Embed Size (px)
Citation preview
EFFECTS OF COMPUTER INTEGRATED INSTRUCTION ON STUDENT
ACHIEVEMENT IN EIGHTH GRADE MATHEMATICS
Mofeed M. Aql
B.S., Southwest Missouri State University, 1989
M.A., Avila University, 2005
Submitted to the Graduate Department and Faculty
of the School of Education of Baker University
in partial fulfillment of the requirements for the degree of
Doctor of Education
in
Educational Leadership
Baker University
Copyright 2011 by Mofeed M. Aql

ii
Dissertation Committee
______________________________________________
______________________________________________
________________________
_____________________________________________
iii
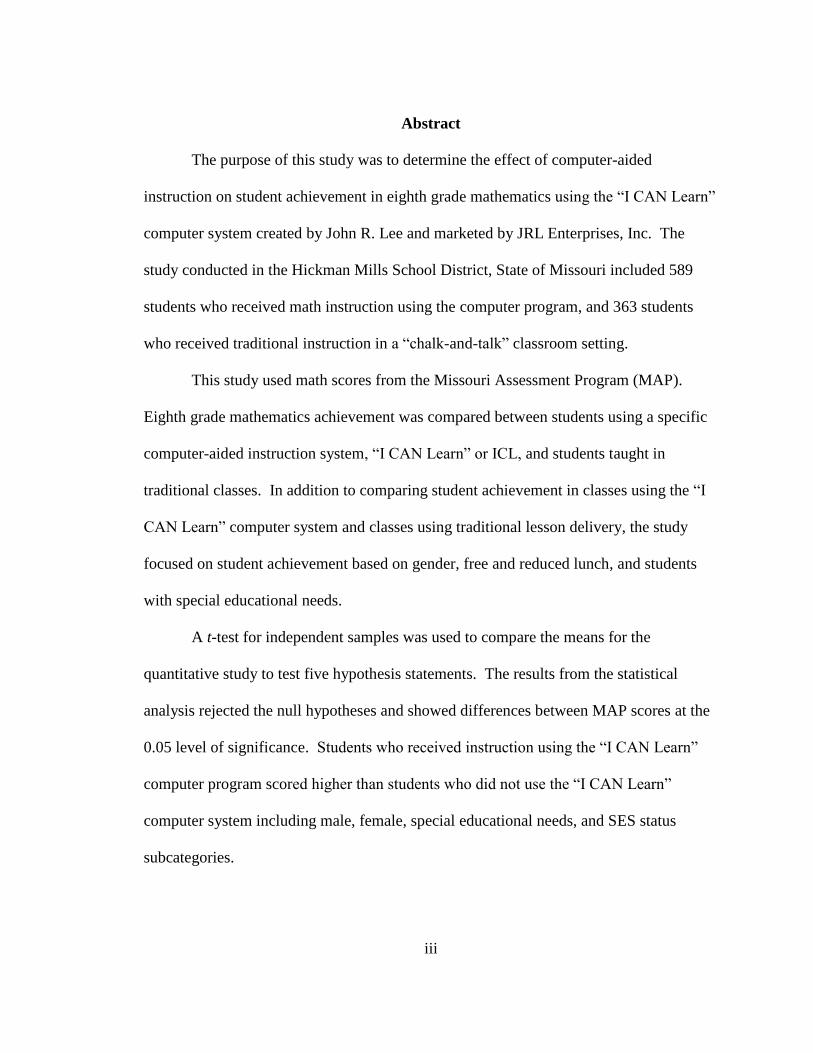
Abstract
The purpose of this study was to determine the effect of computer-aided
instruction on student achievement in eighth grade mathematics using the ―I CAN Learn‖
computer system created by John R. Lee and marketed by JRL Enterprises, Inc. The
study conducted in the Hickman Mills School District, State of Missouri included 589
students who received math instruction using the computer program, and 363 students
who received traditional instruction in a ―chalk-and-talk‖ classroom setting.
This study used math scores from the Missouri Assessment Program (MAP).
Eighth grade mathematics achievement was compared between students using a specific
computer-aided instruction system, ―I CAN Learn‖ or ICL, and students taught in
traditional classes. In addition to comparing student achievement in classes using the ―I
CAN Learn‖ computer system and classes using traditional lesson delivery, the study
focused on student achievement based on gender, free and reduced lunch, and students
with special educational needs.
A t-test for independent samples was used to compare the means for the
quantitative study to test five hypothesis statements. The results from the statistical
analysis rejected the null hypotheses and showed differences between MAP scores at the
0.05 level of significance. Students who received instruction using the ―I CAN Learn‖
computer program scored higher than students who did not use the ―I CAN Learn‖
computer system including male, female, special educational needs, and SES status
subcategories.
iv
Dedication
As I begin to think of all individuals who influenced my work and dedication to
this program, it was difficult to mention only one. Should I thank a friend who was
always there for me? Should I thank my parents and family for their sacrifices and
patience, or my advisor who never gave up on me and never let me down?
I dedicate this work to God for allowing everyone who influenced this work to be
at the right place, saying the right thing at the right moment.
This work is also dedicated to my parents, Mohamed and Sobhia Aql, and to my
mentor, my idol, my oldest brother Mazin. Throughout my life, with all its ups and
downs, you made me feel important and worthy. Your continuous encouragement and
trust in me made me who I am today. I hope I can continue making you proud and
promise, to the best of my ability, to direct my knowledge, experience, and expertise for
good causes and serve education wherever I may be.
v
Acknowledgements
Special thanks to Dr. Harold Frye, my major advisor, for his continuous
encouragement. I also thank Ms. Peg Waterman for her down-to-earth and welcoming
attitude. Without her help and assistance, I would still be stuck on Chapter 3. I thank my
friends, advisors, and cohort colleagues who kept me on track to be able to complete this
degree.
I would like to thank Dr. Ann Sanders and Dr. Charles Wilson, who served on my
doctoral committee. Your continuous assistance and dedication for excellence
encouraged me to face you in defending my dissertation.
To my wife, Samira (you are the best), and my small family, Mazin, Zeena,
Mohamed, Marwah, and Ibraheem, I give you all a heartwarming ―thank you‖ filled with
love and loyalty. You guys have always been my pride and joy and thank you for
enduring and sacrificing during this journey. I hope I can always make you proud and
live up to your expectations.
vi
Table of Contents
Abstract .................................................................................................................. iii
Dedication .............................................................................................................. iv
Acknowledgements ..................................................................................................v
Table of Contents .................................................................................................. vi
List of Tables ...........................................................................................................x
Chapter One: Introduction .......................................................................................1
Background of the Study .............................................................................3
Problem Statement .......................................................................................7
Purpose of the Study ....................................................................................9
Significance of the Study ...………………………………………………10
Research Questions ....................................................................................10
Delimitations ..............................................................................................11
Assumptions ...............................................................................................12
Definition of Key Terms ............................................................................12
Overview of Methodology .........................................................................14
Summary ....................................................................................................15
Chapter Two: Review of Literature .......................................................................16
Theoretical Foundations for Computer Use in Education .........................16
History of Technology in Education ..........................................................19
Strategies to Improve Student Achievement ..............................................23
Achievement In Mathematics: An International Issue ...............................27
vii
United States Government Role in Student Achievement in Math ...........29
Examples of Using Computers in Teaching and Learning ........................32
Research Regarding the ―I CAN Learn‖ Computer System ......................39
Summary ....................................................................................................46
Chapter Three: Research Methodology .................................................................48
Research Design.........................................................................................48
Population and Sample ..............................................................................49
Instrumentation ..........................................................................................49
Validity ......................................................................................................51
Data Collection Procedure .........................................................................52
Data Analysis .............................................................................................53
Limitations .................................................................................................56
Summary ....................................................................................................56
Chapter Four: Results ............................................................................................58
Hypothesis Testing Results ........................................................................59
―I CAN Learn‖ and Traditional Instruction Groups ..................................59
Male ―I CAN Learn‖ and Male Traditional Instruction Groups ................60
Female ―I CAN Learn‖ and Female with Traditional Instruction
Groups…….. ..............................................................................................60
Special Education ―I CAN Learn‖ and Special Education
with Traditional Instruction Groups ...........................................................62
viii
Free and Reduced Lunch ―I CAN Learn‖ and Free and
Reduced Lunch with Traditional Instruction Groups ................................63
Summary ....................................................................................................65
Chapter Five: Interpretation and Recommendations .............................................67
Summary of Findings .................................................................................67
Overview of the Problem ...........................................................................67
Purpose of the Study ..................................................................................68
Review of the Methodology.......................................................................68
Findings......................................................................................................69
Findings Related to the Literature..............................................................71
Conclusions ................................................................................................73
Implications for Action ..............................................................................73
Recommendations ......................................................................................73
Concluding Remarks ..................................................................................75
References ..............................................................................................................76
Appendixes ............................................................................................................86
Appendix A: Electronic communication with KCMO concerning the
―I CAN Learn‖ computer system ......................................88
Appendix B: Electronic communication with Grandview School
District concerning ―I CAN Learn‖ computer system .......90
Appendix C: Hickman Mills School District approval of this study.......92
Appendix D: Letter from the State of Oklahoma Superintendent of
ix
Public Instruction appreciating the ―I CAN Learn‖
computer system ...............................................................94
Appendix E: JRL Enterprises, Inc. graph of student‘s achievement
of the Oklahoma public schools after incorporating
the ―I CAN Learn‖ computer system in their schools .......96
Appendix F: The researcher‘s Institutional Review Board (IRB)
request ...............................................................................98
Appendix G: Baker University‘s approval of the study ........................102
Appendix H: Examples of MAP test released items .............................105
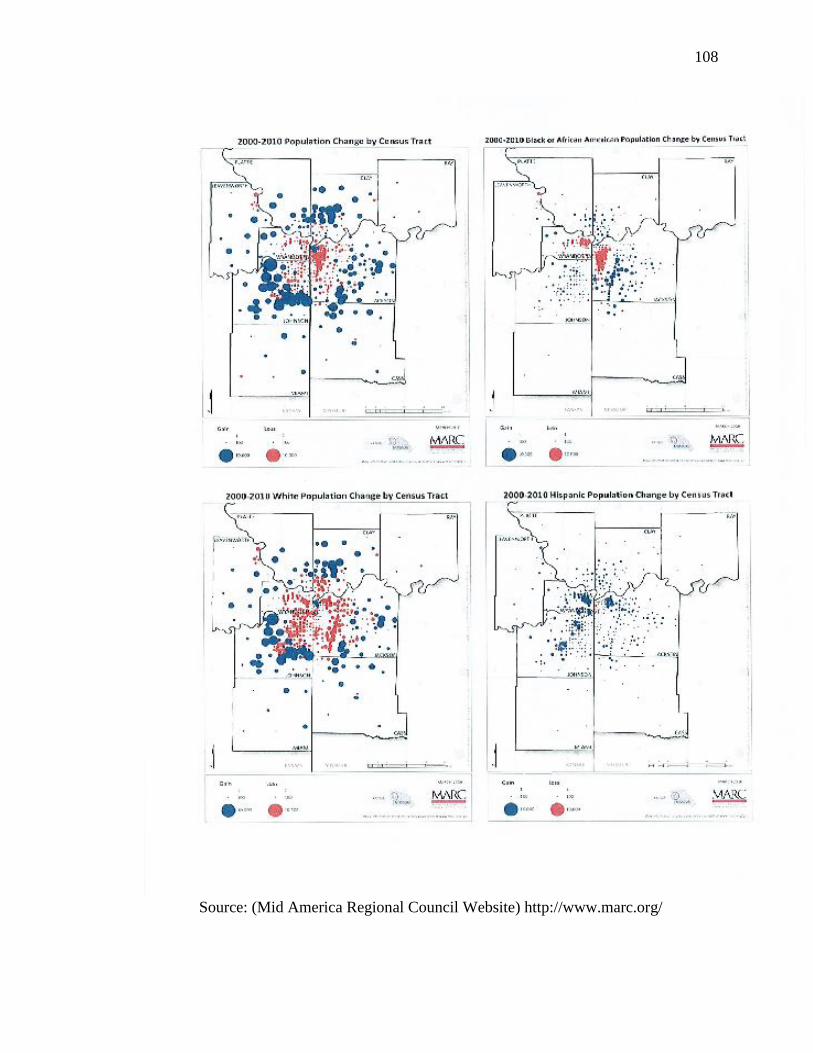
Appendix I: 2000-2010 Population Change by Census Tract ..............107
Appendix J: Cognitive Coaching Chart................................................109
Appendix K: Cognitive Coaching Belief Statements…………………111
x
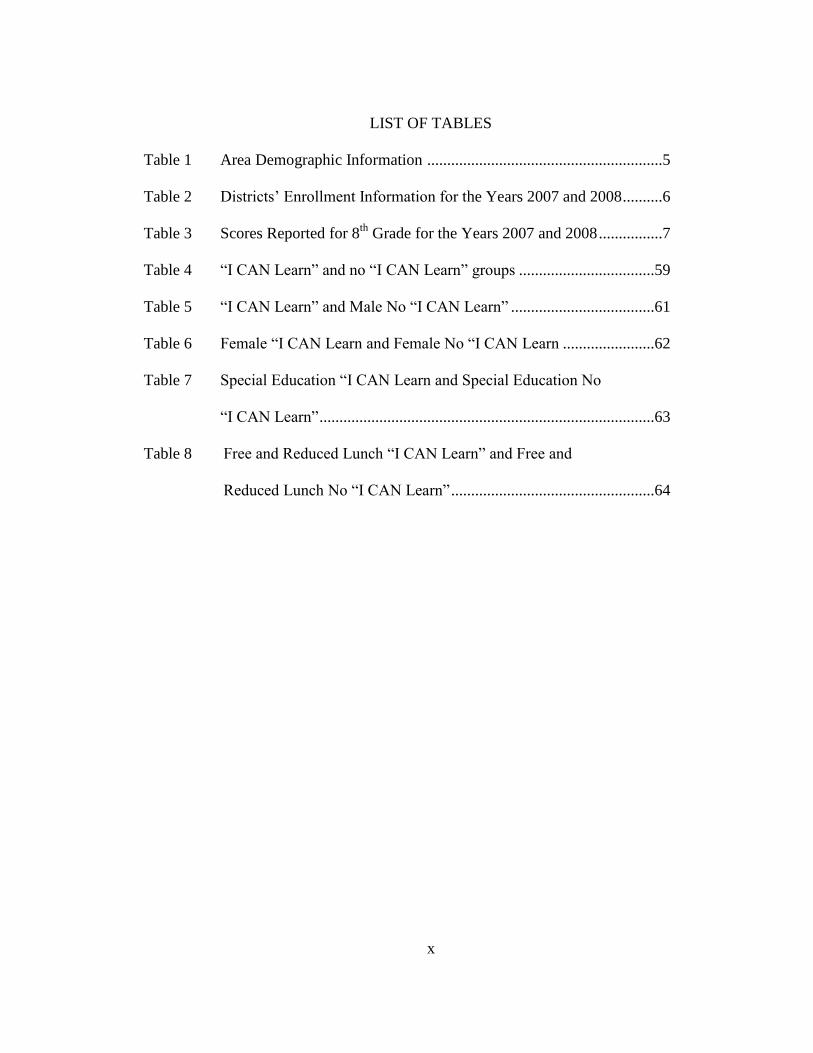
LIST OF TABLES
Table 1 Area Demographic Information ...........................................................5
Table 2 Districts‘ Enrollment Information for the Years 2007 and 2008 ..........6
Table 3 Scores Reported for 8th
Grade for the Years 2007 and 2008 ................7
Table 4 ―I CAN Learn‖ and no ―I CAN Learn‖ groups ..................................59
Table 5 ―I CAN Learn‖ and Male No ―I CAN Learn‖ ....................................61
Table 6 Female ―I CAN Learn and Female No ―I CAN Learn .......................62
Table 7 Special Education ―I CAN Learn and Special Education No
―I CAN Learn‖ ....................................................................................63
Table 8 Free and Reduced Lunch ―I CAN Learn‖ and Free and
Reduced Lunch No ―I CAN Learn‖ ...................................................64
1
Chapter One
Introduction
In today‘s highly changed and technologically dependent world, education has its
fair share of modern challenges. Old teaching methods such as ―chalk-and-talk,‖ known
as a traditional teaching method in which teachers address students by using a board to
provide examples or illustrations, are giving way to newer strategies (Chalk and Talk,
n.d.). Traditional methods of teaching have been undergoing changes influenced by new
techniques and technologies. Since the spread and development of electronics and
computers, computer-aided instruction is an initiative that has been investigated as a
means to close achievement gaps (Daniel, 1999). For many reasons, most related in
some way to poverty, these gaps persist among diverse groups of students.
Educators, in general, have been searching for teaching techniques, strategies, and
methods to close achievement gaps, including those that occur between inner-city
students attending schools in low-socioeconomic areas and their suburban counterparts,
who are, in general, scoring higher on state standardized tests. Government officials who
are involved in the legislation process have attempted to find solutions as well. The No
Child Left Behind Act of 2001 (NCLB) focused on improving student achievement in
Mathematics, Reading, and Science. The purpose of NCLB was to minimize and close
the achievement gap between groups of students within American schools (U.S.
Department of Education, 2004).
Research studies, such as Kulik (1994) and Wenglinsky (1998), addressed the use
of technology in teaching and learning. Their study reveals that students who received
instruction using computer technology score higher than students who received
2
instruction in traditional classes. Short (2002) examined the effect of the Middle School
Math Explorer computer program on student achievement. The program was designed to
address specific school district math standards for the Long Beach Unified School
District. The results showed significant differences in pre- and post-test results. Math
Explorer is a computer aided instruction software similar to the ―I CAN Learn‖ computer
system. The Short (2002) study also suggested that students indicated noticeable gains
with exposure to the Math Explorer computer program. Another study, conducted by
Kigsley and Boone (2008), noted that students who used computers in addition to
textbooks in instruction scored higher on a standardized state test.
A number of applications utilizing computer-aided instruction programs have
been developed in the last two decades. One such program, the computer-aided
instruction program used for this study, is ―Interactive Computer Aided Natural
Learning,‖ or ―I CAN Learn.‖ The system, created by JRL Enterprises, Inc., is a pre-
algebra and algebra computerized curricula that is designed to improve problem-solving
skills by using individualized instruction (I CAN Learn, 2010a). In literature distributed
by JRL Enterprises Inc., the company purports that the program increases student
achievement in in grades six through twelve. The program targets mostly districts with
large concentrations of ethnically diverse, inner-city students and to districts with higher
levels of poverty. JRL Enterprises, Inc. purports that lessons are designed to equip
students with the mathematical skills needed to meet district, state, and national
objectives (I CAN Learn, 2010a). The ―I CAN Learn‖ pre-algebra computer program
consists of 131 lessons, and the algebra computer program consists of 181 lessons. JRL
Enterprises, Inc. claims the curriculum software meets the National Council of Teachers
3
of Mathematics (NCTM) standards and can be configured to meet state and local grade-
level expectations (I CAN Learn, 2010a).
Background of the Study
John Lee, founder of the ―I CAN Learn‖ computer system, had a vision in using
computers in the classroom. He was convinced computers could serve as instructional
tools to provide direct instruction and guided instruction. Lee envisioned that such a
system could test for measurable mastery levels instead of being used as supplemental
tools. John Lee believed computers were capable of improving and contributing to
growth in student achievement in mathematics (I CAN Learn, 2010a). In 1995,
McDonogh No.35 Senior High in New Orleans, Louisiana, was the first school to pilot
the program. Since 1995, JRL Enterprises, Inc. regularly reports in their own newsletter
that the ―I CAN Learn‖ computer system contributed to the increase in student
achievement in mathematics in several schools with similar demographics as McDonogh
high school in New Orleans (I CAN Learn, 2010a).
Since JRL Enterprises, Inc. developed the ―I CAN Learn‖ computer system,
disadvantaged schools and urban school districts began purchasing the program. Schools
in Louisiana, Alabama, North Carolina, and California began adopting the new
technology (I CAN Learn, 2010a). Disadvantaged school districts in Missouri, including
Kansas City, Missouri Consolidated School District shown in Appendix A (KCMSD,
personal communication, February 1, 2010), Grandview Consolidated School District
shown in Appendix B (Grandview C-4, personal communication, February 15, 2011),
and Hickman Mills Consolidated School District shown in Appendix C, decided to
purchase the ―I CAN Learn‖ computer system.

4
Hickman Mills School District was selected for this study. This district is one of
several in Jackson County and is contained totally within the city limits of Kansas City.
To provide the reader an understandable contextual reference of Hickman Mills School
District, the researcher has included regional information. The population diversity of the
region is best described by the Mid-America Regional Council. The population
distribution in Jackson County shows a major concentration and growth of African-
Americans in the suburbs of Kansas City including the Hickman Mills area. This is best
evidenced by viewing U.S. Census data shown in Appendix I (Mid-America Regional
Council, 2011).
To better understand the characteristics of Hickman Mills School District, one
must understand its past. Hickman Mills served the southern portion of the city of
Kansas City. In the early 1950s, when housing was sparse and businesses were small and
owner-operated, business owners created the Hickman Mills Chamber of Commerce with
the hope of receiving city improvements. Their goal was to improve the area with the
additions of street lights, municipal offices, bus services, traffic signs, and police
protection. On May 20, 1957, the entire area of Hickman Mills, Ruskin Heights, and
Martin City was hit by a devastating tornado that claimed 44 lives, injured 531 people
and destroyed hundreds of homes (South Kansas City Chamber of Commerce [SKCCC],
2007). Ruskin Heights residents faced the devastation head-on and were determined to
rebuild. After the tornado, houses were constructed quickly and the new and cheaper
housing deteriorated over time. By the time Kansas City closed its concentrated housing
projects in the 1980‘s and 1990‘s, many of these deteriorated homes in Hickman Mills
had become eligible for federal subsidies through Housing and Urban Development
5
(HUD), more commonly known as Section 8 housing. White out-migration of families
progressed to newer developed areas until the overall economic level of the Hickman
Mills area had dropped significantly (SKCCC, 2007). Today‘s Hickman Mills School
District is a result of an evolution over time of the impact of natural disaster, deterioration
in housing values, and ―white flight‖ migration to suburbs.
The Hickman Mills area was considered a suburb of Kansas City. Once
minorities were able to afford the cost of living and began trading urban for suburban life,
white families began moving out. Over time, the population shift and decrease in
housing values changed. The perception of the area gradually moved to the point that
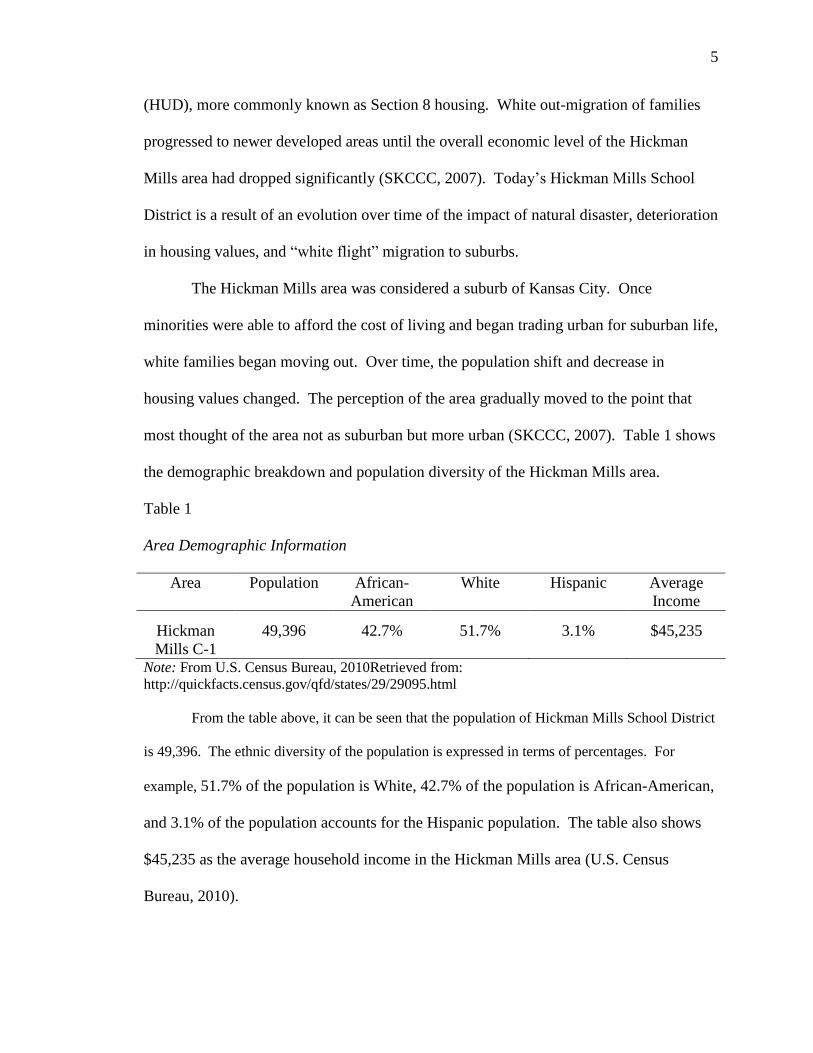
most thought of the area not as suburban but more urban (SKCCC, 2007). Table 1 shows
the demographic breakdown and population diversity of the Hickman Mills area.
Table 1
Area Demographic Information
Area Population African-
American
White Hispanic
Average
Income
Hickman
Mills C-1
49,396 42.7% 51.7% 3.1% $45,235
Note: From U.S. Census Bureau, 2010Retrieved from:
http://quickfacts.census.gov/qfd/states/29/29095.html
From the table above, it can be seen that the population of Hickman Mills School District
is 49,396. The ethnic diversity of the population is expressed in terms of percentages. For
example, 51.7% of the population is White, 42.7% of the population is African-American,
and 3.1% of the population accounts for the Hispanic population. The table also shows
$45,235 as the average household income in the Hickman Mills area (U.S. Census
Bureau, 2010).
6
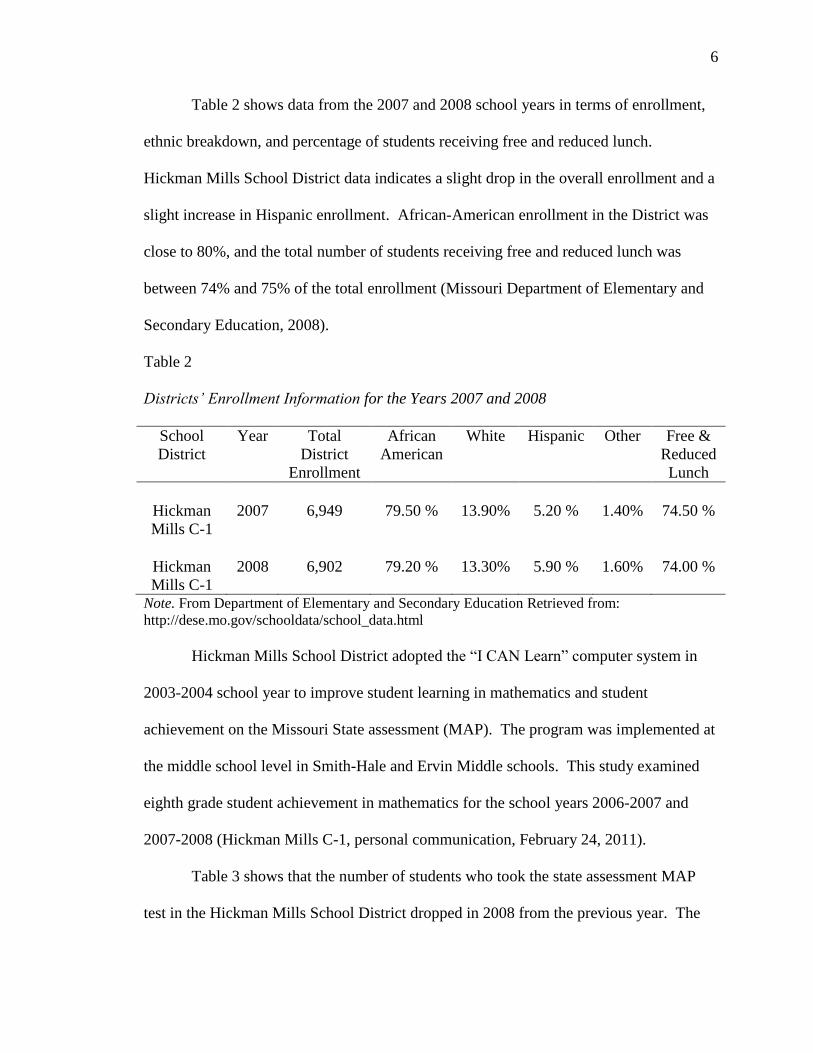
Table 2 shows data from the 2007 and 2008 school years in terms of enrollment,
ethnic breakdown, and percentage of students receiving free and reduced lunch.
Hickman Mills School District data indicates a slight drop in the overall enrollment and a
slight increase in Hispanic enrollment. African-American enrollment in the District was
close to 80%, and the total number of students receiving free and reduced lunch was
between 74% and 75% of the total enrollment (Missouri Department of Elementary and
Secondary Education, 2008).
Table 2
Districts’ Enrollment Information for the Years 2007 and 2008
School
District
Year Total
District
Enrollment
African
American
White
Hispanic
Other
Free &
Reduced
Lunch
Hickman
Mills C-1
2007 6,949 79.50 % 13.90% 5.20 % 1.40% 74.50 %
Hickman
Mills C-1
2008 6,902 79.20 % 13.30% 5.90 % 1.60% 74.00 %
Note. From Department of Elementary and Secondary Education Retrieved from:
http://dese.mo.gov/schooldata/school_data.html
Hickman Mills School District adopted the ―I CAN Learn‖ computer system in
2003-2004 school year to improve student learning in mathematics and student
achievement on the Missouri State assessment (MAP). The program was implemented at
the middle school level in Smith-Hale and Ervin Middle schools. This study examined
eighth grade student achievement in mathematics for the school years 2006-2007 and
2007-2008 (Hickman Mills C-1, personal communication, February 24, 2011).
Table 3 shows that the number of students who took the state assessment MAP
test in the Hickman Mills School District dropped in 2008 from the previous year. The
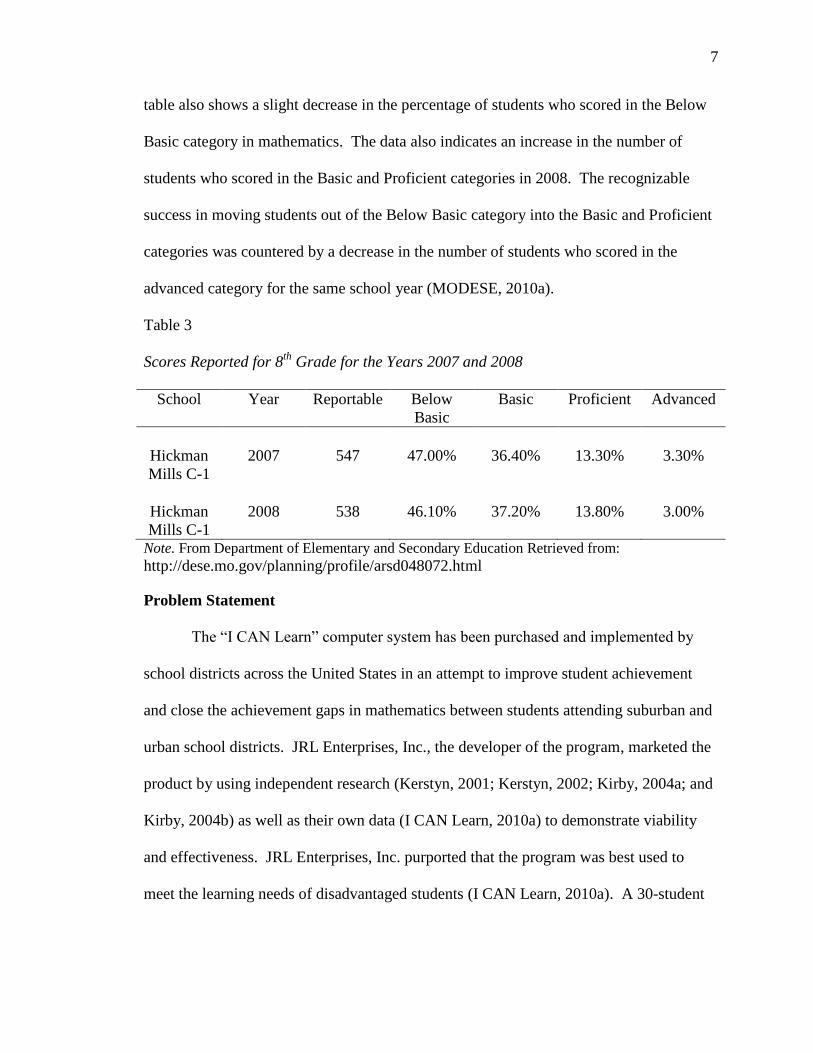
7
table also shows a slight decrease in the percentage of students who scored in the Below
Basic category in mathematics. The data also indicates an increase in the number of
students who scored in the Basic and Proficient categories in 2008. The recognizable
success in moving students out of the Below Basic category into the Basic and Proficient
categories was countered by a decrease in the number of students who scored in the
advanced category for the same school year (MODESE, 2010a).
Table 3
Scores Reported for 8th
Grade for the Years 2007 and 2008
School Year Reportable Below
Basic
Basic Proficient Advanced
Hickman
Mills C-1
2007 547 47.00% 36.40% 13.30% 3.30%
Hickman
Mills C-1
2008 538 46.10% 37.20% 13.80% 3.00%
Note. From Department of Elementary and Secondary Education Retrieved from:
http://dese.mo.gov/planning/profile/arsd048072.html
Problem Statement
The ―I CAN Learn‖ computer system has been purchased and implemented by
school districts across the United States in an attempt to improve student achievement
and close the achievement gaps in mathematics between students attending suburban and
urban school districts. JRL Enterprises, Inc., the developer of the program, marketed the
product by using independent research (Kerstyn, 2001; Kerstyn, 2002; Kirby, 2004a; and
Kirby, 2004b) as well as their own data (I CAN Learn, 2010a) to demonstrate viability
and effectiveness. JRL Enterprises, Inc. purported that the program was best used to
meet the learning needs of disadvantaged students (I CAN Learn, 2010a). A 30-student
8
single classroom setting with the ―I CAN Learn‖ computer program costs between
$100,000 and $300,000. The cost of the program depends upon whether specially
adapted furniture and computers are purchased or whether the district purchases only the
software. The marketing strategy of JRL for the product is directed mainly toward inner-
city school districts with the majority of students classified as low SES (I CAN Learn,
2010a). The US Department of Education continues to search for data to support
programs that show positive effects on student achievement in mathematics. Scrutiny
applied to these searches is even greater for programs with expensive price tags such as
the ―I CAN Learn‖ computer system.
The U.S. Department of Education's Institute of Education Sciences (IES)
established the What Works Clearinghouse (WWC) in 2002 in response to the No
Child Left Behind legislation in 2001 (Schoenfeld, 2006). The WWC is responsible
for providing stakeholders including educators, policymakers, researchers, and the
public with scientific evidence of what works in education. What Works
Clearinghouse collects studies on the effectiveness of educational programs, products,
and practices and reports on the strengths and weaknesses of those studies measured
against standards established by the WWC, which are designed to inform educators of
what the WWC research evidence indicates (Northwest Educational Technology
Consortium, n.d.).
What Works Clearinghouse examined Kerstyn‘s (2001) research conducted on
the use of the ―I CAN Learn‖ computer system in teaching and reported their findings.
The research used state standardized testing as a means to measure student
achievement. The WWC reported that students who received ―I CAN Learn‖
9
classroom instruction did not score significantly higher than their counterparts in
traditional math classrooms (WWC, 2004). On the other hand, Kirby‘s (2004b)
research conducted in Glimer County School District, Georgia, examined the effect ―I
CAN Learn‖ computer system had on student math achievement. Kirby‘s (2004b)
study used data from 254 eighth grade students in which 91 students used the ―I CAN
Learn‖ computer program and the rest used traditional classroom teaching methods.
The results showed students who received instruction using the computer program
increased their math scores with marked improvement. The contradicting findings and
reports created the need for additional examination of the effect ―I CAN Learn‖
computer system has on student achievement. WWC also conducted a meta-analysis
of studies examining the ―I CAN Learn‖ computer system and reported the program
had a positive effect on student achievement (WWC, 2009). Because of these
contradictions, the researcher believes an unbiased and independent study is needed to
examine the effect ―I Can Learn‖ computer system has on student achievement in
mathematics.
Purpose of the Study
The purpose of the study was to determine if the pre-algebra and algebra ―I CAN
Learn‖ computer program implemented by Hickman Mills School District had an effect
on student mathematics achievement in eighth grade. The study compared average math
scores as measured by MAP results in mathematics. Student data were divided into two
groups. One group received instruction using the ―I CAN Learn‖ computer system while
the other group received instruction using traditional teaching methods. Student data was
also divided into subgroups to determine if student math scores were greater for male
10
students, female students, students with special educational needs, and students with low
SES who received math instruction using the ―I CAN Learn‖ computer system than
similar subgroups of students who received instruction in traditional class settings.
Significance of the Study
General studies and research on incorporating technology in teaching and learning
show potential in increasing student achievement on standardized tests. Kulik and Kulik
(1991) wrote in their research about Computer Based Instruction (CBI):
We conclude, therefore, that the typical student in an average CBI class would
perform at the 62nd percentile on an achievement examination, whereas, the
typical student in a conventionally taught class would perform at the 50th
percentile on the same examination. Put in another way, the average student from
the CBI class would outperform 62% of the students from the conventional
classes. (p. 80)
Government oversight agencies such as What Works Clearinghouse (WWC,
2007) in particular, reported the ―I CAN Learn‖ computer system developed by JRL
Enterprises, Inc. has positive effects on student achievement in mathematics. This study
is necessary and significant because additional unbiased research is needed to support or
reject the impact ―I CAN Learn‖ computer system has on student achievement in
mathematics as measured by the Missouri Assessment Program. The results from this
study may provide useful information regarding the effect of computer-aided instruction
on student achievement in Hickman Mills School District.
Research Questions
This study focused on the following questions:
11
1. As determined by the Missouri Assessment Program (MAP), is student
achievement greater for students using the ―I CAN Learn‖ computer system than
for students receiving traditional instruction in eighth grade math?
2. As determined by the Missouri Assessment Program (MAP), is student
achievement greater for male students using the ―I CAN Learn‖ computer system
than for male students receiving traditional instruction in eighth grade math?
3. As determined by the Missouri Assessment Program (MAP), is student
achievement greater for female students using the ―I CAN Learn‖ computer
system than for female students receiving traditional instruction in eighth grade
math?
4. As determined by the Missouri Assessment Program (MAP), is student
achievement greater for students with special needs who received math instruction
using the ―I CAN Learn‖ computer system than for students with special needs
who received traditional instruction in eighth grade math?
5. As determined by the Missouri Assessment Program (MAP), is student
achievement greater for students on free and reduced lunch program who used the
―I CAN Learn‖ computer system than for students on free and reduced lunch
program who attended traditional instruction classes in eighth grade math?
Delimitations
This study is delimited by the age and grade level of students. The study is also
delimited to data collection during two school years, 2006-2007 and 2007-2008.
Hickman Mills School District has two middle schools, and the study is delimited by
using data from the two middle schools in the Hickman Mills School District. As a result
12
of the delimitations, the results from this study potentially may not be generalizable to
other grade levels and populations.
Assumptions
Certain assumptions were made for this study:
It is assumed teacher experience in both instructional models was similar and,
therefore, had no bearing on the outcome of the study.
It is assumed that all teachers using the ―I CAN Learn‖ computer system in their
classrooms received the same training by JRL Enterprises, Inc.
It is assumed that the ―I CAN Learn‖ computer system is used and implemented
as proposed by JRL Enterprises, Inc.
It is assumed, in this study, that school principals and school leaders followed
directives from the district office concerning random student placement in eighth
grade math classes.
Definition of Terms
Adequate Yearly Progress: The NCLB Act of 2001 requires School Districts to show
students are making Adequate Yearly Progress (AYP) based on proficiency,
attendance/graduation rate, and participation rates. The State of Missouri‘s
AYP targets were established by the Missouri Department of Elementary and
Secondary Education based on a formula from the NCLB Act and an analysis
of Missouri Assessment Program (MAP) data, attendance rate data, and
graduation rate data from prior years (MODESE, 2010b).
CTB/McGraw-Hill: A leading publisher of educational assessment solutions for the early
learner, K-12, and adult basic education (CTB/McGraw-Hil, 2007).
13
Missouri Assessment Program: A Missouri state-standardized test (MAP) designed to
see if students in Missouri are meeting the state standards for communication
arts, mathematics and science at grades 3-8. The test is made up of multiple-
choice, mechanically-scored items, and constructed-response items. The test
is also designed to compare Missouri student achievement to groups of
students who take the same test in other states (MODESE, 2010c).
Missouri Department of Elementary and Secondary Education: MODESE, also referred
to as Department of Elementary and Secondary Education (DESE). The
department‘s goals are implemented statewide to: (a) prepare all Missouri
students to graduate from college, (b) ensure all Missouri children will attend
kindergarten, (c) support all effective educators, and (d) improve departmental
efficiency and operational effectiveness (www.dese.mo.gov).
National Council of Teachers of Mathematics: (NCTM) founded in 1920, currently with
approximately 100,000 members internationally. The function of the NCTM
is to ensure all students have access to high quality mathematics teaching and
learning. The organization‘s priorities are to provide guidance for developing
curriculum, instruction, and assessment (National Council of Teachers of
Mathematics, 2009).
No Child Left Behind Act of 2001: The most recent reauthorization of the Elementary
and Secondary Education Act. The purpose and mission of the NCLB is to
close and eliminate the achievement gap that exists between groups of
students within American schools. The NCLB Act is research based on best
14
practice to address accountability, parental choices, flexibility, and finding
what works based on research (MODESE, 2005).
Section 8: Housing subsidies for very low income families and the elderly through the
U.S. Department of Housing and Urban Development (HUD). The Federal
legislation governing HUD was expanded in the 1970‘s and 1980‘s to cause
local governments to disperse Section 8-eligible housing from the core of a
city to areas throughout the municipality
(http://portal.hud.gov/portal/page/portal/HUD).
Students with Special Needs: Students who are handicapped or gifted, and students
whose mental ability, physical functioning, and emotional functioning, require
special teaching approaches, equipment, or care within or outside a regular
classroom. The term is also refers to students with ―Individual Educational
Plans‖ (IEP) (NICHCY, 2010).
Overview of Methodology
This quantitative study was designed to investigate and examine the effect the ―I
CAN Learn‖ computer program has on student achievement in eighth grade. Data
obtained from the Missouri Department of Elementary and Secondary Education (DESE)
was provided by the Hickman Mills School District Department of Curriculum and
Instruction. The obtained student data was divided into two groups, one group of 589
students who used the ―I CAN Learn‖ computer system, and the other group of 363
students who did not use the ―I CAN Learn‖ computer program.
State assessment (MAP) scores for the 2006-2007 and 2007-2008 school years
were used to measure student achievement. A statistical analysis (t-test for independent
15
samples) was performed to compare the means of the two groups of students and four
subgroups (male, female, special education needs, and low SES) on a given variable to
determine the difference in student achievement. The instructional method served as the
independent variable for this study while student MAP scores were the dependent
variable.
Summary
Chapter one introduced the background of the study, the purpose of the study, the
problem statement of the study, the significance of the study, overview of the
methodology of the study, delimitations of the study, research questions of the study,
assumptions of the study, and the definitions of key terms of the study. Chapter two
explores a review of pertinent literature. Methodology is discussed in detail in Chapter
three. Chapter four is organized to describe the results and findings of the study. Chapter
five summarizes the research, all findings, conclusions, implications and
recommendations for future research.
16
Chapter Two
Review of the Literature
This chapter presents a review of literature associated with developments in
teaching and learning related to the use of technology in the classroom. This literature
review includes the theoretical foundations for computer use in teaching and learning, the
history and development of the use of technology in classrooms, selected strategies to
improve student achievement, achievement in mathematics as an international issue,
United States government‘s role in student achievement in math, examples of computer-
aided instruction programs, and research regarding ―I CAN Learn‖ computer system.
Theoretical Foundations for Computer Use in Education
All the attention to computer-aided instruction by the U.S. government pointed to
the need for clear research based on a sound, documented theoretical foundation. Of the
five strands of theories of education identified by Elliott Eisner and E. Vallance (1974),
one stands out in its greatest support for instructional programs that involve computers.
As Eisner and Vallance termed them, ―Technologists‖ are guided by measurable learning
goals and view the student in an input-output manner. The two writers further describe
common vocabulary such as task analysis, management by objectives, and computer
assisted learning. The five groups of educational theories described by Eisner and
Vallance are noted in Appendices J. Major contributors to this strand include notable
theorists such as Skinner, Thorndike, Pavlov, Hunter, Popham, and others. Costa and
Garmston (2002) adopted and extended the Eisner and Vallance characterization of major
educational theories in a program they termed Cognitive Coaching. Costa and Garmston
wrote five statements (Appendix K), each one descriptive of one of the Eisner and
17
Vallance major theory categories. When a reader selects one of the five statements, the
selected statement reveals the purpose of education held by that reader. In so doing, the
particular belief and its underpinnings would become increasingly clear.
To explain some of these theorists‘ views, consider that as early as 1954, B. F.
Skinner developed a teaching machine to reinforce learner behavior as a replacement for
punishment. Skinner spoke only about the strengthening of responses, not the
strengthening of habits. Skinner‘s principle could be observed when a response was
followed by reinforcement. When a response was incorrect, the reinforcement provided
was weaker or not provided at all (Skinner, 1960). Computer-aided instruction strategies
build on Skinner‘s principle by providing immediate positive reinforcement to strengthen
student performance.
Skinner‘s teaching machine extended those of Pavlov, an earlier theorist. Pavlov
developed a classical conditioning theory in which a stimulus would lead to a specific
response (Ormrod, 1999). Building on the work of Pavlov and Skinner, Thorndike
introduced connectionism theory. This theory explains how experiences play a role in the
strengthening and weakening of response connections. Thorndike‘s theory explains how
learning is the result of associations between stimuli and responses. Such associations
become strengthened or weakened by the nature and frequency of the stimuli. Thorndike
theorized that responses to a situation followed by satisfaction are strengthened.
Responses followed by discomfort are weakened (as cited in Ormrod, 1999). This
response stimulation, when positive, reinforces learning. Computer- aided instruction
programs such as the ―I CAN Learn‖ computer system are designed to provide students
18
with positive reinforcement and measurable goals that come from this stimulus-response
relationship.
The concept of scaffolding in education is based on the social development theory
of Vygotsky (as cited in Chang, Chen and Sung, 2002). To perform a new skill, teachers
provide guidance and assistance to the learner during the learning process. Based on
scaffolding, the ―I CAN Learn‖ computer system provides a lesson delivery method that
includes skills mastery by dividing lessons into small benchmarks. The teacher in the ―I
CAN Learn‖ computer system environment provides assistance as a facilitator to meet
students‘ individual needs. Students who use the ―I CAN Learn‖ computer system are
required to achieve a predetermined mastery level and are able to seek the teacher‘s
intervention when needed. ICL is an example of a scaffolded system. The learning
process built into the computer program provides the student with immediate positive
reinforcement once tasks are mastered. Historically, the development and
implementation of computer-assisted learning programs rest squarely on these
foundational theories (I CAN Learn, 2010a).
While theories contained in the ―Technologist‖ strand shown in Appendix J may
explain purported effectiveness of computer-aided instruction, a second strand, ―Self
Actualizers,‖ can explain individualized instruction in learning situations. In this strand,
students are guided toward self-evaluation and may demonstrate an increased sense of
autonomy. Hinton (1978) noted that ―individualized instruction systems work as well or
better than traditional, conventional instruction.
The ―Self Actualizer‖ strand also tends toward what has been popularized as
active engagement or active participation. Students appear to be more actively engaged
19
when computer-aided instruction is implemented. Increases in active engagement and,
most likely, increased learning can be directly associated with a student‘s sense of
commitment and belongingness (Christenson, Sinclair, Lahr, and Godber, 2001).
Commitment brought about or increased through active engagement and autonomy
should result in higher levels of learning.
The ―Self Actualizer‖ strand also yields information about another theoretical
construct commonly referred to as constructivist or constructivism. The work of Piaget,
Dewey, and Vygotsky are often cited as those who originated the constructivist theory
(Hein, 1991). As the name suggests, the learner constructs meaning through experience.
When considering constructivism in relation to computer-aided instruction, an argument
can be made that the learner interacts with problems, scenarios, puzzles, and other
situations and, therefore, constructs knowledge through this interaction.
History of Technology in Education
As early as the 1700s, the only teaching model expected and practiced in the
United States was that of teachers performing as managers in classrooms. Both the
United States and the entire world have gone through many changes since then, but
education still follows early teaching models, such as the ―chalk and talk‖ teaching
method (The 1900s: Education, 2001). In the early 1900s, immigrants changed the
structure of American society. Americans left farming for business opportunities in the
city, which, in return, impacted the national economic structure. The economy
transformed from an agrarian to an industrial society. This transformation created greater
ethnic and socioeconomic diversity in schools and school culture as those who populated
cities mixed with those who came from rural areas (The 1900s: Education, 2001).
20
In addition to the socioeconomic changes in the population, invention of
technology began as early as the late 1940s and 1950s when vacuum-tube-based
computers were invented. Computers were introduced in vocational education; but
traditional schools still used the single-classroom-teacher/manager model. Education in
the United States was still not ready to change classroom structure and use new teaching
methods with technology (Murdock, 2007).
Technology development increased in the 1960s. Computer languages were
created that allowed computer programmers to write the codes that operated computer
processes. Perhaps, the initial language was Common Business Oriented Language
(COBOL) (Techopedia, 2011). In 1965, when most computer uses in schools were
limited to administration, the Elementary and Secondary Education Act was passed,
increasing funding support for the use of technology in schools (Murdock, 2007). In the
late 1960s, the National Science Foundation (NSF) supported the development of
national computing networks. By the end of 1974, the national computer networks
allowed more than 2,000,000 students to use computers (Molnar, 1997).
A historical time was when Neil Armstrong landed on the moon in1969. Such a
landmark in time opened the door for technological innovation and creativity. In the
1970s, mainframe computers and minicomputers were introduced and began spreading in
some schools with limited use in instruction. Personal computers (PCs) were developed
and introduced to the market with little involvement in education (Murdock, 2007).
The challenge facing educators was and remains how to prepare children for an
unknown future, ―Preparing children for the world in which they will live is becoming
more difficult than ever. In retrospect, there has been a confluence of changes that have
21
significantly impacted the direction of modern education‖ (Molnar, 1997, para 2). The
mindset shifted within the educational system when teaching all children rather than most
became the norm. Adding to the challenge is to not know what the future requires from
the new generation (Molnar, 1997). The challenges presented by teaching all students
calls for finding a wider variety of instructional strategies to match the diversity of
learning needs. The role of computers in meeting those needs is just now beginning to be
realized.
Although the use of computers in education was not accepted until the early
1980s, IBM, a mainframe company, developed the Personal Computer (PC). Computer-
aided instruction began to gain acceptance in 1981 (Murdock, 2007). The increased use
of technology in business, the continuous development of hardware and software, and
research on the use of computers in education began the technological transformation in
education. In the mid-1980s, educators began to recognize the benefit of using
computers to support the single-classroom-teacher/manager model in schools (Murdock,
2007).
Technology development and uses within the society increased rapidly in the
1990s. Computer-aided instruction programs began to include CD-ROM disks for
classroom instruction. Schools began providing students online information. In the mid-
1990s, digital videos, virtual reality and 3-D systems ushered in a new era. Even though
not all teachers had access to computers for instructional purposes, most classrooms had
at least one PC available for instructional delivery (Murdock, 2007). While technology
was being developed and growing, educators were still not ready for the change. As
students changed their habits in terms of technology use, educators began to realize the
22
need for newer teaching models by incorporating technology into the classroom. The
creation of search engines, personal computers, and laptops forced the industry to grow
faster than ever imagined. The growth met demands being made by professionals in the
workplace, needs in the household, and children‘s dependence on technology in their
daily activities (Murdock, 2007).
As America moved into the 21st Century, technology integration accelerated to
improve student achievement. Children‘s exposure to technology led educators to
become more determined to use technology in teaching and learning. The use of
computers in the classroom for instructional purposes took on different names, such as
Computer-Managed Instruction, Computer-Aided Instruction, and Computer-Based
Instruction (Murdock, 2007).
Research exploring the effect of technology on student achievement began as
early as the 1960s (Murdock, 2007). While computers were being developed and the
technology was in a state of evolution, researchers were working to find the benefits
produced by using computers in the classroom. Later, Kulik, Bangert, and Williams
(1983) conducted a meta-analysis of 51 Computer-Based Instruction (CBI) studies with
different types of computer applications. The study provided another example of the
effect of technology on education and reported that half the studies examined indicated
more than 90 percent of the students experienced significant increases in scores in a
variety of subjects, including mathematics. Test scores raised .32 standard deviations in
48 of the 51 studies. Researchers purposefully sought advantages for using any kind of
technology in education and instructional delivery methods (Murdock, 2007). Just as
23
those who began this research focus, future researchers will continue to examine possible
connections between technology and student achievement.
Strategies to Improve Student Achievement
As uses of computers continued to advance, research on strategies to increase
student achievement in math became a focal point. Extensive research in learning
strategies increased in the last decade of the 20th
Century. In 1993, the United States
Department of Education funded a study by Means, Blando, Olson, Middleton, Morocco,
Remz, and Zorfass. The study, ―Using Technology to Support Education Reform,‖
examined ways the educational system can utilize technology to enhance student
achievement, especially with disadvantaged students. Means et al. (1993) discovered that
teachers, until the early 1990s, did not change their teaching methods and continued
teaching without utilizing new technologies in lesson plans and teaching strategies. Since
the early 1990s, technology in teaching and learning development has brought about
educational reform through the increased use of teaching models.
Incorporating technology in teaching and learning requires financial funding.
Even though legislators at all levels of government show support for educational
technology by pouring billions of dollars into providing technology access in classrooms,
questions are still not answered (Education Week, 2011). To continue funding,
government officials must rely on research findings and gain concrete evidence that
technology in education improves student achievement. One such study, funded by the
Department of Education and conducted by Mathematica Policy Research, had two
questions to answer; (1) Is educational technology use effective in improving student
achievement? and (2) Which conditions and practices are related to the effects on student
24
achievement? (Mathematica Policy Research, 2009). Examining the effect technology
has on student achievement in mathematics, the Mathematica study was conducted for
the 2004-2005 school year. The study included 132 schools in 36 districts in urban, rural,
and low socioeconomic areas, and excluded schools that already used technology in
teaching. Data were collected based on teacher surveys, classroom and lesson delivery
observations, teacher interviews, school records, and test scores. The findings revealed
confusion in the on-going debate about educational technology‘s effect on student
achievement in mathematics when only one of the 10 products reviewed had statistically
significant positive effects. To prevent bias, the products were not revealed; however, the
results indicated that the positive outcome of the one product moved student achievement
from the 50th
to the 54th
percentile. Overall, the examined programs did not increase nor
decrease test scores by amounts that were statistically significant. The effects of math
products were not affected by classroom and school characteristics (Mathematica Policy
Research, 2009).
Another study, conducted in Pennsylvania, involved two groups of middle-school
students (Soeder, 2001). This study examined the effect of computer-aided instruction on
student achievement. The use of the computer system for the study began in fifth grade
and continued through eighth grade. One group received instruction with the use of
technology for the three years of the study, and the other group was taught traditionally,
without the use of computers. The study showed no measurable increase in math scores
by students who received instruction using technology. Independent studies found that
using technology in the classroom had little or no positive effect on student achievement.
The conflicting research findings created the need for the U. S. Department of Education
25
to conduct and fund their own research. Findings from studies such as Mathematica
Policy Research (2009) and Soeder (2001) show no significant increase in student
achievement for students who used technology or for students who did not use computers
in the classrooms. Both the Mathematica Policy Research and the Soeder findings
contradict other research studies such as Kulik (1994), Kirby (2004a), and Kirby (2004b)
which create the need for more research.
Contradictory findings among studies about technology‘s effect on student
achievement brought more confusion about the subject. The findings from Kulik (1994),
showed that ―drill and practice‖ software, tutorials, and Integrated Learning Systems
increase student achievement by 14 percent. The study also showed that students learn
more in less time, while developing a positive attitude about their subject area. However,
the use of computers did not result in an increase in achievement in all the areas in which
they were used. The findings support the use of technology in education, especially in
mathematics (Kulik, 1994). The success of any program, including those that are
technology-oriented, depends highly on the amount of effort dedicated to the
implementation stage. Effective implementation of a program was addressed by
Reichstetter, et.al (2002):
Certain design elements were observed to be crucial regarding the impact on
achievement, self-concept and attitudes, and learning environment interactions for
all students. These design elements include 1) offering students some control, 2)
programs with feedback, 3) embedded cognitive strategies (e.g. paraphrasing,
repetition of content, cognitive mapping), 4) embedded conceptual change
strategies (e.g. sequences of instruction for increased understanding and
26
knowledge), 5) animation and video, 6) content-related graphics, and others.
Educational technology has positive effects on student achievement, attitudes and
motivation toward learning, and self-concept. Introducing technology wisely into
the learning environment makes learning more student-centered, encourages
cooperative learning, and stimulates increased teacher-student interaction as
academic achievement is addressed and impacted. (p. 5).
The discipline of mathematics benefited from studies that examined the use of
technology in all subjects. A meta-analysis by Sivin-kachala‘s findings (1998) consisted
of a review of 219 studies which were conducted as early as 1990 to determine the effect
technology has on student achievement. The meta-analysis examined all ages, all subject
areas, and all types of technology incorporated in education. Research results indicated
that the inclusion of technology in teaching strategies and lesson delivery has positive
effects on student achievement in all areas used. These findings contradict those of
Kulick as cited earlier. The increase in achievement was significant for students from
pre-school to high school, including special education students. Students showed
positive attitudes toward their own learning. Technology use has a positive effect on
student achievement, and student achievement increased the more students were exposed
to the technology. Student achievement was influenced by diverse demographic student
population, educator‘s role, the type of software being used, and the amount of time
students have access to the technology (Sivin-Kachala, 1998). Similar to Sivin-Kachala‘s
findings (1998) another study by Mann, Shakeshaft, Becker, and Kottkamp (1999)
examined the effect on student achievement of West Virginia‘s Integrated Learning
System technology, Basic Skills/Computer Education (BS/CE). The results revealed
27
positive effects and showed that student achievement increased based on the amount of
time spent participating in the program. In addition, the study of BS/CE revealed
students also developed positive attitudes about learning, and teachers became more
enthusiastic about technology in teaching and learning (Mann et al., 1999).
Achievement in Mathematics: An International Issue
Unlike other disciplines, mathematics and science offer opportunities for
comparing American education and student achievement to other countries. The United
States participates in the international comparison of student achievement, even though
such comparisons are made inequitably when glaring differences exist among students in
terms of instruction, testing, and many other factors. A 1995 report, ―Trends in
International Mathematics and Science Study‖ (TIMSS), showed that U.S. mathematics
scores continued to lag behind other participating countries. Special attention was given
to the TIMSS study in that it included 38 participating countries and focused on math and
science test scores for eighth grade students. TIMSS results were reported in an article,
―National Center for Education Statistics‖ (NCES), noting that Asian countries scored
highest in math. Singapore, the Republic of Korea, and Japan had the highest averages in
eighth grade mathematics (NCES, 2009). United States educators have been working
diligently for years to improve student achievement in mathematics to overcome falling
behind even further (NCTM, 2009). In a similar study conducted in 1999 by TIMSS,
United States eighth grade students did not score any differently from the 1995 study, and
American eighth grade students ranked 19th
in mathematics achievement (NCES, 2009).
In addition to the TIMSS reports in 1995 and 1999, another study ―International
Comparison of Math Skills Among 15-year Olds,‖ revealed that the United States ranked
28
between 25th
and 28th
in a study performed on 250,000 15-year-old students from 41
countries (International Comparison of Math, 2007). United States‘ scores continue to
reflect underperformance in mathematics, especially past the fourth grade as compared to
other countries (NCES, 2009). Note must be made that the goal of the U.S. is to educate
all students, a goal not shared by all countries. Some positive results were noted in the
2007 TIMSS report, showing U.S. results in mathematics were better than before (NCES,
2009). U.S. eighth graders exceeded the international average in mathematics
achievement. Their sixth place ranking was still below all Asian countries. Again, the
TIMSS report did not consider differences in teaching strategies or any other factors that
might contribute to learning, including computers and technology. Educators continue to
search for knowledge about what works in the classroom (NCES, 2009).
Delaney and Smith (2000) reported on the TIMSS ranking of international student
scores and international comparison of student achievement, revealing additional
findings. They noted that, overall, students who scored higher in mathematics had a
more positive attitude toward the subject. This particular finding encouraged researchers
to conclude that positive self-confidence in being able to learn and perform mathematics
is associated with higher achievement. One might also be able to conclude that American
students should perform better in mathematics as a result of teacher qualifications.
Delaney and Smith (2000) found that 87% of United States students were taught by
teachers reported as ―highly qualified‖ as determined by NCLB standards. Of
importance, though, is that the setting of standards for ―highly qualified‖ have been
delegated as a responsibility of each state. Japanese students, on the other hand, scored
higher than American students while only 18% of their students had the advantage of
29
instruction from a teacher classified in such a way. A difference in teacher qualification
exists among American school districts based on poverty rates. Teachers are more likely
to be placed ―out-of-field‖ in districts serving higher numbers of children in poverty and,
therefore, less likely to be as capable of delivering instruction at its highest levels. In
high poverty and high minority schools, four of ten teachers may not be certified to teach
the subject (EdTrust, 2010).
United States continues to produce some of the highest level technology and
software in the world. In 2004, the ―Program for International Student Assessment‖
(PISA) reported that U. S. students ranked 24th
out of the 29 countries included in the
study. The study also reported that American students are lagging behind their Asian and
European counterparts and the gap appears to be widening when differences in testing
populations are not considered. The study revealed that, in the three years after the 2001
study, American student scores fell behind those of Poland, Hungary, and Spain (Dobbs,
2004). The international ranking of student achievement in mathematics likely gained
the attention of U. S. government officials.
United States Government Role in Student Achievement in Math
United States has diligently examined problems in mathematics. Government
officials depend on research and findings to decide what programs to fund. Reports from
the TIMSS and PISA gained government officials‘ attention to seek and fund programs to
improve student achievement in mathematics. The U.S. government became involved in
searching for solutions for the ongoing mathematics achievement problem. Political
initiatives took place aimed at improving student achievement in mathematics and
science as expressed in Governors Award ESRI (2009) report. United States senators and
30
governors took the podium supporting new technology programs. One example was
Washington State Governor Gregoire‘s nomination of Microsoft, recognizing that
company‘s effort to form partnerships between the state and school districts to integrate
technology into public schools. Microsoft‘s efforts included both incorporating
technology in public schools while also providing technical training to the workforce
(Governors Award ESRI, 2009).
The government continued its commitment to finding solutions to the math
problem with E-Rate legislation, an initiative that provides up to $2.5 billion annually to
connect schools and libraries to the Internet (E-Rate, 2011). The major idea of E-Rate
legislation was to use the power of technology in teaching and learning by video-
streaming lessons and instructional strategies to reach learners. An independent study by
Boster, Meyer, Roberto, and Inge (2002) showed an increase in student achievement in
math when digital video clips were used as supplemental instruction in the classroom.
The Boster et al. (2002) results were supported by Kerrey and Isakson (2003) study,
which found that students who received instruction with the computer technology
―Unitedstreaming‖ videos showed a significant increase in student achievement,
including mathematics.
Funding technology does not stop at computer hardware and software. Senator
Michael F. Bennet (Colorado) co-sponsored the Secondary School Innovation Fund Act,
providing funding to implement innovative strategies including technology at the
secondary school level to improve student achievement (S.968-111th
Congress, 2009).
According to Senator Bennet, ―No Child Left Behind resulted in a race to the bottom,
with states adopting low standards‖ (Bennet, n.d., para 12). He also shared an interesting
31
point of view on finding solutions to an on-going problem: ―We won‘t fix schools by
spending more money on the same inadequate programs. But we must commit to
funding what works‖ (Bennet, n.d., para 16). One can conclude that supporting new
technology in education requires funding, and that U.S. officials are recognizing the need
to provide financial support for programs that work. Such recognition for increased
funding is important as is the commitment that may follow.
U.S. Senators have worked together to provide funding for programs that will
improve education and student achievement. On July 19, 2007 R. F. Actions reported in
PR Newswire on the United States Senate vote to fund Enhancing Education Through
Technology (EETT) with $272 million for the year 2007. Overall, several leaders from
the technology industry expressed their appreciation to the Senate and their commitment
and support of the education system (Actions, 2007). Such actions demonstrate
understanding of the importance technology manufacturing companies play in the
solution.
One must recognize that in a capitalistic society such as the United States,
legislation is heavily influenced by lobbying efforts of businesses. When contracts and
opportunities to sell products are impacted by actions of legislation, a relationship can be
easier to trace. Low math performance also has gained the attention of a variety of
support groups. Don Knezek, CEO of the International Society for Technology, thanked
the Senate for its recognition of the connection between EETT and the nation‘s
technological competitiveness. Keith Krueger, CEO of the Consortium for School
Networking, expressed his concern that ―funding for the EETT program in FY07
represents a base hit for ed tech but not a home run.‖ (Actions, 2007, para 5). G. Thomas
32
Houlihan, executive director of the Council of Chief State School Officers, shared his
pleasure in learning the Senate had made education technology a priority. Several
companies and organizations shared their excitement and support of the funding decision
made by the Senate, including Apple, Dell, Discovery Communications, Hewlett-
Packard, Intel and Microsoft, to name a few. (Actions, 2007). So that business efforts
based only on profit motives can be avoided, the continuous development of computer-
aided instruction programs requires that educators and researchers examine the effect
these programs have on student achievement.
Examples of Using Computers in Teaching and Learning
Based on educational theoretical foundations, an asset of computers in the
classroom is that of specialized or personalized instruction (Jenkins & Keefe, 2001).
Instruction is considered individualized once it addresses the individual‘s learning style,
interests and talents. The idea of creating personalized instruction was originally based
on students with special needs (Jenkins & Keefe, 2001). Langer (2001) demonstrated
that, once instruction is customized to the student‘s needs at any ability level and
personal background, learning may be improved. Computer-aided instruction provides
relevance and creates direct connections between new skills and the student‘s background
and understanding (Langer, 2001). In examining earlier studies (Mathematica Policy
Research, 2009, Taepke, 2007, and Beck et al., 2009), researchers have examined the use
of technology in education and their findings substantiate the positive effect the use of
computers in the classrooms has on student achievement. An outcome of technology is
that its use allows the teaching of all students, at all levels, and all types of different
learning styles (Cohen, 1997).
33
Warschaur (2006) and Pytel (2007) examined student attitude toward
mathematics once technology is incorporated in lesson delivery. They concluded that
student enthusiasm and interest for learning when using computers supports teachers‘
reports that students are more attentive, interested, and alert in a technology-based lesson
delivery than in traditional classroom teaching. Feedback is important to let students
know their mistakes or if they are doing well. Computers in education provide faster and
immediate feedback, while traditional teaching styles may require a longer time.
Reinforcement learning, articulated by Hunter (1982) and building on early theories of
Pavlov and Skinner, included factors of positive and negative reinforcement. Reinforcing
learning by immediate feedback gives the learner self-confidence and a sense of self-
worthiness (Marzano, 1998).
A meta-analysis study by Stratham and Torell (1996) examined the use of
computers in teaching and learning. Their results considered 10 studies on the
effectiveness of technology in education. Stratham and Torell (1996) concluded that the
incorporation of technology in schools contributes to fewer discipline issues and a higher
rate of attendance. The study also concluded that the use of technology and ―computer-
based teaching‖ is especially effective among populations of at-risk students. The results
from the study revealed that when technology is implemented as intended, collaboration,
stimulation, student inquiries, and problem solving become an expected behavior in the
classroom.
Earlier research by DeVault (1981) still holds true to this day. He wrote about
computer technology in this way:
34
Computer technology used in mathematics education can be divided into two
categories. The first of these is computer assisted instruction (CAI), which, in
turn, can be divided into drill-and-practice programs, instruction in mathematical
concepts, problem solving, and computer programming. The second use of
computer technology is computer-managed (CMI) instruction. (p. 132)
The use of computers as a supplement to textbooks in education showed gains in
student achievement in math according to Fengfeng (2008). Students developed positive
attitudes toward math learning through computer math gaming. Short (2002) noted that
middle school Math Explorer, a computer-aided instruction program designed to address
specific Long Beach Unified School District math standards, achieved significant
increases in student math scores between pre-test and post-test results. The study
suggests that students showed noticeable gains with exposure to the Math Explorer
computer program (Short, 2002).
In summary, it seems that technologies similar to the ―I CAN Learn‖ computer
system are designed to increase student achievement in mathematics. Student learning
and student achievement are the basic objectives of successful programs used nationwide.
Technology programs such as ―Unitedstreaming,‖ ― iSucceed Math,‖ and ―Laptops in the
Classroom,‖ referred to by researchers as computer-aided instruction (CAI) or aided
instruction (AI), are initiatives designed to maximize the benefits of using technology for
individualized instruction by increasing active engagement and building on positive
reinforcement. Such programs operationalize theories that support one-to-one and self-
paced learning strategies. Such programs support theories espoused by the Self-
Actualizer strand described above.
35
As noted earlier, educators must be aware of companies that develop educational
computer programs and market products to school districts with low SES motivated by
profit. As early as 1986, Wilson and Welsh (1986) warned of companies creating
computer-aided instruction programs for their own business and market gains. They
discussed how some companies investing in AI want to create commercial products to
sell. More often, companies want to use AI to improve their own productivity and
profits. Wilson and Welsh noted that AI provides potential for companies to capture
market advantage within the industry. Companies developing and promoting computer
programs only for their own corporate gains must be avoided. The main concern remains
with companies searching for their own financial gains in developing, producing, and
marketing programs simply for financial purposes, while the focus and the goal should be
student achievement.
Research continues to study the effect of computer-aided instruction programs on
student achievement in mathematics. Findings from research on the use of three
computer programs similar to the ―I CAN Learn‖ computer system follow.
―Unitedstreaming‖ is a video-on-demand technology designed to improve lesson plans by
incorporating technology in lesson delivery methods for grades K-12. ―Unitedstreaming‖
is produced by Discovery Education, a division of Discovery Communications Inc.
Discovery Education is a leading global, real-world and knowledge-based media
company. The developers of the program are committed to create standards-based digital
resources for learning with the focus on improving student achievement (Henry, 2007).
Data from Boster, Meyer, Roberto, Lindsey, Smith, Strom, and Inge (2004), a study
conducted on the use of the ―Unitedstreaming‖ program in math classes, indicated
36
enhanced student performance and increased student scores in mathematics. The study
was an extension of Boster et al.‘s 2002 research that examined math scores for sixth and
eighth grade students in four different schools with two schools of four being assigned
randomly to the experimental condition. The control group received instruction in a
traditional setting and the experimental group received instruction using
―Unitedstreaming‖ computer program. The study found the group of sixth grade and
eighth grade students who received instruction using the computer program achieved
higher average score than the group who received traditional instruction (Boster et al.,
2004).
Another example of incorporating technology in teaching mathematics is the
―iSucceed Math‖ program, a data-driven solution for students who have not mastered
basic fundamentals of math at earlier grade levels. This program specializes in providing
individualized instruction to address conceptual learning in mathematics. The program‘s
curriculum is aligned with both the National Council of Teachers of Mathematics
(NCTM) standards and each individual state‘s standards (Blumenfeld, 2009).
The ―iSucceed Math‖ computer program was designed with a focus on Response
to Intervention methodology (RtI). RtI is a multi-system of support recently applied in
schools to address educational needs of students by providing individualized instruction,
problem solving skills, and step-by-step guided practice. The program also addresses
tutoring, group instruction, collaboration, and assessing student mastery levels. The RtI
model is closely aligned with the ―iSucceed Math‖ model which has a five-step teaching
cycle, and includes diagnostics of individual needs, appropriate lesson allocation, direct
37
practice, recapitulation opportunities, and assessing student mastery level (Beck, Conner,
Cruse & Fernandez, 2009).
Beck, Conner, Cruse, and Fernandez (2009) examined the effect ―iSucceed Math‖
computer program on student achievement. The study focused on grades five through
eight. Students who scored too low on a pre-test were placed in an ―iSucceed Math‖
class, and students who received higher scores were placed in a traditional classroom
without technology. Students who passed were not included in the study. Students who
received instruction using ―iSucceed Math‖ computer program showed a significant
increase in math scores on a post-test, surpassing their counterparts who had received
higher scores on the initial screening test.
Another initiative that includes the use of computers in teaching and learning,
―Laptops in the Classroom,‖ was recognized and supported by the Department of
Education. An article, ―Research Finds Laptop Learning Yields Better Students and
Better Teachers Through Anytime, Anywhere Access‖ (2000), revealed that students
seemed to perform better in writing, were more involved in class work, and worked more
collaboratively. Teachers also showed positive attitudes toward using technology in
teaching (Research Finds Laptop Learning, 2000). The computer program and the
technological initiative showed positive gains in student achievement in math. The
―Laptops in the Classroom‖ program provided hope for new programs to meet and
exceed expectations of success. Similar to ―Laptops in the Classroom‖ program, JRL
Enterprises, Inc. promise that the ―I CAN Learn‖ computer system delivers similar
success.
38
The use of technology in the classroom positively influences the way students feel
about their subject and learning in general (Pytel, 2007). Pytel‘s findings concluded that
students had a high level of enthusiasm for learning and showed an increased level of
self-confidence in classrooms in which computers are being used. Such findings support
a major emphasis of the JRL Enterprises Inc. program. Also, Warschaur (2006) found
similar results when studying a group of students who used laptops in their daily learning
process. At the same time, he found students who use laptops daily have higher test
scores. Middleton and Murray (1999) showed a direct correlation between student
achievement and the amount of time spent using computers for class work and learning.
The study on the Laptops program showed students who spent more time with laptops
scored significantly higher than students with no laptops or limited time with the
technology (Lowther, Ross, Morrison, 2003).
A study conducted by Ash (2005) found significant increases in student test
scores in middle school math when computers were used as teaching tools for one hour a
week. JRL Enterprises, Inc. designed its program to be used throughout the entire class
period. JRL Enterprises, Inc. marketed the ―I CAN Learn‖ computer system with
promises to increase student achievement in math supported by the research findings of
Kirby (2004), Barrow, Markman, and Rouse (2007), and WWC (2007). The ―I CAN
Learn‖ computer program gives students control and autonomy over lessons and tests.
Student engagement with computer-based instruction using the ―I CAN Learn‖ computer
system appears to be similar to that found in the Laptops in the Classroom program,
which provided self-paced, one-on-one, and higher mastery level in learning.
39
Research Regarding the “I CAN Learn” Computer System
Similar to computer-aided instruction programs explored earlier, the ―I CAN
Learn‖ computer system is marketed as a tool to increase student achievement in math.
As stated earlier, the program name, ―I CAN Learn,‖ is an acronym for ―Interactive
Computer Aided Natural Learning‖ and is also referred to as ―ICL.‖ The system is a pre-
algebra and algebra computerized curricula designed to improve problem-solving skills
with students in grades six through twelve (I CAN Learn, 2010a).
JRL Enterprises, Inc. promotes their ―I CAN Learn‖ computer system as a
problem solver that improves student achievement in pre-algebra and algebra classes. A
30-student single classroom setting with the ―I CAN Learn‖ computer program costs
between $100,000 and $300,000, depending on whether tables, wiring, and computer
hardware are purchased. JRL Enterprises, Inc. markets their product to inner city school
districts as the need to raise student achievement levels is generally perceived to be
greater (I CAN Learn, 2010a).
The ―I CAN Learn‖ computer system is designed to pre-test students individually.
Based on pre-test results, students are allowed to move to the next lesson. They also may
choose to review previous lessons to reinforce understanding before moving on. ―I CAN
Learn‖ appears to follow what Bloom (1971) advocated, that mastery learning techniques
help reduce the amount of time spent achieving mastery on a particular skill. Bloom also
claimed that mastery learning increases positive attitude and the interest of students
(Bloom, 1971). Based on Bloom‘s mastery learning, the ―I CAN Learn‖ computer
system provides students who need to learn a lesson with a warm-up session, a lesson
presentation including several videos with step-by-step problem solving, individualized
40
instruction, guided practice, and finally a quiz. When a student‘s score falls below the
threshold level of 70%, the student may ask for teacher‘s assistance. Students have the
freedom to maneuver around within each lesson, using the computer software as needed
to find examples of problems that aid the student‘s understanding (I CAN Learn, 2010a).
The ―I CAN Learn‖ computer-aided instruction program allows each student to
interact with each lesson through stages. The first stage is a pre-test to examine each
student‘s mastery level before taking the lesson. The pre-test stage helps students who
pass to move to the next lesson and eliminate boredom. The program allows each student
to learn and move at his/her own pace. A student has the choice of taking the lesson or
moving on once they pass the pre-test. Each lesson is divided into segments: warm-up,
lecture, note taking, independent practice and step-by-step examples. Students maintain
autonomy in that they may retake a test. This assists in the growth of self-confidence and
development of one‘s ownership of the learning process (I CAN Learn, 2007).
The demonstration that all learners can benefit from the use of computers has
been noted (Middleton and Murray, 1999; Beck et al., 2009; and Boster et al., 2004). In
1981, DeVault discussed the importance of Computer-Aided Instruction (CAI) in
teaching and learning:
Mathematics learning by disadvantaged youth can be improved by certain
computer applications of CAI. Studies that investigated the impact of CAI on
Native Americans, the deaf, inner city African-Americans, and bilingual
Hispanic-American youth have shown that mathematics achievement can
substantially exceed expectations based on previous experience. (p.143)
If DeVault is correct that CAI can increase student achievement among disadvantaged
41
youth, other factors may be present. These may include a culture of low expectations of
educators,
parents, and even students themselves. In such an environment, little exists to motivate a
student to complete lessons and, therefore, to achieve mastery. DeVault and others may
well recognize that CAI can instill intrinsic motivation within the learner that can
overcome other factors. Since the ICL program allows that student to move at his or her
own pace and positive reinforcement adds to the motivation to move forward, boredom
can be reduced.
Several research studies were conducted on the ―I CAN Learn‖ computer system.
Some studies reviewed in this chapter either created confusion or created additional
questions about the reliability of the data and the findings. Barrow, Markman, and Rouse
(2007), for example, examined the ―I CAN Learn‖ computer program. Their findings
showed that the use of the computer-based program had a positive effect on student math
scores and increased student achievement in the examined districts. The study
considered three school districts and used a pre-test and post-test to measure student
achievement. Data used by Barrow, et. al raised confusion concerning the reliability of
the data because the pre-tests were specifically created for the study and the post-test was
re-created to match a post-test already in place at one of the other districts.
Kirby (2004b) conducted a similar study in 2003-2004 on the ―I CAN Learn‖
computer system. Her research showed significant improvement in student achievement
in math as it was measured by the Georgia Criterion-Referenced Competency Tests
(CRCT). The students were randomly placed in ―I CAN Learn‖ classes for the Kirby
study; however, it was revealed that teachers had divided students into three groups based
42
on their performance in seventh grade math – low, average, and high – before placing
them in eighth grade math classes. This grouping may cause results to be questioned
until the composition of ICL classes can be determined. In addition to sub-grouping
students before placing them in eighth grade math classes, special education students and
all high achievers were excluded from the study.
What Works Clearinghouse was established by the U.S. Department of
Education‘s Institute of Education Science to provide the public, educators, policy
makers, and researchers with valid information on what works in teaching and learning
based on research. WWC examines the validity of research and excludes studies that do
not meet validity standards set by the organization (Schoenfeld, 2006). The following
studies and reports on the ―I CAN Learn‖ computer system create the need for more
research on the program. For example, Kerstyn‘s (2001) quasi-experimental design met
WWC standards ―with reservations.‖ The study used state standardized testing as a
means to measure student achievement. The WWC report agreed with Kerstyn‘s findings
that students who received ―I CAN Learn‖ classroom instruction did not score
significantly higher than their counterparts in traditional math classrooms (WWC, 2004).
Later, WWC (2007) published a report confirming the ―I CAN Learn‖ computer program
was found to have positive effects on student math achievement. This report was
published after WWC claimed to have updated their evidence standards and adjusted
their methodological process (Schoenfeld, 2006). Out of twelve studies, the following
studies were the ones considered for the WWC report: Kerstyn, 2001; Kerstyn, 2002;
Kirby, 2004a; Kirby, 2004b; Kirby, 2005; and Kirby, 2006 (WWC, 2007). Confusing
43
reports by the WWC caused questioning of the new positive findings after the latest
adjustments WWC altered in its methodology.
Schoenfeld (2006), senior content advisor at WWC, explained in his report in the
Educational Researcher about the WWC (2004) report,
The Institute of Education Sciences (IES), which funds WWC, instructed WWC
not to publish it. An expanded version, written at WWC‘s invitation for a special
issue of an independent electronic journal and a book to be published by WWC,
argued that methodological problems rendered some WWC mathematics reports
potentially misleading and/or uninterpretable. IES instructed WWC staff not to
publish their chapters—thus canceling the publication of the special issue and the
book. Those actions, chronicled here, raise important issues concerning the role
of federal agencies and their contracting organizations in suppressing scientific
research that casts doubt on current or intended federal policy (p. 13).
If research is to be neutral and free from political, social, or philosophical bias, it is
essential that results be published without regard to any constraints. Government
officials, in general, and educators, in particular, rely on government funded agencies to
provide data driven information to assist in making educated decisions on programs that
work in schools. Because WWC is controlled directly or indirectly by a political process
that often changes with succeeding presidential administrations, research results may
become tainted.
In 2009, What Works Clearinghouse reported that the ―I CAN Learn‖ system had
a positive effect on student math scores and achievement. WWC initially reviewed 27
studies for the report and accepted only five of the studies, concluding that there was
44
evidence that the ―I CAN Learn‖ computer-aided instruction system demonstrates a
medium to large increase in student achievement (WWC, 2009). WWC eliminated 22
studies for not meeting the WWC standards, and the following studies were considered
for the WWC (2009) report: Kerstyn, 2001; Kerstyn, 2002; Kirby, 2004a; Kirby, 2004b;
and Kirby, 2006 (WWC, 2009).
JRL Enterprises, Inc., developer and marketer of the ―I CAN Learn‖ Education
Systems, shared its own on-going improvements and continuous success in their own
newsletter: ―What Works Clearinghouse has just awarded its highest rating to the ‗I
CAN Learn‘ Algebra and Pre-Algebra programs for their ‗positive effects‘ in raising
student test scores on NCLB-required high-stakes testing‖ (I CAN Learn, 2007). On
May 4, 2009, Sandy Garrett, state superintendent of public instruction for the State of
Oklahoma, issued a letter sharing the success in student achievement resulting from the
use of the ―I CAN Learn‖ computer system statewide. Garrett‘s letter is part of the ―I
CAN Learn‖ newsletter and can be accessed from their website (I CAN Learn, 2010a)
and included in Appendix D in this study. Garrett explained that Oklahoma public
schools received a three year commitment for professional development and technical
support in addition to the hardware and software of the system to ensure the program‘s
success. The information provided in Garrett‘s letter displays an average increase of 20%
in the median number of students scoring proficient or higher on the Oklahoma Core
Curriculum Test (OCCT) for the years 2006, 2007, and 2009.
JRL Enterprises, Inc. assessed student achievement in Oklahoma in mathematics
on the Oklahoma Core Curriculum Test (OCCT) before and after implementing the ―I
CAN Learn‖ computer system in the public schools. The information shared by JRL
45
Enterprises Inc. included a chart of student scores on the OCCT from 2005 to 2008 and
can be viewed in Appendix E. The information from the chart reveals the average growth
in student achievement to be ―from 46.4% in 2006 to 74% in 2008 in 10 schools.‖ The
information included the use of the program in 50 public schools; however, the chart
shared by JRL Enterprises, Inc. displays only 36 of the 50 schools (Oklahoma Schools
See, 2009).
JRL Enterprises Inc. reported the following information in their July, 2010
newsletter celebrating their success, recognition and accomplishments. The newsletter
stated, ―In boosting student performance, the program makes all teachers ‗highly
effective teachers,‘ especially those in the lowest-achieving school, a hallmark priority of
the federal government‖ (I CAN Learn, 2010d, para 8). In the January, 2010 newsletter,
JRL stated, ―School officials are turning to the I CAN Learn Instructional Improvement
System as a key component in their plans to compete for $4.35 billion in federal Race to
the Top grants‖ (I CAN Learn, 2010b, para 1). Noting the self-reporting nature of the
information, JRL Enterprises, Inc. reported in April, 2010 newsletter ―U.S. Department
of Education to award Tennessee and Delaware Race to the Top grants further affirms a
national commitment to data tracking systems like the one included in the I CAN Learn
Instructional Improvement System‖ (I CAN Learn, 2010c, para 3). In the July, 2010
newsletter, JRL Enterprises, Inc. shared the following:
School CIO Strategies for K-12 Technology Leaders featured the I CAN Learn
Instructional Improvement System (IIS) on its front page, highlighting its status as
the only middle school math program to earn the U.S. Department of Education‘s
What Works Clearinghouse‘s highest rating of ―Positive Effects.‖ Ratings for
46
other math intervention programs range from no effects to potentially positive
effects (I Can Learn, 2010d, para 1).
Summary
Chapter two provided a review of the literature on the use of computers in
teaching and learning. This chapter demonstrates the need to recognize that technology
development, growth, and social dependency extend to schools and education. The
literature also demonstrates the need for educators to stay abreast of research concerning
the use of technology. The rapid increase continues in dependence on technology in the
education system for teaching strategies, lesson delivery methods, and student
achievement. Raising student achievement in mathematics is not a new challenge. The
reviewed literature demonstrates the continuous struggle to compete internationally in
mathematics and the need for improvements in student achievement.
Searching for new ways to improve student achievement in mathematics was
never confined to schools. Government officials share in trying to figure out what works
best for our children, and depend on reliable research to determine what helps our
education system.
This chapter reviewed computer-aided instruction programs and the literature
related to the topic. The programs were: ―Unitedstreaming,‖ a video-on-demand
technology, ―iSucceed Math‖ program, a data driven program, and Laptops in the
classroom, a ―one-on-one‖ and self-paced initiative to help improve student achievement
in math.

47
In Chapter three, research methodology will be explained. The chapter will
address the research design, the population and sample, the instrumentation, validity, data
collection procedure, data analysis, and limitations.
48
Chapter Three
Research Methodology
The purpose of the study was to determine if the ―I CAN Learn‖ computer system
implemented by Hickman Mills School District in eighth grade had an effect on student
achievement and math scores. The study compared average Missouri Assessment
Program (MAP) math scores to determine if eighth grade student scores were greater for
those who received instruction using the ―I CAN Learn‖ computer system than for those
who received traditional instruction. Students were divided into male, female, special
education, and low SES subgroups. This chapter describes the methodology used to
conduct the study including the research design, population and sample, instrumentation,
validity, data collection, data analysis, and limitations.
Research Design
This quasi-experimental study used MAP achievement scores from eighth grade
students in the Hickman Mills School District. The independent variable was the
instructional method used in the classroom for the 2006-2007 and 2007-2008 school
years. Students who received instruction using the ―I CAN Learn‖ computer system were
the treatment group. Students in the control group received ―Chalk and Talk‖ math
instruction. Data obtained were used to determine if student achievement was greater for
students in eighth grade math classes who received instruction using the ―I CAN Learn‖
computer system instruction than for those students who received traditional math
instruction.
49
Population and Sample
The population for this study included eighth grade students attending Smith-Hale
and Ervin middle schools at Hickman Mills School District in 2006-2007 and 2007-2008
school years. The participants for this study were students identified to receive
instruction using the ―I CAN Learn‖ computer program in the eighth grade and students
who received traditional math instruction. A random selection process was used to place
students in all math classes, including the ―I CAN Learn‖ computer classrooms. School
administrators divided students by marking student rosters, following a random
procedure without regard to any characterizing factor. ―We use a highlighter and
randomly mark student names to be placed in all math classes‖ (J. Davis, personal
communication, September 20, 2009).
Students who did not attend seventh grade in the district, students who attended
the Management school, students who were homebound, and students with invalid MAP
scores were excluded from this study to reduce the possibility that differences in
instruction and other such factors would affect results. The sample for this study
included a total of 589 students who received mathematics instruction using the ―I CAN
Learn‖ computer system and 363 eighth grade students who received traditional
mathematics instruction for the 2006-2007 and 2007-2008 school years.
Instrumentation
Hickman Mills School District uses the Missouri Assessment Program (MAP) to
measure student achievement. MAP testing is required and administered every year to all
students in the eighth grade in Missouri. MAP tests are aligned with the Missouri math
standards and require approximately three hours for completing all sessions in the
50
mathematics portion of the test (Missouri Department of Elementary and Secondary
Education, 2010e).
The MAP testing for eighth grade includes Communication Arts, Mathematics,
and Science. These assessments are designed to determine if students are meeting grade
level standards (Missouri Department of Elementary and Secondary Education, 2010e).
The Mathematics score portion from the MAP test data was used for this study. The
MAP tests assess mathematics during three sessions. MAP mathematics tests for eighth
grade are constructed to assess:
Number and Operations
Algebraic Relationships
Geometric and Spatial Relationships
Measurement
Data and Probability
The MAP test is divided into three sessions, two that are untimed and one that is strictly
timed. All three sessions contain multiple choice and constructed response questions. In
all, the eighth grade MAP test is comprised of 64 questions and problems. Students are
allowed to use calculators in the untimed sessions.
The MAP test is a high stakes, secured state testing program that includes
Communication Arts, Mathematics, and Science in grades 3-11. To provide examples of
MAP questions for this study, only released items from the MAP test are available to the
public. Currently, questions from session one are released. Examples of test items may
be found in Appendix H.
51
Validity
Construct validity of the MAP test is established by demonstrating the test‘s
ability to measure the constructs the test claims to measure. A CTB/McGraw-Hill report
(2007) provides evidence of validity by the minimization of construct irrelevant variance,
by focusing the questions on the skill being tested, and under representation, by probing
questions targeting the tested skill in the development process of the MAP test.
Continuous review of the items representing that content are first steps in minimizing
construct irrelevant variance. CTB shares the steps taken to minimize construct
irrelevant variance and construct under representation, including: specification, item
writing, review, field testing, and test construction (CTB/McGraw-Hill, 2007).
Schools in Missouri experienced an evolution of testing that began with the
passing of legislation in 1984 intended to focus on the improvement of student
achievement. Prior to the 1984 legislations, Missouri students in eighth grade completed
the BEST Test as well as other standardized achievement tests selected individually by
each district (K. Whited, personal communication, 2011). Once the 1984 legislation was
in place, the state department developed the Missouri Mastery Achievement Test
(MMAT) which was later replaced by the Missouri Assessment Program (MAP). This
set of tests was developed by CTB/McGraw-Hill. Districts were given the option of
using the MAP test or developing their own as long as the test met certain criteria. Given
that many Missouri school districts lack the staff resources necessary to develop their
own tests, all districts adopted the MAP and since 1999, have continued to refine
processes with the intent of improving the overall process (Missouri Department of
Elementary and Secondary Education, 2007).
52
In 1999, validity of the MAP study was evaluated by the Department of Education
and Counseling Psychology College of Education, University of Missouri-Columbia.
The study, designed to examine the meaningfulness of the MAP test results, focused
specifically on changes in instructional practices in mathematics. The research also
reported that teachers were becoming more adaptive and data-driven based on MAP test
results. Educators began revising grading practices as a result of the MAP. Increased
uses of performance event testing methods have been noted (Short et al., 1999).
DESE developed the MAP assessments using rigorous test development
procedures. The tests were developed and aligned to specific Missouri State standards
being measured at a specific grade level. Missouri teachers took part in writing
constructed response questions and performance events that matched the measured
standards. Each question was reviewed by a group of educators to ensure the alignment
of each item to the specific standard. The alignment of questions produced by the
reviewers was used to provide evidence for the meaningfulness of the MAP scores
(MODESE, 2010c).
Data Collection Procedure
Hickman Mills School District required a copy of the researcher‘s Institutional
Review Board (IRB) request, in which the researcher provided detailed information about
the study, its purpose, subjects to be included, and steps taken to ensure data
confidentiality. The IRB also required details of any observations, questionnaires, and
any conditions or manipulation that are part of the study. The researcher‘s IRB is
attached as Appendix F.
53
Hickman Mills School District required submission of a letter from Baker
University indicating that this study was approved. This letter is attached as Appendix G.
A letter of approval for data release from the director of curriculum and instruction at
Hickman Mills School District was also obtained and attached as Appendix C. Hickman
Mills School District required that student identities were confidential and not revealed in
this study. Student names and identification numbers for the school years 2005-2006 and
2006-2007 for seventh grade student rosters were provided by the District to allow the
researcher to determine and exclude transferred students into the eighth grade from the
study. A list of all students who attended eighth grade during the school years 2006-2007
and 2007-2008 was provided. Prior to any uses of data, student information that
identified individuals was deleted to eliminate questions of bias based on familiarity by
the researcher. Data provided to the researcher for this study included all student
information essential to the study, such as gender, MAP score, Special Education with an
Individual Education Plan (IEP), and if a student received free or reduced lunches, and if
the student attended the ―I CAN Learn‖ computer system classroom or traditional
classroom.
Data Analysis
Independent samples t-tests were performed to determine the significant
difference in student achievement between the two means of (MAP) scores of students
who used the ―I CAN Learn‖ computer system and students who did not use the ―I CAN
Learn‖ computer program for the 2006-2007 and 2007-2008 school years. The following
research questions and corresponding null hypotheses (H0) were the focus of this study.
54
SPSS computer software was used to perform the statistical analysis needed for this
study.
Data analysis was performed to address the following research questions and the
corresponding null hypothesis:
1. As determined by the Missouri Assessment Program (MAP) is student
achievement greater for students who used the ―I CAN Learn‖ computer
system than for students who received traditional instruction in eighth
grade math? The following null hypothesis, ―The mean of MAP scores
for students who received math instruction using the ‗I CAN Learn‘
computer program is no different from the mean of MAP scores for
students who received traditional math instruction at the 0.05 level of
significance‖ (H0: µ group1 = µ group2), was examined using SPSS
computer software.
2. As determined by the Missouri Assessment Program (MAP), is student
achievement greater for male students who used the ―I CAN Learn‖
computer system than for male students who received traditional
instruction in eighth grade math? The following null hypothesis, ―The
mean of MAP scores for male students who received math instruction
using the ‗I CAN Learn‘ computer program is no different from the mean
of MAP scores for male students who received traditional math instruction
at the 0.05 level of significance‖ (H0: µ male (group1) = µ male (group2)),
was examined using SPSS computer software.
55
3. As determined by the Missouri Assessment Program (MAP), is student
achievement greater for female students who used the ―I CAN Learn‖
computer system than for female students who received traditional
instruction in eighth grade math? The following null hypothesis, ―The
mean of MAP scores for female students who received math instruction
using the ‗I CAN Learn‘ computer program is no different from the mean
of MAP scores for female students who received traditional math
instruction at the 0.05 level of significance‖ (H0: µ female (group1) = µ
female (group2)), was examined using SPSS computer software.
4. As determined by the Missouri Assessment Program (MAP), is student
achievement greater for students with special needs who received math
instruction using the ―I CAN Learn‖ computer system than for students
with special needs who received traditional instruction in eighth math?
The following null hypothesis, ―The mean of MAP scores for students
with special education needs who received math instruction using the ‗I
CAN Learn‘ computer program is no different from the mean of MAP
scores for students with special education needs who received traditional
math instruction at the 0.05 level of significance‖ (H0: µ SpEd (group1) =
µ SpEd (group2)), was examined using SPSS computer software.
5. As determined by the Missouri Assessment Program (MAP), is student
achievement greater for students receiving free/reduced lunch who used
the ―I CAN Learn‖ computer system than for students receiving
free/reduced lunch who attended traditional instruction classes in eighth
56
grade math? The following null hypothesis, ―The mean of MAP scores
for students on free and reduced lunch program who received math
instruction using the ‗I CAN Learn‘ computer program is no different
from the mean of MAP scores for students on free and reduced lunch
program who received traditional math instruction at the 0.05 level of
significance‖ (H0: µ Free &Reduced lunch (group1) = µ Free &Reduced
lunch (group2)), was examined using SPSS.
Limitations
This study was limited by factors such as students attitudes toward computers and
student pre-knowledge of computer usage. The study was also limited by teachers‘
educational level in mathematics and teachers‘ level of confidence in using computers.
The MAP test scores were the only standardized test results available from Hickman
Mills School District for 2006-2007 and 2007-2008 school years. The research was
limited by the accuracy, dependability, and reliability of the MAP test.
The study was also limited by the impact teachers have on students during
instruction in terms of effective modeling. The limitations in this study included student
absenteeism and the natural effect computers have on students.
Summary
The purpose of the study was to determine if the pre-algebra and algebra ―I CAN
Learn‖ computer program implemented by Hickman Mills School District had an effect
on student achievement in eighth grade math classes. This study examined student math
scores from the MAP test for 2006-2007 and 2007-2008 school years. Students who
were transferred into the district for the examined school years were excluded from the
57
study. Student data used for this study were divided into two groups. The experimental
group was comprised of students who used the ―I CAN Learn‖ and the controlled group
was comprised of students who did not use the computer program. SPSS computer
software was used in this study to perform all the statistical analysis needed for the study.
Independent samples t-tests were conducted to determine the effect ―I CAN Learn‖
computer system on student achievement. Chapter four describes the results of the
statistical analyses of the data.
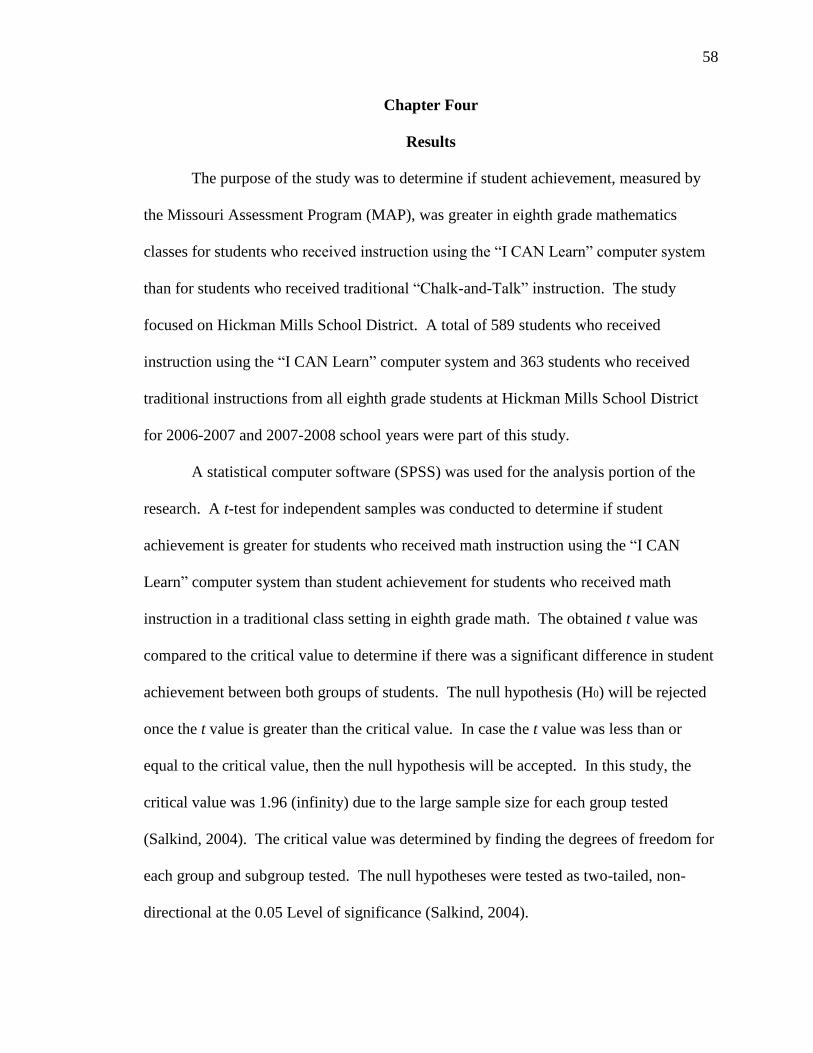
58
Chapter Four
Results
The purpose of the study was to determine if student achievement, measured by
the Missouri Assessment Program (MAP), was greater in eighth grade mathematics
classes for students who received instruction using the ―I CAN Learn‖ computer system
than for students who received traditional ―Chalk-and-Talk‖ instruction. The study
focused on Hickman Mills School District. A total of 589 students who received
instruction using the ―I CAN Learn‖ computer system and 363 students who received
traditional instructions from all eighth grade students at Hickman Mills School District
for 2006-2007 and 2007-2008 school years were part of this study.
A statistical computer software (SPSS) was used for the analysis portion of the
research. A t-test for independent samples was conducted to determine if student
achievement is greater for students who received math instruction using the ―I CAN
Learn‖ computer system than student achievement for students who received math
instruction in a traditional class setting in eighth grade math. The obtained t value was
compared to the critical value to determine if there was a significant difference in student
achievement between both groups of students. The null hypothesis (H0) will be rejected
once the t value is greater than the critical value. In case the t value was less than or
equal to the critical value, then the null hypothesis will be accepted. In this study, the
critical value was 1.96 (infinity) due to the large sample size for each group tested
(Salkind, 2004). The critical value was determined by finding the degrees of freedom for
each group and subgroup tested. The null hypotheses were tested as two-tailed, non-
directional at the 0.05 Level of significance (Salkind, 2004).
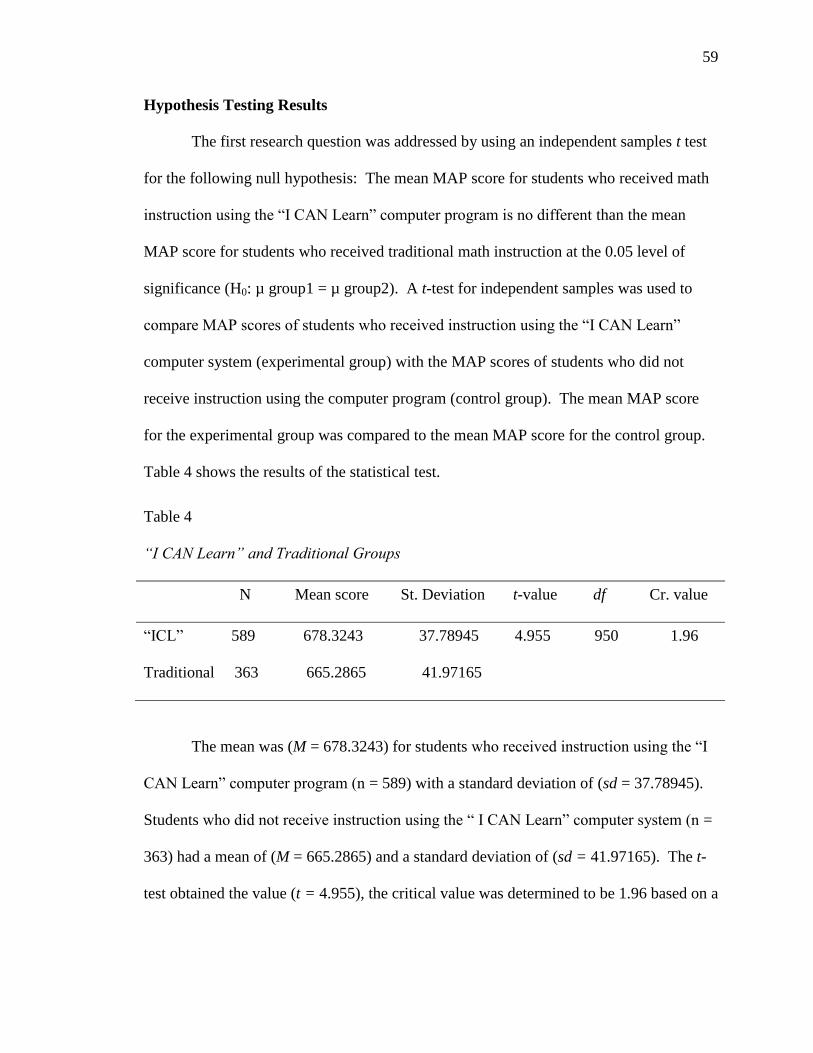
59
Hypothesis Testing Results
The first research question was addressed by using an independent samples t test
for the following null hypothesis: The mean MAP score for students who received math
instruction using the ―I CAN Learn‖ computer program is no different than the mean
MAP score for students who received traditional math instruction at the 0.05 level of
significance (H0: µ group1 = µ group2). A t-test for independent samples was used to
compare MAP scores of students who received instruction using the ―I CAN Learn‖
computer system (experimental group) with the MAP scores of students who did not
receive instruction using the computer program (control group). The mean MAP score
for the experimental group was compared to the mean MAP score for the control group.
Table 4 shows the results of the statistical test.
Table 4
“I CAN Learn” and Traditional Groups
N Mean score St. Deviation t-value df Cr. value
―ICL‖ 589 678.3243 37.78945 4.955 950 1.96
Traditional 363 665.2865 41.97165
The mean was (M = 678.3243) for students who received instruction using the ―I
CAN Learn‖ computer program (n = 589) with a standard deviation of (sd = 37.78945).
Students who did not receive instruction using the ― I CAN Learn‖ computer system (n =
363) had a mean of (M = 665.2865) and a standard deviation of (sd = 41.97165). The t-
test obtained the value (t = 4.955), the critical value was determined to be 1.96 based on a
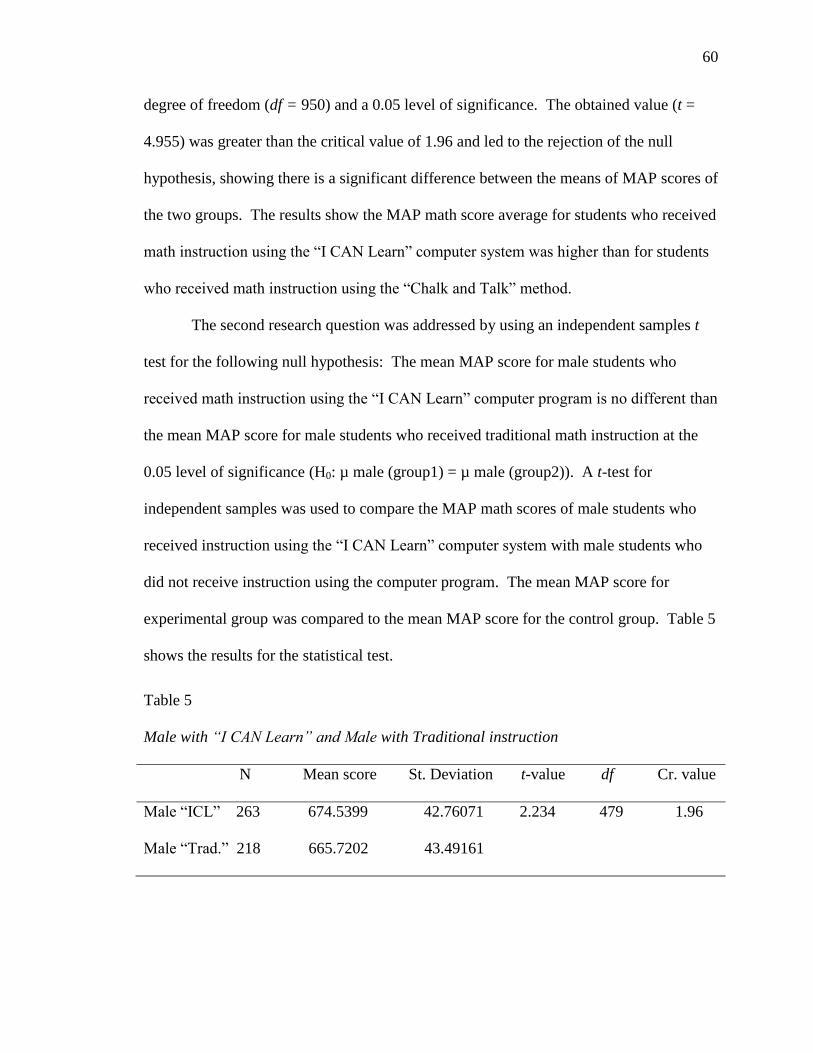
60
degree of freedom (df = 950) and a 0.05 level of significance. The obtained value (t =
4.955) was greater than the critical value of 1.96 and led to the rejection of the null
hypothesis, showing there is a significant difference between the means of MAP scores of
the two groups. The results show the MAP math score average for students who received
math instruction using the ―I CAN Learn‖ computer system was higher than for students
who received math instruction using the ―Chalk and Talk‖ method.
The second research question was addressed by using an independent samples t
test for the following null hypothesis: The mean MAP score for male students who
received math instruction using the ―I CAN Learn‖ computer program is no different than
the mean MAP score for male students who received traditional math instruction at the
0.05 level of significance (H0: µ male (group1) = µ male (group2)). A t-test for
independent samples was used to compare the MAP math scores of male students who
received instruction using the ―I CAN Learn‖ computer system with male students who
did not receive instruction using the computer program. The mean MAP score for
experimental group was compared to the mean MAP score for the control group. Table 5
shows the results for the statistical test.
Table 5
Male with “I CAN Learn” and Male with Traditional instruction
N Mean score St. Deviation t-value df Cr. value
Male ―ICL‖ 263 674.5399 42.76071 2.234 479 1.96
Male ―Trad.‖ 218 665.7202 43.49161
61
The mean was (M = 674.5399) for male students who received instruction using
the ―I CAN Learn‖ computer program (n = 263) with a standard deviation of (sd =
42.76071). Male students who did not receive instruction using the ―I CAN Learn‖
computer system (n = 218) had a mean of (M = 665.7202) and a standard deviation of (sd
= 43.49161). The t-test obtained value was (t = 2.234), the critical value was determined
to be 1.96 based on a degree of freedom (df = 479) and a 0.05 level of significance. The
obtained value (t = 2.234) was greater than the critical value of 1.96 and led to the
rejection of the null hypothesis showing there is significant difference between the means
of MAP scores of the two groups. The results show math score average for male students
who received instruction using the ―I CAN Learn‖ computer system was higher than
male students who received instruction using the ―Chalk and Talk‖ method.
The third research question was addressed by using an independent samples t test
for the following null hypothesis: The mean MAP score for female students who
received math instruction using the ―I CAN Learn‖ computer program is no different than
the mean MAP score for female students who received traditional math instruction at the
0.05 level of significance (H0: µ female (group1) = µ female (group2)). A t-test for
independent samples was used to compare math MAP scores of female students who
received instruction using the ―I CAN Learn‖ computer system with female students who
did not receive instruction using the computer program. The mean MAP score for the
experimental group was compared to the mean MAP score for the control group. Table 6
shows the results for the statistical test.
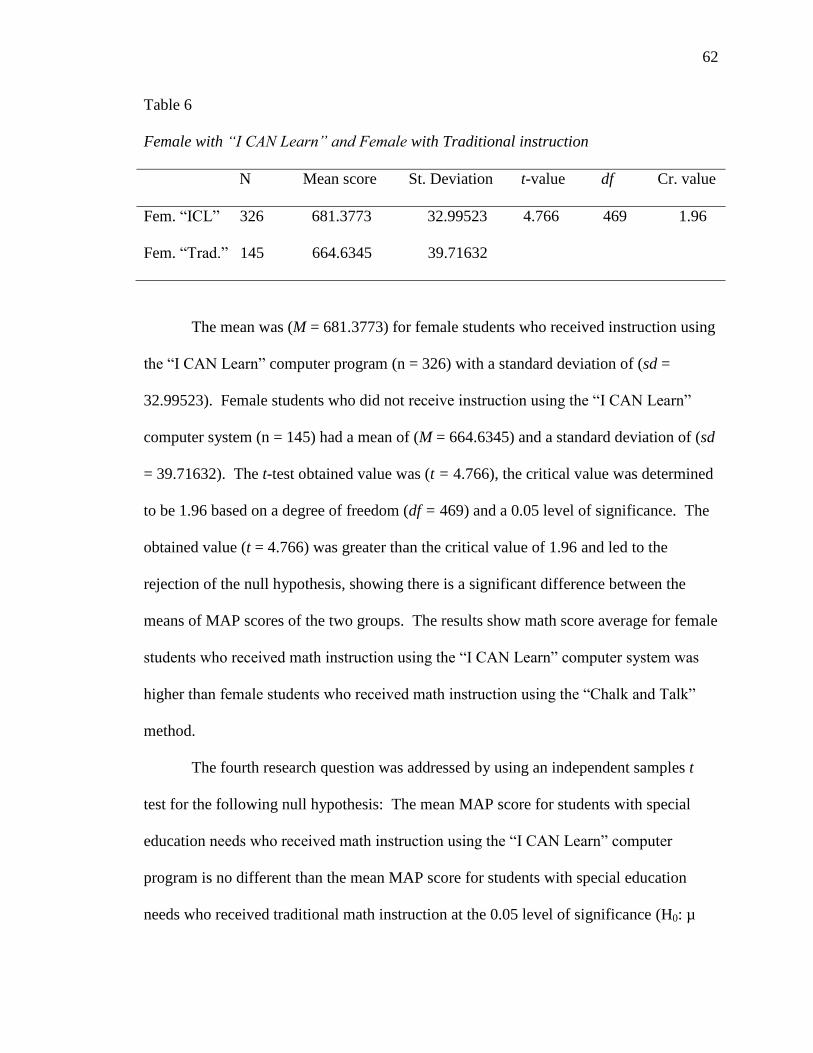
62
Table 6
Female with “I CAN Learn” and Female with Traditional instruction
N Mean score St. Deviation t-value df Cr. value
Fem. ―ICL‖ 326 681.3773 32.99523 4.766 469 1.96
Fem. ―Trad.‖ 145 664.6345 39.71632
The mean was (M = 681.3773) for female students who received instruction using
the ―I CAN Learn‖ computer program (n = 326) with a standard deviation of (sd =
32.99523). Female students who did not receive instruction using the ―I CAN Learn‖
computer system (n = 145) had a mean of (M = 664.6345) and a standard deviation of (sd
= 39.71632). The t-test obtained value was (t = 4.766), the critical value was determined
to be 1.96 based on a degree of freedom (df = 469) and a 0.05 level of significance. The
obtained value (t = 4.766) was greater than the critical value of 1.96 and led to the
rejection of the null hypothesis, showing there is a significant difference between the
means of MAP scores of the two groups. The results show math score average for female
students who received math instruction using the ―I CAN Learn‖ computer system was
higher than female students who received math instruction using the ―Chalk and Talk‖
method.
The fourth research question was addressed by using an independent samples t
test for the following null hypothesis: The mean MAP score for students with special
education needs who received math instruction using the ―I CAN Learn‖ computer
program is no different than the mean MAP score for students with special education
needs who received traditional math instruction at the 0.05 level of significance (H0: µ
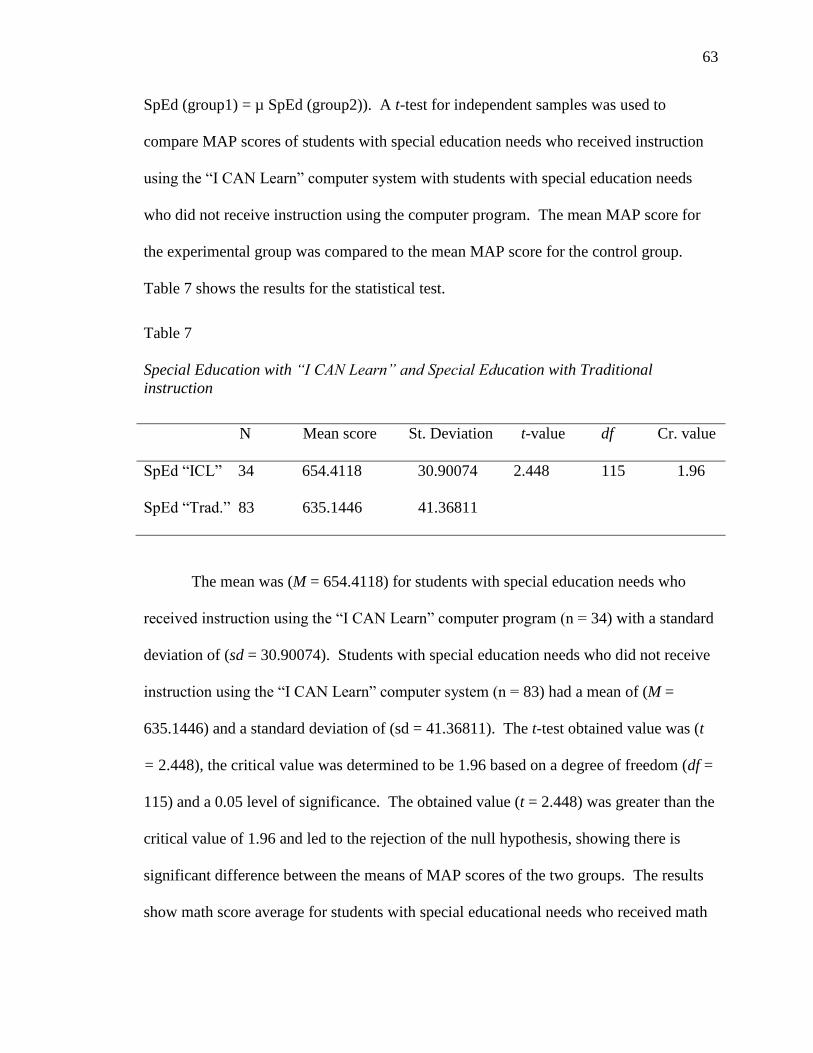
63
SpEd (group1) = µ SpEd (group2)). A t-test for independent samples was used to
compare MAP scores of students with special education needs who received instruction
using the ―I CAN Learn‖ computer system with students with special education needs
who did not receive instruction using the computer program. The mean MAP score for
the experimental group was compared to the mean MAP score for the control group.
Table 7 shows the results for the statistical test.
Table 7
Special Education with “I CAN Learn” and Special Education with Traditional
instruction
N Mean score St. Deviation t-value df Cr. value
SpEd ―ICL‖ 34 654.4118 30.90074 2.448 115 1.96
SpEd ―Trad.‖ 83 635.1446 41.36811
The mean was (M = 654.4118) for students with special education needs who
received instruction using the ―I CAN Learn‖ computer program (n = 34) with a standard
deviation of (sd = 30.90074). Students with special education needs who did not receive
instruction using the ―I CAN Learn‖ computer system (n = 83) had a mean of (M =
635.1446) and a standard deviation of (sd = 41.36811). The t-test obtained value was (t
= 2.448), the critical value was determined to be 1.96 based on a degree of freedom (df =
115) and a 0.05 level of significance. The obtained value (t = 2.448) was greater than the
critical value of 1.96 and led to the rejection of the null hypothesis, showing there is
significant difference between the means of MAP scores of the two groups. The results
show math score average for students with special educational needs who received math
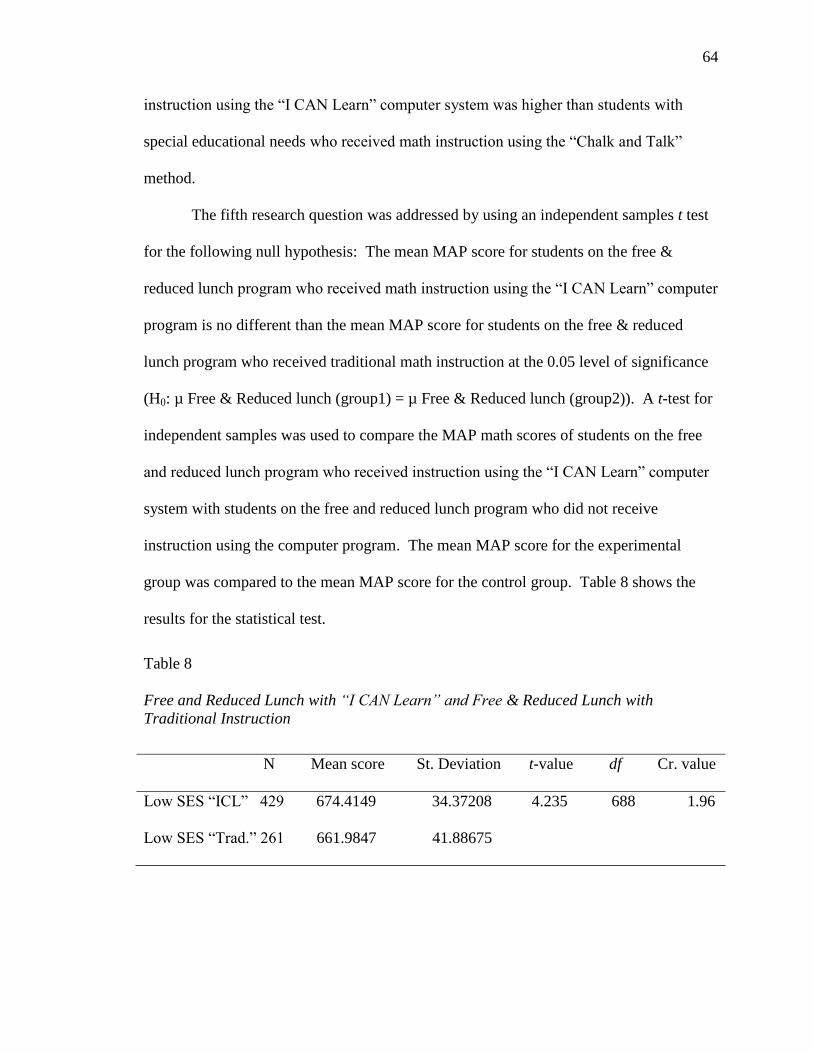
64
instruction using the ―I CAN Learn‖ computer system was higher than students with
special educational needs who received math instruction using the ―Chalk and Talk‖
method.
The fifth research question was addressed by using an independent samples t test
for the following null hypothesis: The mean MAP score for students on the free &
reduced lunch program who received math instruction using the ―I CAN Learn‖ computer
program is no different than the mean MAP score for students on the free & reduced
lunch program who received traditional math instruction at the 0.05 level of significance
(H0: µ Free & Reduced lunch (group1) = µ Free & Reduced lunch (group2)). A t-test for
independent samples was used to compare the MAP math scores of students on the free
and reduced lunch program who received instruction using the ―I CAN Learn‖ computer
system with students on the free and reduced lunch program who did not receive
instruction using the computer program. The mean MAP score for the experimental
group was compared to the mean MAP score for the control group. Table 8 shows the
results for the statistical test.
Table 8
Free and Reduced Lunch with “I CAN Learn” and Free & Reduced Lunch with
Traditional Instruction
N Mean score St. Deviation t-value df Cr. value
Low SES ―ICL‖ 429 674.4149 34.37208 4.235 688 1.96
Low SES ―Trad.‖ 261 661.9847 41.88675
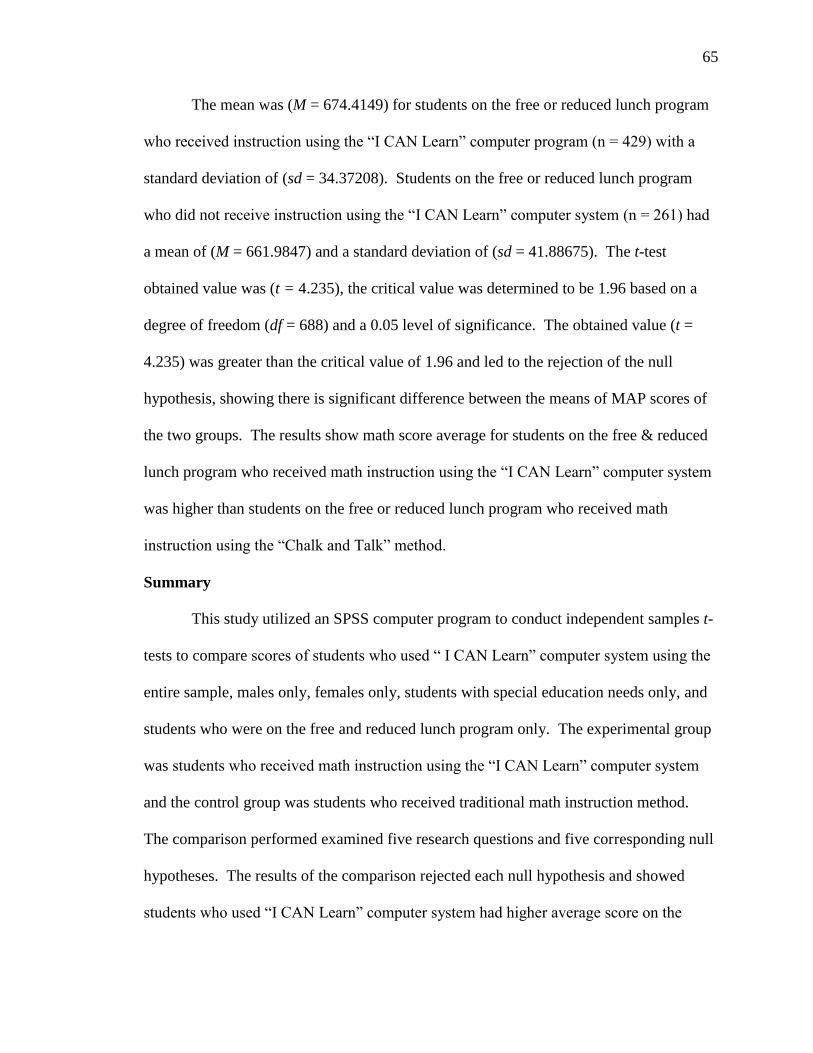
65
The mean was (M = 674.4149) for students on the free or reduced lunch program
who received instruction using the ―I CAN Learn‖ computer program (n = 429) with a
standard deviation of (sd = 34.37208). Students on the free or reduced lunch program
who did not receive instruction using the ―I CAN Learn‖ computer system (n = 261) had
a mean of (M = 661.9847) and a standard deviation of (sd = 41.88675). The t-test
obtained value was (t = 4.235), the critical value was determined to be 1.96 based on a
degree of freedom (df = 688) and a 0.05 level of significance. The obtained value (t =
4.235) was greater than the critical value of 1.96 and led to the rejection of the null
hypothesis, showing there is significant difference between the means of MAP scores of
the two groups. The results show math score average for students on the free & reduced
lunch program who received math instruction using the ―I CAN Learn‖ computer system
was higher than students on the free or reduced lunch program who received math
instruction using the ―Chalk and Talk‖ method.
Summary
This study utilized an SPSS computer program to conduct independent samples t-
tests to compare scores of students who used ― I CAN Learn‖ computer system using the
entire sample, males only, females only, students with special education needs only, and
students who were on the free and reduced lunch program only. The experimental group
was students who received math instruction using the ―I CAN Learn‖ computer system
and the control group was students who received traditional math instruction method.
The comparison performed examined five research questions and five corresponding null
hypotheses. The results of the comparison rejected each null hypothesis and showed
students who used ―I CAN Learn‖ computer system had higher average score on the
66
MAP test than students who received traditional math instruction. The results in chapter
four show math average score for male students, female students, students with special
educational needs and students on free or reduced lunch program who received math
instruction using the ―I CAN Learn‖ computer program was higher than similar student
subgroups who received math instruction using the traditional ―Chalk and Talk‖ method.
Chapter five presents an overview of the research problem, purpose of the research,
review of the methodology, findings related to the literature, implications for action, and
recommendations for future research.
67
Chapter Five
Interpretation and Recommendations
Hickman Mills School District adopted the ―I CAN Learn‖ computer program in
2003 to help students with math skills. The goal was to increase student achievement in
math and increase student scores on the Missouri Assessment Program (MAP). The ―I
CAN Learn‖ computer system, created by JRL Enterprises, Inc., was designed to help
students learn algebra, pre-algebra concepts, and basic math skills (JRL Enterprises Inc.,
2010). This study examined the effect ―I CAN Learn‖ computer system had on student
achievement in eighth grade math by comparing average MAP scores between students
who used the ―I CAN Learn‖ computer program and students who did not use the
computer system in eighth grade. Average MAP scores of subgroups of the population
were also analyzed to explore trends with respect to gender, special education students
and students on free and reduced lunch program. This chapter presents an overview of
the problem, purpose of the research, review of the methodology, findings related to the
literature, and findings. This chapter also includes implications for action, and
recommendations for future research.
Summary of Findings
In this section, the overview of the problem is reviewed as well as the purpose of
the study and the methodology used.
Overview of the Problem.
Missouri Department of Elementary and Secondary Education is holding school
districts accountable for their performance. The No Child Left Behind 2001 Act held
schools accountable to increase student achievement in reading, science, and
68
mathematics. Student subgroups including low SES, and students with special
educational needs are expected to perform at or above grade level by the year 2014.
Facing the challenge, school districts are searching for instructional methods that will
improve student achievement including technology in the classrooms. JRL Enterprises,
Inc. developed and marketed the ―I CAN Learn‖ computer program. The company
purports the program increases student achievement in middle and high school pre-
algebra and algebra in districts with large concentrations of ethnically diverse, inner-city
students as well as in districts with low socioeconomic demographics (JRL Enterprises
Inc., 2010). Hickman Mills secured funding and purchased the computer program in
2003 to increase student achievement on the MAP test.
Purpose of the Study.
A lack of research exists in Missouri about the ―I CAN Learn‖ computer program
created by JRL Enterprises, Inc. The purpose of the study was to determine if the ―I
CAN Learn‖ computer program implemented by Hickman Mills School District had an
effect on student achievement and math test scores in eighth grade when compared to
similar students who received math instruction in a traditional classroom setting, as
measured by the Missouri Assessment Program. The study included 589 students who
received math instruction using the ―I CAN Learn‖ computer system and 363 students
who received math instruction using ―Chalk and Talk‖ instructional method.
Review of Methodology.
The study compared student achievement and average math scores in terms of
(MAP) test scores in mathematics to determine if student math scores are greater for male
students, female students, students with special educational needs, and students with low
69
SES who received math instruction using the ―I CAN Learn‖ computer system than
similar subgroups of students who received math instruction in a traditional class setting
in eighth grade math. The independent variable for this study was the instructional
method. Students in the experimental group received math instruction using the ―I CAN
Learn‖ computer system. The control group received traditional math instruction. The
Missouri state assessment MAP scores were used to compare the average scores between
the two groups and served as the dependent variable. Hickman Mills School District
provided seventh and eighth grade MAP math scores for 2006-2007 and 2007-2008
school years for students who attended Smith-Hale and Ervin Middle Schools. All
information regarding individual students was initially available to the researcher;
however, this information was deleted prior to any analysis. Data included the type of
math class the student attended as well as student gender, if the student had special
educational needs, and if the student was enrolled in the free and reduced lunch program.
The Missouri Assessment Program is aligned with the Missouri State Mathematics
Standards. JRL Enterprises, Inc. claim the curriculum software meets the National
Council of Teachers of Mathematics (NCTM) standards and can be configured to meet
state and local grade-level expectations.
Findings
Five different t-tests for independent samples were conducted to determine if
student achievement was greater for students who received math instruction using the ―I
CAN Learn‖ computer system than for students who received math instruction in a
traditional classroom setting in eighth grade. In this study, the obtained t value was
greater than the critical value of 1.96 for all the of the research questions set by the
70
researcher. The five null hypotheses were rejected based on the sample evidence.
Results revealed higher math achievement for students who received instruction using the
―I CAN Learn‖ computer system than students who received traditional math instruction,
referred in this study as ―Chalk and Talk.‖ Results were disaggregated for gender,
special needs, and SES status.
The mean was higher for the group of students who received instruction using
the ―I CAN Learn‖ computer program than the group of students who received traditional
math instruction. The obtained value was greater than the critical value, once compared,
which led to the rejection of the null hypothesis. The results show a statistically
significant increase in math scores in students who received instruction using the ―I CAN
Learn‖ computer program from their counterparts who received math instruction in a
traditional class setting.
A statistically significant difference was also found in male students who received
instruction using the ―I CAN Learn‖ computer program than the subgroup of male
students who received traditional math instruction. The obtained value was also greater
than the critical value, once compared, which led to the rejection of the null hypothesis.
A statistically significant difference was also found in female students who
received instruction using the ―I CAN Learn‖ computer program than the subgroup of
female students who received traditional math instruction. The obtained value was
greater than the critical value, once compared, which led to the rejection of the null
hypothesis.
The mean was higher in math scores of students with special educational needs
who received instruction using the ―I CAN Learn‖ computer program than the subgroup
71
of students with special educational needs who received traditional math instruction. The
obtained value was greater than the critical value, once compared, which led to the
rejection of the null hypothesis.
Finally, a statistically significant difference in math scores was also found for
students on free and reduced lunch program who received instruction using the ―I CAN
Learn‖ computer program than the subgroup of students on free and reduced lunch
program who received traditional math instruction. The obtained value was greater than
the critical value, once compared, which led to the rejection of the null hypothesis.
Findings Related to the Literature
As expressed in the Stratham and Torell (1996) study in Chapter two,
incorporating technology in teaching reduced discipline issues and student drop-out rates.
While not all students included in this study may be categorized as ―at-risk,‖ students
may gain, in terms of learning, from the benefits of having access to technology in
classrooms. Student benefits include collaboration, student inquiries, and problem
solving resulting in higher achievement and test scores as shown in Appendix J (Costa
and Garmston, 2002).
According to Kirby‘s (2004b) study that was discussed in the literature review,
students who used the ―I CAN Learn‖ computer program showed significant increases in
math scores when the Georgia Assessment System test scores were used to measure
student achievement. What Works Clearinghouse examined several studies conducted on
the ―I CAN Learn‖ computer program including Kirby (2004b) and concluded the
program has positive impact on student achievement. WWC considered different studies
for their 2007 and 2009 reports and both reports agreed that students who used the ―I
72
CAN Learn‖ computer system showed statistically significant increases in achievement
in math. JRL Enterprises, Inc. shared ―What Works Clearinghouse has just awarded its
highest rating to the ‗I CAN Learn‘ Algebra and Pre-Algebra programs for their ‗positive
effects‘ in raising student test scores on NCLB-required high-stakes testing‖ (I CAN
Learn, 2007). In addition to WWC examining studies and providing reports to
government officials and stakeholders, Sandy Garrett, state superintendent of public
instruction for the State of Oklahoma, expressed her appreciation for the success of 50
public schools showed resulting from using the ―I CAN Learn‖ computer program in her
state.
Based on the researcher‘s direct experience with the ―I CAN Learn‖ computer
system, the theories discussed in chapter two were utilized in the design of the ―I CAN
Learn‖ program. Using the computer program provides students with individualized
instruction, motivation, student engagement, self-paced learning and classroom
management. The researcher also credits the success of the ―I CAN Learn‖ computer
program found in this study involving eighth grade students from Hickman Mills School
District to two components. One is the nature of the program and its intervention
strategies such as:
Individualized instruction.
Student freedom to maneuver around a given lesson.
Student freedom over quizzes and test taking.
Student freedom to skip a mastered skill.
Elimination of boredom and including rigor with high achieving students.
Minimization and/or elimination of classroom disruptions.
73
Immediate response/feedback and personalized intervention.
The second factor that contributed to the success of the program are the resources JRL
Enterprises, Inc. provides to school districts. JRL Enterprises, Inc. provides essential
services to their customers such as:
Hands-on teacher training.
Continuous software maintenance and updates.
In-school technical support on teacher demand.
Continuous data monitoring system.
Conclusions
Uses of technology in education continue to increase as the 21st Century advances
and improvements in hardware and software applications improve. What was considered
futuristic only a few decades ago is often taken for granted today. Continued growth in
the uses of technology may well change the shape of education even more dramatically in
the next decade and beyond.
Implications for Action.
Continued monitoring and further testing of student achievement of students who
receive ―I CAN Learn‖ computer system instruction in high school and college levels
may provide a long term effect of the program. Differences in student achievement
between students who used ―I CAN Learn‖ and students who did not use the computer
system may provide needed evidence or answer questions about such programs.
Recommendations.
Considering the findings of this study, recommendations for further study are
needed. In the State of Missouri, Kansas City Missouri School District and Grandview
74
School District are similar in demographics and diversity to Hickman Mills School
District. Further research is needed to support such findings with additional schools and
neighboring school districts to Hickman Mills C-1. Additional study is also needed to
determine the effects on additional subgroups such as African-American, Hispanic, low
SES, and English as second language students.
Algebra students in the Missouri are required to take an End Of Course Exam
(EOC) in mathematics. In addition to MAP scores, further study is needed utilizing EOC
algebra scores to examine the effect ―I CAN Learn‖ has on student achievement.
Students in middle schools in Missouri take the TerraNova test as well. Data from the
TerraNova test can also be used in addition to the MAP test scores to determine the effect
―I CAN Learn‖ computer system might have on student achievement.
Recently, JRL Enterprises, Inc. expanded their program to include high school
and college levels. New services include online distance learning as well (I CAN Learn,
2010a). Further study is needed to include higher grade levels and college students to
measure the effect ―I CAN Learn‖ have on student math test scores.
Further, research is needed that tracks student success in high school and college
for those who received computer-aided math instruction in earlier school years. JRL
Enterprises, Inc. and participating school districts could utilize ACT test scores to
measure student achievement.
Several uncontrolled variables may have contributed to the success of the ―I CAN
Learn‖ computer system in improving student achievement in mathematics. These
variables deserve an in-depth investigation. Variables include teacher quality, including
years of experience, advanced degrees, and degrees specifically in mathematics. The
75
availability, delivery, and quality of professional development for teachers should also be
considered. The presence of resources for both teachers and students that support the
teaching and learning process are worth investigation as are student absenteeism, teacher
absenteeism, and student attitudes.
Concluding Remarks
In closing, it is the belief of this researcher that student achievement is the main
goal of any successful education system. School districts must adopt sound program
evaluation processes prior to purchasing new programs and at intervals following
implementation. Educators must realize that adopting untried and untested products can
only result in wasted time and resources. Such actions can only end in ineffective
learning for our children. Educators, government officials, and stakeholders need to put
their differences aside, collaborate, come to consensus, and support innovations that
work. Supporting expensive programs that work is nothing but an investment in our most
valuable asset, our children.
76
References
Actions, R. F. (2007). Senate Includes Education Technology Funding as Critical
Component of U.S. Competitiveness Agenda. PR Newswire. Retrieved from
http://www.prnewswire.com/news-releases/senate-includes-education-
technology-funding-as-critical-component-of-us-competitiveness-agenda-
56128877.html
Ash, J. E. (2005). The effects of computer-assisted instruction on middle school
mathematics achievement (Unpublished doctoral dissertation). Tennessee State
University. Nashville, TN.
Barrow, L., Markman, L., & Rouse, C. E. (2007). Technology’s edge: The educational
benefits of computer-aided instruction (Unpublished doctoral dissertation).
Princeton University, NJ.
Beck, M., Conner, J., Cruse, K., & Fernandez, J. (2009). A study of the instructional
effectiveness of Houghton Mifflin Harcourt's iSucceed math program (Doctoral
dissertation). Educational Research Institute of America.
Bennet, M. (n.d.). Education. Michael Bennet - United States Senator for Colorado.
Retrieved from http://bennet.senate.gov/issues/issue/?id=2447b931-58ed-4695-
9c7c-f3eef5b8e6f3
Bloom, B. (1971). Mastery learning. New York: Holt, Rinehart, & Winston.
Blumenfeld, J. (2009, August 13). Study shows multimedia math program may hold key
to mathematics improvement for struggling students. Houghton Mifflin Harcourt.
Retrieved from http://www.hmhco.com/news/news_release_081309.html
77
Boster, F. J., Meyer, G. S., Roberto, A. J., & Inge, C. C. (2002). A report on the effect of
the unitedstreaming application on educational performance. Technical Report.
Retrieved from http://www.unitedstreaming.com/home/pdf/la_summary.pdf.
Boster, F. J., Meyer, G. S., Roberto, A. J., Lindsey, L., Smith, R., Strom, R., & Inge, C.
C. (2004). A report on the effect of the unitedstreaming application on
educational performance: The 2004 Los Angeles unified School District
mathematics evaluation (Rep.). Retrieved from
http://streaming.discoveryeducation.com/home/pdf/LA_Summary.pdf
Christenson, Sinclair, Lahr, and Godber, 2001
CTB/McGraw-Hill. (2007, November 28). Missouri Assessment Program Technical
Report 2007 (Rep.). Retrieved
dese.mo.gov/divimprove/.../Final%20MAP%20Tech%20Report.pdf
Chalk and talk. (n.d.). In Encarta® World English Dictionary. Bloomsbury Publishing
Plc. Retrieved from http://encarta.msn.com/dictionary_561502519/
chalk_and_talk.html
Chang, K., Chen, I., & Sung, Y. (2002). The effect of concept mapping to enhance text
comprehension and summarization. The Journal of Experimental Education
71(1), 5-23.
Cohen, V. L. (1997). Learning styles in a technology-rich environment. Journal of
Research on Computing in Education, 29(4), 338-350.
Costa A. L., & Garmston R. J. (2002). Cognitive coaching: A Foundation for
Renaissance Schools. (2nd
Edition). Norwood, MA: Christopher-Gordon.
78
Daniel, J. (1999). Computer aided instruction on the world wide web: the third
generation. Journal of EconomicEducation, 30(2), 163-174.
Delaney, P., & Smith, S. (2000, December 14). Study finds Asian countries are best in
math, science. Boston College. Retrieved from http://www.bc.edu/bc_org/
rvp/pubaf/chronicle/v9/d14/timss.html
DeVault, V. (1981). Computers. In E. Fennema (Ed.), Mathematics education research:
Implications for the 80's (pp. 131-149). Alexandria: Association for Supervision
and Curriculum Development.
Dobbs, M. (2004, December 7). In a global test of math skills, U.S. students behind the
curve. Washington Post. Retrieved from http://www.washingtonpost.com/wp-
dyn/articles/A41278-2004Dec6.html
Education Trust. (2010, November 18). A decade after passage of No Child Left
Behind, America's low-income students still disproportionately taught by out-
of-field, inexperienced teachers. Retrieved from http://www.edtrust.org.
Education Week (2011, February 11). Ed. tech rides wave of stimulus funding.
Retrieved from http://www.edweek.org/ew/articles/2011/02/09/20stim-
tech.h30.html.
Eisner, E. W., & Vallance, E. (1974). Conflicting conceptions of curriculum,. Berkeley,
CA: McCutchan Pub.
E-Rate (2011). Office of Innovation and Improvement: E-Rate Eligibility for Schools
and Libraries. Retrieved from
http://www2.ed.gov/about/offices/list/oii/nonpublic/erate.html.
79
Fengfeng, K. (2008). A case study of computer gaming for math: Engaged learning from
gameplay? (Doctoral dissertation, University of New Mexico) (pp. 1609-1620).
Computers & Education. doi: doi:10.1016/j.physletb.2003.10.071
Governors award ESRI, Microsoft public-private partnership honors. (2009). Government
Technology: State & Local Government News Articles. Retrieved from
http://www.govtech.com/e-government/Governors-Award-ESRI-Microsoft-
Public-Private-Partnership.html
Hein, George E. (1991). Constructivist Learning Theory. Paper presented to the
International Committee of Museum Educators. Jerusalem Israel. Retrieved from
http://www.exploratorium.edu/IFI/resources/constructivistlearning.html
Henry, J. (2007). Discovery education unitedstreaming and science connection honored
with Bessie awards. Discovery Education. Retrieved from
http://www.discoveryeducation.com/aboutus/newsArticle.cfm?news_id=480
Hinton, John R. (1978). Individualized instruction: what the research tells us. Paper
presented at annual meeting of Association of Educational Communications and
Technology. Kansas City, Missouri. Retrieved from
http://www.eric.ed.gov/ERICWebPortal/search/detailmini.jsp
Hunter, M. C. (1982). Mastery teaching. Thousand Oaks, CA: Corwin Press.
I CAN Learn algebra and pre-algebra math programs earn top honors from U.S.
department of education's What Works Clearinghouse. (2007, May 17). Redorbit.
Retrieved from http://www.redorbit.com/news/education/938885/
i_can_learnr_algebra_and_prealgebra_math_programs_earn_top/
80
I CAN Learn instructional improvement system. (2010a). About us. Retrieved from
http://www.icanlearn.com/about-us.html
I CAN Learn instructional improvement system. (2010b, January 26). I Can Learn
Education Systems. Retrieved from http://www.icanlearn.com/blog/2010/01/
I CAN Learn instructional improvement system. (2010c, April 16). Data systems key to
victory in national race to the top grant competition. Add I CAN Learn Program
to Your Summer School Curriculum. Retrieved from http://www.icanlearn.com/
I CAN Learn instructional improvement system. (2010d, July 9). National trade
magazine: I CAN Learn IIS remains top middle school math program. I CAN
Learn Earns National Recognition: Share Your Success Story. Retrieved from
http://www.icanlearn.com/
International comparison of math, reading, and science skills among 15-year-olds.
(2007). Infoplease. Retrieved from http://www.infoplease.com/ipa
/A0923110.html
Jenkins, J. M., & Keefe, J. W. (2001). Strategies for personalizing instruction: A
typology for improving teaching and learning. NASSP Bulletin, 85(629), 72-82.
doi: 10.1177/019263650108562908
Kerrey, B. & Isakson, J. (2003). Streaming technology improves student achievement.
The Journal: Technological Horizons in Education. Retrieved from
http://thejournal.com/articles/2003/02/01/streaming-technology-improves-
student-achievement.aspx
Kerstyn, C. (2001). Evaluation of the I CAN LEARN Mathematics Classroom: First
81
year of implementation. Unpublished manuscript. Retrieved from
http://www.whatworks.ed.gov/
Kerstyn, C. (2002). Evaluation of the I CAN LEARN Mathematics classroom: Second
year of implementation (2001–2002 school year). (Available from the Division of
Instruction, Hillsborough County Public Schools, 901 East Kennedy Blvd.,
Tampa, FL 33602).
Kilpatrick, J. (2009, February). TIMSS 2007 Mathematics: Where are we? MAA Focus.
Retrieved from www.maa.org/pubs/febmar09pg4-7.pdf
Kingsley, K., & Boone, R. (2008). Effects of multimedia software on achievement of
middle school students in an American history class. Journal of Research on
Technology in Education, 41(2), 203-221
Kirby, P. C. (2004a). Comparison of I CAN Learn® and traditionally-taught 8th grade
general math student performance on the California Standards Test, Spring 2004.
New Orleans, LA: Ed-Cet, Inc.
Kirby, P. C. (2004b). Comparison of I CAN Learn® and traditionally-taught 8th grade
student performance on the Georgia Criterion-Referenced Competency Test. New
Orleans, LA: Ed-Cet, Inc.
Kulik, C., & Kulik, J. (1991). Effectiveness of computer-based instruction: An updated
analysis. Computers in Human Behavior, 7, 75-95.
Kulik, J. (1994). Meta-analytic studies of findings on computer-based instruction. In E.
Baker & H. O'Niel, Jr. (Eds.), Technology assessment in education and training
(pp. 1-27). Hillsdale, NJ: Lawrence Erlbaum.
82
Kulik, J.A., Bangert, R.L., & Williams, G. W. (1983). Effects of computer-based
teaching on secondary school students. Journal of Educational Psychology 75(1),
(pp.19-26).
Langer, J. A. (2001). Beating the odds: Teaching middle and high school students to read
and write well. American Educational Research Journal, 38(4), 837-880. doi:
10.3102/00028312038004837
Lowther, D. L., Ross, S. M., & Morrison, G. M. (2003). When each one has one: The
influences on teaching strategies and student achievement of using laptops in the
classroom. Educational Technology Research and Development, 51(3), 23-44.
doi: 10.1007/BF02504551
Mann, D., Shakeshaft, C., Becker, J., & Kottkamp, R. (1999). West Virginia's basic
skills/computer education program: An analysis of student achievement. Santa
Monica, CA: Milken Family Foundation.
Marzano, R. J. (1998). A theory-based meta-analysis of research on instruction. Aurora,
CO: Mid-continent Regional Educational Laboratory.
Mathematica Policy Research (2009). Educational Technology: Does It Improve
Academic Achievement? Mathematica Policy Research Home. Retrieved from
http://www.mathematica-mpr.com/education/edtech.asp
MCDC demographic profile 1, 2000 Census. (n.d.). Missouri Census Data Center.
Retrieved from http://mcdc2.missouri.edu/
Means, B., Blando, J., Olson, K., Middleton, T., Morocco, C., Remz, A., & Zorfass, J.
(1993). Using technology to support education reform. Washington, D.C: U.S.
83
Dept. of Education, Office of Educational Research and Improvement, Office of
Research.
Mid-America Regional Council - Regional Planning for Greater Kansas City. (2011).
Retrieved from http://www.marc.org/gis/2010census.htm
Middleton, B., & Murray, R. (1999). The impact of instructional technology on student
academic achievement in reading and mathematics. International Journal of
Instructional Media, 26(1), 109-116.
Missouri Department of Elementary and Secondary Education. (2005). Q&A about no
child left behind. Retrieved from http://dese.mo.gov/divimprove/nclb/QandA.html
Missouri Department of Elementary and Secondary Education. (2007, November 28).
Missouri Assessment Program Technical Report 2007 (Rep.). Retrieved
dese.mo.gov/divimprove/.../Final%20MAP%20Tech%20Report.pdf
Missouri Department of Elementary and Secondary Education. (2008). School Data and
Statistics. Retrieved from http://dese.mo.gov/schooldata/school_data.html
Missouri Department of Elementary and Secondary Education. (2010a). Hickman Mills
C-1 2007-08 school accountability report. Retrieved from
http://dese.mo.gov/planning/profile/arsd048072.html
Missouri Department of Elementary and Secondary Education. (2010b). No child left
behind homepage. Retrieved from http://dese.mo.gov/divimprove/nclb/
Missouri Department of Elementary and Secondary Education. (2010c). Missouri
Assessment Program. Retrieved from http://dese.mo.gov/divimprove/assess/
84
Molnar, A. (1997). Computers in education: A brief history. The Journal. Retrieved from
http://thejournal.com/Articles/1997/06/01/Computers-in-Education-A-Brief-
History.aspx?Page=1
Murdock, E. (2007). History, the History of Computers, and the History of Computers in
Education. California State University, Long Beach. Retrieved from
http://www.csulb.edu/~murdock/#ITLINKS
National Center for Education Statistics [NCES]. (2009). Trends in International
Mathematics and Science Study (TIMSS) - Overview. National Center for
Education Statistics (NCES) Home Page, a Part of the U.S. Department of
Education. Retrieved from http://nces.ed.gov/timss/
National Council of Teachers of Mathematics (2009). Mission, vision and priorities.
Retrieved from http://www.nctm.org/about/content.aspx?id=172
National Dissemination Center for Children with Disabilities [NICHCY]. (2010). Special
education. National Dissemination Center for Children with Disabilities.
Retrieved from http://nichcy.org/schoolage/iep/iepcontents/specialeducation
Northwest Educational Technology Consortium. (n.d.). Northwest Educational
Technology Consortium What Works Clearinghouse. Retrieved from
http://www.netc.org/planning/research/whatworks.php
Oklahoma schools see big gains on OCCT scores using the I CAN Learn program.
(2009). I Can Learn Education Systems - Computer Based Math with Proven
Results. Retrieved from http://www.icanlearn.com/results.html
Ormrod, J. E. (1999). Human learning (3rd ed.). Upper Saddle River, NJ: Prentice-Hall.
85
Pytel, B. (2007). Laptops: Jury is out: High schools are pulling 1-on-1 laptops after
disappointing results. Suite101.com. Retrieved from http://www.suite101.com
/content/laptops-jury-is-out-a21072
Reichstetter, R., Regan, R., Lindblad, M., Overbay, A., & Dulaney, C. (2002).
Technology use and its relevance to academic achievement (E&R Report
No.02.46). Retrieved from
www.wcpss.net/evaluation.../0246_tech_use_achievement_lit_review.pdf
Research finds laptop learning yields better students and better teachers through anytime,
anywhere access. (2000). Microsoft News Center. Retrieved from
http://www.microsoft.com/presspass/press/2000/sept00/LaptopPR.mspx
S. 968--111th Congress: Secondary School Innovation Fund Act. (2009). In GovTrack.us
(database of federal legislation). Retrieved from
http://www.govtrack.us/congress/bill.xpd?bill=s111-968
Salkind, N. J. (2004). Statistics for people who hate statistics (2nd ed.). Thousand Oaks,
California: Sage Publications, Inc.
Schoenfeld, A. H. (2006). What doesn‘t work: The challenge and failure of the What
Works Clearinghouse to conduct meaningful reviews of studies of mathematics
curricula. Educational Researcher, 35, 13-21.
Short, D. (2002). Computer-based mathematics instruction: Automated remedial
branching (Unpublished doctoral dissertation). California State University.
Short, R. J., Carr, D. L., Tucker, B. J., Goff, S. L., Levinson, A., & Speichinger, N.
(1999). Instructional practices in the state of Missouri and teacher attitude
toward the statewide assessment (Rep.). Columbia, MO: University of Missouri.
86
Sivin-Kachala, J. (1998). Report on the effectiveness of technology in schools (Rep.).
Washington, DC: Software Publisher's Association.
Skinner, B. F. (1960). Teaching Machines and Programmed Learning. Washington, DC:
Department of Audiovisual Education, National Education Association, 1960.
Soeder, K. L. (2001). The effect of computer-aided instruction on mathematics
achievement (Unpublished doctoral dissertation). Immaculata University,
Immaculata, PA.
South Kansas City Chamber of Commerce (2007). From Chamber of Commerce of
consolidated School District # 1 to south Kansas City Chamber of Commerce
1931-2007. Retrieved from http://www.southkcchamber.com/Default.aspx?
pageId=652060
Stratham, D. S., & Torell, C. R. (1996). Computers in the classroom: The impact of
technology on student learning (Doctoral dissertation, Army Research Institute).
Retrieved from http://www.temple.edu/lss/htmlpublications/spotlights
/200/spot206.htm
Taepke, P. (2007). Effect of computer-aided instruction on grades in middle school
algebra, 230 (Doctoral dissertation). University of San Diego. Retrieved from
http://gradworks.umi.com/32/66/3266729.html
TechoPedia (2011). COBOL: A business language. Retrieved from
http://www.techopedia.com.
The 1900s: Education: Overview. (2001). Encyclopedia.com. Retrieved from
http://www.encyclopedia.com/doc/1G2-3468300064.html
87
Third International Mathematics and Science Study. (1995). Retrieved from
http://timss.bc.edu/timss1995i/TIMSSPublications.html
U.S. Census Bureau (2010). Jackson County quickfacts. State and County Quickfacts.
Retrieved from http://quickfacts.census.gov/qfd/states/29/29095.html
U.S. Department of Education (2004). What is the purpose of the no child left behind act?
Retrieved from http://www2.ed.gov/teachers/how/tools/initiative/updates
/040513.html
Warschauer, M. (2006). Laptops and literacy: Learning in the wireless classroom. New
York: Teachers College Press.
Wenglinsky, H. (1998). Does it compute? The relationship between educational
technology and student achievement in mathematics. (Rep.). Princeton, NJ:
Educational Testing Services.
What Works Clearinghouse [WWC]. (2004). Brief study report: Reviewed study.
Retrieved from www.natedeb.com/literaturereviewimages/Brief2001review.pdf
What Works Clearinghouse [WWC]. (2007, March 26). I CAN Learn pre-algebra and
algebra. Retrieved from http://www.whatworks.ed.gov/PDF/Intervention/WWC
_I_Can_Learn_032607.html
What Works Clearinghouse [WWC]. (2009, March). I CAN Learn pre-algebra and
algebra. Retrieved from
http://ies.ed.gov/ncee/wwc/pdf/wwc_icanlearn_031009.pdf
Wilson, B. G., & Welsh, J. R. (1986). Small knowledge-based systems in education and
training: Something new under the sun. Educational Technology, 26(11), 7-13.

88
Appendix A:
Electronic communication with Kansas City Missouri School District concerning
―I CAN Learn‖ computer system
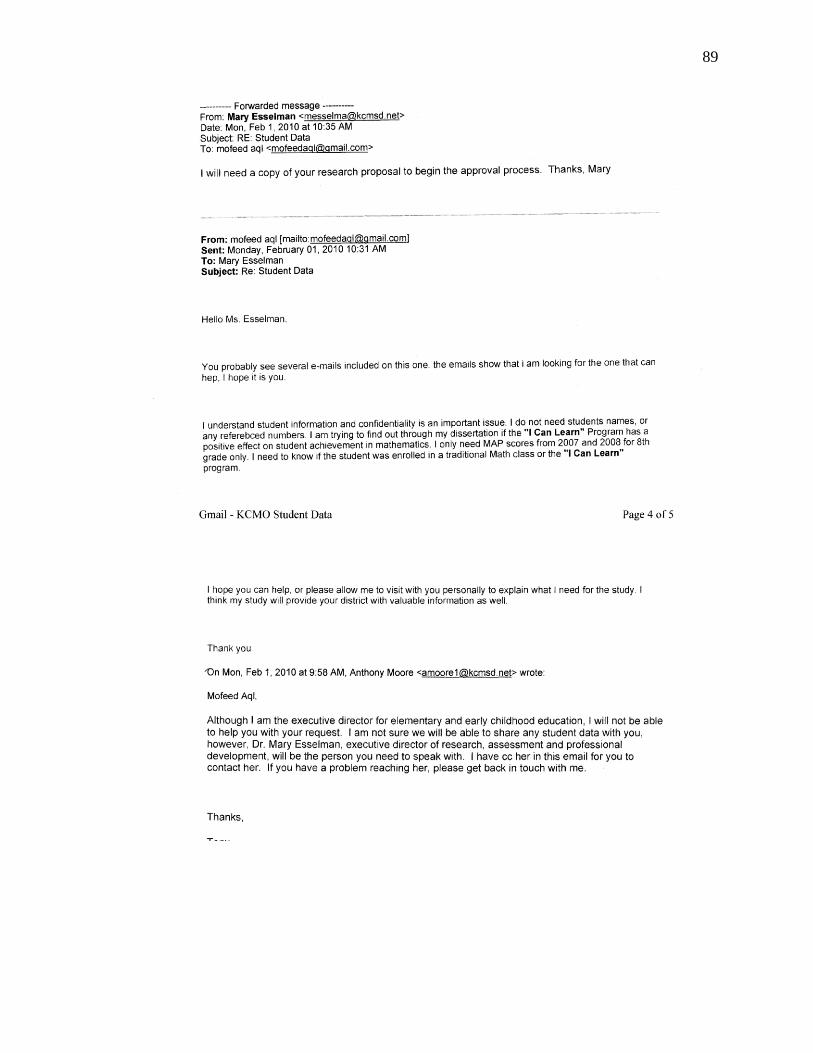
89

90
Appendix B:
Electronic communication with Grandview School District concerning
―I CAN Learn‖ computer system
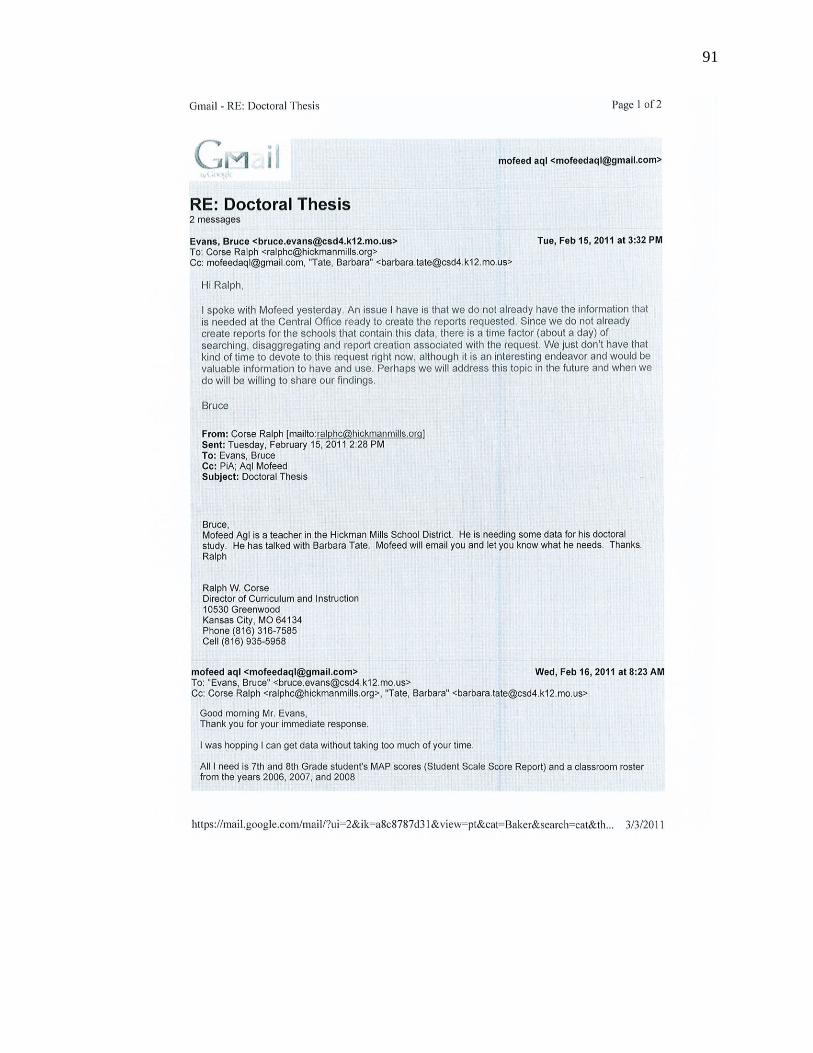
91

92
Appendix C:
Hickman Mills School District approval of the study
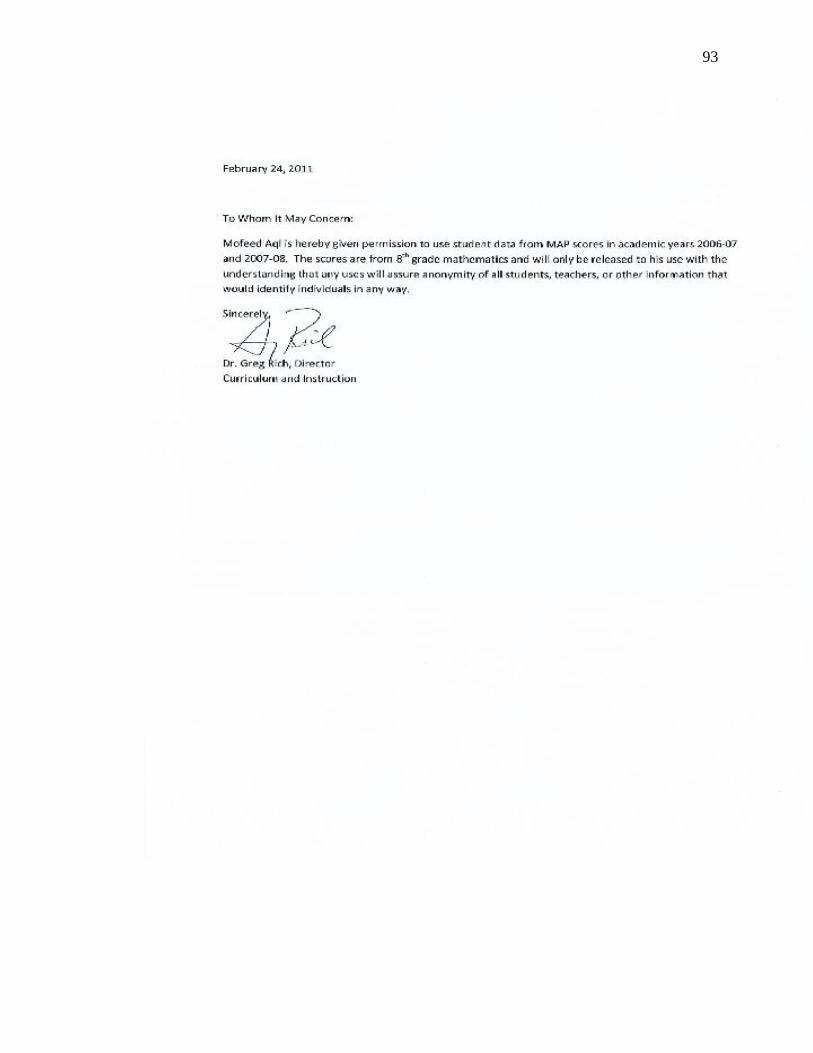
93

94
Appendix D:
Letter From the State of Oklahoma Superintendent of Public Instruction Appreciating the
―I CAN Learn‖ Computer System
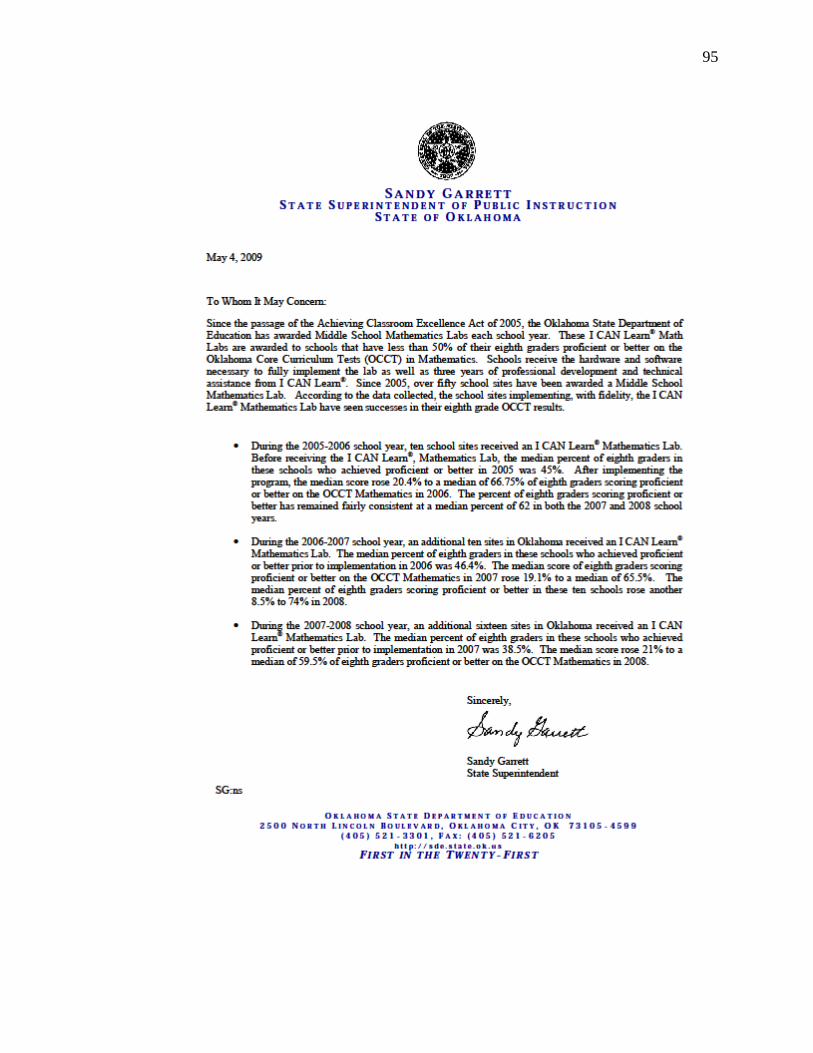
95

96
Appendix E:
JRL Enterprises, Inc. Graph of Student‘s Achievement of the Oklahoma Public Schools
after Incorporating the ―I CAN Learn‖ Computer System in Their Schools
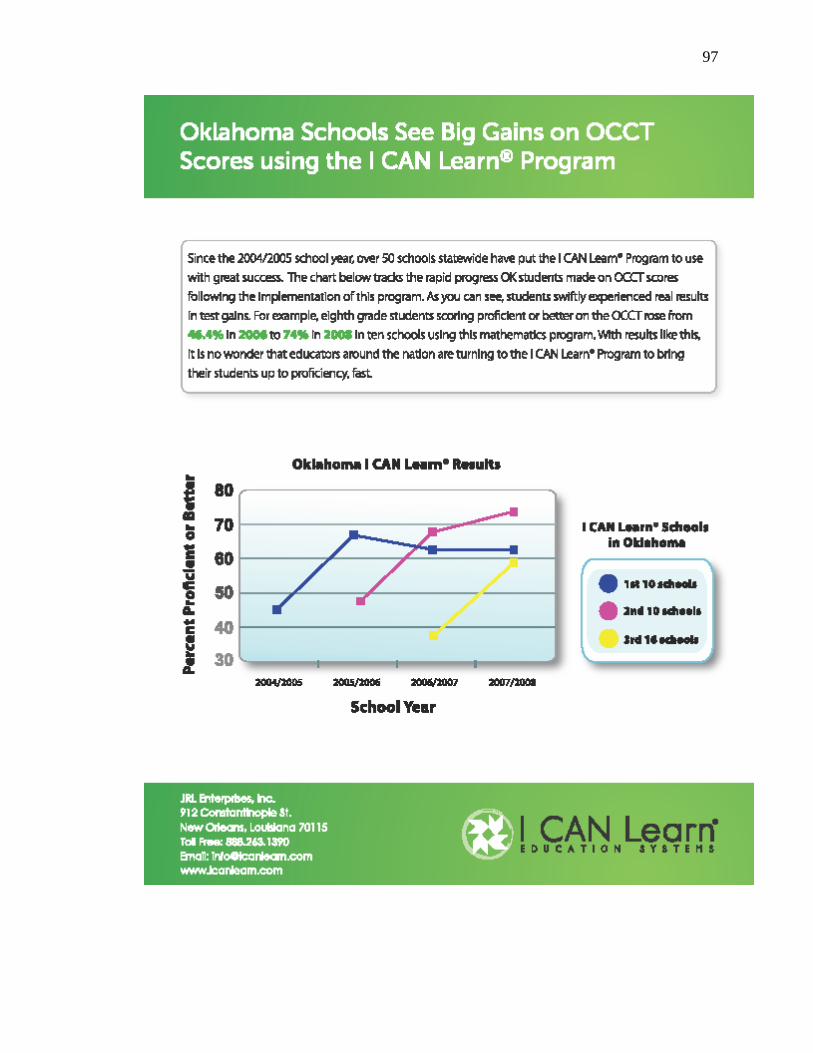
97

98
Appendix F:
Institutional Review Board (IRB) Request
99
100
101

102
Appendix G:
Baker University Approval of the Study
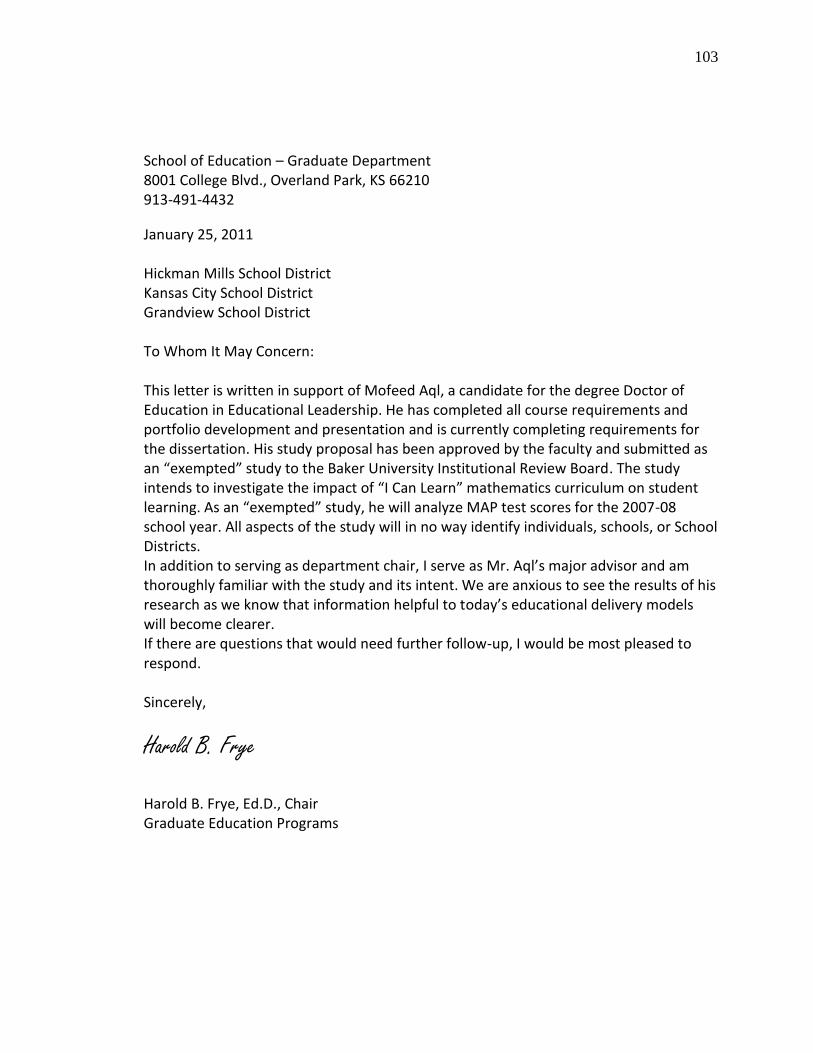
103
School of Education – Graduate Department 8001 College Blvd., Overland Park, KS 66210 913-491-4432
January 25, 2011 Hickman Mills School District Kansas City School District Grandview School District To Whom It May Concern: This letter is written in support of Mofeed Aql, a candidate for the degree Doctor of Education in Educational Leadership. He has completed all course requirements and portfolio development and presentation and is currently completing requirements for the dissertation. His study proposal has been approved by the faculty and submitted as an “exempted” study to the Baker University Institutional Review Board. The study intends to investigate the impact of “I Can Learn” mathematics curriculum on student learning. As an “exempted” study, he will analyze MAP test scores for the 2007-08 school year. All aspects of the study will in no way identify individuals, schools, or School Districts. In addition to serving as department chair, I serve as Mr. Aql’s major advisor and am thoroughly familiar with the study and its intent. We are anxious to see the results of his research as we know that information helpful to today’s educational delivery models will become clearer. If there are questions that would need further follow-up, I would be most pleased to respond. Sincerely,
Harold B. Frye Harold B. Frye, Ed.D., Chair Graduate Education Programs
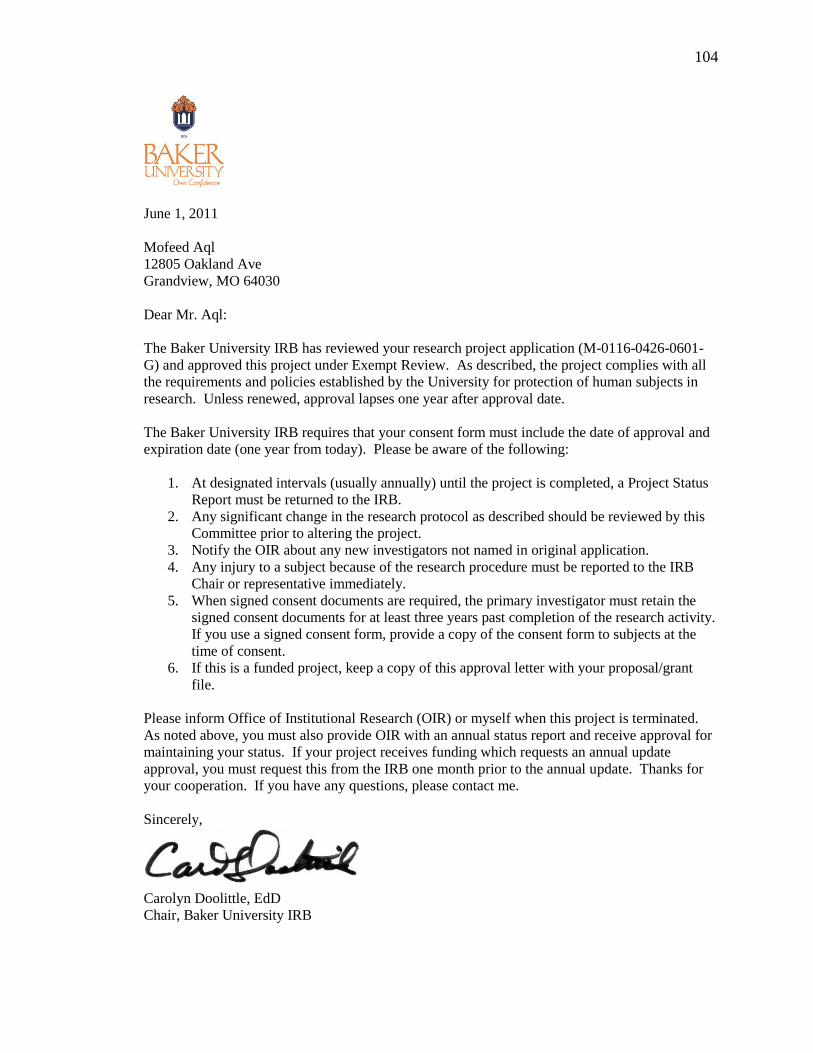
104
June 1, 2011
Mofeed Aql
12805 Oakland Ave
Grandview, MO 64030
Dear Mr. Aql:
The Baker University IRB has reviewed your research project application (M-0116-0426-0601-
G) and approved this project under Exempt Review. As described, the project complies with all
the requirements and policies established by the University for protection of human subjects in
research. Unless renewed, approval lapses one year after approval date.
The Baker University IRB requires that your consent form must include the date of approval and
expiration date (one year from today). Please be aware of the following:
1. At designated intervals (usually annually) until the project is completed, a Project Status
Report must be returned to the IRB.
2. Any significant change in the research protocol as described should be reviewed by this
Committee prior to altering the project.
3. Notify the OIR about any new investigators not named in original application.
4. Any injury to a subject because of the research procedure must be reported to the IRB
Chair or representative immediately.
5. When signed consent documents are required, the primary investigator must retain the
signed consent documents for at least three years past completion of the research activity.
If you use a signed consent form, provide a copy of the consent form to subjects at the
time of consent.
6. If this is a funded project, keep a copy of this approval letter with your proposal/grant
file.
Please inform Office of Institutional Research (OIR) or myself when this project is terminated.
As noted above, you must also provide OIR with an annual status report and receive approval for
maintaining your status. If your project receives funding which requests an annual update
approval, you must request this from the IRB one month prior to the annual update. Thanks for
your cooperation. If you have any questions, please contact me.
Sincerely,
Carolyn Doolittle, EdD Chair, Baker University IRB

105
Appendix H:
Examples of MAP Test Released Items
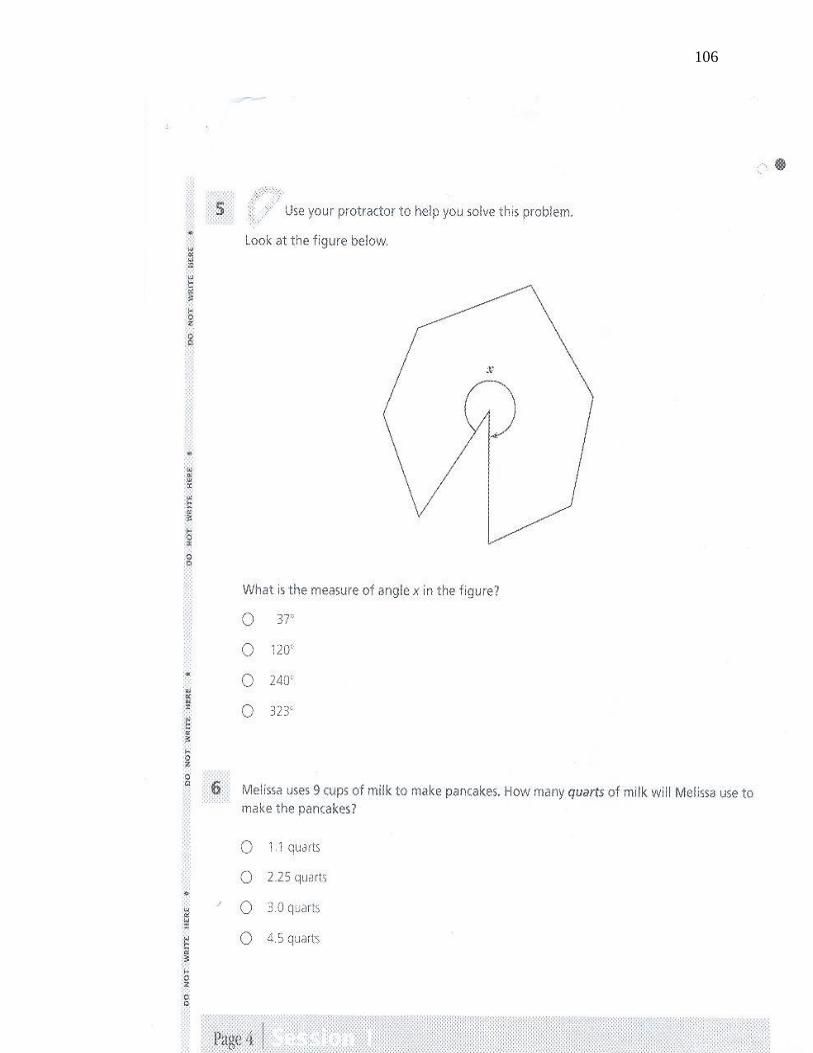
106

107
Appendix I:
2000-2010 Population Change by Census Tract

109
Appendix J:
Cognitive Coaching Chart:
Theories of Education Belief System
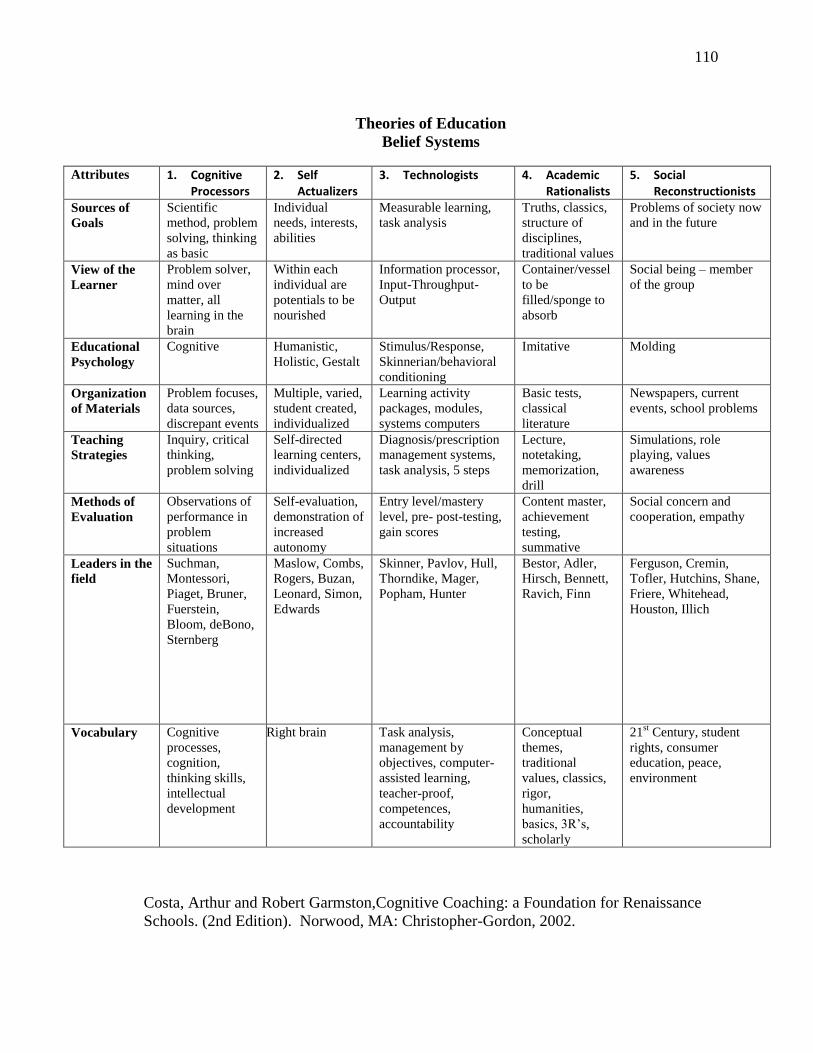
110
Theories of Education
Belief Systems
Attributes 1. Cognitive Processors
2. Self Actualizers
3. Technologists 4. Academic Rationalists
5. Social Reconstructionists
Sources of
Goals
Scientific
method, problem
solving, thinking
as basic
Individual
needs, interests,
abilities
Measurable learning,
task analysis
Truths, classics,
structure of
disciplines,
traditional values
Problems of society now
and in the future
View of the
Learner
Problem solver,
mind over
matter, all
learning in the
brain
Within each
individual are
potentials to be
nourished
Information processor,
Input-Throughput-
Output
Container/vessel
to be
filled/sponge to
absorb
Social being – member
of the group
Educational
Psychology
Cognitive Humanistic,
Holistic, Gestalt
Stimulus/Response,
Skinnerian/behavioral
conditioning
Imitative Molding
Organization
of Materials
Problem focuses,
data sources,
discrepant events
Multiple, varied,
student created,
individualized
Learning activity
packages, modules,
systems computers
Basic tests,
classical
literature
Newspapers, current
events, school problems
Teaching
Strategies
Inquiry, critical
thinking,
problem solving
Self-directed
learning centers,
individualized
Diagnosis/prescription
management systems,
task analysis, 5 steps
Lecture,
notetaking,
memorization,
drill
Simulations, role
playing, values
awareness
Methods of
Evaluation
Observations of
performance in
problem
situations
Self-evaluation,
demonstration of
increased
autonomy
Entry level/mastery
level, pre- post-testing,
gain scores
Content master,
achievement
testing,
summative
Social concern and
cooperation, empathy
Leaders in the
field
Suchman,
Montessori,
Piaget, Bruner,
Fuerstein,
Bloom, deBono,
Sternberg
Maslow, Combs,
Rogers, Buzan,
Leonard, Simon,
Edwards
Skinner, Pavlov, Hull,
Thorndike, Mager,
Popham, Hunter
Bestor, Adler,
Hirsch, Bennett,
Ravich, Finn
Ferguson, Cremin,
Tofler, Hutchins, Shane,
Friere, Whitehead,
Houston, Illich
Vocabulary Cognitive
processes,
cognition,
thinking skills,
intellectual
development
Peak experience, nurturance, whole child, affective, individual, riRight brain Task analysis,
management by
objectives, computer-
assisted learning,
teacher-proof,
competences,
accountability
Conceptual
themes,
traditional
values, classics,
rigor,
humanities,
basics, 3R‘s,
scholarly
21st Century, student
rights, consumer
education, peace,
environment
Costa, Arthur and Robert Garmston,Cognitive Coaching: a Foundation for Renaissance
Schools. (2nd Edition). Norwood, MA: Christopher-Gordon, 2002.

111
Appendix K:
Cognitive Coaching:
Belief Statements
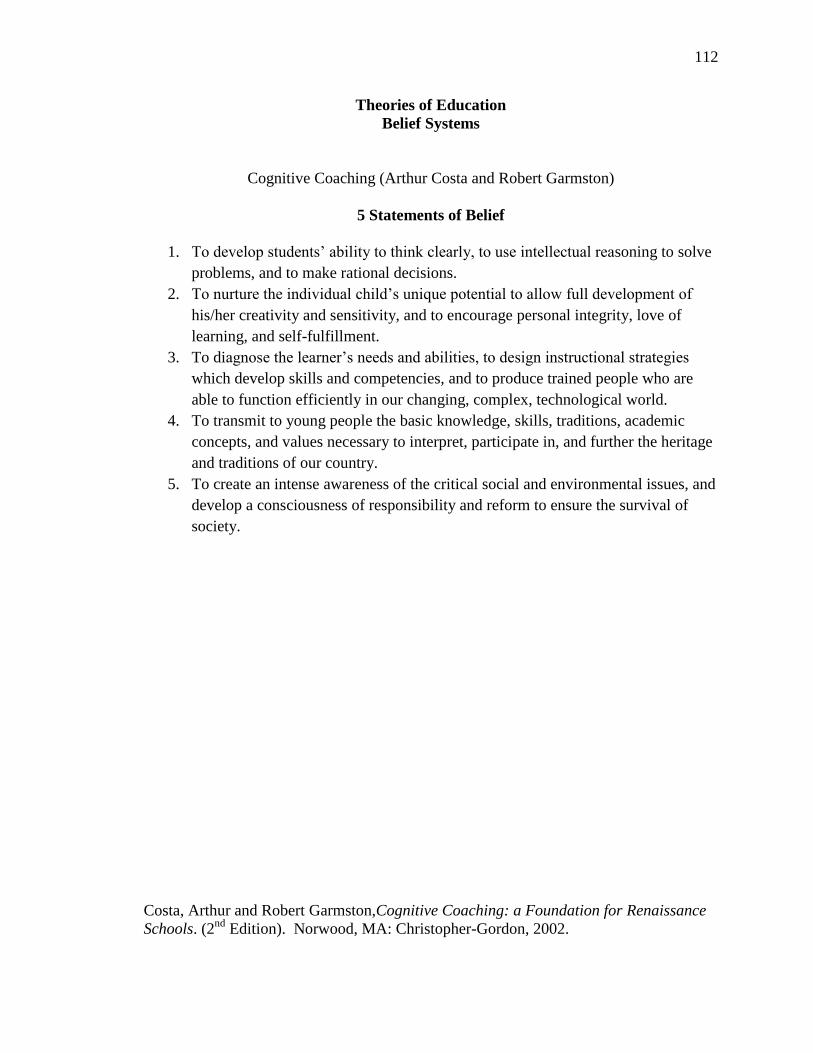
112
Theories of Education
Belief Systems
Cognitive Coaching (Arthur Costa and Robert Garmston)
5 Statements of Belief
1. To develop students‘ ability to think clearly, to use intellectual reasoning to solve
problems, and to make rational decisions.
2. To nurture the individual child‘s unique potential to allow full development of
his/her creativity and sensitivity, and to encourage personal integrity, love of
learning, and self-fulfillment.
3. To diagnose the learner‘s needs and abilities, to design instructional strategies
which develop skills and competencies, and to produce trained people who are
able to function efficiently in our changing, complex, technological world.
4. To transmit to young people the basic knowledge, skills, traditions, academic
concepts, and values necessary to interpret, participate in, and further the heritage
and traditions of our country.
5. To create an intense awareness of the critical social and environmental issues, and
develop a consciousness of responsibility and reform to ensure the survival of
society.
Costa, Arthur and Robert Garmston,Cognitive Coaching: a Foundation for Renaissance
Schools. (2nd
Edition). Norwood, MA: Christopher-Gordon, 2002.