Embed Size (px)
Citation preview
Effects of COVID-19 on Early Childhood Education Centers
Policy Brief March 2021
EPI Policy Brief | March 2021
Effects of COVID-19 on Early Childhood Education Centers:Descriptive Evidence from Boston’s Universal Prekindergarten InitiativeThis brief is part of an ongoing study that is tracking implementation of the Boston Universal Prekindergarten (UPK) expansion, including effects of the COVID-19 crisis on UPK community-based centers. We use administrative and interview data to provide a descriptive snapshot of the impacts of the COVID-19 pandemic on UPK centers so far, focusing on three areas: teacher and administrator turnover; child enrollment; and changes in practices that centers are implementing to increase safety. Unlike many programs across the country, UPK centers have continued to receive full funding for UPK slots and for child-care subsidy slots throughout the crisis. As such, the effects we describe here likely represent a “best case” scenario for centers operating in urban areas serving mostly children from families with low incomes.
Key Findings
UPK teachers’ and administrators’ turnover rates in the Boston UPK community-based organizations (CBOs) during the crisis were 18% and 10%, respectively. These rates were lower than those observed in many other ECE systems before the pandemic. However, approximately half of Boston UPK centers in CBOs lost a teacher during the pandemic, which makes quality improvement efforts in Boston UPK more difficult.
In fall 2020, the number of UPK-funded children enrolled in CBOs implementing the UPK model dropped by 30 percentage points compared to pre-pandemic enrollment levels. Enrollment partially recovered by winter 2021 but was still down by 16 percentage points compared to pre-pandemic levels. Pandemic-related drops in enrollment in Boston UPK programs located in public schools were substantially lower (about 4-8 percentage points in fall 2020).
To reopen in Summer 2020, Boston UPK CBOs employed a range of strategies that increased their direct costs and that imply very different social and instructional environments for children attending in person (e.g., teachers spending considerable time cleaning and children spending more time in individual activities).
Paola Guerrero Rosada University of Michigan
Christina Weiland University of Michigan
Anne Taylor Boston Public Schools
Louisa Penfold Harvard Graduate School of Education
Catherine SnowHarvard Graduate School of Education
Jason Sachs Boston Public Schools
Meghan McCormick MDRC
Authors
Note: The research reported here was conducted as a part of a study funded by the Heising-Simons Foundation and the Foundation for Child Development. The authors’ opinions do not represent views of the Heising-Simons Foundation or the Foundation for Child Development.
Thanks to the Boston Public Schools, TeeAra Dias, the BPS Department of Early Childhood coaches and staff, the BPS Department of Research, the Harvard Graduate School of Education research team (Mariam Dahbi and Leigh Evans), and the University of Michigan research team (Rachel Kushner, Christina Daniel, and Haidan Liu).
Page 1
1
2
3
IntroductionIntroductionEarly childhood education (ECE) centers are facing unprecedented challenges due to the COVID-19 crisis. The future remains murky for many U.S. early childhood centers because of enrollment decreases due to families’ health- and finance-related concerns and to reduced ratio requirements,1 expensive new sanitation procedures, challenges in training children to follow health practices recommended to prevent the spread of the virus, and relatively limited government help (until the passage of the American Rescue Plan in March 2021) to meet these new challenges. 2
This brief is part of an ongoing study that is tracking implementation of the Boston Universal Prekindergarten (UPK) expansion, including the effects of the crisis on UPK community-based centers. The Boston Public Schools (BPS) has offered prekindergarten in public elementary schools since 2005 and is currently partnering with community-based organizations (CBOs) to expand access to the program and make it universally available to all four-year-old children in Boston. The broader study examining UPK expansion draws on rich data sources such as surveys, administrative data, qualitative interviews, coaching logs, classroom observations, and observations of remote coaching sessions.
Here, we use administrative data and director interview data to provide a descriptive snapshot of the impacts of the COVID-19 pandemic on Boston UPK centers so far. We focus on three areas affected by the pandemic: teacher and administrator turnover;3 child enrollment;4 and operational adaptations5 UPK centers have undertaken to increase children’s and teachers’ safety. Almost all UPK centers closed in early March 2020 following state orders, except for two that were authorized to operate as emergency centers. To date, all UPK centers have reopened6 and have adapted their operations to serve children and their families amid a public health crisis that has widely impacted the
availability of ECE services. Notably, prekindergarten classrooms located in the Boston Public Schools remained primarily remote until March 1, 2021.7
Understanding the effects of the COVID-19 crisis on the already fragile but essential ECE sector is crucial. Such evidence, combined with that from other ECE systems,8 can help to determine how to best support early childhood centers, administrators, and teachers during and after the crisis. Importantly, Boston UPK centers have received full funding for UPK slots and child-care subsidy slots throughout the crisis. As such, the effects we describe here likely represent a “best case” scenario for community-based ECE centers operating in urban areas serving mostly children from families with low incomes.
Page 2
In April 2019, the Mayor of Boston announced that the city would pursue full universal preschool for all four-year-olds in the city, with new seats added primarily in CBOs partnering with the Department of Early Childhood (DEC). These new seats expanded prekindergarten offerings beyond those the district offered in the public schools, available to families since 2005.9 We describe these CBO expansion sites as UPK centers throughout this brief. Participating UPK centers receive about $11,000 per funded UPK seat. All children who live in Boston and are four years old by September 1st of the school year (e.g., 9/1/2020) are eligible for a UPK-funded seat. Each year, additional UPK seats and centers will be added to meet the demand for high-quality prekindergarten for all Boston families who would like a seat for their four-year-old child.
After an application-based selection process, in the fall 2019, Boston awarded funding for 429 new seats in 29 classrooms located in 24 centers across 13 CBOs. Six classrooms in four centers (in four CBOs) received funding for their quality improvement process but with no funded seats. In fall 2020, 3 additional classrooms were funded for quality improvement without funded seats, and 142 new seats were added in 8 centers, for a total of 571 UPK seats in 29 centers for the 2020-2021 school year.10
Boston UPK is a comprehensive intervention that aims to increase access to high-quality early education in Boston via a set of coordinated supports. UPK funding provides lead teachers, who are required to have a BA degree, with a substantial pay boost that places them at the starting point of the BPS teacher pay scale
(~$57K/year). UPK teachers also receive training on the Focus on PreK curriculum (a combination of a district-adapted version of Opening the World of Learning, Building Blocks, and BPS-specific components),11 as well as ongoing training and regular coaching. Administrators in these centers also receive ongoing professional development and coaching on curriculum, financial management, comprehensive services, and family engagement, technology, and use of data to inform instruction.
With the outbreak of the COVID-19 pandemic, BPS’s Boston UPK team adjusted operations and strategies in response to the crisis, shifting the support for centers to match new priorities. For example, BPS’s Boston UPK team redesigned coaching and professional development to help centers navigate public health guidelines and develop reopening plans. They adapted curriculum training to meet the needs of centers offering remote instruction. Financial accountability processes were reorganized to allow centers a flexible use of resources in response to a sharp decrease in tuition paid by non-UPK families in the centers. BPS
Page 3
Context: Boston UPK Expansion in CBOs
UPK COVID-19 Adjustments and Supports
also guaranteed UPK centers the same per-seat funding regardless of whether centers were open or not, or once reopened, whether children attended remotely or in-person. For UPK centers without seats, BPS provided flexibility to adjust their budgets as needed for their allotted quality improvement funds. To provide financial relief for ECE providers across the state, the Massachusetts Department of Early Education and Care (EEC) continued to pay child-care providers subsidies based on their pre-COVID-19 enrollment. Notably, Massachusetts was one of about 19 states to fund programs based on enrollment and not attendance early on in the crisis.12
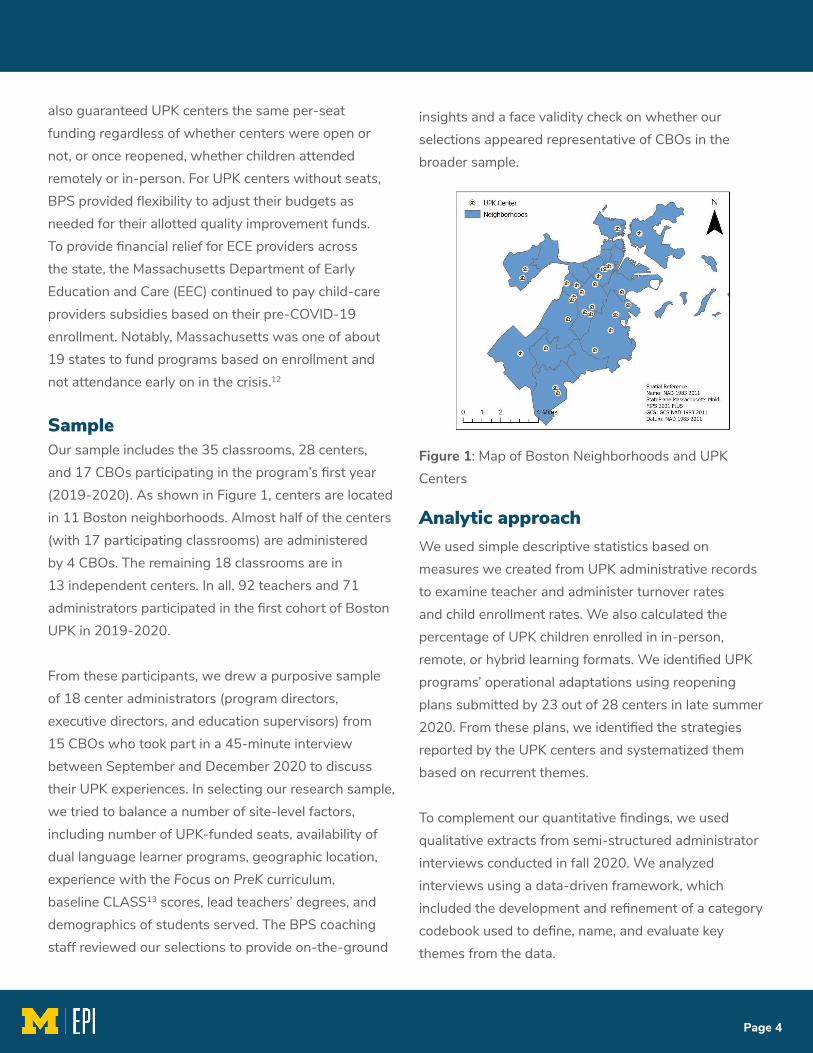
Our sample includes the 35 classrooms, 28 centers, and 17 CBOs participating in the program’s first year (2019-2020). As shown in Figure 1, centers are located in 11 Boston neighborhoods. Almost half of the centers (with 17 participating classrooms) are administered by 4 CBOs. The remaining 18 classrooms are in 13 independent centers. In all, 92 teachers and 71 administrators participated in the first cohort of Boston UPK in 2019-2020.
From these participants, we drew a purposive sample of 18 center administrators (program directors, executive directors, and education supervisors) from 15 CBOs who took part in a 45-minute interview between September and December 2020 to discuss their UPK experiences. In selecting our research sample, we tried to balance a number of site-level factors, including number of UPK-funded seats, availability of dual language learner programs, geographic location, experience with the Focus on PreK curriculum, baseline CLASS13 scores, lead teachers’ degrees, and demographics of students served. The BPS coaching staff reviewed our selections to provide on-the-ground
insights and a face validity check on whether our selections appeared representative of CBOs in the broader sample.
Figure 1: Map of Boston Neighborhoods and UPK Centers
We used simple descriptive statistics based on measures we created from UPK administrative records to examine teacher and administer turnover rates and child enrollment rates. We also calculated the percentage of UPK children enrolled in in-person, remote, or hybrid learning formats. We identified UPK programs’ operational adaptations using reopening plans submitted by 23 out of 28 centers in late summer 2020. From these plans, we identified the strategies reported by the UPK centers and systematized them based on recurrent themes.
To complement our quantitative findings, we used qualitative extracts from semi-structured administrator interviews conducted in fall 2020. We analyzed interviews using a data-driven framework, which included the development and refinement of a category codebook used to define, name, and evaluate key themes from the data.
Page 4
Sample
Analytic approach
As shown in Table 1, classrooms varied in the number of seats funded by UPK, the number of families with low-incomes they served, and their observed quality. More than half of the children in UPK classrooms, on average, were eligible to be funded by the program. The quality baseline measures of the UPK classrooms showed moderate-to-high levels of emotional support and classroom organization, and low-to-low-moderate levels of instructional quality.
Table 1. UPK Classroom Characteristics
Note: Number of classrooms with available information differs across data types. UPK eligibility: N classrooms=33. Out of the 35 classrooms participating in the first year of UPK, two classrooms were excluded due to missingness in total class size information. Quality: N classrooms = 25. CLASS data were collected in spring 2019 by trained live observers. All other data were collected in the 2019-2020 school year. CLASS scores were missing for 10 classrooms due to a combination of scheduling problems, late applications after the CLASS observation period had passed, and because 6 classrooms qualified for quality improvement but not seats in the first year of UPK. Child demographics: N classrooms = 30. Number of enrolled students who receive subsidies (as of March 2020, when centers closed) was not available for 5 classrooms with no funded seats in the first year of UPK. Note that children can fill a UPK seat and also receive a child-care subsidy. Six children enrolled with UPK funding have Individualized Education Plans.
As shown in Table 2, UPK classrooms were in centers that varied in their structural characteristics, such as number of staff and turnover rates, ability to offer four-year-old-only UPK classrooms, and engagement with quality monitoring processes. In 2019, almost 80% were NAEYC accredited, a marker of higher quality in
the early childhood field. Forty percent had three or four stars in the Massachusetts Quality Rating and Improvement System (MA QRIS).14 Most of the centers accepted tuition subsidies and served a high proportion of families who received subsidies.
Table 2. Characteristics of UPK centers in the 2018 – 2019 school year (before UPK)
N = 28 centers
Of the participants in the 2019-2020 UPK cohort, 18% of the teachers (17 out of 92) and 10% of those in administrative positions (7 out of 71) did not return for the 2020-2021 year, after the pandemic had started. UPK centers self-reported overall turnover rates of about 9% before UPK began (see Table 2), suggesting that there may have been a pandemic-related uptick inturnover. It is difficult to compare these data, however, given differences in how they were measured (administrative vs self-report) and in focus (UPK teachers and administrators versus all staff). Overall, these rates are relatively low compared to other early education settings. For example, 31% of preschool teachers in Louisiana during the 2017 – 2018 school year left their programs by the 2018 – 2019 school year.15
Page 5
Classroom and CBO Descriptive Statistics
UPK Turnover
Our FindingsOur Findings
UPK Eligibility Total class size Number of enrolled UPK eligible students Number of enrolled non-UPK eligible students Number of enrolled students who receive subsidiesQuality CLASS – Instructional Support CLASS – Emotional Support CLASS – Classroom OrganizationChild demographics % of Dual language learners (DLL) % of children from families with low incomes
Mean SD Min Max
16.91 3.62 7 2313.00 5.28 0 19 5.31 5.35 0 22 6.61 5.18 10 18
3.03 0.58 2.13 4.406.13 0.56 4.70 6.755.68 0.65 4.07 6.66
32% 24% 0% 100%58% 35% 0% 100%
Operations Hours a week for teacher planning Number of employees % Staff turnover in 2018-2019 % Able to serve 4yo exclusively in UPK classroomsQuality % Is NAEYC accredited % Has 3 or more MA QRIS stars Average MA QRIS starsBusiness model % Accepts tuition subsidies % Families who receive subsidies
Mean SD Min Max
3.81 3.35 0.25 10.00 22.88 12.08 8.00 48.00 9% 11% 0% 38% 86% -- -- --
88% -- -- -- 40% -- -- -- 2.51 1.42 1.00 4.00 89% -- -- -- 66% 31% 17% 100%

Although turnover was relatively low on average, there was substantial variation in turnover across Boston UPK centers. As shown in Figure 2, 46% of centers lost at least 1 UPK teacher. About 18% of centers lost 40-60% of their UPK teachers. Still, these are lower rates than in many other systems pre-pandemic. For example, 69% of community-based preschool centers participating in the New York City Universal Prekindergarten program during the 2016 – 2017 school year reported losing at least one teacher.16
Figure 2. Teacher turnover rates across centers
In our interview sample, 16 out of 18 directors reported not furloughing or laying off staff due to the crisis.17 Our interview data also suggest that much of the turnover we observed was driven by teachers’ individual decisions not to return, due to their own child care needs and worries about safety, rather than by concerns about being paid. One director credited public supports for blunting the impacts of the crisis on her center and increasing staffing stability:
“I think one of the reasons that we are not as hurt as we could have been was because the Department of Early Education and Care. Commissioner Sam [Aigner-Treworgy] really understood what the centers that have contracts are facing. We lost a lot of our private fee-paying parents and with that, you lose income. Since most of our families are on a contracted slot, the department’s commitment to paying us for children, even if they were not physically coming but maintaining their enrollment, has made a major difference. So that has allowed us to be a lot more stable plus our fundraising and development department has been wonderful. So, we have had funds come in from Boston and other people that have helped us through the hump…. I know that we’re lucky. We’re in a different situation than most of the field.”
Even these low turnover rates, though, have implications for quality improvement in UPK classrooms. Curriculum implementation and quality improvement efforts are more complicated and less sustainable when turnover happens, an issue known in the field as the “leaky bucket problem.”18
Child enrollment in UPK decreased substantially into winter 2021 (see Table 3) compared to before the pandemic. Although UPK-funded seats increased by 33% from year 1 to year 2 (from 429 to 571), there was a 30 percentage point reduction in UPK-filled seats between the fall of 2019 pre-pandemic and fall of 2020 mid-pandemic. However, there was some recovery in enrollment during the fall of 2020 as UPK-filled seats increased by 14 percentage points to 70% by January 2021. In comparison, BPS’s public-school-based prekindergarten enrollment in October 2020 was 90% (2,565 seats filled out of 2,854), down only slightly from pre-pandemic levels of 94-98% in October 2017-2019 even though BPS prekindergarten was remote-only in October 2020. Nationally, prekindergarten enrollment dipped by about 17 percentage points in December 2021, compared to pre-pandemic levels.19
UPK Child Enrollment
Page 6
Teacher turnover rates across centers (%)
Perc
ent o
f Cen
ters
0 20 40 60
0
2
0
40
6
0
Table 3. UPK Enrollment before and during COVID-19
UPK Totals Total UPK seats awarded Total UPK students enrolled Percentage of UPK awarded seats usedCenter-level Averages Number UPK seats awarded Number of UPK students enrolled per center Percentage of UPK seats used by students
Pre-COVID During COVID
SY ‘19 Fall ‘20 Winter ‘21
429 571 571 368 320 401 86% 56% 70%
14.79 19.68 19.68 12.69 11.33 13.82
86% 62% 70%
Note: In SY2019 – 2020, 71% of UPK students received funding from an additional source (51% received EEC subsidies and 20% received Head Start funding). In SY2020 – 2021, 50% of UPK students receive funding from an additional source (37% received EEC subsidies and 13% received Head Start funding).
Filled UPK center seats as of winter 2021 were a combination of in-person, hybrid, or remote (as determined by each center and then by each family). As shown in Table 4, approximately 62% of enrolled UPK students were receiving some in-person instruction. This is a particularly important challenge for the UPK model, given that centers are simultaneously aiming to improve their quality and developing strategies to deliver services in learning formats that they have not implemented in the past.
Table 4. Type of learning format for UPK students in centers with funded seats by Winter 2021
Note: We obtained information on the enrollment modality for 367 children (92%) across all centers.
Page 7
UPK Operational Adaptations to Increase Children’s and Teachers’ SafetyIn their reopening plans, centers included a range of changes to enhance health and safety and practice social distancing. These changes have implications for both children’s and teachers’ experiences and financial implications for centers. In the figures below, we use blue to denote changes that do not have direct cost implications and we use red to denote changes that do. Overall, centers reported 21.05 changes to increase safety, on average (SD=7.23; range 9 – 31.)
UPK Totals Students learning remotely Students in hybrid learning Students attending in-personCenter level averages UPK enrollment by center UPK children in remote learning UPK children in hybrid learning UPK children learning in-person
Mean or N SD Min Max
79 38 250
13.00 7.71 4 33 2.76 6.11 0 31 1.31 2.68 0 9 8.93 7.06 0 29
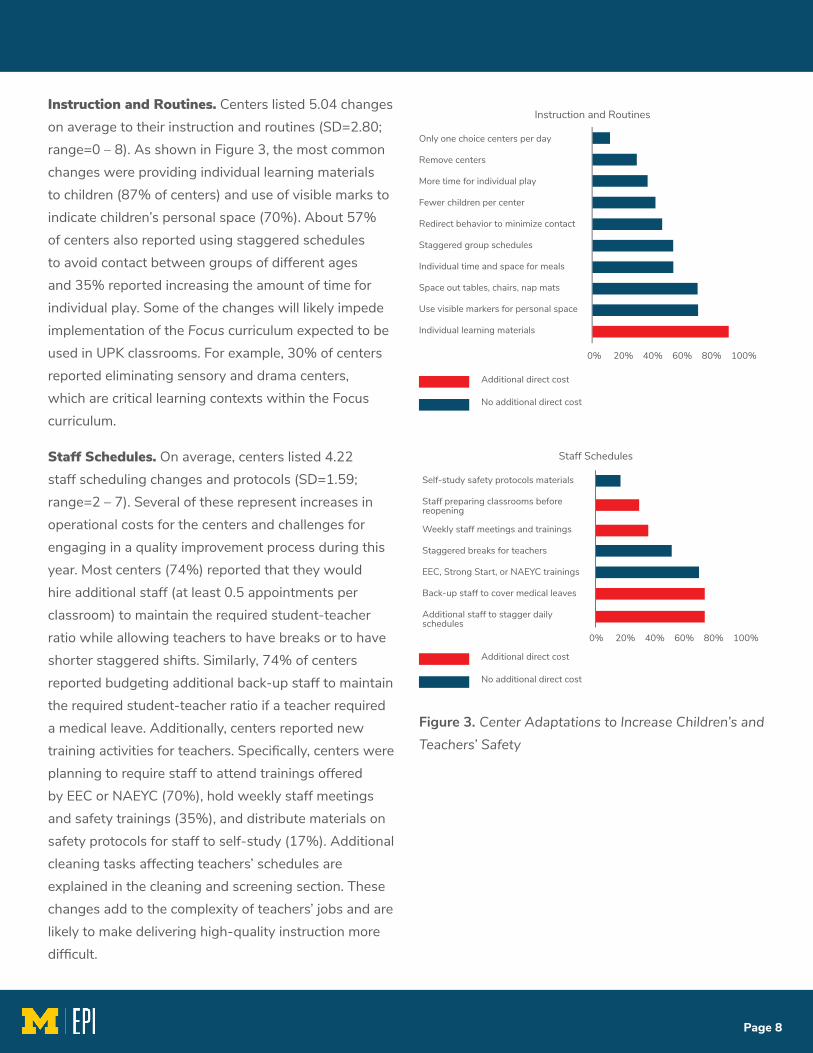
Instruction and Routines. Centers listed 5.04 changes on average to their instruction and routines (SD=2.80; range=0 – 8). As shown in Figure 3, the most common changes were providing individual learning materials to children (87% of centers) and use of visible marks to indicate children’s personal space (70%). About 57% of centers also reported using staggered schedules to avoid contact between groups of different ages and 35% reported increasing the amount of time for individual play. Some of the changes will likely impede implementation of the Focus curriculum expected to be used in UPK classrooms. For example, 30% of centers reported eliminating sensory and drama centers, which are critical learning contexts within the Focus curriculum.
Staff Schedules. On average, centers listed 4.22 staff scheduling changes and protocols (SD=1.59; range=2 – 7). Several of these represent increases in operational costs for the centers and challenges for engaging in a quality improvement process during this year. Most centers (74%) reported that they would hire additional staff (at least 0.5 appointments per classroom) to maintain the required student-teacher ratio while allowing teachers to have breaks or to have shorter staggered shifts. Similarly, 74% of centers reported budgeting additional back-up staff to maintain the required student-teacher ratio if a teacher required a medical leave. Additionally, centers reported new training activities for teachers. Specifically, centers were planning to require staff to attend trainings offered by EEC or NAEYC (70%), hold weekly staff meetings and safety trainings (35%), and distribute materials on safety protocols for staff to self-study (17%). Additional cleaning tasks affecting teachers’ schedules are explained in the cleaning and screening section. These changes add to the complexity of teachers’ jobs and are likely to make delivering high-quality instruction more difficult.
Page 8
Instruction and Routines
Only one choice centers per day
Remove centers
More time for individual play
Fewer children per center
Redirect behavior to minimize contact
Staggered group schedules
Individual time and space for meals
Space out tables, chairs, nap mats
Use visible markers for personal space
Individual learning materials
0% 20% 40% 60% 80% 100%
Staff Schedules
Self-study safety protocols materials
Staff preparing classrooms before reopening
Weekly staff meetings and trainings
Staggered breaks for teachers
EEC, Strong Start, or NAEYC trainings
Back-up staff to cover medical leaves
Additional staff to stagger daily schedules
0% 20% 40% 60% 80% 100%
Additional direct cost
No additional direct cost
Additional direct cost
No additional direct cost
Figure 3. Center Adaptations to Increase Children’s and Teachers’ Safety
Page 9
Family Communication
Host regular virtual meetings
Use mass communications (apps, social networks)
Regular update of families’ contact information
Secure billingual communication
Call familes or emergency contact
Specific drop-offs and pick-up times
Share information with families
0% 20% 40% 60% 80% 100%Additional direct cost
No additional direct cost
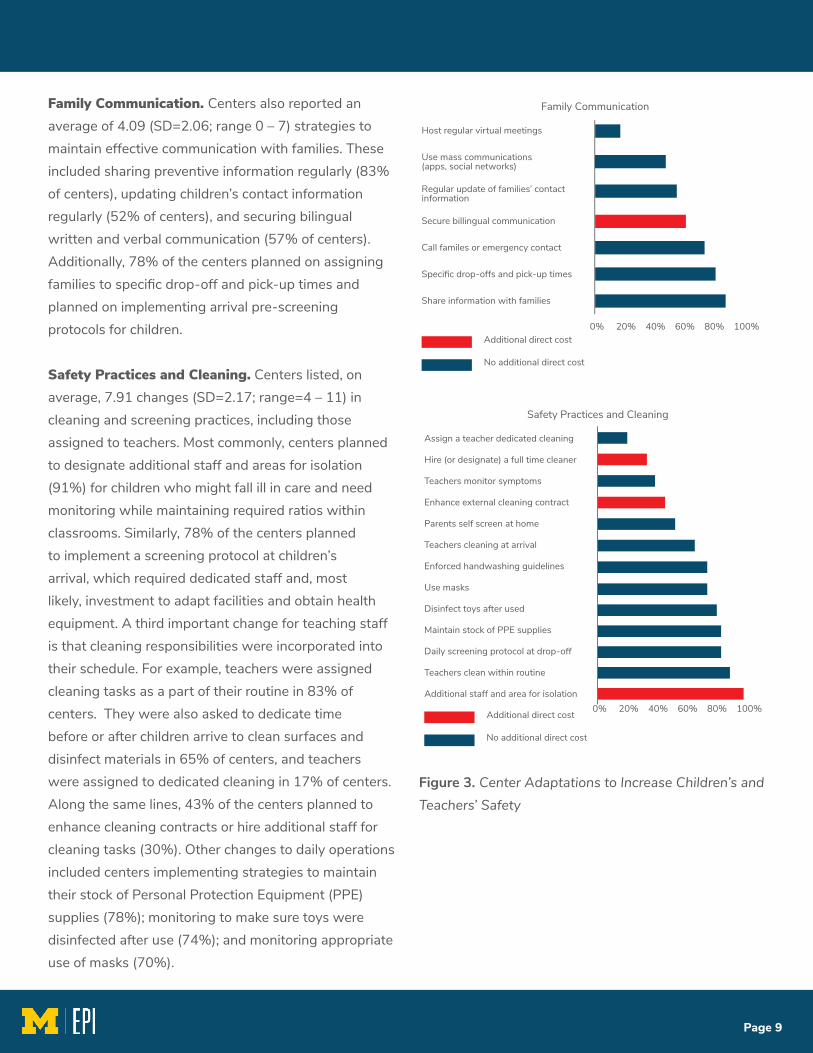
Family Communication. Centers also reported an average of 4.09 (SD=2.06; range 0 – 7) strategies to maintain effective communication with families. These included sharing preventive information regularly (83% of centers), updating children’s contact information regularly (52% of centers), and securing bilingual written and verbal communication (57% of centers). Additionally, 78% of the centers planned on assigning families to specific drop-off and pick-up times and planned on implementing arrival pre-screening protocols for children.
Safety Practices and Cleaning. Centers listed, on average, 7.91 changes (SD=2.17; range=4 – 11) in cleaning and screening practices, including those assigned to teachers. Most commonly, centers planned to designate additional staff and areas for isolation (91%) for children who might fall ill in care and need monitoring while maintaining required ratios within classrooms. Similarly, 78% of the centers planned to implement a screening protocol at children’s arrival, which required dedicated staff and, most likely, investment to adapt facilities and obtain health equipment. A third important change for teaching staff is that cleaning responsibilities were incorporated into their schedule. For example, teachers were assigned cleaning tasks as a part of their routine in 83% of centers. They were also asked to dedicate time before or after children arrive to clean surfaces and disinfect materials in 65% of centers, and teachers were assigned to dedicated cleaning in 17% of centers. Along the same lines, 43% of the centers planned to enhance cleaning contracts or hire additional staff for cleaning tasks (30%). Other changes to daily operations included centers implementing strategies to maintain their stock of Personal Protection Equipment (PPE) supplies (78%); monitoring to make sure toys were disinfected after use (74%); and monitoring appropriate use of masks (70%).
Safety Practices and Cleaning
Assign a teacher dedicated cleaning
Hire (or designate) a full time cleaner
Teachers monitor symptoms
Enhance external cleaning contract
Parents self screen at home
Teachers cleaning at arrival
Enforced handwashing guidelines
Use masks
Disinfect toys after used
Maintain stock of PPE supplies
Daily screening protocol at drop-off
Teachers clean within routine
Additional staff and area for isolation0% 20% 40% 60% 80% 100%
Additional direct cost
No additional direct cost
Figure 3. Center Adaptations to Increase Children’s and Teachers’ Safety

Page 10
The research presented in this brief is preliminary and descriptive. We will be adding additional data sources and continuing to follow centers throughout the crisis. Notably, we do not have data from UPK teachers on the reasons why they did not continue in the program for the 2020 – 2021 year. Such data would have been useful in explaining the turnover we observed. Also, demographic data at the center level would help us understand some of the centers’ strategies in response to COVID – 19 (i.e., providing remote or in person services only), as would child-level attendance data.21 Parent preferences for in-person schooling have been shown to vary by race/ethnicity in other work.22 In addition, our study would benefit from analyzing financial data to gain a better understanding of how the pandemic has affected the participating centers. Our analysis of the reopening plans adds to evidence showing that centers are using resources to adjust physical environments, increase staff, and secure intensive cleaning procedures.23 Since UPK allowed programs to reorganize their budgets to minimize the impacts of COVID-19, an analysis of centers’ budgeting decisions would help illuminate the impacts of the pandemic on centers’ financial situations. Finally, the data used in this brief were collected as part of the monitoring strategy for the UPK program and do not reflect information on all classrooms in the centers. Complete center data would have provided a fuller look into the effects of the pandemic on centers and classrooms.
LimitationsDirectors provided insight into these changes and their effects on centers’ routines, children’s experiences, and added costs:
“I think the biggest burden is having to clean the restroom area after each time it’s used. So if you have 10 or 12 children at lunchtime needing to use the restroom, then we need to clean it each time. It is also just the sheer volume of tables in the classroom. Before you have to clean a table, before and after each meal or before and after each activity, but now instead of having two or three large tables in the classroom, you might have 10 or 12 tables to clean. So now before lunch, 12 tables need to be cleaned and after lunch, 12 tables need to be cleaned again. There are more materials so there are more things that need cleaning.”
“It’s been a great expense in terms of the cleaning products and all the new tables for kids. All the individual supplies too. In the past, a classroom might have had a toddler classroom with two or three dolls. Now all the kids need one. Supplying all those new toys, materials. and furniture, in addition to the modifications throughout the building has been expensive. The Plexiglas has also been installed and the physical modifications to the space have been expensive too. We’ve hired a professional cleaning company that we didn’t have before. So the teachers clean as the day goes on, but we’ve hired a professional cleaning company to come in the morning and do the floors and give everything a wipe down. So that has been an extra expense.” 20
Given these changes to enhance teacher and child safety, children who enrolled for in-person instruction are likely experiencing a different social and instructional environment in the centers during the pandemic. Directors do, however, speak to the resilience of children: “We are trying to incorporate the social distancing and mask-wearing into the new normal. What’s amazing is how resilient and how accepting kids are. More so than adults which is great. That’s the one good thing about working with kids, that they’ll wear that mask, they’ll put it on. They might have it slip a little bit and all that stuff, but they’ll remember to stick it back on which is nice.”
Page 11
EPI Mission StatementThe central mission of the initiative is to engage in applied education policy research. The Education PolicyInitiative is a program within the Ford School that brings together nationally-recognized education policyscholars focused on the generation and dissemination of policy-relevant education research. The primarygoals of the initiative are to:
• Conduct rigorous research to inform education policy debates in Michigan and nationwide
• Disseminate best practices in education reform to local, state, and national policymakers, as well as to educational practitioners, parents, and students
• Train graduate students and others to conduct cutting-edge research in education
• Facilitate interactions between students and faculty from different schools and/ or departments who share an interest in education reform.
Our preliminary evidence underscores the necessity of supporting the early education sector during the COVID-19 crisis and recovery. Although Boston UPK teacher turnover rates are lower than those observed in many other ECE contexts before the pandemic, approximately half of UPK centers lost at least one of their UPK teachers. Program quality improvement efforts are more difficult and less sustainable when turnover occurs. The large drop in child enrollment we observed, along with the changes to the learning and social environments in classrooms for those who do attend, also speak to concerns24 about the effects of the crisis on young children’s learning in the critical early years.
Conclusions
Education Policy Initiative | Gerald R. Ford School of Public PolicyJoan and Sanford Weill Hall, Suite 5100
735 South State Street, Ann Arbor, MI 48109734-615-6978 | edpolicy.umich.edu | @edpolicyford
1 National Association for the Education of Young Children - NAEYC. (2020). Holding on until help comes.A survey reveals child care’s fight to survive. Retrieved from: https://www.naeyc.org/sites/default/files/globally-shared/downloads/PDFs/our-work/public-policy-advocacy/holding_on_until_help_comes.survey_analysis_july_2020.pdf; NAEYC. (2020). Am I next? Sacrificing to stay open, child care providers face a bleak future without relief. Retrieved from: https://illinoisaeyc.org/assets/uploads/sites/491/2020/12/Am-I-Next.pdf
2 The American Rescue Plan Act of 2021 (March 11th, 2021) guaranteed financial support for child care andeducation services. Recovered from: https://www.congress.gov/bill/117th-congress/house-bill/1319
3 We used UPK administrative records to identify teachers and administrative staff that participated in the program during the 2019 – 2020 and 2020 – 2021 school years. We used these records to create measures of UPK turnover at the classroom, center, and CBO levels by year 2 (2020-20201) of the UPK program.
4 UPK administrators at BPS collected enrollment data in classrooms with any UPK seats. Our year 1 (2019-2020) data was collected in April of 2020 and our year 2 data (2020 – 2021) was collected on October 15th, 2020 and January 15th, 2021.
5 In late summer 2020, 23 out of 28 centers submitted a reopening plan to the EEC describing the strategies thatwould be put in place to minimize the risks of contracting and spreading COVID-19. The remaining five centers did not reopen during the summer.
Page 12
6 One center reopened offering remote services only but switched to hybrid in early March 2021.
7 A very limited number of prekindergarten students including students with disabilities and dual language learners returned to hybrid instruction in the Boston Public Schools in November 2020.
8 Bassok, D., Markowitz, A., Smith, A., & Kiscaden., S. (2020). Child care leaders’ experiences with COVID – 19: First findings from the Study of Early Education in Louisiana.. EdPolicyWorks, University of Virginia – UCLA Graduate School of Education and Information Studies; Bassok, D., Michie, M., Cubides-Mateus, D.M., Doromal, J.B., & Kiscaden, S. (2020). The divergent experiences of early educators in schools and child care centers during COVID – 19: Findings from Virginia. EdPolicyWorks. University of Virginia.; Barnett, S., Grafwallner, R., Weisenfeld, G. (2021). Corona pandemic in the United States shapes new normal for young children and their families. European Early Childhood Education Research Journal, 29, pp. 109-124.; Gonzalez, K. E., Hanno, E. C., Cuartas, J., Jones, S. M., Lesaux, N. K., Hofer, K., Checkoway, A., & Goodson, B. (2020). How are they faring? Impacts of the COVID-19 pandemic on the lives of families and young children in Massachusetts. Saul ZaentzEarly Education Initiative, Harvard Graduate School of Education.; Grindal, T. Smith, S., Nakamura, J., & Granja, M. (2021). Early childhood education during COVID-19: The experiences of Arkansas educators. SRI International. Retrieved from: https://www.sri.com/wp-content/uploads/2021/02/ARISE-Memo_Early-childhood-education-during-the-COVID-19-pandemic_02042021_with-Appendices.pdf; Tulsa SEED Study Team. (2020). Parents, teachers, and distance learning during the COVID-19 pandemic: A
Citations
snapshot from Tulsa, OK. Retrieved from:https://medium.com/@TulsaSEED/parents-teachers-and-distance-learning-during-the-covid-19-pandemic-a-snapshot-from-tulsa-ok-5b5fdb54ea18.
9 There has long been more demand than supply for Boston prekindergarten seats located in the public schools. See: Shapiro, A., Martin, E., Weiland, C., & Unterman, R. (2019). If you offer it, will they come? Patterns of application and enrollment behavior in a universal prekindergarten context. AERA Open, 5, 1-22.; Weiland, C., Unterman, R., Shapiro, A., Staszak, S., Rochester, S., & Martin, E. (2020). The effects of enrolling in oversubscribed prekindergarten programs through third grade. Child Development, 91, 1401-1422.
10 Of these eight centers, three participated in Boston UPK in year 1 and were awarded additional seats in new classrooms in year 2. Four are centers from the quality improvement process in year 1 and one is a new center.
11 McCormick, M. P., Weiland, C., Hsueh, J., Maier, M., Hagos, R., Snow, C., Leacock, N., & Schick, L. (2020). Promoting content-enriched alignment across the early grades: A study of policies & practices in the Boston Public Schools. Early Childhood Research Quarterly, 52, 57–73. https://doi.org/10.1016/j.ecresq.2019.06.012
12 Alliance for Early Success (2020, April 24). Child care subsidy and payment changes in response to COVID-19. Retrieved March 16, 2021 fromhttps://legacy.earlysuccess.org/sites/default/files/ChangestoChildCarePayments20200424.pdf.
13 In late spring/early summer 2019, before UPK classrooms were selected, a reliable external observer
Page 13
measured general process quality in late spring/early summer 2019 (before UPK) using the CLASS PreK (Pianta et al., 2008) observational tool via a live observation scheduled at a time convenient for the teacher. The CLASS measures three domains of teacher-child interactions: Emotional Support, Classroom Organization, and Instructional Support.
14 Executive Office of Education – Massachusetts (2020). Learn about the Massachusetts Quality Rating and Improvement System (QRIS). Retrieved from: https://www.mass.gov/service-details/learn-about-the-massachusetts-quality-rating-and-improvement-system-qris
15 Bassok, D., Markowitz, A., Bellows, L., & Sadowski, K. (2021). New evidence on teacher turnover in early childhood. Educational Evaluation and Policy Analysis, 43, 172 – 180. https://doi.org/10.3102/0162373720985340
16 Reid, J. L., Melvin, S. A., Kagan, S. L., & Brooks-Gunn, J. (2019). Building a unified system for universal Pre-K: The case of New York City. Children and Youth Services Review, 100, 191–205. https://doi.org/10.1016/j.childyouth.2019.02.030
17 One center laid off all its 22 employees in spring 2020 but re-employed most once the center re-opened. Another administrator, an Education Supervisor, was unsure whether or not the organization’s multi-site program had furloughed staff and was therefore unable to comment on the issue.
18 Chaudry, A., Morrissey, T., Weiland, C., & Yoshikawa, H. (2017). Cradle to kindergarten: A new plan to combat inequality. New York City, NY Russell Sage Foundation.
19 Barnett, W.S., & Jung, K. (2021). Seven impacts of the pandemic on young children and their parents: Initial findings from NIEER’s December 2020 Preschool Learning Activities Survey. New Brunswick, NJ: National Institute for Early Education Research.
20 These quotes are illustrative in nature from ongoing analyses of interview data.
21 Arbour, M., Yoshikawa, H., Willett, J., Weiland, C., Snow, C., Mendive, S., Barata, C., & Treviño, E. (2016). Experimental impacts of a preschool intervention in Chile on children’s language outcomes: Moderation by student absenteeism. Journal of Research on Educational Effectiveness, 9, 117-149.
22 Gilbert, L.K., Strine, T.W., Szucs, L.E., Crawford, T.N., Parks, S.E., Barradas, D.T., Njai, R., & Ko, J.Y. (2020). Racial and ethnic differences in parental attitudes and concerns about school reopening during the COVID-19 pandemic — United States. CDC COVID-19 Response team, 69, 1848–1852. http://dx.doi.org/10.15585/
23 Doocy, S., Kim, Y., & Montoya, E. (2020). California child care in crisis: The escalating impacts of COVID-19 as California reopens. Center for the Study of Child Care Employment. Retrieved March 2, 2021 from https://cscce.berkeley.edu/california-child-care-in-crisis-covid-19/
24 Kuhfeld, M., Soland, J., Tarasawa, B., Johnson, A., Ruzek, E., & Liu, J. (2020). Projecting the potential impact of COVID-19 school closures on academic achievement. Educational Researcher, 49, 549–565.https://doi.org/10.3102/0013189X20965918
Page 14