Embed Size (px)
Citation preview
8/8/2019 Effects of Cytochrome P450 3A Modulators Ketoconazole
http://slidepdf.com/reader/full/effects-of-cytochrome-p450-3a-modulators-ketoconazole 1/12
British Journal of Clinical Pharmacology DOI:10.1111/j.1365-2125.2005.02507.x
Br J Clin Pharmacol 61:1 58–69 58 © 2005 Blackwell Publishing Ltd
Correspondence
Scott W. Grimm PhD, AstraZeneca
Pharmaceuticals LP, 1800 Concord
Pike, PO Box 15437, Wilmington, DE
19850, USA.
Tel.: +
1 302 886 2271
Fax:
+
1 302 886 5345
E-mail:
Keywords
carbamazepine, drug interaction,
ketoconazole, pharmacokinetics,quetiapine
Received
21 December 2004
Accepted
25 May 2005
Effects of cytochrome P450 3A modulators ketoconazole
and carbamazepine on quetiapine pharmacokinetics
Scott W. Grimm,
1
Neil M. Richtand,
2
Helen R. Winter,
1
Karen R. Stams,
3
& Stots B. Reele
1
1
AstraZeneca Pharmaceuticals LP, Wilmington, DE, 2
Department of Psychiatry, Cincinnati Veterans Affairs Medical Center and University
of Cincinnati College of Medicine, Cincinnati, OH, and 3
AstraZeneca Pharmaceuticals LP, Boston, MA, USA
Aims
To explore the potential for drug interactions on quetiapine pharmacokinetics using
in vitro
and in vivo
assessments.
Methods
The CYP enzymes responsible for quetiapine metabolite formation were assessedusing recombinant expressed CYPs and CYP-selective inhibitors. P-glycoprotein (Pgp)transport was tested in MDCK cells expressing the human MDR1 gene. The effectsof CYP3A4 inhibition were evaluated clinically in 12 healthy volunteers that received25 mg quetiapine before and after 4 days of treatment with ketoconazole 200 mgdaily. To assess CYP3A4 induction in vivo
, 18 patients with psychiatric disorders weretitrated to steady-state quetiapine levels (300 mg twice daily), then titrated to 600 mgdaily carbamazepine for 2 weeks.
Results
CYP3A4 was found to be responsible for formation of quetiapine sulfoxide and N-and O-desalkylquetiapine and not a Pgp substrate. In the clinical studies, ketoconazoleincreased mean quetiapine plasma C
max
by 3.35-fold, from 45 to 150 ng ml
−
1
(mean
C
max
ratio 90% CI 2.51, 4.47) and decreased its clearance (Cl/F) by 84%, from 138to 22 l h
−
1
(mean ratio 90% CI 0.13, 0.20). Carbamazepine decreased quetiapineplasma C
max
by 80%, from 1042 to 205 ng ml
−
1
(mean C
max
ratio 90% CI 0.14, 0.28)and increased its clearance 7.5-fold, from 65 to 483 l h
−
1
(mean ratio 90% CI 6.04,9.28).
Conclusions
Cytochrome P450 3A4 is a primary enzyme responsible for the metabolic clearanceof quetiapine. Quetiapine pharmacokinetics were affected by concomitant adminis-tration of ketoconazole and carbamazepine, and therefore other drugs and ingestednatural products that strongly modulate the activity or expression of CYP3A4 wouldbe predicted to change exposure to quetiapine.
Introduction
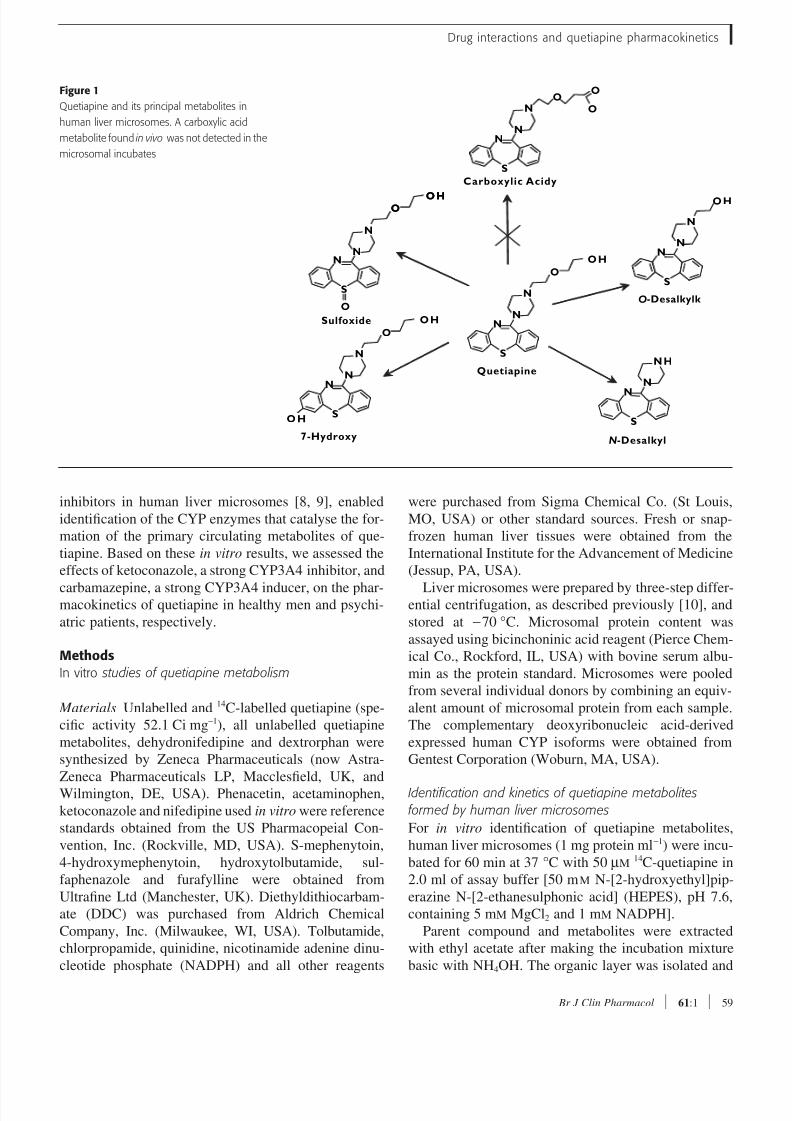
Quetiapine fumarate, a dibenzothiazepine psychotropic,
is extensively metabolized in vivo
via sulfoxidation,
considered the major metabolic pathway, as well as oxi-
dation to carboxylic acid, hydroxylation, and dealkyla-
tion (Figure 1) [1–3]. Quetiapine is often used in
combination with other drugs; thus, an understanding of
its potential for clinically significant drug–drug interac-
tions is essential to successful therapy [4–7].
A combination of commonly used in vitro
approaches, including metabolism by recombinant
human cytochrome P450 (CYP) and enzyme selective
8/8/2019 Effects of Cytochrome P450 3A Modulators Ketoconazole
http://slidepdf.com/reader/full/effects-of-cytochrome-p450-3a-modulators-ketoconazole 2/12
Drug interactions and quetiapine pharmacokinetics
Br J Clin Pharmacol
61
:1 59
inhibitors in human liver microsomes [8, 9], enabled
identification of the CYP enzymes that catalyse the for-
mation of the primary circulating metabolites of que-
tiapine. Based on these in vitro results, we assessed the
effects of ketoconazole, a strong CYP3A4 inhibitor, and
carbamazepine, a strong CYP3A4 inducer, on the phar-macokinetics of quetiapine in healthy men and psychi-
atric patients, respectively.
Methods
In vitro studies of quetiapine metabolism
Materials
Unlabelled and 14
C-labelled quetiapine (spe-
cific activity 52.1 Ci mg
−
1
), all unlabelled quetiapine
metabolites, dehydronifedipine and dextrorphan were
synthesized by Zeneca Pharmaceuticals (now Astra-
Zeneca Pharmaceuticals LP, Macclesfield, UK, and
Wilmington, DE, USA). Phenacetin, acetaminophen,
ketoconazole and nifedipine used in vitro
were reference
standards obtained from the US Pharmacopeial Con-
vention, Inc. (Rockville, MD, USA). S-mephenytoin,
4-hydroxymephenytoin, hydroxytolbutamide, sul-
faphenazole and furafylline were obtained from
Ultrafine Ltd (Manchester, UK). Diethyldithiocarbam-
ate (DDC) was purchased from Aldrich Chemical
Company, Inc. (Milwaukee, WI, USA). Tolbutamide,
chlorpropamide, quinidine, nicotinamide adenine dinu-
cleotide phosphate (NADPH) and all other reagents
were purchased from Sigma Chemical Co. (St Louis,
MO, USA) or other standard sources. Fresh or snap-
frozen human liver tissues were obtained from the
International Institute for the Advancement of Medicine
(Jessup, PA, USA).
Liver microsomes were prepared by three-step differ-ential centrifugation, as described previously [10], and
stored at −70 °C. Microsomal protein content was
assayed using bicinchoninic acid reagent (Pierce Chem-
ical Co., Rockford, IL, USA) with bovine serum albu-
min as the protein standard. Microsomes were pooled
from several individual donors by combining an equiv-
alent amount of microsomal protein from each sample.
The complementary deoxyribonucleic acid-derived
expressed human CYP isoforms were obtained from
Gentest Corporation (Woburn, MA, USA).
Identification and kinetics of quetiapine metabolitesformed by human liver microsomes
For in vitro
identification of quetiapine metabolites,
human liver microsomes (1 mg protein ml
−
1
) were incu-
bated for 60 min at 37 °
C with 50 µ
M
14
C-quetiapine in
2.0 ml of assay buffer [50 m
M
N-[2-hydroxyethyl]pip-
erazine N-[2-ethanesulphonic acid] (HEPES), pH 7.6,
containing 5 m
M
MgCl
2
and 1 m
M
NADPH].
Parent compound and metabolites were extracted
with ethyl acetate after making the incubation mixture
basic with NH
4
OH. The organic layer was isolated and
Figure 1
Quetiapine and its principal metabolites in
human liver microsomes. A carboxylic acid
metabolite found in vivo
was not detected in the
microsomal incubates
N
S
N
NO
O
O
N
S
N
NH
O
N
S
N
N
OH
N
S
N
N
O
OH
NN
N
O
OH N
S
N
N
O
OH
7-Hydroxy
Sulfoxide
Carboxylic Acidy
O-Desalkylk
N-Desalkyl
Quetiapine
S
OHOHO
8/8/2019 Effects of Cytochrome P450 3A Modulators Ketoconazole
http://slidepdf.com/reader/full/effects-of-cytochrome-p450-3a-modulators-ketoconazole 3/12
S. W. Grimm et al.
60
61
:1
Br J Clin Pharmacol
evaporated under nitrogen. The extracted metabolites
were redissolved in the high-pressure liquid chromatog-
raphy (HPLC) mobile phase (see below) and subjected
to liquid chromatography with mass spectrometric
detection. All in vitro extracts (50 µl) were separated
using a Zorbax SB-C8 4.6 × 25 mm column and a pre-
column with the same packing. The HPLC mobile phaseconsisted of 0.1% aqueous trifluoroacetic acid (adjusted
to pH 3.0 with NH
4
OH) and 100% acetonitrile, with
gradient elution between 80 : 20 (v/v) and 65 : 35 (v/v)
at 1.5 ml min
−
1
over 30 min. Authentic metabolite stan-
dards were analysed under the same conditions.
The kinetics of quetiapine metabolite formation were
similarly evaluated. Duplicate samples of pooled
microsomes (1 mg protein ml
−
1
) were incubated for
20 min at 37 °C with 14
C-quetiapine (5–100 µ
M
) in
0.25 ml of the same assay buffer. After incubation, the
reaction was terminated by precipitation of the microso-
mal protein by addition of acetonitrile. Quetiapine
metabolites formed in the mixture were separated by
gradient reverse-phase HPLC (described above) and
monitored using both solid-phase radiochemical and
ultraviolet-photodiode array detection. Peak areas of
each metabolite in the chromatograms were plotted
against the initial concentration of quetiapine in the
incubations. Enzyme kinetic parameters for formation
of each quetiapine metabolite were calculated by using
nonlinear regression (PCNonlin; SCI Software, Lexing-
ton, KY, USA).
Effect of specific CYP inhibitors on quetiapine metabolism in human liver microsomes
Quetiapine (15 µ
M
) was coincubated with selective
CYP inhibitors at 37 °
C with human liver microsomes
(1 mg protein ml
−
1
) in assay buffer as described. A con-
centration of 15 µ
M
of quetiapine was used in these
experiments because it was well below the apparent
K
m
values for metabolite formation in human liver
microsomes but allowed for analytical detection of the
metabolites formed, even though this concentration is
approximately sevenfold greater than the steady-state
plasma maximal drug concentration (
C
max
) following a
clinically used 300-mg twice-daily dose [11].
The CYP inhibitors included furafylline, sul-
faphenazole, quinidine, DDC and ketoconazole, which
selectively inhibit CYP1A2, CYP2C9, CYP2D6,
CYP2E1 and CYP3A4, respectively. The amount of
quetiapine metabolites formed in the presence of these
specific inhibitors was compared with a control sam-
ple containing only quetiapine, microsomes, other
reaction cofactors, and solvent vehicle assay buffer (no
inhibitor).
Quetiapine metabolism by heterologously expressed human CYP enzymes
Quetiapine (15 µ
M
) was incubated for 1 h at 37 °
C in as-
say buffer (as described above) containing microsomal
fractions isolated from human lymphoblastoid cell lines
expressing CYP1A2, CYP2C9, CYP2C19, CYP2D6
and CYP3A4. Exogenous CYP reductase (0.5 U ml
−
1
)was added to incubations containing CYP1A2 and
CYP2C19 because reductase was not coexpressed with
CYP in these cell lines. Control samples were prepared
by coincubating quetiapine with vector-transfected
microsomal fractions lacking expressed CYP protein.
Transport of quetiapine across MDR-1-MDCK cell monolayers
Madin-Darby canine kidney cells transfected with
human multidrug resistance gene (MDR-1-MDCK
cells) were obtained from the Netherlands Cancer Insti-
tute (Amsterdam, the Netherlands) and cultured in
DMEM supplemented with 10% fetal bovine serum.
Directional [basolateral to apical (B–A) and apical to
basolateral (A–B)] assays were conducted 3 days after
seeding MDR-1-MDCK cells onto polycarbonate Tran-
swell membranes at a density of 1.5 × 10
6
cm
−
2
. Trans-
port assays were conducted with 1 µ
M
quetiapine or the
known P-glycoprotein (Pgp) substrate loperamide at
37 °C for 60 min. After incubation, samples from both
the donor and receiver chambers were analysed for
quetiapine or loperamide concentration using LC/MS/
MS.
Clinical studies of the effects of ketoconazole and carbamazepine on quetiapine pharmacokinetics
Two clinical studies were conducted to assess the effects
of coadministration of drugs that strongly induce or
inhibit CYP3A4 on quetiapine pharmacokinetics. In
study 1, the effects of the CYP3A4 inhibitor ketocona-
zole were examined in healthy volunteers. In study 2,
the effects of the CYP3A4 inducer carbamazepine were
examined in patients. The patients were diagnosed by
their treating physician based on Diagnostic and Statis-
tical Manual of Mental Disorders, 4th edition, Text
Revision (DSM-IV-TR) criteria [12]. In both studies,
pharmacokinetic parameters obtained when quetiapine
was used alone were compared with those obtained after
coadministration with ketoconazole or carbamazepine.
Study participants
Healthy male volunteers aged 24–42 years were
enrolled in study 1. Exclusion criteria included a posi-
tive test for hepatitis B surface antigen or human immu-
nodeficiency virus (HIV) antibody; abnormalities in
8/8/2019 Effects of Cytochrome P450 3A Modulators Ketoconazole
http://slidepdf.com/reader/full/effects-of-cytochrome-p450-3a-modulators-ketoconazole 4/12
Drug interactions and quetiapine pharmacokinetics
Br J Clin Pharmacol
61
:1 61
baseline laboratory values or electrocardiographic find-
ings; presence of an acute nonpsychiatric illness within
2 weeks before enrolment; and use of drugs that affect
the CYP enzyme system within 6 weeks before study
initiation. Study participants were asked to limit their
caffeine intake and refrain from making major changes
in their dietary habits throughout the study. Use of pre-scription and nonprescription medications was prohib-
ited unless deemed appropriate by the investigator.
Patients in study 2 were men and women aged 29–
63 years; met DSM-IV-TR criteria [12] for schizophre-
nia, schizoaffective disorder, or bipolar disorder; and
were in remission from an acute exacerbation of their
disorder for at least 3 months. All patients had been
treated with antipsychotic medications during the year
before enrolment and were in remission without psy-
chotic symptoms at time of enrolment into the study.
Some subjects had adverse events on their previous
medications, and because of the lower incidence of dys-
tonic movements on quetiapine, were considered to be
eligible and good candidates to be switched to quetiap-
ine. The subjects were withdrawn from any previous
medication and started on quetiapine within 4 days of
their last dose of previous antischizophrenic treatment,
and were titrated to a high dose of quetiapine (300 mg
twice per day). The high dose ensured that even with the
enzyme induction secondary to carbamazepine, the sub-
jects would be receiving effective exposures to quetiap-
ine. The subjects all were inpatients during the study and
were closely observed so that if there was any sign of relapse of the acute psychotic state, the carbamazepine
would be terminated and the subject aggressively
treated. During the study none of the subjects had an
acute relapse of their psychosis (see clinical effect in the
Results section).
Patients taking lithium for schizoaffective disorder or
bipolar disorder were allowed to continue doing so if
their dose had been stable for at least 1 month before
enrollment. All other antipsychotic, psychotropic or
mood-stabilizing medications except lithium were dis-
continued at enrolment. Only oral chloral hydrate and
benztropine mesylate were permitted to treat agitation,
insomnia or extrapyramidal symptoms. Acetaminophen
was the only analgesic allowed throughout the study.
Women of childbearing age were allowed to participate
only if they were not pregnant and were using a reliable
nonhormonal method of contraception. Exclusions
included a DSM-IV-TR Axis I disorder other than
schizophrenia, schizoaffective disorder, or bipolar dis-
order; a positive test for hepatitis B surface antigen or
HIV antibody; presence of an acute nonpsychiatric ill-
ness during the 2 weeks before study entry; use of cloz-
apine within 2 months of enrolment; or use of CYP
inducers or inhibitors within 6 weeks of enrolment.
The study in healthy volunteers was conducted at
Christiana Care Research Institute in Newark, Delaware
and was approved by the Institutional Review Board of
Christiana Care Health Services. The patient study was
conducted at two sites: Cincinnati VA Hospital and BHCAlhambra Hospital, Rosemead, California. The Univer-
sity of Cincinnati Medical Center Institutional Review
Board and the Western Institutional Review Board ap-
proved the study, and the study protocol adhered to the
ethical guidelines of the Declaration of Helsinki. Each
subject gave informed consent. At the time of enrollment
into the study, all of the patients were in remission, with-
out active psychotic behaviour and were judged by the
investigator to be capable of giving informed consent.
Study design
Study 1 was an 8-day, open-label, crossover trial in
volunteers who resided at the clinical research centre
during the study. After an 8-h fast, study participants
were given a single oral dose of quetiapine (25 mg) at
08.00 h on days 1 and 6. Single oral doses of ketocon-
azole (200 mg day
−
1
) were administered at 06.00 h from
day 3 through day 6. Ketoconazole was taken at least
1 h before or 2 h after meals (quetiapine was adminis-
tered after fasting), with a 2-h interval between the doses
of ketoconazole and quetiapine on day 6.
Study 2 was a 36-day, open-label, multicentre, multi-
ple-dose, pharmacokinetic study. Quetiapine was initi-ated at 25 mg twice daily on day 1 and increased to
300 mg twice daily by day 5. Patients remained on this
dose through day 33 and then discontinued treatment
after a final 300-mg dose given on the morning of day
34. Carbamazepine was initiated with a 200-mg dose on
the evening of day 9, continued at 200 mg twice daily
on days 10 through 12, and increased to 200 mg three
times daily on days 13 through 33, ending after a final
200-mg dose on the morning of day 34. To attain a
reliable determination of steady-state trough plasma
concentrations of quetiapine both before and after the
addition of carbamazepine, efforts were made to main-
tain a precise 12-h interval between the morning and
evening doses of quetiapine on days 7 through 9 and
days 32–33.
Pharmacokinetic sampling
In study 1, blood samples were obtained on days 1 and
6 at baseline and at 0.25, 0.5, 0.75, 1, 1.5, 2, 3, 5, 8, 12,
16, 20, 24 and 30 h after quetiapine administration to
measure concentrations of quetiapine and its sulfoxide
metabolite.

8/8/2019 Effects of Cytochrome P450 3A Modulators Ketoconazole
http://slidepdf.com/reader/full/effects-of-cytochrome-p450-3a-modulators-ketoconazole 5/12
S. W. Grimm et al.
62
61
:1
Br J Clin Pharmacol
In study 2, blood samples were obtained for measure-
ment of quetiapine exposure on days 9 and 34 at 15 min
before and 0.25, 0.5, 0.75, 1, 1.5, 2, 2.5, 3, 4, 6, 8, 10
and 12 h after the morning dose of quetiapine. Addi-
tional blood samples were taken 15 min before carbam-
azepine administration on the evening of day 9 and the
morning of day 34.In both studies, blood samples were collected into
heparinized Vacutainer
®
tubes (BD, Franklin Lakes, NJ,
USA). The blood was centrifuged within 15–30 min
after collection, and the resulting plasma samples were
placed into polypropylene tubes and frozen at −20 °C
until analysed using HPLC with atmospheric pressure
chemical ionization and tandem mass spectrometry.
Plasma samples were analysed for concentrations of
quetiapine and its major metabolite, quetiapine sulfox-
ide, using a validated procedure (KeyStone Analytical
Laboratories, Inc., North Wales, PA, USA). These ana-
lytes were extracted from alkalinized plasma with ethyl
acetate and evaporated, and the dried residues reconsti-
tuted in 50 : 50 methanol:acetonitrile. Chromatographic
separation was carried out on a reverse-phase liquid
chromatography system utilizing a 3.5-µm Zorbax™
SB-phenyl (4.6 × 75 mm) column, with a mobile phase
composed of 0.088% ammonium formate (pH 3.0),
methanol and acetonitrile at a flow rate of 1.5 ml min
−
1
.
Detection was achieved on a PE Sciex API 300 tandem
mass spectrometer with turbo ionspray ionization. The
parent/daughter ions monitored were m/z 384.2/253.0
(quetiapine) and m/z 400.1/221.1 (sulfoxidemetabolite). The method has a quantification range of
2.50–500 ng ml
−
1
with an applicable range to
5000 ng ml
−
1
by sample dilution with plasma.
Pharmacokinetic variables
In study 1, primary pharmacokinetic variables included
the area under the plasma concentration–time curve
from baseline to t hours after dosing (AUC0–t ), the total
area under the plasma concentration–time curve from
time 0 to infinity (AUC), and C max. The terminal half-
life (t 1/2
) and apparent oral clearance (CL/F) of quetiap-
ine were evaluated as secondary pharmacokinetic
parameters. The pharmacokinetic profile of the sulfox-
ide metabolite of quetiapine was also examined.
In study 2, all primary pharmacokinetic parameters
were assessed at steady state (ss), confirmed by analysis
of minimum plasma concentrations (C min). Parameters
included C max-ss and AUCτ-ss, where τ is the dosing
interval. Secondary pharmacokinetic parameters in-
cluded time to reach C max-ss (t max-ss), C min-ss and CL/F.
In both studies, all pharmacokinetic parameters were
determined using a noncompartmental model.
Statistical analyses
In study 1, AUC0–t , AUC, C max and CL/F were logarith-
mically transformed before analysis of variance
(ANOVA). The 90% confidence intervals of the geomet-
ric mean ratio for day 6 to day 1 for these parameters
were constructed using Schuirmann’s two one-sided
tests procedure. The apparent t 1/2 was analysed in a sim-ilar fashion but not log transformed. Descriptive statis-
tics were given for all analyses of ketoconazole.
In study 2, the logarithmically transformed values of
AUCτ-ss, C max-ss and CL/F and the rank transformed
values of t max-ss on day 9 (quetiapine alone) and day 34
(quetiapine plus carbamazepine) were analysed using a
two-way ANOVA. The ANOVA results were then used to
construct 90% confidence intervals for the geometric
mean ratios of AUCτ-ss, C max-ss and CL/F. The interac-
tion of quetiapine and carbamazepine was assessed
using the two one-sided tests procedure. If the 90%
confidence interval for a given geometric mean ratio was
between 0.8 and 1.25 (indicating a change of less than
20% between day 9 and day 34), no statistically signif-
icant interactions were recorded. To ensure achievement
of steady state, a two-way ANOVA was used to compare
C min values for quetiapine and its metabolites on days 8
and 9 with values on days 33 and 34.
ResultsIn vitro studies
Quetiapine metabolites formed by human liver
microsomes Four primary metabolites of quetiapineoxidation – quetiapine sulfoxide, 7-hydroxyquetiapine,
and the N- and O-dealkylated products – were formed
after quetiapine incubation with human liver micro-
somes (Figure 2). Structures of metabolites were veri-
fied by using mass spectrometry and by their retention
times on HPLC in comparison with authentic metabolite
standards. The apparent K m values for the microsomal
formation of quetiapine sulfoxide and the 7-hydroxy, N-
desalkyl and O-desalkyl metabolites were estimated at
110, 160, 100, and 170 µM (no assessment of nonspe-
cific microsomal binding as a correction factor), respec-
tively, although the maximum velocity of metabolite
formation (V max) was not achieved for the four reactions
at quetiapine concentrations up to 100 µM (the maxi-
mum concentration tested).
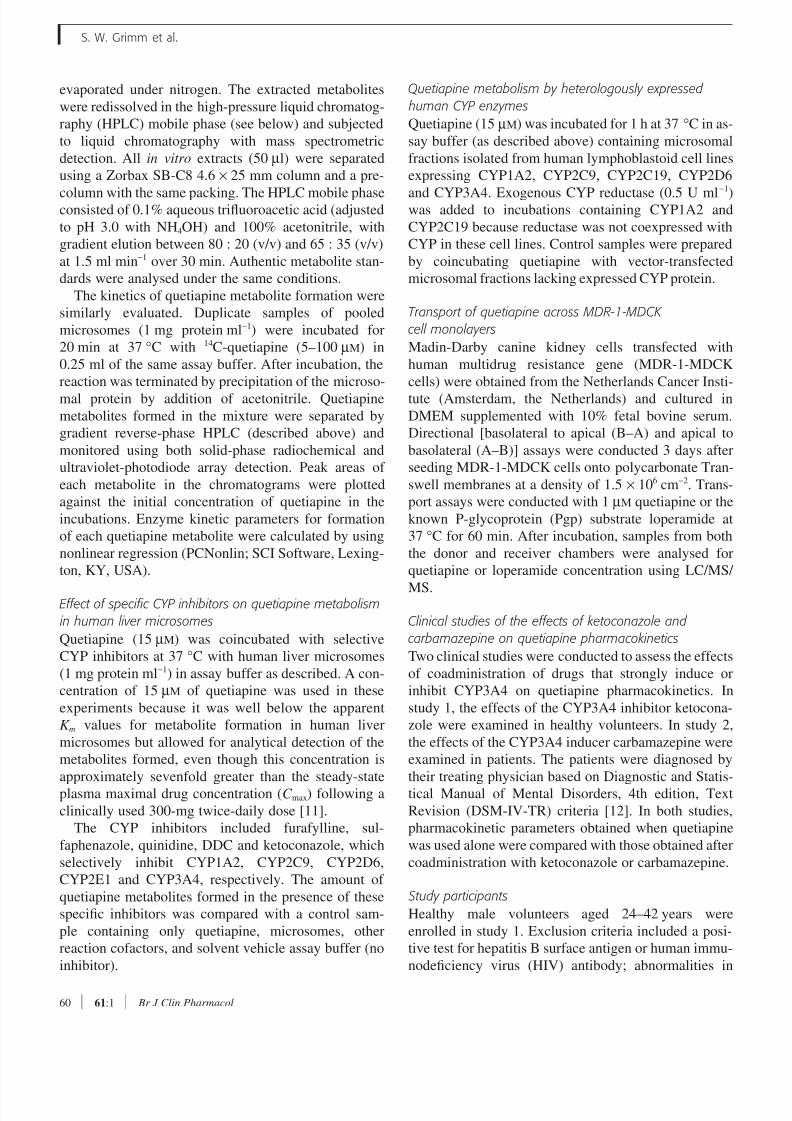
Inhibition of quetiapine metabolism by specific CYP
isoenzyme inhibitors Decreases in quetiapine metabo-
lite formation were observed after coincubation with
CYP2C9, CYP2D6 and CYP3A4 inhibitors (Table 1).
Ketoconazole, a CYP3A4 inhibitor, decreased the
microsomal formation of the sulfoxide metabolite in a
8/8/2019 Effects of Cytochrome P450 3A Modulators Ketoconazole
http://slidepdf.com/reader/full/effects-of-cytochrome-p450-3a-modulators-ketoconazole 6/12
Drug interactions and quetiapine pharmacokinetics
Br J Clin Pharmacol 61:1 63
concentration-dependent manner, with greater than 50%inhibition achieved at 0.02 µM ketoconazole. Ketocon-
azole also decreased the formation of N- and O-desalkyl
metabolites in a concentration-dependent manner,
whereas the 7-hydroxylation pathway was not changed
by more than 10% in a concentration-independent fash-
ion. The substantial inhibition of sulfoxidation and O-
and N-dealkylation pathways by ketoconazole indicated
that CYP3A4 enzymes are primarily responsible for
three of the four metabolic pathways for quetiapine
measured in human liver microsomes.
Quinidine, a potent inhibitor of CYP2D6, had no
effect on the formation of the sulfoxide or dealkylated
metabolites of quetiapine. However, 0.2–5 µM quinidine
decreased formation of 7-hydroxyquetiapine by more
than 50%, suggesting that CYP2D6 may be involved in
7-hydroxyquetiapine formation [8].
Sulfaphenazole, a selective CYP2C9 inhibitor,
reduced formation of all four quetiapine metabolites
when coincubated in human liver microsomes at a high
concentration (100 µM). However, at 5.0 µM, a concen-
tration that substantially decreases the metabolism of
known CYP2C9 substrates [8], sulfaphenazole had little
effect on quetiapine metabolism. Microsomal coincuba-tion with furafylline (up to 25 µM) and DDC (up to
100 µM), inhibitors of CYP1A2 and CYP2E1, had little
effect on quetiapine metabolism.
Quetiapine metabolism by heterologously expressed
human CYP isoenzymes Quetiapine metabolites were
not detected after 1-h incubations of quetiapine with
microsomes from vector-control lymphoblastoid cell
lines or those that expressed CYP1A2, CYP2C9,
CYP2C19 or CYP2E1. In contrast, metabolite profiles
produced when quetiapine was incubated in human liver
microsomes (Figure 2A) were similar to those produced
by expressed CYP3A4 (Figure 2B). Quetiapine sulfox-
ide was the major metabolite formed during incubations
with expressed CYP3A4. The O- and N-desalkyl metab-
olites and detectable amounts of the 7-hydroxy metab-
olite also were formed by expressed CYP3A4. Small
amounts of a secondary O-desalkylsulfoxide metabolite
were identified in both human liver microsomes and
expressed CYP3A4. These findings clearly implicate
CYP3A4 as the major CYP involved in quetiapine
metabolism.
Table 1
Effect of specific CYP inhibitors on quetiapine metabolism in human liver microsomes
Inhibitor
CYP
specificity C ( µM )
Metabolite formation (% control activity)
7-hydroxy Sulfoxide N-dealkyl O-dealkyl
Furafylline CYP1A2 1 103 97 93 95
5 87 97 96 98
25 111 90 93 88
Sulfaphenazole CYP2C9 5 80 86 89 86
25 76 68 71 94
100 41 19 28 46
Quinidine CYP2D6 0.2 74 88 93 87
1 42 79 84 86
5 44 82 77 82
DDC CYP2E1 5 90 85 87 95
25 78 76 84 84
100 82 80 88 105
Ketoconazole CYP3A4 0.02 90 40 72 81
0.1 107 18 49 65
1 91 2 10 28
C, Concentration; CYP, cytochrome P450; DDC, diethyldithiocarbamate. Values represent percentage of metabolite formed during inhibitor coincubations vs. control incubations with no inhibitor present, averages of duplicate determinations.

8/8/2019 Effects of Cytochrome P450 3A Modulators Ketoconazole
http://slidepdf.com/reader/full/effects-of-cytochrome-p450-3a-modulators-ketoconazole 7/12
S. W. Grimm et al.
64 61:1 Br J Clin Pharmacol
Expressed CYP2D6 formed detectable amounts of 7-
hydroxyquetiapine but no other quetiapine metabolites.
This result further corroborated the inhibition of this
pathway in liver microsomes by the CYP2D6 inhibitor
quinidine and confirmed that CYP2D6 is at least par-
tially responsible for quetiapine 7-hydroxylation.
Transport of quetiapine across MDR-1-MDCK cell
monolayers The results of the experiments on transport
of quetiapine across MDR-1-MDCK cell monolayers
expressing human Pgp are shown in Table 2. Quetiapine
was highly permeable in MDR-1-MDCK cell monolay-
ers when incubated in either the apical-to-basolateral or
basolateral-to-apical direction. There was little differ-
ence in flux in either direction (flux ratio =1.2), indicat-
ing that quetiapine is not an efflux substrate of Pgp.
Clinical studies
Demographics In study 1, 12 healthy men (mean age
33 years) were enrolled. All study participants com-
pleted the trial and were included in the pharmacoki-
netic analysis. In study 2, 18 patients (men and women;
mean age 44 years) were enrolled. Patients had diag-
noses of paranoid schizophrenia (n = 4) or schizoaffec-
tive (n = 6) or bipolar disorder (n = 8). Fourteen patients
had complete pharmacokinetic data. Baseline demo-
graphics for both studies are summarized in Table 3.
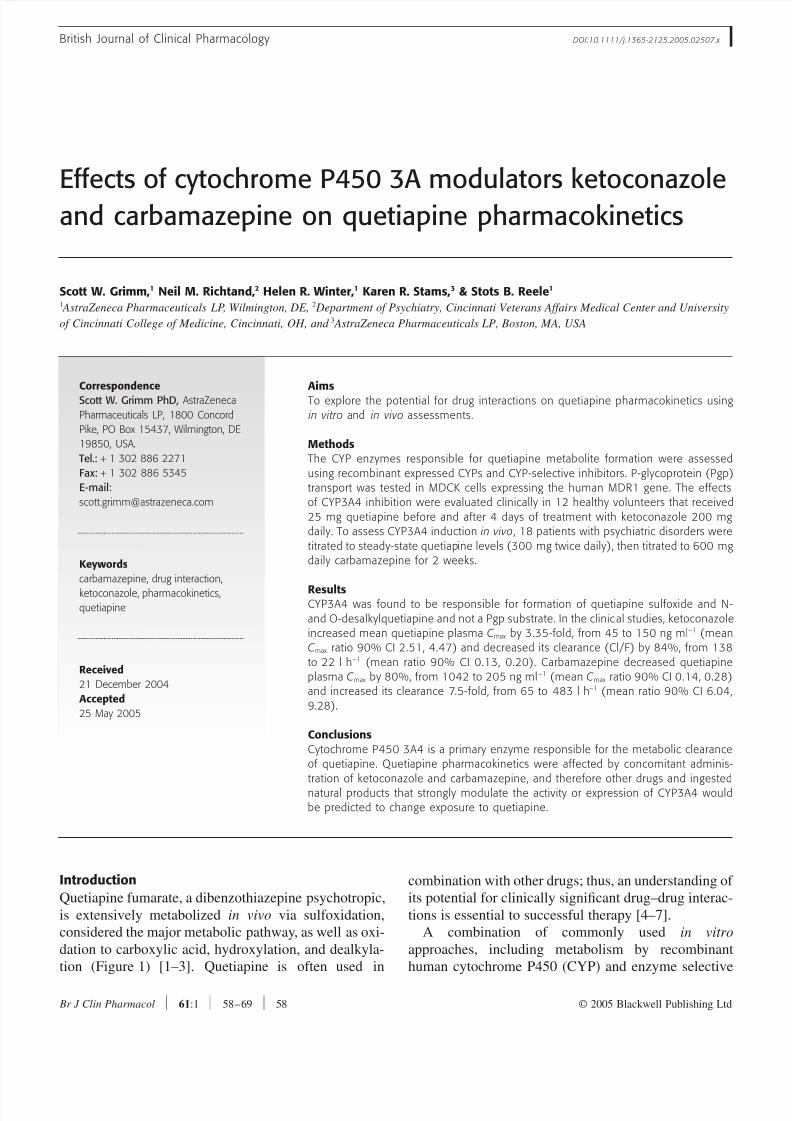
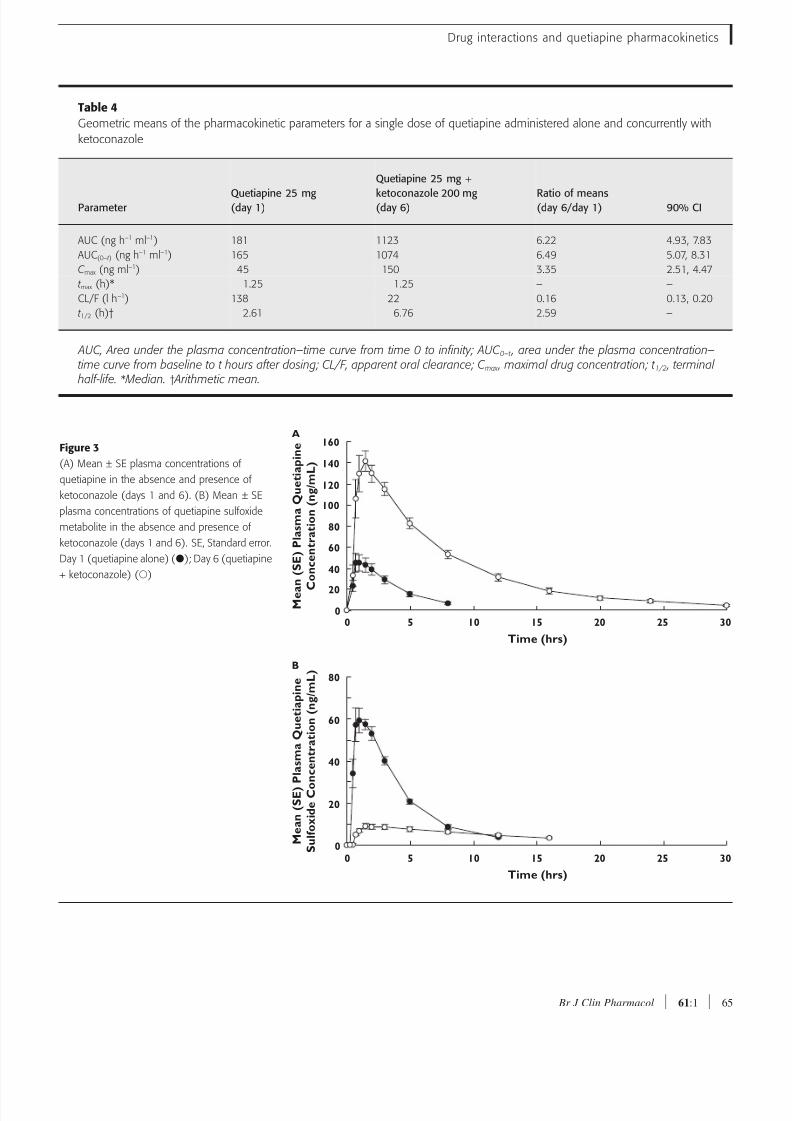
Pharmacokinetic evaluations In study 1, concomitant
use of ketoconazole resulted in substantial increases in
plasma concentrations of quetiapine (Figure 3A). The
mean C max and AUC of quetiapine were increased by
235% and 522%, respectively. Conversely, the geomet-
ric mean AUC and C max of the sulfoxide metabolite were
decreased by 46% and 87%, respectively (Figure 3B).
Mean CL/F of quetiapine was decreased by 84%, and
mean t 1/2 was increased from 2.61 to 6.76 h. Data for all
pharmacokinetic variables are summarized in Table 4.
Table 2
Transport of quetiapine (1 µM) across MDR-1-MDCK cellmonolayers
Papp A→B
(10−6 cm s−1 )
Papp B→A
(10−6 cm s−1 ) Flux ratio
Quetiapine 47.4 ± 1.3 56.2 ± 4.7 1.2
Loperamide 2.13 ± 0.3 48.9 ± 3.7 23.0
A→ B, Apical to basolateral; B→ A, basolateral to apical; MDR-1-MDCK, Madin-Darby canine kidney cells trans-fected with human multidrug resistance gene; P app , appar-ent permeability. Values are the mean standard deviationof triplicates in a single experiment.
Table 3
Demographics and baseline characteristics
Characteristic
Ketoconazole
study ( n = 12)
Carbamazepine
study ( n = 18)
Age, years
Mean (range) 33 (24–42) 44 (29–63)
Sex, n
Men 12 15
Women 0 3
Race/ethnicity, n
White 3 7
Black 9 8
Hispanic 0 3
Mental status, n
Healthy volunteers 12 0
Patients with underlying
psychotic disorder
0 18
Figure 2
(A) Chromatographic profile of quetiapine metabolites formed during
incubation with pooled human liver microsomes. (B) Chromatographic
profile of quetiapine metabolites formed during incubation with
recombinant expressed CYP3A4. AU, Absorbance units
A
10 20
0.00
0.02
0.04
A U
Time (mins)
7 -
H y d r o x y q u e t i a p i n e
O - D e s a l k y l S u l f o x i d e
S u l f o x i d e
N
- D e a l k y l q u e t i a p i n e
O - D e a l k y l q u e t i a p i n e
Q u e t i a p i n e
B
10 20
0.00
0.02
0.04
A U
Time (mins)
7 - H y d r o x y q u e t i a p i n e
S u l f o x i d e
N - D e a l k y l q u e t i a p i n e
O - D e a l k y l q u e t i a p i n e
Q u e t i a p i n e
8/8/2019 Effects of Cytochrome P450 3A Modulators Ketoconazole
http://slidepdf.com/reader/full/effects-of-cytochrome-p450-3a-modulators-ketoconazole 8/12
Drug interactions and quetiapine pharmacokinetics
Br J Clin Pharmacol 61:1 65
Table 4
Geometric means of the pharmacokinetic parameters for a single dose of quetiapine administered alone and concurrently with
ketoconazole
ParameterQuetiapine 25 mg(day 1)
Quetiapine 25 mg +
ketoconazole 200 mg(day 6)
Ratio of means(day 6/day 1) 90% CI
AUC (ng h−1 ml−1) 181 1123 6.22 4.93, 7.83
AUC(0–t ) (ng h−1 ml−1) 165 1074 6.49 5.07, 8.31
C max (ng ml−1) 45 150 3.35 2.51, 4.47
t max (h)* 1.25 1.25 – –
CL/F (l h−1) 138 22 0.16 0.13, 0.20
t 1/2 (h)† 2.61 6.76 2.59 –
AUC, Area under the plasma concentration–time curve from time 0 to infinity; AUC 0–t , area under the plasma concentration–time curve from baseline to t hours after dosing; CL/F, apparent oral clearance; C max , maximal drug concentration; t 1/2 , terminal
half-life. * Median. † Arithmetic mean.
Figure 3
(A) Mean ± SE plasma concentrations of
quetiapine in the absence and presence of
ketoconazole (days 1 and 6). (B) Mean ± SE
plasma concentrations of quetiapine sulfoxide
metabolite in the absence and presence of
ketoconazole (days 1 and 6). SE, Standard error.
Day 1 (quetiapine alone) (); Day 6 (quetiapine
+ ketoconazole) ()
A
10
M e a
n ( S E ) P l a s m a Q u e t i a p i n e
C
o n c e n t r a t i o n ( n g / m L )
Time (hrs)
15 20 25 30500
20
40
60
80
100
120
140
160
B
10
M e a n ( S E ) P l a s m a Q u e t i a p i n e
S u l f o x i d e C o n c e n t r a t i o n ( n g / m L )
Time (hrs)
15 20 25 30500
20
40
60
80
8/8/2019 Effects of Cytochrome P450 3A Modulators Ketoconazole
http://slidepdf.com/reader/full/effects-of-cytochrome-p450-3a-modulators-ketoconazole 9/12
S. W. Grimm et al.
66 61:1 Br J Clin Pharmacol
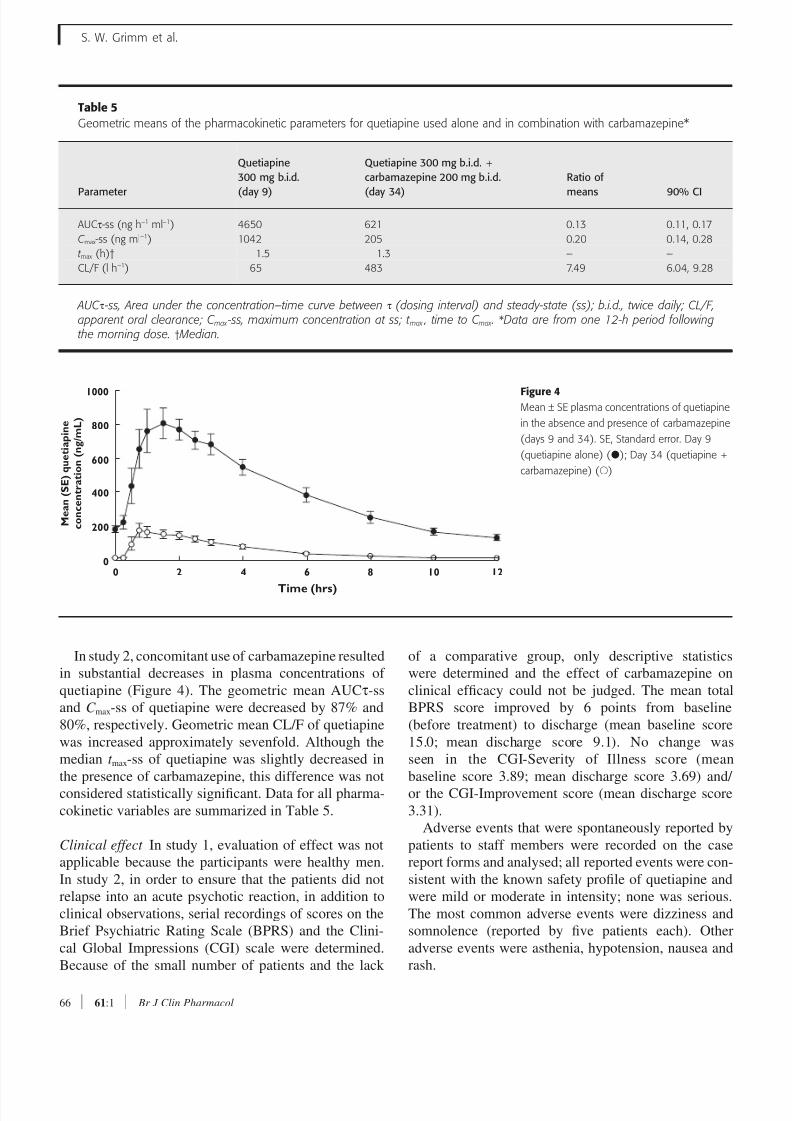
In study 2, concomitant use of carbamazepine resulted
in substantial decreases in plasma concentrations of
quetiapine (Figure 4). The geometric mean AUCτ-ss
and C max-ss of quetiapine were decreased by 87% and
80%, respectively. Geometric mean CL/F of quetiapine
was increased approximately sevenfold. Although the
median t max-ss of quetiapine was slightly decreased in
the presence of carbamazepine, this difference was not
considered statistically significant. Data for all pharma-
cokinetic variables are summarized in Table 5.
Clinical effect In study 1, evaluation of effect was not
applicable because the participants were healthy men.
In study 2, in order to ensure that the patients did not
relapse into an acute psychotic reaction, in addition to
clinical observations, serial recordings of scores on the
Brief Psychiatric Rating Scale (BPRS) and the Clini-
cal Global Impressions (CGI) scale were determined.
Because of the small number of patients and the lack
of a comparative group, only descriptive statistics
were determined and the effect of carbamazepine on
clinical efficacy could not be judged. The mean total
BPRS score improved by 6 points from baseline
(before treatment) to discharge (mean baseline score
15.0; mean discharge score 9.1). No change was
seen in the CGI-Severity of Illness score (mean
baseline score 3.89; mean discharge score 3.69) and/
or the CGI-Improvement score (mean discharge score
3.31).
Adverse events that were spontaneously reported by
patients to staff members were recorded on the case
report forms and analysed; all reported events were con-
sistent with the known safety profile of quetiapine and
were mild or moderate in intensity; none was serious.
The most common adverse events were dizziness and
somnolence (reported by five patients each). Other
adverse events were asthenia, hypotension, nausea and
rash.
Table 5
Geometric means of the pharmacokinetic parameters for quetiapine used alone and in combination with carbamazepine*
Parameter
Quetiapine
300 mg b.i.d.
(day 9)
Quetiapine 300 mg b.i.d. +
carbamazepine 200 mg b.i.d.
(day 34)
Ratio of
means 90% CI
AUCτ-ss (ng h−1 ml−1) 4650 621 0.13 0.11, 0.17
C max-ss (ng ml−1) 1042 205 0.20 0.14, 0.28
t max (h)† 1.5 1.3 – –
CL/F (l h−1) 65 483 7.49 6.04, 9.28
AUC τ -ss, Area under the concentration–time curve between τ (dosing interval) and steady-state (ss); b.i.d., twice daily; CL/F,apparent oral clearance; C max -ss, maximum concentration at ss; t max , time to C max . *Data are from one 12-h period followingthe morning dose. † Median.
Figure 4Mean ± SE plasma concentrations of quetiapine
in the absence and presence of carbamazepine
(days 9 and 34). SE, Standard error. Day 9
(quetiapine alone) (); Day 34 (quetiapine +
carbamazepine) ()
4
M e a n ( S E ) q u e t i a p i n e
c o n c e n t r a t i o n ( n g / m L )
Time (hrs)
6 8 10 12200
1000
200
400
600
800
8/8/2019 Effects of Cytochrome P450 3A Modulators Ketoconazole
http://slidepdf.com/reader/full/effects-of-cytochrome-p450-3a-modulators-ketoconazole 10/12
Drug interactions and quetiapine pharmacokinetics
Br J Clin Pharmacol 61:1 67
Discussion
Four quetiapine metabolites were formed by pooled
human liver microsomes: the 7-hydroxyl, sulfoxide and
N- and O-desalkyl metabolites. In vivo studies, reviewed
by DeVane and Nemeroff [13], have identified at least
10 measurable metabolites of quetiapine, although many
of these are secondary oxidative or conjugated metabo-lites of the primary metabolite species seen in the in
vitro microsomal experiments.
Taken together, our in vitro results with specific CYP
inhibitors and the heterologously expressed CYP
forms demonstrated that CYP3A4 is a major enzyme
responsible for quetiapine metabolism, and that 7-
hydroxylation, a minor metabolic pathway in vivo, is
also catalysed by CYP2D6. Other CYP enzymes
probably do not contribute substantially to quetiapine
clearance. However, many substrates for CYP3A4 are
also CYP3A5 substrates [14]. CYP3A5 may metabolize
quetiapine similarly to CYP3A4, although we did not
specifically evaluate this or other minor CYPs in this
study.
Based on the moderate inhibition by sulfaphenazole
at relatively high concentrations, a contribution to all
quetiapine metabolic pathways by CYP2C9 cannot be
ruled out. However, no inhibition of quetiapine metab-
olism was observed when coincubated in human liver
microsomes at concentrations that substantially de-
crease the metabolism of known CYP2C9 substrates [8],
and incubations with recombinant CYP2C9 did not
form detectable metabolites.Our in vitro findings suggested that concurrent admin-
istration of quetiapine with drugs that induce or inhibit
CYP3A4-mediated metabolism would be more likely to
alter quetiapine pharmacokinetics than drugs affecting
other CYP enzymes. Therefore, the two clinical studies
were undertaken to determine if the pharmacokinetics
of quetiapine would be altered by concomitant admin-
istration of strong CYP3A4 inhibitors or inducers. These
studies demonstrated that coadministration with keto-
conazole or carbamazepine substantially altered the
pharmacokinetic profile of quetiapine.
Concurrent administration of quetiapine with the
CYP3A4 inhibitor ketoconazole in vivo increased
plasma concentrations of quetiapine, with increases in
the mean C max and AUC exceeding twofold and fivefold,
respectively. The finding of a substantially increased
AUC and C max is consistent with significant first-pass
metabolism and hepatic clearance of quetiapine by
CYP3A4. In this study, an 84% reduction in quetiapine
clearance paralleled the increases in both C max and AUC.
Because quetiapine was given as a single low dose
(25 mg), no adverse events were expected in the study
participants despite exposure to increased plasma con-
centrations of quetiapine.
Results of both clinical studies are consistent with the
in vitro data predicting CYP3A4 as the primary CYP
enzyme for quetiapine and with an earlier pharmacoki-
netic interaction study in humans treated with pheny-
toin, another inducer of CYP3A4 [15].In the quetiapine–ketoconazole interaction study
(study 1), a low dose of quetiapine was used because
the study was performed in healthy volunteers. A low
dose was believed to be scientifically appropriate
because quetiapine is known to have linear pharmacok-
inetics at doses approved for use in the clinic. High
doses of quetiapine in healthy volunteers are associated
with considerable sedation, with a risk of developing
symptomatic hypotension.
However, in clinical practice in patients with psychi-
atric illness, quetiapine is administered at substantially
higher dosages (up to 750 mg day−1) [16, 17]. Ketocon-
azole has been shown to decrease the clearance and thus
potentially increase adverse effects associated with
many drugs that are CYP3A substrates [9, 18, 19],
including midazolam [20], triazolam [21, 22], zolpidem
[23] and tacrolimus [24]. Ketoconazole has also been
shown to inhibit Pgp [25] and may cause interactions
with drugs that are Pgp substrates. In addition, Boulton
et al. [26] suggested that quetiapine was a substrate for
Pgp in an in vitro study that assessed the stimulation of
adenosine triphosphatase activity in membranes with
expressed Pgp. We showed here using monolayer assaysin cells expressing Pgp that quetiapine is not a substrate
of this transporter and therefore the effects of ketocon-
azole on quetiapine pharmacokinetics are likely to be
due to inhibition of its metabolic elimination. Therefore,
plasma concentrations of quetiapine, when administered
in usual clinical doses concurrently with ketoconazole
or another strong CYP3A4 inhibitor, would be expected
to increase substantially compared with those of que-
tiapine given alone. Likewise, drinking grapefruit juice
during treatment with quetiapine may be expected to
increase exposure to the drug owing to inactivation of
intestinal CYP3A4 [27].
Coadministration of carbamazepine led to a signifi-
cant decrease in the steady-state plasma concentrations
of quetiapine. These results demonstrate that concur-
rent administration of quetiapine with a strong
CYP3A4 inducer can lead to a significant increase in
quetiapine metabolism and, potentially, a loss of clini-
cal efficacy. Possibly because of the short duration of
this study and the fact that patients were in clinical
remission before enrolment, no loss of quetiapine effi-
cacy was observed.
8/8/2019 Effects of Cytochrome P450 3A Modulators Ketoconazole
http://slidepdf.com/reader/full/effects-of-cytochrome-p450-3a-modulators-ketoconazole 11/12
S. W. Grimm et al.
68 61:1 Br J Clin Pharmacol
Conclusions
The in vitro and clinical studies described here demon-
strate that clinically important pharmacokinetic changes
may occur when drugs that potently modulate the
expression or activity of CYP3A4 enzymes are admin-
istered concurrently with quetiapine. Patients with
severe mental illness typically require long-term treat-ment with antipsychotic medication, often in con-
junction with other psychotropic drugs [6] or with
nonpsychiatric medications. In addition to ketoconazole
and carbamazepine, other drugs that induce or inhibit
CYP3A4 (e.g. rifampin, ritonavir) could affect quetiap-
ine exposure, efficacy and adverse event profile. If con-
comitant use of drugs that potently change CYP3A4
activity is necessary in patients treated with quetiapine,
clinicians should monitor their patients for signs of
adverse effects or decreased efficacy and titrate dosages
accordingly.
We thank Dr Liyue Huang for providing the Pgp results.
Financial and editorial support for this work was pro-
vided by AstraZeneca Pharmaceuticals LP.
References1 Markowitz JS, Brown CS, Moore TR. Atypical antipsychotics. Part
I: pharmacology, pharmacokinetics, and efficacy. Ann
Pharmacother 1999; 33: 73–85.
2 Goren JL, Levin GM. Quetiapine, an atypical antipsychotic.
Pharmacotherapy 1998; 18: 1183–94.3 Seroquel (quetiapine fumarate, AstraZeneca
Pharmaceuticals LP, Wilmington, DE). Full prescribing information,
2004.
4 Prior TI, Chue PS, Tibbo P, Baker GB. Drug metabolism and
atypical antipsychotics. Eur Neuropsychopharmacol 1999; 9:
301–9.
5 Tanaka E, Hisawa S. Clinically significant pharmacokinetic drug
interactions with psychoactive drugs: antidepressants and
antipsychotics and the cytochrome P450 system. J Clin Pharm
Ther 1999; 24: 7–16.
6 Brown CS, Markowitz JS, Moore TR, Parker NG. Atypical
antipsychotics: Part II. Adverse effects, drug interactions, and costs.Ann Pharmacother 1999; 33: 210–7.
7 Bertz RJ, Granneman GR. Use of in vitro and in vivo data to
estimate the likelihood of metabolic pharmacokinetic interactions.
Clin Pharmacokinet 1997; 32: 210–58.
8 Newton DJ, Wang RW, Lu AYH. Cytochrome P450 inhibitors:
evaluation of specificities in the in vitro metabolism of therapeutic
agents by human liver microsomes. Drug Metab Dispos 1995;
23: 154–8.
9 Bjornsson T, Callaghan JT, Einolf HJ, Fischer V, Gan L, Grimm SW,
Kao J, King SP, Miwa G, Ni L, Kumar G, McLeod J, Obach RS,
Roberts S, Roc A, Shah A, Snikeris F, Sullivan JT, Tweedie D, Vega
J, Walsh J, Wrighton SA. The conduct of in vitro and in vivo drug–
drug interaction studies: a Pharmaceutical Research and
Manufacturers of America (PhRMA) perspective. Drug Metab
Dispos 2003; 31: 815–32.
10 Grimm SW, Dyroff MC. Inhibition of human drug metabolizing
cytochromes P450 by anastrozole, a potent and selective
inhibitor of aromatase. Drug Metab Dispos 1997; 25:
598–602.
11 Potkin SG, Thyrum PT, Alva G, Bera R, Yeh C, Arvanitis LA. The
safety and pharmacokinetics of quetiapine when coadministered
with haloperidol, risperidone, or thioridazine. J Clin
Psychopharmacol 2002; 22: 121–30.
12 American Psychiatric Association. Diagnostic and Statistical Manual
of Mental Disorders, 4th edn. Text Revision. Washington, DC:
American Psychiatric Association, American Psychiatric
Press 2000.
13 DeVane CL, Nemeroff CB. Clinical pharmacokinetics of quetiapine:
an atypical antipsychotic. Clin Pharmacokinet 2001; 40:
509–22.
14 Williams JA, Ring BJ, Cantrell VE, Jones DR, Eckstein J, Ruterbories
K, Hamman MA, Hall SD, Wrighton SA. Comparative metabolic
capabilities of CYP3A4, CYP3A5, and CYP3A7. Drug Metab Dispos
2002; 30: 883–91.
15 Wong YWJ, Ewing BJ, Thyrum PT, Yeh C. The effect of phenytoin
and cimetidine on the pharmacokinetics of Seroquel. Schizophr
Res 1997; 24: 200–1.
16 McConville B, Carrero L, Sweitzer D, Potter L, Chaney R, Foster K,
Sorter M, Friedman L, Browne K. Long-term safety, tolerability, and
clinical efficacy of quetiapine in adolescents: an open-label
extension trial. J Child Adolesc Psychopharmacol 2003; 13: 75–
82.17 Shaw JA, Lewis JE, Pascal S, Sharma RK, Rodriguez RA, Guillen R,
Pupo Guillen M. A study of quetiapine: efficacy and tolerability in
psychotic adolescents. J Child Adolesc Psychopharmacol 2001;
11: 415–24.
18 Venkatakrishnan K, von Moltke LL, Greenblatt DJ. Effects of the
antifungal agents on oxidative drug metabolism: clinical relevance.
Clin Pharmacokinet 2000; 38: 111–80.
19 Albengres E, Le Louet H, Tillement JP. Systemic antifungal agents.
Drug interactions of clinical significance. Drug Saf 1998; 18: 83–97.
20 Olkkola KT, Backman JT, Neuvonen PJ. Midazolam should be
avoided in patients receiving the systemic antimycotics
ketoconazole or itraconazole. Clin Pharmacol Ther 1994; 55:481–5.
21 Varhe A, Olkkola KT, Neuvonen PJ. Oral triazolam is potentially
hazardous to patients receiving the systemic antimycotics
ketoconazole or itraconazole. Clin Pharmacol Ther 1994; 56 (6
Part 1): 601–7.
22 von Moltke LL, Greenblatt DJ, Harmatz JS, Duan SX, Harrel LM,
Cotreau-Bibbo MM, Pritchard GA, Wright CE, Shader RI. Triazolam
biotransformation by human liver microsomes in vitro: effects of
metabolic inhibitors and clinical confirmation of a predicted
interaction with ketoconazole. J Pharmacol Exp Ther 1996; 276:
370–9.
8/8/2019 Effects of Cytochrome P450 3A Modulators Ketoconazole
http://slidepdf.com/reader/full/effects-of-cytochrome-p450-3a-modulators-ketoconazole 12/12