Embed Size (px)
Citation preview
EFFECTS OF DIETARY PHYSICAL FORM AND CARBOHYDRATE PROFILE ON
CAPTIVE GIRAFFE
By
CELESTE C. KEARNEY
A THESIS PRESENTED TO THE GRADUATE SCHOOL OF THE UNIVERSITY OF FLORIDA IN PARTIAL FULFILLMENT
OF THE REQUIREMENTS FOR THE MASTER OF SCIENCE
UNIVERSITY OF FLORIDA
2005
Copyright 2005
by
Celeste C. Kearney

This work is dedicated, with gratitude, to the Maker of all living things.
This thesis is dedicated to my family, near and far.
It is especially dedicated to My father, who shared his deep, abiding sense of respect and wonder for all Creation
My mother, who encouraged me to pursue my goals and fight for what I believe My siblings, natural and “adopted,” who offered love and support
My nieces and nephews, a constant source of joy and pride And most of all my loving husband,
Who made me complete.
iv
ACKNOWLEDGMENTS
This research was a team effort. The development and execution of this study
would not have been possible without the generous contributions of numerous
individuals. My sincerest thanks go out to my committee chair, Dr. Mary Beth Hall, and
committee members, Drs. Ellen Dierenfeld, Lee McDowell, and Charles Staples, for
assistance and instruction throughout my graduate program, and for taking a chance on an
unusual project; Busch Entertainment Corporation, for permitting and sponsoring the
study; Dr. Ray Ball, Giraffe SSP Veterinary Advisor, for initial instruction in giraffe
health and nutrition, and continued selfless assistance through all phases of this research;
Dr. Ramon Littell, University of Florida Statistics Department, for assistance with
statistical design of the study; Dr. Judy St. Ledger, BEC Director of Veterinary
Pathology, for encouragement and considerable intellectual contributions; the preceding
researchers who have taken an interest in the nutrition of captive concentrate selectors,
particularly Dr. Marcus Clauss, for his literature donations and thoughtful e-mail
discussions; Heidi Bissell, Amanda Dinges and Marti Roberson, for volunteer giraffe
observations; Kellie and the Robersons, for food, housing and helpful distractions during
the study; Alexandra Amorocho, Heidi Bissell, Faith Cullens, Colleen Larson, and
especially Lucia Holtshausen and Ashley Hughes, students of the UF Dairy Nutrition
Lab, for assistance with feed mixing and laboratory analyses; John Funk, Jocelyn
Jennings, Jan Kivipelto, Sergei Sennikov and Nancy Wilkinson, UF Animal Sciences
technicians, for training and assistance with sample preparation and laboratory analyses;
v
and the staff of the UF Dairy Research Unit (Hague, FL), for assistance in mixing the
experimental ration. Last but certainly far from least, I would like to acknowledge and
thank the following staff at Busch Gardens, Tampa: Chris Bliss, for passing along the
knowledge and experience of generations; Chris Allen, Joaquin Alonso, Kellie Anderson,
Kathy Driggers, James Hammerton, Brian Hart, Waylon Kerr, Chris Merrifield, Charles
Moss, Jennifer Phelps, April Richardson, Pandora Sokol, Bobby Toomy and Jerry
Washburn, hoofstock keepers, for long days and late nights of hard work during the
collection phase of this labor-intensive study; Richard Baker, Alan Cross, Cindy Davis,
Andrea Demuth, Joe Devlin, Dr. John Olsen and Glenn Young, zoo and hoofstock
management, for logistical coordination and providing the essential animal, facility, and
labor resources; Dr. Mike Burton, Dr. Genevieve Demonceaux, Heather Henry, Ian
Hutchinson, Cliff Martel and Mary Port, veterinary and hospital staff, for assistance with
sample collection and analysis; and the entire Busch Gardens Zoo staff, for their ongoing
commitment to animal care, and for their thoughts, assistance and encouragement during
this project.

vi
TABLE OF CONTENTS page
ACKNOWLEDGMENTS ................................................................................................. iv
LIST OF TABLES........................................................................................................... viii
LIST OF FIGURES .............................................................................................................x
ABSTRACT....................................................................................................................... xi
CHAPTER
1 INTRODUCTION ........................................................................................................1
2 REVIEW OF THE LITERATURE ON DIETARY PHYSICAL FORM AND CARBOHYDRATE PROFILE IN RUMINANT DIETS ............................................8
Physical Form ...............................................................................................................8 Effects of Particle Size on Mastication, Saliva Flow, and Ruminal pH................9 Effects of Particle Size on Digesta Passage, Intake, and Fermentation ..............13 Potential Implications of peNDF for Captive Giraffe .........................................18
Dietary Carbohydrate Profile......................................................................................20 Carbohydrate Fractions .......................................................................................20
Proximate analysis system ...........................................................................21 Detergent system ..........................................................................................21
Carbohydrates in Natural CS Diets .....................................................................21 Effects of NFC Source on Fermentation Characteristics and Animal
Performance .....................................................................................................24 Interaction Between Dietary Components...........................................................28 Potential Implications of Dietary NFC Profile for Captive Giraffe ....................29
3 EFFECTS OF ALTERING THE PHYSICAL FORM AND CARBOHYDRATE PROFILE OF THE DIET ON CAPTIVE GIRAFFE.................................................36
Introduction.................................................................................................................36 Materials and Methods ...............................................................................................38
Design..................................................................................................................38 Giraffe..................................................................................................................39
vii
Facilities ..............................................................................................................39 Diets.....................................................................................................................40 Sample Collection and Analyses .........................................................................41
Feedstuffs and intake....................................................................................41 Fecal collection and analysis........................................................................43 Behavior .......................................................................................................45 Body weight and blood samples...................................................................46 Statistical analysis ........................................................................................47
Results and Discussion ...............................................................................................47 Intake ...................................................................................................................48 Digestibility .........................................................................................................49 Behavior ..............................................................................................................51 Blood Measures ...................................................................................................53 Ancillary Study Observations / Individual Animal Effects.................................54 Diet Selection ......................................................................................................56 Conclusions .........................................................................................................58
APPENDIX
A INDIVIDUAL ANIMAL MEASURES .................................................................... 68
B CARBOHYDRATE FRACTIONING IN FEEDSTUFFS.........................................80
C INFORMATION ON CONTROL DIET COMPOSITION AND BEHAVIOR RECORDING.............................................................................................................81
LIST OF REFERENCES...................................................................................................84
BIOGRAPHICAL SKETCH .............................................................................................94
viii
LIST OF TABLES
Table page 2-1 Effects of particle size of alfalfa-based dairy cow diets on chewing activity and
ruminal pH................................................................................................................32
2-2 Effects of concentrate level and feeding management on ruminal pH of lactating dairy cows. ...............................................................................................................32
2-3 Effects of forage particle size and grain fermentability on chewing activity, ruminal pH, and ruminal VFA profile in midlactation cows. ..................................33
2-4 Nutrient intake and digestion coefficients from giraffe fed all-hay diets.................33
2-5 Chemical composition (DM basis) of five browse plants grown at Busch Gardens in Tampa, Florida.......................................................................................34
2-6 Influence of supplemental carbohydrate source fed in combination with 0.122% BW/ day of degradable intake protein on ruminal fermentation characteristics. ..........................................................................................................35
3-1 Design of study.........................................................................................................59
3-2 Chemical composition of alfalfa hay and supplements (dry matter basis) fed to captive giraffe, and difference between supplements. .........................................60
3-3 Effects of dietary treatment on mean daily dry matter and nutrient intake, digestion of organic matter and crude protein (apparent) and NDFOM (true), body weight gain and body condition score.............................................................60
3-4 Effect of diet on fecal nutrient composition (dry matter basis)................................61
3-5 Recorded behavior of captive giraffe consuming different supplements.................62
3-6 Percentage of time female giraffe spent engaged in oral behaviors.........................62
3-7 Effects of type of dietary supplement on giraffe blood parameters. ........................62
3-8 Pearson Correlation Coefficients for correlations of blood glucose and BUN with kilograms of nutrients consumed and digested. ...............................................64
ix
3-9 Pearson Correlation Coefficients for correlations of blood glucose and BUN with various blood proteins. .....................................................................................64
A-1 Individual giraffe voluntary intake (DM basis)........................................................68
A-2 Individual giraffe nutrient intake (kg) (DM basis)...................................................69
A-3 Individual giraffe fecal output, fecal nutrient concentration (% of DM), and apparent nutrient digestibility (%)............................................................................70
A-4 Differences in crude protein concentration of individual fecal samples analyzed in wet and dried forms..............................................................................................71
A-5 Minutes over 48 hours individual giraffe spent engaged in measured behaviors. ...72
A-6 Individual giraffe blood values on day 21................................................................74
A-7 Body weight and body condition score of individual giraffe on days 1 and 21 of each period. ..............................................................................................................77
B-1 NDF and NFC fractions (percent of sample DM) in feedstuffs analyzed at the University of Florida. ...............................................................................................80
C-1 Mean analyzed chemical composition of the batches of Purina Omelene 200 (n=5) and Mazuri Browser Breeder (n=5) fed to captive giraffe during a giraffe feeding study. ...........................................................................................................81
C-2 Behavioral category definitions used by observers when recording giraffe behaviors. .................................................................................................................82
x
LIST OF FIGURES
Figure page 3-1 Number of minutes over 48 hours individual giraffe spent engaged in specific
and total oral stereotype behavior. ...........................................................................65
3-2 Blood concentrations of non-esterified fatty acids in individual giraffe..................66
A-1 Individual animal consumption of alfalfa hay and supplement as a percentage of body weight ..............................................................................................................78
A-2 Individual animal digestion of neutral detergent fiber organic matter (NDFOM), and apparent digestion of OM and CP. ....................................................................79
B-1 Carbohydrate partitioning. (Hall, 2001) ..................................................................80
C-1 Example of data sheet used to record giraffe behavior. ...........................................83
xi
Abstract of Thesis Presented to the Graduate School
of the University of Florida in Partial Fulfillment of the Requirements for the Master of Science
EFFECTS OF DIETARY PHYSICAL FORM AND CARBOHYDRATE PROFILE ON CAPTIVE GIRAFFE
By
Celeste C. Kearney
May, 2005
Chair: Mary Beth Hall Major Department: Animal Sciences
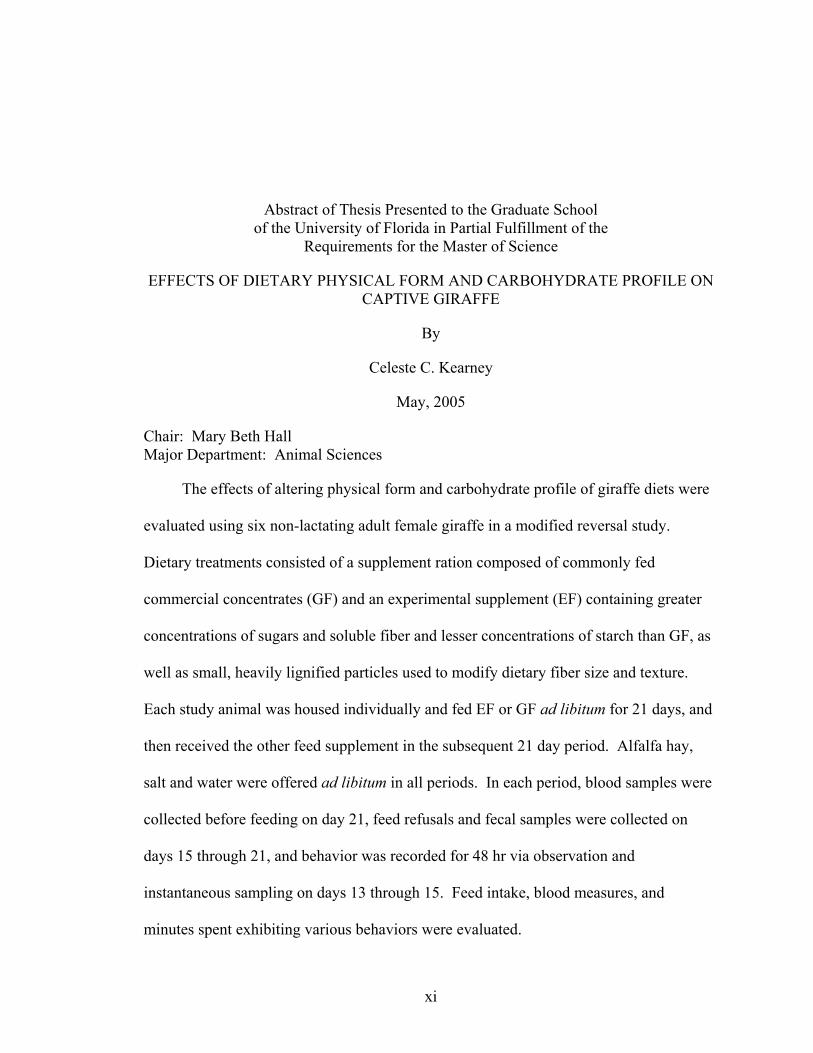
The effects of altering physical form and carbohydrate profile of giraffe diets were
evaluated using six non-lactating adult female giraffe in a modified reversal study.
Dietary treatments consisted of a supplement ration composed of commonly fed
commercial concentrates (GF) and an experimental supplement (EF) containing greater
concentrations of sugars and soluble fiber and lesser concentrations of starch than GF, as
well as small, heavily lignified particles used to modify dietary fiber size and texture.
Each study animal was housed individually and fed EF or GF ad libitum for 21 days, and
then received the other feed supplement in the subsequent 21 day period. Alfalfa hay,
salt and water were offered ad libitum in all periods. In each period, blood samples were
collected before feeding on day 21, feed refusals and fecal samples were collected on
days 15 through 21, and behavior was recorded for 48 hr via observation and
instantaneous sampling on days 13 through 15. Feed intake, blood measures, and
minutes spent exhibiting various behaviors were evaluated.
xii
Data were analyzed with a statistical model that included animal, period, and diet.
Data presented are least squares means. Significance was declared at P<0.10 and
tendency at 0.10<P<0.15. Blood glucose (mg/dl) was lower in animals consuming EF
than GF. Average daily DM intake varied greatly among animals for both alfalfa hay
(0.12 to 3.94 kg/day) and supplement (2.87 to 9.26 kg/day), but did not differ between
diets. Starch intake by giraffe decreased from 0.92 kg/day on GF to 0.12 kg/ day EF,
sugar intake tended (P=0.115) to increase from 1.12 kg/day on GF to 1.53 kg/day on EF,
and neutral detergent-soluble fiber (NDSF) intake increased from 0.85 kg/day on GF to
1.19 kg/day on EF. Time engaged in supplement consumption was greater on EF than
GF and total feed consumption + rumination time tended to be greater on EF than GF,
which may have increased saliva flow and buffering of the rumen. Despite few animals
and high variability in their feed selection and intake, the data suggest that EF facilitated
small but measurable changes in animal response. Further investigation with a larger
population of animals is needed.
1
CHAPTER 1 INTRODUCTION
Numerous health problems that are suspected to be of nutritional origin have been
documented in captive giraffe. Pathologies that may relate to vitamin and mineral intake
or metabolism include white muscle disease (Strafuss, 1973; Burton, 1990), urolithiosis
(Wolfe et al., 2000), and dental disease (Enqvist, 2003). Pancreatic pathologies ( Fox,
1938; Fowler, 1978; Lechowski et al., 1991; Ball et al., 2002), decreased ruminal
absorptive surface area (Hofmann and Matern, 1988), ruminal acidosis (Clauss, 1998;
Clauss et al., 2002b), fermentative gastritis or rumenitis (Fox, 1938; Ball et al., 2002) and
gastrointestinal ulceration (Fox, 1938; Fowler, 1978) also have been documented. First-
year calf mortality may be as high as 45% (Lackey and LaRue, 1997). Failure of passive
transfer (Miller et al., 1996), calf mortality due to poor milk intake (Flach et al., 1997),
and anecdotal reports of calf mortality or hand-rearing due to “maternal failure” may
relate to low colostrum and milk production due to poor nutritional status of giraffe dams.
Wasting and sudden death (Fox, 1938; Chaffe, 1968; Fowler, 1978; Strandberg et al.,
1984; Junge and Bradley, 1993; Flach et al., 1997; Ball et al., 2002) are frequently
reported in the literature and anecdotally. At this time, the true proportion of captive
giraffe mortality caused by nutritional pathologies is unknown.
The term “Peracute Mortality Syndrome” (PMS) was used to describe giraffe
wasting/ sudden death by Dr. Murray Fowler in 1978, following four cases of sudden
death at the Sacramento Zoo. Concurrent disease (tuberculosis, treated with isoniazid
powder) occurred in all four giraffe; weight loss despite reportedly adequate intake and
2
recent (less than one month prior to death) parturition occurred in two animals.
Necropsies were performed on three of the four animals. Absence of perirenal fat and
generalized serous atrophy of adipose tissue (3 of 3 giraffe) and marked pancreatic
atrophy (2 of 3) were notable findings. In a subsequent survey, 14 of 42 responding
institutions reported unexplained deaths of giraffe or submitted necropsy reports listing
findings consistent with the Sacramento Zoo cases. Peracute death, emaciation,
concurrent disease or stress episode, serous atrophy of adipose tissue, pulmonary edema
and trachial froth, petechial hemorrhage of serosal surfaces, and gastrointestinal
ulceration were common findings.
Fowler hypothesized that both chronic predisposing factors and acute trigger
episodes contributed to the occurrence of PMS. Based on the information available at the
time, chronic protein or energy deficiencies were listed as the most likely predisposing
factors. It was recommended that giraffe be offered low fiber diets containing 15 to 18%
CP for adult non-lactating animals, and 18 to 20% CP for calves and lactating cows.
However, a 1993 follow-up study by Junge and Bradley reported nine additional cases of
PMS in giraffe offered diets meeting these protein recommendations.
Chronic energy deficiency has again come under scrutiny as a possible
predisposing factor for PMS (Ball et al., 2002). Consistent findings of depletion and
serous atrophy of adipose tissue stores (Fox, 1938; Chaffe, 1968; Strafuss and Kennedy,
1973; Fowler, 1978; Strandberg et al., 1984; Junge and Bradley, 1993; Ball et al., 2002)
are indicative of negative energy balance. When energy expenditure exceeds available
dietary energy, a catabolic state occurs, and body reserves are mobilized. Once body fat
stores are excessively depleted, rapid catabolism of even the smallest amounts of adipose
3
tissue takes place in an attempt to meet energy demands. The result is serous atrophy of
adipose tissue (Smith et al., 1972).
Acute energy deficiency has been proposed as an immediate cause of death in
giraffe PMS. Ball et al. (2002) reported on the rapid wasting and mortality of two female
giraffe (A and B) during the third trimester of first pregnancy. Ante- and post- mortem
findings were consistent with PMS. Histopathologic findings included serous atrophy of
mesenteric and epicardial fat, lymphohistiocytic rumenitis and pulmonary congestion in
both cases. Pancreatic atrophy and generalized muscle atrophy were also noted in giraffe
B. Blood glucose concentrations were 20 mg/dl at the time of death in giraffe A, and 3
mg/dl at 5 hours post-mortem in giraffe B. Hypoglycemia, caused by depletion of body
reserves followed by an acute stressor (parturition), was proposed as the immediate cause
of death. Since this publication, blood samples collected within 20 minutes of death have
revealed glucose levels of 6 and 12 mg/dl in two giraffe succumbing to PMS, and 297
mg/dl at less than 1 hour post-mortem in a giraffe expiring from an observed cervical
injury (R. Ball, personal communications).
It should be noted that endemic pathologies of unknown or suspected nutritional
origin are not isolated to captive giraffe. Wasting and mortality from unknown causes,
and from digestive pathologies, have been reported in other captive concentrate selectors
(CS) (Paglia and Miller, 1992; Shochat et al., 1997; Dierenfeld et al., 2000; Clauss et al.,
2002a; Willette et al., 2002). High (30 to 40% in some collections) neonatal mortality,
wasting syndrome, ruminal hypomotility syndrome, bloat, and rumenitis have been
described as prevalent but underreported in captive duikers (Willette et al., 2002), and
hand-rearing, diet modification, and browse supplementation were among factors
4
associated with improved health and increased (up to 2x) lifespan in one institution
(Barnes et al., 2002). Moose, the second largest ruminant concentrate selector (CS), are
rarely exhibited in zoos because of premature mortality (Shochat et al., 1997). Moose
“wasting syndrome complex,” a syndrome of suspected nutritional origin, was the
diagnosed cause of death in 47% of 131 adult mortalities (Clauss et al., 2002a). Sudden
death, frequently attributed to digestive disorders such as ruminal acidosis and bloat, is a
common occurrence in feedlot cattle (Glock and DeGroot, 1998).
While the importance of nutrition in maintaining health, welfare, and reproductive
status of captive wildlife is receiving increasing recognition, the research that can be
performed using captive exotic animals is limited by a number of factors. The number of
animals of a given species housed in a single institution is often small, and collections
typically consist of animals in different physiological states (growth, pregnancy,
lactation), making it difficult to obtain a sufficient number of similar research animals.
Since many of the species housed in zoological institutions are rare or endangered, their
conservation value prohibits placing them in potentially harmful situations. Thus, the
herd instincts and fearful or aggressive temperament of many captive ungulates limits
collection of data that requires individual housing or animal-human contact. As a result,
statistically viable data on the effects of diet modification of individually or group-fed
animals is difficult to obtain.
At the present time, in-depth nutritional knowledge of CS ruminants remains
scarce. The true nutritional requirements of giraffe and other captive CS and dietary
factors contributing to suspected nutrition-related pathologies remain unquantified.
Because of the dearth of data on the ingredient and chemical composition of diets
5
consumed in the wild and on nutrient requirements of exotic ruminants, domestic
ruminants have been used as models for ration formulation. However, numerous
differences between domestic and wild ruminants must be considered. While the
objective of ration formulation for most domestic ruminants is to optimize relatively
short-term production, the objective of ration formulation for captive wildlife is to
maximize longevity and long-term health and reproduction, which may extend into
decades of life. Furthermore, differences in digestive morphology and physiology may
create discrepancies in how dietary items are utilized. When ruminants are classified
according to natural diet and digestive anatomy, domestic cattle and sheep are grazers
(GR), adapted to consumption of a predominantly grass diet. The largest living ruminant,
the giraffe, is a CS, consuming primarily foliage in its natural environment. Over 40% of
the approximately 150 known extant ruminant species are classified as CS (Wood et al.,
2000) and consume little or no grass, subsisting instead on fruit and foliage from trees,
shrubs, and herbs. Differences between wild CS and domestic GR include not only
dietary constituents, but also rumen microbial population (Dehority and Odenyo, 2003)
and gastrointestinal anatomy (Hofmann, 1973, 1984).
Digestive morphophysiological differences between ruminant CS and GR have
been widely documented and discussed (Hofmann, 1973; Kay et al., 1980; Gordon and
Illius, 1996; Shipley, 1999; Ditchkoff, 2000), and a review is presented in the
proceedings of the 30th International Congress of the International Union of Physiological
Sciences (Hofmann, 1988). A brief summary of differences pertinent to the research
presented in this thesis follows. Generally, CS have proportionally larger salivary glands
than GR. Parotid glands, for example, range from 0.18 to 0.25% of body weight (BW) in
6
CS, but only 0.05 to 0.07% of BW in GR. The suspected increase in saliva flow in CS
may or may not facilitate increased ruminal buffering, since the apparently well-
developed ventricular groove may allow a proportion of swallowed saliva to bypass the
rumen. Such a bypass mechanism would also allow increased amounts of dietary cell
solubles to escape ruminal fermentation. The abundance of intestinal Na+/glucose co-
transporter in the brush border membrane of wild moose and roe deer is suggestive of
some mechanism of ruminal escape for dietary sugars (Rowell-Schafer et al., 1999;
Wood et al., 2000). Decreased ruminal compartmentalization and increased diameter of
the reticulo-omasal orifice in CS (Hofmann, 1973) may contribute to the observed
increased rate of digesta passage (Clauss, 1998), while the larger capacity of the lower GI
tract suggests greater reliance on hind-gut digestion. Decreased rumen capacity, greatly
increased ruminal surface area due to dense, even papillation, and increased liver size
imply a rapid rate of fermentation and nutrient absorption.
Put succinctly, these data illustrate a single point: giraffe are not cattle. Given the
known differences between GR and CS, the likelihood of unmodified domestic ruminant
feeding practices to maintain optimal health and nutritional status of captive CS appears
questionable. However, the basic biological principles of ruminant digestion and
metabolism discovered via domestic ruminant research may be able to facilitate improved
nutrition for captive CS if viewed in light of CS ruminants’ unique anatomy and
physiology.
In discussing the unique anatomical arrangements of CS, Hofmann touches upon
the need for further analysis of natural foods in order to maintain captive CS under
optimal conditions. He concludes by stating: “Neglect of original conditions finally leads
7
to a failing of the delicate anatomical, physiological, biochemical-microbial balance of
the concentrate selector’s ruminant stomach” (Hofmann, 1973). The research presented
in this thesis is an attempt to further the understanding of captive CS nutritional status
and requirements, and to examine possible links between dietary factors and suspected
nutritional pathologies, including PMS in captive giraffe.
8
CHAPTER 2 REVIEW OF THE LITERATURE ON DIETARY PHYSICAL FORM AND
CARBOHYDRATE PROFILE IN RUMINANT DIETS
Physical Form
Current feeding recommendations for zoo ungulates (Lintzenich and Ward, 1997)
do not address two of the more recent areas of focus in ruminant nutrition research:
dietary physical form and non-fiber carbohydrate (NFC) profile. The physical form of
dietary components impacts the manner in which feedstuffs are processed in the digestive
tract. Dietary physical form affects mastication (Mertens, 1997), saliva production
(Allen, 1997), ruminal development (Beharka et al., 1998), ruminal pH (Allen, 1997),
rate and extent of ruminal fermentation (Mertens, 1997), rate of digesta passage (Allen,
1996), and the proportion of unfermented nutrients passing into the lower GI tract
(Firkins, 1997; Callison et al., 2001; Yang et al., 2001). Many methods of quantifying
the physical effectiveness of feeds by evaluating dietary particle size, chewing behavior,
or milk fat production have been proposed and used in domestic ruminant research.
Physically effective fiber (peNDF) is one approach used to define the effectiveness of
dietary particle size in maintaining ruminal (and animal) health and function (Mertens,
1997). The peNDF of a feed is defined as “the product of its neutral detergent fiber
(NDF) concentration and its physical effectiveness factor,” with physical effectiveness
factor determined by the ability of the feed to promote a chewing response in the animal,
as judged on a scale of 0 (not effective) to 10 (fully effective in promoting chewing). The
9
physical effectiveness of a feed is, in essence, a function of particle size and rate of
particle size reduction.
Effects of Particle Size on Mastication, Saliva Flow, and Ruminal pH
Little reduction in feed particle size occurs once ingesta has passed from the rumen
(Poppi et al., 1980). Chai et al. (1984) demonstrated that initial mastication and
rumination serve to reduce feed particle size. In steers fed long-stem alfalfa or brome
hays, bolus content of particles > 3.35 mm was reduced 58 to 75% by initial mastication
and 23 to 27% by rumination (Chai et al., 1984).
The ability to stimulate chewing behavior appears to vary among forage types.
Steers on high-concentrate diets spent more time (P<0.10) chewing when fed wheat straw
rather than alfalfa hay (Shain et al., 1999). The number of eating and ruminating chews
per g of DM consumed were 2.04 and 3.41 by steers fed long-stem brome hay, but only
1.26 and 1.80 by steers fed long-stem alfalfa hay, which may have been attributable to
differences in forage fragility, or rate of particle breakdown during chewing (Chai et al.,
1984).
Dietary items with a larger physical size require more time to be consumed and
generally have a greater ability to stimulate rumination. Long-stem or minimally
chopped forages, with high NDF content and long particle length, have a greater
stimulatory effect on mastication than do finely chopped forages, and a higher peNDF
value than grains or pellets (Mertens, 1997). Eating and total chewing time in lactating
Holstein cows offered a total mixed ration (TMR) increased (P<0.05) with inclusion of
additional alfalfa in the ration, and rumination and total chewing increased linearly with
increasing particle length of alfalfa silage (P<0.05) (Clark and Armentano, 2002). Time
engaged in rumination decreased (P<0.001) linearly as wheaten hay fed ad libitum to
10
sheep and goats was progressively switched from chopped (1 cm) to ground (3.2 mm)
and pelleted forms (McSweeney and Kennedy, 1992). Campbell et al. (1992) used ten
Hereford steers to compare the ability of five diets to stimulate chewing: A – 80%
pelleted concentrate, 20% long timothy hay (control); B – 80% pelleted concentrate, 20%
alfalfa cubes; C – 90% pelleted concentrate, 10% alfalfa cubes; D – completely pelleted
ration using corn cobs as the primary NDF source; E – 80% coarse (unground grains)
concentrate, 20% long timothy hay. Time engaged in rumination and eating behaviors
are reported as minutes per gram of dry matter intake (DMI)/ BW0.75. Modifying the
physical form of concentrates had no effect on eating (P=0.702) or rumination (P=0.954)
times. Replacing timothy hay with alfalfa cubes decreased rumination from 2.58 to 1.38
to 1.47 (P=0.001) but did not affect eating behavior (P=0.897). Replacing the control
ration with the all-pelleted diet decreased eating time from 3.55 to 2.98 (P=0.063) and
rumination from 2.58 to 1.29 (P=0.001). Number of chews per gram of DMI/ BW0.75
also decreased on the completely pelleted ration, from 234 to 173 (P=0.005) during
eating, and from 162 to 76 (P=0.001) during rumination.
Saliva, with a pH of approximately 8.5 (Cassida and Stokes, 1986), is a primary
ruminal buffering agent, supplying approximately half of the bicarbonate entering the
rumen of domestic cattle (Owens et al., 1998). The rate of saliva flow increases during
periods of eating and rumination (Bailey, 1961). Therefore, decreasing time engaged in
chewing behavior may decrease total daily saliva production per unit of feed consumed
(Bailey, 1961; Maekawa et al., 2002).
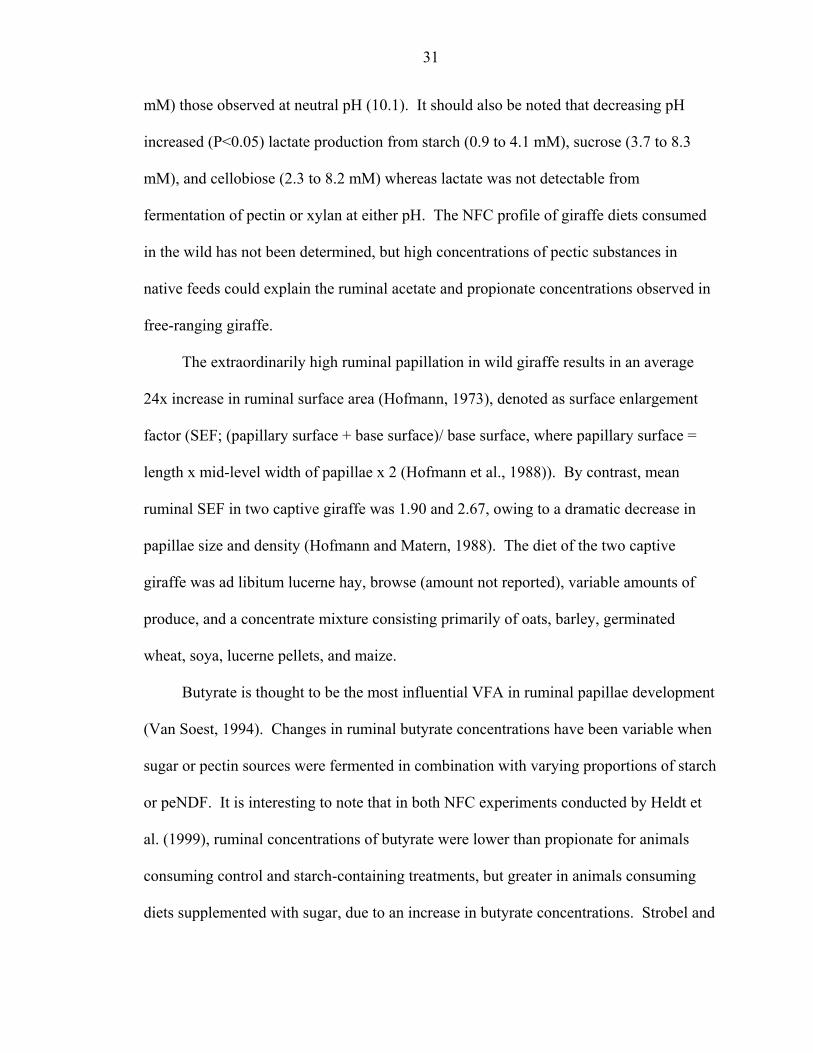
A study by Beauchemin et al. (2003) illustrates the link between forage particle
size, chewing activity, and ruminal pH. The effects of dietary particle size on lactating
11
dairy cows were examined using a total mixed ration (TMR) consisting of 60% barley-
based concentrate and 40% forage (DM basis). Forage consisted of alfalfa silage (AS)
and alfalfa hay (AH) in a 50:50 or 25:75 ratio. Alfalfa hay was coarsely chopped (CH) or
ground (GH) through a 4mm screen. Mean dietary particle length (MPL) was highest for
the TMR containing 50:50 AS:CH, followed by 25:75 AS:CH, 50:50 AS:GH, and 25:75
AS:GH. Eating and rumination behaviors were recorded every 5 minutes for 24 hours.
Rumination time per unit of DMI decreased with decreasing dietary particle size (Table
2-1). The shortest rumination time was 4.6 hours/day or 13.5 minutes/kg of DMI. Total
chewing time varied from 12.1 to 9.9 hours/day, and decreased with decreasing MPL.
Ruminal pH was measured every 5 seconds for 48 hours by an industrial electrode placed
in the ventral sac via ruminal cannulae. Ruminal pH was evaluated according to time
above 6.2 and below 5.8, based on the observations of Russell and Wilson (1996) that
ruminal microbial activity is compromised when pH falls below 6.2, and the premise that
the incidence of sub-clinical acidosis increases when ruminal pH drops below 5.8. Cows
fed 25:75 AS:AH had a greater mean ruminal pH (P=0.10) and time above pH 6.2
(P=0.08) than cows fed 50:50 AS:AH, perhaps due to decreased DMI (P<0.10) and
increased time spent eating (P=0.01). Ruminal pH status was mainly affected by forage
particle size, and was improved by feeding chopped, rather than ground, alfalfa hay
(Table 2-1).
Ruminal pH is influenced by the relative concentrations of acids, bases and buffers
present at any given time. Fermentation of NFC found in high concentrations in
concentrates and cereal grains results in rapid production of organic acids, while peNDF
consumption stimulates saliva flow. Concurrent consumption of NFC and peNDF

12
sources can be facilitated by combining diet components in a TMR rather than offering
forage and concentrate separately. Maekawa et al. (2002) used eight ruminally
cannulated lactating Holstein cows arranged in a double 4 x 4 Latin square design to
examine the effects of offering whole crop barley silage and steam-rolled, ground barley
grain-based concentrate on chewing activities, saliva production and ruminal pH. Four
diets were offered: separate ingredients (SI) offered at a forage to concentrate (F:C) ratio
of 50:50 (DM basis), and ad libitum TMR with F:C ratios of 60:40, 50:50, and 40:60.
When SI were fed, silage was offered ad libitum and grain was offered at 50% of
previous DM consumption to facilitate consumption of a 50:50 F:C ratio. However,
animals fed SI elected to consume an actual F:C ratio of 43:57, illustrating that when diet
components are fed separately, the animals may choose to consume a different F:C ratio
than the formulated ration. Cows were fed twice daily, with silage fed 1 hour after the
concentrate on SI treatment. Eating and ruminating activities were recorded every 5
minutes for 24 hours. Ruminal pH was measured every 5 seconds for 24 hours, and mean
pH for each 15-minute period was recorded. Saliva samples were collected at the cardia
during feeding and resting. Salivation could not be measured during rumination, so
salivation rate was assumed to be the same as that observed during eating.
Salivary secretion rate was 2.2 times greater during eating than resting. Linear
effects of increasing silage concentrations in the TMR showed only numerical increase in
minutes/ day spent eating (P=0.18), but increased minutes/ day spent ruminating
(P=0.03), increasing total chewing time (P=0.01) from 741 to 757 and 848 minutes/day
on F:C ratios of 40:60, 50:50, and 60:40, respectively. Total chewing time by cows fed
the SI diet (736 minutes/ day) was similar to that of cows fed the 40:60 TMR. However,
13
SI was consumed at a faster (P=0.02) rate (10.9 minutes/ kg of DM) than the 40:60 TMR
(13.5 minutes/ kg of DM). Concentrates required less mastication before being
swallowed, and were therefore consumed more rapidly than silage or TMR (P<0.01),
decreasing the amount of saliva produced per unit of feed (ml/g of DM) from 4.43 on
silage to 1.19 on concentrates (P<0.01). The main diet effect on ruminal pH was not
significant, but numerical differences presented in Table 2-2 suggest that diet did alter pH
characteristics. The postprandial decline in ruminal pH was greatest for cows fed SI, and
mean ruminal pH in SI cows was below the 5.8 benchmark suggested for increased risk
of subacute ruminal acidosis. Feeding TMR rather than SI appeared to decrease risk of
ruminal acidosis by preventing higher than intended consumption of concentrates and
increasing saliva production via increased mastication at the time that rapidly fermentable
concentrates were consumed.
Effects of Particle Size on Digesta Passage, Intake, and Fermentation
Kennedy et al. (1992) reported a linear increase in DMI (P<0.001) and linear
decreases in ruminal DM retention time (P=0.001) and DM digestibility (P<0.01) when
wheaten hay fed ad libitum to sheep and goats was progressively switched from hay
chopped to 1 cm (c), to a 2:1 ratio of c + hay ground to pass through a 3-mm screen and
pelleted (p), to a 1:2 ratio of c+p, to an all p diet. Dietary particle size can influence
voluntary intake, rate of digesta passage, and rate and extent of ruminal fermentation.
Since the rumen is a dynamic system, multiple interactions, exceptions, and caveats must
be considered. The following includes a brief, and by no means comprehensive,
discussion of such considerations.
Although multiple factors, including hydration and density, influence the rate at
which feed particles leave the rumen, resistance to outflow increases with increasing
14
particle size (Poppi et al., 1980). Poppi et al. (1980) suggested a high resistance for
particles greater than 1.18 mm, since less than 5% of particles leaving the rumen of sheep
fed chopped (2 cm) hay were retained on a 1.18 mm mesh sieve. Small particles may
flow from the rumen more rapidly than large particles (Weston and Cantle, 1984). Long
forage particles form a mat in the rumen, which can trap small particles, retaining them
for a greater length of time (Grant, 1997). As a result, decreasing forage particle size
may decrease overall ruminal DM retention (Bernard et al., 2000).
An increased rate of digesta passage can increase voluntary intake by reducing the
constraints of rumen fill. A direct relationship has been demonstrated between increased
ruminal contents and decreased voluntary intake (Campling and Balch, 1961); Schettini
et al., 1999). When long forages are consumed, rumen distention resulting from
restricted digesta flow may limit voluntary intake (Allen, 1996), which may prevent
intake of sufficient energy to meet animal requirements (Miller and O'Dell, 1969).
Conversely, fine particle size in an entire ration, particularly in high concentrate rations,
can also reduce voluntary intake (Krause and Combs, 2003), likely due to unfavorable
alterations in rumen conditions, such as a decline in pH (Nocek, 1997).
Dietary particle size impacts ruminal digestibility in part by influencing the balance
between the length of time feed components are retained in the rumen and the rate at
which they are fermented. Ruminal fermentation of dietary nutrients takes time. An
increased rate of particulate outflow from the rumen decreases the amount of time feed
components are available for microbial fermentation. Ruminal digestibility of dietary
components, particularly of slowly fermenting fiber, may decrease as a result (Pasha et
al., 1994). Conversely, chopping or grinding feed components increases the surface area
15
available for microbial access (Owens and Goetsch, 1988), increasing the rate of
fermentation. As a result, decreasing the particle size of a particular feed component may
increase the extent of its digestion in the rumen (Callison et al., 2001). However, when
rapid fermentation is not balanced by increased buffers and disappearance of organic
acids from the rumen, ruminal pH will decrease, the microbial population will be altered,
and nutrient digestibility may decrease (Russell and Wilson, 1996)
Changes in dietary physical form alter the ruminal environment, and may result in a
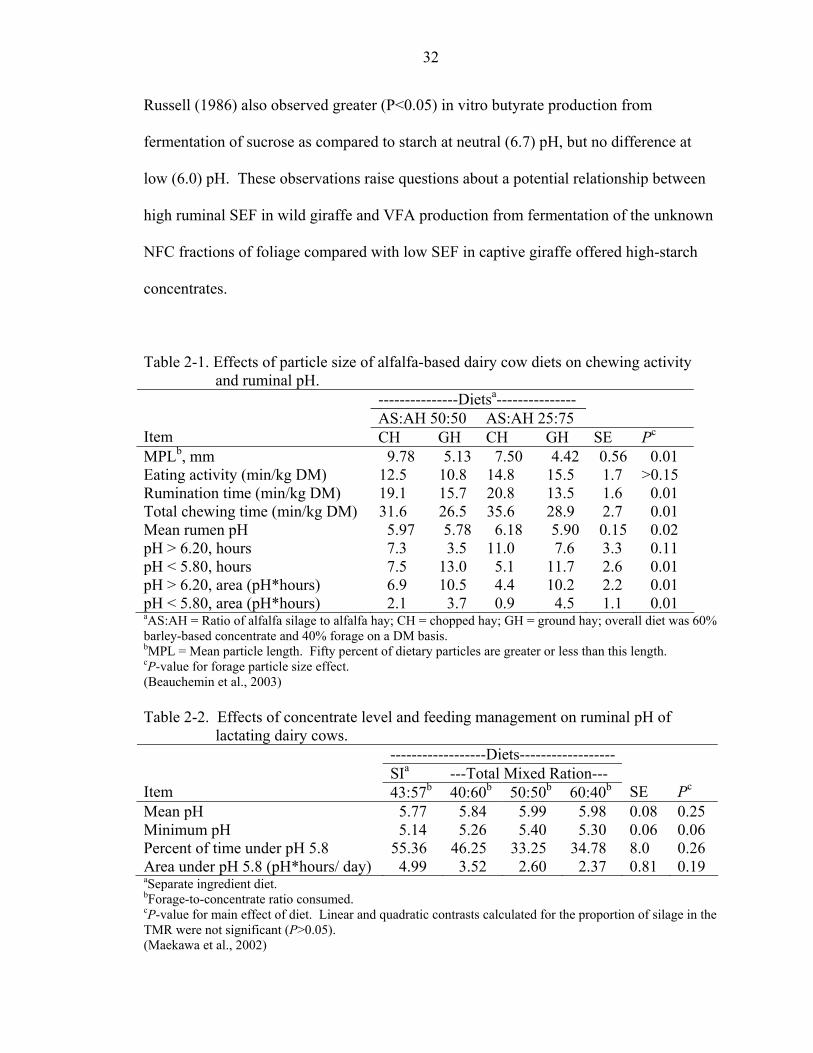
shift in VFA profile. In a study by Krause et al. (2002), four TMR rations with forage to
concentrate ratios of 39:61 (DM basis) were used to investigate the effects of forage
particle size and the concentration of dietary ruminally fermentable carbohydrates (RFC)
in diets of equal NDF content. Diets were offered ad libitum to eight ruminally
cannulated, lactating Holstein cows. Dietary concentrates were cracked-shelled corn
(low RFC) or ground high-moisture shelled corn (high RFC). Dietary forages were
chopped alfalfa silage of mean particle length of 13.6 (coarse) or 3.7mm (fine).
Decreasing forage particle size decreased the amount of time engaged in chewing
behavior (Table 2-3). Both decreasing forage particle size and increasing RFC decreased
mean ruminal pH, increased time (hours per day) and area (time*pH units/day) of
ruminal fluid below pH 5.8, and decreased the ratio of acetate to propionate by increasing
ruminal propionate concentration (Table 2-3). The percentage of dietary particles
retained on the top screen of a Penn State particle separator was positively correlated
(0.61) with minutes of chewing per day (P=0.0003) and, to a lesser extent, negatively
correlated (-0.32) with time that ruminal fluid pH was <5.8 (P=0.09).
16
Jorgenson and Schultz (1963) fed lactating cattle 7.26 kg of ground corn daily,
along with long-stem (control) or pelleted alfalfa hay in ad libitum amounts. Feeding
pelleted hay increased DMI from 1.1 to 1.2 kg/ 45 kg of body weight (P<0.05), increased
total ruminal VFA concentration from 600 to 844 mg/ 100 ml of ruminal fluid (P<0.05),
and altered the VFA profile of ruminal fluid. As a percentage of total VFA, acetate
decreased from 60.3 to 55.6% (P<0.05), propionate increased from 20.1 to 27.0%
(P<0.05), and butyrate decreased numerically from 17.0 to 15.3% (P>0.05). A second
trial compared the same control diet with an experimental diet of 16.3 kg of a 50:50
mixture of alfalfa: corn pellets, plus ad libitum alfalfa pellets. Changes in VFA profile of
the ruminal fluid were similar to the first trial. Intake, however, declined from 1.22 to
1.18 kg/ 45 kg of body weight (P<0.05) due to difficulty in keeping the cows consuming
the pelleted feed. Blood glucose concentrations increased from 49.1 to 57.4 mg%
(P<0.05) in cows fed the all-pellet diet. Although ruminal pH was not reported in this
study, subacute ruminal acidosis (SARA) may be caused by an elevation in total VFA
(Stone, 2004), and can result in decreased or variable intake (Nocek, 1997).
In diets for domestic ruminants, forage has long been the staple physically effective
component, and the effects of forage particle length on digestion parameters and
production performance have been investigated widely. In more recent years, byproduct
(non-forage) feeds have come into use as effective fiber sources in the livestock industry.
The peNDF value of nonforage fiber sources is considerably lower than long-stem
forages, but may be higher than some forms of concentrates, grains, and ground forages
(Mertens, 1997).

17
Partial replacement of forage with cottonseed hulls (CSH) has been shown to
increase DMI and decrease NDF and DM digestibility (Moore et al., 1990; Theurer et al.,
1999) in cattle, suggesting an associated increase in passage rate. Dry matter intake as a
percent of body weight in steers fed sorghum grain and chopped (15 cm screen) alfalfa
hay increased (P<0.05) when half of the alfalfa was replaced with CSH or chopped (2.5
cm screen) wheat straw (Theurer et al., 1999). However, DMI intake per kg of body
weight gain was lower for steers fed alfalfa, suggesting an increased efficiency of feed
utilization with alfalfa as compared to CSH.
Further effects were noted when CSH replaced long (theoretical 22.3 mm) or short
(theoretical 4.8 mm) cut corn silage in TMR offered to lactating Holstein cows (Kononoff
and Heinrichs, 2003). The inclusion of CSH at 8% of dietary DM reduced the
concentration of corn silage from 57.4 to 45.8% of dietary DM. Physically effective
NDF, estimated according to (Mertens, 1997), did not differ across treatments, and
increased sorting behavior was noted when cows were fed long corn silage. It is
therefore not surprising that reducing corn silage particle size did not affect (P>0.05)
chewing activity, DMI, ruminal pH, or apparent total tract digestibility of total
nonstructural carbohydrates, NDF or acid detergent fiber (ADF). Total chewing time per
kilogram of NDF intake tended (P<0.10) to increase by cow fed diets containing long
corn silage. The inclusion of CSH tended (P=0.06) to decrease total chewing time per
kilogram of DM consumed, and decreased mean ruminal pH from 6.24 to <6.17
(P=0.05). Cottonseed hulls increased DM and NDF intake (P<0.01) but did not affect
DM digestibility.
18
Potential Implications of peNDF for Captive Giraffe
From 1974 to 1978, a series of digestion trials comparing grass and alfalfa hays
were conducted using thirty herbivore species at five zoos (Foose, 1982). For each
dietary treatment, 14 days were allowed for acclimation to diets, followed by 10 days of
intake measurements. Total fecal production was collected during the final 4 days.
Individual animal intake was recorded, and orts were composited by species and
treatment (grass or alfalfa hay) for chemical analysis. Daily fecal output of each animal
was weighed, and pooled subsamples from each of the 4 days were composited for
analysis. The report mentions that “in most cases, it was possible to collect (fecal)
accumulations only at 24 hour intervals.” Given that inability to collect samples soon
after defecation resulted in sample trampling and contamination that prevented total fecal
collection in one giraffe study (Clauss et al., 2001), giraffe digestibility results from the
Foose (1982) study may be inaccurate.
Intake and nutrient extraction results are reported for three giraffe fed alfalfa hay
and one giraffe fed timothy grass hay (Table 2-4). Foose (1982) reports that grass hay
digestion trials on several giraffe had to be discontinued because the animals were
“conspicuously languishing on the diets.” Giraffe used were 2 and 3 years old, and thus
were likely to still be growing. Body weight could not be measured, and was estimated
from the literature. Organic matter intake (% of BW) and digestion coefficient ((amount
ingested – amount defecated) / amount ingested) x 100% were 0.45 and 57.11 for grass
hay, and 0.89 and 60.70 for alfalfa hay. Of the 28 ungulate species in this study, giraffe
had the lowest intake as a percentage of body weight, suggesting that the ruminal fill
effects of long forage may have an especially high impact in giraffe.
19
Feeding all-forage diets to high producing dairy cows can prevent adequate energy
intake, but feeding high-concentrate rations has potential to cause a variety of metabolic
and health problems (Miller and O'Dell, 1969). It has been suggested (Clauss et al.,
2002b) that captive giraffe fed a traditional hay/ concentrate diet face a nutritional
dilemma. Giraffe consuming a high proportion of hay will increase ruminal fill and
decrease intake. Those that consume a high proportion of concentrates will increase their
potential risk of ruminal acidosis.
The appropriate particle size for maintaining optimal diet utilization and
gastrointestinal health in CS remains to be determined, but it has been suggested that
giraffe are ill-suited to consumption of long-stem forages and the formation of a ruminal
mat similar to that in domestic ruminants (Clauss et al., 2002b). The giraffe’s diet in the
wild consists primarily of polygonal leaves as opposed to the elongated grasses and hays
consumed by GR (Clauss et al., 2002b). These physical as well as chemical features
including density factors may explain why stratification of ruminal contents occurs in
wild GR, but not in wild CS ( Hofmann, 1973; Clauss et al., 2001). Anatomical
differences between GR and CS (Hofmann, 1973) suggest a naturally faster passage rate
of digesta in CS ruminants than in GR ruminants, which has been observed in captive
giraffe (Hatt et al., 1998). Giraffe appear to be adapted to rapid rates of fermentation and
nutrient absorption (Hofmann, 1973).
However, feeding high-concentrate, low-forage diets is unlikely to enhance captive
giraffe nutrition. It seems likely that even in giraffe, acid production from ruminally-
degraded organic matter (particularly rapidly fermenting NFC) must be balanced with the
ruminal dilution and salivary stimulation effects of an appropriate form of peNDF (Allen,
20
1997). Saliva production in wild giraffe may be high due to the oral stimulation and time
involved in selective feeding patterns. One of the challenges in feeding captive giraffe is
providing diets with a physical form that will stimulate mastication and saliva flow to
maintain a balanced rumen pH, while avoiding an unnatural reduction in rate of passage
and dietary intake.
Dietary Carbohydrate Profile
Carbohydrate Fractions
Dietary carbohydrates can be divided into two basic fractions: fiber and nonfiber
carbohydrates (NFC). The chemical bonds between sugar residues in dietary fiber cannot
be broken by mammalian enzymes. As a result, fiber cannot be digested by mammals
themselves, but may be utilized by microbes in the digestive tract. The end products of
microbial fermentation can then be absorbed and utilized by the host animal.
Fermentation of cellulose and hemicelluloses is typically slow (2 to 14% digestion/ hour)
(Sniffen et al., 1992). Nonfiber carbohydrates, on the other hand, are generally
associated with rapid rates of ruminal fermentation, with digestion rate constants of 75 to
400% digestion/ hour for sugars, and 5 to 50% digestion/ hour for starch and pectin
(Sniffen et al., 1992). With the exception of neutral detergent-soluble fiber (NDSF),
NFCs may be digested by mammalian enzymes. The NFC may be further divided into
sugars (mono-, di-, and oligosaccharides), starch, organic acids, and NDSF (Hall et al.,
1999). As we will see, mounting evidence suggests that these NFC fractions differ in
their fermentation characteristics.
As the science of carbohydrate analysis has progressed, new techniques have
allowed evaluation of carbohydrates in increasing detail. Use of different techniques
over time can make the literature difficult to interpret. For the sake of clarity,
21
carbohydrate fractions found in the different analytical systems discussed in this section
are listed below.
Proximate analysis system
Crude fiber (CF): cellulose, acid- and alkali-insoluble hemicellulose, acid- and
alkali-insoluble lignin
Nitrogen-free extract (NFE): sugars, starch, pectic substances, organic acids,
fructans, acid- and alkali-soluble hemicellulose, acid- and alkali-soluble lignin
Under the proximate analysis system, fiber (hemicellulose) and lignin can appear in
either the CF or NFE fraction. The detergent system, however, distinguishes between the
fiber and non-fiber carbohydrate fraction of feeds.
Detergent system
Neutral detergent fiber (NDF): cellulose, hemicellulose, lignin
Acid detergent fiber (ADF): cellulose, lignin
Nonfiber carbohydrates (NFC): sugars, starch, pectic substances, organic acids,
fructans, and other carbohydrates soluble in neutral detergent
Carbohydrates in Natural CS Diets
The methodology for differentiation of NFC into sugars, starch and NDSF has only
recently been applied to animal feedstuffs. (Dierenfeld et al., 2002) examined sugar and
starch concentrations in 8 fruit and 2 flower species consumed by wild duikers in the
Democratic Republic of Congo. Samples contained 2 to15 times more sugar than starch,
with DM percentages of sugars at 0.16 in one sample and 3.19 to 15.71 in 9 samples, and
DM starch percentages of 7.43 in 1 sample, 0.37 to 1.96 in four samples, and less than
0.1 in 5 samples. Duikers are considered frugivores (fruit eaters), consuming large
22
proportions of fruits, flowers and seeds. Hence, no leaf material was included in this
report.
Unlike duikers, giraffe are considered folivores (foliage eaters). Plants consumed
by wild giraffe vary widely with season and geographic location. While Acacia spp.
appear to be the most commonly reported dietary item ( Foster, 1966; Dagg and Foster,
1976; Furstenburg and Van Hoven, 1994; Ciofolo and LePendu, 2002; Caister et al.,
2003), giraffe in a given location may consume as many as 66 plant species over the
course of a year (Leuthold and Leuthold, 1972). Trees and shrubs comprise the bulk of
the diet, with limited vine and herb consumption (Leuthold and Leuthold, 1972). Grass
consumption appears either non-existent (Leuthold and Leuthold, 1972) or negligible
(Ciofolo and LePendu, 2002). Field and Ross (1976) observed that woody plants
comprised > 93% of the diet, and “grass appeared to be eaten by accident when enmeshed
with other food.” Plant portions consumed are primarily leaves and stems, but may also
include fruits, flowers and bark (Leuthold and Leuthold, 1972; Caister et al., 2003). The
diet of giraffe in Niger was reportedly composed of 86% leaves, 8.5% stems and 5.5%
flowers and fruits. However, during the dry season (December to April), the diet was
composed of 45% leaves and stems, 44% fruits and 11% flowers (Ciofolo and LePendu,
2002).
Wild CS are generally thought to consume a “rich, rapidly fermenting diet”
(Hofmann, 1973). Pellew (1984) reported mean daily nutrient intakes of 2.22 to 3.12 kg
of crude protein (CP), 0.53 to 0.97 kg of ether extract (EE), 4.33 to 8.63 kg of acid
detergent fiber (ADF), and 5.48 to 7.73 kg of nitrogen-free extract (NFE) for giraffe in
the Serengeti. Composition of leaves (DM basis) from 10 plant species consumed by
23
giraffe in Niger during the dry season ranged from 8.2 to 28.6% CP, 0.8 to 6.8% crude
fat, 1.55 to 16.2% crude fiber (CF), and 19.8 to 71.93% NFE (Caister et al., 2003). Mean
composition of browse leaves (DM basis) from the Narus Valley (Uganda) for the
months of January, March, April, May and December ranged from 11.51 to 22.37% CP,
2.36 to 3.01% EE, 19.33 to 33.48% CF, and 36.80 to 50.32% NFE. Browse stems
contained 5.78 to 9.35% CP, 1.17 to 1.62% EE, 32.49 to 48.80% CF, and 35.91 to
52.18% NFE (Field and Ross, 1976). The high NFE content in these studies seems to
suggest a high concentration of nonfiber carbohydrates. However, it is important to
remember that NFE contains not only sugars, starch and soluble fiber, but also variable
amounts of hemicellulose and lignin, and therefore is not a true representation of NFC
content.
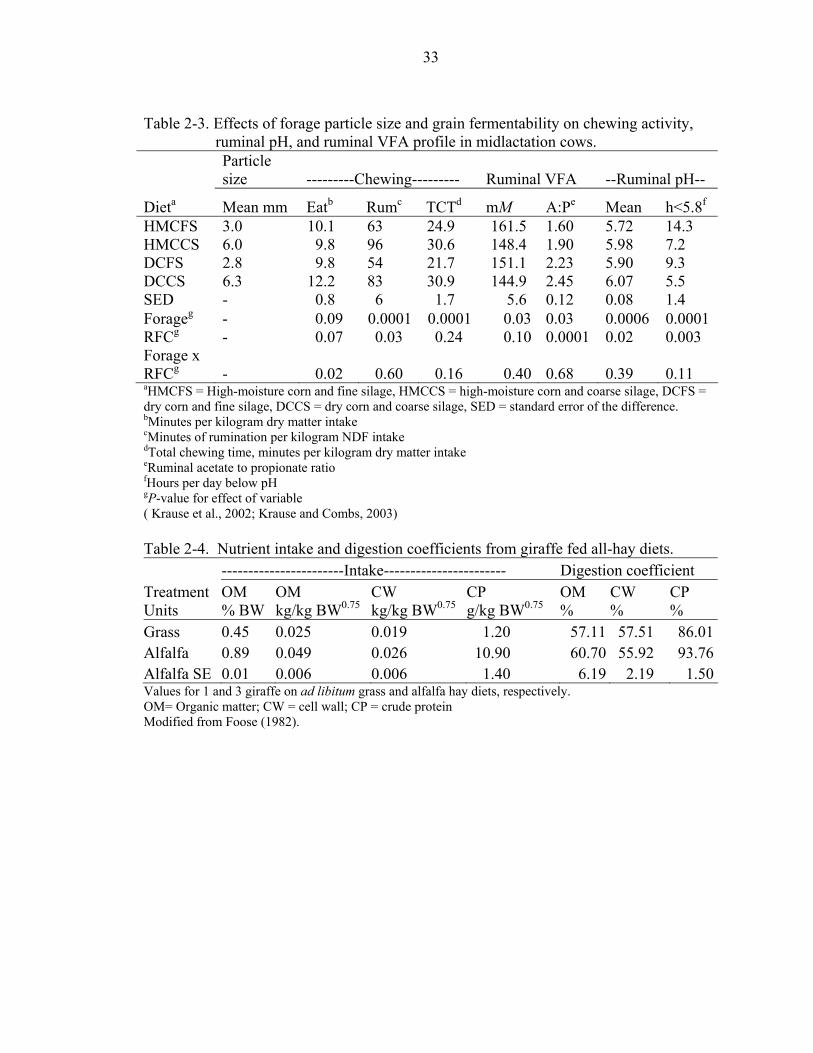
In our search of the literature, we found no published data on NFC fractions in
foliage. Analysis of leaves collected in October from three tree, one shrub, and one grass
species used for zoo animal enrichment showed higher concentrations (DM basis) of
sugars (6.5 to 13.2) than starch (0.3 to 3.1) in four of five species (Table 2-5; R. Ball,
personal communications). Acacia leaves contained 37.2% NFC, 6.5% sugars, and 0.5%
starch, suggesting that NDSF and organic acids may account for approximately 81% of
the NFC fraction. As will be discussed below, the differing NFC fractions do not digest
in the same manner in a fermentative environment. In order to improve our
understanding of their nutritional requirements, and optimize nutrition of captive
folivorous CS species, NFC analysis of natural dietary foliage needs to be further
explored.
24
Effects of NFC Source on Fermentation Characteristics and Animal Performance
Domestic ruminant feeding studies suggest that high- and low- starch NFC sources
differ in digestion characteristics and fermentation end products. Grains such as corn,
oats, wheat, and barley contain starch as the main nutrient component (Huntington,
1997). Supplemental energy sources having less starch include molasses and sucrose as
sugar sources, as well as beet pulp and citrus pulp, which have substantial NDSF and
sugar contents.
Carbohydrate feeding trials that have involved addition or subtraction of whole
feeds generally alter multiple ration characteristics, rather than carbohydrate profile
alone. This may explain the variability in DMI and body weight changes in livestock fed
diets in which NDSF or sugar sources replaced fibrous or starchy feeds. Increasing
supplemental NDSF sources (generally beet pulp or citrus pulp) while decreasing starchy
feeds (generally barley or corn) has both increased DMI in cattle (Chester-Jones et al.,
1991) and had no effect on DMI in sheep (Ben-Ghedalia et al., 1989). Supplemental
NDSF tended (P = 0.05) to decrease average daily gain in one study (Chester-Jones et
al., 1991), but showed no effect on body weight in others (Bhattacharya and Lubbadah,
1971; Friggens et al., 1995).
Altering dietary NFC profile has changed fermentation patterns, ruminal pH, and
diet digestibility. Switching lactating cows fed a basal diet of freshly cut grass (85%
Lolium perenne) from a supplement (36% of dietary DM) containing 47.5% corn meal
and 50% hominy to a supplement containing 82.5% sugar beet pulp and 15% soybean
hulls increased (P<0.05) ruminal OM and NDF digestibility and VFA concentrations
(Van Vuuren et al., 1993). Ben-Ghedalia et al. (1989) used four ruminally and
duodenally cannulated Merino rams to compare digestion characteristics of supplements
25
of dried citrus pulp (84.4% of supplement DM) with supplement containing citrus pulp
(20.4%) and barley (76.5%). Isonitrogenous supplements DCP (84.4% citrus pulp) and B
(20.4% citrus pulp, 76.5% barley) were offered with lucerne hay in an 80:20 supplement:
forage ratio. Sheep consuming DCP had greater ruminal pH (6.42) than those consuming
B (6.18). Total tract apparent digestibility of OM did not differ between diets, but
apparent NDF digestibility was greater by sheep fed DCP (79.4%) than those fed B
(63.6%). The results indicate that the fermentation of DCP created a more favorable
ruminal environment for fermentation of NDF.
In vitro investigation of microbial CP yield, detected as trichloroacetic acid-
precipitated crude protein (TCACP), also suggested differences in NFC fermentation
patterns (Hall and Herejk, 2001). When isolated NDF from bermudagrass hay was
incubated with sucrose, corn starch, or citrus pectin in media containing mixed ruminal
microbes, maximum TCACP synthesis (mg/g substrate OM) was greater for starch (85.6)
than sucrose (73.3) or pectin (75.4) (P <0.05). Temporal patterns of TCACP yield
differed as well. Sucrose showed no detectable lag phase, with greatest yield of TCACP
at the 12-hour sampling, and declined only gradually over time. The TCACP reached
peak yield at 12 and 16 hours during fermentation of substrate containing pectin,
followed by a rapid decline. When starch was fermented, peak TCACP yield was not
reached until 16 hours, also followed by a rapid decline.
Bhattacharya and Lubbadah (1971) used cattle and sheep to examine the effects of
replacing corn with beet pulp in high (approximately 75%) concentrate diets. Three
experiments were conducted, with the same four supplements fed in each experiment. In
all three experiments, the control supplement (Diet I) consisted of corn (73%), soybean

26
meal (21%), tallow (0.8%), bonemeal (2.7%), limestone (2.0%) and salt (0.5%). Beet
pulp was used to replace 0, 50, 75, and 100% of the corn in Diets I, II, III, and IV,
respectively. As beet pulp concentrations increased, concentrations of tallow and
bonemeal were increased, and limestone decreased, to maintain similar levels of fat,
phosphorus, and calcium among diets.
Experiment I used four lactating Holstein-Friesian cows in a 4 x 4 Latin square
design, with 4-week periods, to evaluate dietary effects on body weight gain, milk yield,
and milk fat. Animals were offered 19 kg of concentrate and 5 kg of alfalfa hay daily.
No significant differences were observed. It was noted that bloat symptoms occasionally
seen during pre-experimental and experimental periods in cows on the control diet were
not observed in cows offered the beet pulp diets.
Experiment II consisted of two 17-day trials using eight wethers housed in
metabolism crates, with two animals randomly allotted to each feeding treatment during
each trial. Alfalfa hay in this experiment was ground (size unreported) and mixed with
concentrate in a 26.2: 73.8 ratio. Diets were offered twice daily for three hours each
feeding. Sample collection in each trial included total feces and urine (final 7 days) and
jugular blood samples at three hours post-feeding on the day following the end of the
collection period. Apparent total tract DM digestibility was not affected by diet.
Replacement of Diet I (73% corn supplement) with Diet IV (73% beet pulp supplement)
decreased the apparent percent digestibility of CP (78.2 to 72.5%) and NFE (87.1 to
85.5%) and increased the apparent percent digestibility of CF (46.1 to 72.4%) (P < 0.01).
No dietary effect on blood glucose or VFA concentration was reported.
27
In Experiment III, rations “similar to those in Experiment 2” were offered ad
libitum to four ruminally fistulated Holstein steers. Beginning with the control ration and
progressing to higher beet pulp concentrations, animals received each ration for seven
days, with four days gradual adjustment between diets. Intake (average 7.65 kg/ day) did
not differ across diets. Ruminal fluid measures at the end of each period showed
differences (P<0.01) in VFA concentration (mmole/ L) response among all treatments,
and increased VFA concentrations in animals on Diets II (138.7), III (157.5) and IV
(141.3) as compared to control animals (113.3). Ruminal pH was numerically lower on
Diet IV (5.9) than on Diets I, II, and III (6.2, 6.3, and 6.2 respectively), and lactic acid
concentration was not affected. The authors observed that when animals received the
control diet, “the rumen was full of gas and frothy foam. As the proportion of … beet
pulp increased…, gas and foam gradually disappeared, and the appearance of the rumen
ingesta resembled that under hay-feeding conditions.”
Notable treatment differences in fermentation characteristics were observed in
ruminally cannulated Angus x Hereford steers (n=20) offered low-quality tallgrass-prairie
hay (chopped through a 75-mm screen, offered at 130% of previous intake) only
(control), and hay supplemented with starch, glucose, fructose or sucrose at 0.30% of
BW/ day (Heldt et al., 1999). Supplemented steers also received ruminally degradable
protein (RDP) (sodium caseinate, 91.6% CP) at 0.031% and 0.122% of BW/ day in
Experiments 1 and 2, respectively. Supplements were administered intraruminally. In
Experiment 2, total tract OM digestibility was 7.9% greater in animals supplemented with
sugars as compared to those receiving starch (P =0.04). In agreement with Ben-Ghedalia
et al. (1989), ruminal pH and total tract NDF digestibility were lower for animals
28
supplemented with starch than for those supplemented with sugar (P <0.05). Volatile
fatty acid concentrations differed between control and supplemented animals, and
between animals supplemented with sugar or starch (Table 2-6). Ruminal concentrations
of butyrate and lactate were greater in animals supplemented with sugars than in control
animals or animals supplemented with starch (P <0.01). In both experiments, time-
related fermentation patterns were dramatically different for sugars and starch. With all
three sugar treatments, pH declined rapidly, reaching the lowest point at 3 hours after
supplementation, followed by a rapid recovery. Decline in pH was slower for the starch
treatment, reaching the lowest point 9 hours after supplementation.
Interaction Between Dietary Components
Heldt et al. (1999) also illustrates the possible impact of other dietary components,
in this case protein, on fermentation characteristics of NFC fractions. In Experiment 1,
where RDP was fed at 0.031% of BW/ day, OM and NDF digestibility did not differ
between supplement treatments, and NFC supplementation depressed NDF digestibility
when compared to the hay-only control. Increasing RDP from 0.031 to 0.122% BW/ day
(Experiment 2) resulted in higher OM and NDF digestibilities in animals receiving
supplement vs. control, and sugars vs. starch. Carbohydrate treatment affected mean
ruminal pH at high, but not low, RDP amounts. Other factors beyond RDP can alter the
effect of dietary NFC. The physical form of the NFC source can affect the site of
digestion and the extent of ruminal digestion (Callison et al., 2001). The proportion of
dietary forage can affect ruminal VFA production response to individual NFC feeds
(Friggens et al., 1998). Dietary characteristics other than NFC profile alone may affect
animal response to NFC supplementation.
29
Potential Implications of Dietary NFC Profile for Captive Giraffe
Clemens et al. (1983) reported the molar proportions of VFA in the digestive tracts
of 16 species (4 CS, 5 intermediate feeders (IM), and 7 GR) of free-ranging African
ruminants, using animals sacrificed during wildlife management programs. The digestive
tract was separated by ligatures into six segments, and representative content samples
from each segment were strained through cheesecloth. Supernatant was acidified with
concentrated H2SO4 and refrigerated for later analysis. Sample collection and field
analysis were generally completed within 1 hour after death. Of all species, giraffe had
the highest ruminal proportion of acetate (73.2 + 1.6 molar %; 60.2 to 72.9 molar % in
other species), and the second lowest proportion of propionate (14.1 + 0.5 molar %; 12.8
to 22.8 molar % in other species) in ruminal fluid. The acetate: propionate ratio (5.21 +
0.13) in ruminal fluid from giraffe was exceeded only by the eland (5.71 + 1.38) and
followed closely by the oryx (5.13 + 0.11), with other species ranging from 2.92 to 4.65.
Traditionally, high acetate concentration is associated with fiber fermentation, and
elevated propionate concentration is associated with NFC fermentation. Since giraffe are
thought to consume diets relatively rich in NFC and low in NDF, with extensive fiber
fermentation impeded by a rapid rate of digesta passage from the rumen, high acetate/
low propionate concentrations in the wild giraffe rumen appear paradoxical. However,
domestic ruminant studies reveal that the various NFC fractions differ in fermentation
and VFA production characteristics. Although VFA disappearance rates and the
unknown nutrient content of feedstuffs consumed prior to sample collection cannot be
discounted as possible causes for the findings of Clemens et al. (1983), another potential
contributing factor lies in the still unquantified NFC fractions of giraffe diets consumed
in the wild.
30
In domestic sheep and cattle, ruminal acetate and propionate profiles have been
altered by modification of dietary NFC. When high amounts of citrus pulp (84.4% of
dietary DM) were fed to sheep in place of a 20.4% citrus pulp and 76.5% barley diet,
propionate decreased numerically from 17.6 to 14.4 molar % (P>0.05) and acetate
increased from 65.0 to 69.1 molar % (P<0.05) (Ben-Ghedalia et al., 1989). Using
continuous culture in vitro fermentations with mixed ruminal microbes from cattle
inoculum, Ariza et al. (2001) observed changes in molar concentrations of propionate and
acetate when starch was decreased from 24.0 to 11.0% and NDSF was increased from 8.8
to 14.4% by altering the substrate ratio of hominy feed to citrus pulp. Propionate
decreased from 22.7 to 16.7 molar % and acetate increased from 62.6 to 68.9 molar %
(P<0.04). The acetate: propionate ratio increased from 2.8 to 4.1 (P=0.01). Strobel and
Russell (1986) provided six carbohydrate substrates (starch, sucrose, cellobiose, xylan,
pectin, and a mix of the preceding in equal parts) to mixed ruminal bacteria at 1 mM/ h
for 10 h at an initial pH of 6.7 (neutral) or 6.0 (low). Propionate concentrations across
treatments were numerically lowest for pectin, though the differences were not significant
(P>0.05) at low pH. Less (P<0.05) propionate was produced in response to pectin (1.3
mM) than starch (2.9 mM) or cellobiose (2.7 mM) at pH 6.7. At neutral pH, millimolar
concentrations of acetate from fermentation of pectin, cellobiose, starch, mixed
carbohydrates, sucrose, and xylan were 10.1, 6.4, 5.1, 4.8, 4.7, and 3.6 respectively, and
were greatest (P<0.05) from pectin fermentation. At low pH, pectin fermentation
resulted in greater (P<0.05) acetate concentrations than fermentation of other single-
carbohydrate treatments, and numerically greater (P>0.05) acetate than from mixed
carbohydrates. Acetate concentrations from pectin fermentation at low pH were half (5.0
31
mM) those observed at neutral pH (10.1). It should also be noted that decreasing pH
increased (P<0.05) lactate production from starch (0.9 to 4.1 mM), sucrose (3.7 to 8.3
mM), and cellobiose (2.3 to 8.2 mM) whereas lactate was not detectable from
fermentation of pectin or xylan at either pH. The NFC profile of giraffe diets consumed
in the wild has not been determined, but high concentrations of pectic substances in
native feeds could explain the ruminal acetate and propionate concentrations observed in
free-ranging giraffe.
The extraordinarily high ruminal papillation in wild giraffe results in an average
24x increase in ruminal surface area (Hofmann, 1973), denoted as surface enlargement
factor (SEF; (papillary surface + base surface)/ base surface, where papillary surface =
length x mid-level width of papillae x 2 (Hofmann et al., 1988)). By contrast, mean
ruminal SEF in two captive giraffe was 1.90 and 2.67, owing to a dramatic decrease in
papillae size and density (Hofmann and Matern, 1988). The diet of the two captive
giraffe was ad libitum lucerne hay, browse (amount not reported), variable amounts of
produce, and a concentrate mixture consisting primarily of oats, barley, germinated
wheat, soya, lucerne pellets, and maize.
Butyrate is thought to be the most influential VFA in ruminal papillae development
(Van Soest, 1994). Changes in ruminal butyrate concentrations have been variable when
sugar or pectin sources were fermented in combination with varying proportions of starch
or peNDF. It is interesting to note that in both NFC experiments conducted by Heldt et
al. (1999), ruminal concentrations of butyrate were lower than propionate for animals
consuming control and starch-containing treatments, but greater in animals consuming
diets supplemented with sugar, due to an increase in butyrate concentrations. Strobel and
32
Russell (1986) also observed greater (P<0.05) in vitro butyrate production from
fermentation of sucrose as compared to starch at neutral (6.7) pH, but no difference at
low (6.0) pH. These observations raise questions about a potential relationship between
high ruminal SEF in wild giraffe and VFA production from fermentation of the unknown
NFC fractions of foliage compared with low SEF in captive giraffe offered high-starch
concentrates.
Table 2-1. Effects of particle size of alfalfa-based dairy cow diets on chewing activity and ruminal pH.
---------------Dietsa--------------- AS:AH 50:50 AS:AH 25:75
Item CH GH CH GH SE Pc MPLb, mm 9.78 5.13 7.50 4.42 0.56 0.01 Eating activity (min/kg DM) 12.5 10.8 14.8 15.5 1.7 >0.15 Rumination time (min/kg DM) 19.1 15.7 20.8 13.5 1.6 0.01 Total chewing time (min/kg DM) 31.6 26.5 35.6 28.9 2.7 0.01 Mean rumen pH 5.97 5.78 6.18 5.90 0.15 0.02 pH > 6.20, hours 7.3 3.5 11.0 7.6 3.3 0.11 pH < 5.80, hours 7.5 13.0 5.1 11.7 2.6 0.01 pH > 6.20, area (pH*hours) 6.9 10.5 4.4 10.2 2.2 0.01 pH < 5.80, area (pH*hours) 2.1 3.7 0.9 4.5 1.1 0.01 aAS:AH = Ratio of alfalfa silage to alfalfa hay; CH = chopped hay; GH = ground hay; overall diet was 60% barley-based concentrate and 40% forage on a DM basis. bMPL = Mean particle length. Fifty percent of dietary particles are greater or less than this length. cP-value for forage particle size effect. (Beauchemin et al., 2003) Table 2-2. Effects of concentrate level and feeding management on ruminal pH of
lactating dairy cows. ------------------Diets------------------ SIa ---Total Mixed Ration---
Item 43:57b 40:60b 50:50b 60:40b SE Pc Mean pH 5.77 5.84 5.99 5.98 0.08 0.25 Minimum pH 5.14 5.26 5.40 5.30 0.06 0.06 Percent of time under pH 5.8 55.36 46.25 33.25 34.78 8.0 0.26 Area under pH 5.8 (pH*hours/ day) 4.99 3.52 2.60 2.37 0.81 0.19 aSeparate ingredient diet. bForage-to-concentrate ratio consumed. cP-value for main effect of diet. Linear and quadratic contrasts calculated for the proportion of silage in the TMR were not significant (P>0.05). (Maekawa et al., 2002)
33
Table 2-3. Effects of forage particle size and grain fermentability on chewing activity,
ruminal pH, and ruminal VFA profile in midlactation cows.
Particle size ---------Chewing--------- Ruminal VFA --Ruminal pH--
Dieta Mean mm Eatb Rumc TCTd mM A:Pe Mean h<5.8f HMCFS 3.0 10.1 63 24.9 161.5 1.60 5.72 14.3 HMCCS 6.0 9.8 96 30.6 148.4 1.90 5.98 7.2 DCFS 2.8 9.8 54 21.7 151.1 2.23 5.90 9.3 DCCS 6.3 12.2 83 30.9 144.9 2.45 6.07 5.5 SED - 0.8 6 1.7 5.6 0.12 0.08 1.4 Forageg - 0.09 0.0001 0.0001 0.03 0.03 0.0006 0.0001 RFCg - 0.07 0.03 0.24 0.10 0.0001 0.02 0.003 Forage x RFCg - 0.02 0.60 0.16 0.40 0.68 0.39 0.11 aHMCFS = High-moisture corn and fine silage, HMCCS = high-moisture corn and coarse silage, DCFS = dry corn and fine silage, DCCS = dry corn and coarse silage, SED = standard error of the difference. bMinutes per kilogram dry matter intake cMinutes of rumination per kilogram NDF intake dTotal chewing time, minutes per kilogram dry matter intake eRuminal acetate to propionate ratio fHours per day below pH gP-value for effect of variable ( Krause et al., 2002; Krause and Combs, 2003) Table 2-4. Nutrient intake and digestion coefficients from giraffe fed all-hay diets. -----------------------Intake----------------------- Digestion coefficient Treatment OM OM CW CP OM CW CP Units % BW kg/kg BW0.75 kg/kg BW0.75 g/kg BW0.75 % % % Grass 0.45 0.025 0.019 1.20 57.11 57.51 86.01Alfalfa 0.89 0.049 0.026 10.90 60.70 55.92 93.76Alfalfa SE 0.01 0.006 0.006 1.40 6.19 2.19 1.50Values for 1 and 3 giraffe on ad libitum grass and alfalfa hay diets, respectively. OM= Organic matter; CW = cell wall; CP = crude protein Modified from Foose (1982).
34
Table 2-5. Chemical composition (DM basis) of five browse plants grown at Busch Gardens in Tampa, Florida.
Item Hibiscusa Bambooa Acaciaa Acaciab MulberryaFalse Acaciaa
False Acaciab
(DM) 18.7 47.7 39.7 46.8 27 28 52.2 Ash 16.87 11.6 14.23 9.58 11.48 7.88 6.05 NDF 53.9 65.1 33.7 46.1 33.6 36.4 56.7 NFC 15.8 12 37.2 34.8 34.6 43.3 28.9 Sugar 3.2 6.9 6.5 4.6 13.2 7.1 4.4 Starch 3.9 0.3 0.5 0.8 3.1 0.7 2.1 CP 15.4 12.9 16.5 13.6 25.7 18.3 10.2 NDICP 8.4 5.6 5.2 7.2 9.4 9.1 4.3 Ca 3.31 1.08 4.23 2.99 2.16 1.9 1.63 P 0.77 0.28 0.24 0.24 0.4 0.22 0.17 NDF = Neutral detergent fiber; NFC = non-fiber carbohydrates; NDICP = neutral detergent insoluble crude protein. aLeaf bLeaf + stem Samples collected in October, 2004. Unpublished data courtesy of Busch Gardens, Tampa.
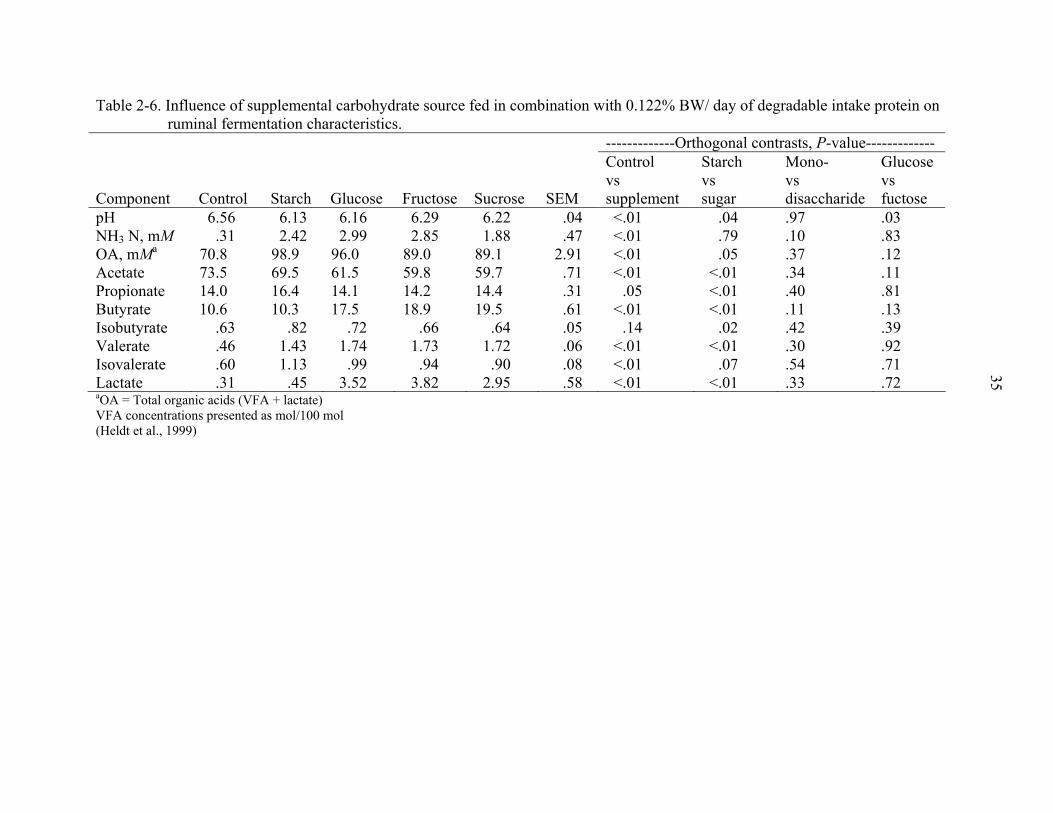
35
Table 2-6. Influence of supplemental carbohydrate source fed in combination with 0.122% BW/ day of degradable intake protein on ruminal fermentation characteristics.
-------------Orthogonal contrasts, P-value------------- Control Starch Mono- Glucose vs vs vs vs Component Control Starch Glucose Fructose Sucrose SEM supplement sugar disaccharide fuctose pH 6.56 6.13 6.16 6.29 6.22 .04 <.01 .04 .97 .03 NH3 N, mM .31 2.42 2.99 2.85 1.88 .47 <.01 .79 .10 .83 OA, mMa 70.8 98.9 96.0 89.0 89.1 2.91 <.01 .05 .37 .12 Acetate 73.5 69.5 61.5 59.8 59.7 .71 <.01 <.01 .34 .11 Propionate 14.0 16.4 14.1 14.2 14.4 .31 .05 <.01 .40 .81 Butyrate 10.6 10.3 17.5 18.9 19.5 .61 <.01 <.01 .11 .13 Isobutyrate .63 .82 .72 .66 .64 .05 .14 .02 .42 .39 Valerate .46 1.43 1.74 1.73 1.72 .06 <.01 <.01 .30 .92 Isovalerate .60 1.13 .99 .94 .90 .08 <.01 .07 .54 .71 Lactate .31 .45 3.52 3.82 2.95 .58 <.01 <.01 .33 .72 aOA = Total organic acids (VFA + lactate) VFA concentrations presented as mol/100 mol (Heldt et al., 1999)
36
CHAPTER 3 EFFECTS OF ALTERING THE PHYSICAL FORM AND CARBOHYDRATE
PROFILE OF THE DIET ON CAPTIVE GIRAFFE
Introduction
Physical characteristics of feeds, particularly of the fiber fraction, can influence the
efficiency of use of a ruminant’s diet. Proper ruminal function in domestic ruminants is
maintained by consumption of sufficient “physically effective fiber” (peNDF), which is
determined by the neutral detergent fiber (NDF) concentration and the ability of the feed
to promote a chewing response in the animal (Mertens, 1997). The appropriate physical
form, digestibility, and quantity of peNDF for concentrate selectors (CS) such as giraffe
have not been determined. It has been proposed that peNDF for CS includes particles of
polygonal shape similar to browse, rather than the needle-like fibers derived from grasses
(Clauss et al., 2002). Captive giraffe fed a traditional hay/ concentrate diet may face a
nutritional dilemma: consume a high proportion of hay, increasing ruminal fill and
decreasing intake, or consume a high proportion of concentrates, increasing potential risk
of ruminal acidosis (Clauss et al., 2002).
Nonfiber carbohydrates (NFCs) can be divided into sugars (mono-, di-, and
oligosaccharides), starch, organic acids, and neutral-detergent soluble fiber (NDSF),
which includes carbohydrates such as pectin (Hall et al., 1999). The NFC fractions differ
in fermentation characteristics and end products. Sugar (sucrose), starch and pectin have
been shown to differ in vitro in both maximum microbial protein yields and in temporal
pattern of that yield (Hall and Herejk, 2001). When fermented in the absence of other
37
NFC sources, sugars have produced higher butyrate concentrations than starch (Heldt et
al., 1999; Strobel and Russell, 1986). Strobel and Russell (1986) noted that unlike
fermentation of sugars or starch, pectin fermentation did not result in detectable lactate
production at either neutral (6.7) or low (6.0) ph media. Fermentation of pectin or feeds
high in NDSF has increased acetate concentrations both in vitro (Ariza et al., 2001;
Strobel and Russell, 1986) and in vivo (Ben-Ghedalia et al., 1989).
Although the NFC fractions of giraffe diets in nature have not been quantified
extensively, analysis of leaves collected from five tree and shrub species used for
enrichment of zoo animal diets showed greater DM concentrations of sugars (6.5 – 13.2)
than starch (0.3 – 3.1) in four of five species (R. Ball, personal communications). Acacia
leaves contained 37.2% NFC, 6.5% sugars, and 0.5% starch, suggesting that NDSF,
organic acids, and analytical may account for approximately 81% of the NFC fraction (R.
Ball, personal communications). Consumption of feeds high in NDSF by wild giraffe
could explain why when (Clemens et al., 1983) examined molar proportions of volatile
fatty acids (VFA) in the digestive tracts of 16 free-ranging African ruminant species, the
highest ruminal proportion of acetate and the second highest acetate: propionate ratio
were found in giraffe. Collectively, these observations raise questions about the
importance of dietary NFC complement in maintaining optimal ruminal fermentation,
and the response of captive giraffe to the various NFC fractions.
Nutrient supply to the ruminant animal is not dependent upon diet composition
alone. The amounts and proportions of offered dietary items that the animal chooses to
consume, digestion characteristics and interactions of consumed dietary components, and
nutrient absorption also must be considered. It has been suggested that the wasting and
38
sudden death widely reported in captive giraffe (Fox, 1938; Chaffe, 1968; Fowler, 1978;
Strandberg et al., 1984; Flach et al., 1997; Junge and Bradley, 1993; Ball et al., 2002)
may be a result of a functional energy deficiency ( Fowler, 1978; Ball et al., 2002). The
reports of ruminal acidosis (Clauss, 1998; Clauss et al., 2002b), fermentative gastritis or
rumenitis (Fox, 1938; Ball et al., 2002), gastrointestinal ulceration (Fox, 1938; Fowler,
1978) and pancreatic pathologies ( Fox, 1938; Fowler, 1978; Lechowski et al., 1991; Ball
et al., 2002) also may be indicative of consumption of an unbalanced diet or altered
fermentation of dietary components in captive giraffe. Compounding this problem,
decreased ruminal absorptive surface area that has been reported in captive giraffe
(Hofmann and Matern, 1988) may impair nutrient absorption.
The objective of this study was to examine the effects of modified dietary physical
form and NFC profile compared to a commercial diet on captive giraffe intake, nutrient
digestibility, behavior, and blood parameters. The hypothesis was that modifying
supplement physical form and NFC profile would alter the intake, nutrient digestion,
behavior, and blood parameters of captive giraffe fed a hay + supplement diet.
Materials and Methods
Design
This study was conducted from August 2002 through February 2003 at Busch
Gardens in Tampa, FL (BGT). The design was a modified reversal study using two
treatments and six animals in seven 21-day periods (Table 3-1). The study was
conducted according to protocols approved by the Institutional Animal Care and Use
Committees of the University of Florida and Busch Entertainment Corporation.
39
Giraffe
Six non-lactating adult female reticulated giraffe (Giraffa camelopardalis
reticulata) were used. Body weight (BW) ranged from 576 to 715 kg (average 637 +
42.6 kg). Giraffe were assigned identification numbers G1 through G6, in order of
entrance to the study. Three giraffe (G2, G4 and G6) were wild-caught, and estimated to
be approximately 22 years of age at the time of the study. Three giraffe were born at
BGT and aged 12 (G1), 7 (G3), and 4 (G5) years at time of entrance to the study.
Pregnancy status of the animals varied. Two giraffe were in the third (G1) and
second (G3) trimesters of pregnancy during their time on study, and the remaining four
giraffe were non-pregnant. Nine and a half months prior to entrance to the study, G5
delivered a large (74 kg), rapidly growing calf. The calf was weaned through progressive
separation two to five days prior to G5’s entrance to the study.
Facilities
Study giraffe were individually housed in two adjacent pens, which allowed
continual access to visual and tactile contact with conspecifics. Pen dimensions were
approximately 22 and 21 meters (east to west) by 8 and 9 meters (north to south) in pens
1 and 2 respectively. Flooring in each pen consisted of a roughed concrete pad of
approximately 9 by 9 meters spanning the west end, and sand in the remainder of the pen.
A shade shelter sloped east to west (9 and 7 meters high respectively) and covered the
western 1/3 of each pen. Radiant heaters attached to the bottom of the shade shelter
provided heat when temperatures fell below 10°C. Pen 1 was equipped with a second
shelter adjacent to the west end of the pen that provided feed troughs with additional
protection from driving rain. Feed in pen 1 suffered less weather damage than feed in
pen 2 for one collection day in period 1 as a result. Water was provided in a 189-litre tub
40
at ground height in pen 1, and an automatic waterer (Nelson Manufacturing Company,
Cedar Rapids, IA) at approximately 1.8 meters high in pen 2.
Hayracks with catch pans and supplement feed tubs were mounted to the center of
the west wall in each pen. Feeders were only accessible to the animal in that pen.
Hayracks and supplement feeders were placed adjacent to one another, with the top of
each mounted to the top of the wall at approximately 3.2 meters high. At the onset of
period 3, the supplement feed pan in pen 2 was lowered 15 cm to accommodate the
shorter height of G3, and remained at this height for the remainder of the study.
Diets
The standard BGT giraffe ration consisted of ad libitum alfalfa hay, fresh browse as
available, and two concentrates, Mazuri Browser Breeder and Purina Omelene 200
(Purina Mills, St. Louis, MO). Concentrates were fed together in a 75:25 ratio (as-fed
basis) at approximately 1% of giraffe body weight as per manufacturer’s
recommendations for Mazuri Browser Breeder. This 75:25 grain mix (GF) was used as
the control diet for comparative evaluation to the coarse, non-pelleted experimental
browser feed (EF). Ingredient composition (DM basis) of EF was 35% sugar beet pulp,
18% cottonseed hulls, 13% molasses, 11% soybean meal, 10% alfalfa meal, 6% mineral
mix*, 4% heat-treated soybean meal (Soy Plus) and 3% sucrose (table sugar).
*Mineral mix was 94.5% DM, and was composed of the following ingredients (percentage inclusion on air dry basis): dicalcium phosphate (39.5%), calcium carbonate (8.76%), urea (8.76%), salt (5.25%), sodium bicarbonate (17.5%), potassium carbonate (9.65%), selenium 1% (0.12%), cobalt sulfate (0.02%), copper sulfate (0.08%), zinc sulfate (0.08%), iron sulfate (0.30%), manganese sulfate (4.38%), magnesium oxide (4.38%), ethylenediamine dihydroiodide (0.003%), vitamin A 650 x 106 IU/ kg (0.03%), vitamin D3 400 x 106 IU/ kg (0.01), and vitamin E 500 x 103 IU/ kg (0.80%). Mix contained: 84% ash, 24% CP as non-protein N, 9.9% Ca, 8.3% P, 6.9% Na, 3.2% Cl, 2.6% Mg, 4.7% K, 0.96% S, 68 ppm Co, 203 ppm Cu, 20 ppm I, 5270 ppm Fe, 14118 ppm Mn, 12 ppm Se, 2060 ppm Zn, 88452 IU/# Vit. A, 18144 IU/# Vit. D3, 1814 IU/# Vit. E.
41
The EF was formulated to be equivalent to GF in minerals and vitamins A, D, and E, and
differed from GF and other commonly-fed browser feeds by containing less starch, more
sugars and soluble fiber, and small, heavily lignified particles (cottonseed hulls) to
modify the fiber size and texture of the diet. The experimental supplement was mixed in
178 kg batches by study personnel at the University of Florida Dairy Research Unit
(Hague, FL).
Each animal was housed individually and fed EF or GF ad libitum for 21 days, and
then received the other feed supplement in the subsequent 21-day period, so that each
animal received each diet. Alfalfa hay, water, and salt were offered ad libitum
throughout the study.
Sample Collection and Analyses
Feedstuffs and intake
Amounts of all feedstuffs offered and refused were weighed and recorded daily.
Subsamples of all feedstuffs were collected. In periods 1 through 3, two to three flakes of
alfalfa hay from a bale fed (and considered representative of alfalfa offered during that
period) were retained for analysis. In periods 4 through 7, a bale corer was used to
sample five to seven of the bales fed during that period. On days 15-21 of each study
period, th total amount of hay and supplement orts for each giraffe were collected and
frozen at -23°C until analysis.
Dry matter (DM) content of supplement fed and daily supplement orts were
obtained by drying duplicate subsamples of two to three grams each at 105°C in a forced
air oven for approximately 36 hours, until a constant weight was achieved. Results were
42
used to calculate daily dry matter intake (DMI) for each animal. Subsamples of offered
supplements and supplement orts were dried at 55°C in a forced-air oven until constant
weight was achieved. Subsamples were retained for particle size analysis, and the
remaining dried sample was ground through a Wiley mill (A.H. Thomas, Philadelphia,
PA) to pass through a 1-mm screen.
In order to obtain representative subsamples for DM determination, hay offered in
periods 1 through 3 and total daily hay orts for each animal were chopped with a paper
cutter to roughly 2.5 cm, then blended and subsampled following the procedure of Van
Soest and Robertson (1985). One subsample of approximately 10 grams was used to
determine DM. Remaining sample was dried in a forced-air oven at 55°C, ground
through a Hammer mill (Smalley Manufacturing Co., Manitowoc, WI) using a 0.635-cm
screen, mixed and subsampled. Subsamples were ground through a Wiley mill using a 1-
mm screen. Ground samples were analyzed for DM at 105°C and organic matter (OM)
by ashing overnight (>8 hours) at 512°C in a muffle furnace (Sybron Corporation,
Dubuque, IA). Daily orts were composited on a DM basis by giraffe by period. Batches
of EF fed during the collection week of each period were composited by period. Mazuri
Browser Breeder and Purina Omelene 200 fed in each period were analyzed separately
for nutrient content, and results used to calculate the nutrient composition of GF (75%
Mazuri Browser Breeder, 25% Purina Omelene 200) fed in each period.
Feed offered and composited orts were analyzed for DM, OM and nutrient content.
Neutral detergent fiber (NDF) and NDF organic matter (NDFOM) were determined using
heat-stable α-amylase (Goering and Van Soest, 1970; Van Soest, 1991). Acid detergent
fiber (ADF) (Goering and Van Soest, 1970), sugar (Hall, 2001), starch (Hall, 2001),
43
lignin (Goering and Van Soest, 1970), and mineral (using Perkin Elmer 3300 XL ICP
manufactured by Perkin Elmer, Shelton, CT) (Association of Official Analytical
Chemists, 1990) content were analyzed by Cumberland Valley Analytical Services,
Maugansville, MD. Neutral detergent soluble fiber was determined according to the
method of (Hall et al., 1999). Crude protein (CP) as N x 6.25 was determined by
combustion analysis (Association of Official Analytical Chemists, 1990) using Macro
Elementar Analyzer (vario MAX CN, Elementar Analysensysteme GmbH, Hanau,
Germany). Nutrient intake was calculated as: kg nutrient offered – kg nutrient refused.
Particle size of supplements offered was analyzed using U.S.A. Standard Testing
Sieves (Fisher Scientific Company, Pittsburg, PA) 5, 10, 18, 23, 60, and 120 (pore sizes
of 4, 2, 1, 0.5, 0.25, and 0.125 mm). Samples of approximately 10 g DM were soaked in
300 ml of deionized water for 2 hours. Hydrated samples were quantitatively transferred
to stacked sieves. The top sieve was rinsed for 5 minutes using a three-jet water sprayer
calibrated to a flow of 1 L per minute (D. Mertens, personal communication), then
inverted and contents rinsed into a Gooch crucible under vacuum. This procedure was
repeated for each sieve. Crucibles were dried at 105°C for approximately 36 hours to
determine DM retained on each screen. Results were used to calculate modulus of finess
(MOF) according to Poppi et al. (1980).
Fecal collection and analysis
Attempts at total fecal collection began on day 16 in period 3, and day 15 of each
remaining period, and lasted for 56 - 108 consecutive hours. Duration of total fecal
collection in a given period was often limited by adverse weather conditions or animal
behavior that resulted in sample loss or safety risk to the animal or staff. In period 3,
44
attempts to collect the total daily fecal production of G3 were considered unsuccessful
due to excessive pacing by that animal. Total collection was not attempted on G3 in
period 4. Samples were collected in gallon Ziploc bags approximately six times per day,
as staff became available, and for two hours overnight on days 16 and 17 in period 3, and
days 15 and 16 in remaining periods. Samples were frozen at -23°C for subsequent
analysis.
Fecal samples from each giraffe were composited by each 24 hours of collection,
yielding two consecutive 24-hour composites for each giraffe in each study period, with
the exception of G3 in P4, when total collection was not attempted. Compositing
procedure was as follows. Samples were thawed in their original bags overnight at room
temperature. Each individual bag of fecal material was weighed on a Mettler PE 3600
top-loading balance. Bag contents were emptied into a plastic container. All non-fecal
organic debris and as much contaminating sand as possible were removed from the
sample and returned to the original bag. Bag and debris weight was subtracted from
initial weight to calculate sample wet weight. Sample was mixed manually, and
subsamples of 10% + 0.02% of original wet weight were taken from each bag for each
composite. Two composites were retained for each giraffe by day, and frozen at -13°C
until analysis.
Composite 1 was dried for analysis of DM, OM, NDF and CP. The thawed sample
bag was laid flat and rolled with a plastic cylinder to crush fecal pellets and blend
material, facilitating accuracy of subsampling. Duplicate subsamples of approximately 2-
3 g each were used to determine DM and OM and the remaining sample was dried in a
forced air-oven at 55°C and ground to pass through the 1-mm screen of a Wiley mill.
45
Crude protein as N x 6.25 was determined in duplicate on 0.25 – 0.35 g samples by
combustion analysis (Association of Official Analytical Chemists, 1990) (Vario MAX
CN, Elementar Analysensysteme GmbH, Hanau, Germany). Duplicate samples of 0.7 g
each were used to determine NDFOM using heat-stable α-amylase (Goering and Van
Soest, 1970; Van Soest, 1991 ). Percent digestibility of NDFOM and apparent percent
digestibility of OM and CP were calculated as: (mean g nutrient consumed per day) –
(mean g nutrient defecated per day) / (mean g nutrient consumed per day), using intake
values from days 14 through 20 in each period and fecal samples collected for 48
consecutive hours on days 16 through 18 in periods 3 and 6, and days 15 through 17 in
remaining periods. Nutrient kg digested was calculated as: nutrient kg consumed x
percent digestibility.
Composite 2 was crushed manually, subsampled for DM and OM, and analyzed
wet for CP, to examine for volatile nitrogen (N) loss due to drying and grinding.
Composite 1 and composite 2 samples were analyzed for CP using macro-Kjeldahl
analysis (Association of Official Analytical Chemists, 1990).
Behavior
On days 13 through 15 of each period, behavior was recorded for 48 consecutive
hours by on-site trained observers. Rumination, consumption (supplement, hay, water,
salt and sand), oral stereotypes (tongue play, licking metal and licking non-metal
inanimate objects), tactile contact between giraffe, and locomotor behaviors (standing,
walking, lying down with head erect and lying down with head on flank) were recorded
every sixty seconds using instantaneous sampling (Martin and Bateson, 1986). Results
were analyzed for differences in the number of minutes over 48 hours engaged in each
individual behavior, total oral stereotypes, supplement + hay consumption, supplement +
46
hay consumption + rumination, and total oral behavior (all oral stereotypes + total feed,
water, salt and sand consumption + rumination).
Body weight and blood samples
A 2.4 meter high solid wooden chute system adjacent to pen 1 provided manual
restraint for blood collection. The chute was equipped with a scale for measuring body
weight. At approximately 0800 hours on day 1 of the first period an animal entered the
study and day 21 of each period, weight and body condition scores (scored by C. Kearney
on a scale of 1 through 8) were recorded and blood samples collected on each animal
before feeding. Blood samples were collected via jugular venipuncture using manual
restraint (chute system). Blood samples were collected on all giraffe using clot tubes and
three anti-coagulants: ethylenediaminetetraacetic acid (EDTA), sodium heparin (NaH),
and sodium citrate (NaC) (Vacutainer Brand tubes by Becton Dickinson, Franklin Lakes,
NJ). Blood was collected using an 18- or 14-gauge needle, 30-inch extension set and 35-
cc syringe. Blood samples were transferred into the tubes, placed on ice, and returned to
the zoo hospital laboratory within two hours of collection. Sodium citrate samples were
placed on a rocker until shipping for fibrinogen analysis.
Complete blood count (on whole blood prepared with EDTA) (Automated Cell
Counter) and serum chemistry profiles (Hitachi 747-200 Chemistry Analyzer, Hitachi,
Hitachi-NAKA, Japan) were analyzed by Antech Diagnostics (Largo, FL). Serum
chemistry profiles evaluated glucose, urea nitrogen, creatinine, total protein, albumin,
total bilirubin, alkaline phosphatase, alanine aminotransferase, aspartate
aminotransferase, cholesterol, Ca, P, Na, K, Cl, Mg, globulin, lipase, amylase,
triglycerides, creatinine phosphokinase, gamma-glutamyltransferase, lactate
dehydrogenase, and calculated osmolality. Additional plasma and serum were pipetted
47
into scintillation vials and frozen at –80°C for later analysis. Plasma with NaH was
analyzed for insulin (double antibody radioimmunoassay procedure; Soeldner and
Sloane, 1965), and non-esterified fatty acids (NEFA) (NEFA-C kit; Wako Fine Chemical
Industries USA, Inc., Dallas, TX; as modified by Johnson and Peters (1993) at the
University of Florida.
Statistical analysis
Data were analyzed by the MIXED procedure of SAS (1999). Animal response
data were analyzed using a statistical model that included animal, period, and diet with
animal as a random variable. Supplement nutrient content and fecal nutrient content were
analyzed using the model “nutrient = diet”. Results are reported as least squares means
with standard errors as determine with PROC MIXED. Pearson correlation coefficients
were calculated using the PROC CORR procedure of SAS. Due to the small number of
animals in this study (n=6), significance was declared at P<0.10, and tendency at
0.10<P<0.15.
Results and Discussion
As planned, the EF diet contained greater concentrations of sugar (P<0.001) and
NDSF (P<0.001), and decreased concentrations of starch (P<0.001) (Table 3-2).
Concentrations of ash, lignin, and NDFOM were also greater in EF, and CP
concentrations tended to increase as well, and variable differences occurred in mineral
concentrations (Table 3-2). Supplement particle size differed (P<0.001) between diets.
The EF supplement was courser than GF, with a greater MOF value (4.97) than GF
(3.15).
48
Intake
Average daily DM intake varied greatly among the six animals for both alfalfa hay
(0.12 to 3.94 kg/day) and supplement (2.87 to 9.26 kg/day) consumption, but did not
differ between diets (Table 3-3). As giraffe shifted from consuming supplement GF to
EF, starch intake decreased (P=0.052) from 0.93 to 0.12 kg/ day, sugar intake tended
(P=0.115) to increase from 1.12 to 1.53 kg/day, and NDSF intake increased (P=0.074)
from 0.85 to 1.19 kg/day. Consumption of ADF (1.83 vs. 2.23 kg/day) (P=0.039) and
lignin (0.33 vs. 0.50 kg/day) (P=0.064) differed between animals consuming supplement
GF and those consuming EF, respectively.
Although supplements were formulated to be equivalent in concentration of
minerals, CP, and NDF, analysis of the supplements fed revealed slight differences in
these analytes (Table 3-2). As a result, treatment-associated differences for mineral
intake (Table 3-3) may reflect differences in supplement mineral concentrations.
Differences in supplement nutrient concentration and intake may account for the
increased consumption of NDFOM and ash when giraffes were offered EF. There was a
tendency for greater CP consumption by giraffe offered EF than those offered GF
(P=0.136).
Pellew (1983) estimated intake of wild giraffe in the Serengeti by recording the
number of bites during feeding bouts, then multiplying by mean bite mass. Mean bite
mass was first estimated by hand clipping foliage to simulate giraffe browsing behavior,
then corrected using observations of the number of bites taken by captive giraffe
consuming a known quantity of browse during timed feeding periods. Daily DM intake
was estimated as 19.0 kg for males and 16.6 kg for females. Using average live weights
of 1200 kg and 800 kg, as reported by Dagg and Foster (1976), mean daily DM intake
49
was estimated at 1.6 and 2.1% of BW for males and females, respectively. Dry matter
intake as a percentage of BW in the present study ranged from 0.69 to 1.66% and
averaged 1.22% (+ 0.28), much lower than intake reported for wild giraffe (Pellew,
1983), but similar to DM intake by non-lactating captive giraffe reported by Baer et al.
(1985) of (1.22% of BW) and by Clauss et al. (2001) of (0.97 to 1.28% of BW).
Digestibility
Several challenges occurred with attempted total fecal collection. In period 1, total
collection was attempted on days 15 and 16, but was considered suspect on day 16
because of possible sample loss due to heavy rain. When laboratory analyses yielded
unusually high digestibility values for day 16, it was concluded that total collection likely
had not been achieved, and this day was excluded from data analysis. Digestibility data
from G3 in period 3 and G4 in period 4 were also excluded from data analysis, since
collection records, high sample ash content, and high digestibility results suggested that
excessive trampling had prevented total collection of fecal material and given excessive
contamination with sand. Since collection was not attempted on G3 in period 4, no
digestibility data is reported for period 4.
Because samples were collected from sand-bedded pens, sand contamination was a
continual complicating factor. Although samples were “cleaned” manually at the time of
collection and again prior to compositing, ash content of fecal composites ranged from 20
to 63% of sample DM (20 to 46% in samples included in results). Sand contamination
increased subsampling error, which often increased variation between duplicates when
samples were analyzed for OM, CP, and especially NDFOM at the University of Florida.
Subsampling of fecal samples and analysis of NDFOM was evaluated at the U.S. Dairy
Forage Research Center (USDA-ARS, Madison, WI), where the same difficulties were
50
encountered. In the end, any samples not meeting the Horwitz criteria (Horwitz, 1982)
for difference between duplicates were re-analyzed in duplicate at the University of
Florida, and the mean of four values was reported.
Previous attempts at determining apparent digestibility of DM, NDF, and CP in
captive giraffe fed hay/concentrate diets using acid detergent lignin, acid insoluble ash,
indigestible NDF and alkanes as markers have been summarized by Clauss et al. (2001).
Mean apparent digestibility of CP, OM, and NDFOM in the present study fell within the
range of apparent digestibility of CP (59.7 to 82.4%), DM (52.0 to 85.2%), and NDF
(32.5 to 74.8%) previously reported for captive giraffe (Clauss et al., 2001). Digestibility
of NDFOM averaged 55.5 + 4.0%, and was not affected by treatment (Table 3-3). The
kg of NDFOM digested increased (P=0.077) by 0.25 kg on EF, and was likely due in part
to the 0.47 kg increase in NDFOM intake on EF. Apparent OM digestibility averaged
72.0 + 4.5%, and decreased numerically (P=0.206) on the EF diet. Apparent CP
digestibility was numerically 10 percentage units greater for GF than EF (P=0.151), but
apparent kg of CP digested differed by only 0.06 kg (Table 3-3). The EF supplement
included 4% heat-treated soybean meal, containing protein which is less degradable in
the rumen. We do not know if a ruminally undegradable protein source was present in
GF. This potential difference between supplements may have contributed differences in
true CP digestibility between diets. Alternatively, an increase in yield of ruminal or
hindgut microbes may have facilitated an increased presence of microbial CP in the fecal
material of giraffe consuming EF.
The CP concentrations of feces from giraffe fed EF were greater (P<0.004) than
concentrations for giraffe fed GF using all three analytical techniques (Table 3-4). When
51
fecal samples were analyzed for CP in dry and wet forms, CP concentrations were
generally higher in the wet samples by approximately two percentage units, suggesting a
loss of volatile nitrogen during the drying process. Apparent CP digestibility calculated
using dried feces may have been overestimated as a result.
Behavior
The effect of dietary treatment on giraffe behavior is reported in Table 3-5. The
number of minutes engaged in rumination and hay consumption over 48 hours was not
affected by treatment. Time engaged in supplement consumption was 2.3 times longer
by giraffe offered EF than by giraffe offered GF (P=0.063), and total feeding time tended
(P=0.100) to be greater by giraffe offered EF. The tendency (P=0.124) for increased
time spent in eating and rumination by giraffe fed the EF diet has potential to have
increased saliva flow and ruminal buffering.
Leuthold and Leuthold (1972) reported on the diurnal time budgets of wild giraffe.
Female giraffe spent 53.1% and 15% of daylight hours engaged in feeding and
rumination, respectively (Table 3-6). By contrast, giraffe in this study spent 17.7% and
22% of time feeding and ruminating. It is interesting to note that oral stereotypes, which
have not been observed in wild giraffe, increased the total time captive animals spent
engaged in oral behavior from 39.7% for feeding and rumination alone to 54.1%, which
bears more similarity to the 68.1% of time wild giraffe spent engaged in feeding and
rumination.
Oral stereotypy appears to be the most prevalent stereotypic behavior observed in
captive giraffe. A survey of giraffe and / or okapi-holding American Zoo and Aquariums
Association (AZA) accredited institutions by Bashaw et al. (2001) yielded data on the
occurrence of stereotypes in 214 giraffe and 29 okapi in 49 institutions. The most
52
prevalent stereotypic behaviors were repetitive licking of non-food objects (referred to as
“licking”) and pacing. Licking was reported in 72.4% of giraffe + okapi, and pacing was
reported in 29.9%. Additional behaviors reported in 3.2% of animals included head
tossing, self-injury, and tongue playing. An attempt to reduce incidence of stereotypic
behavior had been made by 51.7% of responding institutions, with reported success in
51.9% of these institutions. Tarou et al. (2003) attempted using Bitter Apple®, a
chemical spray used to deter undesirable chewing in horses, to deter stereotypic licking in
three captive giraffe. Animals simply shifted licking behavior to a non-treated area.
Bashaw et al. (2001) suggested that licking in captive giraffe and okapi may be
related to feeding motivation. In the present study, oral stereotypes were recorded as
three separate oral behaviors: repetitive licking of metal objects, repetitive licking of non-
metal objects, and tongue play unassociated with feeding, rumination, drinking, or
licking. Licking metal was the most prevalent oral stereotype (mean = 258 minutes / 48
hours), followed by tongue play (mean = 105 minutes / 48 hours) and licking non-metal
objects (mean = 20 minutes / 48 hours). The amount of time spent engaged in tongue
play tended (P=0.119) to be twice as long in giraffe offered GF (Table 3-5). Although all
six animals exhibited each of the individual stereotypes, they varied in individual
preference for metal licking or tongue play (Figure 3-1). The number of minutes over 48
hours spent engaged in total oral stereotype behavior ranged from 209 to 661, with a
mean of 383 + 127. Despite the increase in time engaged in feeding behavior, minutes
engaged in total oral stereotyes decreased only numerically (P=0.223) from 433 to 318
minutes in giraffe offered EF.
53
During this study, giraffe were repeatedly observed drooling or swallowing while
engaged in oral stereotype behavior. Although this observation is purely subjective in
nature, it suggests that oral stereotypy may also facilitate some amount of ruminal
buffering.
Blood Measures
Few blood parameters were affected by diet (Table 3-7). Animals consuming GF
had higher (P=0.028) blood glucose values (99.0 mg/dl), compared to those consuming
EF that showed values (82.3 mg/dl) more similar to the range reported for domesticated
ruminants (40-80 mg/dl) (Swenson, 1984). Switching captive giraffe from GF to EF
decreased starch consumption and increased NDSF consumption. Ruminal fermentation
of NDSF rather than starch has increased acetate and decreased propionate concentrations
in ruminal fluid in domestic livestock studies. Since acetate may be utilized directly as
an energy source or used as a lipogenic substrate, whereas propionate is converted largely
to glucose, a potential NFC profile-associated shift in ruminal VFA production offers one
possible explanation for the decreased blood glucose concentrations in giraffe fed EF.
Despite the similarity in apparent kg of CP digested, blood urea nitrogen showed a
numerical decrease (P=0.166) from 20.6 mg/dl in giraffe fed GF to 16.6 mg/dl in those
fed EF. Comparatively for animals consuming EF, this may reflect a shift in dietary
protein utilization towards proliferation of microbial mass, decreased degradation of body
protein, or decreased degradation of absorbed amino acids.
Non-esterified fatty acids (NEFA) decreased numerically for animals consuming
EF (P=0.282), and decreased on EF in all giraffe except G1 (Figure 3-2), who elected to
consume a 99% supplement diet when fed EF. A BW gain of > 15 kg occurred in 5 of 6
giraffe when EF was fed, and only in 1 of 6 giraffe when GF was fed, but treatment-
54
associated changes in BW varied among animals and were not significant (P = 0.327)
(Table 3-3). These observations raise the question of the basis for possibly decreased
adipose tissue mobilization with diet EF. Could part of this effect be the result of
increased NDSF intake and increased mass of NDFOM digested altering ruminal
acetate:propionate ratio, providing the animals with more lipogenic nutrients?
Blood glucose was positively correlated with kg of OM and CP digested and
consumed (Table 3-8). Although BUN showed a positive correlation with apparent kg of
CP digested, a stronger positive correlation existed between BUN and starch intake.
Glucose and BUN were positively correlated with one another, and of the blood proteins
measured, CPK was the only protein positively correlated with both glucose and BUN
(Table 3-9). Increased blood concentrations of CPK have been associated with increased
muscle catabolism.
Ancillary Study Observations / Individual Animal Effects
The giraffe originally designated to serve as G4 became ill at the time of entrance
to the study. As a result, the study was halted for three weeks, and this animal eventually
entered the study as G6. During the break in the study, G3 continued to receive the EF
diet, which she had received in the previous period. Over the 6 weeks on EF, her body
weight increased by 35 kg, from 542 to 577 kg. While pregnancy status may have been a
contributing factor, her weight gain during three weeks on GF was only 3 kg. This
observation, coupled with increased body weight and condition in a lactating non-study
giraffe fed EF for several months suggest that greater changes in animal response may
have been observed had study periods been of longer duration. Furthermore, ancillary
observations suggest that feeding EF to two lactating giraffe not on study may have
increased milk production. When these females were switched from the normal giraffe
55
ration (GF) to EF, the fecal consistency of their calves was loose the following day, and
gradually returned to normal over the subsequent days.
By using six non-lactating adult female giraffe, this study contained the largest and
most similar giraffe population reported in a captive feeding study. Even so, each animal
proved to be a unique individual, exhibiting qualities or behaviors that no doubt affected
study results. Giraffe 1 elected to consume a diet of 98.7% supplement and 1.3% hay
when fed the EF diet. Giraffe 2, an arthritic older female with a historically strong
exhibition of maternal behavior, was on the study for three periods, and received the EF
supplement in both periods 1 and 3. The low mean voluntary intake for G2 in period 1
(0.69% of BW), which was lower than other reported intake values (0.86 to 1.66% of
BW), may have been related to factors other than dietary treatment. During the eleven
acclimation days in period 1 during which as-fed intake values can be considered
reasonably accurate (days without heavy rain), her daily as-fed intake averaged 7.01 kg,
similar to mean DM intake (6.92 kg) during the collection week of period 3. However,
mean daily intake on days 16-18 of period 1 decreased by nearly half, to 3.58 kg (3.31 kg
of DM). This may have been related to environmental factors rather than diet. Sand
erosion caused by heavy rain had made it necessary for G2 to step up onto the concrete
pad in order to access feeders. While attempting to walk onto the concrete pad on day
18, G2 was observed “tripping” over a small irrigation pipe that had been exposed by
sand erosion. After the pipe was removed during the morning feeding on day 19, G2
would not step up onto the concrete, and consumed no feed that day. Consequently, day
19 was removed from analysis of intake results. During morning feeding on day 20, a
sand ramp was constructed, and feeding behavior resumed. However, G2 did not
56
approach the feeders after the evening feeding on day 20, appearing instead to be
preoccupied with the birth and overnight keeper observations of a giraffe calf in an
adjacent pen. Thus, intake amounts on day 20 (3.15 kg of DM) were similar to intake on
days 16 through 18.
Giraffe 3 had not been housed in a small pen prior to this study, and had a history
of nervous behavior around humans. She spent a great deal of time pacing, displaying
nervous behavior which may have affected intake and blood values, and certainly
prevented total fecal collection. Giraffes 3 and 4 frequently engaged in tongue play with
the mouth closed, rather than open, making the behavior difficult to detect from a
distance. Consequently, oral stereotype behavior may have been underestimated or
disproportionately reported in these animals.
Giraffe 5 was on the study for three periods, and received GF supplement in
periods 5 and 7. Prior to study entrance, this primiparous female had been nursing a
rapidly growing calf, and had shown a decline in body weight and condition. Body
weight increased steadily from 611 kg at study entrance to 661 kg at study exit, and body
condition score increased from 3.5 to 4.5 on a scale of 1-8, suggesting that G5 was
recovering from the demands of lactation during her time on the study. Giraffe 5 also
elected to consume hay as a substantially greater proportion (39 to 41%) of total DM
intake than other giraffe. In short, individual animal variation may have played a large
role in the results of this study.
Diet Selection
Both dietary physical form and carbohydrate profile play a role in development or
prevention of ruminal acidosis. Voluntary intake patterns of low amounts of forage and
high amounts of concentrate by captive giraffe appear similar to those associated with
57
ruminal acidosis in domestic livestock. Hay: supplement intake ratios for giraffe in the
current study ranged from 1:99 to 41:59 and averaged 21:79 (DM basis). Previously
reported hay: concentrate intake ratio of two giraffe fed in the same pen was 26:74 (Baer
et al., 1985). Another study using four giraffe supplemented with limited amounts of
browse in addition to lucerne hay and concentrates found forage:concentrate intake ratios
of 25:75 to 51:49 (Clauss et al., 2001). The forage: supplement intake ratios of the 21
measures taken from these three studies averaged 27:73 (DM basis). Decreasing dietary
ratios of forage: concentrate from 40:60 to 30:70 has been used to induce subclinical
ruminal acidosis in dairy cattle (Krajcarski-Hunt et al., 2002). Although giraffe are
believed to be adapted to diets characterized by a rapid ruminal fermentation and nutrient
absorption, a key factor in this adaptation is greatly increased ruminal surface area.
Papillary development plays an important role in stabilizing pH by preventing acid
accumulation via absorption of ruminally-produced organic acids (Dirksen et al., 1985).
The captive giraffe examined by Hofmann and Matern (1988) had approximately 11% of
the ruminal surface area of that found in wild conspecifics, suggesting they had partially
lost their ability to deal with rapid production of VFA in the rumen. Even pH reductions
that do not reach the threshold for ruminal acidosis can alter the ruminal environment,
and notable changes in fermentation characteristics occur when pH decreases to <6.2
(Russell and Wilson, 1996). If hay: concentrate intake ratios of the eleven giraffe in the
three aforementioned studies, low (relative to wild giraffe) feeding and rumination time
by giraffe in the present study, and papillae development of the two giraffe cited in
Hofmann and Matern (1988) are representative of captive giraffe in general, ruminal pH
58
reduction, and quite possibly some degree of ruminal acidosis, is likely occurring in a
substantial percentage of the captive giraffe population.
The lack of documentation of acidosis in captive giraffe may relate to the degree of
pH reduction and the extreme difficulty in diagnosing non-catastrophic degrees of
acidosis without rumen fluid collection (Garrett et al., 1999), which is unlikely to occur
in captive giraffe. Symptoms of subacute (pH<5.5) rather than acute (pH<5.0) acidosis
are “insidious and considerably less overt,” and include decreased or variable feed intake,
decreased efficiency of milk production, poor body condition, unexplained diarrhea, and
episodic laminitis (Nocek, 1997), symptoms which have occurred in captive giraffe, but
have generally been attributed to other causes. The variation in selective consumption of
forage and concentrate noted in the present study may dictate which animals are at
greater risk of ruminal disorders. Provision of mixed diets that reduce the ability of the
animals to selectively consume concentrates may reduce this risk.
Conclusions
Captive giraffe offered EF as compared to those offered GF increased the amount
of time engaged in feeding behavior to a level closer to that observed for wild giraffe,
which also may have increased ruminal buffering via saliva production at the time of
rapidly-fermenting NFC consumption. Decreased starch and increased NDSF contents of
EF facilitated consumption of a carbohydrate profile that may bear a greater similarity to
natural giraffe feedstuffs than typical zoo concentrate diets. A possible resultant shift in
ruminal VFA production toward the high acetate: low propionate profile observed in wild
giraffe could contribute to the observed decrease in blood glucose.
The fact that few significant treatment effects were observed in this study may be a
result of low animal numbers, individual animal variation, and a relatively short time on
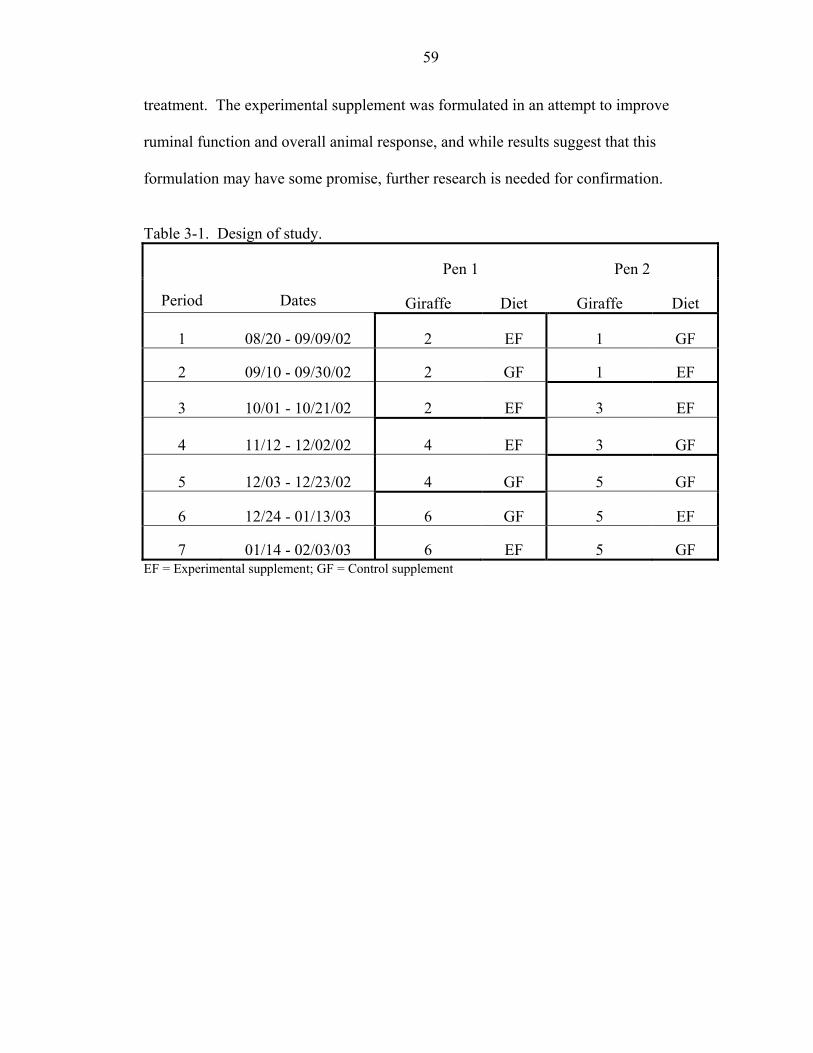
59
treatment. The experimental supplement was formulated in an attempt to improve
ruminal function and overall animal response, and while results suggest that this
formulation may have some promise, further research is needed for confirmation.
Table 3-1. Design of study.
Pen 1 Pen 2
Period Dates Giraffe Diet Giraffe Diet
1 08/20 - 09/09/02 2 EF 1 GF
2 09/10 - 09/30/02 2 GF 1 EF
3 10/01 - 10/21/02 2 EF 3 EF
4 11/12 - 12/02/02 4 EF 3 GF
5 12/03 - 12/23/02 4 GF 5 GF
6 12/24 - 01/13/03 6 GF 5 EF
7 01/14 - 02/03/03 6 EF 5 GF EF = Experimental supplement; GF = Control supplement

60
Table 3-2. Chemical composition of alfalfa hay and supplements (dry matter basis) fed to captive giraffe, and difference between supplements.
-----------------------Supplement ---------------- Alfalfa hay GF EF SE P-values Dry matter (%) 90.8 88.3 85.2 0.29 0.001 Organic matter (%) 91.0 92.0 89.1 0.07 <0.001 Ash (%) 9.04 8.02 10.9 0.07 <0.001 Crude Protein (%) 19.2 17.1 17.6 0.25 0.138 NDFOM (%) 41.2 35.1 40.3 0.60 0.003 ADF (%) 33.8 23.0 26.0 0.41 0.002 Lignin (%) 7.12 3.32 5.67 0.12 <0.001 NDSF (%) 15.2 9.64 14.9 0.25 0.001 Sugar (%) 11.6 14.7 21.4 0.51 <0.001 Starch (%) 1.20 14.2 1.47 0.06 <0.001 Ca (%) 1.65 1.17 1.28 0.02 0.021 P (%) 0.22 0.79 0.65 0.02 0.007 Mg (%) 0.34 0.44 0.56 0.04 0.080 K (%) 1.63 1.21 1.91 0.03 <0.001 Na (%) 0.16 0.30 0.46 0.02 0.003 Fe (ppm) 97.8 413 674 98.9 0.003 Mn (ppm) 31.9 141 1097 75.4 <0.001 Zn (ppm) 37.6 160 282 31.0 0.050 Cu (ppm) 4.94 23.8 29.3 4.26 0.410 NDFOM = neutral detergent fiber organic matter; NDSF = neutral detergent soluble fiber EF (experimental supplement) was calculated to contain 0.29% S, 0.38 ppm Co, 387 ppm Fe, 1.0 ppm I, 0.77 ppm Se, 6.29 KIU/lb Vitamin A, 1.50 KIU/lb Vitamin D,and 118.23 KIU/lb Vitamin E. GF (control supplement) was composed of 75% Mazuri Browser Breeder and 25% Purina Omolene 200. Mazuri Browser Breeder is reported to contain 0.21% S, 0.37 ppm Co, 370 ppm Fe, 1.0 ppm I, 0.69 ppm Se, 16,250 IU/kg Vitamin A, 3,000 IU/kg Vitamin D3 (added), 240 IU/kg Vitamin E, 5.3 ppm Vitamin K, 12 ppm thiamin hydrochloride, 10 ppm riboflavin, 47 ppm niacin, 44 ppm pantothenic acid, 1070 ppm choline chloride, 1.5 ppm folic acid, 9.9 ppm pyridoxine, 0.21 ppm biotin, and 46 mcg/kg Vitamin B12. Purina Omolene 200 is reported to contain not less than 0.60 ppm Se and 3000 IU/lb Vitamin E. Table 3-3. Effects of dietary treatment on mean daily dry matter and nutrient intake,
digestion of organic matter and crude protein (apparent) and NDFOM (true), body weight gain and body condition score.
--------P-values-------- Intake, DM basis GF EF SE Diet Period Total (% of BW) 1.20 1.25 0.10 0.294 0.123 Supplement (% of BW) 1.00 0.98 0.10 0.81 0.237 Hay (% of BW) 0.24 0.23 0.06 0.63 0.332 Total DM, kg/ day 7.60 7.91 0.66 0.527 0.273 Supplement, kg/ day 6.17 6.30 0.58 0.83 0.351
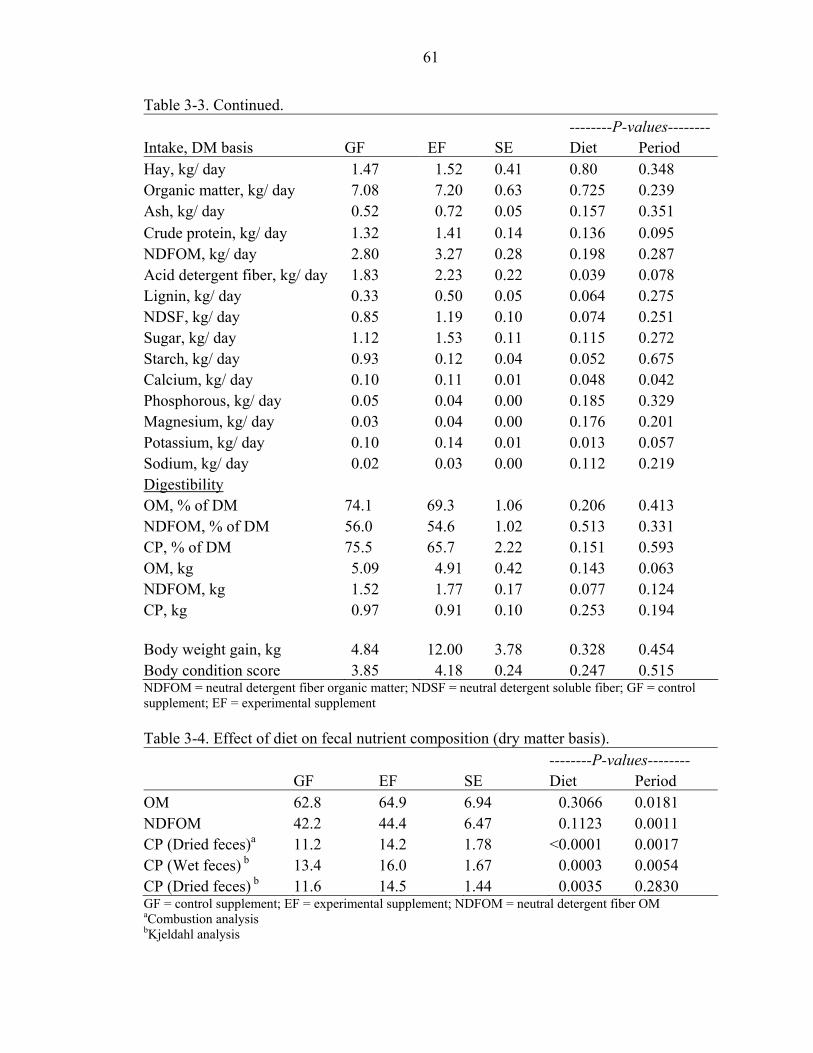
61
Table 3-3. Continued. --------P-values--------Intake, DM basis GF EF SE Diet Period Hay, kg/ day 1.47 1.52 0.41 0.80 0.348 Organic matter, kg/ day 7.08 7.20 0.63 0.725 0.239 Ash, kg/ day 0.52 0.72 0.05 0.157 0.351 Crude protein, kg/ day 1.32 1.41 0.14 0.136 0.095 NDFOM, kg/ day 2.80 3.27 0.28 0.198 0.287 Acid detergent fiber, kg/ day 1.83 2.23 0.22 0.039 0.078 Lignin, kg/ day 0.33 0.50 0.05 0.064 0.275 NDSF, kg/ day 0.85 1.19 0.10 0.074 0.251 Sugar, kg/ day 1.12 1.53 0.11 0.115 0.272 Starch, kg/ day 0.93 0.12 0.04 0.052 0.675 Calcium, kg/ day 0.10 0.11 0.01 0.048 0.042 Phosphorous, kg/ day 0.05 0.04 0.00 0.185 0.329 Magnesium, kg/ day 0.03 0.04 0.00 0.176 0.201 Potassium, kg/ day 0.10 0.14 0.01 0.013 0.057 Sodium, kg/ day 0.02 0.03 0.00 0.112 0.219 Digestibility OM, % of DM 74.1 69.3 1.06 0.206 0.413 NDFOM, % of DM 56.0 54.6 1.02 0.513 0.331 CP, % of DM 75.5 65.7 2.22 0.151 0.593 OM, kg 5.09 4.91 0.42 0.143 0.063 NDFOM, kg 1.52 1.77 0.17 0.077 0.124 CP, kg 0.97 0.91 0.10 0.253 0.194 Body weight gain, kg 4.84 12.00 3.78 0.328 0.454 Body condition score 3.85 4.18 0.24 0.247 0.515 NDFOM = neutral detergent fiber organic matter; NDSF = neutral detergent soluble fiber; GF = control supplement; EF = experimental supplement Table 3-4. Effect of diet on fecal nutrient composition (dry matter basis). --------P-values-------- GF EF SE Diet Period OM 62.8 64.9 6.94 0.3066 0.0181 NDFOM 42.2 44.4 6.47 0.1123 0.0011 CP (Dried feces)a 11.2 14.2 1.78 <0.0001 0.0017 CP (Wet feces) b 13.4 16.0 1.67 0.0003 0.0054 CP (Dried feces) b 11.6 14.5 1.44 0.0035 0.2830 GF = control supplement; EF = experimental supplement; NDFOM = neutral detergent fiber OM aCombustion analysis bKjeldahl analysis
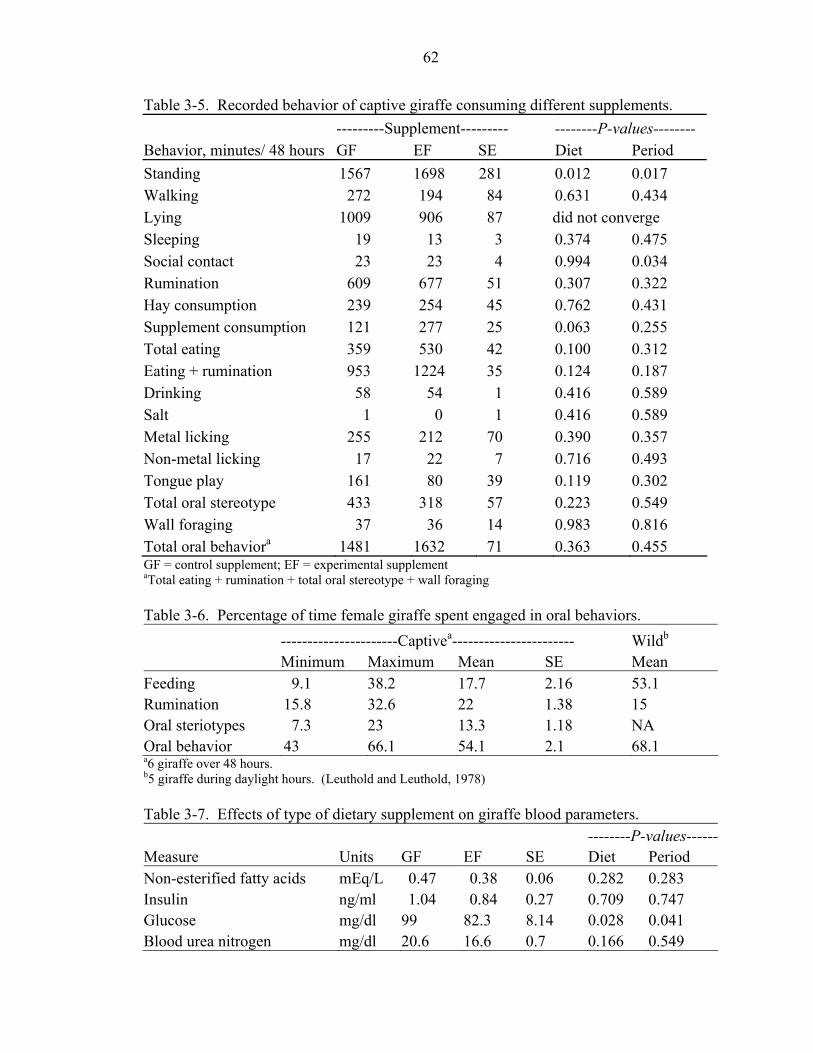
62
Table 3-5. Recorded behavior of captive giraffe consuming different supplements. ---------Supplement--------- --------P-values-------- Behavior, minutes/ 48 hours GF EF SE Diet Period Standing 1567 1698 281 0.012 0.017 Walking 272 194 84 0.631 0.434 Lying 1009 906 87 did not converge Sleeping 19 13 3 0.374 0.475 Social contact 23 23 4 0.994 0.034 Rumination 609 677 51 0.307 0.322 Hay consumption 239 254 45 0.762 0.431 Supplement consumption 121 277 25 0.063 0.255 Total eating 359 530 42 0.100 0.312 Eating + rumination 953 1224 35 0.124 0.187 Drinking 58 54 1 0.416 0.589 Salt 1 0 1 0.416 0.589 Metal licking 255 212 70 0.390 0.357 Non-metal licking 17 22 7 0.716 0.493 Tongue play 161 80 39 0.119 0.302 Total oral stereotype 433 318 57 0.223 0.549 Wall foraging 37 36 14 0.983 0.816 Total oral behaviora 1481 1632 71 0.363 0.455 GF = control supplement; EF = experimental supplement
aTotal eating + rumination + total oral stereotype + wall foraging Table 3-6. Percentage of time female giraffe spent engaged in oral behaviors. ----------------------Captivea----------------------- Wildb Minimum Maximum Mean SE Mean Feeding 9.1 38.2 17.7 2.16 53.1 Rumination 15.8 32.6 22 1.38 15 Oral steriotypes 7.3 23 13.3 1.18 NA Oral behavior 43 66.1 54.1 2.1 68.1 a6 giraffe over 48 hours. b5 giraffe during daylight hours. (Leuthold and Leuthold, 1978) Table 3-7. Effects of type of dietary supplement on giraffe blood parameters. --------P-values------Measure Units GF EF SE Diet Period Non-esterified fatty acids mEq/L 0.47 0.38 0.06 0.282 0.283 Insulin ng/ml 1.04 0.84 0.27 0.709 0.747 Glucose mg/dl 99 82.3 8.14 0.028 0.041 Blood urea nitrogen mg/dl 20.6 16.6 0.7 0.166 0.549
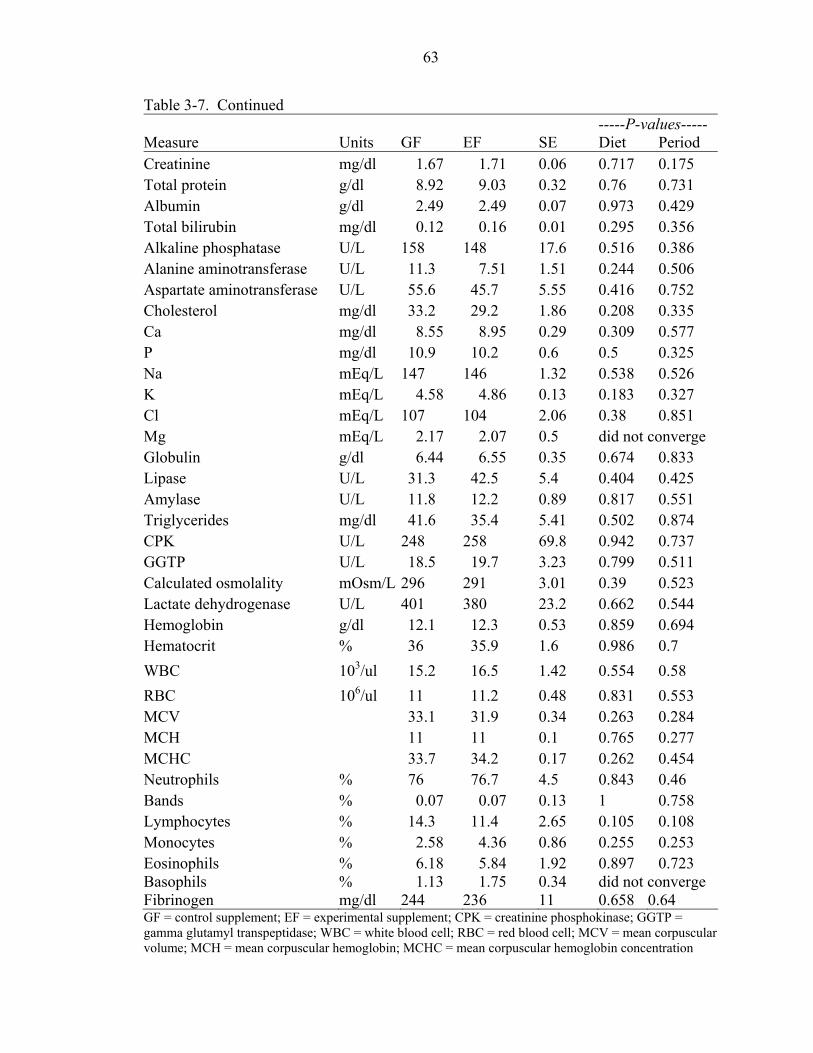
63
Table 3-7. Continued -----P-values----- Measure Units GF EF SE Diet Period Creatinine mg/dl 1.67 1.71 0.06 0.717 0.175 Total protein g/dl 8.92 9.03 0.32 0.76 0.731 Albumin g/dl 2.49 2.49 0.07 0.973 0.429 Total bilirubin mg/dl 0.12 0.16 0.01 0.295 0.356 Alkaline phosphatase U/L 158 148 17.6 0.516 0.386 Alanine aminotransferase U/L 11.3 7.51 1.51 0.244 0.506 Aspartate aminotransferase U/L 55.6 45.7 5.55 0.416 0.752 Cholesterol mg/dl 33.2 29.2 1.86 0.208 0.335 Ca mg/dl 8.55 8.95 0.29 0.309 0.577 P mg/dl 10.9 10.2 0.6 0.5 0.325 Na mEq/L 147 146 1.32 0.538 0.526 K mEq/L 4.58 4.86 0.13 0.183 0.327 Cl mEq/L 107 104 2.06 0.38 0.851 Mg mEq/L 2.17 2.07 0.5 did not converge Globulin g/dl 6.44 6.55 0.35 0.674 0.833 Lipase U/L 31.3 42.5 5.4 0.404 0.425 Amylase U/L 11.8 12.2 0.89 0.817 0.551 Triglycerides mg/dl 41.6 35.4 5.41 0.502 0.874 CPK U/L 248 258 69.8 0.942 0.737 GGTP U/L 18.5 19.7 3.23 0.799 0.511 Calculated osmolality mOsm/L 296 291 3.01 0.39 0.523 Lactate dehydrogenase U/L 401 380 23.2 0.662 0.544 Hemoglobin g/dl 12.1 12.3 0.53 0.859 0.694 Hematocrit % 36 35.9 1.6 0.986 0.7 WBC 103/ul 15.2 16.5 1.42 0.554 0.58 RBC 106/ul 11 11.2 0.48 0.831 0.553 MCV 33.1 31.9 0.34 0.263 0.284 MCH 11 11 0.1 0.765 0.277 MCHC 33.7 34.2 0.17 0.262 0.454 Neutrophils % 76 76.7 4.5 0.843 0.46 Bands % 0.07 0.07 0.13 1 0.758 Lymphocytes % 14.3 11.4 2.65 0.105 0.108 Monocytes % 2.58 4.36 0.86 0.255 0.253 Eosinophils % 6.18 5.84 1.92 0.897 0.723 Basophils % 1.13 1.75 0.34 did not converge Fibrinogen mg/dl 244 236 11 0.658 0.64 GF = control supplement; EF = experimental supplement; CPK = creatinine phosphokinase; GGTP = gamma glutamyl transpeptidase; WBC = white blood cell; RBC = red blood cell; MCV = mean corpuscular volume; MCH = mean corpuscular hemoglobin; MCHC = mean corpuscular hemoglobin concentration
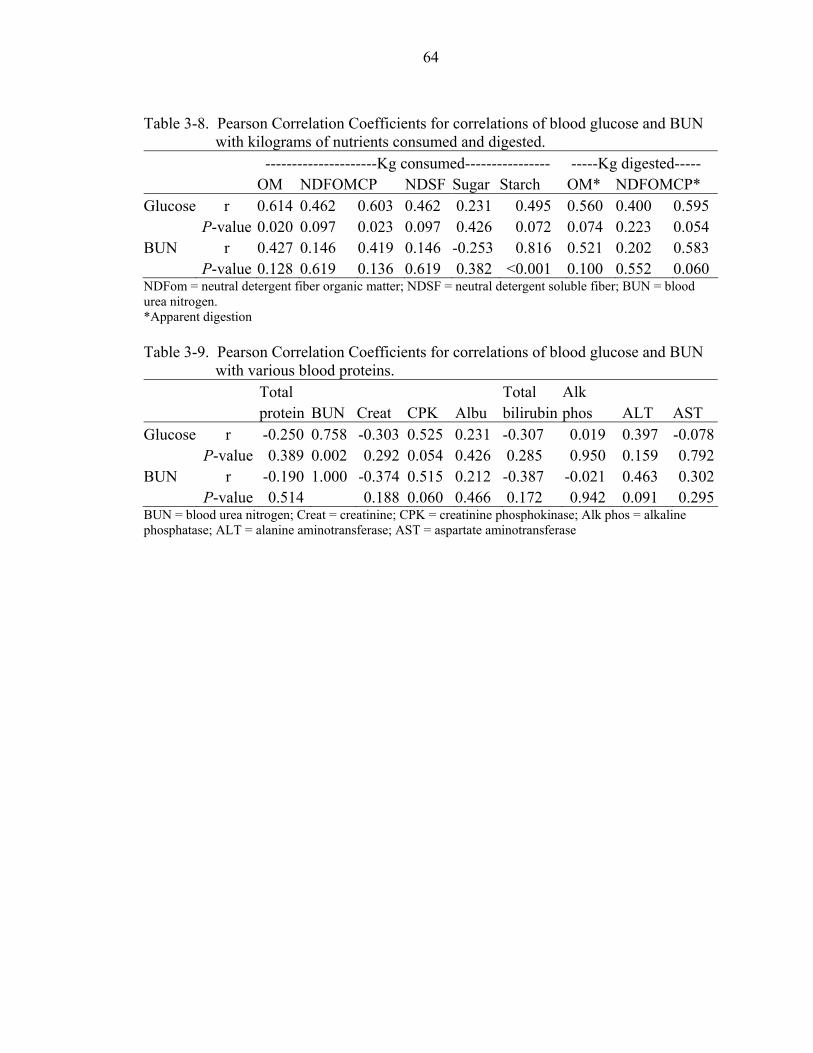
64
Table 3-8. Pearson Correlation Coefficients for correlations of blood glucose and BUN
with kilograms of nutrients consumed and digested. ---------------------Kg consumed---------------- -----Kg digested----- OM NDFOMCP NDSF Sugar Starch OM* NDFOMCP* Glucose r 0.614 0.462 0.603 0.462 0.231 0.495 0.560 0.400 0.595 P-value 0.020 0.097 0.023 0.097 0.426 0.072 0.074 0.223 0.054 BUN r 0.427 0.146 0.419 0.146 -0.253 0.816 0.521 0.202 0.583 P-value 0.128 0.619 0.136 0.619 0.382 <0.001 0.100 0.552 0.060 NDFom = neutral detergent fiber organic matter; NDSF = neutral detergent soluble fiber; BUN = blood urea nitrogen. *Apparent digestion Table 3-9. Pearson Correlation Coefficients for correlations of blood glucose and BUN
with various blood proteins. Total Total Alk protein BUN Creat CPK Albu bilirubin phos ALT AST Glucose r -0.250 0.758 -0.303 0.525 0.231 -0.307 0.019 0.397 -0.078 P-value 0.389 0.002 0.292 0.054 0.426 0.285 0.950 0.159 0.792BUN r -0.190 1.000 -0.374 0.515 0.212 -0.387 -0.021 0.463 0.302 P-value 0.514 0.188 0.060 0.466 0.172 0.942 0.091 0.295BUN = blood urea nitrogen; Creat = creatinine; CPK = creatinine phosphokinase; Alk phos = alkaline phosphatase; ALT = alanine aminotransferase; AST = aspartate aminotransferase
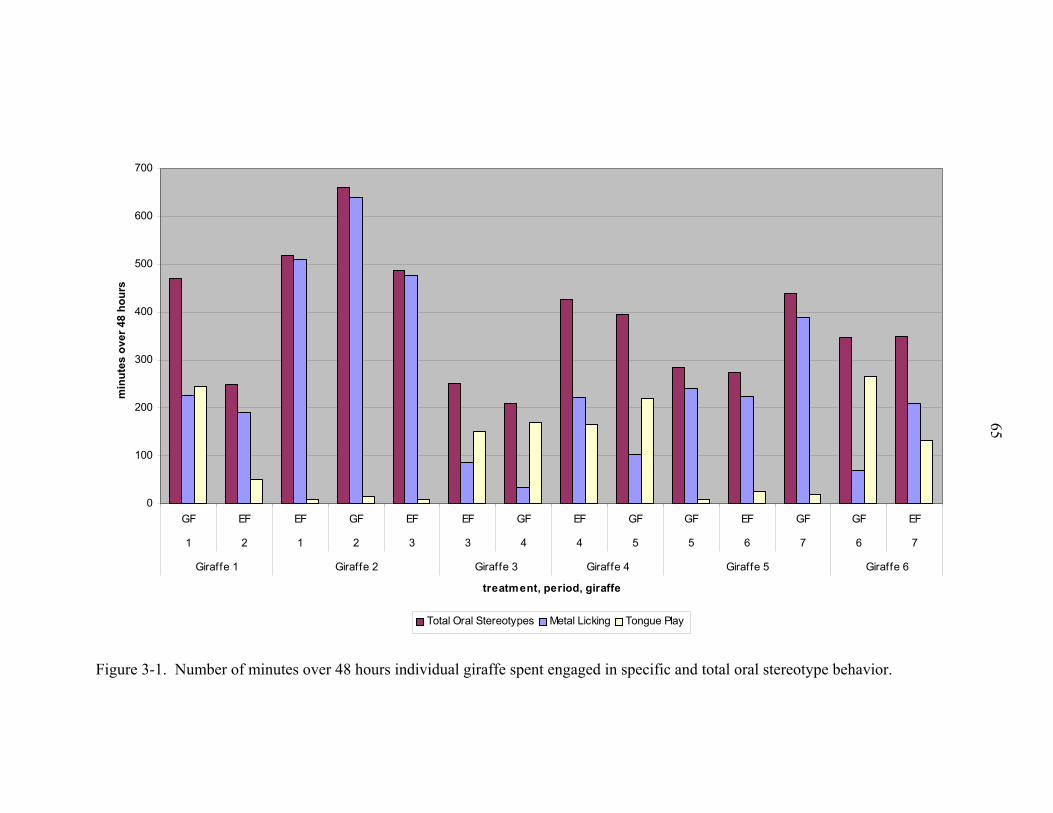
65
0
100
200
300
400
500
600
700
GF EF EF GF EF EF GF EF GF GF EF GF GF EF
1 2 1 2 3 3 4 4 5 5 6 7 6 7
Giraffe 1 Giraffe 2 Giraffe 3 Giraffe 4 Giraffe 5 Giraffe 6
treatment, period, giraffe
min
utes
ove
r 48
hour
s
Total Oral Stereotypes Metal Licking Tongue Play
Figure 3-1. Number of minutes over 48 hours individual giraffe spent engaged in specific and total oral stereotype behavior.
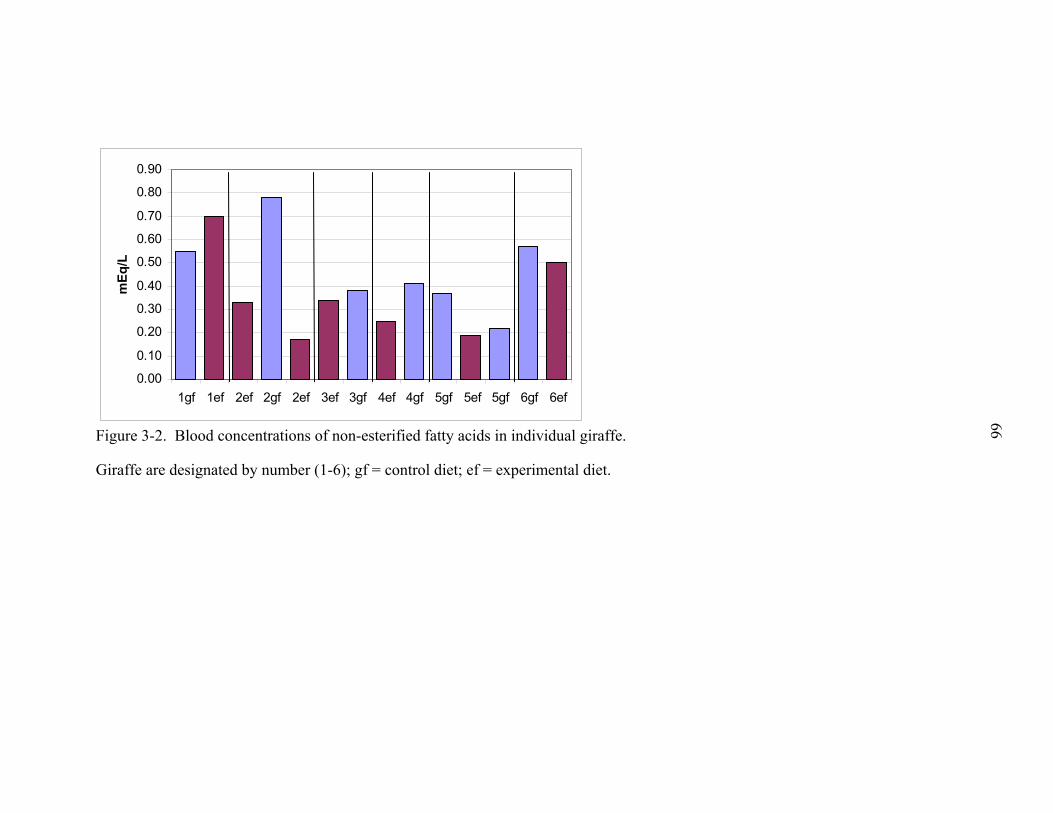
66
0.00
0.10
0.20
0.30
0.40
0.50
0.60
0.70
0.80
0.90
1gf 1ef 2ef 2gf 2ef 3ef 3gf 4ef 4gf 5gf 5ef 5gf 6gf 6ef
mEq
/L
Figure 3-2. Blood concentrations of non-esterified fatty acids in individual giraffe.
Giraffe are designated by number (1-6); gf = control diet; ef = experimental diet.

APPENDIX A INDIVIDUAL ANIMAL MEASURES
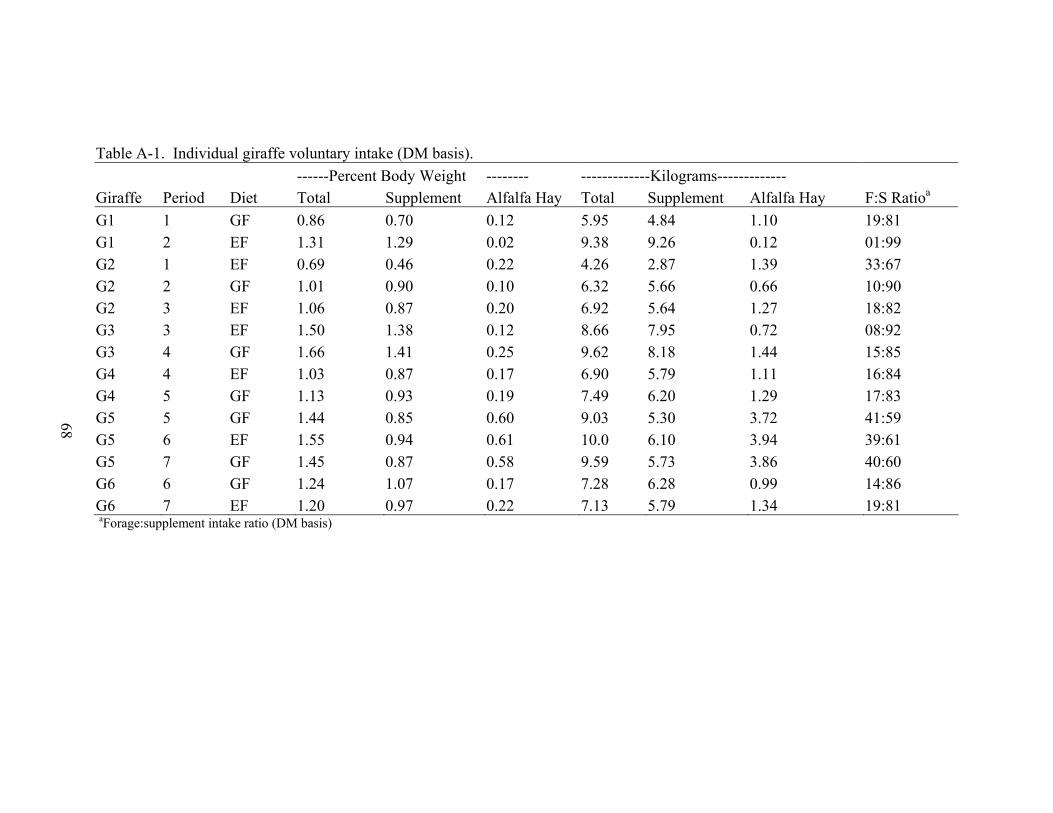
68
Table A-1. Individual giraffe voluntary intake (DM basis). ------Percent Body Weight -------- -------------Kilograms------------- Giraffe Period Diet Total Supplement Alfalfa Hay Total Supplement Alfalfa Hay F:S Ratioa G1 1 GF 0.86 0.70 0.12 5.95 4.84 1.10 19:81 G1 2 EF 1.31 1.29 0.02 9.38 9.26 0.12 01:99 G2 1 EF 0.69 0.46 0.22 4.26 2.87 1.39 33:67 G2 2 GF 1.01 0.90 0.10 6.32 5.66 0.66 10:90 G2 3 EF 1.06 0.87 0.20 6.92 5.64 1.27 18:82 G3 3 EF 1.50 1.38 0.12 8.66 7.95 0.72 08:92 G3 4 GF 1.66 1.41 0.25 9.62 8.18 1.44 15:85 G4 4 EF 1.03 0.87 0.17 6.90 5.79 1.11 16:84 G4 5 GF 1.13 0.93 0.19 7.49 6.20 1.29 17:83 G5 5 GF 1.44 0.85 0.60 9.03 5.30 3.72 41:59 G5 6 EF 1.55 0.94 0.61 10.0 6.10 3.94 39:61 G5 7 GF 1.45 0.87 0.58 9.59 5.73 3.86 40:60 G6 6 GF 1.24 1.07 0.17 7.28 6.28 0.99 14:86 G6 7 EF 1.20 0.97 0.22 7.13 5.79 1.34 19:81 aForage:supplement intake ratio (DM basis)
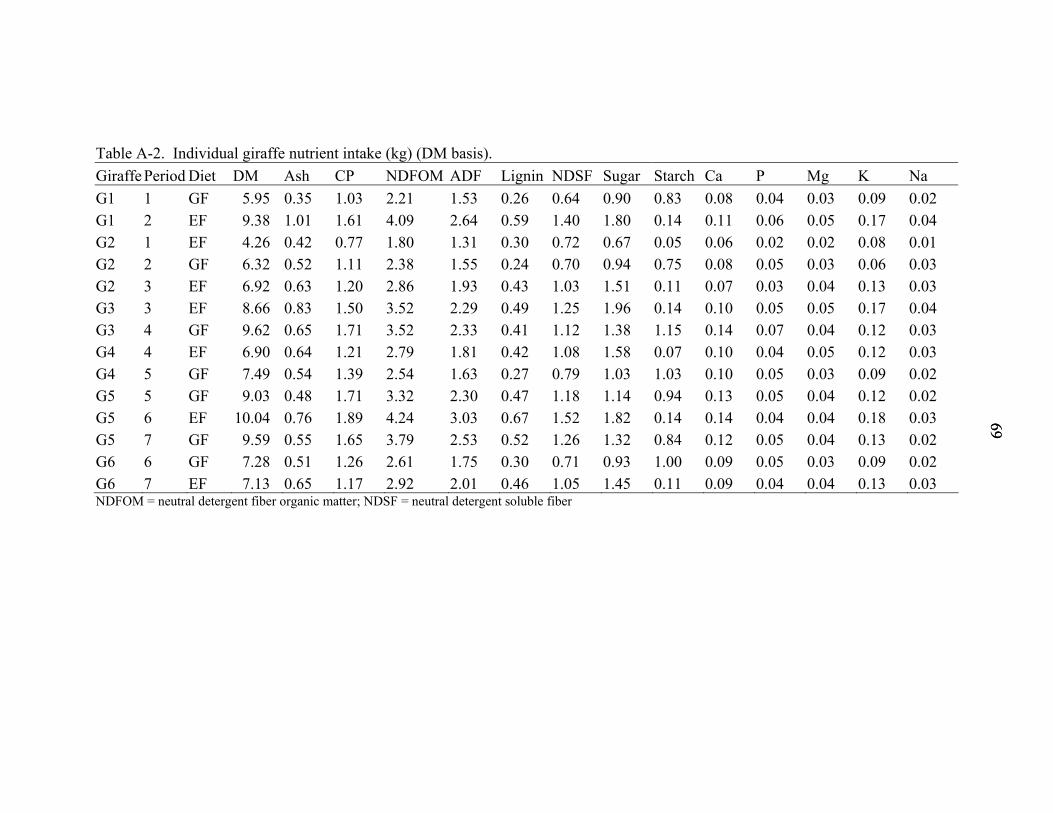
6969
Table A-2. Individual giraffe nutrient intake (kg) (DM basis). Giraffe Period Diet DM Ash CP NDFOM ADF Lignin NDSF Sugar Starch Ca P Mg K Na G1 1 GF 5.95 0.35 1.03 2.21 1.53 0.26 0.64 0.90 0.83 0.08 0.04 0.03 0.09 0.02 G1 2 EF 9.38 1.01 1.61 4.09 2.64 0.59 1.40 1.80 0.14 0.11 0.06 0.05 0.17 0.04 G2 1 EF 4.26 0.42 0.77 1.80 1.31 0.30 0.72 0.67 0.05 0.06 0.02 0.02 0.08 0.01 G2 2 GF 6.32 0.52 1.11 2.38 1.55 0.24 0.70 0.94 0.75 0.08 0.05 0.03 0.06 0.03 G2 3 EF 6.92 0.63 1.20 2.86 1.93 0.43 1.03 1.51 0.11 0.07 0.03 0.04 0.13 0.03 G3 3 EF 8.66 0.83 1.50 3.52 2.29 0.49 1.25 1.96 0.14 0.10 0.05 0.05 0.17 0.04 G3 4 GF 9.62 0.65 1.71 3.52 2.33 0.41 1.12 1.38 1.15 0.14 0.07 0.04 0.12 0.03 G4 4 EF 6.90 0.64 1.21 2.79 1.81 0.42 1.08 1.58 0.07 0.10 0.04 0.05 0.12 0.03 G4 5 GF 7.49 0.54 1.39 2.54 1.63 0.27 0.79 1.03 1.03 0.10 0.05 0.03 0.09 0.02 G5 5 GF 9.03 0.48 1.71 3.32 2.30 0.47 1.18 1.14 0.94 0.13 0.05 0.04 0.12 0.02 G5 6 EF 10.04 0.76 1.89 4.24 3.03 0.67 1.52 1.82 0.14 0.14 0.04 0.04 0.18 0.03 G5 7 GF 9.59 0.55 1.65 3.79 2.53 0.52 1.26 1.32 0.84 0.12 0.05 0.04 0.13 0.02 G6 6 GF 7.28 0.51 1.26 2.61 1.75 0.30 0.71 0.93 1.00 0.09 0.05 0.03 0.09 0.02 G6 7 EF 7.13 0.65 1.17 2.92 2.01 0.46 1.05 1.45 0.11 0.09 0.04 0.04 0.13 0.03 NDFOM = neutral detergent fiber organic matter; NDSF = neutral detergent soluble fiber
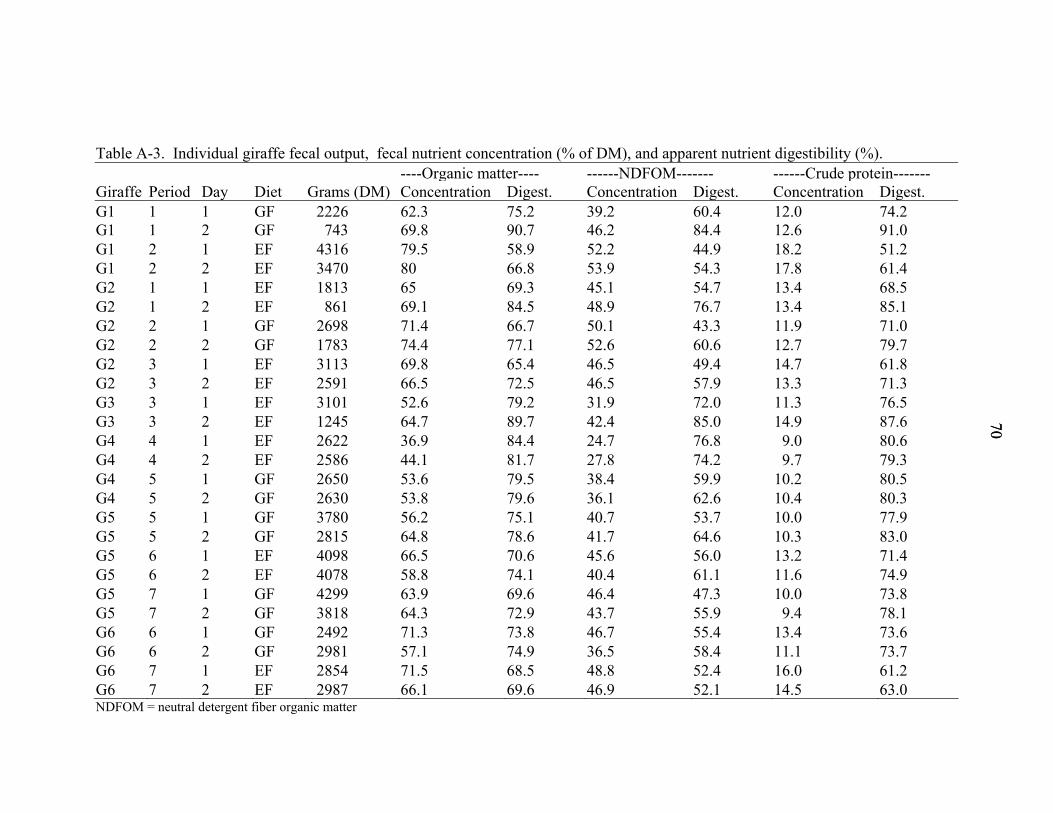
7070
Table A-3. Individual giraffe fecal output, fecal nutrient concentration (% of DM), and apparent nutrient digestibility (%). ----Organic matter---- ------NDFOM------- ------Crude protein-------Giraffe Period Day Diet Grams (DM) Concentration Digest. Concentration Digest. Concentration Digest. G1 1 1 GF 2226 62.3 75.2 39.2 60.4 12.0 74.2G1 1 2 GF 743 69.8 90.7 46.2 84.4 12.6 91.0G1 2 1 EF 4316 79.5 58.9 52.2 44.9 18.2 51.2G1 2 2 EF 3470 80 66.8 53.9 54.3 17.8 61.4G2 1 1 EF 1813 65 69.3 45.1 54.7 13.4 68.5G2 1 2 EF 861 69.1 84.5 48.9 76.7 13.4 85.1G2 2 1 GF 2698 71.4 66.7 50.1 43.3 11.9 71.0G2 2 2 GF 1783 74.4 77.1 52.6 60.6 12.7 79.7G2 3 1 EF 3113 69.8 65.4 46.5 49.4 14.7 61.8G2 3 2 EF 2591 66.5 72.5 46.5 57.9 13.3 71.3G3 3 1 EF 3101 52.6 79.2 31.9 72.0 11.3 76.5G3 3 2 EF 1245 64.7 89.7 42.4 85.0 14.9 87.6G4 4 1 EF 2622 36.9 84.4 24.7 76.8 9.0 80.6G4 4 2 EF 2586 44.1 81.7 27.8 74.2 9.7 79.3G4 5 1 GF 2650 53.6 79.5 38.4 59.9 10.2 80.5G4 5 2 GF 2630 53.8 79.6 36.1 62.6 10.4 80.3G5 5 1 GF 3780 56.2 75.1 40.7 53.7 10.0 77.9G5 5 2 GF 2815 64.8 78.6 41.7 64.6 10.3 83.0G5 6 1 EF 4098 66.5 70.6 45.6 56.0 13.2 71.4G5 6 2 EF 4078 58.8 74.1 40.4 61.1 11.6 74.9G5 7 1 GF 4299 63.9 69.6 46.4 47.3 10.0 73.8G5 7 2 GF 3818 64.3 72.9 43.7 55.9 9.4 78.1G6 6 1 GF 2492 71.3 73.8 46.7 55.4 13.4 73.6G6 6 2 GF 2981 57.1 74.9 36.5 58.4 11.1 73.7G6 7 1 EF 2854 71.5 68.5 48.8 52.4 16.0 61.2G6 7 2 EF 2987 66.1 69.6 46.9 52.1 14.5 63.0NDFOM = neutral detergent fiber organic matter
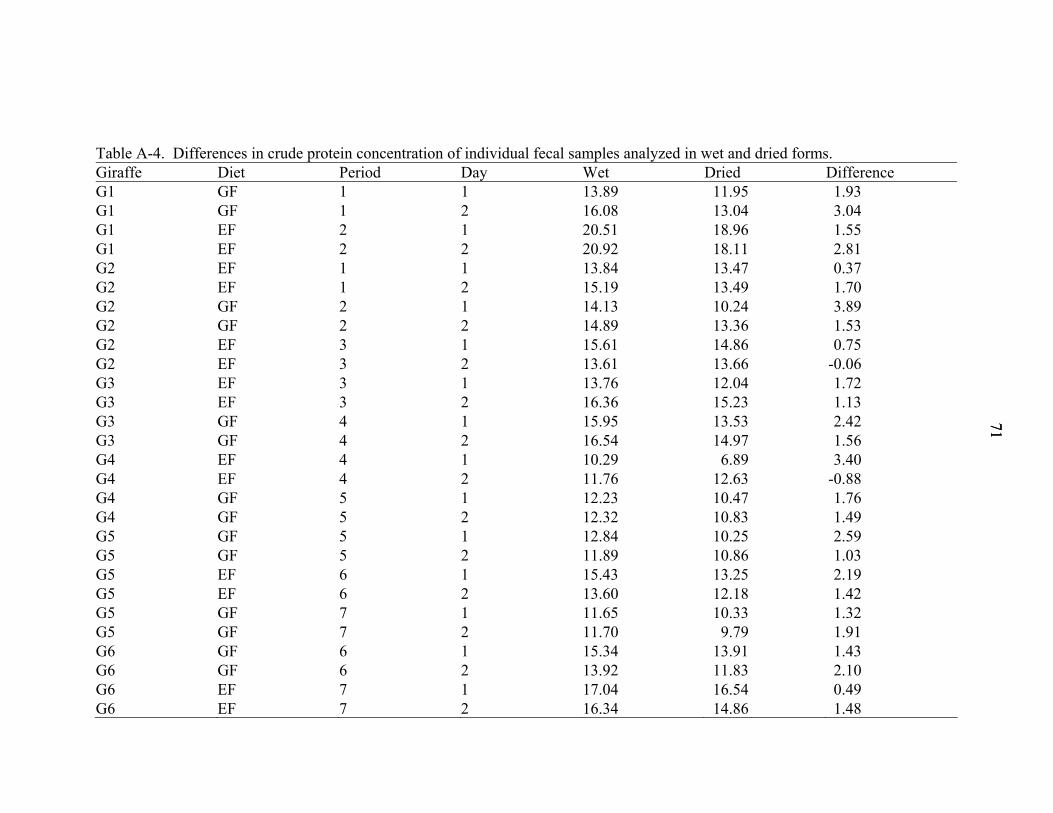
7171
Table A-4. Differences in crude protein concentration of individual fecal samples analyzed in wet and dried forms. Giraffe Diet Period Day Wet Dried Difference G1 GF 1 1 13.89 11.95 1.93 G1 GF 1 2 16.08 13.04 3.04 G1 EF 2 1 20.51 18.96 1.55 G1 EF 2 2 20.92 18.11 2.81 G2 EF 1 1 13.84 13.47 0.37 G2 EF 1 2 15.19 13.49 1.70 G2 GF 2 1 14.13 10.24 3.89 G2 GF 2 2 14.89 13.36 1.53 G2 EF 3 1 15.61 14.86 0.75 G2 EF 3 2 13.61 13.66 -0.06 G3 EF 3 1 13.76 12.04 1.72 G3 EF 3 2 16.36 15.23 1.13 G3 GF 4 1 15.95 13.53 2.42 G3 GF 4 2 16.54 14.97 1.56 G4 EF 4 1 10.29 6.89 3.40 G4 EF 4 2 11.76 12.63 -0.88 G4 GF 5 1 12.23 10.47 1.76 G4 GF 5 2 12.32 10.83 1.49 G5 GF 5 1 12.84 10.25 2.59 G5 GF 5 2 11.89 10.86 1.03 G5 EF 6 1 15.43 13.25 2.19 G5 EF 6 2 13.60 12.18 1.42 G5 GF 7 1 11.65 10.33 1.32 G5 GF 7 2 11.70 9.79 1.91 G6 GF 6 1 15.34 13.91 1.43 G6 GF 6 2 13.92 11.83 2.10 G6 EF 7 1 17.04 16.54 0.49 G6 EF 7 2 16.34 14.86 1.48
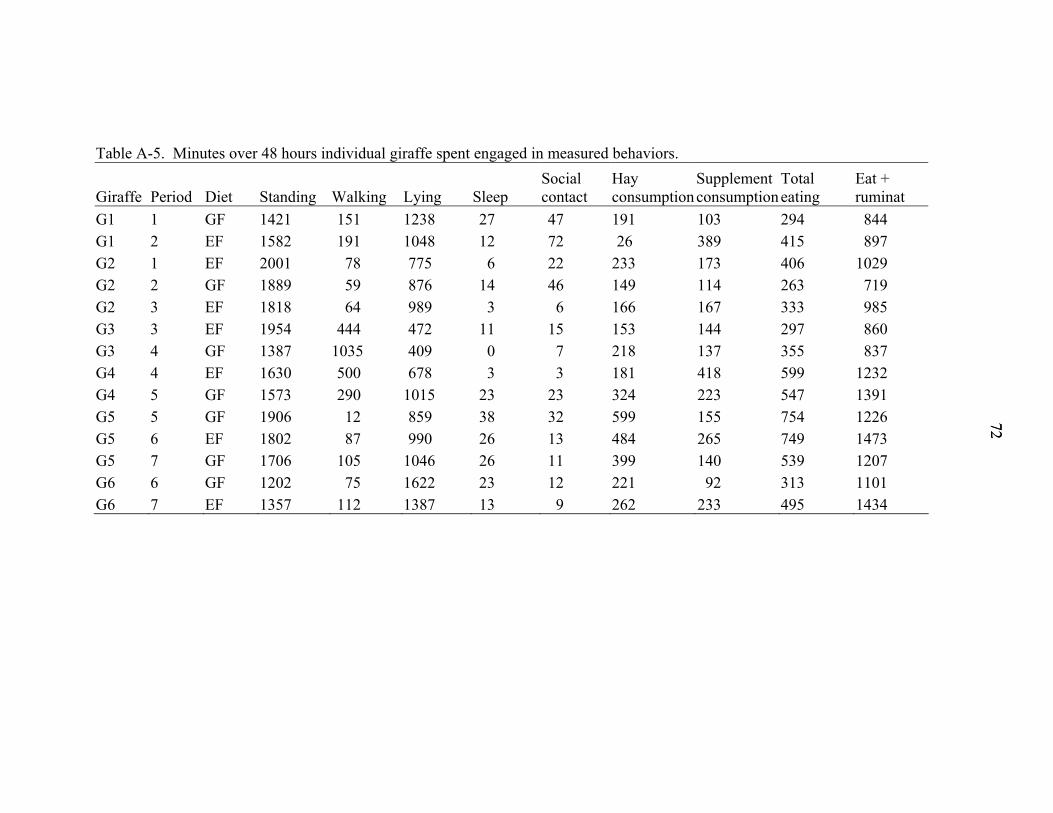
7272
Table A-5. Minutes over 48 hours individual giraffe spent engaged in measured behaviors.
Giraffe Period Diet Standing Walking Lying Sleep Social contact
Hay consumption
Supplement consumption
Total eating
Eat + ruminat
G1 1 GF 1421 151 1238 27 47 191 103 294 844 G1 2 EF 1582 191 1048 12 72 26 389 415 897 G2 1 EF 2001 78 775 6 22 233 173 406 1029 G2 2 GF 1889 59 876 14 46 149 114 263 719 G2 3 EF 1818 64 989 3 6 166 167 333 985 G3 3 EF 1954 444 472 11 15 153 144 297 860 G3 4 GF 1387 1035 409 0 7 218 137 355 837 G4 4 EF 1630 500 678 3 3 181 418 599 1232 G4 5 GF 1573 290 1015 23 23 324 223 547 1391 G5 5 GF 1906 12 859 38 32 599 155 754 1226 G5 6 EF 1802 87 990 26 13 484 265 749 1473 G5 7 GF 1706 105 1046 26 11 399 140 539 1207 G6 6 GF 1202 75 1622 23 12 221 92 313 1101 G6 7 EF 1357 112 1387 13 9 262 233 495 1434
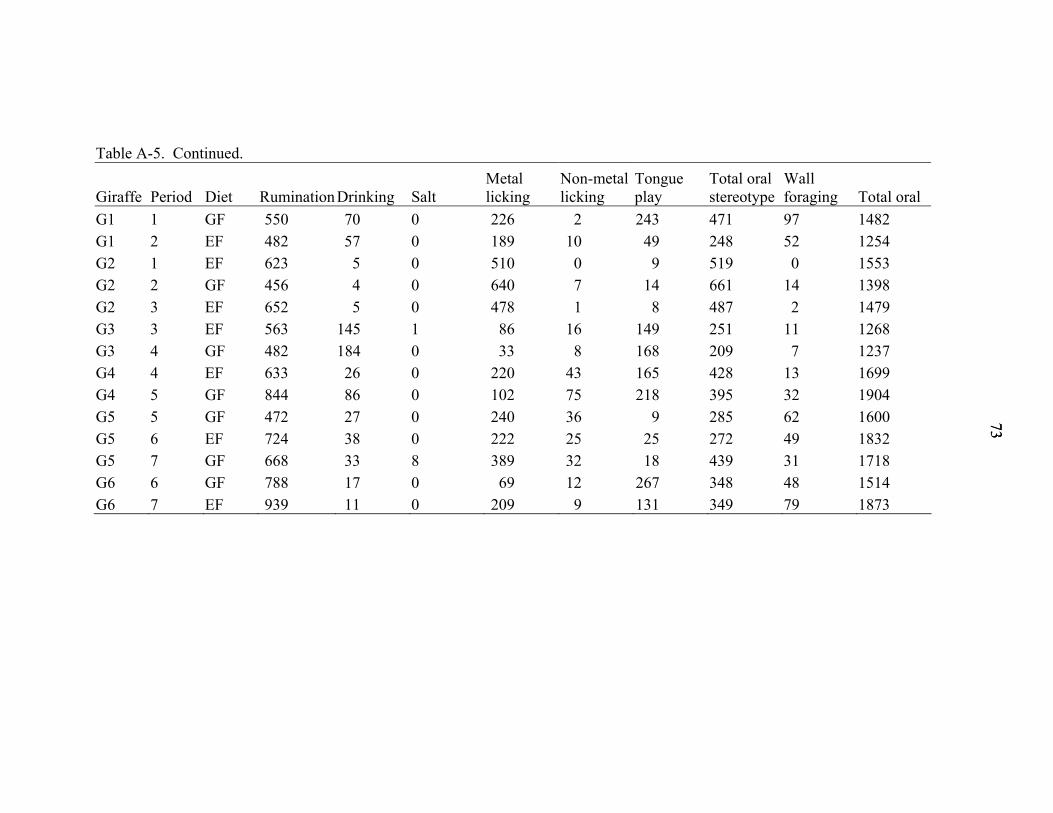
7373
Table A-5. Continued.
Giraffe Period Diet RuminationDrinking Salt Metal licking
Non-metal licking
Tongue play
Total oral stereotype
Wall foraging Total oral
G1 1 GF 550 70 0 226 2 243 471 97 1482 G1 2 EF 482 57 0 189 10 49 248 52 1254 G2 1 EF 623 5 0 510 0 9 519 0 1553 G2 2 GF 456 4 0 640 7 14 661 14 1398 G2 3 EF 652 5 0 478 1 8 487 2 1479 G3 3 EF 563 145 1 86 16 149 251 11 1268 G3 4 GF 482 184 0 33 8 168 209 7 1237 G4 4 EF 633 26 0 220 43 165 428 13 1699 G4 5 GF 844 86 0 102 75 218 395 32 1904 G5 5 GF 472 27 0 240 36 9 285 62 1600 G5 6 EF 724 38 0 222 25 25 272 49 1832 G5 7 GF 668 33 8 389 32 18 439 31 1718 G6 6 GF 788 17 0 69 12 267 348 48 1514 G6 7 EF 939 11 0 209 9 131 349 79 1873
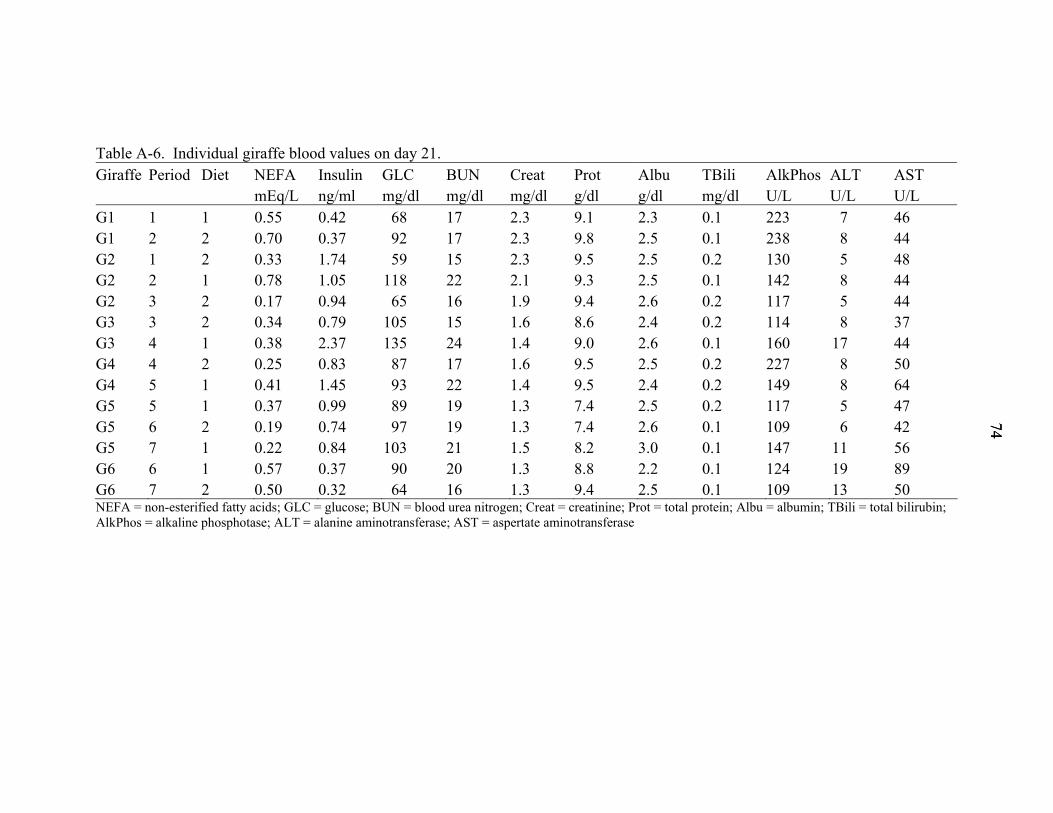
7474
Table A-6. Individual giraffe blood values on day 21. Giraffe Period Diet NEFA Insulin GLC BUN Creat Prot Albu TBili AlkPhos ALT AST mEq/L ng/ml mg/dl mg/dl mg/dl g/dl g/dl mg/dl U/L U/L U/L G1 1 1 0.55 0.42 68 17 2.3 9.1 2.3 0.1 223 7 46 G1 2 2 0.70 0.37 92 17 2.3 9.8 2.5 0.1 238 8 44 G2 1 2 0.33 1.74 59 15 2.3 9.5 2.5 0.2 130 5 48 G2 2 1 0.78 1.05 118 22 2.1 9.3 2.5 0.1 142 8 44 G2 3 2 0.17 0.94 65 16 1.9 9.4 2.6 0.2 117 5 44 G3 3 2 0.34 0.79 105 15 1.6 8.6 2.4 0.2 114 8 37 G3 4 1 0.38 2.37 135 24 1.4 9.0 2.6 0.1 160 17 44 G4 4 2 0.25 0.83 87 17 1.6 9.5 2.5 0.2 227 8 50 G4 5 1 0.41 1.45 93 22 1.4 9.5 2.4 0.2 149 8 64 G5 5 1 0.37 0.99 89 19 1.3 7.4 2.5 0.2 117 5 47 G5 6 2 0.19 0.74 97 19 1.3 7.4 2.6 0.1 109 6 42 G5 7 1 0.22 0.84 103 21 1.5 8.2 3.0 0.1 147 11 56 G6 6 1 0.57 0.37 90 20 1.3 8.8 2.2 0.1 124 19 89 G6 7 2 0.50 0.32 64 16 1.3 9.4 2.5 0.1 109 13 50 NEFA = non-esterified fatty acids; GLC = glucose; BUN = blood urea nitrogen; Creat = creatinine; Prot = total protein; Albu = albumin; TBili = total bilirubin; AlkPhos = alkaline phosphotase; ALT = alanine aminotransferase; AST = aspertate aminotransferase
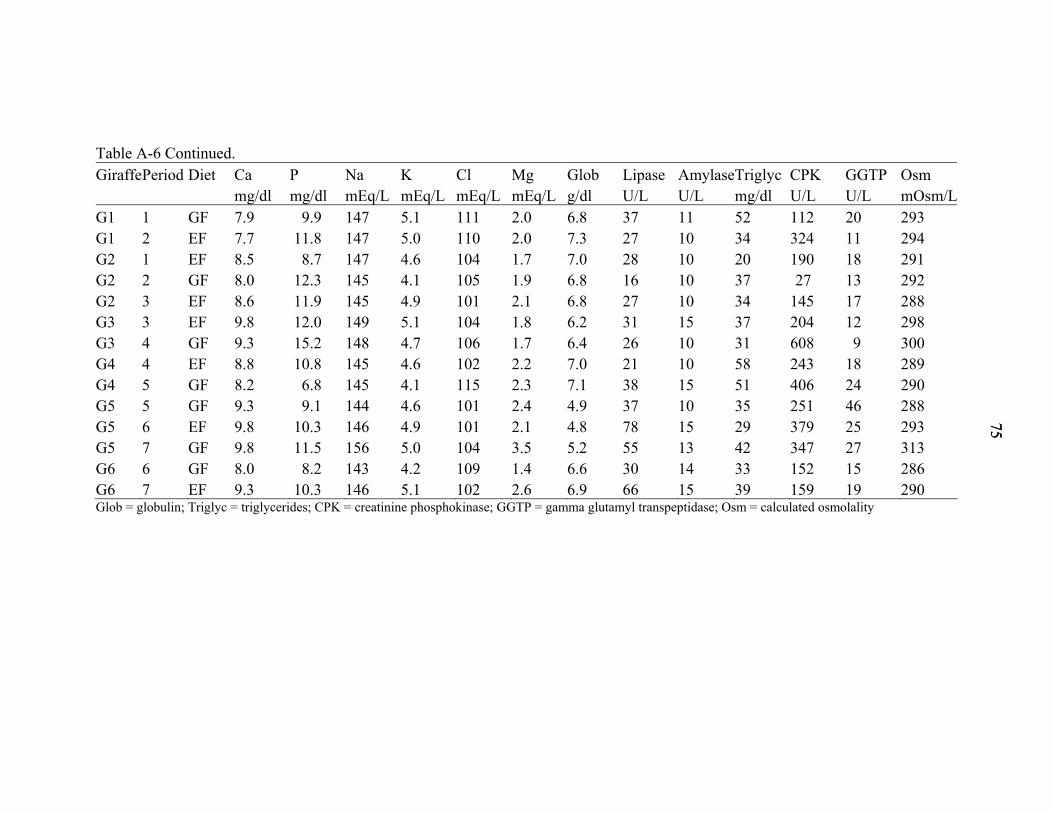
7575
Table A-6 Continued. Giraffe Period Diet Ca P Na K Cl Mg Glob Lipase AmylaseTriglyc CPK GGTP Osm mg/dl mg/dl mEq/L mEq/L mEq/L mEq/L g/dl U/L U/L mg/dl U/L U/L mOsm/LG1 1 GF 7.9 9.9 147 5.1 111 2.0 6.8 37 11 52 112 20 293 G1 2 EF 7.7 11.8 147 5.0 110 2.0 7.3 27 10 34 324 11 294 G2 1 EF 8.5 8.7 147 4.6 104 1.7 7.0 28 10 20 190 18 291 G2 2 GF 8.0 12.3 145 4.1 105 1.9 6.8 16 10 37 27 13 292 G2 3 EF 8.6 11.9 145 4.9 101 2.1 6.8 27 10 34 145 17 288 G3 3 EF 9.8 12.0 149 5.1 104 1.8 6.2 31 15 37 204 12 298 G3 4 GF 9.3 15.2 148 4.7 106 1.7 6.4 26 10 31 608 9 300 G4 4 EF 8.8 10.8 145 4.6 102 2.2 7.0 21 10 58 243 18 289 G4 5 GF 8.2 6.8 145 4.1 115 2.3 7.1 38 15 51 406 24 290 G5 5 GF 9.3 9.1 144 4.6 101 2.4 4.9 37 10 35 251 46 288 G5 6 EF 9.8 10.3 146 4.9 101 2.1 4.8 78 15 29 379 25 293 G5 7 GF 9.8 11.5 156 5.0 104 3.5 5.2 55 13 42 347 27 313 G6 6 GF 8.0 8.2 143 4.2 109 1.4 6.6 30 14 33 152 15 286 G6 7 EF 9.3 10.3 146 5.1 102 2.6 6.9 66 15 39 159 19 290 Glob = globulin; Triglyc = triglycerides; CPK = creatinine phosphokinase; GGTP = gamma glutamyl transpeptidase; Osm = calculated osmolality
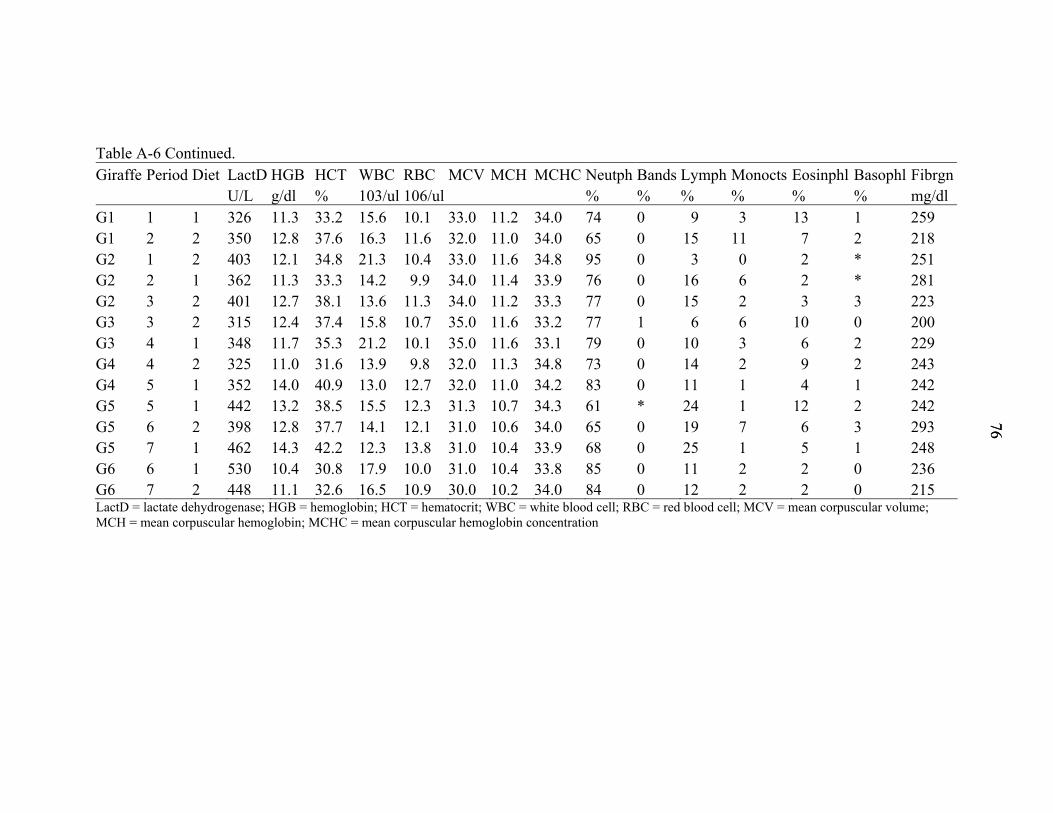
7676
Table A-6 Continued. Giraffe Period Diet LactD HGB HCT WBC RBC MCV MCH MCHC Neutph Bands Lymph Monocts Eosinphl Basophl Fibrgn U/L g/dl % 103/ul 106/ul % % % % % % mg/dl G1 1 1 326 11.3 33.2 15.6 10.1 33.0 11.2 34.0 74 0 9 3 13 1 259 G1 2 2 350 12.8 37.6 16.3 11.6 32.0 11.0 34.0 65 0 15 11 7 2 218 G2 1 2 403 12.1 34.8 21.3 10.4 33.0 11.6 34.8 95 0 3 0 2 * 251 G2 2 1 362 11.3 33.3 14.2 9.9 34.0 11.4 33.9 76 0 16 6 2 * 281 G2 3 2 401 12.7 38.1 13.6 11.3 34.0 11.2 33.3 77 0 15 2 3 3 223 G3 3 2 315 12.4 37.4 15.8 10.7 35.0 11.6 33.2 77 1 6 6 10 0 200 G3 4 1 348 11.7 35.3 21.2 10.1 35.0 11.6 33.1 79 0 10 3 6 2 229 G4 4 2 325 11.0 31.6 13.9 9.8 32.0 11.3 34.8 73 0 14 2 9 2 243 G4 5 1 352 14.0 40.9 13.0 12.7 32.0 11.0 34.2 83 0 11 1 4 1 242 G5 5 1 442 13.2 38.5 15.5 12.3 31.3 10.7 34.3 61 * 24 1 12 2 242 G5 6 2 398 12.8 37.7 14.1 12.1 31.0 10.6 34.0 65 0 19 7 6 3 293 G5 7 1 462 14.3 42.2 12.3 13.8 31.0 10.4 33.9 68 0 25 1 5 1 248 G6 6 1 530 10.4 30.8 17.9 10.0 31.0 10.4 33.8 85 0 11 2 2 0 236 G6 7 2 448 11.1 32.6 16.5 10.9 30.0 10.2 34.0 84 0 12 2 2 0 215 LactD = lactate dehydrogenase; HGB = hemoglobin; HCT = hematocrit; WBC = white blood cell; RBC = red blood cell; MCV = mean corpuscular volume; MCH = mean corpuscular hemoglobin; MCHC = mean corpuscular hemoglobin concentration
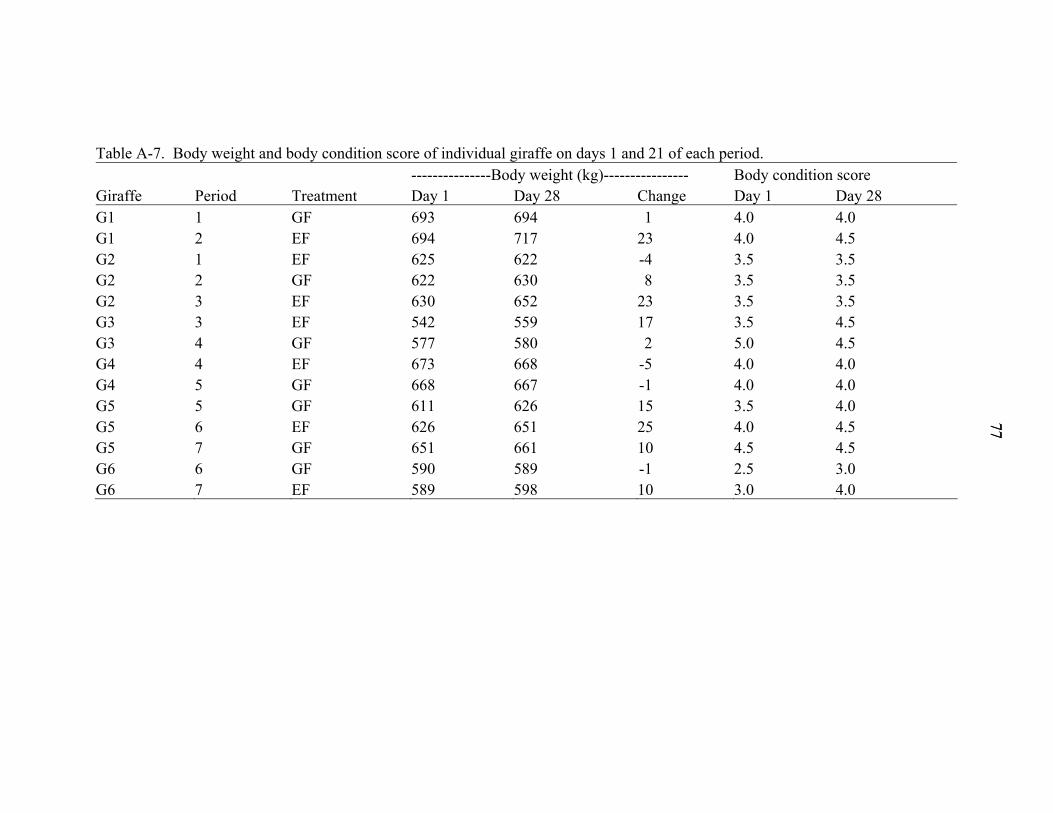
7777
Table A-7. Body weight and body condition score of individual giraffe on days 1 and 21 of each period. ---------------Body weight (kg)---------------- Body condition score Giraffe Period Treatment Day 1 Day 28 Change Day 1 Day 28 G1 1 GF 693 694 1 4.0 4.0 G1 2 EF 694 717 23 4.0 4.5 G2 1 EF 625 622 -4 3.5 3.5 G2 2 GF 622 630 8 3.5 3.5 G2 3 EF 630 652 23 3.5 3.5 G3 3 EF 542 559 17 3.5 4.5 G3 4 GF 577 580 2 5.0 4.5 G4 4 EF 673 668 -5 4.0 4.0 G4 5 GF 668 667 -1 4.0 4.0 G5 5 GF 611 626 15 3.5 4.0 G5 6 EF 626 651 25 4.0 4.5 G5 7 GF 651 661 10 4.5 4.5 G6 6 GF 590 589 -1 2.5 3.0 G6 7 EF 589 598 10 3.0 4.0
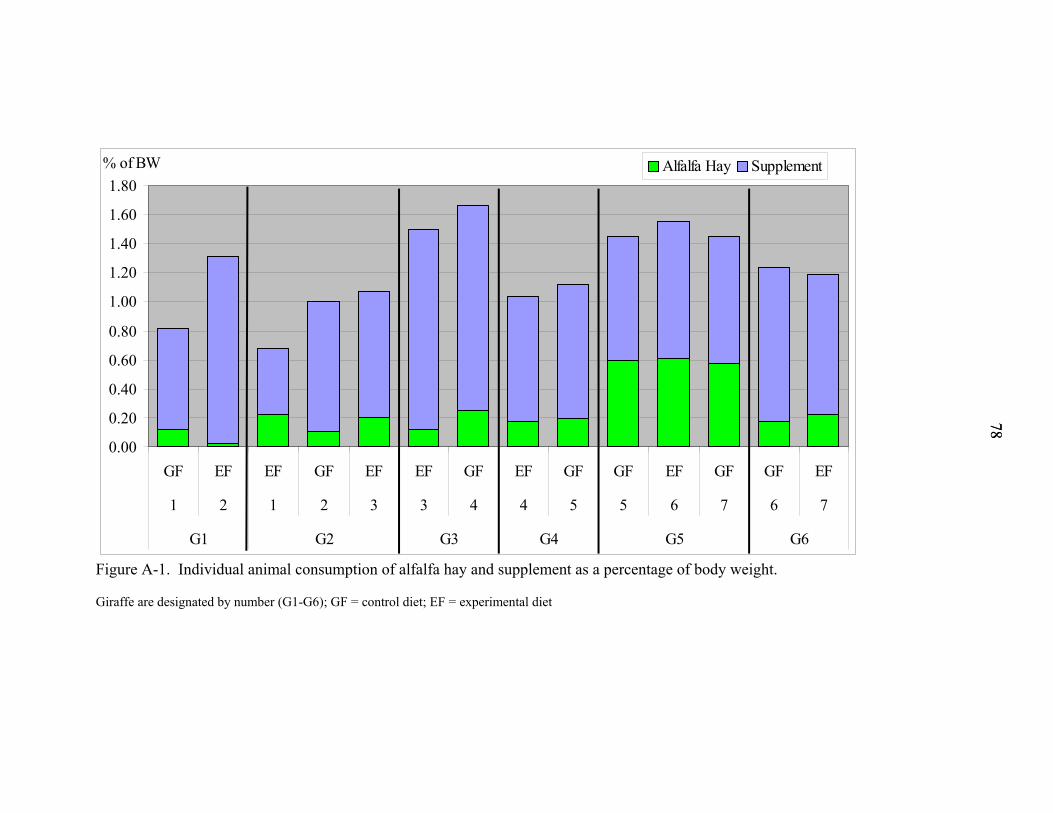
7878
% of BW
0.00
0.20
0.40
0.60
0.80
1.00
1.20
1.40
1.60
1.80
GF EF EF GF EF EF GF EF GF GF EF GF GF EF
1 2 1 2 3 3 4 4 5 5 6 7 6 7
G1 G2 G3 G4 G5 G6
Alfalfa Hay Supplement
Figure A-1. Individual animal consumption of alfalfa hay and supplement as a percentage of body weight.
Giraffe are designated by number (G1-G6); GF = control diet; EF = experimental diet
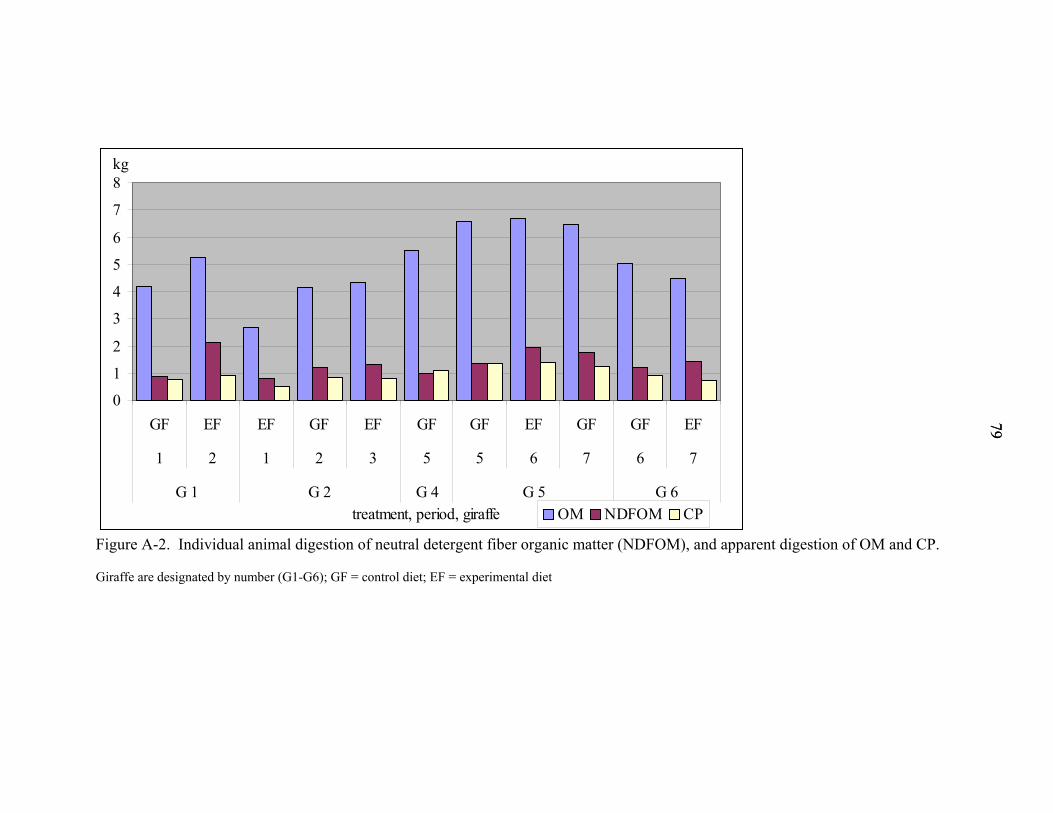
7979
kg
0
1
2
3
4
5
6
7
8
GF EF EF GF EF GF GF EF GF GF EF
1 2 1 2 3 5 5 6 7 6 7
G 1 G 2 G 4 G 5 G 6treatment, period, giraffe OM NDFOM CP
Figure A-2. Individual animal digestion of neutral detergent fiber organic matter (NDFOM), and apparent digestion of OM and CP.
Giraffe are designated by number (G1-G6); GF = control diet; EF = experimental diet
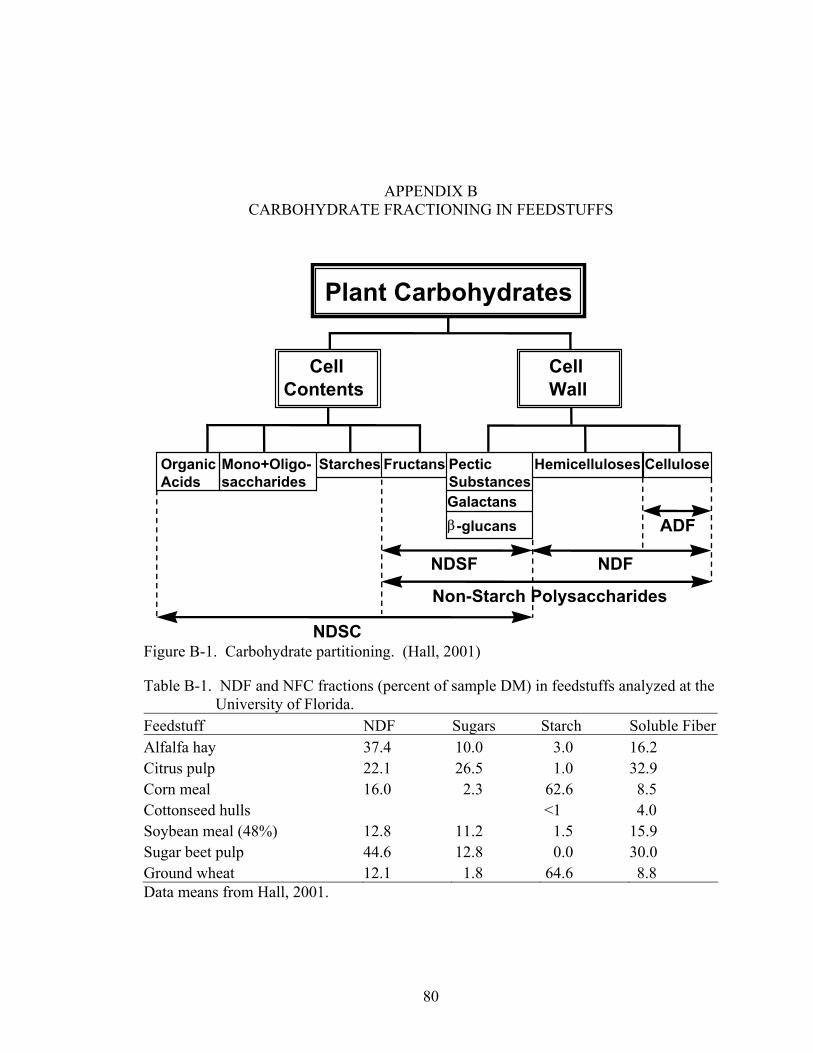
80
APPENDIX B CARBOHYDRATE FRACTIONING IN FEEDSTUFFS
Figure B-1. Carbohydrate partitioning. (Hall, 2001)
Table B-1. NDF and NFC fractions (percent of sample DM) in feedstuffs analyzed at the University of Florida.
Feedstuff NDF Sugars Starch Soluble FiberAlfalfa hay 37.4 10.0 3.0 16.2 Citrus pulp 22.1 26.5 1.0 32.9 Corn meal 16.0 2.3 62.6 8.5 Cottonseed hulls <1 4.0 Soybean meal (48%) 12.8 11.2 1.5 15.9 Sugar beet pulp 44.6 12.8 0.0 30.0 Ground wheat 12.1 1.8 64.6 8.8 Data means from Hall, 2001.
Plant Carbohydrates
CellContents
CellWall
HemicellulosesPecticSubstances
β-glucans
FructansStarchesMono+Oligo-saccharides
OrganicAcids
Cellulose
ADF
NDSF
NDSC
Galactans
Non-Starch Polysaccharides
NDF
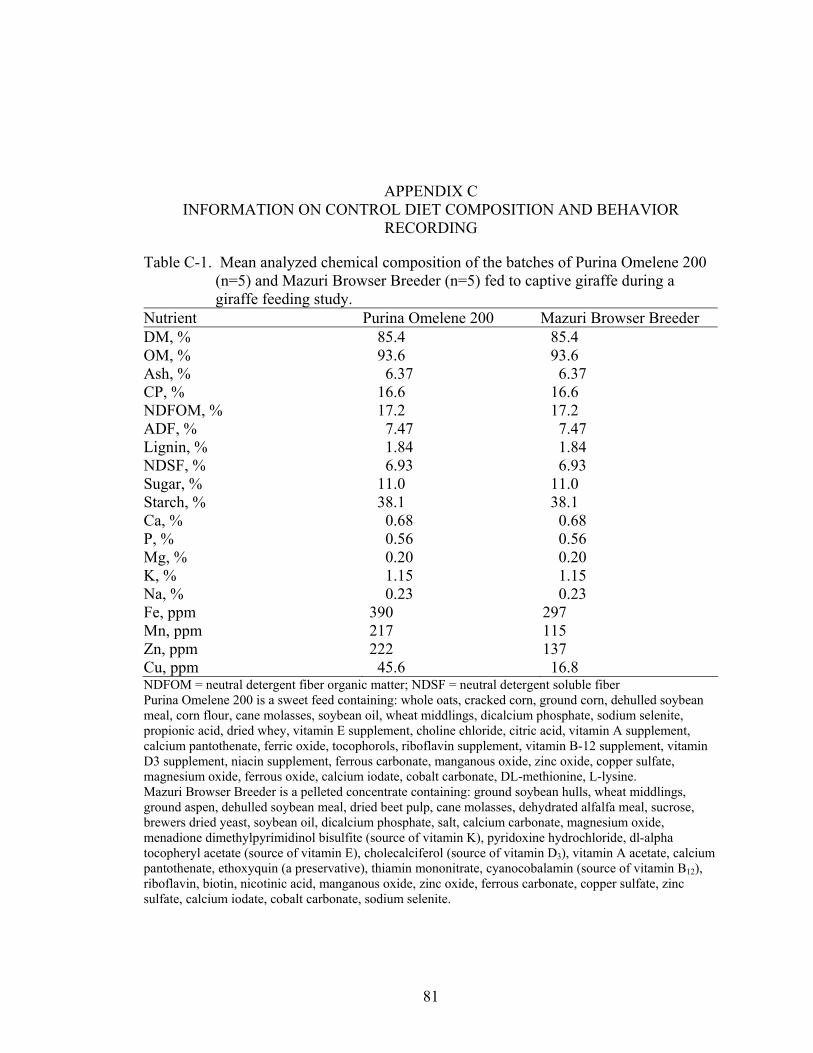
81
APPENDIX C INFORMATION ON CONTROL DIET COMPOSITION AND BEHAVIOR
RECORDING
Table C-1. Mean analyzed chemical composition of the batches of Purina Omelene 200 (n=5) and Mazuri Browser Breeder (n=5) fed to captive giraffe during a giraffe feeding study.
Nutrient Purina Omelene 200 Mazuri Browser Breeder DM, % 85.4 85.4 OM, % 93.6 93.6 Ash, % 6.37 6.37 CP, % 16.6 16.6 NDFOM, % 17.2 17.2 ADF, % 7.47 7.47 Lignin, % 1.84 1.84 NDSF, % 6.93 6.93 Sugar, % 11.0 11.0 Starch, % 38.1 38.1 Ca, % 0.68 0.68 P, % 0.56 0.56 Mg, % 0.20 0.20 K, % 1.15 1.15 Na, % 0.23 0.23 Fe, ppm 390 297 Mn, ppm 217 115 Zn, ppm 222 137 Cu, ppm 45.6 16.8 NDFOM = neutral detergent fiber organic matter; NDSF = neutral detergent soluble fiber Purina Omelene 200 is a sweet feed containing: whole oats, cracked corn, ground corn, dehulled soybean meal, corn flour, cane molasses, soybean oil, wheat middlings, dicalcium phosphate, sodium selenite, propionic acid, dried whey, vitamin E supplement, choline chloride, citric acid, vitamin A supplement, calcium pantothenate, ferric oxide, tocophorols, riboflavin supplement, vitamin B-12 supplement, vitamin D3 supplement, niacin supplement, ferrous carbonate, manganous oxide, zinc oxide, copper sulfate, magnesium oxide, ferrous oxide, calcium iodate, cobalt carbonate, DL-methionine, L-lysine. Mazuri Browser Breeder is a pelleted concentrate containing: ground soybean hulls, wheat middlings, ground aspen, dehulled soybean meal, dried beet pulp, cane molasses, dehydrated alfalfa meal, sucrose, brewers dried yeast, soybean oil, dicalcium phosphate, salt, calcium carbonate, magnesium oxide, menadione dimethylpyrimidinol bisulfite (source of vitamin K), pyridoxine hydrochloride, dl-alpha tocopheryl acetate (source of vitamin E), cholecalciferol (source of vitamin D3), vitamin A acetate, calcium pantothenate, ethoxyquin (a preservative), thiamin mononitrate, cyanocobalamin (source of vitamin B12), riboflavin, biotin, nicotinic acid, manganous oxide, zinc oxide, ferrous carbonate, copper sulfate, zinc sulfate, calcium iodate, cobalt carbonate, sodium selenite.
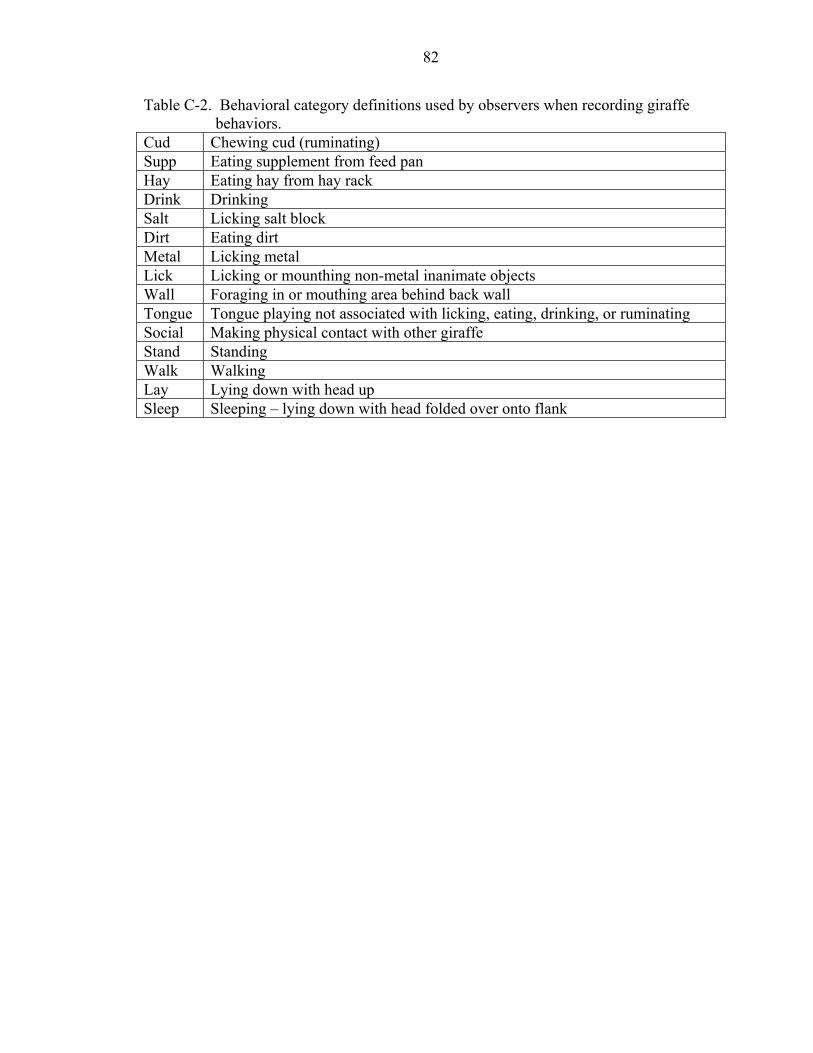
82
Table C-2. Behavioral category definitions used by observers when recording giraffe behaviors.
Cud Chewing cud (ruminating) Supp Eating supplement from feed pan Hay Eating hay from hay rack Drink Drinking Salt Licking salt block Dirt Eating dirt Metal Licking metal Lick Licking or mounthing non-metal inanimate objects Wall Foraging in or mouthing area behind back wall Tongue Tongue playing not associated with licking, eating, drinking, or ruminating Social Making physical contact with other giraffe Stand Standing Walk Walking Lay Lying down with head up Sleep Sleeping – lying down with head folded over onto flank
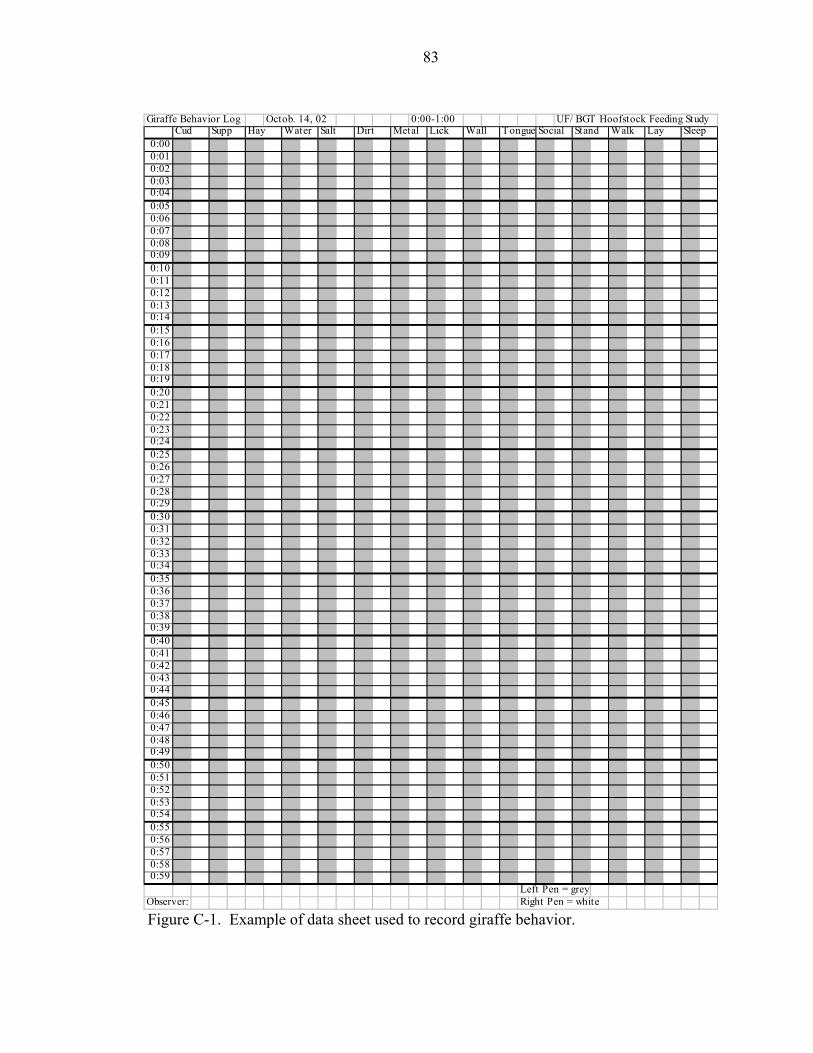
83
Figure C-1. Example of data sheet used to record giraffe behavior.
Giraffe Behavior Log Octob. 14, 02 0:00-1:00 UF/ BGT Hoofstock Feeding StudyCud Supp Hay Water Salt Dirt Metal Lick Wall Tongue Social Stand Walk Lay Sleep
0:000:010:020:030:040:050:060:070:080:090:100:110:120:130:140:150:160:170:180:190:200:210:220:230:240:250:260:270:280:290:300:310:320:330:340:350:360:370:380:390:400:410:420:430:440:450:460:470:480:490:500:510:520:530:540:550:560:570:580:59
Left Pen = greyObserver: Right Pen = white
84
LIST OF REFERENCES
Allen MS. 1996. Physical constraints on voluntary intake of forages by ruminants. J Anim Sci 74:3063-3075.
Allen MS. 1997. Relationship between fermentation acid production in the rumen and the requirement for physically effective fiber. J Dairy Sci 80:1447-1462.
Ariza P, Bach A, Stern MD, Hall MB. 2001. Effects of carbohydrates from citrus pulp and hominy feed on microbial fermentation in continuous culture. J Anim Sci 79:2713-2718.
Association of Official Analytical Chemists. 1990. Official Methods of Analysis, 15th edition. Arlington, VA.
Baer DJ, Oftedal OT, Fahey Jr. GC. 1985. Feed selection and digestibility by captive giraffe. Zoo Biol 4:57-64.
Bailey CB. 1961. Saliva secretion and its relation to feeding in cattle. III. The rate of secretion of mixed saliva in the cow during eating, with an estimate of the magnitude of the total daily secretion of mixed saliva. Br J Nutr 15:443-451.
Ball RL, Kearney C, Burton M, Dumoneux G, Olsen JH. 2002. Morbidity and mortality related to hypoglycemia and chronic energy malnutrition in captive giraffe. In: Proc Am Assoc Zoo Vets, p 180-185.
Barnes R, Greene K, Lamm M. 2002. Management and husbandry of duikers at the Los Angeles Zoo. Zoo Biol 21:107-121.
Bashaw MJ, Tarou LR, Maki TS, Maple TL. 2001. A survey assesment of variable related to stereotypy in captive giraffe. Appl Anim Behaviour Sci 73:235-247.
Beauchemin KA, Yang WZ, Rode LM. 2003. Effects of particle size of alfalfa-based dairy cow diets on chewing activity, ruminal fermentation, and milk production. J Dairy Sci 86:630-643.
Beharka AA, Nagaraja TG, Morrill JL, Kennedy GA, Klemm RD. 1998. Effects of form of diet on anatomical, microbial, and fermentative development of the rumen of neonatal calves. J Dairy Sci 81:1946-1955.

85
Ben-Ghedalia D, Yosef E, Miron J, Est Y. 1989. The effects of starch- and pectin-rich diets on quantitative aspects of digestion in sheep. Anim Feed Sci Technol 24:289-298.
Bernard L, Chaise JP, Baumont R, Poncet C. 2000. The effect of physical form of orchardgrass hay on the passage of particulate matter through the rumen of sheep. J Anim Sci 78:1338-1354.
Bhattacharya AN, Lubbadah WF. 1971. Feeding high levels of beet pulp in high concentrate dairy rations. J Dairy Sci 54:95-99.
Burton MS, Dierenfeld ES. 1990. Comparisons of vitamin E injectables in giraffes (Giraffa Camelopardalis reticulata). In: Proc Am Assoc Zoo Vets, p 198-201.
Caister LE, Shields WM, Gosser A. 2003. Female tannin avoidance: a possible explanation for habitat and dietary segregatoin of giraffes (Giraffa camelopardalis peralta) in Niger. Afr J Ecol 41:201-210.
Callison SL, Firkins JL, Eastridge ML, Hull BL. 2001. Site of nutrient digestion by dairy cows fed corn of different particle sizes or steam-rolled. J Dairy Sci 84:1458-1467.
Campbell CP, Marshall SA, Mandell IB, Wilton JW. 1992. Effects of source of dietary neutral detergent fiber on chewing behavior in beef cattle fed pelleted concentrates with or without supplemental roughage. J Anim Sci 70:894-903.
Campling RC, Balch CC. 1961. Factors affecting the voluntary intake of food by cows. 1. Preliminary observations on the effect, on the voluntary intake of hay, of changes in the amount of the reticulo-ruminal contents. Br J Nutr 15:523-530.
Cassida KA, Stokes MR. 1986. Eating and resting salivation in early lactation dairy cows. J Dairy Sci 69:1282-1292.
Chaffe PS. 1968. Report on death of a giraffe. J Small Anim Pract 9:136-137.
Chai K, Kennedy PM, Milligan LP. 1984. Reduction in particle size during rumination in cattle. Can J Anim Sci 64(Suppl.):339-340.
Chester-Jones H, Metwally HM, Linn JG, Ziegler DM, Stern MD. 1991. Effects of dietary protein-energy interrelationships on Holstein steer performance and ruminal bacterial fermentation in continuous culture. J Anim Sci 69:4956-4966.
Ciofolo I, LePendu Y. 2002. The feeding behaviour of giraffe in Niger. Mammalia 66:183-194.
Clark PW, Armentano LE. 2002. Influence of particle size on the effectiveness of the fiber in alfalfa silage. J Dairy Sci 85:3000-3007.
86
Clauss M. 1998. Feeding Giraffe (Giraffe camelopardis) [Masters thesis]. London, UK: University of London. 114 p.
Clauss M, Kienzle E, Wiesner H. 2002a. Importance of the wasting syndrome complex in captive moose (Alces alces). Zoo Biol 21:499-506.
Clauss M, Lechner-Doll M. 2001. Differences in selective reticulo-ruminal particle retention as a key factor in ruminant diversification. Oecologia 129:321-327.
Clauss M, Lechner-Doll M, Flach EJ, Tack C, Hatt JM. 2001. Comparative use of four different marker systems for the estimation of digestibility and low food intake in a group of captive giraffes (Giraffa camelopardalis). Zoo Biol 20:315-329.
Clauss M, Lechner-Doll M, Flach EJ, Wisser J, Hatt J-M. 2002b. Digestive tract pathology of captive giraffe (Giraffa camelopardalis) an unifying hypothesis. European Association of Zoo and Wildlife Veterinarians Fourth Scientific Meeting. Heidelberg, Germany. p 99-107.
Clemens ET, Maloiy GMO, Sutton JD. 1983. Molar proportions of volatile fatty acids in the gastrointestinal tract of East African wild ruminants. Comp Biochem Physiol 76A:217-224.
Dagg AI, Foster JB. 1976. The Giraffe. Its Biology, Behavior, and Ecology. Malabar, FL: Krieger Publishing Company.
Dehority BA, Odenyo AA. 2003. Influence of diet on the rumen protozoal fauna of indigenous African wild ruminants. J Eukaryot Microbiol 50:220-223.
Dierenfeld ES, Mueller PJ, Hall MB. 2002. Duikers: Native food composition, micronutrient assessment, and implications for improving captive diets. Zoo Biol 21:185-196.
Dierenfeld ES, Wildman REC, Romo S. 2000. Feed intake, diet utilization, and composition of browses consumed by the Sumatran rhino (Dicerorhinus sumatrensis) in a North American zoo. Zoo Biol 19:169-180.
Dirksen GU, Liebich HG, Mayer E. 1985. Adaptive changes of the ruminal mucosa and their functional and clinical significance. The Bovine Practitioner 20:116-120.
Ditchkoff SS. 2000. A decade since "diversification of ruminants": has our knowledge improved? Oecologia 125:82-84.
Enqvist KE. 2003. Dental disease and serous atrophy of fat syndrome in captive giraffes (Giraffa camelopardalis). Minneapolis, MN: Annual conference of the American Association of Zoo Veterinarians.
Field CR, Ross IC. 1976. The savanna ecology of Kidepo Valley National Forest. E Afr Wildl J 14:1-15.
87
Firkins JL. 1997. Effects of feeding nonforage fiber sources on site of fiber digestion. J Dairy Sci 80:1426-1437.
Flach EJ, Thornton SM, Kirkwood JK, Sainesbury AW. 1997. Chronic loss of condition with persistent neutrophilia in a reticulated giraffe (Giraffa camelopardalis). In: Proc British Vet Zoo Soc, p 33-37.
Foose TJ. 1982. Trophic strategies of ruminant versus nonruminant ungulates [PhD Dissertation]. Chicago, IL: The University of Chicago. 334 p.
Foster JB. 1966. The giraffe of Nairobi National Park: home range, sex ratios, the herd and food. E Afr Wildl J 4:139-148.
Fowler ME. 1978. Peracute mortality in captive giraffe. J Am Vet Med Assoc 173:1088-1093.
Fox H. 1938. The giraffe. Some notes upon the natural characters of this animals, its care and its misfortune. In: Zso, editor. Report of the Penrose Research Laboratory, formerly the Laboratory and Museum of Comparative Pathology. Philadelphia, PA: Zoological Society of Philadelphia. p 35-67.
Friggens N, Emmans GC, Robertson S, Chamberlain DG, Whittemore CT, Oldham JD. 1995. The lactational responses of dairy cows to amount of feed and to the source of carbohydrate energy. J Dairy Sci 78:1734-1744.
Friggens NC, Oldham JD, Dewhurst RJ, Horgan G. 1998. Proportions of volatile fatty acids in relation to the chemical composition of feeds based on grass silage. J Dairy Sci 81:1331-1344.
Furstenburg D, Van Hoven W. 1994. Condensed tannin as an anti-defoliate agent against browsing by giraffe (Giraffe camelopardalis) in the Kruger National Park. Comp Biochem Physiol 107A(2):425-431.
Garrett EF, Pereira MN, Nordlund KV, Armentano LE, Goodger WJ, Oetzel GR. 1999. Diagnostic methods for the detection of subacute ruminal acidosis in dairy cows. J Dairy Sci 82:1170-1178.
Glock RD, DeGroot BD. 1998. Sudden death of feedlot cattle. J Anim Sci 76:315-319.
Goering HK, Van Soest PJ. 1970. Forage fiber analysis (apparatus, reagents, procedures and some applications). In: Agric. Handb. No. 379. Washington, DC: ARS-USDA.
Gordon IJ, Illius AW. 1996. The nutritional ecology of African ruminants: a reinterpretation. J Anim Ecol 65:18-28.
Grant RJ. 1997. Interactions among forages and nonforage fiber sources. J Dairy Sci 80:1438-1446.
88
Hall MB. 1999. Management strategies against ruminal acidosis. In: Tenth Annual Florida Ruminant Nutrition Symposium. Gainesville, FL: University of Florida. p 104-113.
Hall MB. 2001. Neutral Detergent-Soluble Carbohydrates, Nutritional Relevance and Analysis, A Laboratory Manual. Gainesvelle: University of Florida Report nr 339.
Hall MB, Herejk C. 2001. Differences in yields of microbial crude protein from in vitro fermentation of carbohydrates. J Dairy Sci 84:2486-2493.
Hall MB, Hoover WH, Jennings JP, Miller Webster TK. 1999. A method for partitioning neutral detergent-soluble carbohydrates. J Sci Food Agric 79:2079-2086.
Hall-Martin AJ, Skinner JD, Van Dyk JM. 1975. Reproduction in the giraffe in relation to some environmental factors. E Afr Wildl J 13:237-248.
Hatt JM, Lechner-Doll M, Mayes B. 1998. The use of dosed and herbage n-alkanes as markers for the determination of digestive strategies of captive giraffes (Giraffa camelopardalis). Zoo Biol 17:295-309.
Heldt JS, Cochran RC, Stokka GL, Farmer CG, Mathis CP, Titgemeyer EC, Nagaraja TG. 1999. Effects of different supplemental sugars and starch fed in combination with degradable intake protein on low-quality forage use by beef steers. J Anim Sci 77:2793-2802.
Hofmann RR. 1973. The Ruminant Stomach--Stomach Structure and Feeding Habits of East African Game Ruminants. Odhiambo TR, editor. Nairobi, Kenya: East African Literature Bureau.
Hofmann RR. 1984. Comparative anatomical studies imply adaptive variations of ruminants digestive physiology. J Anim Sci 64:203-205.
Hofmann RR. 1988. Morphophysiological evolutionary adaptations of the ruminant digestive system. In: Dobson A, Dobson MJ, editors. Aspects of Digestive Physiology in Ruminants: Proceedings of a Satellite Symposium of the 30th International Congress of the International Union of Physiological Sciences. p 1-20.
Hofmann RR, Kock RA, Ludwig J, Axmacher H. 1988. Seasonal changes in rumen papillary development and body condition in free ranging Chinese water deer (Hydropotes inermis). J Zool 216:103-117.
Hofmann RR, Matern B. 1988. Changes in gastrointestinal morphology related to nutrition in giraffes. Cons Sci and Zoos 22:168-176.
Horwitz W. 1982. Evaluation of analytical methods used for regulation of food and drugs. Anal Chem 54:67A-76A.
89
Huntington GB. 1997. Starch utilization by ruminants: from basics to the bunk. J Anim Sci 75:852-867.
Johnson MM, Peters JP. 1993. Technical note: An improved method to quantify nonesterified fatty acids in bovine plasma. J Anim Sci 71:753-756.
Jorgenson NA, Schultz LH. 1963. Ration effects on rumen acids, ketogenesis, and milk composition. I. Unrestricted roughage feeding. J Dairy Sci 46:437-443.
Junge RE, Bradley TE. 1993. Peracute mortality syndrome of giraffes. In: Fowler ME, editor. Zoo and Wild Animal Medicine: Current Therapy 3. Philadelphia, PA: Saunders Company. p 547-549.
Kay RND, Engelhardt WV, White RG. 1980. The digestive physiology of wild ruminants. In: Ruckebusch Y, Thivend P, editors. Digestive Physiology and Metabolism in Ruminants. Wesport, CT: AVI.
Kennedy PM, McSweeney CS, Welch JG. 1992. Influence of dietary particle size on intake, digestion, and passage rate of digesta in goats and sheep fed wheaten (Triticum aestivum) hay. Small Ruminant Research 9:125-138.
Kononoff PJ, Heinrichs AJ. 2003. The effect of corn silage particle size and cottonseed hulls on cows in early lactation. J Dairy Sci 86:2438-2451.
Krajcarski-Hunt H, Plaizier JC, Walton J-P, Spratt R, McBride BW. 2002. Short communication: Effect of subacute ruminal acidosis on in situ fiber digestion in lactating dairy cows. J Dairy Sci 85:570-573.
Krause KM, Combs DK. 2003. Effects of forage particle size, forage source, and grain fermentability on performance and ruminal pH in midlactation cows. J Dairy Sci 86:1382-1397.
Krause KM, Combs DK, Beauchemin KA. 2002. Effects of forage particle size and grain fermentability in midlactation cows. II. Ruminal pH and chewing activity. J Dairy Sci 85:1947-1957.
Lackey LB, LaRue FV. 1997. North American Regional Giraffe Studbook. Dallas, TX: Dallas Zoo.
Lechowski R, Pisarski J, Goslawski J, Lenarcik M. 1991. Exocrine pancreatic insufficiency-like syndrome in giraffe. J Wildlife Diseases 27:728-780.
Leuthold BM, Leuthold W. 1972. Food habits of giraffe in Tsavo National Park, Kenya. E Afr Wildl J 10:129-141.
Leuthold BM, Leuthold W. 1978. Daytime activity patterns of gerenuk and giraffe in Tsavo National Park, Kenya. E Afr Wildl J 16:231-243.
90
Lintzenich BA, Ward AM. 1997. Hay and pellet ratios: considerations in feeding ungulates. Nutrition Advisory Group Handbook: Fact Sheet 007. www.nagonline.net. Last accessed: December 29, 2004.
Maekawa M, Beauchemin KA, Christensen DA. 2002. Effect of concentrate level and feeding management on chewing activities, saliva production, and ruminal pH of lactating dairy cows. J Dairy Sci 85:1165-1175.
Martin P, Bateson P. 1986. Measuring Behavior: An Introductory Guide. New York: Cambridge Univ. Press.
Martin SA, Sullivan HM, Evans JD. 2000. Effect of sugars and malate on ruminal microorganisms. J Dairy Sci 83:2574-2579.
McSweeney CS, Kennedy PM. 1992. Influence of dietary particle size on chewing activity and reticulo-ruminal motility in goats and sheep fed wheaten (Triticum aestivum) hay. Small Ruminant Research 9:107-115.
Mertens DR. 1997. Creating a system for meeting the fiber requirements for dairy cows. J Dairy Sci 80:1463-1481.
Miller M, Abou-Madi N, Coville B, Olsen J. 1996. Comparison of in vitro tests for evaluation of passive transfer in giraffe. In: Proc Am Assoc Zoo Vets, p 94-101.
Miller WJ, O'Dell GD. 1969. Nutritional problems of using maximum forage or maximum concentrates in dairy rations. J Dairy Sci 52:1144-1154.
Moore JA, Poore MH, Swingle RS. 1990. Influence of roughage source on kinetics of digestion and passage, and on calculated extents of ruminal digestion in beef steers fed 65% concentrate diets. J Anim Sci 68:3412-3420.
Nocek JE. 1997. Bovine acidosis: implications on laminitis. J Dairy Sci 80:1005-1028.
Owens FN, Goetsch AL. 1988. Ruminal fermentation. In: Church DC, editor. The Ruminant Animal Digestive Physiology and Nutrition. Prospect Heights, IL: Waveland Press, Inc.
Owens FN, Secrist DS, Hill WJ, Gill DR. 1998. Acidosis in cattle: a review. J Anim Sci 76:275-286.
Paglia DE, Miller RE. 1992. Erythrocyte ATP deficiency and acatalasemia in the black rhinoceros (Diceros bicornis) and their pathogenetic roles in acute episodic hemolysis and mucocutaneous ulcerations. In: Proc Am Assoc Zoo Vets, p 217-219.
Pasha TN, Prigge EC, Russell RW, Bryan WB. 1994. Influence of moisture content of forage diets on intake and digestion by sheep. J Anim Sci 72:2455-2463.
91
Pellew RA. 1983. The giraffe and its food resource in the Serengeti. I. Composition, biomass and production of available browse. Afr J Ecol 21:241-267.
Pellew RA. 1984. Food consumption and energy budgets of the giraffe. J Appl Ecol 21:141-159.
Poppi DP, Norton BW, Minson DJ, Hendricksen RE. 1980. The validity of the critical size theory for particles leaving the rumen. J Agric Sci 94:275-280.
Randhawa SS, Gupta PP, Misra SK. 1981. Histopathological changes in experimental ruminal acidosis in buffalo calves. Ind J Anim Sci 51:518-521.
Rowell-Schafer A, Dyer J, Hofmann RR, Lechner-Doll M, Meyer HHD, Shirazi-Beechey SP, Streich WJ. 1999. Abundance of intestinal Na+/glucose cotransporter (SGLT1) in roe deer (Capreolus capreolus). J Anim Physiol 82:25-32.
Russell JB, Wilson DB. 1996. Why are ruminal cellulolytic bacteria unable to digest cellulose at low pH? J Dairy Sci 79:1503-1509.
SAS. 1999. The SAS System for Windows, Release 8.02. Cary, NC: SAS Institute, Inc.
Schettini MA, Prigge EC, Nestor EL. 1999. Influence of mass and volume of ruminal contents on voluntary intake and digesta passage of a forage diet in steers. J Anim Sci 77:1896-1904.
Shain DH, Stock RA, Klopfenstein TJ, Herold DW. 1999. The effect of forage source and particle size on finishing yearling steer performance and ruminal metabolism. J Anim Sci 77:1082-1092.
Shipley L. 1999. Grazers and browsers: how digestive morphology affects diet selection. In: Launchbaugh KL, Sanders KD, Mosley JC, editors. Grazing Behavior of Livestock and Wildlife. Moscow, ID: University of Idaho, p 20-27.
Shochat E, Robbins CT, Parish SM, Young PB, Stephenson TR, Tamayo A. 1997. Nutritional investigations and management of captive moose. Zoo Biol 16:479-494.
Smith HA, Jones TC, Hunt RD. 1972. Veterinary Pathology. Philadelphia, PA: Lea & Febiger.
Sniffen CJ, O'Connor JD, Van Soest PJ, Fox DG, Russell JB. 1992. A net carbohydrate and protein system for evaluating cattle diets: II. Carbohydrate and protein availability. J Anim Sci 70:3562-3577.
Soeldner JS, Sloane D. 1965. Critical variables in the radioimmunoassay of serum insulin using the double antibody technic. Diabetes 14:711-719.
Stone WC. 2004. Nutritional approaches to minimize subacute ruminal acidosis and laminitis in dairy cattle. J Dairy Sci 87(E. Suppl.):E13-E26.
92
Strafuss AC, Kennedy GA. 1973. Degenerative myopathy in a giraffe. J Am Vet Med Assoc 163:551-552.
Strandberg J, Eckhaus M, Kincaid A, Cranfield M. 1984 Fatal wasting disease in Angolan giraffes. In: Proc Am Assoc Zoo Vets, p 115-116.
Strobel HJ, Russell JB. 1986. Effect of pH and energy spilling on bacterial protein synthesis by carbohydrate-limited cultures of mixed rumen bacteria. J Dairy Sci 69:2941-2947.
Swenson MJ. 1984. Dukes' Physiology of Domestic Animals, 10th edition. Ithaca, NY: Cornell University Press.
Tarou LR, Bashaw MJ, Maple TL. 2003. Failure of a chemical spray to significantly reduce stereotypic licking in a captive giraffe. Zoo Biol 22:601-607.
Theurer CB, Swingle RS, Wanderley RC, Kattnig RM, Urias A, Ghenniwa G. 1999. Sorghum grain flake density and source of roughage in feedlot cattle diets. J Anim Sci 77:1066-1073.
Van Soest PJ. 1994. Nutritional Ecology of the Ruminant. 2nd ed. Ithaca, NY: Cornell University Press. 476 p.
Van Soest PJ, Robertson JB. 1985. Analysis of Forages and Fibrous Foods--A Laboratory Manual for Animal Science 613. Ithaca, NY: Cornell University. 202 p.
Van Soest PJ, Robertson JB, Lewis BA. 1991. Methods for dietary fiber, neutral detergent fiber, and nonstarch polysaccharides in relation to animal nutrition. J Dairy Sci 74:3583-3597.
Van Vuuren AM, Van Der Koelen CJ, Vroons-De Bruin J. 1993. Ryegrass versus corn starch or beet pulp fiber diet effects on digestion and intestinal amino acids in dairy cows. J Dairy Sci 76:2692-2700.
Weston RH, Cantle JA. 1984. The movement of undigested plant particle fractions through the stomach of roughage-fed young sheep. Can J Anim Sci 64(Suppl.):322-323.
Willette MM, Norton TL, Miller CL, Lamm MG. 2002. Verterinary concerns of captive duikers. Zoo Biol 21:197-207.
Wolfe BA, Sladky KK, Loomis MR. 2000. Obstructive urolithiasis in a reticulated giraffe (Giraffe camelopardalis reticulata). The Vet Rec 146:260-261.
Wood S, Dyer J, Hofmann RR, Shirazi-Beechey SP. 2000. Expression of the Na+/glucose co-transporter (SGLT1) in the intestine of domestic and wild ruminants. Pflugers Arch 441:155-162.

93
Yang WZ, Beauchemin KA, Rode LM. 2001. Effects of grain processing, forage to concentrate ratio, and forage particle size on rumen pH and digestion by dairy cows. J Dairy Sci 84:2203-2216.
94
BIOGRAPHICAL SKETCH
Celeste Kearney grew up in the small fishing and farming community of Oquawka,
IL. She worked in the equine industry for several years, and completed a B.S. in animal
sciences at Murray State University in 1997. After working in the zoo industry for four
years, she enrolled in graduate studies in animal sciences at the University of Florida.