Embed Size (px)
Citation preview
University of Massachusetts AmherstScholarWorks@UMass AmherstEnvironmental & Water Resources EngineeringMasters Projects Civil and Environmental Engineering
9-2015
Effects of Disinfectants on the Formation ofAldehydesMegan Dutra
Follow this and additional works at: https://scholarworks.umass.edu/cee_ewre
Part of the Environmental Engineering Commons
This Article is brought to you for free and open access by the Civil and Environmental Engineering at ScholarWorks@UMass Amherst. It has beenaccepted for inclusion in Environmental & Water Resources Engineering Masters Projects by an authorized administrator of ScholarWorks@UMassAmherst. For more information, please contact [email protected].
Dutra, Megan, "Effects of Disinfectants on the Formation of Aldehydes" (2015). Environmental & Water Resources Engineering MastersProjects. 73.https://doi.org/10.7275/pbm9-nj09
Effects of Disinfectants on the Formation of Aldehydes
A Master’s Project Presented
by
Megan Dutra
Submitted to the Department of Civil and Environmental Engineering of the University of
Massachusetts in partial fulfillment of the requirements for the degree of
MASTER OF SCIENCE IN ENVIRONMENTAL ENGINEERING
September 2015
i
Acknowledgements
I would like to thank my advisor, Dr. David Reckhow, for his patience, support, guidance and for
encouraging me to pursue my ideas. I would also like to extend my thanks to Dr. John Tobiason
for sitting on my committee as well as the other professors in the Environmental Engineering
department for their advice and lessons.
I would like to thank Sherrie Webb-Yagodzinski for her endless help and support, and Yanjun
Jiang for helping me with my ferrate experiments. I would also like to thank Julie Bliss and Xian
Ma for their help with ozonation and chlorine dioxide treatment, as well as their patience for all of
my questions.
I would also like to extend my thanks to all of my fellow graduate students and friends for making
my time here a memorable one.
Lastly, I would like to thank my friends and family for their never-ending love and support.
ii
iii
ABSTRACT
Disinfection by-products have been the subject of intense study in the water treatment community
due to the established adverse health effects of many known by-products and the postulated
adverse health effects of many other known and unknown by-products. Aldehydes are one such
group of by-products, containing compounds of both known and postulated health effects. This
thesis explores the formation of simple alkyl aldehydes due to different disinfectants; these
relationships are important because they can aid in determining possible by-product formation of
potentially harmful substances with a particular disinfectant or disinfectant combination.
Compounds such as these biodegrade easily, presenting a potential for microbial growth in
distribution systems. Water samples were taken from the Atkins Reservoir in Massachusetts and
treated at different concentrations with four disinfectants: ozone, chlorine, chlorine dioxide, and
ferrate. The samples were analyzed for formaldehyde, glyoxal, methyl glyoxal, and propanal. The
highest concentrations produced were for formaldehyde, followed by glyoxal. The greatest
concentrations resulted from oxidation using ozone or chlorine dioxide. Ferrate and chlorine
produced similar concentrations of these aldehydes. Water samples that had been fortified with
sodium bromide before addition of ozone, chlorine dioxide, or ferrate produced higher
concentrations than any three of those disinfectants alone. For samples treated with chlorine,
longer contact times produced slightly higher increases in formaldehyde and glyoxal
concentrations but had no distinct effect on methyl glyoxal. Propanal concentrations were low and
barely detectable throughout the study so little information was reported on it.
iv
TABLE OF CONTENTS
Acknowledgements .......................................................................................................................... i
Abstract .......................................................................................................................................... iii
List of Figures ................................................................................................................................. v
1. Introduction ................................................................................................................................. 1
1.1 Disinfection ........................................................................................................................... 1
1.2 Disinfection Byproducts ........................................................................................................ 1
1.3 Aldehydes .............................................................................................................................. 2
1.4 Research Objectives .............................................................................................................. 3
2. Methods and Materials ................................................................................................................ 4
2.1 Addition of chlorine, ozone, chlorine dioxide, sodium bromide, and ferrate ....................... 4
2.2 Preparation and preservation of samples. .............................................................................. 5
2.3 Experimental Design ............................................................................................................. 6
2.4 Extraction and measurements of aldehydes .......................................................................... 7
3. Results and Discussion ............................................................................................................... 9
3.1 Effects of ozonation on aldehyde formation ......................................................................... 9
3.2 Effects of chlorine on aldehyde formation .......................................................................... 12
3.2.1 Formaldehyde ............................................................................................................... 12
3.2.3 Methyl Glyoxal ............................................................................................................. 19
3.2.4 Propanal ........................................................................................................................ 21
3.3 Effects of chlorine dioxide on aldehyde formation ............................................................. 23
3.4 Effects of ferrate on aldehyde formation............................................................................. 24
4. Conclusion ................................................................................................................................ 27
5. References ................................................................................................................................. 29
6. Appendix ................................................................................................................................... 30
v
LIST OF FIGURES
Figure 1. Aldehyde concentrations when Atkins Reservoir water was treated with ozone only. Each
point shows a replicate measurement. Lines designate replicate averages (excluding outliers). ... 9 Figure 2. Aldehyde yields due to ozonation from this study compared to previously documented
data. ............................................................................................................................................... 10 Figure 3. Water samples, fortified with 300 µg/L sodium bromide, dosed with different ozone
doses, and finished with 6 mg/L chlorine. .................................................................................... 11 Figure 4. Formaldehyde increases when Atkins Reservoir water was treated with chlorine only.
....................................................................................................................................................... 13
Figure 5. Formaldehyde increases in two replicate experiments with Atkins Reservoir water
pretreated with 2 mg/L ozone before chlorine addition. (Different symbols represent different
chlorine contact times.) ................................................................................................................. 14 Figure 6. Formaldehyde increases in two replicate experiments with Atkins Reservoir water
pretreated with 4 mg/L ozone before chlorine treatment. ............................................................. 15 Figure 7. Glyoxal concentrations in two replicate experiment with Atkins Reservoir water treated
with chlorine only. ........................................................................................................................ 16 Figure 8. Glyoxal concentrations in two replicate experiments with Atkins Reservoir water
pretreated with 2 mg/L ozone before chlorine addition. ............................................................... 17 Figure 9. Glyoxal concentrations in two replicate experiments with Atkins Reservoir water
pretreated with 4 mg/L ozone before chlorine addition. ............................................................... 18
Figure 10. Methyl glyoxal concentration for two replicate experiments with Atkins Reservoir water
pretreated with 2 mg/L ozone before chlorine addition. ............................................................... 19
Figure 11. Methyl glyoxal concentrations in two replicate experiments with Atkins Reservoir water
pretreated with 4 mg/L ozone before addition of chlorine. .......................................................... 20 Figure 12. Aldehyde yields from chlorination in this study compared to previously documented
data. ............................................................................................................................................... 21
Figure 13.Aldehyde concentrations when Atkins Reservoir water was fortified with 300 µg/L
NaBr, treated with varying levels of chlorine dioxide, and finished with 6 mg/L chlorine. ........ 23 Figure 14. Aldehyde increases from Atkins Reservoir water buffered to a pH of 6.2 and treated
with ferrate. ................................................................................................................................... 24 Figure 15. Aldehyde increases from Atkins Reservoir water buffered to a pH of 7.5 and treated
with ferrate. ................................................................................................................................... 25 Figure 16. Aldehyde concentrations from Atkins Reservoir water fortified with sodium bromide
and treated with ferrate (pH 7.5). .................................................................................................. 25 Figure 17. Average aldehyde yields of different aldehydes using different treatment scenarios.
Formations from chlorine are averaged from all contact times. Outliers are excluded. ............... 27
LIST OF TABLES
Table 1. Water quality parameters for raw Atkins Reservoir water. .............................................. 5
Table 2. Chemical compound origins. ............................................................................................ 6
1
1. INTRODUCTION
1.1 Disinfection
Disinfection, the inactivation of viable pathogenic microorganisms, has been used since
the early 1900s in water treatment and wastewater treatment. It is used in public systems to protect
against waterborne diseases. Many methods of disinfection are currently used and include a variety
of chemical oxidants such as chlorine as well as physical processes like ultraviolet irradiation. The
disinfection method chosen for a certain water system depends on factors such as the properties of
the water being treated, target microorganisms and contaminants, convenience, and expense.
Chemical oxidants such as ozone, chlorine, chlorine dioxide are commonly used for
disinfection on a large scale. Ferrate, another disinfectant, is starting to be used, mainly in
wastewater. Chlorine, inexpensive and widely available, is the most widely used disinfectant in
the US. Ozone is used as a disinfectant as well as an oxidant to control taste and odor problems
and can be used to facilitate the removal of iron and manganese. Ozone can inactivate most viruses,
bacteria, and protozoa better than chlorine. Since ozone decomposes rapidly, it is often followed
by a secondary disinfectant such as chlorine to provide a disinfectant residual. Chlorine dioxide
inactivates microorganisms better than chlorine while producing lower concentrations of regulated
organic by-products as well. It does form inorganic byproducts such as chlorite (which is regulated
by the USEPA) and chlorate and has been shown to produce aldehydes (Dabrowska et al., 2005).
Ferrate is a disinfectant of growing interest that has proved to be a powerful oxidant over a wide
pH range in addition to its conceivable use as a coagulant (Jiang and Lloyd, 2002).
1.2 Disinfection Byproducts
While disinfection is necessary for controlling pathogens and waterborne diseases, it can
also produce unwanted by-products. Disinfection by-products (DBPs) form when disinfectants
2
react with natural organic matter (NOM) and other compounds in water. NOM is a complex,
diverse mixture of organic compounds, with a large portion often composed of humic substances.
By reducing the concentration of NOM in water before disinfection occurs, DBPs can be limited.
While hundreds of DBPs have been identified, some major classes include trihalomethanes
(THMs), haloacetic acids (HAAs), and aldehydes. Different disinfectants cause different by-
products to form; for example, chlorine produces especially high levels of THMs and HAAs while
ozone produces high concentrations of aldehydes, ketones and carboxylic acids.
1.3 Aldehydes
The aldehydes targeted for this research are straight-chain, low-molecular-weight organic
compounds that can be found naturally in the environment. Some may be the source of taste and
odor problems in water. The formation of aldehydes is not fully understood, but it is generally
accepted that they form from two pathways: the first is a direct pathway in which the ozone
molecules attack carbon-carbon double bonds or aromatic rings in NOM; the second is an indirect
reaction involving hydroxyl radicals which form from decomposing ozone (Zhou, 1993, Can and
Gurol, 2003). The first pathway has been found to be more important in aldehyde formation.
Production of aldehydes depends on many factors such as NOM concentration, pH and
temperature of the water, and disinfectant dosage. Many studies have found correlations between
assimable organic carbon (AOC) and aldehyde concentration (Schechter and Singer, 1995, Zhou,
1993), although the relationships are specific to each water.
It has been found by several authors that aldehydes form in direct proportion to ozone dose,
but aldehyde destruction is possible at high doses of ozonation (Nawrocki and Kalkowska, 1996,
Dabrowska et al., 2005, Can and Gurol, 2003). Some authors have also shown aldehyde formation
3
with chlorine (Zhou, 1993) and chlorine dioxide (Swietlik et al., 2003, Dabrowska et al., 2002).
For example, Dabrowska et al. (2005) showed increased concentrations of aldehydes, especially
formaldehyde and acetaldehyde, for three natural waters dosed with chlorine, chlorine dioxide and
ozone; with chlorine and chlorine dioxide, the concentrations increased over time. They also found
when using chlorine dioxide and chlorine together in different ratios with the same total molar
dose, the concentration of generated aldehydes was relatively independent of the ratios. Ramseier
et al. (2010) showed connections between ferrate addition and AOC formation, which may indicate
a connection between ferrate addition and aldehyde formation as well.
Aldehydes are not regulated under the EPA as certain THMs and HAAs are, however, some
aldehydes are included in the USEPA’s Contaminant Candidate List for possible future regulation.
Formaldehyde is a human carcinogen and glyoxal has been shown to promote stomach tumors
(Can and Gurol, 2003). Aldehydes remain a concern due to possible adverse health side effects,
their high biodegradability, and the adverse side effects that can occur when aldehydes react with
disinfectants to form halogenated byproducts (Schechter and Singer, 1995).
1.4 Research Objectives
The goal of this study was to examine the effects of ozone, chlorine, chlorine dioxide, and
ferrate oxidants on the aldehyde concentrations, specifically, formaldehyde, propanol, glyoxal, and
methyl glyoxal concentrations, in a natural water. Different doses of each disinfectant, different
chlorine contact times, and combinations of the disinfectants were tested. The effects of bromide
on aldehyde formation were also examined.
4
2. METHODS AND MATERIALS
2.1 Addition of chlorine, ozone, chlorine dioxide, sodium bromide, and ferrate
Sodium hypochlorite (NaClO) was used for chlorine dosing. Depending on the volume to
be added, chlorine was either dosed directly from the concentrated stock or from a diluted stock
of chlorine in Milli-Q water (Millipore Corp, Billerica, MA, US). Samples were buffered to a pH
of 7 using a 1 M phosphate buffer solution (sodium phosphate monobasic monohydrate and
sodium hydroxide, both from Fisher Scientific, Pittsburg, PA, USA) prior to chlorine dosing. At
the appropriate contact time, 40 mL samples were quenched with 45 mg of ammonium chloride
(Fisher); if no contact time is noted, samples were quenched at time of analysis (12-24 hours after
addition).
Ozone was generated using a Welsbach Ozonator (Type T-408, Welshbach Ozonator
Systems Corp., Philadelphia, PA, USA): ozone was bubbled into a borosilicate glass vessel
containing Milli-Q water at room temperature for the preparation of a concentration stock solution.
The exact concentration of this stock was determined using an Agilent 8453 UV-visible diode-
array spectrophotometer and published values for its molar absorptivity. For a 1-cm pathlength
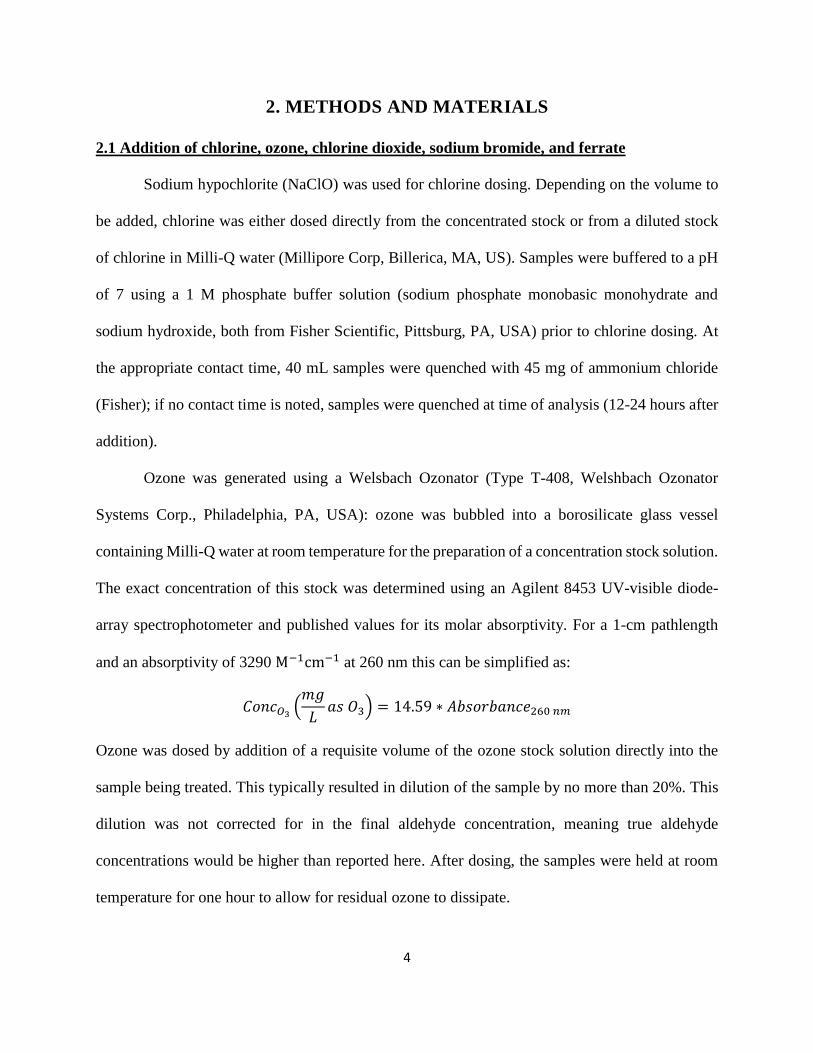
and an absorptivity of 3290 M−1cm−1 at 260 nm this can be simplified as:
𝐶𝑜𝑛𝑐𝑂3(
𝑚𝑔
𝐿𝑎𝑠 𝑂3) = 14.59 ∗ 𝐴𝑏𝑠𝑜𝑟𝑏𝑎𝑛𝑐𝑒260 𝑛𝑚
Ozone was dosed by addition of a requisite volume of the ozone stock solution directly into the
sample being treated. This typically resulted in dilution of the sample by no more than 20%. This
dilution was not corrected for in the final aldehyde concentration, meaning true aldehyde
concentrations would be higher than reported here. After dosing, the samples were held at room
temperature for one hour to allow for residual ozone to dissipate.
5
Chlorine dioxide was generated using Standard Method 4500-Chlorine Dioxide (APHA et
al., 2005) and stored at 4°C. Sodium bromide (Fisher) was added directly to samples as a solid.
For ferrate dosing, solid potassium ferrate (Aldrich, Milwaukee, WI, USA) was added to samples
buffered to a desired pH with 10 mM borate buffer.
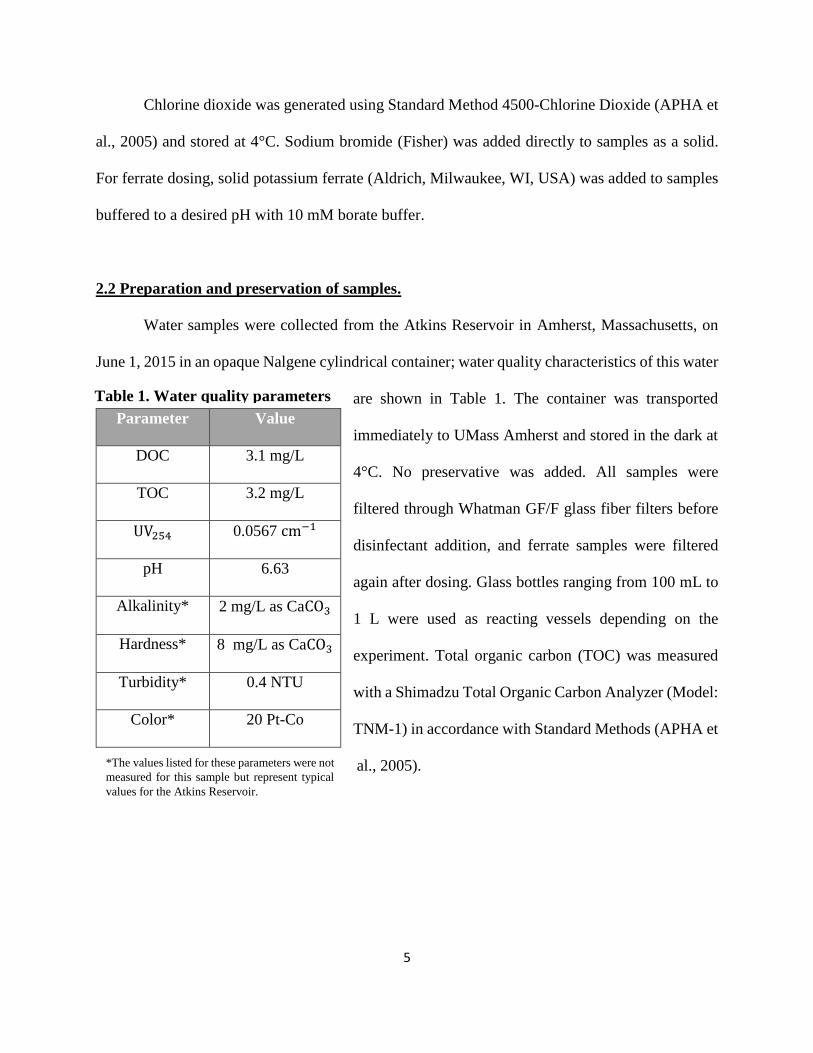
2.2 Preparation and preservation of samples.
Water samples were collected from the Atkins Reservoir in Amherst, Massachusetts, on
June 1, 2015 in an opaque Nalgene cylindrical container; water quality characteristics of this water
are shown in Table 1. The container was transported
immediately to UMass Amherst and stored in the dark at
4°C. No preservative was added. All samples were
filtered through Whatman GF/F glass fiber filters before
disinfectant addition, and ferrate samples were filtered
again after dosing. Glass bottles ranging from 100 mL to
1 L were used as reacting vessels depending on the
experiment. Total organic carbon (TOC) was measured
with a Shimadzu Total Organic Carbon Analyzer (Model:
TNM-1) in accordance with Standard Methods (APHA et
al., 2005).
Table 1. Water quality parameters
for raw Atkins Reservoir water.
Parameter Value
DOC 3.1 mg/L
TOC 3.2 mg/L
UV254 0.0567 cm−1
pH 6.63
Alkalinity* 2 mg/L as CaCO3
Hardness* 8 mg/L as CaCO3
Turbidity* 0.4 NTU
Color* 20 Pt-Co
*The values listed for these parameters were not
measured for this sample but represent typical
values for the Atkins Reservoir.
6
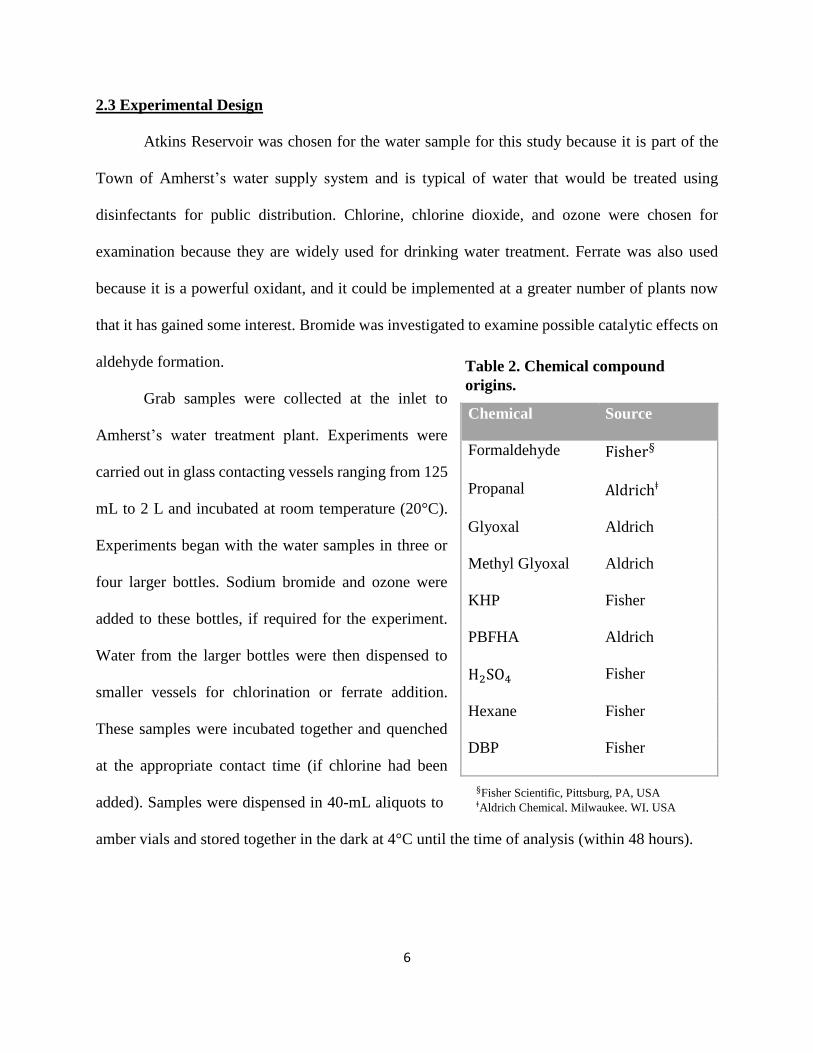
2.3 Experimental Design
Atkins Reservoir was chosen for the water sample for this study because it is part of the
Town of Amherst’s water supply system and is typical of water that would be treated using
disinfectants for public distribution. Chlorine, chlorine dioxide, and ozone were chosen for
examination because they are widely used for drinking water treatment. Ferrate was also used
because it is a powerful oxidant, and it could be implemented at a greater number of plants now
that it has gained some interest. Bromide was investigated to examine possible catalytic effects on
aldehyde formation.
Grab samples were collected at the inlet to
Amherst’s water treatment plant. Experiments were
carried out in glass contacting vessels ranging from 125
mL to 2 L and incubated at room temperature (20°C).
Experiments began with the water samples in three or
four larger bottles. Sodium bromide and ozone were
added to these bottles, if required for the experiment.
Water from the larger bottles were then dispensed to
smaller vessels for chlorination or ferrate addition.
These samples were incubated together and quenched
at the appropriate contact time (if chlorine had been
added). Samples were dispensed in 40-mL aliquots to
amber vials and stored together in the dark at 4°C until the time of analysis (within 48 hours).
Chemical Source
Formaldehyde Fisher§
Propanal Aldrichǂ
Glyoxal Aldrich
Methyl Glyoxal Aldrich
KHP Fisher
PBFHA Aldrich
H2SO4 Fisher
Hexane Fisher
DBP Fisher
Table 2. Chemical compound
origins.
§Fisher Scientific, Pittsburg, PA, USA ǂAldrich Chemical, Milwaukee, WI, USA
7
2.4 Extraction and measurements of aldehydes
The procedures outlined in Standard Methods 6252. Disinfection By-Products: Aldehydes
(Proposed) (APHA et al., 2005) were used for the aldehyde analysis. Chemical sources are
displayed in Table 2. Standards of formaldehyde, propanal, glyoxal, and methyl glyoxal were
prepared volumetrically in acetonitrile for stock solutions and, from these stock solutions, an
additive mixture containing all four aldehydes was prepared weekly. Five calibration standards
were prepared daily from the additive standard solution in Milli-Q water with concentrations
ranging from 2 µg/L to 40 µg/L. Example standard curves are included in the Appendix.
Samples were analyzed in duplicate when available sample volumes allowed. Samples (20
ml each in 40 mL amber vials) were buffered with 200 mg potassium hydrogen phthalate
( KHP, C8H5KO4 ) each before addition of 1 milliliter of 15 mg/mL O-(2,3,4,5,6-
pentafluorobenzyl)hydroxylamine hydrochloride (PFBHA) derivatizing agent (prepared fresh
daily gravimetrically in Milli-Q water). Samples were incubated in a 35°C water bath for 2 hours.
Samples were cooled for 10 minutes and the reaction quenched with two drops of concentrated
sulfuric acid. Four milliliters of hexane solvent containing 100 µg/L 1,2-dibromopropane (DBP,
internal standard) was added to each vial and the samples were shaken for 3.5 minutes. After
settling for five minutes, the top hexane layer was drawn and added to a smaller vial containing 3
mL of 0.2 N sulfuric acid. The vials were shaken for 30 seconds and settled for five minutes. The
top hexane layers were again drawn and placed in gas chromatograph (GC) autosampler vials. If
not used immediately, vials could be stored for up to 14 days in the dark at 4°C.
An Agilent 6890N GC with an electron capture detector was used for the analysis. The gas
chromatograph injector was set to 180°C with the split valve open at 0.5 min and the split flow at
50 mL/min. A fused silica DB-5 capillary column (30 m long, 0.25-mm internal diameter, 0.25-
8
μm film thickness, J&W Scientific) was used with helium carrier gas (flow of 1.5 mL/min at
100°C) and the following temperature program: 50°C for 1 minute, rising at 4°C/min to 220°C,
and finally rising at 20°C to 250°C. The detector was set to 300°C with a nitrogen make-up gas
flow of 27 mL/min.
9
3. RESULTS AND DISCUSSION
3.1 Effects of ozonation on aldehyde formation
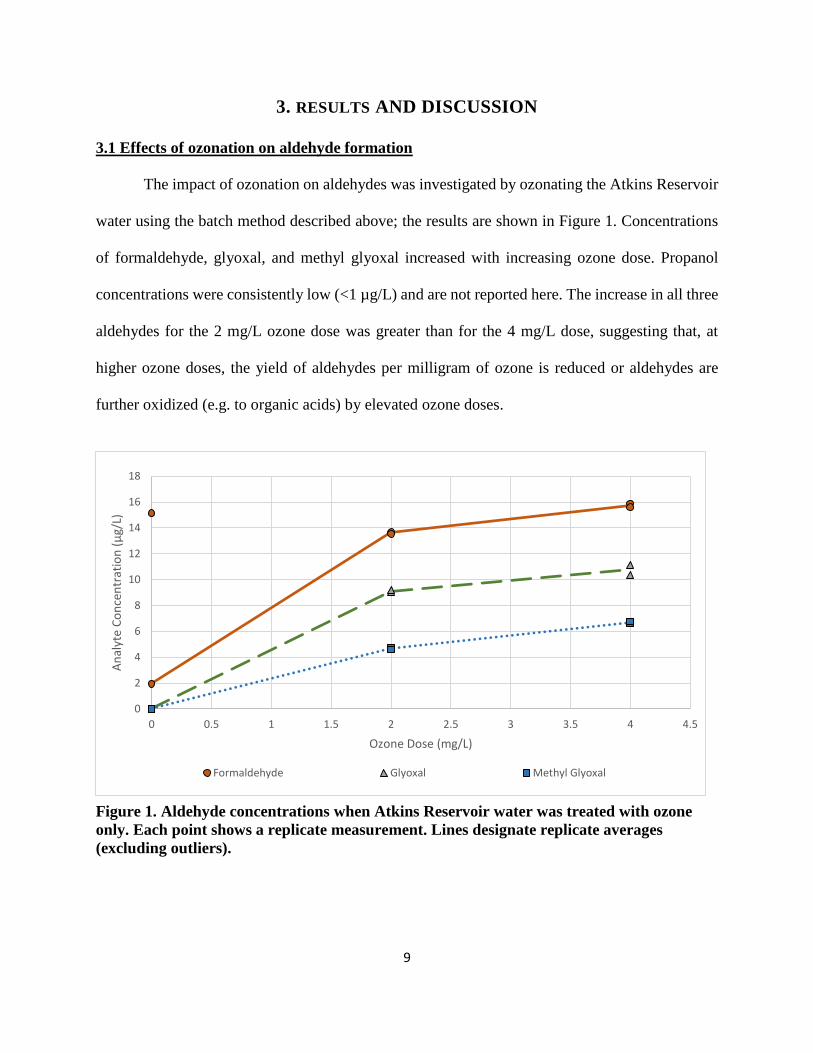
The impact of ozonation on aldehydes was investigated by ozonating the Atkins Reservoir
water using the batch method described above; the results are shown in Figure 1. Concentrations
of formaldehyde, glyoxal, and methyl glyoxal increased with increasing ozone dose. Propanol
concentrations were consistently low (<1 µg/L) and are not reported here. The increase in all three
aldehydes for the 2 mg/L ozone dose was greater than for the 4 mg/L dose, suggesting that, at
higher ozone doses, the yield of aldehydes per milligram of ozone is reduced or aldehydes are
further oxidized (e.g. to organic acids) by elevated ozone doses.
0
2
4
6
8
10
12
14
16
18
0 0.5 1 1.5 2 2.5 3 3.5 4 4.5
An
alyt
e C
on
cen
trat
ion
(µ
g/L)
Ozone Dose (mg/L)
Formaldehyde Glyoxal Methyl Glyoxal
Figure 1. Aldehyde concentrations when Atkins Reservoir water was treated with ozone
only. Each point shows a replicate measurement. Lines designate replicate averages
(excluding outliers).
10
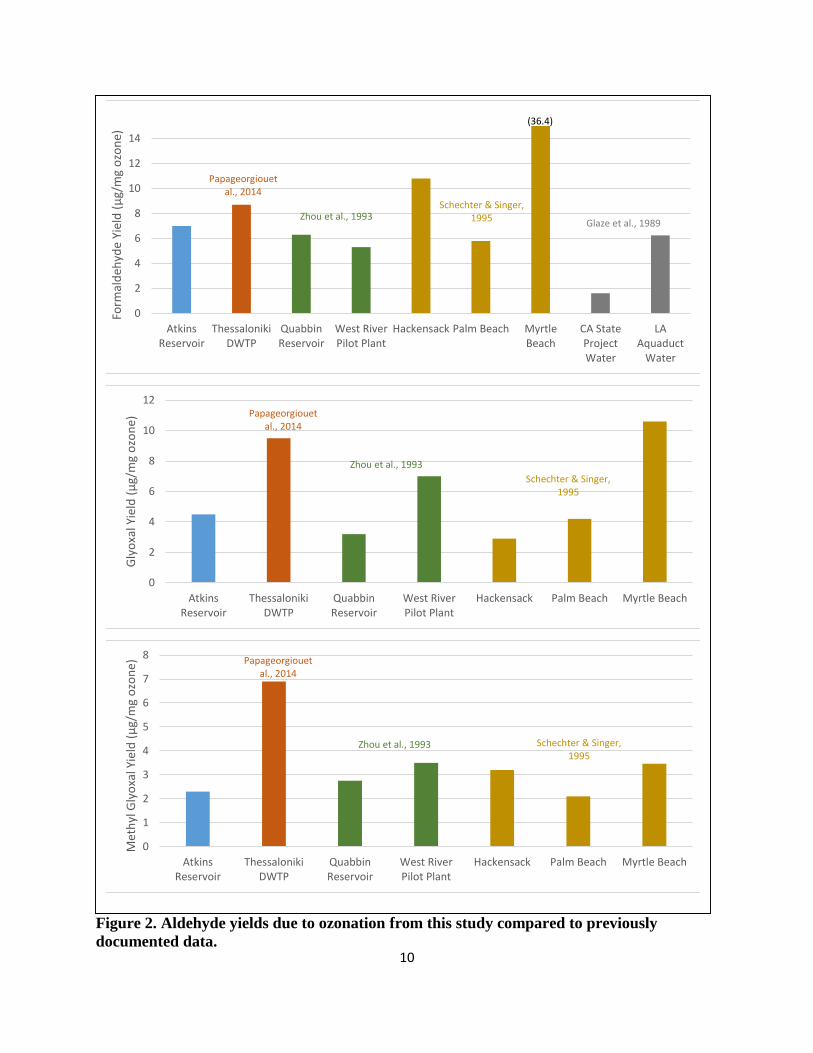
Figure 2. Aldehyde yields due to ozonation from this study compared to previously
documented data.
0
2
4
6
8
10
12
14
AtkinsReservoir
ThessalonikiDWTP
QuabbinReservoir
West RiverPilot Plant
Hackensack Palm Beach MyrtleBeach
CA StateProjectWater
LAAquaduct
Water
Form
ald
ehyd
e Yi
eld
(µ
g/m
g o
zon
e)
Papageorgiouet al., 2014
Zhou et al., 1993Schechter & Singer,
1995 Glaze et al., 1989
(36.4)
0
2
4
6
8
10
12
AtkinsReservoir
ThessalonikiDWTP
QuabbinReservoir
West RiverPilot Plant
Hackensack Palm Beach Myrtle Beach
Gly
oxa
l Yie
ld (
µg/
mg
ozo
ne)
Papageorgiouet al., 2014
Zhou et al., 1993
Schechter & Singer, 1995
0
1
2
3
4
5
6
7
8
AtkinsReservoir
ThessalonikiDWTP
QuabbinReservoir
West RiverPilot Plant
Hackensack Palm Beach Myrtle Beach
Met
hyl
Gly
oxa
l Yie
ld (
µg/
mg
ozo
ne) Papageorgiouet
al., 2014
Zhou et al., 1993 Schechter & Singer, 1995
11
The data above fall within in the range of previously published aldehyde concentrations
(see Figure 2). The most similar yields are from Palm Beach (Schechter & Singer, 1995), the LA
Aquaduct Plant (Glaze et al., 1989), and the Quabbin Reservoir (Zhou, 1993). Schechter & Singer
recorded average formaldehyde, glyoxal, and methyl glyoxal increases of 6 µg/L, 4 µg/L and 2
µg/L, respectively, using Palm Beach water with semi-batch ozonation. Zhou used ozone doses up
to 4 mg/L with water from the Quabbin Reservoir in Massachusetts and found formaldehyde
increased up to 10 µg/L, glyoxal up to 4 mg/L, and methyl glyoxal up to 6 µg/L. Glaze documented
averages of 6 µg/L, 10.5 µg/L, and 3.5 µg/L for formaldehyde, glyoxal and methyl glyoxal
respectively at the Los Angeles Aqueduct Filtration Plant. The variety of yields in Figure 2 shows
how broad the range of aldehyde production is for ozonated waters.
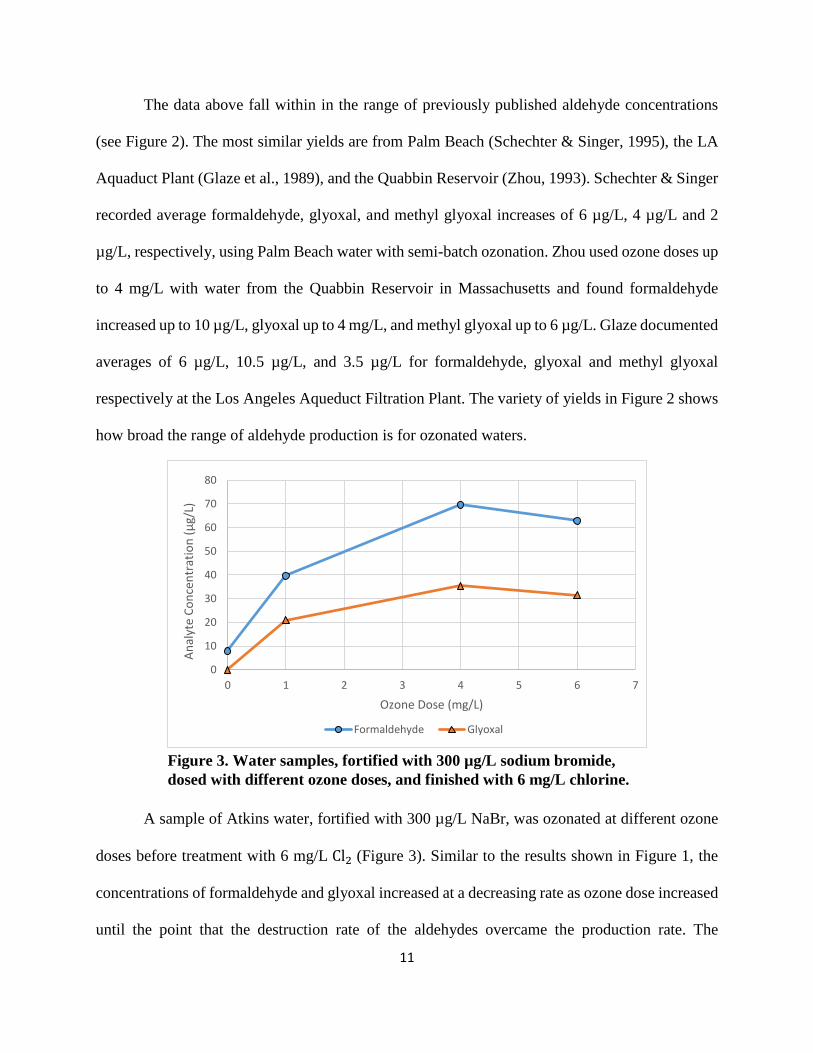
A sample of Atkins water, fortified with 300 µg/L NaBr, was ozonated at different ozone
doses before treatment with 6 mg/L Cl2 (Figure 3). Similar to the results shown in Figure 1, the
concentrations of formaldehyde and glyoxal increased at a decreasing rate as ozone dose increased
until the point that the destruction rate of the aldehydes overcame the production rate. The
0
10
20
30
40
50
60
70
80
0 1 2 3 4 5 6 7
An
alyt
e C
on
cen
trat
ion
(µ
g/L)
Ozone Dose (mg/L)
Formaldehyde Glyoxal
Figure 3. Water samples, fortified with 300 µg/L sodium bromide,
dosed with different ozone doses, and finished with 6 mg/L chlorine.
12
concentrations seen from pretreating with sodium bromide are much greater than with ozonation
alone. Propanal and methyl glyoxal did not appear in significant concentrations. Bromide is known
to act as a catalyst in many oxidation reactions in water treatment (Gunten, 2003), although other
authors have not found any effect (Schechter and Singer, 1995). It appears from these results that
bromide catalyzes the formation of aldehydes.
3.2 Effects of chlorine on aldehyde formation
Atkins Reservoir water samples were also treated with chlorine under varying conditions
to evaluate the effects of chlorine on aldehyde formation. Two replicate experiments were
performed with the second experiment using the same water stored for a week longer at 4°C. The
second experiment also included more sampling points than the first. The higher concentrations in
the first experiment may be reflective of these differences, as the chlorine stock may have degraded
in the time between the two experiments. The top graphs of the pairs below show the results from
the first experiment, and the bottom graphs show the results from the second experiment. Each
graph shows the concentrations of the aldehydes when the chlorine was quenched at different
chlorine contact times under the same ozonation condition; each pair of graphs corresponds to a
different ozonation condition, either 0 mg/L, 2 mg/L, or 4 mg/L ozone dose.
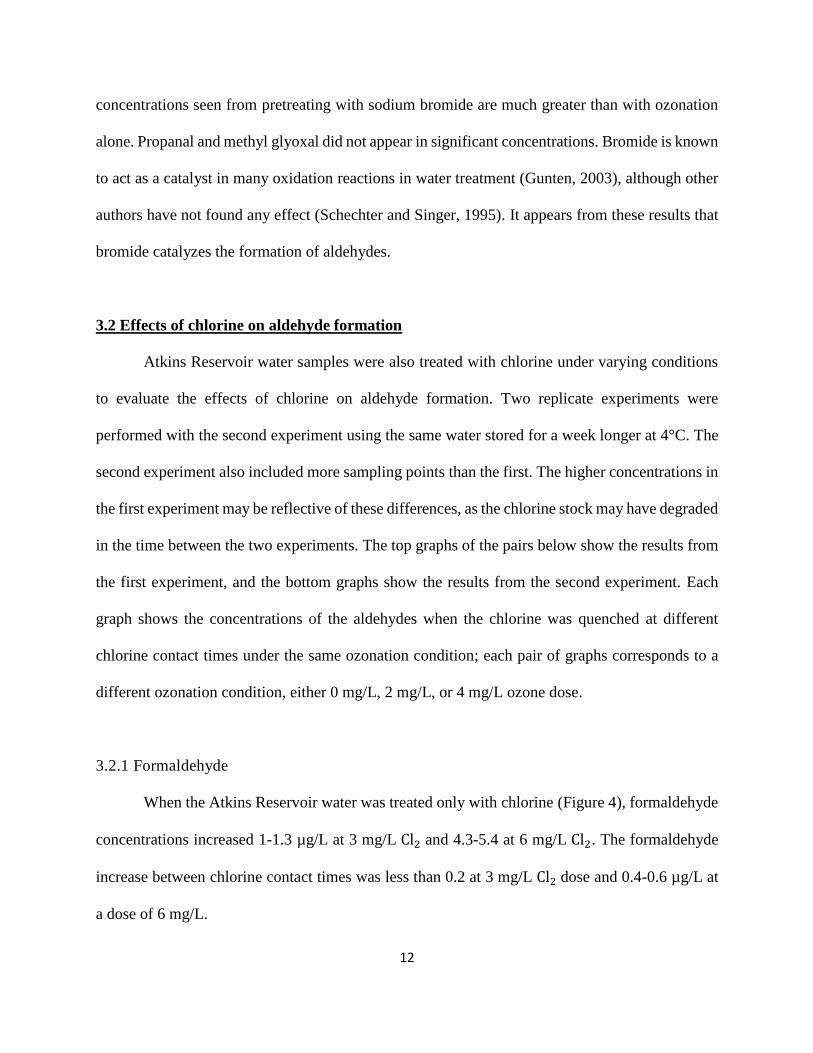
3.2.1 Formaldehyde
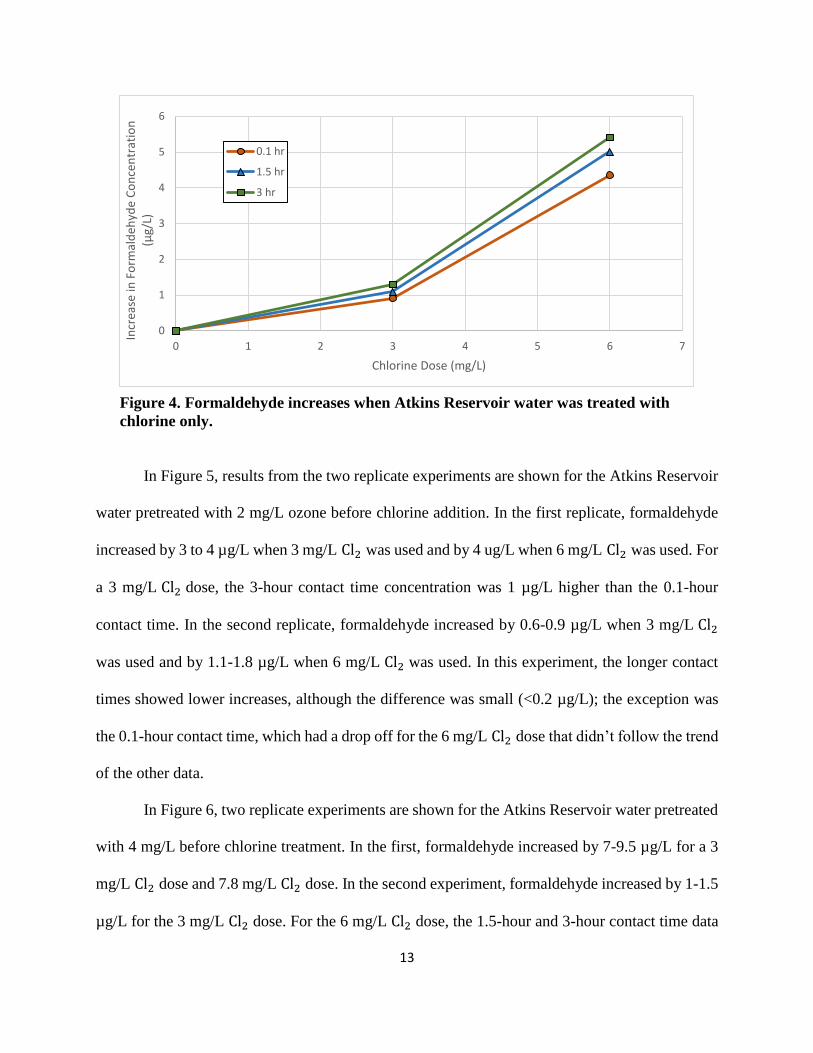
When the Atkins Reservoir water was treated only with chlorine (Figure 4), formaldehyde
concentrations increased 1-1.3 µg/L at 3 mg/L Cl2 and 4.3-5.4 at 6 mg/L Cl2. The formaldehyde
increase between chlorine contact times was less than 0.2 at 3 mg/L Cl2 dose and 0.4-0.6 µg/L at
a dose of 6 mg/L.
13
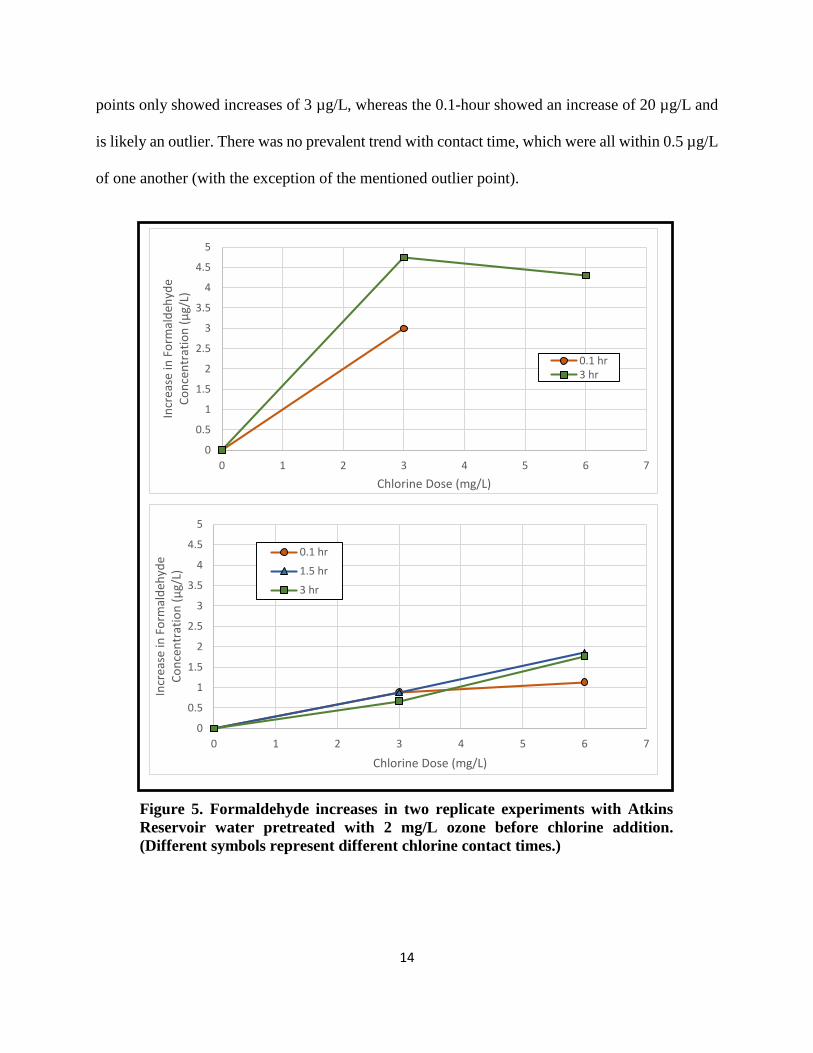
In Figure 5, results from the two replicate experiments are shown for the Atkins Reservoir
water pretreated with 2 mg/L ozone before chlorine addition. In the first replicate, formaldehyde
increased by 3 to 4 µg/L when 3 mg/L Cl2 was used and by 4 ug/L when 6 mg/L Cl2 was used. For
a 3 mg/L Cl2 dose, the 3-hour contact time concentration was 1 µg/L higher than the 0.1-hour
contact time. In the second replicate, formaldehyde increased by 0.6-0.9 µg/L when 3 mg/L Cl2
was used and by 1.1-1.8 µg/L when 6 mg/L Cl2 was used. In this experiment, the longer contact
times showed lower increases, although the difference was small (<0.2 µg/L); the exception was
the 0.1-hour contact time, which had a drop off for the 6 mg/L Cl2 dose that didn’t follow the trend
of the other data.
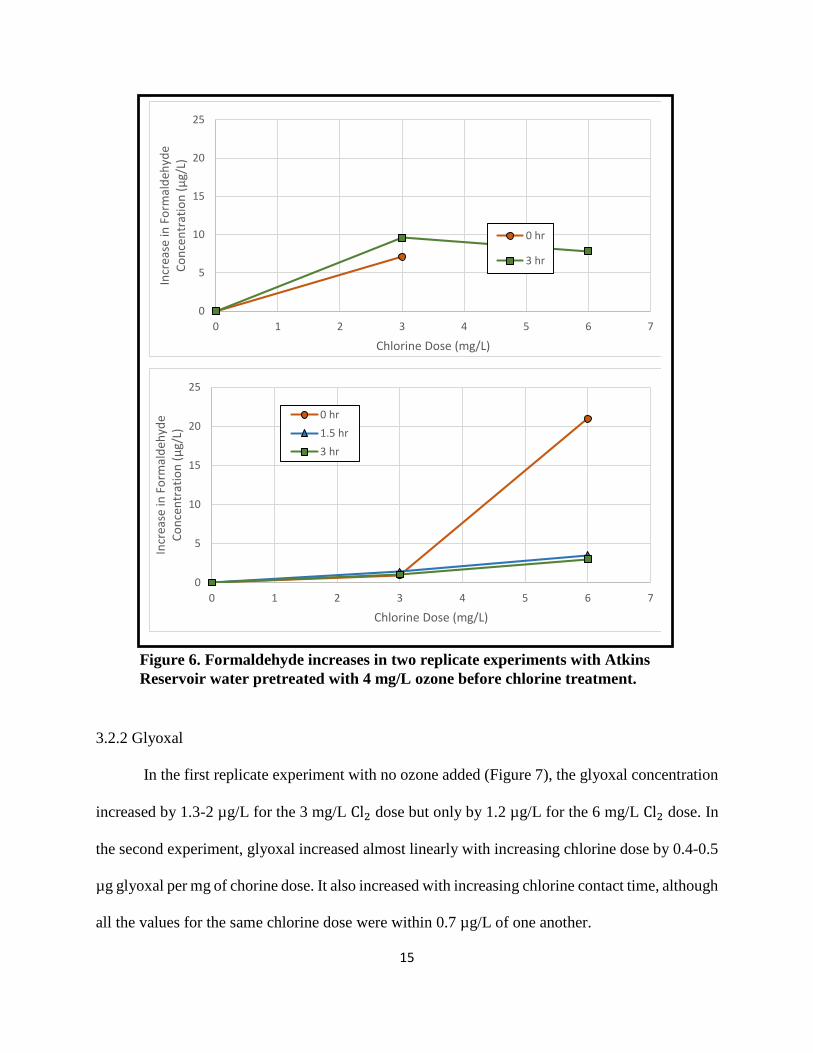
In Figure 6, two replicate experiments are shown for the Atkins Reservoir water pretreated
with 4 mg/L before chlorine treatment. In the first, formaldehyde increased by 7-9.5 µg/L for a 3
mg/L Cl2 dose and 7.8 mg/L Cl2 dose. In the second experiment, formaldehyde increased by 1-1.5
µg/L for the 3 mg/L Cl2 dose. For the 6 mg/L Cl2 dose, the 1.5-hour and 3-hour contact time data
0
1
2
3
4
5
6
0 1 2 3 4 5 6 7
Incr
ease
in F
orm
ald
ehyd
e C
on
cen
trat
ion
(µ
g/L)
Chlorine Dose (mg/L)
0.1 hr
1.5 hr
3 hr
Figure 4. Formaldehyde increases when Atkins Reservoir water was treated with
chlorine only.
14
points only showed increases of 3 µg/L, whereas the 0.1-hour showed an increase of 20 µg/L and
is likely an outlier. There was no prevalent trend with contact time, which were all within 0.5 µg/L
of one another (with the exception of the mentioned outlier point).
0
0.5
1
1.5
2
2.5
3
3.5
4
4.5
5
0 1 2 3 4 5 6 7
Incr
ease
in F
orm
ald
ehyd
e C
on
cen
trat
ion
(µ
g/L)
Chlorine Dose (mg/L)
0.1 hr3 hr
0
0.5
1
1.5
2
2.5
3
3.5
4
4.5
5
0 1 2 3 4 5 6 7
Incr
ease
in F
orm
ald
ehyd
e C
on
cen
trat
ion
(µ
g/L)
Chlorine Dose (mg/L)
0.1 hr
1.5 hr
3 hr
Figure 5. Formaldehyde increases in two replicate experiments with Atkins
Reservoir water pretreated with 2 mg/L ozone before chlorine addition.
(Different symbols represent different chlorine contact times.)
15
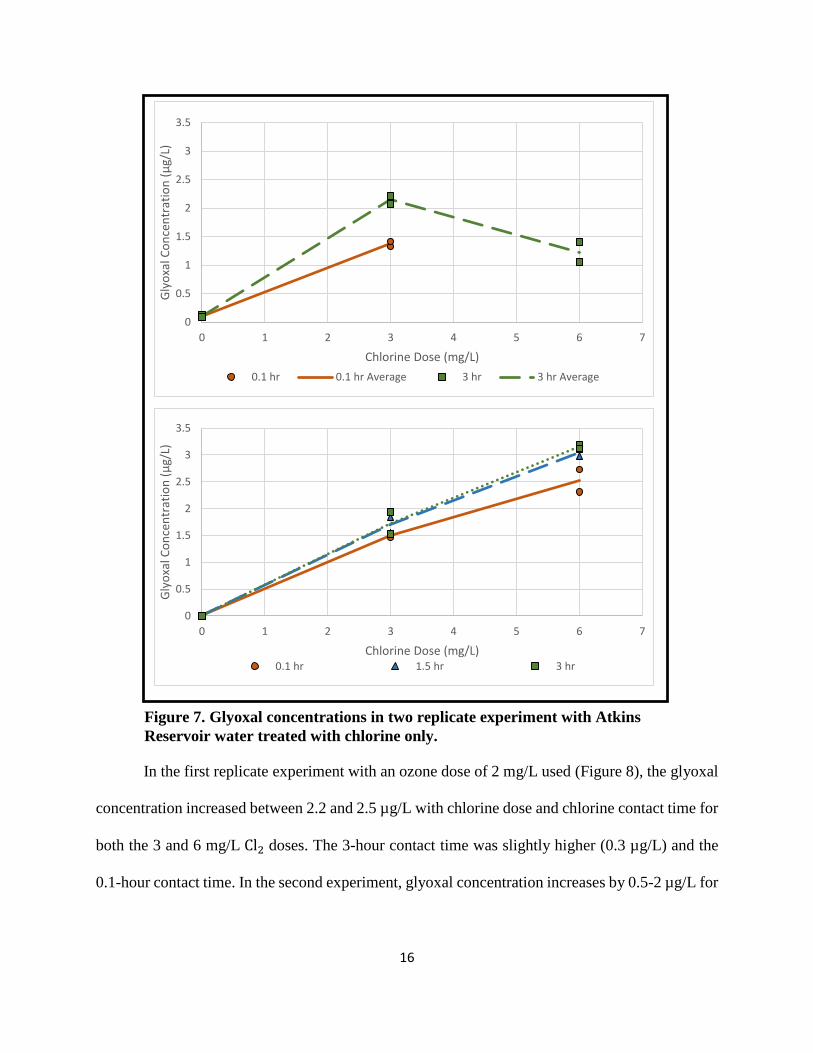
3.2.2 Glyoxal
In the first replicate experiment with no ozone added (Figure 7), the glyoxal concentration
increased by 1.3-2 µg/L for the 3 mg/L Cl2 dose but only by 1.2 µg/L for the 6 mg/L Cl2 dose. In
the second experiment, glyoxal increased almost linearly with increasing chlorine dose by 0.4-0.5
µg glyoxal per mg of chorine dose. It also increased with increasing chlorine contact time, although
all the values for the same chlorine dose were within 0.7 µg/L of one another.
0
5
10
15
20
25
0 1 2 3 4 5 6 7
Incr
ease
in F
orm
ald
ehyd
e C
on
cen
trat
ion
(µ
g/L)
Chlorine Dose (mg/L)
0 hr
3 hr
0
5
10
15
20
25
0 1 2 3 4 5 6 7
Incr
ease
in F
orm
ald
ehyd
e C
on
cen
trat
ion
(µ
g/L)
Chlorine Dose (mg/L)
0 hr
1.5 hr
3 hr
Figure 6. Formaldehyde increases in two replicate experiments with Atkins
Reservoir water pretreated with 4 mg/L ozone before chlorine treatment.
16
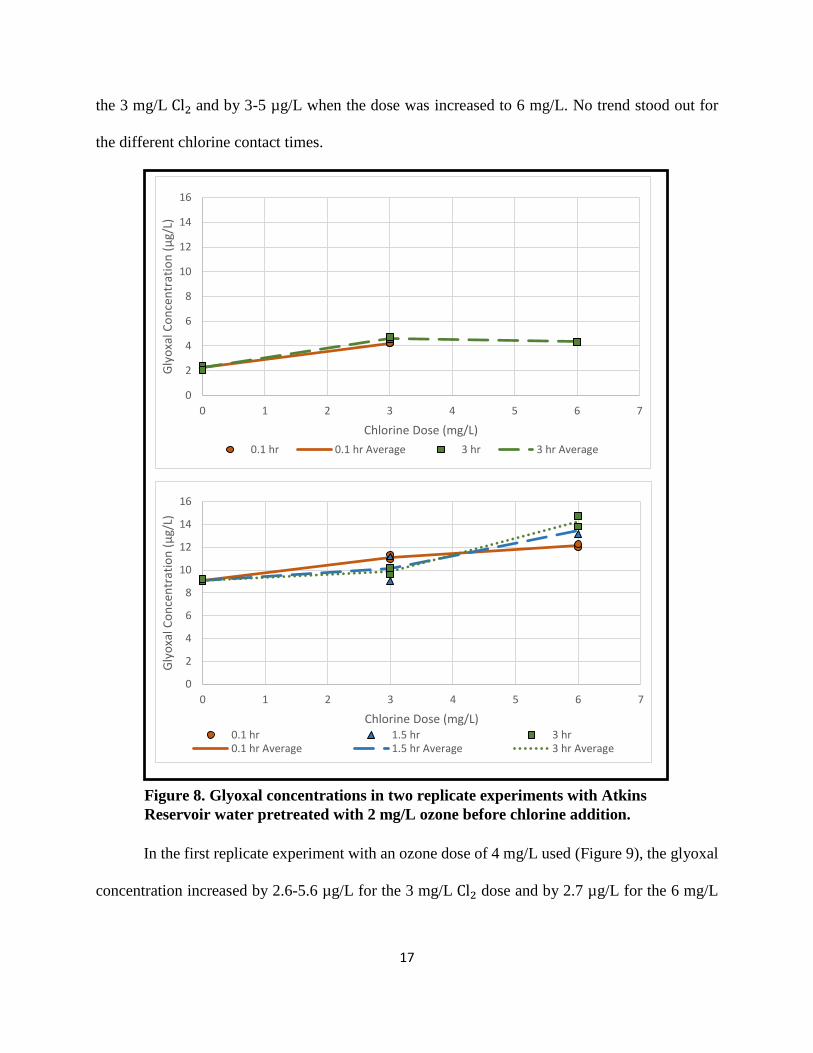
In the first replicate experiment with an ozone dose of 2 mg/L used (Figure 8), the glyoxal
concentration increased between 2.2 and 2.5 µg/L with chlorine dose and chlorine contact time for
both the 3 and 6 mg/L Cl2 doses. The 3-hour contact time was slightly higher (0.3 µg/L) and the
0.1-hour contact time. In the second experiment, glyoxal concentration increases by 0.5-2 µg/L for
0
0.5
1
1.5
2
2.5
3
3.5
0 1 2 3 4 5 6 7
Gly
oxa
l Co
nce
ntr
atio
n (
µg/
L)
Chlorine Dose (mg/L)
0.1 hr 0.1 hr Average 3 hr 3 hr Average
0
0.5
1
1.5
2
2.5
3
3.5
0 1 2 3 4 5 6 7
Gly
oxa
l Co
nce
ntr
atio
n (
µg/
L)
Chlorine Dose (mg/L)0.1 hr 1.5 hr 3 hr
Figure 7. Glyoxal concentrations in two replicate experiment with Atkins
Reservoir water treated with chlorine only.
17
the 3 mg/L Cl2 and by 3-5 µg/L when the dose was increased to 6 mg/L. No trend stood out for
the different chlorine contact times.
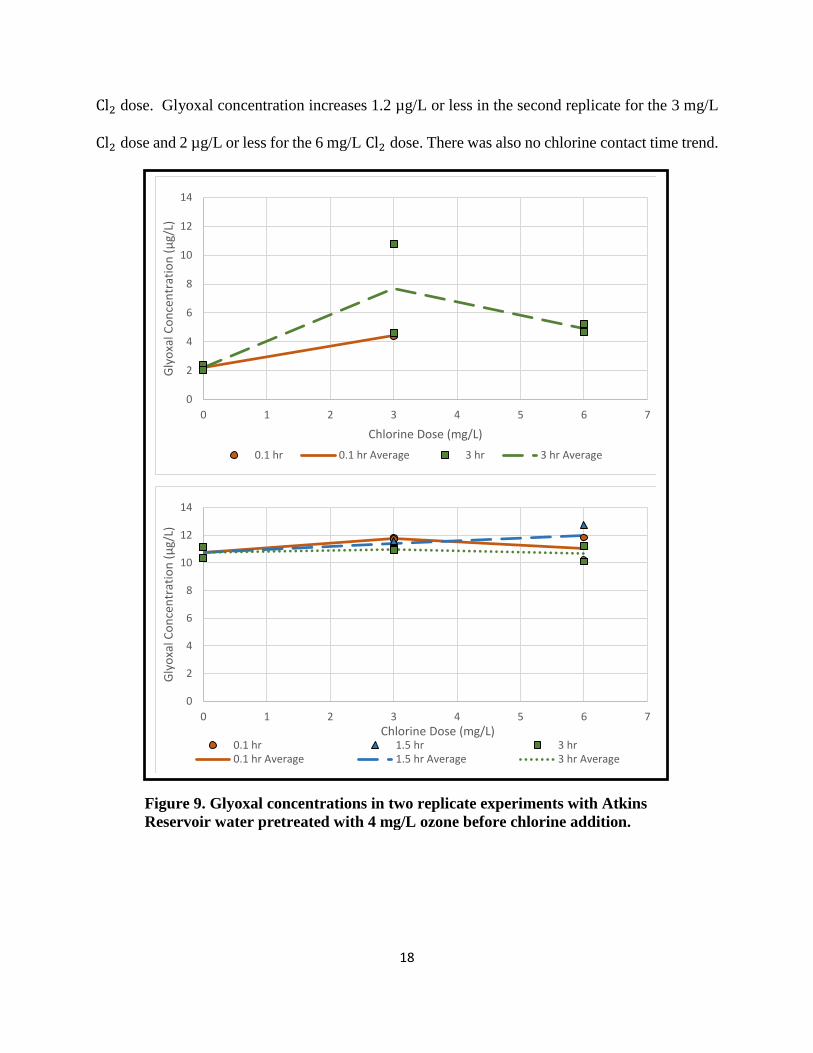
In the first replicate experiment with an ozone dose of 4 mg/L used (Figure 9), the glyoxal
concentration increased by 2.6-5.6 µg/L for the 3 mg/L Cl2 dose and by 2.7 µg/L for the 6 mg/L
0
2
4
6
8
10
12
14
16
0 1 2 3 4 5 6 7
Gly
oxa
l Co
nce
ntr
atio
n (
µg/
L)
Chlorine Dose (mg/L)
0.1 hr 0.1 hr Average 3 hr 3 hr Average
0
2
4
6
8
10
12
14
16
0 1 2 3 4 5 6 7
Gly
oxa
l Co
nce
ntr
atio
n (
µg/
L)
Chlorine Dose (mg/L)0.1 hr 1.5 hr 3 hr0.1 hr Average 1.5 hr Average 3 hr Average
Figure 8. Glyoxal concentrations in two replicate experiments with Atkins
Reservoir water pretreated with 2 mg/L ozone before chlorine addition.
18
Cl2 dose. Glyoxal concentration increases 1.2 µg/L or less in the second replicate for the 3 mg/L
Cl2 dose and 2 µg/L or less for the 6 mg/L Cl2 dose. There was also no chlorine contact time trend.
0
2
4
6
8
10
12
14
0 1 2 3 4 5 6 7
Gly
oxa
l Co
nce
ntr
atio
n (
µg/
L)
Chlorine Dose (mg/L)
0.1 hr 0.1 hr Average 3 hr 3 hr Average
0
2
4
6
8
10
12
14
0 1 2 3 4 5 6 7
Gly
oxa
l Co
nce
ntr
atio
n (
µg/
L)
Chlorine Dose (mg/L)0.1 hr 1.5 hr 3 hr0.1 hr Average 1.5 hr Average 3 hr Average
Figure 9. Glyoxal concentrations in two replicate experiments with Atkins
Reservoir water pretreated with 4 mg/L ozone before chlorine addition.
19
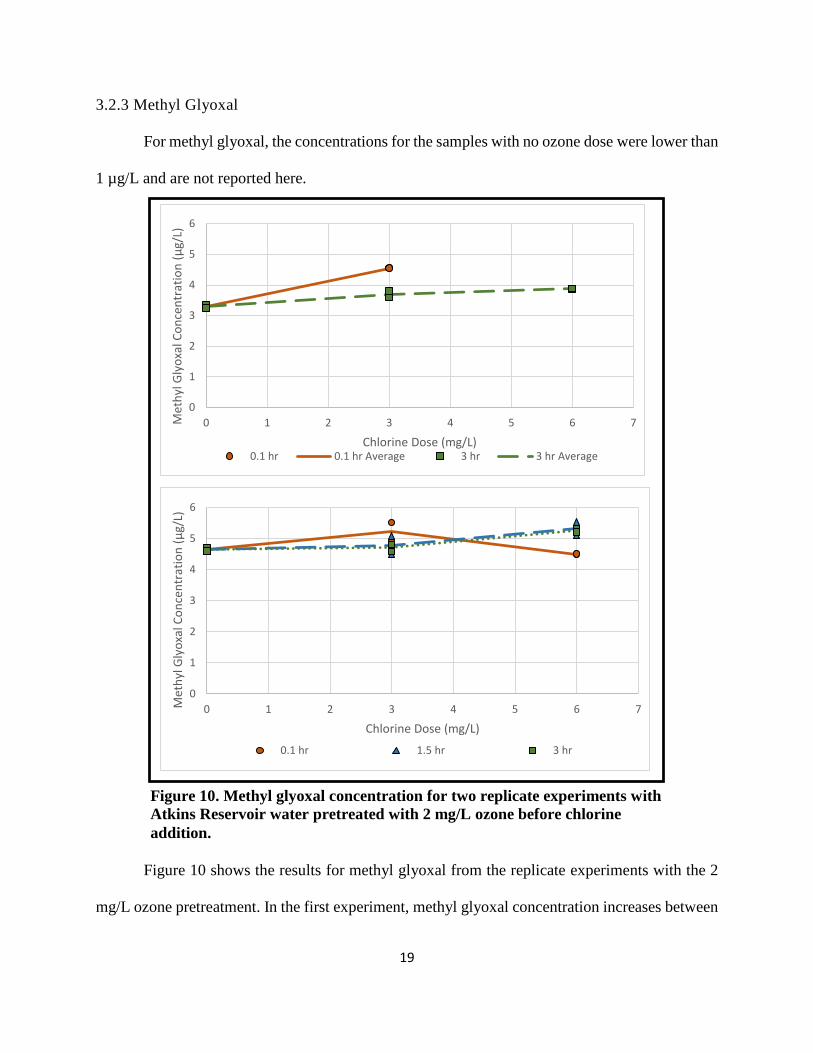
3.2.3 Methyl Glyoxal
For methyl glyoxal, the concentrations for the samples with no ozone dose were lower than
1 µg/L and are not reported here.
Figure 10 shows the results for methyl glyoxal from the replicate experiments with the 2
mg/L ozone pretreatment. In the first experiment, methyl glyoxal concentration increases between
0
1
2
3
4
5
6
0 1 2 3 4 5 6 7Met
hyl
Gly
oxa
l Co
nce
ntr
atio
n (
µg/
L)
Chlorine Dose (mg/L)0.1 hr 0.1 hr Average 3 hr 3 hr Average
0
1
2
3
4
5
6
0 1 2 3 4 5 6 7Met
hyl
Gly
oxa
l Co
nce
ntr
atio
n (
µg/
L)
Chlorine Dose (mg/L)
0.1 hr 1.5 hr 3 hr
Figure 10. Methyl glyoxal concentration for two replicate experiments with
Atkins Reservoir water pretreated with 2 mg/L ozone before chlorine
addition.
20
0.5 µg/L and 1 µg/L for the 3 mg/L Cl2 chlorine dose and by 0.6 µg/L for the 6 mg/L dose. In the
second experiment, concentrations for both doses rose under 0.7 µg/L, and no trends in chlorine
contact time were observed.
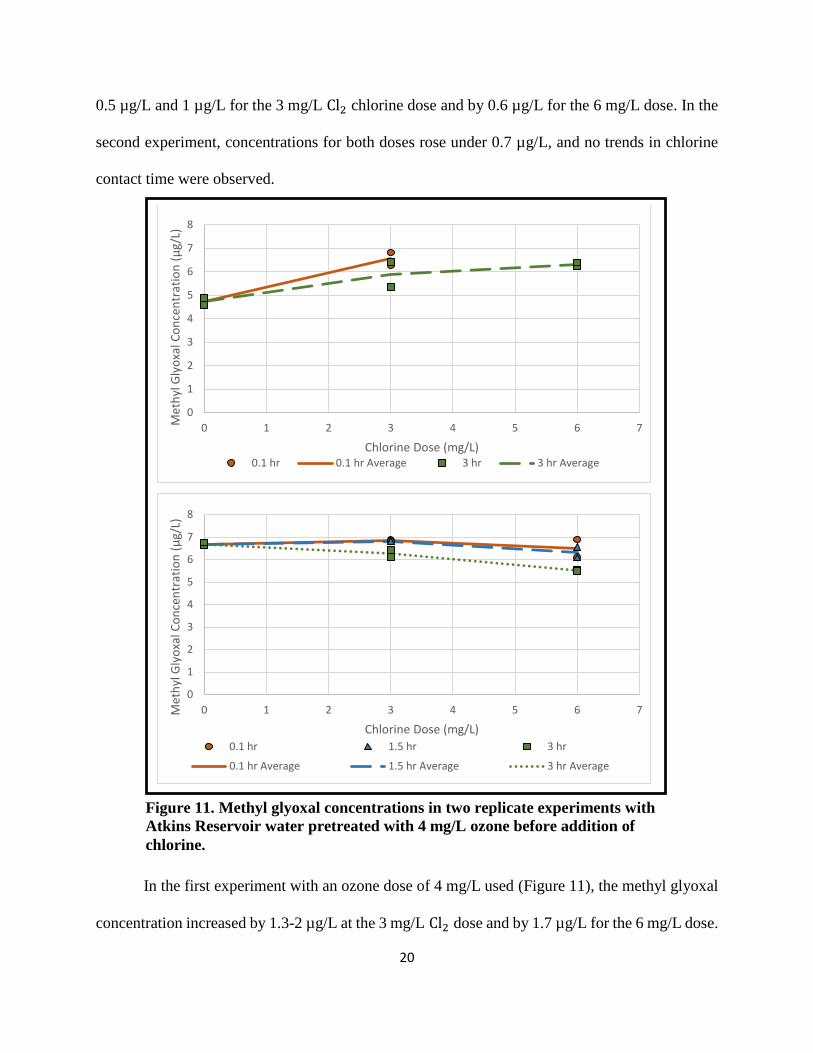
In the first experiment with an ozone dose of 4 mg/L used (Figure 11), the methyl glyoxal
concentration increased by 1.3-2 µg/L at the 3 mg/L Cl2 dose and by 1.7 µg/L for the 6 mg/L dose.
0
1
2
3
4
5
6
7
8
0 1 2 3 4 5 6 7Met
hyl
Gly
oxa
l Co
nce
ntr
atio
n (
µg/
L)
Chlorine Dose (mg/L)0.1 hr 0.1 hr Average 3 hr 3 hr Average
0
1
2
3
4
5
6
7
8
0 1 2 3 4 5 6 7Met
hyl
Gly
oxa
l Co
nce
ntr
atio
n (
µg/
L)
Chlorine Dose (mg/L)
0.1 hr 1.5 hr 3 hr
0.1 hr Average 1.5 hr Average 3 hr Average
Figure 11. Methyl glyoxal concentrations in two replicate experiments with
Atkins Reservoir water pretreated with 4 mg/L ozone before addition of
chlorine.
21
In the second experiment, the results show a decrease in concentration (up to 0.5 µg/L for 3 mg/L
and up to 1 µg/L for the 6 mg/L dose) with increasing chlorine dose. In both, concentrations
increase with decreasing chlorine contact time.
Overall, chlorine addition cause methyl glyoxal concentrations to increase. Methyl glyoxal
concentrations decreased at higher chlorine doses in some—but not all—cases. Longer contact
times generally showed a decrease in methyl glyoxal concentration, possibly due to the
degradation of methyl glyoxal overcoming its rate of production by chlorine.
3.2.4 Propanal
In all the chlorine experiments, propanal was only detected in low concentrations (2 µg/L
or less) and was not reported here. It would appear, from this, then propanol is not produced in
great quantities in response to chlorination.
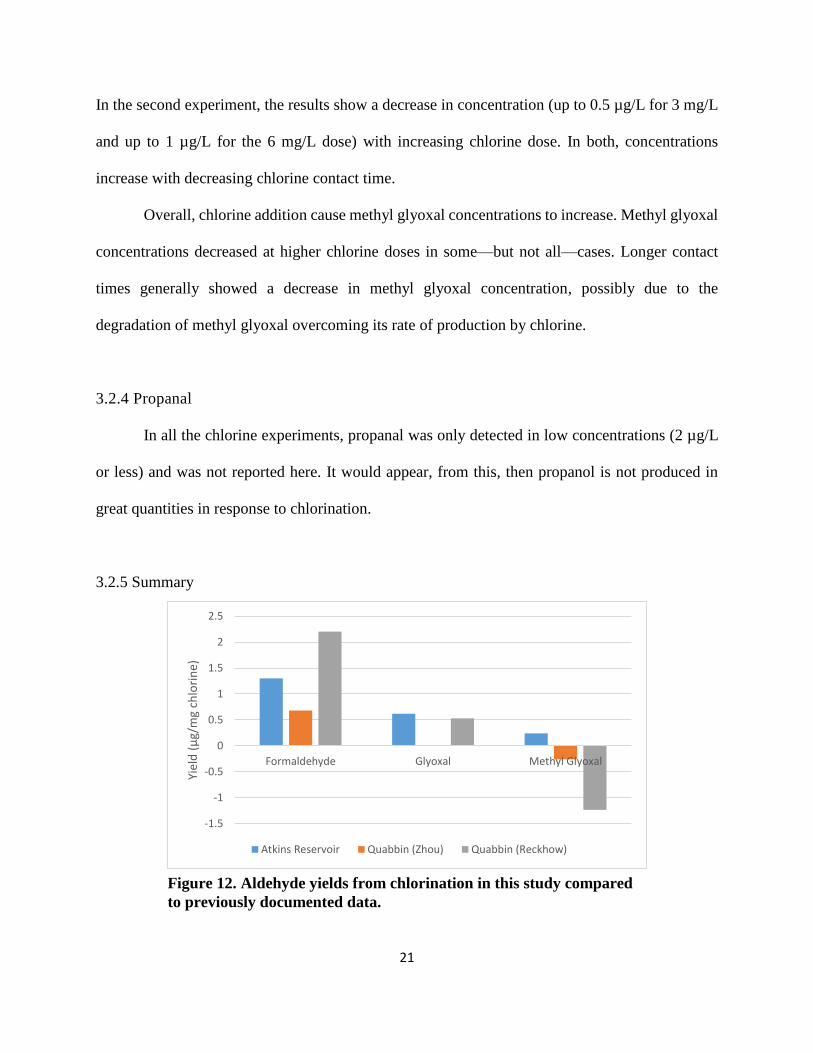
3.2.5 Summary
-1.5
-1
-0.5
0
0.5
1
1.5
2
2.5
Formaldehyde Glyoxal Methyl Glyoxal
Yiel
d (
µg/
mg
chlo
rin
e)
Atkins Reservoir Quabbin (Zhou) Quabbin (Reckhow)
Figure 12. Aldehyde yields from chlorination in this study compared
to previously documented data.
22
The overall yield results of the chlorination experiments are summarized in Figure 12. The
yields for formaldehyde and glyoxal from chlorine treatment are within the general
range of other published data, however, the range of yields varies considerably (even within the
same water source, e.g. Quabbin Reservoir). In addition, the methyl glyoxal yield for this study is
positive, but the other studies report negative yields. Only one set of data in this study (water
pretreated 4 mg/L ozone) showed a definite negative trend for methyl glyoxal.
The relationship between chlorine contact time, chlorine dose, and aldehyde concentrations
was not consistent across all experiments or aldehydes. Longer contact times increased
formaldehyde concentrations in most cases, but the increases were mostly minor (1 or 2 µg/L).
Glyoxal showed the same trend in about half the data, but the increases were likewise small.
Methyl glyoxal showed the opposite trend (decreased concentration for longer chlorine contact
times); this is not surprising as the other studies in Figure 12 showed a decrease in methyl glyoxal
with chlorine dose. This decrease for only methyl glyoxal likely occurs when chlorine reacts with
the compound’s methyl group, forming chlorinated by-products through additional reactions.
Increases in aldehyde concentrations were greater per milligram of ozone for the 2 mg/L
dose than the 4 mg/L dose, indicating that the bulk of aldehyde formation happens at lower doses
of ozone. This likely happens due to the limited amount of carbon available in the samples for
oxidation: as the aldehyde precursor concentration became depleted, the rate of aldehyde
production would slow. Because of this, it is possible that a greater difference in formation would
be demonstrated if chlorine contact times were studied using lower doses of ozone.
23
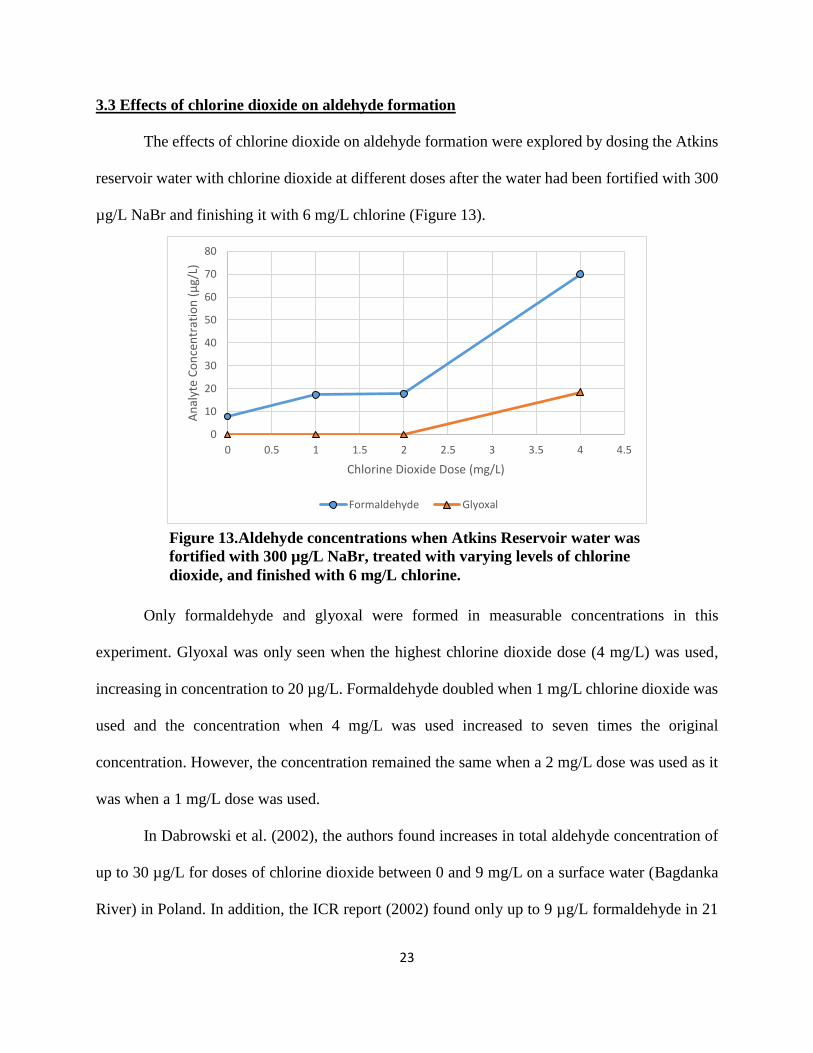
3.3 Effects of chlorine dioxide on aldehyde formation
The effects of chlorine dioxide on aldehyde formation were explored by dosing the Atkins
reservoir water with chlorine dioxide at different doses after the water had been fortified with 300
µg/L NaBr and finishing it with 6 mg/L chlorine (Figure 13).
Only formaldehyde and glyoxal were formed in measurable concentrations in this
experiment. Glyoxal was only seen when the highest chlorine dioxide dose (4 mg/L) was used,
increasing in concentration to 20 µg/L. Formaldehyde doubled when 1 mg/L chlorine dioxide was
used and the concentration when 4 mg/L was used increased to seven times the original
concentration. However, the concentration remained the same when a 2 mg/L dose was used as it
was when a 1 mg/L dose was used.
In Dabrowski et al. (2002), the authors found increases in total aldehyde concentration of
up to 30 µg/L for doses of chlorine dioxide between 0 and 9 mg/L on a surface water (Bagdanka
River) in Poland. In addition, the ICR report (2002) found only up to 9 µg/L formaldehyde in 21
0
10
20
30
40
50
60
70
80
0 0.5 1 1.5 2 2.5 3 3.5 4 4.5
An
alyt
e C
on
cen
trat
ion
(µ
g/L)
Chlorine Dioxide Dose (mg/L)
Formaldehyde Glyoxal
Figure 13.Aldehyde concentrations when Atkins Reservoir water was
fortified with 300 µg/L NaBr, treated with varying levels of chlorine
dioxide, and finished with 6 mg/L chlorine.
24
surface water plants using chlorine dioxide. Both of these are considerably lower than the results
seen here, which reach a maximum increase of 60 µg/L of formaldehyde alone.
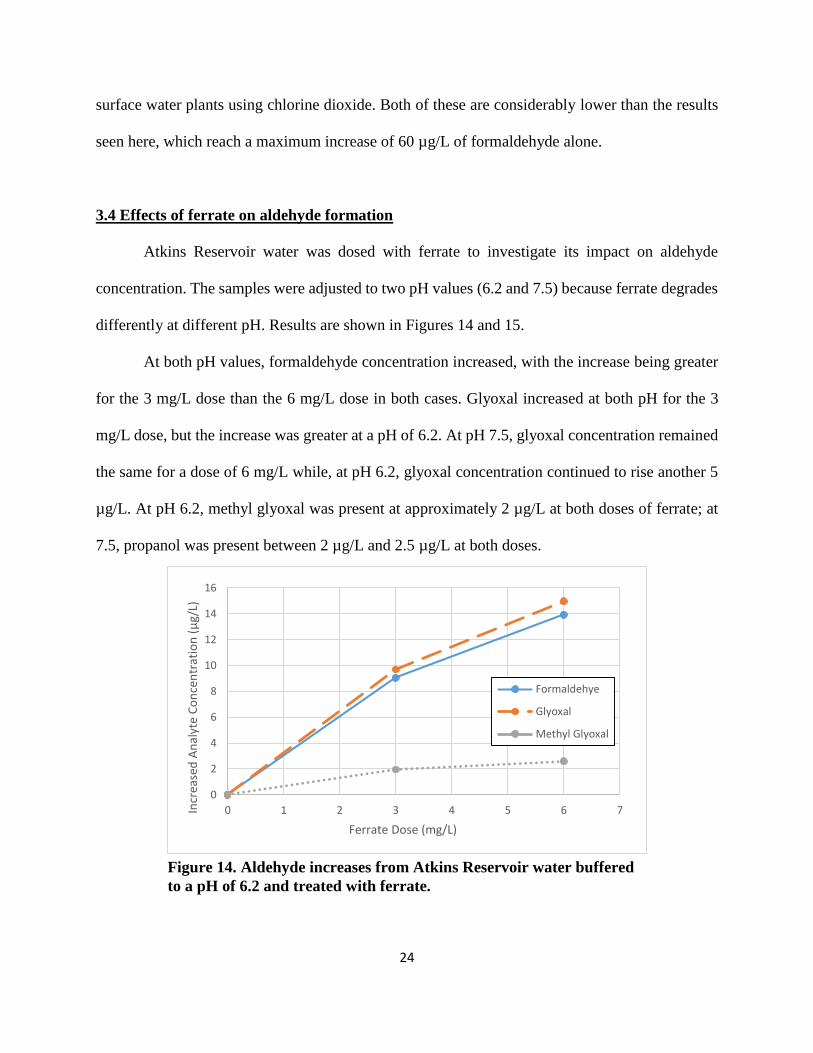
3.4 Effects of ferrate on aldehyde formation
Atkins Reservoir water was dosed with ferrate to investigate its impact on aldehyde
concentration. The samples were adjusted to two pH values (6.2 and 7.5) because ferrate degrades
differently at different pH. Results are shown in Figures 14 and 15.
At both pH values, formaldehyde concentration increased, with the increase being greater
for the 3 mg/L dose than the 6 mg/L dose in both cases. Glyoxal increased at both pH for the 3
mg/L dose, but the increase was greater at a pH of 6.2. At pH 7.5, glyoxal concentration remained
the same for a dose of 6 mg/L while, at pH 6.2, glyoxal concentration continued to rise another 5
µg/L. At pH 6.2, methyl glyoxal was present at approximately 2 µg/L at both doses of ferrate; at
7.5, propanol was present between 2 µg/L and 2.5 µg/L at both doses.
0
2
4
6
8
10
12
14
16
0 1 2 3 4 5 6 7Incr
ease
d A
nal
yte
Co
nce
ntr
atio
n (
µg/
L)
Ferrate Dose (mg/L)
Formaldehye
Glyoxal
Methyl Glyoxal
Figure 14. Aldehyde increases from Atkins Reservoir water buffered
to a pH of 6.2 and treated with ferrate.
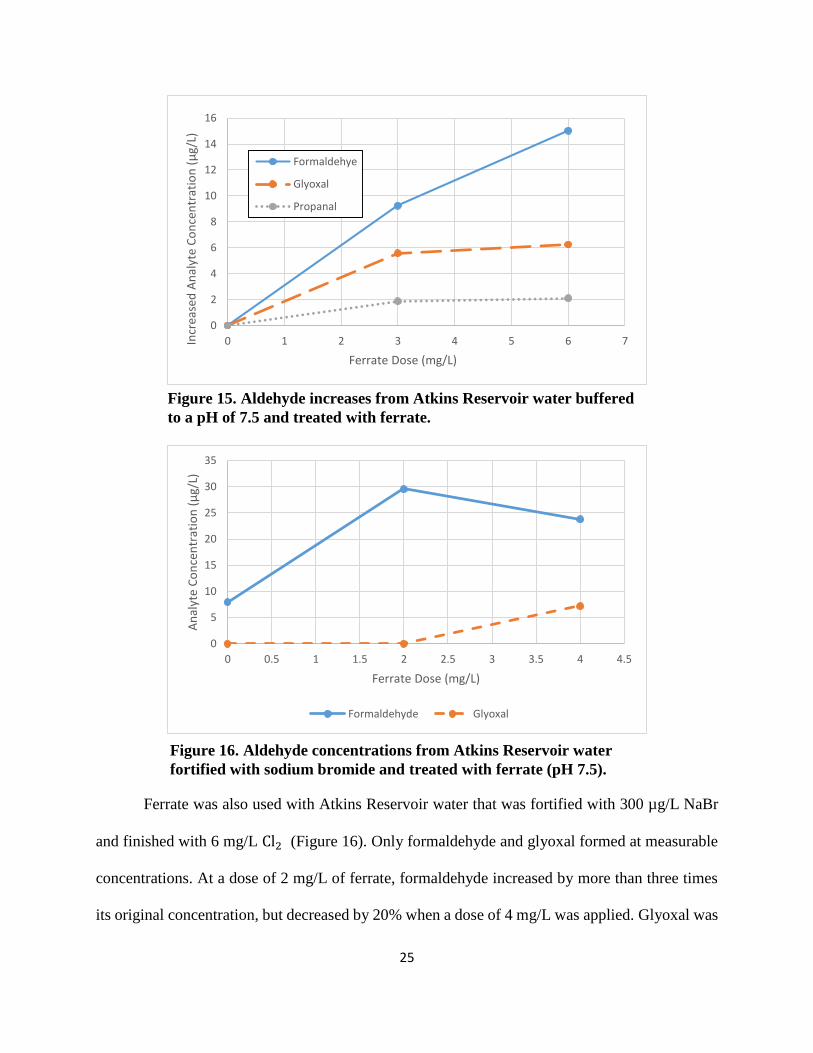
25
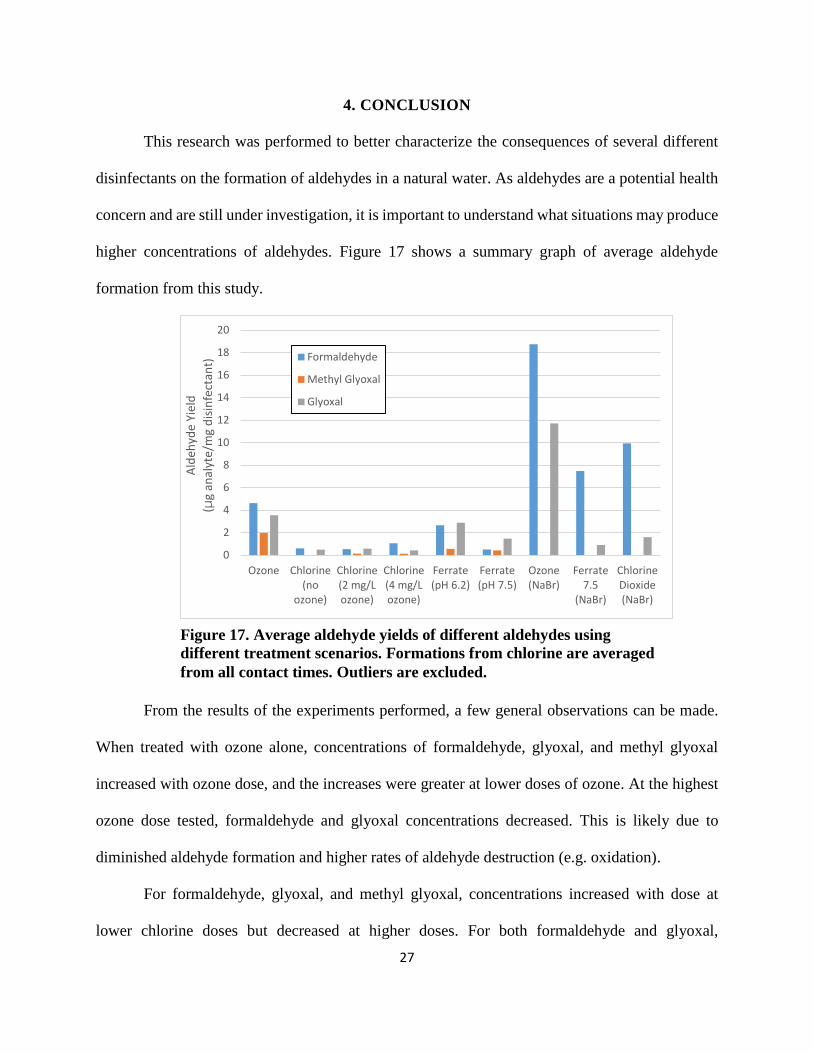
Ferrate was also used with Atkins Reservoir water that was fortified with 300 µg/L NaBr
and finished with 6 mg/L Cl2 (Figure 16). Only formaldehyde and glyoxal formed at measurable
concentrations. At a dose of 2 mg/L of ferrate, formaldehyde increased by more than three times
its original concentration, but decreased by 20% when a dose of 4 mg/L was applied. Glyoxal was
0
2
4
6
8
10
12
14
16
0 1 2 3 4 5 6 7Incr
ease
d A
nal
yte
Co
nce
ntr
atio
n (
µg/
L)
Ferrate Dose (mg/L)
Formaldehye
Glyoxal
Propanal
0
5
10
15
20
25
30
35
0 0.5 1 1.5 2 2.5 3 3.5 4 4.5
An
alyt
e C
on
cen
trat
ion
(µ
g/L)
Ferrate Dose (mg/L)
Formaldehyde Glyoxal
Figure 15. Aldehyde increases from Atkins Reservoir water buffered
to a pH of 7.5 and treated with ferrate.
Figure 16. Aldehyde concentrations from Atkins Reservoir water
fortified with sodium bromide and treated with ferrate (pH 7.5).

26
not seen until the higher ferrate dose of 4 mg/L was used, at which it was found at a concentration
of 7 µg/L.
27
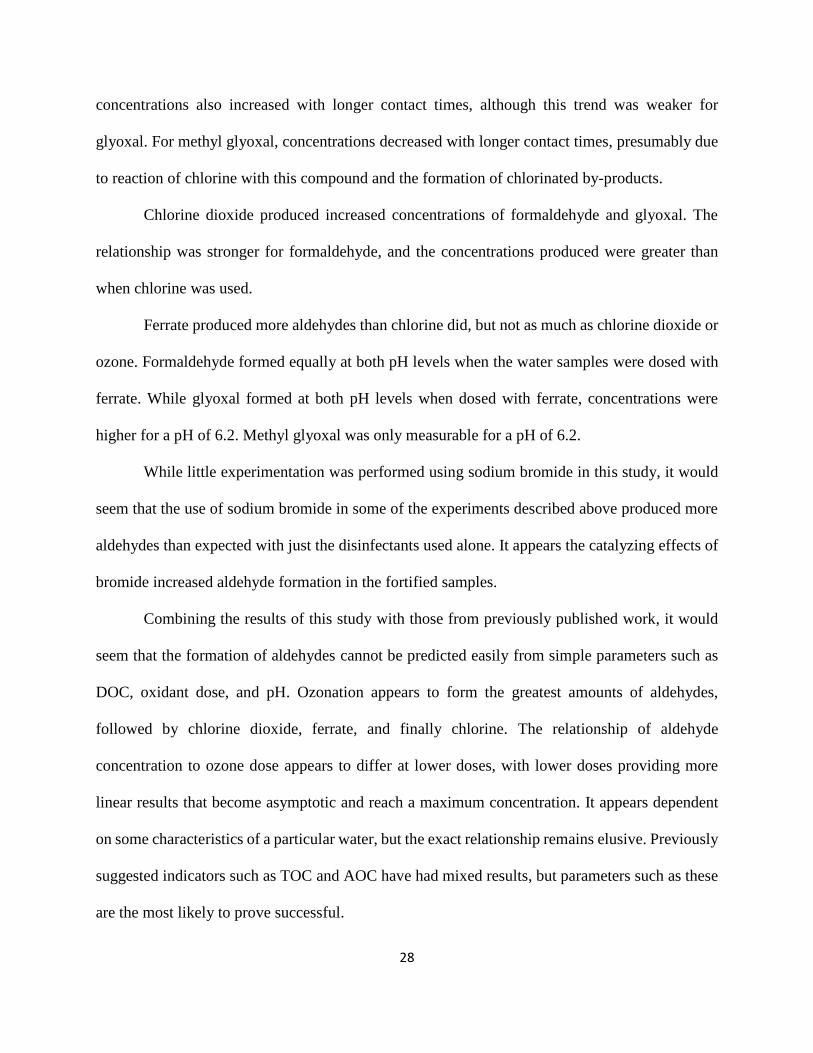
4. CONCLUSION
This research was performed to better characterize the consequences of several different
disinfectants on the formation of aldehydes in a natural water. As aldehydes are a potential health
concern and are still under investigation, it is important to understand what situations may produce
higher concentrations of aldehydes. Figure 17 shows a summary graph of average aldehyde
formation from this study.
From the results of the experiments performed, a few general observations can be made.
When treated with ozone alone, concentrations of formaldehyde, glyoxal, and methyl glyoxal
increased with ozone dose, and the increases were greater at lower doses of ozone. At the highest
ozone dose tested, formaldehyde and glyoxal concentrations decreased. This is likely due to
diminished aldehyde formation and higher rates of aldehyde destruction (e.g. oxidation).
For formaldehyde, glyoxal, and methyl glyoxal, concentrations increased with dose at
lower chlorine doses but decreased at higher doses. For both formaldehyde and glyoxal,
0
2
4
6
8
10
12
14
16
18
20
Ozone Chlorine(no
ozone)
Chlorine(2 mg/Lozone)
Chlorine(4 mg/Lozone)
Ferrate(pH 6.2)
Ferrate(pH 7.5)
Ozone(NaBr)
Ferrate7.5
(NaBr)
ChlorineDioxide(NaBr)
Ald
ehyd
e Yi
eld
(μg
anal
yte/
mg
dis
infe
ctan
t) Formaldehyde
Methyl Glyoxal
Glyoxal
Figure 17. Average aldehyde yields of different aldehydes using
different treatment scenarios. Formations from chlorine are averaged
from all contact times. Outliers are excluded.
28
concentrations also increased with longer contact times, although this trend was weaker for
glyoxal. For methyl glyoxal, concentrations decreased with longer contact times, presumably due
to reaction of chlorine with this compound and the formation of chlorinated by-products.
Chlorine dioxide produced increased concentrations of formaldehyde and glyoxal. The
relationship was stronger for formaldehyde, and the concentrations produced were greater than
when chlorine was used.
Ferrate produced more aldehydes than chlorine did, but not as much as chlorine dioxide or
ozone. Formaldehyde formed equally at both pH levels when the water samples were dosed with
ferrate. While glyoxal formed at both pH levels when dosed with ferrate, concentrations were
higher for a pH of 6.2. Methyl glyoxal was only measurable for a pH of 6.2.
While little experimentation was performed using sodium bromide in this study, it would
seem that the use of sodium bromide in some of the experiments described above produced more
aldehydes than expected with just the disinfectants used alone. It appears the catalyzing effects of
bromide increased aldehyde formation in the fortified samples.
Combining the results of this study with those from previously published work, it would
seem that the formation of aldehydes cannot be predicted easily from simple parameters such as
DOC, oxidant dose, and pH. Ozonation appears to form the greatest amounts of aldehydes,
followed by chlorine dioxide, ferrate, and finally chlorine. The relationship of aldehyde
concentration to ozone dose appears to differ at lower doses, with lower doses providing more
linear results that become asymptotic and reach a maximum concentration. It appears dependent
on some characteristics of a particular water, but the exact relationship remains elusive. Previously
suggested indicators such as TOC and AOC have had mixed results, but parameters such as these
are the most likely to prove successful.
29
5. REFERENCES
American Public Health Association, American Water Works Association, Water Environment
Federation (2005). Standard Methods for the Examination of Water and Wastewater.
Can, Z. S., & Gurol, M. (2003). Formaldehyde Formation During Ozonation of Drinking Water.
Ozone: Science & Engineering, 25: 41-51.
Dabrowska, A., Swietlik, J., Nawrocki, J. (2002). Formation of aldehydes upon ClO2 disinfection.
Water Research 37: 1161-1169.
Dabrowska, A., Hordern, B. K., Nawrocki, J. (2005). Aldehydes Formation During Water
Disinfection By Ozonation and Chlorination Process. Global NEST Journal 7.1: 61-71.
Glaze, W. H., Koga, M., Cancilla, D., Wang, K., McGuire, M. J., Liang, S., Davis, M. K., Tate, C.
H., Aieta, E. M. (1989). Evaluation of Ozonation By-products From Two California
Surface Waters. American Water Works Association 81.8: 66-73.
Jiang, J. and Lloyd, B. (2002). Progress in the development and use of ferrate(VI) salt as an
oxidant and coagulant for water and wastewater treatment. Water Research 36: 1397-1408.
McGuire, M. J., McLain, J. L., Obolensky, A. (2002). Information Collection Rule Data Analysis.
AWWA Research Foundation and American Water Works Association.
Nawrocki, J. and Kalkowska, I. (1996). Formation and Determination of Aldehydes—Ozonation
By-products. Chemical Analysis 41.3: 447-454.
Papageorgiou, A., Voutsa, D., Papadakis, N. (2014). Occurrence and fate of ozonation by-products
at a full-scale drinking water treatment plant. Science of the Total Environment 481: 392-
400.
Ramseier, M. K., Peter, A., Traber, J., von Gunten, U. (2010). Formation of assimilable organic
carbon during oxidation of natural waters with ozone, chlorine dioxide, chlorine,
permanganate, and ferrate. Water Research 45: 2002-2010.
Schechter, D. S. and Singer, P. C. (1995). Formation of Aldehydes During Ozonation. Ozone:
Science & Engineering 17.1: 53-69.
Swietlik, J., Dabrowska, A., Raczyk-Stanislawiak, U., Nawrocki, J. (2003). Reactivity of natural
organic matter fractions with chlorine dioxide and ozone. Water Research 38: 547-558.
von Gunten, U. (2003). Ozonation of drinking water: Part II. Disinfection and by-product
formation in presence of bromide, iodide or chlorine. Water Research 37: 1469-1487.
Zhou, X. (1993). Formation and Removal of Aldehydes in Drinking Water Treatment Processes.
University of Massachusetts at Amherst.
30
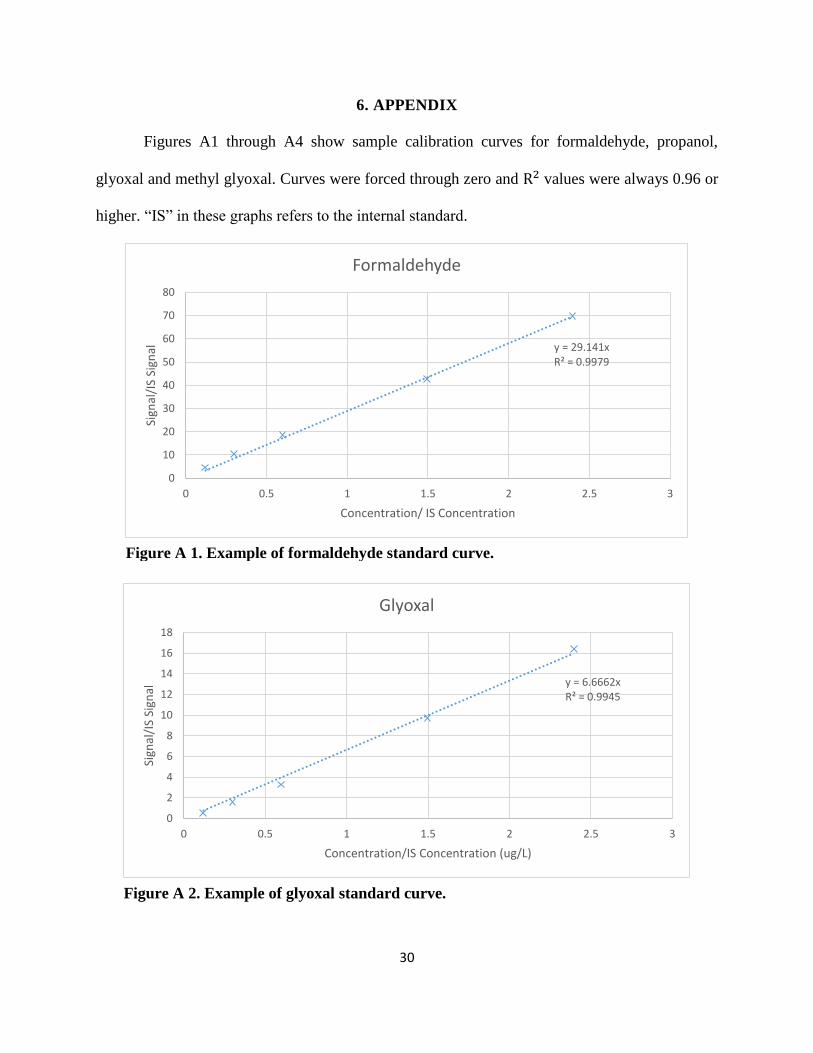
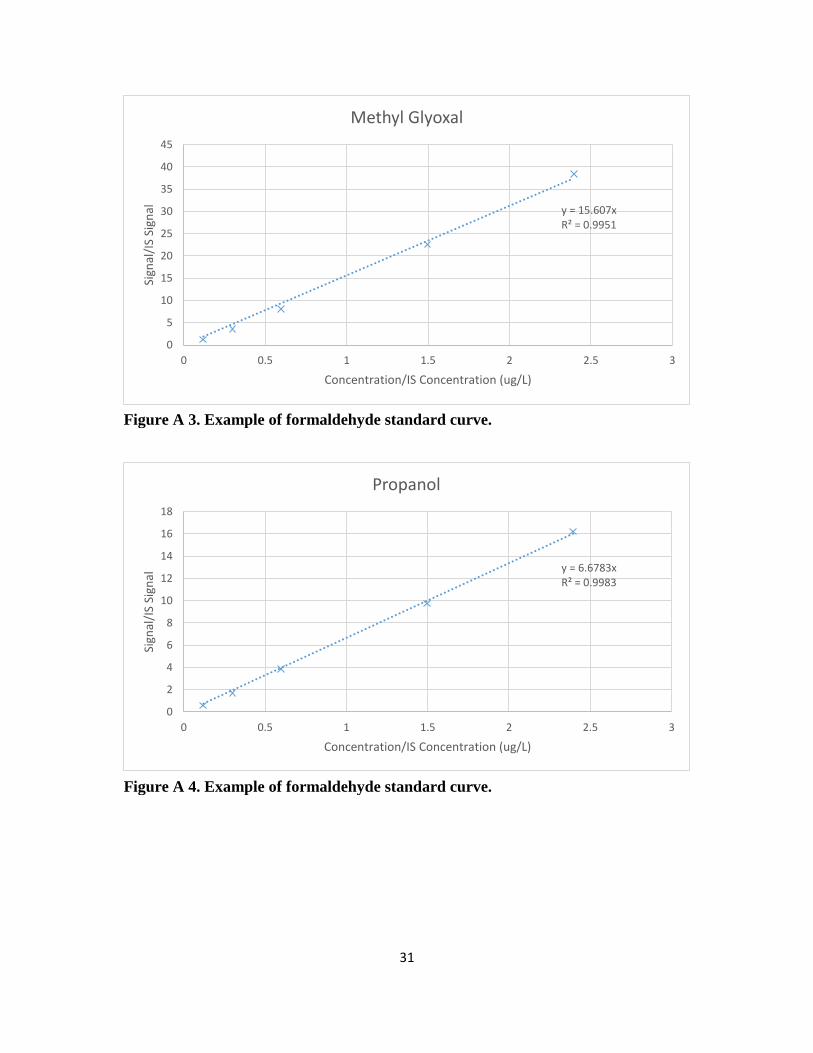
6. APPENDIX
Figures A1 through A4 show sample calibration curves for formaldehyde, propanol,
glyoxal and methyl glyoxal. Curves were forced through zero and R2 values were always 0.96 or
higher. “IS” in these graphs refers to the internal standard.
y = 29.141xR² = 0.9979
0
10
20
30
40
50
60
70
80
0 0.5 1 1.5 2 2.5 3
Sign
al/I
S Si
gnal
Concentration/ IS Concentration
Formaldehyde
y = 6.6662xR² = 0.9945
0
2
4
6
8
10
12
14
16
18
0 0.5 1 1.5 2 2.5 3
Sign
al/I
S Si
gnal
Concentration/IS Concentration (ug/L)
Glyoxal
Figure A 1. Example of formaldehyde standard curve.
Figure A 2. Example of glyoxal standard curve.
31
y = 15.607xR² = 0.9951
0
5
10
15
20
25
30
35
40
45
0 0.5 1 1.5 2 2.5 3
Sign
al/I
S Si
gnal
Concentration/IS Concentration (ug/L)
Methyl Glyoxal
y = 6.6783xR² = 0.9983
0
2
4
6
8
10
12
14
16
18
0 0.5 1 1.5 2 2.5 3
Sign
al/I
S Si
gnal
Concentration/IS Concentration (ug/L)
Propanol
Figure A 3. Example of formaldehyde standard curve.
Figure A 4. Example of formaldehyde standard curve.