Embed Size (px)
Citation preview

I L L I N 0 I SUNIVERSITY OF ILLINOIS AT URBANA-CHAMPAIGN
PRODUCTION NOTE
University of Illinois atUrbana-Champaign Library
Large-scale Digitization Project, 2007.

:01 'F
it AILLINOIS
NATURAL HISTORYSURVEY
Dcts of Exposure to Ammonia onve Life Stages of Aquatic Organisms
Contract Report 68-01-5832/A
nter for Aquatic Ecology
Keturah A. Reinboldand
Stephen M. Pescitelli
October 1982Reprinted January 1990
Natural History SuwyLibrary
Aquatic Ecology Technical ReportContract 68-01-5832/A


Illinois Natural History SurveyAquatic Ecology Technical ReportContract 68-01-5832/A
Effects of Exposure to Ammonia onSensitive Life Stages of Aquatic Organisms
by
Keturah A. Reinboldand
Stephen M. Pescitelli
Center for Aquatic EcologyIllinois Natural History Survey
607 E. Peabody Dr.Champaign, IL 61820
Final Report to U.S. Environmental Protection AgencyRegion V, Chicago, Illinois
Walter Redmon, Project Officer
October 1982Reprinted January 1990

ABSTRACT
Effects of ammonia on early life stages of four fish species (walleye, white sucker,channel catfish, and green sunfish) and throughout the life cycle of Daphnia magna wereevaluated. D. magna was less sensitive to ammonia than were the fish species tested. Thelowest concentration of un-ionized ammonia found to cause an adverse effect on daphnidswas 1.3 mg/L.
Fish eggs were not affected by exposure to un-ionized ammonia at 0.96 mg/L, thehighest concentration tested in this investigation. Concentrations as low as 0.05 and 0.06mg/L caused a delay in time to swim-up and a significant reduction in growth, respectively,in the fish species tested.
CONTENTS
Page
ACKNOWLEDGMENTS v
I. INTRODUCTION 1
II. CONCLUSIONS 1
III. RECOMMENDATIONS 1
IV. MATERIALS AND METHODS 2Test species 2Dilution water 3Exposure systems 3Analytical procedures 5Test procedures 5Data analysis 7
V. RESULTS 7Acute toxicity tests 7Sublethal effects tests 8
VI. DISCUSSION 13
REFERENCES 15
APPENDICESA. ANOVA table and results of Student-Newman-Keul's test
for white sucker lengths from early life stages test 17B. ANOVA table and results of Student-Newman-Keul's test
for channel catfish lengths from early life stages test 18
TABLES1. Source, age of fertilized eggs at exposure, incubation time and
temperature, and duration of exposure for species used in the testson the sublethal effect of ammonia to early life stages 2
2. Source and age after hatching of species used in the tests on theacute toxicity of ammonia to larval stages 3
3. Chemical characteristics of dilution water. 4
4. Acute toxicity (96-h LC50) of ammonia to swim-up fry of walleyeand green sunfish and to Daphnia magna. 8
5. Conditions during test on sublethal effects of ammonia on earlylife stages of white sucker. 9
6. Hatchability, larval survival, development, and growth data forS eggs and larvae of white sucker exposed to ammonia for 1 month. 9
7. Conditions during test on sublethal effects of ammonia on earlylife stages of channel catfish. 10
iii

Page
8. Hatchability, larval survival, development, and growth data foreggs and larvae of channel catfish exposed to ammonia for 1 month. 11
9. Conditions during test on sublethal effects of ammonia on earlylife stages of green sunfish. 11
10. Hatchability, larval survival, development, and growth data foreggs and larvae of green sunfish exposed to ammonia for 1 month. 12
11. Conditions during test on chronic effects of ammonia on Daphniamagna. 12
12. Survival of adults, growth, and reproduction of Daphnia magna in a21-d chronic ammonia toxicity test 13
13. No-observed-effects concentrations (NOEC) and lowest-observed-effects concentration (LOEC) for sublethal effects of un-ionizedammonia on white sucker, channel catfish, green sunfish, andDaphnia magna. 14
iv
ACKNOWLEDGMENTS
We are grateful to Dr. Richard Sparks, co-principal investigator, for providingvaluable counsel and advice throughout the investigation and for reviewing the final report.We are grateful to Mr. Dennis Leonard of Anaconda Company and to Mr. Ron Phillips ofBecker Industries, Inc., for providing the clinoptilolite mineral. During the study we werefortunate to have the laboratory assistance of Kolby Harris, Eugene Buksa, KarenScrogum, and Michael McMahon, who performed many of the tasks necessary inconducting the tests. Mr. William Cochran designed portions of the electronic controlsystem and Robert Ellis, Larry Gross, Chris Rohl, John Suloway, and Eric Hallermanhelped construct some of the test apparatus. Many of the water quality and metal analyseswere performed under the direction of Drs. Allison R. Brigham and Suzanne Wood,respectively. Dr. Michael Wiley and Ms. Diane Lynn assisted with the computerized dataanalysis. Ms. Jana Waite retyped, formatted, and edited the 1990 version of this report.
We are indebted to the following individuals for supplying fertilized fish eggs: Mr.Maurice Whitacre, Mr. Rodney Homer, and Mr. Rudy Stinauer, Illinois Department ofConservation; Dr. Ted Storck, Illinois Natural History Survey; Mr. Jim Copeland, WolfLake Hatchery, Mattawan, MI; Mr. Jack West, Regional Supervisor, U.S. Fish andWildlife Service, Minneapolis, MN; Mr. Jim Haney, Minnesota State Fish Hatchery, St.Paul, MN; Mr. Terry Jennings, Supervisor of Hatcheries, Rathbun Hatchery, Moravia, IA;and Mr. Bill Aydt, Centralia, IL. We thank Dr. Homer Buck and Mr. Richard Baur of theIllinois Natural History Survey, Mr. Rudy Stinauer, and Mr. Maurice Whitacre forassistance in locating sources of fish eggs.
Our sincere appreciation is extended to Mr. Walter Redmon, Project Officer,USEPA Region V, Chicago, IL, for his patience and constructive advice during the study.

I. INTRODUCTION
Ammonia is an important toxicant to fish and other aquatic organisms. It entersnatural waters from several sources, including sewage effluents, industrial wastes, andrunoff from agricultural feedlots.
Considerable data are available on ammonia toxicity as reviewed in the U.S.Environmental Protection Agency's "Quality criteria for water" (1977) and by Willinghamet al. (1979). There are, however, important aquatic species for which little or no data onammonia toxicity are available, and information on ammonia toxicity to sensitive life stagesexists for only a few species. Data on effects on sensitive life stages of additional speciesare needed to evaluate effects of ammonia discharges and to determine levels that allow pro-tection of aquatic life throughout their life cycles.
The objective of this study was to evaluate effects, particularly sublethal effects, ofammonia on early life stages of five aquatic species native to the Midwest for which eitherlittle information on ammonia toxicity was available or data on sublethal effects of ammoniaor effects on early life stages were lacking. Selected for this investigation were the micro-crustacean Daphnia magna and four fish species: walleye (Stizostedion vitreum), whitesucker (Catostomus commersoni), channel catfish (Ictalurus punctatus), and green sunfish(Lepomis cyanellus).
II. CONCLUSIONS
Daphnia magna was less sensitive to ammonia in both acute and sublethal effectstests than were the fish species tested. The lowest concentration of un-ionized ammoniafound to cause an adverse effect on the daphnids was 1.3 mg/L, while effects on fishoccurred at concentrations as low as 0.05 mg/L.
Fish eggs were not affected by exposure to un-ionized ammonia at 0.96 mg/L, thehighest concentration tested in this investigation. Concentrations as low as 0.05 and 0.06mg/L caused a delay in time to swim-up and a significant reduction in growth, respectively,in the fish species tested.
Walleye egg viability was poor, as was larval survival during the first 2 wk afterhatch, when some individuals did not begin to feed. Additional information is needed ontechniques for rearing this species before it can be used successfully in tests on early lifestages.
III. RECOMMENDATIONS
1. More investigation of laboratory rearing techniques for walleye is needed beforethis species can be used in tests on early life stages.
2. The test of the effects of ammonia on early life stages of green sunfish should berepeated since a concentration of ammonia causing an effect on growth could not beidentified in our tests.
3. Results that should be considered in setting water quality standards are the delay intime to swim-up at 0.05 mg/L un-ionized ammonia nitrogen and the significantreduction in growth at 0.06 mg/L in the fish early life stages.
4. We recommend that experiments be conducted on the sensitivity of juvenile fish toammonia at winter temperatures. In this investigation, experiments were run attypical spawning temperatures for the fish species tested. Some information in theliterature indicates that fishes may be more sensitive to ammonia at lower tempera-tures. Thus, it is possible that juveniles exposed to winter temperatures could be amore sensitive life stage than the larval stage.
IV. MATERIALS AND METHODS
TEST SPECIES
Toxic effects of ammonia were evaluated for four fish species and the micro-crustacean Daphnia magna. Acute lethal toxicity was determined for walleye (Stizostedionvitreum) and green sunfish (Lepomis cyanellus) larvae and for D. magna. Chronic toxiceffects were evaluated for D. magna and sublethal effects on early life stages of greensunfish, white sucker (Catostomus commersoni), and channel catfish (Ictalurus punctatus).
Fertilized eggs of walleye and white sucker were obtained from state fish hatcheriesand channel catfish eggs from a commercial fish farmer. Green sunfish eggs were arti-ficially fertilized in the laboratory. Sexually mature adults were collected from a populationmaintained in outdoor ponds at the Illinois Natural History Survey (INHS). No fish werehybrids. Sources of eggs and larval fish are listed in Tables 1 and 2.
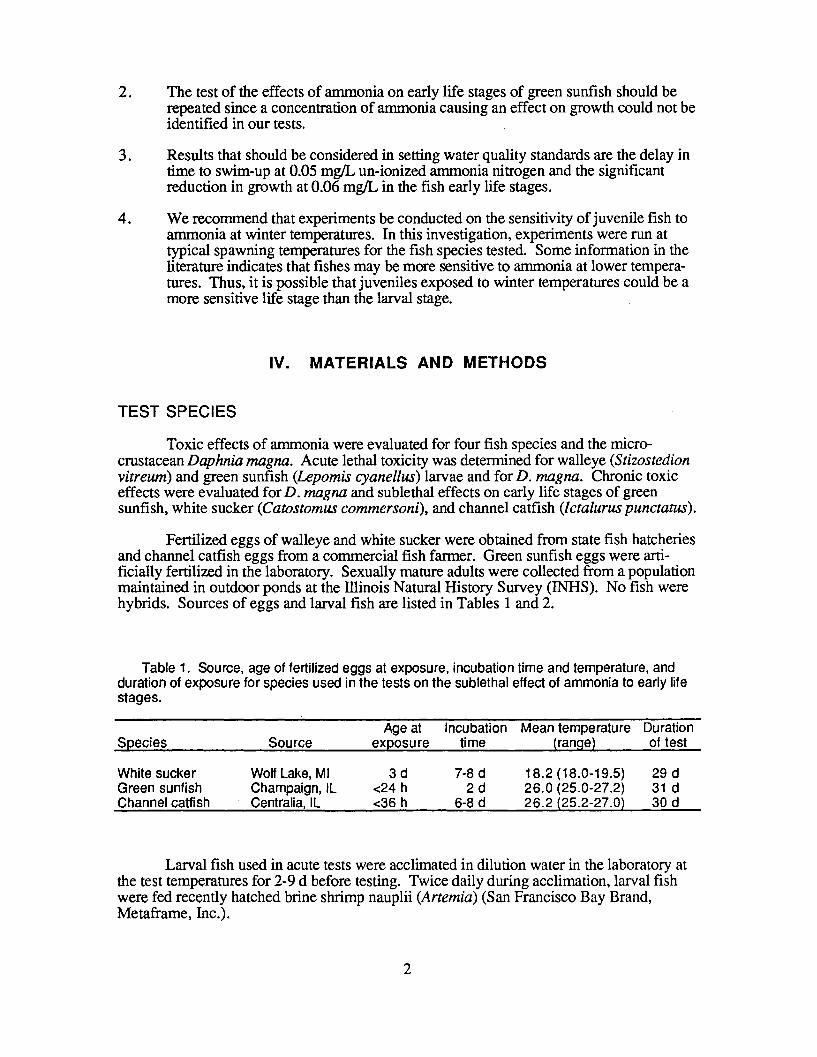
Table 1. Source, age of fertilized eggs at exposure, incubation time and temperature, andduration of exposure for species used in the tests on the sublethal effect of ammonia to early lifestages.
Age at Incubation Mean temperature DurationSpecies Source exposure time (range) of test
White sucker Wolf Lake, MI 3 d 7-8 d 18.2 (18.0-19.5) 29 dGreen sunfish Champaign, IL <24 h 2 d 26.0 (25.0-27.2) 31 dChannel catfish Centralia, IL <36 h 6-8 d 26.2 (25.2-27.0) 30 d
Larval fish used in acute tests were acclimated in dilution water in the laboratory atthe test temperatures for 2-9 d before testing. Twice daily during acclimation, larval fishwere fed recently hatched brine shrimp nauplii (Artemia) (San Francisco Bay Brand,Metaframe, Inc.).

Table 2. Source and age after hatching of species used inthe tests on the acute toxicity of ammonia to larval stages.
Species Source Age
Walleye Shelbyville, IL 4 dSt. Paul, MN 6 d
Green sunfish Champaign, IL 9 d
Daphnia magna used in toxicity tests came from cultures maintained in dilutionwater at 200 C for two generations prior to testing. Cultures were started with daphnidsfrom a culture continuously maintained for more than 5 years at INHS.
DILUTION WATER
Dilution water was taken from municipal wells 220-370 ft deep in the Mahomet-Teays aquifer near Champaign-Urbana. The water was passed through two in-line char-coal filters to remove chlorine, through clinoptilolite when necessary to remove backgroundammonia, and through an ultraviolet sterilizer to eliminate microorganisms and was thendelivered through PVC pipe to a stainless steel holding tank. Sodium thiosulfate wasmetered into the holding tank to remove any trace of chlorine that might remain aftercharcoal filtration. Characteristics of the dilution water are listed in Table 3.
EXPOSURE SYSTEMS
Dilution water was supplied from a 670-L stainless steel holding tank. Temperaturewas controlled by a thermistor in conjunction with two solenoid valves, which allowed hotor cold water to pass through a water jacket surrounding the tank. Water in the tank wasaerated.
For each test, a 0.5-L proportional diluter, modified from Mount & Brungs (1967)and Lemke et al. (1978), was used to deliver a logarithmic series of five ammonia concen-trations and a control through mixing chambers to two replicate test aquaria. Filling of thevalve bucket tripped a microswitch which, in conjunction with an electronic timer, con-trolled a solenoid valve in the water supply line to provide a flow of 0.25 L of water to eachtest chamber every 6 min. Three diluters were used. The holding tank and diluters werecleaned weekly to prevent bacterial build-up and to maintain a constant pH level.
Reagent-grade ammonium chloride was used as the toxicant. Stock solutions wereprepared in distilled water and delivered to diluters from a Mariotte bottle. The pH of thestock solution was adjusted to that of the dilution water with a sodium hydroxide solution.
Test chambers used for fish were constructed of glass and silicone sealant. Eachaquarium measured 30 x 20 x 15 cm, had an overflow outlet at a height of 22.5 cm, andcontained a volume of 10 L. Test aquaria were placed in a stratified random arrangementand were maintained in circulating water baths at the recommended temperature for thespecies being tested. Egg incubation cups, made from 4-oz, 5.5-cm OD round glass jars
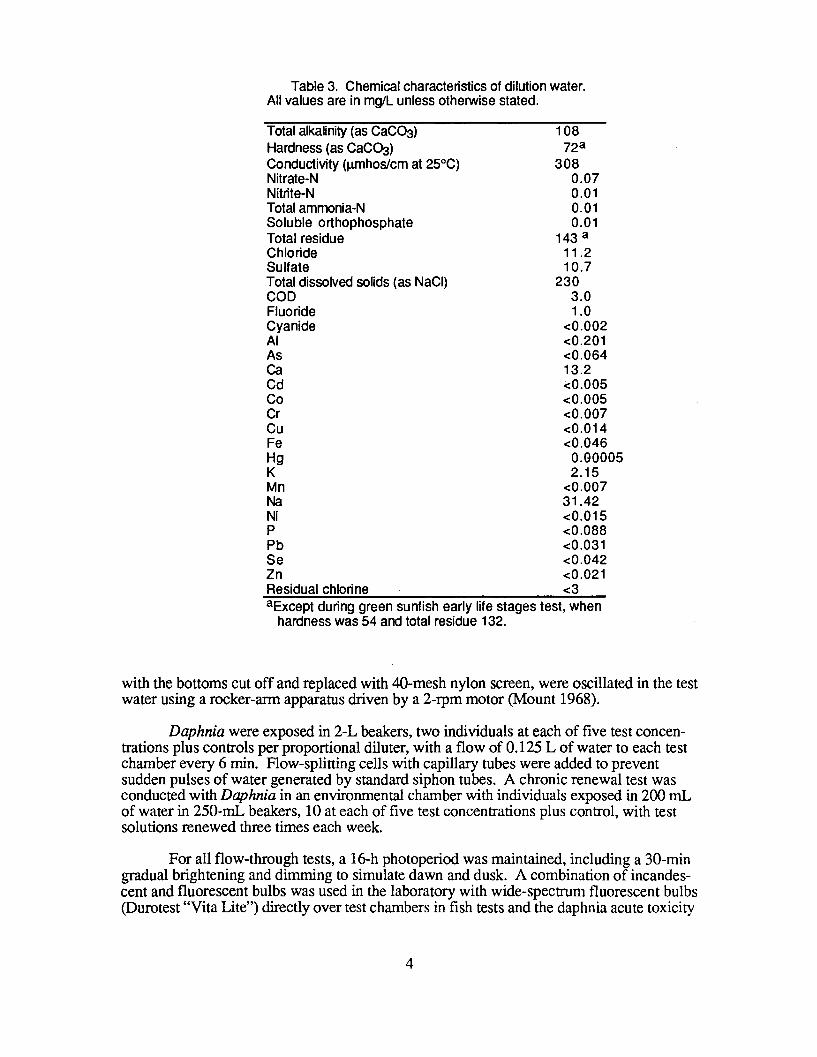
Table 3. Chemical characteristics of dilution water.All values are in mg/L unless otherwise stated.
Total alkalinity (as CaCO3) 108Hardness (as CaCO3 ) 72 a
Conductivity (pmhos/cm at 250C) 308Nitrate-N 0.07Nitrite-N 0.01Total ammonia-N 0.01Soluble orthophosphate 0.01Total residue 143 aChloride 11.2Sulfate 10.7Total dissolved solids (as NaCI) 230COD 3.0Fluoride 1.0Cyanide <0.002Al <0.201As <0.064Ca 13.2Cd <0.005Co <0.005Cr <0.007Cu <0.014Fe <0.046Hg 0.00005K 2.15Mn <0.007Na 31.42Ni <0.015P <0.088Pb <0.031Se <0.042Zn <0.021Residual chlorine <3aExcept during green sunfish early life stages test, when
hardness was 54 and total residue 132.
with the bottoms cut off and replaced with 40-mesh nylon screen, were oscillated in the testwater using a rocker-arm apparatus driven by a 2-rpm motor (Mount 1968).
Daphnia were exposed in 2-L beakers, two individuals at each of five test concen-trations plus controls per proportional diluter, with a flow of 0.125 L of water to each testchamber every 6 min. Flow-splitting cells with capillary tubes were added to preventsudden pulses of water generated by standard siphon tubes. A chronic renewal test wasconducted with Daphnia in an environmental chamber with individuals exposed in 200 mLof water in 250-mL beakers, 10 at each of five test concentrations plus control, with testsolutions renewed three times each week.
For all flow-through tests, a 16-h photoperiod was maintained, including a 30-mingradual brightening and dimming to simulate dawn and dusk. A combination of incandes-cent and fluorescent bulbs was used in the laboratory with wide-spectrum fluorescent bulbs(Durotest "Vita Lite") directly over test chambers in fish tests and the daphnia acute toxicity
test. The environmental chamber used in the daphnia chronic test was lighted by cool-white fluorescent bulbs on a 16-h photoperiod.
ANALYTICAL PROCEDURES
Water quality parameters were measured using standard methods (American PublicHealth Association et al. 1976, U.S. Environmental Protection Agency 1979). Watersamples were taken from the center of each test chamber.
Total ammonia nitrogen concentrations were determined by the phenate method(American Public Health Association et al. 1976) using a standard curve prepared by linearregression. Colorimetric measurements were made with a Coleman 124D double-beamspectrophotometer. Un-ionized ammonia nitrogen (NH3-N) concentrations were deter-mined from total ammonia nitrogen, pH, and temperature, using the tables of Thurston etal. (1979). The pH in each test chamber was determined at least daily with an Orion 701Adigital pH meter. Dissolved oxygen was measured with an oxygen-specific electrode cali-brated to titration accuracy (Altex 0260 oxygen analyzer by Beckman).
Hardness, nitrate nitrogen, nitrite nitrogen, and soluble orthophosphate were deter-mined using a Technicon Autoanalyzer (U.S. Environmental Protection Agency 1979).Other water quality parameters, such as alkalinity, conductivity, and COD, were deter-mined according to analytical procedures described in American Public Health Associationet al. (1976). Analyses of metals in the dilution water were performed by induction-coupled argon plasma spectrometry (American Society for Testing and Materials 1980).
TEST PROCEDURES
Acute Toxicity Tests
Methodology for these tests generally followed those in "Methods for acute toxicitytests with fish, macroinvertebrates and amphibians" (U.S. Environmental ProtectionAgency 1975). The diluter was operated with toxicant introduced into test chambers for atleast 24 h before test organisms were added to achieve equilibrium ammonia concentrationsin test chambers. Walleye tests were initiated by adding larval fish one at a time to each testchamber. Green sunfish and Daphnia were added one at a time to each of 12 beakerscontaining about 50 mL of dilution water and all organisms from each beaker were thentransferred simultaneously into the test chamber. Ages of fish used in acute tests are listedin Table 2. Daphnia were less than 24-h old at the initiation of the test.
Larval fish were fed newly hatched brine shrimp twice daily during the test. Daph-nids were fed twice daily by adding a sufficient volume of yeast food stock solution toyield 15 mg/L of solids in each test chamber. The food solution was prepared by adding14.3 g of active dry yeast and 41.8 g of sugar to 0.5 L of dilution water.
Mortality was recorded after 1, 3, 6, 12, and 24 h and at least daily thereafter to theend of the test. Death was determined by lack of a heart beat in fish larvae and byimmobility in daphnia.

Tests of Sublethal Effects
Fish. Methodology for these tests generally followed that proposed in "Recom-mended bioassay procedure for egg and fry stages of freshwater fish" prepared by theNational Water Quality Laboratory, Duluth, MN (U.S. Environmental Protection Agency1972a). In addition, we reviewed drafts of reports of ASTM Committee E-35 on Pesti-cides, Task Group on conducting toxicity tests with early life stages of fishes.
Egg exposures, except those of channel catfish, were initiated by adding no morethan 5 eggs at a time to a total of 100 to each of two egg cups per test chamber. Becausechannel catfish eggs are in a gelatinous matrix, individual eggs cannot be separated withoutrisk of damaging the chorion. These eggs, therefore, were separated from the mass ingroups of approximately 50 each. Four groups (two in each of two egg cups) were placedin each test chamber.
Mortality was recorded daily, and dead eggs were removed to prevent fungusgrowth. Eggs were determined to be dead when the contents began to turn opaque white.Fry mortality was determined by lack of a heart beat. Tme of hatch and hatching successfor each group were recorded. After hatching was completed, surviving white sucker orgreen sunfish fry were transferred from egg cups into each test chamber. Two weeks afterthe initiation of the green sunfish test, when fish had been lost from some test chambers,numbers in the remaining test chambers were reduced to 40 each to more nearly equalizethe numbers in all chambers. When hatching of channel catfish eggs was completed, 50fry (25 from each egg cup) were released into each test chamber. Numbers were reduced atthat time to prevent crowding and improve growth conditions for larger catfish larvae.
Beginning at the time of swim-up, fry were fed newly hatched brine shrimp twicedaily. The test aquaria were siphoned daily to remove fecal material and detritus, and twiceeach week the sides and bottoms of the chambers were gently brushed to remove bacterialand algal growths.
Specific information on incubation times and test durations are shown in Table 1.All tests were terminated after 29-31 d; surviving fry were individually measured andgroup weights were determined.
Daphnia magna. Test procedures followed "Recommended bioassay procedure forDaphnia magna chronic tests in a flowing system" (U.S. Environmental Protection Agency1972b) and the proposed standard practices for conducting D. magna renewal toxicity tests(Daphnia Task Group, ASTM Committee E-35).
In the chronic renewal test, Daphnia were exposed for 21 d in 250-mL beakers, 10at each concentration. Stock solutions were prepared at five concentrations in a logarithmicseries plus a control and the pH of each stock test solution was adjusted to that of thecontrol with a 10-M solution of sodium hydroxide. A food solution was prepared byadding 14.3 g of active dry yeast and 41.8 g of sugar to 0.5 L of dilution water. This solu-tion contained 30 mg/mL of solids. Sufficient volume of this food stock was added to eachtoxicant stock solution to yield 15 mg/L of solids.
To each of 10 beakers per concentration, 200 mL of stock solution were added.The beakers were separated into two sets: 7 reproduction beakers and 3 survival beakers.One Daphnia was added to each reproduction beaker and five individuals were added, oneat a time, to each survival beaker. Stock solutions were renewed three times per week.
Mortality and reproduction counts were made three times per week just prior to renewal ofthe toxicant solution. Young were counted and removed, and original test organisms weretransferred into new solutions with a glass pipet. At the end of the test, lengths of sur-viving first-generation Daphnia were measured to the nearest 0.01 mm.
DATA ANALYSIS
Acute Toxicity Tests
Median lethal concentration (LC50) values in the acute toxicity tests were deter-mined using the trimmed Spearman-Karber method (Hamilton et al. 1977). When it wasnecessary to adjust for mortality in the control, Abbott's formula was used (AmericanPublic Health Association et al. 1976).
Sublethal Effects Tests
One-way analysis of variance (ANOVA) was primarily used in evaluating signifi-cance of differences between treatments. Data on group weights, time to swim-up,mortality, and daphnid reproduction and lengths were subjected to ANOVA, and whentreatment effects were indicated, were followed by Student-Newman-Keul's or Duncan'sNew Multiple Range test to determine which treatment effects were significantly differentfrom the controls. For fish length data, the analysis of variance program from thecomputer package Statistical Package for the Social Sciences (Hine et al. 1975) was used,followed by Student-Newman-Keul's multiple range test.
For comparison, swim-up data were also analyzed by 2 x 2 contingency tables.Results were comparable to those from ANOVA. Data on daphnid survival in the chronictest were also analyzed by 2 x 2 contingency tables, using the x2 test for goodness of fit.
The maximum concentration causing no effects is defined by Maki (1979) as lyingsomewhere between the lowest-observed-effect concentration (LOEC) and the highest-observed no-effect concentration (NOEC). NOEC and LOEC values from chronic tests areused to define the range of the estimated maximum no-effect concentration.
V. RESULTS
ACUTE TOXICITY TESTS
Because no data were found in the literature on acute toxicity of ammonia to walleyeor green sunfish fry, 96-h acute toxicity tests were conducted with larval walleye fromMinnesota and Illinois and green sunfish from Illinois at 6,4, and 9 d after hatch, respec-tively (Table 2). The conditions during the tests and results are presented in Table 4.
For walleye, the 96-h LC50 (NH3-N) values were 0.30 and 0.70 mg/L for fishfrom Illinois and Minnesota, respectively. The 96-h LC50 for green sunfish was 0.89mg/L, and the 48-h and 24-h LC50 values for Daphnia were 4.07 and 4.72 mg/L NH3-N,respectively.

Table 4. Acute toxicity (96-h LC50, 95% confidence interval) of ammonia to swim-up fry ofwalleye and green sunfish and to Daphnia magna. Temperature is in OC, dissolved oxygen as %saturation, and un-ionized ammonia and total ammonia in mg/L.
96-h LC50 (95% Cl)Temperature pH Dissolved oxygen Un-ionized ammonia Total ammoniaMean (range) range Mean(range) Mean (range) Mean (range)
Walleyela 18.3 (17.0-19.6) 8.17-8.61 100 0.30 (0.27-0.33) 3.89 (3.22-4.68)IIb 18.2 (17.8-18.7) 7.84-8.31 97 (93-100) 0.70 (0.68-0.72) 13.47(13.12-13.84)
Green sunfish26.2 (24.4-27.2) 8.46-8.09 88 (78-91) 0.89 (0.81-0.98) 8.93 (8.00-9.98)
Daphnia magna19.7 (19.4-20.2) 8.58-8.11 95 (90-97) 4.07 (4.07-4.07) 61.3 (61.3-61.3)
aWalleye obtained from IllinoisbWalleye obtained from Minnesota
SUBLETHAL EFFECTS TESTS
Walleye
Two attempts were made to complete a test on early life stages with walleye fromLake Shelbyville, Illinois. Survival at 2 wk after beginning the test was 20% or less in alltest chambers, including controls. Others using walleye eggs obtained from Lake Shelby-ville during the same month found similar mortality. The Illinois Department of Conserva-tion had 80% mortality in eggs held to hatch (personal communication, M. Whitacre), andINHS personnel rearing walleye from eggs from the same source had mortalities similar toours in both embryo and larval stages (personal communication, K. Clement). Others havealso reported poor survival (<30%) of walleye in tests (Sauter et al. 1976).
Additional walleye eggs were obtained from the Minnesota State Fish Hatchery inSt. Paul, but these eggs hatched in flight to our laboratory. The larval fish were subse-quently used in an acute toxicity test, as described earlier.
White Sucker
Conditions during the test are presented in Table 5 and results are shown in Table6. There were no significant effects on hatching success or larval survival from exposureto NH3-N concentrations as high as 0.197 mg/L. Time to swim-up was delayed at concen-trations of 0.058-0.197 mg/L NH3-N. Total lengths of sucker larvae exposed to 0.058-0.197 mg/L NH3-N were significantly less than those of control larvae and of larvaeexposed to lower concentrations of ammonia.

Table 5. Conditions during test on sublethal effects of ammonia on early life stages of whitesucker. Values for temperature and pH are means of all measurements in all test chambers.Temperature is °C, dissolved oxygen is % saturation, and total and un-ionized ammonia is mg/L.
Temperaturet pH Dissolved oxygen Total ammonia. Un-ionized ammoniaMean (range) range Mean(range) Mean (range) Mean (range)
A 18.5 (17.2-20.2) 8.02-8.64 75 (87-58) controlB 18.6 (17.2-20.1) 8.03-8.64 73 (85-55) control
A 18.7 (17.2-20.1) 8.04-8.56 71 (89-53) 0.39 (0.31-0.48) 0.023(0.013-0.047)B 18.8 (17.5-20.3) 8.07-8.65 74 (87-62) 0.29 (0.23-0.34) 0.023 (0.012-0.045)
A 18.8 (17.3-20.3) 8.04-8.63 73 (87-52) 0.53 (0.38-0.68) 0.040(0.024-0.077)B 18.5 (17.1-19.9) 8.04-8.63 70 (87-53) 0.50 (0.40-0.64) 0.034(0.020-0.064)
A 18.5 (17.2-19.9) 8.05-8.62 70 (81-56) 0.97 (0.69-1.18) 0.068(0.035-0.119)B 18.9 (17.2-20.5) 8.03-8.62 70 (83-55) 0.85 (0.64-1.32) 0.058(0.033-0.123)
A 18.7 (17.4-20.1) 8.01-8.60 69 (84-57) 1.50 (1.10-1.89) 0.101 (0.062-0.170)B 18.5 (16.9-19.8) 8.07-8.63 68 (86-52) 1.48 (1.05-1.95) 0.101 (0.068-0.180)
A 18.6 (17.2-20.1) 8.06-8.58 70 (86-59) 2.88 (2.16-3.55) 0.176(0.121-0.291)B 18.6 (17.2-20.1) 8.02-8.60 74 (86-57) 2.88 (2.25-3.65) 0.197(0.122-0.315)
Table 6. Hatchability, larval survival, development, and growth data for eggs'and larvae ofwhite sucker exposed to ammonia for 1 month.
Mean un-ionized % swimming up Mean total Meanammonia (mg/L) % hatch % survival 72 h after hatch length (mm) weight (mg)
A Control 96.5 65.4 65.0 15.6 8.7B Control 90.5 68.5 77.5 14.8 10.7
A 0.023 93.0 60.8 82.5 14.5 10.2B 0.023 93.5 62.0 76.9 15.3 12.5
A 0.040 92.5 73.0 67.4 15.3 11.2B 0.034 85.5 73.7 72.7 14.6 9.4
A 0.068 95.5 65.4 5 5 .6 b 14.1 a 14.7B 0.058 82.0 67.7 6 4 .9b 14.7 a 10.4
A 0.101 94.0 61.7 45.0 b 14.3 a 10.8B 0.101 94.0 68.1 5 5 .0b 14.6 a 11.0
A 0.176 91.5 56.3 4 0 .9 a,b 14.0 a 10.5B 0.197 90.5 64.1 15 .8 a,b 14.4 a 10.7aValues significantly lower than controls (Student-Newman-Keul's test, P = 0.05).bValues significantly lower than controls (2 x 2 contingency table using number swimming up
rather than percentage, P= 0.05).
9

Channel Catfish
Test conditions and results are listed in Tables 7 and 8, respectively. No significanteffect on hatching success or larval survival was observed during continuous exposure toun-ionized ammonia concentrations as high as 0.480 mg/L. Some mortality was apparentlycaused by a fungus infection. As observed for white suckers, time to swim-up wasdelayed at all test concentrations relative to the controls. Continuous exposure to' 0.323-0.480 mg/L NH3-N significantly reduced total lengths and weights of the larval oatfishcompared with those of controls and of fish exposed to lower treatment concentrations.
Green Sunfish
Test conditions and results for green sunfish are listed in Tables 9 and 10, respec-tively. Continuous exposure to NH 3-N concentrations as high as 0.96 mg/L hadmno signi-ficant effect on hatching success but larval mortality increased at 0.66 and 0.96 mg/L.Time to swim-up was delayed at 0.96 mg/L, and no fry survived continuous exposure tothat concentration for longer than 10 d.
In addition to increased mortality at the two highest test concentrations, some frywere lost from additional chambers. The small size of the fry necessitated the of a fine-meshed screen on overflow tubes in test chambers. Although screens were cleaned 2-3times/d, they clogged easily, and overnight overflows caused loss of fish from some cham-bers. As a result of mortality and the overflows, numbers of individuals per chamber wereno longer equal. Thus, 2 wk after initiation of the test, numbers of fry in remainingchambers were reduced to approximately 40 each. By the end of the test, due to additionalmortality, there were still fewer individuals in both replicates (11 and 21) at the 0.66 mg/Ltest concentration and in replicate A (26) at 0.23 mg/L compared to other test chambers (36-
Table 7. Conditions during test on sublethal effects of ammonia on early life stages of chan-nel catfish. Values for temperature and pH are means of all measurements in all test chambers.Temperature is OC, dissolved oxygen is % saturation, and total and un-ionized ammonia is mg/L.
Temperature pH Dissolved oxygen Total ammonia Un-ionized ammoniaMean (range) range Mean(range) Mean (range) Mean (range)
A 25.9 (24.8-28.3) 7.75-8.37 76 (96-64) controlB 26.2 (24.8-28.2) 7.94-8.37 73 (94-62) control
A 25.2 (24.8-28.2) 7.57-8.27 73 (91-62) 1.05 (0.45-1.42) 0.059(0.028-0.095)B 25.5 (24.8-28.3) 7.73-8.23 74 (93-60) 0.90 (0.58-1.16) 0.050(0.028-0.074)
A 26.2 (24.8-28.1) 7.65-8.13 75 (94-64) 1.92 (1.47-2.44) 0.116(0.049-0.192)B 26.1 (24.8-28.0) 7.65-8.17 74 (91-62) 2.00 (1.36-2.68) 0.115(0.043-0.206)
A 26.2 (24.9-28.3) 7.57-8.06 73 (90-60) 2.91 (2.48-4.32) 0.169(0.125-0.270)B 26.5 (24.9-28.4) 7.53-8.04 70 (91-56) 2.88 (2.36-4.38) 0.157(0.108-0.248)
A 26.2 (25.0-28.1) 7.68-8.15 75 (91-62) 5.16 (4.70-6.70) 0.323(0.219-0.450)B 26.0 (24.9-28.3) 7.66-8.13 74 (93-63) 5.28 (5.10-6.90) 0.338(0.209-0.510)
A 25.6 (24.9-28.2) 7.56-8.01 72 (94-60) 10.29 (8.64-11.70) 0.453(0.324-0.604)B 26.1 (24.9-28.0) 7.57-8.05 73 (94-60) 10.91(10.44-11.88) 0.480(0.351-0.636)
10

Table 8. Hatchability, larval survival, development, and growth data for eggs and larvae ofchannel catfish exposed to ammonia for 1 month.
Mean un-ionized % swimming up Mean total Meanammonia (mg/L) % hatch % survival 96 h 105 h length (mm) weight (mg)
A Control 73.0 a 86 .0a 100 100 21.9 62.0
B Control 92.5 100.0 100 100 21.6 60.0
A 0.059 94.5 94.0 6 4b,c, d 84 21.6 61.0
B 0.050 95.5 100.0 6 2b,c, d
8 0d 21.4 60.0
A 0.116 92.0 99.5 5 2b,c, d
7 0 b,c,d 21.0 54.0B 0.115 97.0 98.5 4 6
b,c, d 4 8 b,c,d 21.7 60.0
A 0.169 7 8 .0a 74.0 a 3 8
b,c, d 4 0
b,c, d 21.4 61.0B 0.157 8 0 .5a 96.0 a
68b,c, d
6 8 b,c,d 21.3 58.0
A 0.323 94.5 97.0 4 0b,c, d 5 4
b,c, d 2 0 .4 b 48.0 c
B 0.338 98.5 99.0 4 0b,c, d 4 0
b,c, d 2 1 .0b 54.0 c
A 0.453 95.0 99.0 2b ,c, d
8b,c, d
2 0 .3 b 49.0 c
B 0.480 93.0 99.0 1 0b,c,d 2 0b,c,d 2 0 .9 b 53.0 c
aFungus present on egg masses.bValues significantly lower than controls (Student-Newman-Keul's test, P = 0.05).cValues significantly lower than controls (Duncan's new multiple range test, P = 0.05).dValues significantly lower than controls (2 x 2 contingency table using number-swimming up
rather than percentage, P-= 0.05).
Table 9. Conditions during test on sublethal effects of ammonia on early life stages of greensunfish. Values for temperature and pH are means of all measurements in all test chambers.Temperature is OC, dissolved oxygen is % saturation, and total and un-ionized ammonia is mg/L.
Temperature. pH Dissolved oxygen Total ammonia Un-ionized ammoniaMean (range) range Mean(range) Mean (range) Mean (range)
A 25.2 (23.8-27.2) 7.92-8.54 87(100-78) controlB 25.4 (23.6-27.0) 7.99-8.56 87 (98-78) control
A 25.4 (23.8-27.3) 7.94-8.43 87 (97-75) 1.3 (1.2-1.4) 0.13 (0.10-0.15)B 25.4 (23.9-27.0) 7.94-8.48 88 (99-78) 1.3 (1.1-1.5) 0.13 (0.10-0.14)
A 25.4 (23.9-26.9) 7.86-8.47 87(100-77) 2.0 (1.8-2.3) 0.23 (0.20-0.25)B 25.6 (24.1-27.3) 7.89-8.44 86(100-67) 2.2 (2.0-2.7) 0.24 (0.21-0.26)
A 25.5 (24.0-27.1) 7.88-8.40 87(100-77) 3.4 (3.1-3.9) 0.33 (0.27-0.37)B 25.3 (23.4-27.1) 7.92-8.45 87 (98-69) 3.4 (3.0-3.9) 0.33 (0.26-0.37)
A 25.3 (23.8-26.9) 7.89-8.42 88(100-70) 6.3 (5.6-7.1) 0.66 (0.61-0.67)B 25.4 (23.3-27.0) 7.89-8.45 88(100-72) 6.3 (5.6-7.4) 0.66 (0.65-0.67)
A 25.6 (24.0-27.3) 7.82-8.39 87(100-70) 9.7(9.2-10.0) 0.96 (0.91-1.0)B 25.4 (23.9-27.2) 7.82-8.40 85(100-65) 9.4 (9.0-9.9) 0.95 (0.90-0.99)
11

Table 10. Hatchability, larval survival, development, and growth data for eggs and larvae ofgreen sunfish exposed to ammonia for 1 month.
Mean un-ionized % swimming up Mean total Meanammonia (mp/L) % hatch % survival 96 h after hatch length (mm) weight (mg)
A Control 99 73.0 99 10.9 12.2B Control 99 73.5 100 11.0 18.8
A 0.13 99 78.0 98 10.6 10.8B 0.13 99 87.2 97 11.2 13.1
A 0.23 96 96.0 99 12.2 b 15.0bB 0.24 98 78.0 98 11.1 11.5
A 0.33 99 77.0 90 10.7 10.9B 0.33 96 84.2 92 10.9 11.2
A 0.66 96 57.5 a 96 1 2 .9 b 19.4bB 0.66 96 44.0 a 86 11.4 b
1 3 .6 b
A 0.96 98 0.0 a 8 7a
B 0.95 99 0.0 a 77 a
aValues significantly lower than controls (Student-Newman-Keul's test, P = 0.05).bFewer individuals than in other test chambers.
41). In addition to differences in numbers, the small size of the fry made it difficult todistinguish growth effects. For these reasons, no significant effect of ammonia on growthcould be identified.
Daphnia magna
A 21-d chronic renewal test was conducted with Daphnia magna. Conditionsduring the test are shown in Table 11. Results of the test as mean values of replicates arepresented in Table 12. Survival was slightly less at the two highest test concentrations(73%) than at the other treatments (86-100%), but were not significantly different from thecontrol (2 x 2 contingency table analysis). Daphnid growth, as shown by length, was sig-nificantly reduced at the highest test concentration of 1.3 mg/L NH 3-N. Mean lengths in
Table 11. Conditions during the test on the chronic effects of ammonia on Daphniamagna. Temperature is in OC and total and un-ionized ammonia in mg/L.
Temperature pH Total ammonia Un-ionized ammoniaMean (range) range Mean(range) Mean (range)
20.3 (20.0-20.8) 7.75-8.16 Control20.2 (17.8-20.7) 7.74-8.16 3.99 (2.92-4.58) 0.16 (0.08-0.23)20.1 (19.8-20.5) 7.70-8.14 6.85 (5.06-7.44) 0.28 (0.14-0.42)20.1 (19.9-20.6) 7.72-8.12 11.75 (8.30-13.08) 0.47 (0.23-0.73)20.1 (19.7-20.4) 7.70-8.16 19.66(14.94-23.36) 0.79 (0.38-1.25)20.1 (19.7-20.5) 7.63-8.16 33.07(25.08-39.06) 1.30 (0.53-2.06)
12

Table 12. Survival of adults, growth, and reproduction of Daphnia magna in a 21-dchronic ammonia toxicity test. Un-ionized ammonia concentrations were measured inmg/L.
Adult Mean length Mean numberMeasured survival of surviving Day when young of young/
un-ionized ammonia (%) adults (mm) first produced adult
Control 86 3.52 7 24.60.16 91 3.57 7 21.70.28 86 3.61 7 22.70.47 100 3.73 7 29.00.79 73 3.49 7 20.81.30 73 3.02 a 9 6.4 a
aValues significantly lower than controls (Student-Newman-Keul's test, P = 0.05).
the control and in the high concentration were 3.52 and 3.02 mm, respectively. Meanlengths at the three lowest treatment concentrations were slightly higher than in the controlbut were not significantly different.
Reproduction was also affected. The first young were produced on day 7 of thetest in all treatments except the highest concentration, where no young were found until day9. The average number of young/adult was significantly lower at that concentration-6.4versus 24.6 in the control. Reproduction in the control versus other treatment concen-rations was not significantly different.
VI. DISCUSSION
The results of this study indicate that Daphnia magna is less sensitive to ammoniathan are the fish species tested. The 48-h and 24-h LC50 values of 4.07 and 4.72 mg/LNH3-N for D. magna are in good agreement with the 24-h LC50 of 4.8 mg/L NH3 -N forDaphnia sp. reported by Tabata (1962) and the 64-h apparent threshold LC50 for D.magna, calculated from Anderson (1948), of 2-3 mg/L NH3-N at 25°C and a pH range of8.2-8.4.
Median lethal concentrations of NH3-N for larval green sunfish and walleye arewithin the range of toxicity values reported in the literature for other fish species.Roseboom & Richey (1977) reported a 96-h LC50 of 0.4 mg/L NH3-N for small bluegillwith an average weight of 0.072 g at 220 C. For bluegill averaging 0.217-0.646 g at 22-28°C, 96-h LC50 values ranged from 0.49 to 1.3 mg/L. In the pH range similar to that inour tests, Thurston et al. (1981) reported 96-h LC50 values for rainbow trout (9.5 g) of0.51 and 0.66 and for fathead minnows (1.9 g) of 0.65-1.4 mg/L NH3-N.
The 96-h LC50 for green sunfish fry of 0.81-0.98 mg/L NH3-N in this test fallswithin the range of values reported above for other species. Because the green sunfishtested were most comparable in size to the smallest bluegill tested by Roseboom & Richey(1977) and could be more sensitive than larger individuals, green sunfish may be slightlymore tolerant of ammonia than are bluegill. On the other hand, Jude (1973) reported an
13
LC50, presumably at 96 h, of 33 ppm of ammonia as N (approximately 1 mg/L NH3-N)for green sunfish with an average weight of 8.39 g. This median lethal concentration isonly slightly higher than that for the larval green sunfish in our test.
Toxicity values for walleye larvae were lower than for green sunfish, but the 96-hLC50 value of 0.7 mg/L for walleye from Minnesota is within the ranges cited above forbluegill and fathead minnow. Larval walleye from Lake Shelbyville, Illinois, were morethan twice as sensitive as those from Minnesota. The apparently greater sensitivity ofIllinois walleye to ammonia may be indicative of a more sensitive or less healthy populationthan those from Minnesota.
There could be several reasons why our early life stages test on walleye was notsuccessful. Generally poor survival rate of Illinois walleye reared in the laboratory couldhave indicated a problem with the population from Lake Shelbyville. On the other hand,there are problems in working with this species. In their review of biological data on wall-eye, Colby et al. (1979) pointed out that egg viability in walleye may vary widely. Valuesfrom 100 to 3.4% have been reported. Others have reported problems in rearing walleye inthe laboratory, particularly in feeding them. Sauter et al. (1976) reported poor success infeeding walleye fry in toxicity tests on egg and fry stages. Cuff (1977) found that not allwalleye in culture learned to feed on brine shrimp, and thus some starved. Cannibalismwas also a problem. Such problems need to be addressed to determine whether this speciescan be successfully used in laboratory tests.
Ammonia concentrations used in fish early life stages tests in this study producedno significant differences in mortalities of fertilized eggs, incubation times to hatching, orpercent hatching success for white sucker, channel catfish, or green sunfish. Similarresults were reported by Burkhalter & Kaya (1977) for rainbow trout.
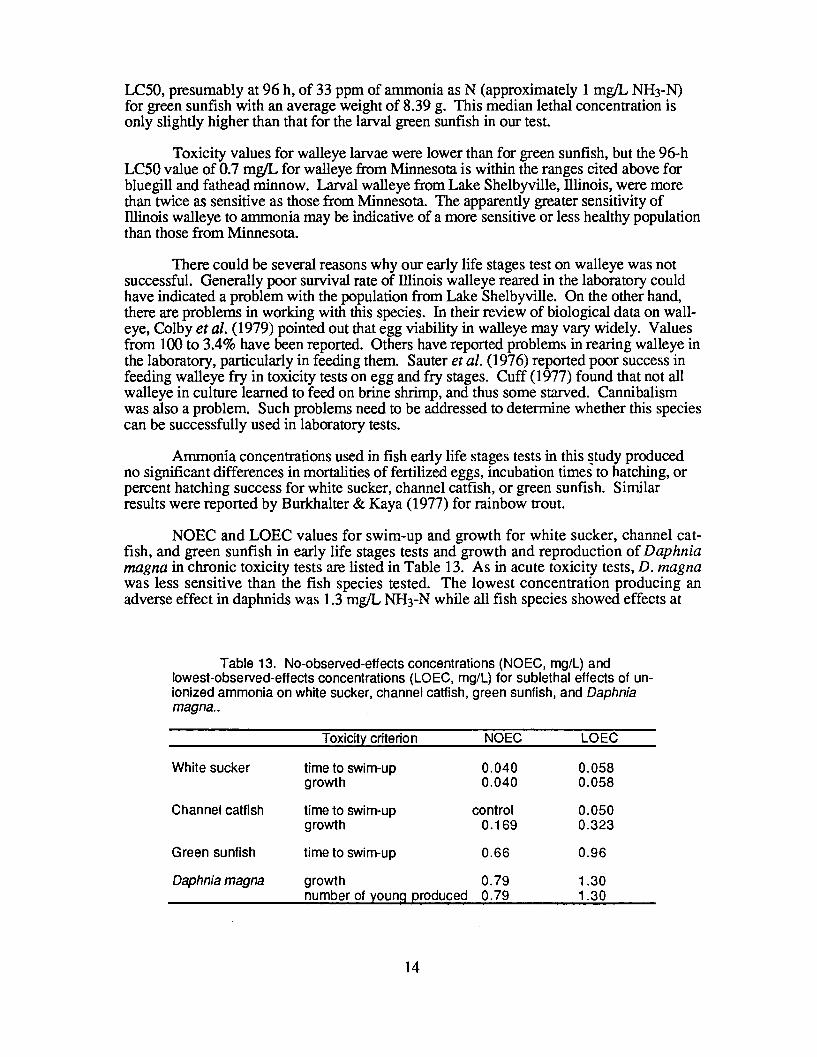
NOEC and LOEC values for swim-up and growth for white sucker, channel cat-fish, and green sunfish in early life stages tests and growth and reproduction of Daphniamagna in chronic toxicity tests are listed in Table 13. As in acute toxicity tests, D. magnawas less sensitive than the fish species tested. The lowest concentration producing anadverse effect in daphnids was 1.3 mg/L NH3-N while all fish species showed effects at
Table 13. No-observed-effects concentrations (NOEC, mg/L) andlowest-observed-effects concentrations (LOEC, mg/L) for sublethal effects of un-ionized ammonia on white sucker, channel catfish, green sunfish, and Daphniamagna..
Toxicity criterion NOEC LOEC
White sucker time to swim-up 0.040 0.058growth 0.040 0.058
Channel catfish time to swim-up control 0.050growth 0.169 0.323
Green sunfish time to swim-up 0.66 0.96
Daphnia magna growth 0.79 1.30number of young produced 0.79 1.30
14

lower concentrations. Both growth and reproduction were affected in daphnids. Sincereproduction in daphnids is correlated with body size, however, reduction in the number ofyoung produced may be related to reduction in growth.
In all three fish early life stages tests, time to swim-up was delayed at some treat-ment concentration. LOEC concentrations were 0.058, 0.050, and 0.96 mg/L NH3-N forwhite sucker, channel catfish, and green sunfish, respectively. As shown by the results ofcounts, at two different times in the case of catfish, the actual percentage of fry that reachedswim-up stage depended on the time when the count was made. Differences observed,however, were statistically significant.
Growth reduction in white suckers occurred at concentrations as low as 0.058 mg/LNH3 -N. This is comparable to the level of 0.05 mg/L that Burkhalter & Kaya (1977)found to cause retardation of growth and development in rainbow trout fry.
For channel catfish, the lowest concentration found to decrease growth significantlywas 0.323 mg/L NH3-N, with no significant effect found at 0.169 mg/L. We have foundno other information in the literature on effects of ammonia on channel catfish early lifestages. For larger individuals (20.3 g) of the same species, Colt & Tchobanoglous (1978)found a 50% reduction in growth during a 31-d trial at 0.517 mg/L NH3-N, no growth at0.967 mg/L, a 23% reduction in growth at 0.217 mg/L, and a difference in growth com-pared with the control at 0.048 mg/L. The lowest value causing an effect on growth in thatstudy is similar to the lowest concentration (0.05 mg/L) found to affect time to swim-up inthis investigation.
In summary, results of this investigation indicate that concentrations of NH3-N aslow as 0.05 and 0.06 mg/L caused a delay in time to swim-up and a significant reduction ingrowth, respectively, in early life stages tests with these fish species.
REFERENCES
American Public Health Association, American Water Works Association, and Water Pollution ControlFederation. 1976. Standard methods for the examination of water and wastewater, 14th ed.American Public Health Association, Washington, DC.
American Society for Testing and Materials. 1980. Annual book of standards. Part 31, Water. AmericanSociety for Testing and Materials, Philadelphia, PA.
Anderson, B.G. 1948. The apparent thresholds of toxicity to Daphnia magna for chlorides of variousmetals when added to Lake Erie water. Trans. Am. Fish. Soc. 78:96-113.
Burkhalter, D.E., and C.M. Kaya. 1977. Effects of prolonged exposure to ammonia on fertilized eggs andsac fry of rainbow trout (Salmo gairdneri). Trans. Am. Fish. Soc. 106:470-475.
Colby, PJ., R.E. McNicol, and R.A.Ryder. 1979. Synopsis of biological data on the walleye Stizo-stedion v. vitreum (Mitchill 1818). FAO Fisheries Synopsis 119. Food and AgricultureAssociation of the United Nations, Rome.
Colt, J., and G. Tchobanoglous. 1978. Chronic exposure of channel catfish, Ictalurus punctatus, toammonia: effects on growth and survival. Aquaculture 15:353-372.
Cuff, W.R. 1977. Initiation and control of cannibalism in larval walleyes. Prog. Fish-Cult 39:29-32.Hamilton, M.A., R.C. Russo, and R.V. Thurston. 1977. Trimmed Spearman-Karber method for esti-
mating median lethal concentrations in toxicity bioassays. Environ. Sci. Technol. 11:714-719.Hine, N.H., C.H. Hull, J.G. Jenkins, K. Steinbrenner, and D.H. Bent. 1975. SPSS: statistical package
for the social sciences, 2nd ed. McGraw-Hill, New York.
15

Jude, DJ. 1973. Sublethal effects of ammonia and cadmium on growth of green sunfish. Ph.D. thesis,Michigan State University, East Lansing.
Lemke, A.E., W.A. Brungs, and B.J. Halligan. 1978. Manual for construction and operation of toxicity-testing proportional diluters. EPA-600/3-78-072. U.S. Environmental Protection Agency,Environmental Research Laboratory, Duluth, MN.
Maki, A.W. 1979. Correlations between Daphnia magna and fathead minnow (Pimephales promelas)chronic toxicity values for several classes of test substances. J. Fish. Res. Board Can. 36:411-421.
Mount, D.I. 1968. Chronic toxicity of copper to fathead minnows (Pimephales promelas Rafinesque).Water Res. 2:215-223.
Mount, D.I., and W.A. Brungs. 1967. A simplified dosing apparatus for fish toxicity studies. Water Res.1:21-29.
Roseboom, D.P., and D.L. Richey. 1977. Acute toxicity of residual chlorine and ammonia to some nativeIllinois fishes. Report of Investigation 85, Illinois State Water Survey, Urbana.
Sauter, S., K.S. Buxton, K.J. Macek, and S.R. Petrocelli. 1976. Effects of exposure to heavy metals onselected freshwater fish: toxicity of copper, cadmium, chromium, and lead to eggs and fry of sevenfish species. EPA-600/3-76-105. U.S. Environmental Protection Agency, Duluth, MN.
Tabata, K. 1962. Toxicity of ammonia to aquatic animals with reference to the effect of pH and carbondioxide. (In Japanese with English summary). Bull. Tokai Reg. Fish. Res. Lab. 34:67-74.
Thurston, R.V., R.C. Russo, and K. Emerson. 1979. Aqueous ammonia equilibrium-tabulation ofpercent un-ionized ammonia. EPA-600/3-79-091. U.S. Environmental Protection Agency,Environmental Research Laboratory, Duluth, MN.
Thurston, R.V., R.C. Russo, and G.A. Vinogradov. 1981. Ammonia toxicity to fishes. Effect of pH onthe toxicity of the un-ionized ammonia species. Environ. Sci. Technol. 15:837-840.
U.S. Environmental Protection Agency. 1972a. Proposed recommended bioassay procedure for egg and frystages of freshwater fish. National Water Quality Laboratory, Duluth, MN.
U.S. Environmental Protection Agency. 1972b. Recommended bioassay procedure for Daphnia magnachronic tests in a flowing system. National Water Quality Laboratory, Duluth, MN.
U.S. Environmental Protection Agency. 1975. Methods for acute toxicity tests with fish,macroinvertebrates, and amphibians. EPA-660/3-75-009. National Environmental ResearchCenter, Corvallis, OR.
U.S. Environmental Protection Agency. 1977. Quality criteria for water. Office of Water Planning andStandards, Washington, DC.
U.S. Environmental Protection Agency. 1979. Methods for chemical analysis of water. EPA-600/4-79-020. Environmental Monitoring and Support Laboratory, Cincinnati, OH.
Willingham, W.T., J.E. Colt, J.A. Fava, B.A. Hillaby, C.L. Ho, M. Katz, R.C. Russo, D.L. Swanson,and R.V. Thurston. 1979. Ammonia. EPA criterion. Pages 6-18 in R.V. Thurston, R.C.Russo, C.M. Fetterolf, Jr., T.A. Edsall, and Y.M. Barber, Jr., eds. A review of the EPA RedBook: quality criteria for water. Water Quality Section, American Fisheries Society, Bethesda,MD.
16

Appendix A. ANOVA table and results of Student-Newman-Keul's testfor white sucker lengths from early life stages test
Variable length by treatment
Source d.f. Sum of squares Mean square F ratio F probability
Between groups 5 90.012 18.002 14.769 0Within groups 819 998.335 1.219Total 824 1088.348
Variable lengthMultiple range test
Student-Newman-Keul's procedureRanges for the 0.050 level
2.81 3.33 3.65 3.87 4.04
The ranges above are tabular values.The value actually compared with mean (j) - mean (i) is
0.7807 x range x sqrt (1/n(i) + 1/n(j))
Homogeneous subsets (subsets of groups, whose highest and lowest means donot differ by more than the shortest significant range for a subset of that size).
Subset 1Group 6 4 5Mean 14.2055 14.3514 14.4893
Subset 2Group 5 2Mean 14.4893 14.7488
Subset 3Group 2 3Mean 14.7488 14.9154
Subset 4Group 3 1Mean 14.9154 15.1449
17

Appendix B. ANOVA table and results of Student-Newman-Keul's testfor channel catfish lengths from early life stages tests
Variable length by treatment
Source d.f. Sum of squares Mean square F ratio F probability
Between groups 5 103.617 20.723 16.871 0.7Within groups 586 722.832 1.234Total 591 826.449
Variable lengthMultiple range test
Student-Newman-Keul's procedureRanges for the 0.050 level
2.81 3.33 3.65 3.83 4.05
The ranges above are tabular values.The value actually compared with mean (j) - mean (i) is
0.7853 x range x sqrt (1/n(i) +1/n(j))
Homogeneous subsets (subsets of groups, whose highest and lowest means donot differ by more than the shortest significant range for a subset of that size).
Subset 1Group 6 5Mean 20.6010 20.7163
Subset 2Group 4 3 2 1Mean 21.3525 21.3554 21.4960 21.7544
18