Embed Size (px)
Citation preview
University of Nebraska - LincolnDigitalCommons@University of Nebraska - Lincoln
Theses and Dissertations in Animal Science Animal Science Department
Spring 5-2015
Effects of Feeding Distillers Grains ThroughoutDifferent Phases of Production on Shelf Life ofGround BeefBrandy D. ClevelandUniversity of Nebraska-Lincoln, [email protected]
Follow this and additional works at: http://digitalcommons.unl.edu/animalscidiss
Part of the Meat Science Commons
This Article is brought to you for free and open access by the Animal Science Department at DigitalCommons@University of Nebraska - Lincoln. It hasbeen accepted for inclusion in Theses and Dissertations in Animal Science by an authorized administrator of DigitalCommons@University of Nebraska- Lincoln.
Cleveland, Brandy D., "Effects of Feeding Distillers Grains Throughout Different Phases of Production on Shelf Life of Ground Beef "(2015). Theses and Dissertations in Animal Science. 107.http://digitalcommons.unl.edu/animalscidiss/107
EFFECTS OF FEEDING DISTILLERS GRAINS THROUGHOUT DIFFERENT
PHASES OF PRODUCTION ON SHELF LIFE OF GROUND BEEF
By
Brandy Danielle Cleveland
A THESIS
Presented to the Faculty of
The Graduate College at the University of Nebraska
In Partial Fulfillment of Requirements
For the Degree of Master of Science
Major: Animal Science
Under the Supervision of Professor Gary A. Sullivan
Lincoln, Nebraska
May 2015

ii
Effects of Feeding Distillers Grains Throughout Different Phases of Production on the Shelf Life
of Ground Beef
Brandy Danielle Cleveland, M.S.
University of Nebraska, 2015
Advisor: Gary A. Sullivan
These studies analyzed the effects of feeding distillers grains on the shelf life of cooked
and raw ground beef, and how the addition of postmortem or dietary antioxidants impact shelf
life.
For study one, cattle were assigned to backgrounding diets containing low or high
concentrations of wet distillers grains (WDGS) and either corn gluten feed or modified wet
distillers grains (MDGS) during finishing. For study two, cattle were fed one of five finishing
diets; corn, wet distillers grains (WDGS), WDGS + vitamin E, WDGS + Ethoxyquin/TBHQ, or
WDGS + vitamin E + Ethoxyquin/TBHQ.
Shoulder clods from each dietary treatment were ground and lean, fat, and composite
samples were taken for fatty acid analysis. Patties were overwrapped for retail display and
analyzed for lipid oxidation, discoloration and objective color. Cooked beef links were
manufactured with salt and phosphate. Links from the first study contained different
concentrations of rosemary and green tea extract. Beef was stuffed into links, cooked, and lipid
oxidation was measured throughout refrigerated or frozen storage.
iii
For study one, there were no differences in lipid oxidation of patties, yet ground beef
from heifers finished with MDGS discolored faster than beef from cattle finished on corn gluten
feed. Increased lipid oxidation in beef links occurred when cattle were fed distillers grains
during backgrounding or finishing but antioxidants reduced lipid oxidation similarly regardless
of concentration.
For study two, ground beef patties showed no dietary differences for instrumental color,
only increased percent discoloration over time. All ground beef TBARS increased over time, and
supplementation of vitamin E resulted in lower TBARS values than corn after 2 d of retail
display. An increase in PUFA and C18:2 was observed in lean and composite fatty acids in
WDGS versus corn-finished cattle.
Both dietary and postmortem antioxidants were effective at extending shelf life in ground
beef from cattle fed distillers grains. Additionally, the effect of feeding distillers grains on shelf
life varies depending on when distillers grains was supplemented.
iv
Copyright, 2015, Brandy Danielle Cleveland

v
ACKNOWLEDGEMENTS
My time at Nebraska would not have been complete without the generous support and
friendship of many people.
First of all, I would like to extend my gratitude to my supervisor, Dr. Gary Sullivan, for
offering me a valuable graduate school experience. His cooperation with my coaching position
was highly appreciated. We both have experienced a lot of changes, trials and tribulations that
we were able to work through as a team, and for that I am eternally grateful. I am honored to
serve as one of your first graduate students.
I would also like to thank Dr. Dennis Burson and Dr. Chris Calkins for being members of
my committee and setting me up for success in the meat industry moving forward. Dr. Burson is
the reason I was able to call the University of Nebraska home for my graduate school experience,
as he recruited me to coach the meat judging team. I am highly grateful to Dr. Calkins for
exposing me to several valuable networking opportunities while at Nebraska that I will continue
to utilize throughout my career. My gratitude also goes to my meat judging coordinator, Dr. Ty
Schmidt. He allowed me to live out one of my biggest dreams as a coach, and provided
cherished guidance throughout my personal development as a coach and instructor.
Equally as important, I wish to thank Sherri Pitchie, Calvin Schrock and Tommi Jones for
their assistance during my time at Nebraska. Sherri was particularly helpful with my meat
judging team travel arrangements and providing advice whenever I needed it most. Calvin’s
patience and cooperation with my judging team practices was certainly appreciated. Tommi’s
organizational skills and contributions towards my lab endeavors were most appreciated, not to
mention the positive advice she provides to graduate students.
I am grateful to the Beef Checkoff program and the Nebraska Beef Council for funding
my research projects.
vi
My fellow graduate students were most helpful throughout my projects. Kim Varnold,
Michelle Semler, Derek Schroeder, Amy Redfield, Katherine Domenech, Michael Chao, Joe
Buntyn, Chad Bower, Regan Stanley, Hope Voegele, Kelly McCarty, and Emery Kunze
provided a team atmosphere and fellowship that would be hard to match. To Sara Sieren, I can’t
thank you enough for being my sidekick during the judging seasons and keeping me grounded
during rough times.
Finally, I must thank my family and friends, near and far, for providing me endless
encouragement over the past few years. They were the link I needed to push myself to be the best
I can be. Special thanks particularly go to my parents, Darlene and Doug, for being my biggest
supporters through this and keeping my spirits high.

vii
TABLE OF CONTENTS
ABSTRACT .................................................................................................................................... ii
COPYRIGHT PAGE ..................................................................................................................... iv
ACKNOWLEDGEMENTS ............................................................................................................v
TABLE OF CONTENTS .............................................................................................................. vii
INTRODUCTION ...........................................................................................................................1
REVIEW OF LITERATURE ..........................................................................................................3
2.1 Distillers Grains ......................................................................................................................3
2.1.1 Fatty Acid Composition and Lipid Oxidation .................................................................4
2.2 Lipid Oxidation ......................................................................................................................5
2.2.1 Steps of Lipid Oxidation .................................................................................................6
2.2.2 Flavor and Lipid Oxidation .............................................................................................7
2.2.3 Promotors of Lipid Oxidation .........................................................................................7
2.2.4 Measurements of Lipid Oxidation in Meat .....................................................................9
2.2.5 Health Implications of Lipid Oxidation Products .........................................................10
2.3 Fresh Meat Color ..................................................................................................................11
2.3.1 Myoglobin in Fresh Meat ..............................................................................................11
2.3.2 Forms of Myoglobin ......................................................................................................12
2.3.3 Myoglobin Concentration ..............................................................................................13
2.3.4 Oxygen Consumption ....................................................................................................14
2.3.5 Metmyoglobin Reducing Activity .................................................................................16
2.3.6 Grinding and Color Stability .........................................................................................17
2.3.7 Relationship of Lipid Oxidation and Meat Color ..........................................................17
2.4 Antioxidants .........................................................................................................................18
2.4.1 Impacts of Natural Antioxidants on Lipid and Myoglobin Oxidation ..........................20
2.5 Natural Antioxidants ............................................................................................................20
2.5.1 Rosemary as an Antioxidant ..........................................................................................21
2.5.2 Tea Catechins as Antioxidants ......................................................................................22
2.6 Dietary Antioxidants ............................................................................................................22

viii
2.6.1 Tocopherols ...................................................................................................................22
2.6.2 Ethoxyquin/TBHQ ........................................................................................................24
2.7 Conclusion ............................................................................................................................25
MATERIALS AND METHODS ...................................................................................................26
LITERATURE CITED ..................................................................................................................33
MANUSCRIPTS............................................................................................................................43
1. EFFECT OF FEEDING DISTILLERS GRAINS DURING DIFFERENT PHASES OF
PRODUCTION AND ADDITION OF POSTMORTEM ANTIOXIDANTS ON SHELF
LIFE AND FATTY ACID PROFILE OF
GROUND BEEF ..............................................................................................................44
2. EFFECT OF FEEDING DISTILLERS GRAINS AND SUPPLEMENTING WITH
DIETARY ANTIOXIDANTS ON SHELF LIFE AND FATTY ACID PROFILE OF
GROUND BEEF ..............................................................................................................75
RECOMMENDATIONS FOR FUTURE RESEARCH ................................................................98
APPENDICES ...............................................................................................................................99

1
1. Introduction
The fermentation of grain has been available to the animal feed industry since the 19th
century, where dried distillers grains plus solubles were being fed to cattle (Klopfenstein et al.,
2008). Approximately one third of each bushel of grain used for fuel ethanol production is made
into distillers grains, of which 43% is utilized as feed by the beef cattle sector (RFA, 2010).
Some of the fat in distillers grains is protected from rumen biohydrogenation, resulting in an
increased concentration of unsaturated fatty acids absorbed into the lean and fat tissues,
particularly in the phospholipid membranes (Gill et al., 2008; Koger et al., 2010; Vander Pol et
al., 2009). Due to the increase in polyunsaturated fatty acids, meat from animals fed distillers
grains tend to have reduced a reduced shelf life, both from a lipid and myoglobin oxidation
perspective (Gill et al., 2008). Further processing often has a detrimental impact on shelf life
that could magnify the reduction in shelf life in beef from cattle fed distillers grains. For
example, grinding of meat products disrupt the phospholipid membranes and allows increased
exposure to oxygen, hence increasing the product susceptibility to lipid oxidation. Additionally,
heating allows the phospholipids to become more exposed and vulnerable to oxygen and free
radicals, and has been shown to increase thiobarbituric acid reactive substances (TBARS) values,
a measure of lipid oxidation, up to four-fold (McCarthy et al., 2001).
Both dietary and postmortem antioxidants can be used to compensate for the negative
effects of diet and processing. The phenolic compounds of natural plant extracts, such as
rosemary and green tea, act as a hydrogen donor to stabilize free radicals, in a manner
functionally identical to that of synthetic antioxidant, BHA/BHT (McCarthy et al., 2001). The
effectiveness of the antioxidant depends on how the antioxidant itself was processed, what
concentration is added, the environment it is in, and how the product is processed and stored.

2
Vitamin E is also known to be a primary antioxidant by releasing a hydrogen atom to quench
free radicals (Berges, 1999). Govaris et al. (2004) determined that the antioxidant effect of direct
addition of ɑ-tocopherol was inferior compared to dietary supplementation. The antioxidant
Ethoxyquin/TBHQ (Agrado Plus, Novus International, St. Louis, MO) is approved for usage in
feed rations to reduce oxidation of ingredients with higher fat content, such as supplemented
vitamin E (Maddock et al., 2003). Ethoxyquin/TBHQ supplementation does not increase serum
Vitamin E values directly, but could indirectly increase vitamin E concentrations over time
because Agrado Plus is able to stabilize vitamin E in the feed ration (Choat et al., 2002).
The purposes of these studies were to evaluate the effect of feeding distillers grains on
the shelf life and fatty acid composition of both cooked and raw ground beef, as well as the
effect of both dietary and postmortem antioxidants on shelf life.
3
2. Review of Literature
2.1 Distillers Grains
The fermentation of grain has been available to the animal feed industry since the 19th
century, where dried distillers grains plus solubles were being fed to cattle (Klopfenstein et al.,
2008). One third of each bushel of grain used for fuel ethanol production is returned to the
animal feed industry as distillers grains (RFA, 2010). Several types of distillers grains exist,
dependent on the processing technique. The initial step in ethanol production is to remove the
starch from the grain and hydrolyze it to dextrin using the enzyme glucoamylase. This dextrin is
converted to glucose by a glucoamylase sugar, where yeast coverts the glucose to ethanol and
CO2 (Davis, 2001). The ethanol is removed and the remaining product is centrifuged. The
coarser particles are wet distillers grains (WDG) or may be dried into dried distillers grains
(DDG). The drying process allows the coarser particulates to pass through a rotary dryer. The
remaining liquid (called thin stillage) goes through an evaporator to remove additional moisture,
producing a syrup-consistency product called solubles. These solubles are often added back to
DDG or WDG to form DDG/WDG plus solubles (DDGS/WDGS, respectively; Stock et al.,
1999). Partially dried WDGS with a moisture percentage of approximately 50 percent are
termed modified distillers grains plus solubles (MDGS). Other processes have been identified to
remove fiber or oil content of the distillers grains (Berger & Singh, 2010).
In ethanol production, sulfuric acid is used to regulate pH in fermentation, and is added to
the grain during steeping, thus contributing to a higher sulfur content to the byproduct. Wet
distillers grains has approximately 0.79% sulfur, based on 1200 samples from various Nebraska
ethanol plants (Buckner et al., 2008). An upper limit of sulfur in finishing diets at 0.4% is set by
the National Research Council to reduce the risk of polioencephalomalacia, which in turn

4
typically limits the concentrations of DGS fed in the diet to no higher than 50%, depending on
the percent sulfur in the batch being used.
Larson et al. (1993) showed an increase in average daily gain in both calves and yearlings
fed distillers grains when compared to corn, likely due to a combination of factors, including
increased energy utilization, reduced acidosis, and yeast products. This could also be attributed
to more unsaturated fatty acids reaching the duodenum, increased fat digestibility, and more
proprionate production (Vander Pol et al., 2009). Vander Pol et al. (2006) also determined in an
earlier study that feeding DGS at 0, 10, 20, 30, 40 and 50 resulted in a quadratic response in
average daily gain and feed efficiency, and that feed efficiency was higher in WDGS diets than
in corn diets.
2.1.1 Fatty Acid Composition and Lipid Oxidation
Meat from cattle fed distillers grains have increased polyunsaturated fatty acid (PUFA)
concentrations when compared to corn based diets, making it more prone to lipid oxidation (Gill
et al., 2008; Koger, et al., 2010). Biohydrogenation in the rumen conserves some of the fats,
resulting in an increased concentration of unsaturated fatty acids in the small intestines which
could later be absorbed into the lean tissue (Vander Pol et al., 2009). Unsaturated fatty acids are
converted to saturated fatty acids through an isomerization process in the rumen that forms trans
fatty acids intermediates, including conjugated linoleic acid (CLA) (Mello et al., 2012).
Therefore, the increase in trans fats seen in beef from cattle fed MDGS may be attributed to the
increased digestibility of MDGS fat increasing the initial hydrogenation process of linoleic acid.
As the amount of distillers grains fed increased, the total polyunsaturated fatty acids (PUFA),
linoleic acid (18:2) and CLA increased in tissue samples (Depenbusch et al., 2009; Mello et al.,
2012). To complement this, several studies report a decrease in several monounsaturated fatty
5
acids (MUFA) and saturated fatty acids (SFA) in cattle supplemented DGS (Depenbusch et al.,
2009; Koger et al., 2010; Mello et al., 2012).
Due to the shift in fatty acid composition, meat from animals fed distillers grains tend to
have reduced a reduced shelf life, both from a lipid and myoglobin oxidation perspective (Gill et
al., 2008). Depenbusch et al. (2009) observed a decrease in redness (a* values) of steaks in
display over a 7 day period once the concentration of DGS exceeded 45% of the ration. Koger et
al. (2010) saw a decrease in color stability in lower L* values and a* values in beef from cattle
fed DGS versus steam flaked corn. Additionally, increased concentrations of DGS (20% to 40%
DM) increased TBARS concentrations in ground beef (Koger et al., 2010).
2.2 Lipid Oxidation
Lipids are the most energy dense storage compound at 9 calories per gram (Wong et al.,
1989). Therefore, lipids remain an imperative part of the human diet, and maintaining the
stability of these lipids is necessary. Lipid oxidation deteriorates food quality and consequently
is one of the most intensely researched areas (Ladikos & Lougovois, 1990; Wong et al., 1989).
Lipid oxidation most often occurs in unsaturated fatty acids where the higher the degree of
unsaturation, the more prone the fatty acid is to oxidation (Schultz & Sinnhuber, 1962).
Therefore, greater amounts of polyunsaturated fatty acids tends to lead to less lipid stability.
Phospholipid membranes, which only account for approximately 1% of tissue weight, contain
large amounts of polyunsaturated fatty acids (Christie, 1978). The most common unsaturated
fatty acids found in beef are oleic, linoleic, linolenic and arachidonic. Lipid degradation occurs
by one of two ways, enzymatic lipolysis and oxidation. The enzymatic approach utilizes lipases
to release free fatty acids from the triglycerides by hydrolyzing the ester bond that attaches the
fatty acid to the glycerol backbone (Forrest et al., 2012). The oxidation of lipids is the reaction

6
with oxygen and unsaturated fatty acids, and is of greater concern than lipase activity in meat
products (Wong et al., 1989; Forrest et al., 2012). Autooxidation and photo-sensitized oxidation
are two different pathways to initiate the oxidative process (Wong, 1989). Autooxidation is a
cyclic reaction involving development of free-radicals.
2.2.1 Steps of Lipid Oxidation
The three steps of autooxidation include: initiation, propagation and termination. The
initiation stage is when labile hydrogen is abstracted to form a carbon centered alkyl radical in
the presence of an initiator such as oxygen, heavy metals or light (Wong et al., 1989; Ladikos &
Lougovois, 1990). The free radicals formed in initiation react with oxygen to form peroxy
radicals, which react with a second unsaturated fatty acid to form a hydroperoxide and a alkyl
radical on the second fatty acid. This is the propagation stage, and is a recurring, cyclical event
until the lipid runs out of double bonds to react or outside compounds (such as antioxidants)
terminate the process. The rate at which this process occurs is dependent on the degree of
unsaturation of the lipid (Wong et al., 1989). During the autooxidation process, primary and
secondary products are produced. Primary products are in the form of peroxides, whereas
secondary products, primarily aldehydes, ketones, acids, alcohols, carbonyls, esters and
hydrocarbons, are formed from the breakdown of primary oxidation products. Primary products
of oxidation are reactive with functional groups of amino acids, such as sulfur or amines, and
could be a contributor to nutritional loss in food products (Ladikos & Lougovois, 1990).
Secondary products of oxidation promote oxidation after binding with the thiols of cysteine,
which further allows nutritional loss (Ladikos & Lougovois, 1990).

7
2.2.2 Flavor and Lipid Oxidation
Hydroperoxides formed during lipid oxidation are unstable, and undergo cleavage at the
carbon-carbon bond on either side of the alkoxy radical. These radicals react among others and
form volatile compounds (alcohols, carbonyls, esters and hydrocarbons). Some secondary
products are responsible for the oxidized flavor in foods (Wong et al., 1989). Hydroperoxides
may convert to hydroxy and alkoxy radicals, where cleavage of adjacent fatty acid chains result
in volatile compounds that contribute to flavor and aroma (Ladikos & Lougovois, 1990).
Warmed over flavor is an off flavor due to secondary products of lipid oxidation that you see in
cooked meats, and typically become apparent within 48 h at refrigerated temperatures (Forrest et
al., 2012). Other flavors that are used to describe lipid oxidation are: rancid, cardboard flavor,
dirty sock and musty (Sato & Hegarty, 1971; Pearson et al., 1977).
Despite this, not all oxidation processes are negative. In certain dry-cured country hams
and fermented sausages, the desired end flavor is not achieved until a specific level of hydrolysis
and oxidation of the fat occurs (Pearson et al., 1977). Additionally, lipid oxidation immediately
prior to cooking may be a source of intermediates that react with other components to contribute
to desirable cooked flavor (Enser et al., 1987)
2.2.3 Promotors of Lipid Oxidation
Several factors act as catalysts on the lipid oxidation process, both endogenously and
exogenously. For endogenous factors, muscle type and specie differences exist due to the
differing concentrations of polyunsaturated fatty acids (Govaris et al., 2004). Lipid
concentrations, unsaturation of the fatty acids, and iron content are responsible for the variability
between specie (Tang et al., 2001). Metal ions, such as iron, copper, cobalt and calcium cause
autooxidation of the reductant (e.g. catalase, reduced glutathione, ascorbic acid) to produce O2-, a
8
superoxide anion (Lawrence et al., 2003; Maestre et al., 2009; Wong et al., 1989). The metals
increase the rate at which electron transfer occurs, resulting in increased free radical formation
(Ingold, 1962). Furthermore, the oxidation state of the metal will determine the effect as a pro-
oxidant. In the case of free iron, both ferrous and ferric states of iron can act as pro-oxidants,
where ferrous iron would require an oxidant compound (such as oxygen) to initiate peroxidation,
and ferric iron would require a reducing agent to initiate peroxidation (Braughler et al., 1986).
The ferrous state has been shown to have more pro-oxidant activity than ferric, particularly since
oxidants are more readily available than reductants to initiate the oxidation process (Pearson et
al., 1977; Braughler et al., 1986).
For exogenous factors, simply eliminating exposure to oxygen through packaging
techniques will reduce lipid oxidation (Tang et al., 2001). Furthermore, lipid oxidation is
accelerated during cooking due to the release of free and heme iron from myoglobin, as well as
disruption of cell structure and antioxidant enzymes (Min et al., 2008). Non-heme iron is
considered most responsible for lipid oxidation in cooked meats, since a portion of the heme iron
is destroyed during cooking (Han et al., 1993). Min et al. (2008) determined that free ionic iron
and ferric iron reducing capacity were large contributors to lipid oxidation in cooked meats.
Additionally, meats with increased concentrations of heme pigment (beef, for example), produce
more hydrogen peroxide during myoglobin oxidation, where the secondary products of this
reaction can initiate lipid oxidation (Min et al., 2008). Higher temperatures observed during
cooking allow the phospholipids to become more exposed and vulnerable to oxygen and free
radicals, and have been shown to increase thiobarbituric acid reactive substances (TBARS)
values up to four-fold (McCarthy et al., 2001). However, Huang and Greene (1978) and Roux et
al. (2014) found that meat heated at lower temperatures and/or short periods of time had higher

9
TBARS values than those cooked for a longer period of time at higher temperatures. They
determined that this may have resulted from antioxidant substances with reducing properties that
form from browning reactions. Grinding of meat products disrupt the phospholipid membranes
and allows increased exposure to oxygen, thus increasing the rate of lipid oxidation significantly
(Sato et al., 1971). Furthermore, salt contains metallic elements that would act as prooxidants
(Wong, 1989).
2.2.4 Measurement of Lipid Oxidation in Meat
Measurement of lipid oxidation can be conducted by analyzing for primary or secondary
oxidation products. This is dependent on several factors, including the predicted stage of
oxidation, processing or storage conditions, or the correlation to sensory analysis. The 2-
thiobarbituric acid (TBA) test are the most widely used in meat, since TBARS values, a
measurement of malonaldehyde (secondary oxidation products) are more closely correlated to
sensory differences than peroxide values, a measure of primary oxidation products (Ladikos &
Lougovois, 1990). Malonaldehyde is a product of oxidation of polyunsaturated fats, particularly
omega-6 fatty acids (Ayala et al., 2014). Muscles with high concentrations of polyunsaturated
fats tend to have lower peroxide values since the conversion to secondary oxidation products
occurs at a much faster rate (Gheisari et al., 2011). Additionally, presence of pro-oxidants, such
as heme iron, will cause a faster conversion from primary to secondary lipid oxidation products
(Min et al., 2008). The TBARS method utilizes spectrophotometric determination of the
extracted malonaldehyde from the food product (Ahn et al., 1998). Thiobarbituric acid reactive
substances measurements have been highly correlated to the sensory measures of lipid oxidation
flavors, including warmed over flavor (Ahn et al., 1998). Other secondary products can be
measured, such as formation of carbonyls and hydrocarbons, but may not have as strong of a

10
correlation to the sensory data (Ladikos & Lougovois, 1990). Hexanal, a volatile aldehyde that
is a product of linoleic acid oxidation, is associated with cooked meats under refrigerated storage
(St. Angelo et al., 1987). Primary changes, such as hydroperoxide formation, oxygen uptake and
loss of polyunsaturated fatty acids are generally used to measure early stages of oxidation, where
very little oxidation has occurred (Ladikos & Lougovois, 1990).
2.2.5 Health Implications of Lipid Oxidation Products
Approximately 90-95% of oxygen in the body is converted to water. The remaining 5-
10% goes through a univalent and divalent reduction to produce reactive oxygen species, such as
peroxides (Esterbauer, 1993). The body contains several enzymes and antioxidants to protect
human cells from the toxic effects of the radicals, but certain circumstances suggest that these
protective systems are overwhelmed by the quantities of radicals and the cells may still be
damaged (Esterbauer, 1993). It is thought that the atherogenic potential of low-density
lipoproteins increase if modified by lipid oxidation (Esterbaur et al., 1990; Steinberg et al.,
1989). Several studies suggest that oral consumption of heavily oxidized oils are not acutely
toxic, mostly because the di- and polymeric oxidation products are not easily absorbed by the
small intestine and do not make it to the blood stream, or are detoxified in the harsh
environments of the stomach (Esterbauer, 1993). Lower molecular weight oxidation products
are more readily absorbed. However, it is highly unlikely that a human ingests the same
magnitude of oxidative products as the animal models used in these studies. Endogenous lipid
oxidation products are more likely to have a higher health risk. This is thought to be due to
higher TBARS values of human serum during certain pathological conditions, such as diabetes
(Janero, 1990). Different secondary oxidation products have varying toxicity levels. For

11
example, longer chain length aldehydes are more likely to have higher toxicity (Esterbauer,
1993).
2.3 Fresh Meat Color
2.3.1 Myoglobin in Fresh Meat
Myoglobin (Mb) is the primary protein pigment associated with meat color (Mancini &
Hunt, 2005). Myoglobin delivers oxygen from the sarcolemma to the mitochondria. It is found
in all muscle fiber types, but is present in greater concentrations in type I muscle fibers.
(Wittenberg & Wittenberg, 2003). Myoglobin is a water soluble, monomeric globular heme
protein with 150 amino acid residues (Livingston & Brown, 1981) and contains 8 α-helices (A–
H) linked by short nonhelical sections (Mancini & Hunt, 2005). The heme group consists of a
planar porphyrin ring that is made up of four pyrrole rings attached to each other through
methane bridges (Clydesdale & Francis, 1972). An iron atom which is centrally located in the
ring has the ability to form six bonds. Two of these bonds are perpendicular to the plane with the
5th coordinating with the proximal histidine-93 of myglobin and the sixth remaining open for
reversible bonding with ligands (Mancini & Hunt. 2005). Meat color is a result of the ligand
occupying the sixth position and the oxidation state of the iron atom. The other four bonds lie in
the plane and are with pyrrole nitrogens.
Myoglobin is more prone to oxidation than hemoglobin due to myoglobin’s functional
ability at lower oxygen pressure (George & Stratmann, 1952). A conformational change occurs
in the prosthetic heme due to the presence of molecular oxygen that stabilizes the electronic
structure of oxymyoglobin (Omb) and delays Mb oxidation (George & Stratmann, 1952).
Myoglobin is more susceptible to oxidation after deoxygenation of the heme occurs because of
12
factors including decreased pH values, greater temperatures, and a decreased oxygen partial
pressure (Mancini & Hunt, 2005; Renerre, 1990).
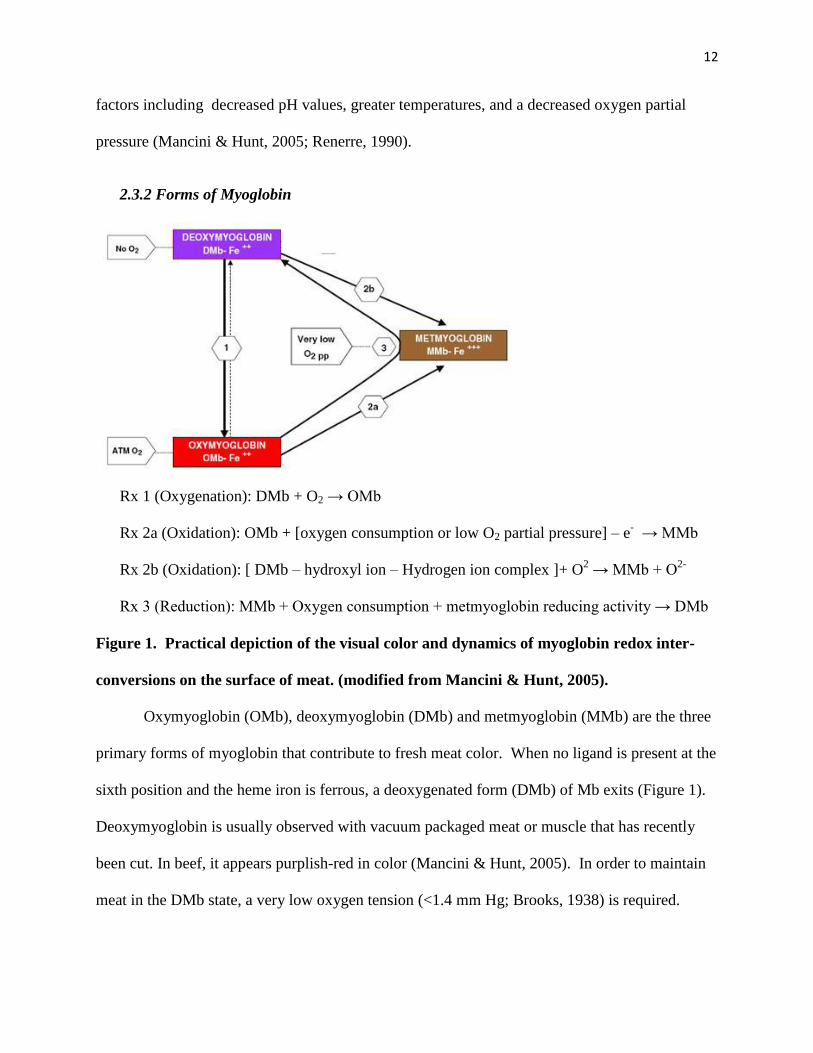
2.3.2 Forms of Myoglobin
Rx 1 (Oxygenation): DMb + O2 → OMb
Rx 2a (Oxidation): OMb + [oxygen consumption or low O2 partial pressure] – e- → MMb
Rx 2b (Oxidation): [ DMb – hydroxyl ion – Hydrogen ion complex ]+ O2 → MMb + O
2-
Rx 3 (Reduction): MMb + Oxygen consumption + metmyoglobin reducing activity → DMb
Figure 1. Practical depiction of the visual color and dynamics of myoglobin redox inter-
conversions on the surface of meat. (modified from Mancini & Hunt, 2005).
Oxymyoglobin (OMb), deoxymyoglobin (DMb) and metmyoglobin (MMb) are the three
primary forms of myoglobin that contribute to fresh meat color. When no ligand is present at the
sixth position and the heme iron is ferrous, a deoxygenated form (DMb) of Mb exits (Figure 1).
Deoxymyoglobin is usually observed with vacuum packaged meat or muscle that has recently
been cut. In beef, it appears purplish-red in color (Mancini & Hunt, 2005). In order to maintain
meat in the DMb state, a very low oxygen tension (<1.4 mm Hg; Brooks, 1938) is required.

13
When Mb is exposed to oxygen and it occupies the sixth position, the formation of OMb
occurs and the bright red desired pigment of fresh meat develops (Figure 1). Oxymyoglobin is
associated with the “bloomed” color of meat. The iron is still in the ferrous state but when the
distal histidine interacts with bound oxygen it alters myoglobin’s structure and stability. Meat
temperature, oxygen partial pressure, pH, and competition for oxygen by endogenous systems
can all affect the depth of oxygen penetration and thickness of the OMb section of the muscle
tissue (Mancini & Hunt, 2005).
Browning (discoloration) of meat is a sign of the formation of MMb on the meat surface.
This pigment formation results from the oxidation of the heme iron ferrous to ferric ion. Several
factors affect the formation of MMb and influence the rate of this discoloration including low
pH, high temperature, low metmyoglobin reducing ability, and very low oxygen partial pressure
(Mancini & Hunt, 2005).
The oxygenation reaction is the process of DMb being exposed to oxygen and changing
into the OMb form. Oxidation is the loss of an electron and the transformation of Fe2+
to Fe3+
.
Mancini and Hunt (2005) describe the redox conversion of OMb to DMb as an indirect, two-step
process. The OMb visually appears to first convert to MMb as the muscle consumes oxygen,
which creates a low oxygen partial pressure that auto-oxidizes the heme iron, which produces
MMb. Then the MMb can be converted to DMb, depending upon the muscle's reducing capacity
and the meat temperature (Mancini & Hunt, 2005). In conclusion, fresh meat Mb has three
forms that are influenced by the heme iron state and the ligand occupying the sixth position.
2.3.3 Myoglobin Concentration
Fresh meat color is predominantly determined by myoglobin concentration, redox state,
and bound ligand. Myoglobin typically is distributed uniformly within individual muscles but
14
varies by types of muscle, species, sex, breed, and age (Lawrie, 1998). In fresh meat, the meat
color portrays the most abundant Mb redox form present, even though the redox states of Mb are
continuously changing (Mancini & Hunt, 2005).
When comparing muscles within an animal, differences in Mb concentration have a
significant impact not only on meat color but also color stability. Red (oxidative) muscles that
appear darker contain more Mb than white (glycolytic) muscles (Seideman et al., 1984). Hunt
and Hedrick (1977) reported that the myoglobin concentrations in beef M. longissimus (3.48
mg/g), M. gluteus medius (4.11 mg/g), and the inner (2.97 mg/g) and outer (1.95 mg/g) M.
semitendinosus varied significantly. Additionally, myoglobin concentration varies between
different animal species. For example, the Mb concentration ranges from 2.0-5.0 mg/g wet
weight in beef (Hunt & Hedrick, 1977; Rickansrud & Henrickson, 1967), 4-7 mg/g in lamb
(Ledward & Shorthose, 1971), and 2.5-7.0 mg/g in pork (Topel et al., 1966). Meat from older
animals is darker due to the increase in Mb concentration as animals age. The American Meat
Institute Foundation (1960) stated that animal age has reportedly influenced the myoglobin
content in several species, as myoglobin content of muscle tissue in cattle was reported as 1 to 3
mg/g of wet tissue in veal, 4 to 10 mg/g in beef, and up to 16 to 20 mg/g in old beef. Overall,
Mb content differs by muscle fiber type, species, and age.
2.3.4 Oxygen Consumption
Oxygen consumption is an inherent property of meat where a series of reactions,
principally involving the Kreb cycle enzymes, scavenge oxygen in meat. Oxygen consumption
is responsible for the deoxygenation of OMb and the further decrease of oxygen concentration to
zero allowing the reduction of MMb to DMb (AMSA, 2014). Oxygen consumption rate, a
measurement of the rate where oxygen consumption per unit time is calculated, is a major

15
contributor to meat color stability. The bright red color of postmortem muscle tissue is
determined by the rate of DMb oxygenation and depth of oxygen penetration beneath the surface
of meat. These are impacted by many factors including partial oxygen pressure at the meat
surface, rate of oxygen diffusion, oxygen consumption by muscle enzymes, and the product
temperature (O'Keefe & Hood, 1982).
Mitochondria are important subcellular organelles involved in energy metabolism.
Mitochondrial enzymes such as cytochrome c oxidase continue to consume oxygen postmortem
reducing the amount available to bind to myoglobin, which leads to deoxymyoglobin formation
instead of oxymyoglobin (Tang et al., 2005). Furthermore, deoxymyoglobin is more susceptible
to oxidation than is oxymyoglobin (Richards et al., 2002). Myoglobin’s role in muscle tissues is
to transport oxygen to mitochondria in cells for energy production (Wittenberg et al., 1975).
Muscles with weaker color stability have been linked with greater mitochondrial content (Tang
et al., 2005). Faster rates of pH decline and lower final pH may inhibit the respiratory activity of
mitochondria (Lanari & Cassens, 1991). Postmortem muscles with a lower pH were discovered
to have a lower oxygen consumption rate leading to improved color stability (Lanari & Cassens,
1991; Tang et al., 2005) while increasing pH or temperature has been reported to increase tissue
oxygen uptake (Urbin & Wilson, 1958).
The oxygen tension above the meat surface greatly influences where the sub-surface
MMb layer forms between the outer surface OMb and interior DMb (Atkinson & Follet, 1973).
The deeper the OMb layer, the longer it takes for the sub-surface MMb to move upward and
impact the hue and discolor the meat. When the mitochondria have a greater oxygen
consumption rate, the oxygen surrounding the meat will be used up and Mb will be susceptible to
becoming the brown MMb pigment (Tang et al., 2005; Lanari & Cassens, 1991).
16
2.3.5 Metmyoglobin Reducing Activity
Metmyoglobin reducing activity (MRA) is essential for meat color life because the state
of MMb on meat surface is not appealing to consumers (Mancini & Hunt, 2005). Metmyoglobin
reducing activity is a property of meat where a series of reactions help reduce MMb to DMb. In
addition, this trait is directly related to color stability where greater MRA results in more stable
meat color (AMSA, 2014). Many factors, including the NADH (reduced form of nicotinamide
adenine dinucleotide) pool, muscle’s oxygen scavenging enzymes, and reducing enzyme
systems, help give the muscle the ability to go from the MMb form and return to DMb (Mancini
& Hunt, 2005). Metmyoglobin reduction activity is the enzymatic pathway of reducing the ferric
(Fe3+
) iron molecule in MMb back to the ferrous (Fe2+
) state in the presence of the NADH
(Renerre, 1990). The major components required for the enzymatic reduction of MMb are the
enzyme (NADH-cytochrome b5 MMb reductase), the intermediate (cytochrome b5) and the
cofactor NADH (Bekhit & Fautsman, 2005).
Nicotinamide adenine dinucleotide (NAD) concentrations in post-mortem muscle varied
with breed (Holstein had higher NADH than crossbred) and muscle type (M. longissimus dorsi
were greater than M. gluteus medius) and NADH concentration decreased with storage time
during storage at 4ºC (Faustman & Cassens, 1991). While NAD concentration was negatively
correlated with MMb accumulation in the Holstein breed animals tested, no significant
correlation was observed with crossbred animals. Sammel et al. (2002a and 2002b) reported that
NAD and NADH concentrations were location dependent in the M. semimembranosus muscle
(external vs. internal location) and attributed the location dependent effect to differences in
relative chilling rate (i.e. the outer portion would cool faster and not result in rapid depletion of

17
metabolites). McKenna et al. (2005) studied the biochemical properties of 19 beef muscles and
found that those with high color stability also had highest MRA.
Madhavi and Carpenter (1993) studied the effects of aging and processing on muscle
color and MRA and found that surface MMb accumulation, MRA, and OCR were affected by
muscle type, post-mortem aging and fabrication method. These authors also reported that color
labile muscle (M. psoas major) appears to have greater MMb accumulation, less MRA, and
greater OCR than color stable muscle (M. longissimus dorsi). In addition, the effect of
temperature on MRA is pH dependent. Reddy and Carpenter (1991) reported that enzyme
activity was greatest at pH 6.4 and 30ºC, compared to pH 5.8 or 7.0 and 4ºC.
2.3.6 Grinding and Color Stability
Sato et al. (1971) concluded that grinding meat disrupts the phospholipid membranes and
allows increases exposure to oxygen and release of the intracellular reductant, NADH, thus
increasing susceptibility to both lipid and myoglobin oxidation. The correlation between
myoglobin and lipid oxidation thus decreases the overall color stability of ground meat when
compared to intact steaks. Strange et al. (1974) observed TBARS values of ground products
were two to three times greater than those of unground product under similar conditions, which
would potentially result in a decrease in color stability as well. The same study concluded that a
freshly prepared ground sample held at 25°C discolored to a brownish red color description
within 15 minutes, and was completed brown after 2 hours. Thus, proper storage conditions and
antioxidant control are useful in sustaining color stability in ground products.
2.3.7 Relationship of Lipid Oxidation and Meat Color
Lipid oxidation has a positive correlation with color instability (Faustman et al., 1989;
Zakrys et al., 2008). The radicals formed from lipid oxidation could act directly or indirectly on

18
color pigments to influence color stability (Liu et al., 1995). Incubation of lipid oxidation
products with oxymyoglobin increased metmyoglobin formation, indicating a direct effect on the
pigments (Yin & Faustman, 1994). On the other hand, greater concentrations of iron and
myoglobin are correlated to lipid oxidation (Faustman et al., 1991). The dissociation of iron
from the heme of myoglobin could be a contributor to lipid oxidation (Faustman et al., 2010).
Additionally, myoglobin with high heme affinity (in the oxymyoglobin state) was less effective
as a prooxidant than myoglobin with a low heme affinity (metmyoglobin; Grunwald & Richards,
2006; Richards et al., 2002). O’Grady et al. (2001) suggested that lipid oxidation occurs after
oxymyoglobin oxidation, yet pigment oxidation can be enhanced by lipid oxidation primary
products. Secondary lipid oxidation products, such as 4-Hydroxy-2-nonenal (HNE) can bind
directly to myoglobin and lower the redox stability (Alderton et al., 2003; Faustman et al., 2010;
Suman at al., 2007).
2.4 Antioxidants
There are two different types of antioxidants: primary and secondary (Shahidi & Zhong,
1992). Primary antioxidants terminate the lipid oxidation process itself, whereas secondary
antioxidants react with pro-oxidants or regenerate other antioxidant compounds. Primary
antioxidants act by quenching free radicals, most often through phenolic compounds (Wong,
1989). Tert-Butylhydroquinon (TBHQ), Propyl Gallate (PG), Butylated hydroxyanisole and
Butylated hydroxytoluene (BHA/BHT) are synthetic primary antioxidants available for food use
(Shahidi and Zhong, 2005). Since these antioxidants have been shown to inflict cellular damage
at higher concentrations, government regulations exist for the utilization of these antioxidants
(Shahidi & Zhong, 2005). Secondary antioxidants help prevent lipid oxidation in ways other
than direct impact on the chemical process itself. These antioxidants react with other
19
prooxidants, regenerate current antioxidants, or act as reducing agents.
Ethylenediaminetetraacetic acid (EDTA) is an effective synthetic metal chelator, however the
transition toward natural ingredients increase the need to find another naturally occurring
compound with similar traits. Reducing sugars, such as whey products, form antioxidative
substances during the Maillard reaction of cooking (Ranken, 1987, Bedinghaus & Ockerman,
1995). Moreover, casein peptides found in bovine milk are capable of chelating calcium, iron,
copper and zinc (Baumy & Brule, 1999, Singh & Fox, 1995). The antioxidant activity is largely
due to the concentration used, since the study showed that the peptide had a prooxidant effect at
greater concentrations. Many metal chelators have prooxidant effects when the concentrations
are lower than that of iron, which is still not clearly understood (Diaz & Decker, 2004). Vitamin
C, ascorbic acid, is involved in the reduction of tocopheroxyl, causing a regenerative effect on
tocopherol (Descalzo et al., 2008). Therefore, vitamin C and ɑ-tocopherol can act
synergistically. On the other hand, high concentrations of ascorbic acid in the presence of
oxygen may form H2O2 and have detrimental effects on meat color (Descalzo et al., 2008).
If a maximum antioxidant effect is desired, a combination of a postmortem antioxidant
and dietary antioxidants (Vitamin E) is the most effective (Formanek et al., 2001). The same
study also concluded that the natural and dietary antioxidant combination was as effective as a
synthetic and dietary antioxidant combination. Antioxidants may act differently in cooked
products than raw products, where McCarthy et al. (2001) determined that mustard has
antioxidant properties in raw products, but acts as a prooxidant in cooked products. Therefore, it
cannot be assumed that antioxidants will act in the same manner throughout different processing
techniques.
20
2.4.1 Impacts of Antioxidants on Meat Color
Because of the interrelationship of lipid and color oxidation, both dietary and postmortem
antioxidants have been shown to increase color stability in meat products (Arnold et al., 1992;
Bloomberg et al., 2011; Maddock et al., 2003). Lanari and others (1994) reported that vitamin E
could stabilize the oxymyoglobin complex in muscles through increasing deoxymyoglobin
oxygenation and decreasing oxymyoglobin oxidation. The supplementation of ethoxyquin in
conjunction with vitamin E even further enhances a* values, but the same may not apply to
supplementation of ethoxyquin alone (Maddock et al., 2003; Walenciak et al., 1999).
In reference to postmortem antioxidants, butylated hydroxyanisole and butylated
hydroxytoluene (BHA/BHT) have been shown to be the most effective at retaining fresh meat
color when compared to natural antioxidants. Despite this, in raw pork patties, fenugreek, tea
catechins and whey protein had equal effectiveness in retaining redness as BHA/BHT (McCarthy
et al., 2001). Rosemary extracts are found to improve color stability in turkey, beef and pork in
ground and injected products (Yu et al., 2002; Formanek et al., 2003; Lawrence et al., 2004;
McCarthy et al., 2001; Sebranek et al., 2005). In contradiction, not all antioxidants contribute to
color stability. The use of trans-cinnamaldehyde, for example, was shown to lower TBARS
values, but did not improve color scores (Naveena et al., 2014).
2.5 Natural Antioxidants
Concern about the safety of synthetic antioxidants, such as BHA, BHT and TBHQ, has
opened up a large opportunity for the meat industry to research and utilize natural antioxidants.
Much research has been conducted to evaluate the effectiveness of natural antioxidants in
comparison to synthetic antioxidants, and the economic value of using such products. Many
natural antioxidants exist, including but not limited to: rosemary, sage, ginger, fenugreek,
21
mustard, grape seed extract and tea catechins. The antioxidant activity of these substances is not
newly recognized, as Chipault et al. (1952) reported strong antioxidant activity in the leaves of
rosemary in 1952.
2.5.1 Rosemary as an Antioxidant
Rosemary, like many other plant-based antioxidants, gains its antioxidant activity through
phenolic compounds. The phenolic compounds are different depending on the antioxidant, but
in the case of rosemary it is primarily diterpenes such as carnosol and carnosic acid (Decker &
Mei, 1996). These phenolic compounds act as hydrogen donors to stabilize free radicals. This
process is identical to that of BHA/BHT (McCarthy et al., 2001). Rosemary extracts have been
shown to provide greater (Wu et al., 1982) or lesser antioxidant activity in comparison to
BHA/BHT (Ahn et al, 2002). The results are heavily dependent on processing technique and
concentration of antioxidant used.
Efficacy of antioxidants depends on how the antioxidant itself was processed, what
concentration is added, the environment it is in, and how the product is processed and stored.
Application of rosemary extract to the trim prior to grinding has been shown to be more effective
at extending color stability and reducing TBARS values than addition of antioxidant after the
grinding process (Balentine et al., 2006). Murphy et al. (1998) discovered that the presence of
rosemary in cooked, salt-added roast beef resulted in lower TBARS values than the control.
Rojas and Brewer (2007) determined that grape seed extract, when used at the same amount of
rosemary oleoresin, generated lower TBARS values than rosemary extract at 8 days. This is
largely because greater concentrations of rosemary extract would be necessary to match the
antioxidant levels of grape seed extract in this instance. This being said, using specific extracts
at higher levels may begin to alter sensory characteristics of the product, and conducting sensory

22
research on plant-based extracts is imperative to determine if it is acceptable for use in food
products.
2.5.2 Tea Catechins as Antioxidants
Like rosemary, tea catechins are primary antioxidants that use catechin, epicatechin
gallate (ECG), epigallocatechin gallate (EGCG), and epicatechin to donate the phenolic hydrogen
to quench free radicals (Tang et al., 2001). The phenolic compounds ECG and EGCG
specifically have a high affinity for lipid bilayers and are more able to penetrate the lipid bilayer
to interact with phospholipids susceptible to lipid oxidation (Hashimoto et al., 1999). Roedig-
Penman and Gordon (1997) discovered that tea extract at 0.03% had equal antioxidant activity to
that of BHA/BHT at 0.02% over a 40 day period in an oil-in-water emulsion. McCarthy et al.
(2001) reported that tea catechins have similar TBARS values to those of BHA/BHT and of
rosemary extract in raw pork patties. In cooked patties, tea catechins were the best at reducing
TBARS values over a period of 9 days. Tea catechins are effective in all species, but have less
effect in meat from species with higher concentrations of unsaturated fats and iron (Tang et al.,
2001). Although tea catechins are acceptable to reduce lipid oxidation, they have shown to have
a negative effect on a* and b* values of cooked beef and chicken patties possibly due to binding
of the iron component of myoglobin (Mitsumoto et al., 2005).
2.6 Dietary Antioxidants
2.6.1 Tocopherols
There are four tocopherols: ɑ, β, γ, δ. (Sales & Koukolová, 2011). Alpha-tocopherol is
significantly more effective as an antioxidant than other tocopherols and is the most common
lipid soluble antioxidant in animal tissue. Vitamin E cannot be synthesized by animals and must
be found in the diet (Sales & Koukolová, 2011). Vitamin E is known to be a primary antioxidant

23
by releasing a hydrogen atom to counteract free radicals (Berges, 1999). Absorption of vitamin
E occurs in the lymphatic system. It is secreted into the liver and incorporated into very-low-
density lipoproteins, and transported into the interior of cells inside low-density lipoproteins
(Berges, 1999). Muscles with a higher exposure to blood flow contain higher concentrations of
ɑ-tocopherol than those with lower vascularity (Sheldon et al., 1997). Dietary supplementation
with vitamin E in the form of ɑ-tocopherol acetate delays lipid oxidation more effectively than
direct addition because it allows the vitamin E to be incorporated into the phospholipid
membranes rather than the neutral membranes (Ahn et al., 2002). Vitamin E is heat stable and
still retains the ability to act as an antioxidant in cooked meat products (Faustman et al., 1989).
Narciso Gaytán et al. (2010) determined that despite the rapid development of lipid oxidation in
cooked chicken patties versus fresh samples, vitamin E fed at higher concentrations in the diet
may combat the increased rate of oxidation. Postmortem addition of vitamin E can potentially
act as a prooxidant in some cases, by reducing ferric iron to a more active ferrous form (Pokorny,
1991). Govaris et al. (2004) determined that the antioxidant effect of direct addition of ɑ-
tocopherol was inferior, as dietary ɑ-tocopherol contained 90-fold more ɑ-tocopherol in the
membranes of turkey meat. Roux et al. (2014) detected that feed with six times more vitamin E
than the control had nearly equivalent differences in the meat itself, with 5.4 times more vitamin
E in the meat from chickens supplemented with vitamin E. Concentration of ɑ-tocopherol varies
between muscles, and is dependent on the capillary density and capillary-to-fiber ratio in turkey
femoris muscle (Bartov et al., 1983). However, vitamin E supplementation will not likely alter
the fatty acid composition of the tissue (Narciso-Gaytan et al., 2010).
Other compounds can be used synergistically with vitamin E to create a protective effect
on ɑ-tocopherol. Ascorbic acid has been used in conjunction with vitamin E since it serves as a

24
reducing agent on tocopherol (Descalzo et al., 2008). Oregano oil exerted protective in vivo
effects on the concentrations of ɑ-tocopherol in turkey muscle, suggesting that it has reducing
properties as well as phenolic compounds (Govaris et al., 2004).
2.6.2 Ethoxquin/TBHQ
Ethoxyquin/TBHQ (Agrado Plus, Novus International, St. Louis, MO) is approved for
usage in feed rations to reduce oxidation of ingredients with higher fat ratios (Maddock et al.,
2003). It is important to note that this ingredient prevents oxidation of the feed itself and does
not act as an antioxidant in the body. Choat et al. (2002) reported that Agrado supplementation
did not increase serum Vitamin E values directly, but could increase vitamin E concentrations
over time since Agrado is able to stabilize vitamin E in the feed ration.
Ethoxyquin/TBHQ has previously been shown to decrease TBARS values in beef
(Walenciak et al., 1999, Krumsiek & Owens, 1998). Choat et al. (2002), however, did not see
this decrease in TBARS values. This would likely be attributed to the absence of vitamin E
supplementation in the diet of the cattle used in this study. The contribution of Agrado to color
stability has contradictory results, where Krumsiek and Owens (1998) and Choat et al. (2002)
had an increased time period before discoloration of steaks in Agrado supplemented cattle
compared to the control. On the contrary, Walenciak et al. (1999) did not see any differences in
color stability over time. This could be attributed to the supplementation time, where the
Krumsiek and Ownes (1998) study had cattle supplemented with Agrado for 28 d prior to
slaughter and the Walenciak et al. (1999) study used cattle supplemented for 123 d.
Additionally, Krumsiek and Owens (1998) and Choat et al. (2002) studied color stability on
steaks only, whereas Walenciak et al. (1999) utilized both ground and whole muscle beef. The
25
intensity of lipid oxidation occurring in ground products could have overwhelmed the
antioxidant capabilities of vitamin E available in that study.
Agrado, specifically, was initially used in the dairy industry to reduce feed oxidation and
is making its way into the beef sector. This being said, there are many research opportunities in
Agrado supplementation, including feeding to different species, how it acts as an antioxidant,
and the effect on meat products, specifically processed meats.
2.7 Conclusion
Much research has shown that the increased usage of ethanol co-products in cattle diets
increases the PUFA concentration of muscle which decreases lipid and myoglobin stability in
fresh meat. Furthermore, processing techniques can reduce color and lipid stability.
Comminution increases susceptibility to lipid oxidation by disrupting the phospholipid
membranes and further exposing them to oxygen which can in turn act on the muscle pigments to
reduce color stability. Cooking further promotes lipid oxidation by the release of both free and
heme iron from myoglobin. However, little work has been conducted on the impact of animal
diet on raw and cooked ground beef characteristics. The use of antioxidants, whether dietary or
postmortem, is essential to counterbalance the negative impacts of diet and processing technique
on the shelf life. Therefore, the objectives of these studies are to determine the impact of feeding
ethanol co-products to cattle and the effect of dietary and postmortem antioxidants on the shelf
life of raw and cooked ground beef and to determine if dietary or postmortem antioxidants can
counteract any negative impacts of feeding distillers grains on shelf life
26
3. Materials and Methods
3.1 Dietary Treatments and Product Collection
In the first study, heifers (n=64) were randomly assigned to a 2 X 2 factorial dietary
treatments that included 0.91 or 2.27 kg of wet distillers grains (WDGS) during the winter
backgrounding phase and finished with a corn based diet with either corn gluten feed (Sweet
Bran®; Cargill, Minneapolis, MN) or modified wet distillers grains (WDGS) included (40% dry
matter basis; DM). All cattle were supplemented with modified wet distillers grains (MDGS) at
a rate of 0.6% of BW during the summer months. After commercial harvest and grading, USDA
Choice beef shoulder clods (IMPS # 114; NAMP, 2007) were vacuum-packed, transported to
Loeffel Meat Laboratory at the University of Nebraska-Lincoln and stored at 2°C until
processing. A total of 16 shoulder clods from the right side of carcasses were collected
representing four shoulder clods from each dietary treatment group.
In the second study, cattle (n=100) were randomly assigned to one of five 106-day
finishing diets; corn-based diet with no WDGS (control), wet distillers grains (WDGS, 30% dry
matter basis), WDGS + 1000 IU/hd/d vitamin E, WDGS + 3 g/hd/d Agrado Plus, or WDGS +
500 IU/hd/d vitamin E + 3 g/hd/d Agrado Plus. At the conclusion of the finishing phase, cattle
were harvested at commercial abattoir. Forty-eight h post-harvest, seven USDA Choice beef
shoulder clods (IMPS # 114; NAMP, 2007) from each dietary treatment group were collected
from the right side of carcasses, vacuum packaged, and shipped to the University of Nebraska-
Lincoln Loeffel Meat Laboratory.

27
3.2 Beef Link Manufacture
On d 14 postmortem, subcutaneous fat and lean samples were taken from each shoulder
clod on the ventral end from the triceps brachii muscle for fatty acid analysis. Each shoulder
clod was independently ground through a 1.27 cm plate and then through a 0.476 cm plate
(Model 4732, Hobart; Troy, OH), a composite sample taken for fatty acid analysis, and the
remainder was weighed into 2.27 kg batches. All treatments contained 0.75% salt, 0.25%
sodium phosphate (Brifisol 85 instant, BK Giulini Corp., Simi Valley, CA). In the first study,
three 2.27 kg batches were weighed and 0%, 0.13% or 0.20% rosemary and green tea natural
plant extract (FORTIUM RGT12 Plus Dry Natural Plant Extract; Kemin, Des Moines, IA) was
added in addition to salt and phosphate. Beef and non-meat ingredients were mixed for 1 min
and the mixture was stuffed into 22 mm diameter skinless links using a hydraulic piston stuffer
(Talsa H31P, Talsabell S.A., Valencia, Spain) and Colosimo press (model 200,Gale Colosimo
Seasoning Co., South Salt Lake, UT). After cooking, links were placed in individual foil trays
for each shoulder clod and cooked to an internal temperature of 71 °C. Links were placed in
oxygen impermeable zip-top bags (Ziploc® Storage Bags, 1 Gallon, S. C. Johnson, Racine,
Wisconsin) and placed in either dark refrigerated storage at 2°C or dark frozen storage at -20°C.
3.3 Beef Patty Manufacture and Simulated Retail Display
On d 14, each shoulder clod was independently ground, 113-g patties were formed using
a hand operated hamburger press, placed on styrofoam trays, overwrapped with permeable
oxygen polyvinyl chloride wrap (Prime Source Meat Film, Prime Source Sanitary Supply, St.
George, UT) and placed under simulated retail display. Beef patties (first study - two full patties
for color analysis, ten patties for TBARS, per sample; second study – two full patties for color
28
analysis, six, ½ patties for TBARS, per sample) were packaged on Styrofoam trays (13.3 × 25.6
× 1.4 cm, Styro-Tech, Denver, CO), overwrapped with oxygen permeable polyvinyl chloride
film (Prime Source Meat Film, Prime Source Sanitary Supply, St. George, UT) and placed on a
table in a cooler maintained at 0 to 2°C under continuous 1,000 to 1,800 Lux warm white
fluorescence lighting (PHILIPS F32T8/TL741 ALTO 700 Series, 32 WATT B7, Royal Philips
Electronics, Amsterdam, Netherlands) to provide simulated retail display conditions.
3.4 Proximate Analysis
Moisture and total fat of pulverized raw meat samples were determined. Two g of
pulverized tissue in duplicate were used to quantify moisture and ash using a LECO thermo-
gravimetric analyzer (LECO Corporation, model 604- 100- 400, St. Joseph, MI). Total fat was
determined as outlined by AOAC (1990) using the Soxhlet extraction procedure.
3.5 Objective color evaluation
The patty color was measured with a colorimeter (Chroma Meter CR-400; Konica
Minolta Sensing Americas, Inc., Ramsey, NJ) using a 2° standard observer and a D65 illuminant.
The calibration plate was read through polyvinyl chloride overwrap film since patties were still
within the packaging during the color measurement. The color of the two patties at three
locations each was measured and the resulting measurements were averaged for each sample.
Color values were collected for L*, a*, and b*. Color was measured on d 0, 0.5, 1, 2, 3, 5, and 6,
and for the first study and on d 0, 1, 2, 3, 4, 5, 6, and 7 for the second study.

29
3.6 Subjective color evaluation
A five-person trained panel composed of graduate students of the Department of Animal
Science at University of Nebraska-Lincoln subjectively evaluated the percentage discoloration
every day. Discoloration was evaluated as percentage surface discoloration ranging from 0 to
100%. Subjective color was evaluated every 24 h for 7 d, with the exception of d 4 on the first
study.
3.7 Lipid Oxidation
The 2-thiobarbuteric acid reactive substance assay (TBARS) described by Ahn et al.
(1998), which was a modification of the TBARS assay developed by Beuge and Aust (1978),
was used to measure the oxidation status of refrigerated and frozen cooked, ground, beef links
and fresh ground beef patties over storage time. Refrigerated links TBARS measurements were
taken every 3 d for 18 d, beginning at d 0. Frozen links TBARS measurements were taken every
28 d for 252 d, beginning at d 0.
Fourteen mL of deionized, distilled water and 1 mL of butylated hydroxyanisole solution
(10% BHA in 90% ethanol) were added to 5 g of pulverized sample. After homogenizing for 15
s using a Polytron (POLYTRON®
Kinimatica CH-6010, Switzerland), the homogenate was
centrifuged for 2000 × g for 5 m. One mL of homogenate was mixed with 2 mL of 2-
thiobarbituric acid and trichloroacetic acid mixture (15% TCA (w/v) and 20 nM TBA in
deionized distilled H20) and vortexed for 5 sec. The sample mixture was incubated at 70°C in a
water bath for 30 min to develop color. After samples were cooled in a cold-water bath for 10
m, the sample mixture was centrifuged at 2,000 × g for 15 m. Duplicate 200 μL aliquots of each
sample were transferred into wells on a 96-well plate and the absorbance was read at 540 nm to

30
calculate the mg of malonaldehyde per kg of tissue using 1,1,3,3-tetraethoxypropane as the
standard solution.
3.8 Fatty Acid Analysis
Total lipid was extracted following the chloroform-methanol procedure of Folch et al.
(1957). After extraction, the lipids were converted to fatty acid methyl esters according to
Morrison and Smith (1964) and Metcalfe et al. (1966). Following dicing, each frozen fat,
composite, and lean portion of each shoulder clod was dipped in liquid nitrogen and macerated
using a Waring commercial blender (Model 51BL32, Waring Commercial, Torrington, CT).
Powdered samples were stored at -80°C until analysis. Each fatty acid was determined by gas
chromatography (GC) after fat extraction from samples followed by formation of methyl esters
of fatty acids. Powdered lean, composite, and fat samples (one gram for lean and composite, 0.1
g for fat) were dissolved in 5 mL of 2:1 chloroform:methanol (v/v) to extract the lipid fraction
after vortexing for 5 s and letting them stand for 1 h at room temperature. The homogenate was
filtered through Watman #2 filter paper into a 13 × 150 mm screw-cap tube and the final volume
was brought up to 10 mL with 2:1 chloroform:methanol mix. Then, 2 mL of 0.74% KCl solution
was added to the lipid extract and vortexed for 5 s to separate extracted proteins. Samples were
centrifuged at 1000 × g for 5 m. Following centrifugation, the aqueous layer was aspirated and
evaporated to dryness under nitrogen at 60°C (Folch et al., 1957). Then, 0.5 mL of 0.5 M NaOH
in methanol was added, vortexed again for 5 s and heated for 5 m at 100°C under nitrogen for
saponification. To methylate the fatty acids, 0.5 mL of boron triflouride in 14% methanol was
added and heated for 5 m at 100°C to methylate the fatty acids (Metcalfe et al., 1966). One mL
of saturated salt solution and 1 mL of hexane were added and vortexed for 5 s. Following
centrifugation at 1,000 × g for 5 min, the hexane layer was removed and placed in a gas

31
chromatography (GC) vial. Sample containing fatty acids in the GC vial was purged with
nitrogen, capped and stored at -80°C until the sample was read on a Hewlett-Packard Gas
Chromatograph (Agilent Technologies, model 5890A series, Santa Clara, CA) attached to a
Hewlett-Packard Autosampler (Agilent Technologies, model 6890A series, Santa Clara, CA).
Total fatty acids converted to methyl esters were separated on a fused silica column (Chrompack
CP-Sil 88; 0.25 mm × 100 m, Santa Clara, CA), which was placed in an oven programmed from
140°C for 10 m to 220°C at a rate of 2°C/m and held at 220°C for 20 m. Total run time was 70
m. The injector and detector were programmed to work at 270°C and 300°C, respectively. Each
lipid extract was separated into fatty acids by using helium as the carrier gas at a flow rate of 1
mL/m. Individual fatty acids of each sample were determined by comparison of retention times
with known standards. Each standard contained known fatty acids that were ran through gas
chromatography at the same time as the samples in order to provide a reference point to identify
fatty acids in the sample. Each fatty acid was expressed as weight percentage value, which were
relative proportions of all peaks observed by gas chromatography.
3.9 Statistical Analysis
For the first study, data for cooked link TBARS were analyzed as a 2 × 2 × 3 factorial
(backgrounding diet × finishing diet × antioxidant) using the PROC GLIMMIX procedure of
SAS (SAS Inst. Inc., Cary, NC USA) with repeated measures (day) where applicable. Cooked
link TBARS were analyzed as a 2 × 2 factorial using the PROC GLIMMIX procedure of SAS
with repeated measures to specifically observe effects of diet on TBARS. Data for raw patty
TBARS proximate analysis, objective color and percent discoloration were analyzed as a 2 × 2
factorial using the PROC GLIMMIX procedure of SAS with repeated measures (day) where

32
applicable. Fatty acid data analysis was conducted as a 2 × 2 factorial using the PROC
GLIMMIX procedure of SAS.
For the second study, data for TBARS (refrigerated, frozen and raw patty), fatty acid
analysis, proximate analysis, objective color and percent discoloration were analyzed for
treatment (dietary antioxidant or corn control) main effects using the PROC GLIMMIX
procedure of SAS (SAS Inst. Inc., Cary, NC USA) with day as repeated measures when traits
were measured over time.
All means were separated utilizing the LSMEANS and PDIFF option when level of
significance indicated by ANOVA was P < 0.05.
33
4. Literature Cited
Ahn, D. U., Olson, D. G., Jo, C., Chen, X., Wu, C., & Lee, J. I. (1998). Effect of muscle type,
packaging, and irradiation on lipid oxidation, volatile production, and color in raw pork
patties. Meat Science, 49(1), 27-39.
Ahn, J., Grün, I., & Fernando, L. (2002). Antioxidant properties of natural plant extracts
containing polyphenolic compounds in cooked ground beef. Journal of Food Science,
67(4), 1364-1369.
Alderton, A., Faustman, C., Liebler, D., & Hill, D. (2003). Induction of redox instability of
bovine myoglobin by adduction with 4-hydroxy-2-nonenal. Biochemistry, 42(15), 4398-
4405.
American Meat Institute Foundation, (1960). The Science of Meat and Meat Products. San
Francisco and London: W.H. Freeman and Company.
American Meat Science Association (AMSA), (2014). Meat color measurements guide.
Champaign, Illinois: American Meat Science Association.
AOAC. 1990. Official Methods of Analysis. 15th
ed. Association of Analytic Committees.,
Arlington, VA.
Arnold, R. N., Scheller, K. K., Arp, S. C., Williams, S. N., Buege, D. R., & Schaefer, D. M.
(1992). Effect of long- or short-term feeding of alpha-tocopheryl acetate to Holstein and
crossbred beef steers on performance, carcass characteristics, and beef color stability.
Journal of Animal Science, 70(10), 3055-3065.
Atkinson, J., & Follett, M. (1973). Biochemical studies on the discoloration of fresh meat.
International Journal of Food Science and Technology, 8(1), 51-58.
Ayala, A., Muñoz, M., and Argüelles, S. (2014). Lipid Peroxidation: Production, Metabolism,
and Signaling Mechanisms of Malondialdehyde and 4-Hydroxy-2-Nonenal. Oxidative
Medicine and Cellular Longevity. 2014. 1-31.
Balentine, C. W., Crandall, P. G., O’Bryan, C. A., Duong, D. Q., & Pohlman, F. W. (2006). The
pre-and post-grinding application of rosemary and its effects on lipid oxidation and color
during storage of ground beef. Meat Science, 73(3), 413-421.
Bartov, I., Basker, D., & Angel, S. (1983). Effect of dietary vitamin E on the stability and
sensory quality of turkey meat. Poultry Science, 62(7), 1224-1230.
Baumy, J., & Brule, G. (1988). Effect of pH and ionic strength on the binding of bivalent cations
to β-casein. Le lait, 68(4), 409-417.
34
Bedinghaus, A. J., & Ockerman, H. W. (1995). Antioxidative Maillard reaction products from
reducing sugars and free amino acids in cooked ground pork patties. Journal of Food
Science, 60(5), 992-995.
Bekhit, A., & Faustman, C. (2005). Metmyoglobin reducing activity. Meat Science, 71(3), 407-
439.
Berger, L., & Singh, V. (2010). Changes and evolution of corn coproducts for beef cattle.
Journal of Animal Science, 88(13), E143-150.
Berges, E. (1999). Importance of vitamin E in the oxidative stability of meat: organoleptic
qualities and consequences. Cahiers Options Méditerranéennes (CIHEAM).
Bloomberg, B., Hilton, G., Hanger, K., Richards, C., Morgan, J., & VanOverbeke, D. (2011).
Effects of vitamin E on color stability and palatability of strip loin steaks from cattle fed
distillers grains. Journal of Animal Science, 89(11), 3769-3782.
Braughler, J. M., Duncan, L. A., & Chase, R. L. (1986). The involvement of iron in lipid
peroxidation. Importance of ferric to ferrous ratios in initiation. Journal of Biological
Chemistry, 261(22), 10282-10289.
Brooks, J. (1938). Color of meat. Journal of Food Science, 3(1‐2), 75-78.
Buckner, C., Vanness, S., Erickson, G., Klopfenstein, T., & Benton, J. (2008). Sampling wet
distillers grains plus solubles to determine nutrient variability. University of Nebraska
Beef Reports. 126-127. Available online: http://beef.unl.edu/nebeefreport2008. Accessed:
7 Feb, 2015.
Buege, J., & Aust, S. (1978). The thiobarbituric acid assay. Methods in Enzymology, 52, 306-
307.
Chipault, J., Mizuno, G., Hawkins, J., & Lundberg, W. (1952). The antioxidant properties of
natural spices. Journal of Food Science, 17(1‐6), 46-55.
Choat, W., Brooks, J., Krehbiel, C., Nelson, J., Gill, D., Morgan, J., & McDowell, L. (2002).
Effect of Supplementing AGRADO® Antioxidant (AOX) on Feedlot Performance and
Carcass Characteristics of Beef Steers and Shelf-Life of Beef. Oklahoma State Animal
Science Research Reports. Available online: http://ansi.okstate.edu. Accessed: 11 Feb,
2015.
Christie, W. W. (1978). The composition, structure and function of lipids in the tissues of
ruminant animals. Progress in Lipid Research, 17(2), 111-205.
Clydesdale, F. M., & Francis, F. J. (1972). Color measurement of foods. xXVII. The chemistry
of meat color. Food Product Development. 581.

35
Davis, K. (2001). Corn milling, processing and generation of co-products. Proceedings of the
62nd Minnesota Nutrition Conference Minnesota Corn Growers Association Technical
Symposium, Bloomington, MN. 1-7. Available online at http://ddgs.umn.edu. Accessed:
05 Feb 2015
Decker, E., & Mei, L. (1996). Antioxidant mechanisms and applications in muscle foods.
Proceedings of 49th Reciprocal Meat Conference, American Meat Science Association,
Kansas City, MO.
Depenbusch, B., Coleman, C., Higgins, J., & Drouillard, J. (2009). Effects of increasing levels of
dried corn distillers grains with solubles on growth performance, carcass characteristics,
and meat quality of yearling heifers. Journal of Animal Science, 87(8), 2653-2663.
Descalzo, A. M., Insani, E. M., Biolatto, A., Sancho, A. M., García, P. T., Pensel, N. A., &
Josifovich, J. A. (2005). Influence of pasture or grain-based diets supplemented with
vitamin E on antioxidant/oxidative balance of Argentine beef. Meat Science, 70(1), 35-
44.
Descalzo, A. M., & Sancho, A. M. (2008). A review of natural antioxidants and their effects on
oxidative status, odor and quality of fresh beef produced in Argentina. Meat Science,
79(3), 423-436.
Díaz, M., & Decker, E. A. (2004). Antioxidant mechanisms of caseinophosphopeptides and
casein hydrolysates and their application in ground beef. Journal of Agricultural and
Food Chemistry, 52(26), 8208-8213.
Enser, M. (1987). What is lipid oxidation? Food Science and Technology Today, 1, 151-153.
Esterbauer, H. (1993). Cytotoxicity and genotoxicity of lipid-oxidation products. The American
Journal of Clinical Nutrition, 57(5), 779S-785S.
Esterbauer, H., Dieber-Rotheneder, M., Waeg, G., Striegl, G., & Juergens, G. (1990).
Biochemical structural and functional properties of oxidized low-density lipoprotein.
Chemical Research in Toxicology, 3(2), 77-92.
Faustman, C., & Cassens, R. (1991). The effect of cattle breed and muscle type on discoloration
and various biochemical parameters in fresh beef. Journal of Animal Science, 69(1), 184-
193.
Faustman, C., Cassens, R., Schaefer, D., Buege, D., & Scheller, K. (1989). Vitamin E
supplementation of Holstein steer diets improves sirloin steak color. Journal of Food
Science, 54(2), 485-486.
Faustman, C., Sun, Q., Mancini, R., & Suman, S. P. (2010). Myoglobin and lipid oxidation
interactions: Mechanistic bases and control. Meat Science, 86(1), 86-94.
36
Folch, J., Lees, M., & Stanley, G., 1957. A simple method for the isolation and purification of
total lipids from animal tissues. Journal of Biological Chemistry. 226:497-509
Formanek, Z., Kerry, J. P., Higgins, F. M., Buckley, D. J., Morrissey, P. A., & Farkas, J. (2001).
Addition of synthetic and natural antioxidants to α-tocopheryl acetate supplemented beef
patties: effects of antioxidants and packaging on lipid oxidation. Meat Science, 58(4),
337-341.
Formanek, Z., Lynch, A., Galvin, K., Farkas, J., & Kerry, J. (2003). Combined effects of
irradiation and the use of natural antioxidants on the shelf-life stability of overwrapped
minced beef. Meat Science, 63(4), 433-440.
Forrest, J. C., Aberle, E.D., Gerrard, D.E., & Mills, E.W. (2012). Fresh Meat Color. Principles of
Meat Science: W.H. Freeman and Company.
George, P., & Stratmann, C. (1952). The oxidation of myoglobin to metmyoglobin by oxygen. 1.
Biochemical Journal, 51(1), 103.
Gheisari, H. R. (2011). Correlation between acid, TBA, peroxide and iodine values, catalase and
glutathione peroxidase activities of chicken, cattle and camel meat during refrigerated
storage. Veterinary World, 4(4), 153-157.
Gill, R., VanOverbeke, D., Depenbusch, B., Drouillard, J., & DiCostanzo, A. (2008). Impact of
beef cattle diets containing corn or sorghum distillers grains on beef color, fatty acid
profiles, and sensory attributes. Journal of Animal Science, 86(4), 923-935.
Govaris, A., Botsoglou, N., Papageorgiou, G., Botsoglou, E., & Ambrosiadis, I. (2004). Dietary
versus post-mortem use of oregano oil and/or α-tocopherol in turkeys to inhibit
development of lipid oxidation in meat during refrigerated storage. International Journal
of Food Sciences and Nutrition, 55(2), 115-123.
Greene, B. E., & Cumuze, T. H. (1982). Relationship between TBA numbers and inexperienced
panelists’ assessments of oxidized flavor in cooked beef. Journal of Food Science, 47(1),
52-54.
Grunwald, E. W., & Richards, M. P. (2006). Mechanisms of heme protein-mediated lipid
oxidation using hemoglobin and myoglobin variants in raw and heated washed muscle.
Journal of Agricultural and Food Chemistry, 54(21), 8271-8280.
Han, D., McMillin, K., Godber, J., Bidner, T., Younathan, M., Marshall, D., & Hart, L. (1993).
Iron distribution in heated beef and chicken muscles. Journal of Food Science, 58(4),
697-700.
Hashimoto, T., Kumazawa, S., Nanjo, F., Hara, Y., & Nakayama, T. (1999). Interaction of tea
catechins with lipid bilayers investigated with liposome systems. Bioscience,
Biotechnology, and Biochemistry, 63(12), 2252-2255.
37
Huang, W. H., & Greene, B. E. (1978). Effect of cooking method on TBA numbers of stored
beef. Journal of Food Science, 43(4), 1201-1203.
Hunt, M., & Hedrick, H. (1977). Chemical, physical and sensory characteristics of bovine
muscle from four quality groups. Journal of Food Science, 42(3), 716-720.
Ingold, K. (1962). Metal catalysis. Proceedings the Symposium on foods: Lipids and their
oxidation. (pp. 93-98). Westport, CT: Avi Publishing Co.
Janero, D. R. (1990). Malondialdehyde and thiobarbituric acid-reactivity as diagnostic indices of
lipid peroxidation and peroxidative tissue injury. Free Radical Biology and Medicine,
9(6), 515-540.
Jo, C., & Ahn, D. (1998). Fluorometric analysis of 2-thiobarbituric acid reactive substances in
turkey. Poultry Science, 77(3), 475-480.
Klopfenstein, T. J., Erickson, G. E., & Bremer, V. R. (2008). Board-Invited Review: Use of
distillers by-products in the beef cattle feeding industry. Journal of Animal Science,
86(5), 1223-1231.
Koger, T., Wulf, D., Weaver, A., Wright, C., Tjardes, K., Mateo, K., & Smart, A. (2010).
Influence of feeding various quantities of wet and dry distillers grains to finishing steers
on carcass characteristics, meat quality, retail-case life of ground beef, and fatty acid
profile of longissimus muscle. Journal of Animal Science, 88(10), 3399-3408.
Krumsiek, C., & Owens, F. (1998). Agrado™ for finishing cattle: Effect on shelf life of beef.
Oklahoma Agriculture Experimental Station Research Report P-965, 16-20. Available
online: http://ansi.okstate.edu. Accessed: 11 Feb, 2015.
Ladikos, D., & Lougovois, V. (1990). Lipid oxidation in muscle foods: A review. Food
Chemistry, 35(4), 295-314.
Lanari, M., & Cassens, R. (1991). Mitochondrial activity and beef muscle color stability. Journal
of Food Science, 56(6), 1476-1479.
Lanari, M., Cassens, R., Schaefer, D., & Scheller, K. (1994). Effect of dietary vitamin E on
pigment and lipid stability of frozen beef: a kinetic analysis. Meat Science, 38(1), 3-15.
Larson, E. M., Stock, R. A., Klopfenstein, T. J., Sindt, M. H., & Huffman, R. P. (1993). Feeding
value of wet distillers byproducts for finishing ruminants. Journal of Animal Science
71(2228). Available online at http://ddgs.umn.edu. Accessed: 4 Feb 2015
Lawrence, T. E., Dikeman, M. E., Hunt, M. C., Kastner, C. L., & Johnson, D. E. (2003). Effects
of calcium salts on beef longissimus quality. Meat Science, 64(3), 299-308.
38
Lawrence, T., Dikeman, M., Hunt, M., Kastner, C., & Johnson, D. (2004). Effects of enhancing
beef longissimus with phosphate plus salt, or calcium lactate plus non-phosphate water
binders plus rosemary extract. Meat Science, 67(1), 129-137.
Lawrie, R. A. (1998). Lawrie's Meat Science (6 ed.). Cambridge: Woodhead Publishing Ltd.
Ledward, D. A., & Shorthose, W. (1971). A note on the haem pigment concentration of lamb as
influenced by age and sex. Animal Production, 13, 193-195.
Liu, Q., Lanari, M. C., & Schaefer, D. M. (1995). A review of dietary vitamin E supplementation
for improvement of beef quality. Journal of Animal Science, 73(10), 3131-3140.
Livingston, D. J., & Brown, W. D. (1981). The chemistry of myoglobin and its reactions [Meat
pigments, food quality indices]. Food Technology, 35(5), 244.
Maddock, R., Wulf, D., & McKenna, D. (2003). The effect of ethoxyquin and vitamin E
supplementation on the display life of beef steaks. Journal of Food Science, 68(3), 1072-
1074.
Madhavi, D., & Carpenter, C. E. (1993). Aging and processing affect color, metmyoglobin
reductase and oxygen consumption of beef muscles. Journal of Food Science, 58(5), 939-
942.
Maestre, R., Pazos, M., Iglesias, J., & Medina, I. (2009). Capacity of reductants and chelators to
prevent lipid oxidation catalyzed by fish hemoglobin. Journal of Agricultural and Food
Chemistry, 57(19), 9190-9196.
Mancini, R., & Hunt, M. (2005). Current research in meat color. Meat Science, 71(1), 100-121.
McCarthy, T., Kerry, J., Kerry, J., Lynch, P., & Buckley, D. (2001). Evaluation of the
antioxidant potential of natural food/plant extracts as compared with synthetic
antioxidants and vitamin E in raw and cooked pork patties. Meat Science, 58(1), 45-52.
McKenna, D., Mies, P., Baird, B., Pfeiffer, K., Ellebracht, J., & Savell, J. (2005). Biochemical
and physical factors affecting discoloration characteristics of 19 bovine muscles. Meat
Science, 70(4), 665-682.
Mello, A., Calkins, C., Jenschke, B., Carr, T., Dugan, M., & Erickson, G. (2012). Beef quality of
calf-fed steers finished on varying levels of corn-based wet distillers grains plus solubles.
Journal of Animal Science, 90(12), 4625-4633.
Metcalfe, L., Schmitz, A., & Pelka, J. 1966. Rapid penetration of fatty acid esters from lipids for
gas chromatographic analysis. Analytical Chemistry, 38, 514-515.

39
Min, B., Nam, K., Cordray, J., & Ahn, D. (2008). Endogenous factors affecting oxidative
stability of beef loin, pork loin, and chicken breast and thigh meats. Journal of Food
Science, 73(6), C439-C446.
Mitsumoto, M., O’Grady, M. N., Kerry, J. P., & Buckley, D. J. (2005). Addition of tea catechins
and vitamin C on sensory evaluation, colour and lipid stability during chilled storage in
cooked or raw beef and chicken patties. Meat Science, 69(4), 773-779.
Morrison, W. & Smith, L. 1964. Preparation of fatty acid methyl esters and dimethylacetals
from lipids with boron fluoride-methanol. Journal of Lipid Research, 5, 600-608.
Murphy, A., Kerry, J. P., Buckley, J., & Gray, I. (1998). The antioxidative properties of
rosemary oleoresin and inhibition of off‐flavours in precooked roast beef slices. Journal
of the Science of Food and Agriculture, 77(2), 235-243.
Narciso-Gaytán, C., Shin, D., Sams, A., Keeton, J., Miller, R., Smith, S., & Sánchez-Plata, M.
(2010). Dietary lipid source and vitamin E effect on lipid oxidation stability of
refrigerated fresh and cooked chicken meat. Poultry Science, 89(12), 2726-2734.
Naveena, B. M., Muthukumar, M., Sen, A. R., Praveen Kumar, Y., & Kiran, M. (2014). Use of
cinnamaldehyde as a potential antioxidant in ground spent hen meat. Journal of Food
Processing and Preservation, 38(4), 1911-1917.
O'Grady, M., Monahan, F., & Brunton, N. (2001). Oxymyoglobin oxidation and lipid oxidation
in bovine muscle—mechanistic studies. Journal of Food Science, 66(3), 386-392.
O'Keefe, M., & Hood, D. (1982). Biochemical factors influencing metmyoglobin formation on
beef from muscles of differing colour stability. Meat Science, 7(3), 209-228.
Pearson, A., Love, J. D., & Shorland, F. (1977). “Warmed-over” flavor in meat, poultry, and
fish. Advances in Food Research, 23, 1-74.
Pokorný, J. (1991). Natural antioxidants for food use. Trends in Food Science & Technology, 2,
223-227.
Ranken, M. (1987). Use of antioxidants in meat and meat products. Food Science and
Technology Today, 1, 166-181.
Reddy, L. M., & Carpenter, C. E. (1991). Determination of metmyoglobin reductase activity in
bovine skeletal muscles. Journal of Food Science, 56(5), 1161-1164.
Renerre, M. T. (1990). Factors involved in the discoloration of beef meat. International Journal
of Food Science and Technology, 25(6), 613-630.
Renewable Fuels Association (RFA), (2015). Statistics. Retrieved Jan. 15, 2015, from
http://www.ethanolrfa.org/pages/statistics
40
Richards, M. P., Modra, A. M., & Li, R. (2002). Role of deoxyhemoglobin in lipid oxidation of
washed cod muscle mediated by trout, poultry and beef hemoglobins. Meat Science,
62(2), 157-163.
Rickansrud, D., & Henrickson, R. (1967). Total pigments and myoglobin concentration in four
bovine muscles. Journal of Food Science, 32(1), 57-61.
Roedig-Penman, A., & Gordon, M. H. (1997). Antioxidant properties of catechins and green tea
extracts in model food emulsions. Journal of Agricultural and Food Chemistry, 45(11),
4267-4270.
Rojas, M. C., & Brewer, M. S. (2007). Effect of Natural Antioxidants on Oxidative Stability of
Cooked, Refrigerated Beef and Pork. Journal of Food Science, 72(4), S282-S288.
Roux, S., Petit, M., Baeza, E., Bastianelli, D., Tillard, E., & Arnaud, E. (2014). Kinetics of
malonaldehyde content in enriched chicken meat during isothermal cooking. European
Journal of Lipid Science and Technology, 116(2), 153-159.
Sales, J., & Koukolová, V. (2011). Dietary vitamin E and lipid and color stability of beef and
pork: Modeling of relationships. Journal of Animal Science, 89(9), 2836-2848.
Sammel, L., Hunt, M., Kropf, D., Hachmeister, K., & Johnson, D. (2002a). Comparison of
assays for metmyoglobin reducing ability in beef inside and outside semimembranosus
muscle. Journal of Food Science, 67(3), 978-984.
Sammel, L., Hunt, M., Kropf, D., Hachmeister, K., Kastner, C., & Johnson, D. (2002b).
Influence of chemical characteristics of beef inside and outside semimembranosus on
color traits. Journal of Food Science, 67(4), 1323-1330.
Sato, K., & Hegarty, G. R. (1971). Warmed‐over flavor in cooked meats. Journal of Food
Science, 36(7), 1098-1102.
Schultz, H., & Sinnhuber, R. (1962). Proceedings of the Symposium on Foods: Lipids and Their
Oxidation. Westport, CT: Avi Publishing Co.
Sebranek, J., Sewalt, V., Robbins, K., & Houser, T. (2005). Comparison of a natural rosemary
extract and BHA/BHT for relative antioxidant effectiveness in pork sausage. Meat
Science, 69(2), 289-296.
Seideman, S., Cross, H., Smith, G., & Durland, P. (1984). Factors associated with fresh meat
color: a review. Journal of Food Quality, 6(3), 211-237.
Shahidi, F., & Zhong, Y. (2005). Antioxidants: regulatory status. Bailey's Industrial Oil and Fat
Products. 491-512. Volume 1. John Wiley and Sons, New York, NY.
41
Sheldon, B., Curtis, P., Dawson, P., & Ferket, P. (1997). Effect of dietary vitamin E on the
oxidative stability, flavor, color, and volatile profiles of refrigerated and frozen turkey
breast meat. Poultry Science, 76(4), 634-641.
Singh, H., & Fox, P. (1995). Heat-induced changes in casein, including interactions with whey
proteins. Heat-induced changes in milk. (Ed. 2), 86-104.
Steinberg, D., Parthasarathy, S., Carew, T. E., Khoo, J. C., & Witztum, J. L. (1989). Beyond
Cholesterol. New England Journal of Medicine, 320(14), 915-924.
St Angelo, A., Vercellotti, J., Legendre, M., Vinnel T., Kuan, J., James, C., & Dupuy, H. (1987).
Chemical and Instrumental Analyses of Warmed‐Over Flavor in Beef. Journal of Food
Science, 52(5), 1163-1168.
Stock, R., Lewis, J., Klopfenstein, T. J., & Milton, C. (1999). Review of new information on the
use of wet and dry milling feed by-products in feedlot diets. Proceeding of the American
Society of Animal Science meetings. Available online at
http://digitalcommons.unl.edu/animalscifacpub. Accessed 5 Mar 2015.
Strange, E. D., Benedict, R. C., Gugger, R. E., Metzger, V. G., & Swift, C. E. (1974). Simplified
methodology for measuring meat color. Journal of Food Science, 39(5), 988-992.
Suman, S. P., Faustman, C., Stamer, S. L., & Liebler, D. C. (2007). Proteomics of lipid
oxidation-induced oxidation of porcine and bovine oxymyoglobins. Proteomics, 7(4),
628-640.
Tang, J., Faustman, C., Hoagland, T. A., Mancini, R. A., Seyfert, M., & Hunt, M. C. (2005).
Postmortem oxygen consumption by mitochondria and its effects on myoglobin form and
stability. Journal of Agricultural and Food Chemistry, 53(4), 1223-1230.
Tang, S., Kerry, J. P., Sheehan, D., Buckley, D. J., & Morrissey, P. A. (2001). Antioxidative
effect of added tea catechins on susceptibility of cooked red meat, poultry and fish patties
to lipid oxidation. Food Research International, 34(8), 651-657.
Topel, D., Merkel, R., Mackintosh, D., & Hall, J. (1966). Variation of some physical and
biochemical properties within and among selected porcine muscles. Journal of Animal
Science, 25(2), 277-282.
Urbin, M., & Wilson, G. (1958) Fresh Meat Characteristics which Influence Packaging
Requirements. Proceedings of the 10th Research Conference, American Meat Institute
Foundation, Chicago, 13-20
Vander Pol, K., Erickson, G., Klopfenstein, T., Greenquist, M., & Robb, T. (2006). Effect of
dietary inclusion of wet distillers grains on feedlot performance of finishing cattle and
energy value relative to corn.

42
Vander Pol, K., Luebbe, M. K., Crawford, G., Erickson, G. E., & Klopfenstein, T. J. (2009).
Performance and digestibility characteristics of finishing diets containing distillers grains,
composites of corn processing coproducts, or supplemental corn oil. Journal of Animal
Science, 87(2), 639-652.
Walenciak, C., Gardner, B., Dolezal, H., & Owens, F. (1999). Effects of including Agrado in
finishing diets for beef cattle in retail case-life of ground beef and top loin steaks.
Oklahoma Agriculture Experimental Station Research Report P-973, 67-71. Available
online at http://ansi.okstate.edu. Accessed: 15 Feb 2014
Wittenberg, B., Wittenberg, J., & Caldwell, P. (1975). Role of myoglobin in the oxygen supply
to red skeletal muscle. Journal of Biological Chemistry, 250(23), 9038-9043.
Wittenberg, J. B., & Wittenberg, B. A. (2003). Myoglobin function reassessed. Journal of
Experimental Biology, 206(12), 2011-2020.
Wong, D. (1989). Mechanism and Theory in Food Chemistry. New York, New York: Van
Nostrand Reinhold.
Wu, J., Lee, M., Ho, C., & Chang, S. (1982). Elucidation of the chemical structures of natural
antioxidants isolated from rosemary. Journal of the American Oil Chemists’ Society,
59(8), 339-345.
Yin, M., & Faustman, C. (1994). The influence of microsomal and cytosolic components on the
oxidation of myoglobin and lipid in vitro. Food Chemistry, 51(2), 159-164.
Yu, L., Scanlin, L., Wilson, J., & Schmidt, G. (2002). Rosemary extracts as inhibitors of lipid
oxidation and color change in cooked turkey products during refrigerated storage.
Journal of Food Science, 67(2), 582-585.
Zakrys, P., Hogan, S., O’Sullivan, M., Allen, P., & Kerry, J. (2008). Effects of oxygen
concentration on the sensory evaluation and quality indicators of beef muscle packed
under modified atmosphere. Meat Science, 79(4), 648-655.

43
5. Manuscripts

44
Effect of feeding distillers grains during different phases of production and addition of
postmortem antioxidants on shelf life of ground beef
B.D. Cleveland, J.O. Buntyn, A.L. Redfield, J.C. MacDonald and G.A. Sullivan1
Department of Animal Science, University of Nebraska, Lincoln 68583-0908
A contribution to the University of Nebraska Agriculture Research Division, Lincoln, NE 68583
1Correspondence: [A213 Animal Science; Telephone (402) 472-6430; Fax (402) 472-6362]
Email address: [email protected] (Gary A. Sullivan)
Prepared using the guide for authors for the journal Meat Science

45
ABSTRACT
The objective of this study was to evaluate the impact of feeding distillers grains and added
antioxidants on the shelf life of ground beef products. Heifers were assigned to diets containing
low or high concentrations of wet distillers grains (WDGS) during backgrounding and either
corn gluten feed or modified wet distillers grains (MDGS) during finishing. Four beef shoulder
clods from each dietary group were ground. Raw patties were overwrapped for retail display and
analyzed for lipid oxidation, percent discoloration and objective color. Cooked beef links were
manufactured with salt, phosphate, and a blend of rosemary and green tea extract, stuffed into
links, cooked and lipid oxidation was measured throughout storage. There were no differences
in lipid oxidation of raw patties regardless of diet, yet beef from heifers finished with MDGS
discolored at a greater rate. Increased lipid oxidation in cooked beef links occurred when cattle
were fed WDGS during backgrounding or finishing but antioxidants reduced lipid oxidation
regardless of dietary treatment.
Keywords: ground beef, antioxidant, TBARS, distillers grains, fatty acid
1. Introduction
In 2013 in the United States, 35.5 million metric tons of distillers grains (DGS) were
produced as by-products of the fuel ethanol industry and has increased by nearly 30 million
metric tons annually over the past ten years (RFA, 2014). Each 25.4 kg bushel of corn used in
dry-mill ethanol production generates about 7.89 kg of DGS available for livestock feed (USDA
Economic Research Service, 2012) and beef cattle account for nearly half of DGS consumption
(RFA, 2014). As a result of the rapid growth of the ethanol industry, many cattle producers
include ethanol by-products in cattle diets. Previous research has shown that steaks from cattle
fed WDGS have an increase in PUFA, and have decreased oxidative stability (Depenbush,
46
Coleman, Higgins, & Drouillard, 2009; Jenschke et al., 2008). Furthermore, higher
concentrations of DGS (20% to 40% DM) increased lipid oxidation in ground beef (Koger et al.,
2010).
Lipid oxidation occurs most commonly in polyunsaturated fatty acids (PUFA) that more
readily undergo free-radical chain reactions resulting in deterioration of the lipid. Lipid
oxidation has a positive correlation with color instability (Faustman et al., 1989; Zakrys, Hogan,
O’Sullivan, Allen, & Kerry, 2008). The radicals formed from lipid oxidation could act directly
or indirectly on color pigments to influence color stability (Liu, Lanari, & Schaefer, 1995) and
likewise, pigment oxidation can promote lipid oxidation (Faustman, Sun, Mancini, & Suman,
2010). It is hypothesized that products of unsaturated fatty acid oxidation can bind directly to
myoglobin and lower the redox stability (Faustman et al., 2010). In addition, comminution of
meat products disrupts the phospholipid membranes and allows increased exposure to oxygen,
thus increasing the rate of lipid oxidation (Sato & Hegarty, 1971). Cooking meat increases lipid
oxidation by release of free and heme iron from myoglobin (Greene & Cumuze, 1982). These
processing and cooking techniques reduce shelf life and decrease overall desirability of the
product by increasing "warmed over" or "rancid" flavors. Warmed over flavor is an off flavor
due to secondary products of lipid oxidation found in cooked meats, and typically become
apparent within 48 h at refrigeration temperatures (Forrest, Aberle, Gerrard, Mills, 2012). Prior
to this study, Dierks et al. (2014) were the only ones to look at the impact of distillers grains on
cooked beef, where they observed that supplementation of DGS during backgrounding increased
lipid oxidation compared to cooked beef from non-supplemented cattle.
The use of plant extracts, such as rosemary or green tea, is becoming increasingly popular
in meat processing as natural antioxidants to increase shelf life of cooked meat products. This
47
becomes particularly beneficial for companies seeking use "natural" labeling claims for their
product. Both rosemary and green tea have phenolic compounds that donate the phenolic
hydrogen to quench free radicals formed during lipid oxidation (Tang, Kerry, Sheehan, Buckley,
& Morrissey, 2001).
Therefore, the objectives of this trial were to evaluate the effect of feeding different
concentrations of WDGS during winter backgrounding and either MDGS or corn gluten feed
(Sweet Bran, Cargill®, Blair, NE) during the finishing phase on raw and cooked ground beef and
to evaluate the effectiveness of natural rosemary and green tea extract in the cooked beef
samples.
2. Materials and methods
2.1 Dietary Treatments and Product Collection
Heifers (n=64) were randomly assigned to a 2 X 2 factorial dietary treatments that
included 0.91 or 2.27 kg of wet distillers grains (WDGS) per d during the winter backgrounding
phase and finished on a corn-based diet with either corn gluten feed (40% dry matter basis; DM)
or modified wet distillers grains (WDGS) included (40% DM; Figure 1). All cattle were
supplemented with modified wet distillers grains (MDGS) at a rate of 0.6% of BW during the
summer months. After commercial harvest and grading, untrimmed beef shoulder clods (IMPS #
114; NAMP, 2007) were vacuum-packed, transported to Loeffel Meat Laboratory at the
University of Nebraska-Lincoln and stored at 2°C until processing on d 14. A total of 16
shoulder clods from the right side of carcasses were collected representing four shoulder clods
from each dietary treatment group.

48
2.2 Beef Link Manufacture
On d 14 postmortem, subcutaneous fat and lean samples were taken from the triceps
brachii muscle on the ventral of each shoulder clod for fatty acid analysis. Each shoulder clod
was independently ground through a 1.27 cm plate and then through a 0.476 cm plate (Model
4732, Hobart; Troy, OH), a sample taken for fatty acid analysis, and the remainder was divided
into three 2.27 kg batches. All treatments contained 0.75% salt, 0.25% sodium phosphate
(Brifisol 85 instant, BK Giulini Corp., Simi Valley, CA) and either 0%, 0.13% or 0.20%
rosemary and green tea natural plant extract (FORTIUM RGT12 Plus Dry Natural Plant Extract;
Kemin, Des Moines, IA). Beef and non-meat ingredients were mixed for 1 min and the mixture
was stuffed into 22 mm diameter skinless links using a hydraulic piston stuffer (Talsa H31P,
Talsabell S.A., Valencia, Spain) and Colosimo press (model 200, Gale Colosimo Seasoning Co.,
South Salt Lake, UT). Links were placed in individual foil trays for each shoulder clod and
cooked to an internal temperature of 71 °C. Links were placed in oxygen impermeable zip-top
bags (Ziploc® Storage Bags, 1 Gallon, S. C. Johnson, Racine, Wisconsin) and kept in either dark
refrigerated storage at 2°C or dark frozen storage at -20°C until appropriate sampling days.
2.3 Beef Patty Manufacture and Simulated Retail Display
On d 14 from each ground shoulder clod, twelve, 113-g patties were formed using a 11
cm diameter hand operated hamburger press, placed on styrofoam trays, overwrapped with
permeable oxygen polyvinyl chloride wrap (Prime Source Meat Film, Prime Source Sanitary
Supply, St. George, UT) and placed under simulated retail display for 7 d. Beef patties (two full
patties for color analysis, ten patties for TBARS, per shoulder clod) were packaged on Styrofoam
trays (13.3 × 25.6 × 1.4 cm, Styro-Tech, Denver, CO), overwrapped with oxygen permeable
49
polyvinyl chloride film and placed on a table in a cooler maintained at 0 to 2°C under continuous
1,000 to 1,800 Lux warm white fluorescence lighting (PHILIPS F32T8/TL741 ALTO 700
Series, 32 WATT B7, Royal Philips Electronics, Amsterdam, Netherlands) to provide simulated
retail display conditions.
2.4 Proximate Analysis
Moisture and total fat of pulverized raw meat samples were determined for lean and
composite samples. Two g of pulverized tissue in duplicate were used to quantify moisture and
ash using a LECO thermo-gravimetric analyzer (LECO Corporation, model 604- 100- 400, St.
Joseph, MI). Total fat was determined as outlined by AOAC (1990) using the Soxhlet extraction
procedure.
2.5 Fatty Acid Analysis
Total lipid was extracted following the chloroform-methanol procedure of Folch et al.
(1957). After extraction, the lipids were converted to fatty acid methyl esters according to
Morrison and Smith (1964) and Metcalfe et al. (1966). Following dicing, each frozen lean,
composite and subcutaneous fat, samples from each shoulder clod was frozen in liquid nitrogen
and powdered to ensure a homogenized sample using a Waring commercial blender (Model
51BL32, Waring Commercial, Torrington, CT). Powdered samples were stored at -80°C until
analysis. Fatty acid composition was determined by gas chromatography (GC) after fat
extraction from samples followed by formation of methyl esters of fatty acids. Powdered lean,
composite, and subcutaneous fat samples (1 gram for lean and composite, 0.1 g for fat) were
dissolved in 5 mL of 2:1 chloroform:methanol (v/v) to extract the lipid fraction after vortexing
for 5 s and letting them stand for 1 h at room temperature. The homogenate was filtered through
50
Watman #2 filter paper into a 13 × 150 mm screw-cap tube and the final volume was brought up
to 10 mL with 2:1 chloroform:methanol mix. Then, 2 mL of 0.74% KCl solution was added to
the lipid extract and vortexed for 5 s to separate extracted proteins. Samples were centrifuges at
1,000 × g for 5 m. Following centrifugation, the aqueous layer was aspirated and evaporated to
dryness under nitrogen at 60°C (Folch et al., 1957). Then, 0.5 mL of 0.5 M NaOH in methanol
was added, vortexed again for 5 s and heated for 5 m at 100°C under nitrogen for saponification.
To methylate the fatty acids, 0.5 mL of boron triflouride in 14% methanol was added and heated
for 5 m at 100°C to methylate the fatty acids (Metcalfe et al., 1966). One mL of saturated salt
solution and 1 mL of hexane were added and vortexed for 5 s. Following centrifugation at 1,000
× g for 5 m, the hexane layer was removed and placed in a GC sampling vial. Sample containing
fatty acids in the GC vial was purged with nitrogen, capped and stored at -80°C until the sample
was read on a Hewlett-Packard Gas Chromatograph (Agilent Technologies, model 5890A series,
Santa Clara, CA) attached to a Hewlett-Packard Autosampler (Agilent Technologies, model
6890A series, Santa Clara, CA). Fatty acid methyl esters were separated on a fused silica
column (Chrompack CP-Sil 88; 0.25 mm × 100 m, Santa Clara, CA), which was placed in an
oven programmed from 140°C for 10 m to 220°C at a rate of 2°C/m and held at 220°C for 20 m.
Total run time was 70 m. The injector and detector were programmed to operate at 270°C and
300°C, respectively. Each lipid extract was separated into fatty acids by using helium as the
carrier gas at a flow rate of 1 mL/m. Individual fatty acids of each sample were determined by
comparison of retention times with known standards. Each standard contained known fatty acids
that were ran through gas chromatography at the same time as the samples in order to provide a
reference point to identify fatty acids in the sample. Each fatty acid was expressed as weight
percentage value, which were relative proportions of all peaks observed by gas chromatography.

51
2.6 Objective color evaluation
The patty color was measured with a colorimeter (Chroma Meter CR-400; Konica
Minolta Sensing Americas, Inc., Ramsey, NJ) using a 2° standard observer and a D65 illuminant.
The calibration plate was read through polyvinyl chloride overwrap film since patties were still
within the packaging during the color measurement. The color of the two patties at three
locations each was measured and the resulting measurements were averaged for each sample.
Color values were collected for L*, a*, and b*. Color was measured on d 0, 0.5, 1, 2, 3, 5, and 6.
2.7 Subjective color evaluation
A five-person trained panel composed of graduate students of the Department of Animal
Science at University of Nebraska-Lincoln subjectively evaluated the percentage discoloration
every day. Discoloration was evaluated as percentage surface discoloration ranging from 0 to
100%. Subjective color was evaluated on d 0, 1, 2, 3, 4, 5, and 6.
2.8 Lipid Oxidation
The 2-thiobarbuteric acid reactive substance assay (TBARS) described by Ahn et al.
(1998), which was a modification of the TBARS assay developed by Beuge and Aust (1978),
was used to measure the oxidation status of refrigerated and frozen cooked, ground, beef links
and fresh ground beef patties over storage time. Refrigerated links TBARS measurements were
taken every 3 d for 18 d, beginning at d 0. Frozen links TBARS measurements were taken every
28 d for 252 d, beginning at d 0.
Fourteen mL of deionized, distilled water and 1 mL of butylated hydroxyanisole solution
(10% BHA in 90% ethanol) were added to 5 g of sample. After homogenizing for 15 s using a

52
Polytron (POLYTRON®
Kinimatica CH-6010, Switzerland), the homogenate was centrifuged for
2,000 × g for 5 m. One mL of homogenate was mixed with 2 mL of 2-thiobarbituric acid and
trichloroacetic acid mixture (15% TCA (w/v) and 20 nM TBA in double distilled H20 and
vortexed for 5 s. The sample mixture was incubated at 70°C in a water bath for 30 m to develop
color. After samples were cooled in a cold-water bath for 10 min, the sample mixture was
centrifuged at 2,000 × g for 15 m. Duplicate 200 μL aliquots of each sample were transferred
into wells on a 96-well plate and the absorbance was read at 540 nm to calculate the mg of
malonaldehyde per kg of tissue using 1,1,3,3-tetraethoxypropane as the standard solution.
2.9 Statistical Analysis
Data for raw patty TBARS, proximate analysis, objective color and percent discoloration
were analyzed as a 2 × 2 factorial using the PROC GLIMMIX procedure of SAS with repeated
measures (day) where applicable. Fatty acid data analysis was conducted as a 2 × 2 factorial
using the PROC GLIMMIX procedure of SAS. Data for cooked link TBARS were analyzed as a
2 × 2 × 3 factorial (backgrounding diet × finishing diet × antioxidant) using the PROC
GLIMMIX procedure of SAS (SAS Inst. Inc., Cary, NC USA) with repeated measures (day)
where applicable. Additional analysis of cooked link TBARS were analyzed as a 2 × 2 factorial
using the PROC GLIMMIX procedure of SAS with repeated measures (day) to specifically
observe effects of diet on TBARS. All means were separated utilizing the LSMEANS and
PDIFF option when level of significance indicated by ANOVA was P < 0.05.

53
3. Results and Discussion
3.1 Proximate Composition
No dietary effects were found for fat or moisture for the composite or lean samples (P >
0.39, data not shown). The average fat percentage for composite and lean samples was 22.8 %
and 7.8 %, respectively. The average percent moisture for composite and lean samples was 60 %
and 74 %, respectively.
3.2 Fatty Acid Composition
For the lean, subcutaneous fat, and composite portion fatty acid analyses, a finishing
effect was observed where beef from cattle finished on MDGS had greater amounts of C18:2 and
total PUFA (P ≤ 0.0283, Table 1). The composite sample also had a finishing effect where cattle
finished on MDGS had greater amounts of C16:1 (P=.0425) and lesser amounts of C17:0 and
C17:1 (P=.0018 and .0064, respectively). These changes in PUFA concentration are likely
directly related to changes in lipid oxidation related to finishing diet since you would expect a
decrease in lipid stability with the increase in PUFA. The subcutaneous fat portion had a
backgrounding effect where there was a greater amount of UFA, lower concentrations of C18:0,
and a lower UFA:SFA (P=.0045, .0060, and .0139 respectively, Table 2) in beef from cattle
supplemented with greater amounts of MDGS while no significant backgrounding diet effects
(P > 0.05) were found for the lean or composite samples. The backgrounding diet impact on
fatty acid composition does not fully explain differences in oxidation due to backgounding diet
in cooked beef links. Dierks et al. (2014) also found limited differences in fatty acid profile that
did not fully explain differences in oxidation when only ground composite samples from the
shoulder clod were evaluated. Thus, this study utilized three different fat depots for fatty acid
analysis to see the impact of type of fat storage. Domenech et al. (2014) also saw the increase of
54
total PUFA and 18:2 of cattle fed wet distillers grains in raw beef strip steaks. This also agrees
with the research of Gill and others (2008), where there was an increase in all types of 18:2, total
PUFA and total conjugated linoleic acid in both corn and sorghum distillers grains when
compared to steam flaked corn.
The expected increase of PUFA and 18:2 was seen in the composite, lean, and fat
samples from the shoulder clod from cattle fed distillers grains during the finishing phase. The
significant increase in C16:1 and total unsaturated fatty acids (UFA) during backgrounding of
cattle supplemented with higher concentrations of distillers grains suggests that higher
supplementation has an effect on fatty acid composition but not to the extent of the finishing diet.
The lack of significant differences in PUFA during backgrounding may suggest that feeding
distillers grains causes incorporation of polyunsaturated fatty acids into the phospholipid
membranes at similar amounts, regardless of concentration fed during backgrounding. This
could be that even the slight increase in PUFA, even though not significant, seen in high
supplementation of distillers grains during backgrounding was enough to increase oxidation
susceptibility.
3.3 Lipid Oxidation– Raw Patties
As expected, there was an increase (P<0.001) over simulated retail display time for
TBARS concentrations (Table 3) but backgrounding nor finishing diet did not impact lipid
oxidation of ground beef links (P = 0.53 and 0.47, respectively, data not shown). This agrees
with a companion study conducted on strip loin steaks from the same group of cattle where there
were no dietary effects on lipid oxidation (Sudbeck, Varnold, MacDonald, Calkins, & Erickson,
2014). In contrast, Koger et al. (2010) observed increased TBARS values on d 7 of display in
55
ground beef from cattle finished on both DDGS and WDGS at 40% inclusion. Grinding of meat
products disrupt the phospholipid membranes and allows increased exposure to oxygen, thus
increasing the rate of lipid oxidation when compared to intact steaks (Sato et al., 1971). It may
be that no dietary differences were observed for lipid oxidation in raw patties as the oxygen
environment post grinding provided an optimal environment for lipid oxidation.
3.4 Objective Color and Subjective Color – Raw Patties
For objective color, both a* and b* values decreased (P < 0.0001) over time regardless of
treatment (Table 4). Both finishing diet and day had an impact (P < 0.03) on L* values. Patties
from heifers fed MDGS had lower (P=0.03) L* values compared to heifers fed corn gluten feed
during the finishing phase (Table 4) and L* increased (P<0.001) as days of simulated retail
display increased independent from diet (Table 4). Koger et al. (2010) did not see any
differences in objective color values due to diet. The differences observed in our study could be
attributed to the extended period of time that DGS was fed.
There was a finishing diet by day interaction (P<0.001) for percent discoloration of
ground beef patties, where patties from heifers fed MDGS were observed to have a greater
(P<0.02) discoloration on d 3, 5, and 6 when compared to patties from heifers finished with corn
gluten feed (all other days were similar; P>0.19; Table 5). The main effects of backgrounding
and finishing diet were not significant (P>0.65). Sudbeck et al. (2014) showed a lack of main
dietary effects on discoloration of strip loins from the same cattle used in this experiment for
both backgrounding and finishing. Additionally, Koger et al. (2010) did not observe a dietary
difference during finishing on discoloration of ground beef from cattle fed DGS compared to
corn, however discoloration in their study was only analyzed on day 0, 2 and 7 and cattle were

56
not supplemented DGS during any other phase of production. The daily discoloration evaluation
may have helped to detect dietary differences observed in this study. The extended
supplementation during summer grazing of DGS seems to have contributed to discoloration.
Despite the lack of dietary effects on TBARS concentrations, finishing diet showed an increase
in L* values of beef from cattle fed corn gluten feed compared to MDGS. The increase in PUFA
concentration in the composite sample of cattle finished on MDGS compared to corn gluten feed
may explain decreased brightness observed, since an increase in PUFA has been linked to
oxidation of both myoglobin and lipid. All samples became darker and less red over time,
regardless of dietary treatment. Beef patties discolored at a faster rate than strip steaks from the
same dietary treatments in a companion study (Sudbeck et al., 2014). This is expected, since
grinding increases availability to oxygen, creating an atmosphere more prone to lipid oxidation.
The results of this trial suggest that while there were no differences in lipid oxidation regardless
of dietary treatment, ground beef from heifers finished with MDGS discolored at a greater rate
compared to ground beef from heifers finished with corn gluten feed.
3.5 Lipid Oxidation – Cooked Links
An antioxidant concentration by day interaction (P<0.05) for refrigerated cooked link
oxidation was observed, however no significant dietary treatment interactions or main effects
were observed in the full factorial analysis. The lack of dietary effects (P >0.16) is likely due to
the addition of antioxidants masking differences. Therefore, subsequent analyses using only
samples without added antioxidant was conducted to independently determine dietary impacts.
In the full analysis, links with no added antioxidants were more oxidized at d 9, 12, 15 and 18 (P
≤ 0.0001 for all) than any treatments containing antioxidants on any day (Figure 2). There were
no (P>0.05) differences in lipid oxidation between any day when using 0.13 or 0.20%
57
concentrations of antioxidants. The sensory perception threshold of TBARS been reported to be
between 1 and 2 mg malonaldehyde/ kg of sample (Campo et al., 2006, Greene & Cumuze,
1981, Tarladgis, Watts, Younathan, Dugan Jr, 1960). Ahn, Grün, and Mustapha (2007)
determined that cooked ground beef with no added antioxidants was already above the general
perception of the upper threshold of 2 mg/malonaldehyde at day 0, and was significantly higher
than ground beef with grape seed extract, pine bark extract or oleoresin of rosemary, at all time
periods. Additionally, grape seed extract, pine bark extract and rosemary oleoresin were below
the threshold through 9 d of refrigerated storage. Our results indicate that cooked ground beef
links with the addition of antioxidant at 0.13% or 0.20% were below this threshold for up to 18 d
of storage.
When only 0%-added antioxidant samples were analyzed as a 2 × 2 factorial diet
treatment, significant winter backgrounding diet by day (P=0.008) and finishing diet by day
(P=0.02) interactions were identified. During winter backgrounding, there were no differences
(P>0.05) in lipid oxidation between cattle fed 0.91 kg and 2.27 kg of MDGS on days 0, 3 and 6
of refrigerated storage. However, cattle fed 2.27 kg of MDGS during backgrounding had greater
lipid oxidation than cattle fed 0.91 kg of distillers grains for days 9, 12 and 18 (P < 0.02; Figure
3). This suggests that feeding MDGS at any point in production can increase lipid oxidation but
greater backgrounding supplementation may have a greater impact. For the finishing diet by day
interaction, there was an increase in lipid oxidation for days 0, 3, 6, 9 and 12 for cattle fed
MDGS whereas cattle finished on corn gluten feed had little increase in oxidation until day 12.
However only on day 9 was the oxidation of beef from cattle fed MDGS greater than those fed
corn gluten feed (P = 0.02; Figure 4). Additionally, ready-to-eat beef links from cattle fed 2.27
kg/hd/day of MDGS during backgrounding had greater TBARS concentration with extended

58
storage than those from cattle fed 0.91 kg/hd/day. This agrees with the work of Dierks et al.
(2014), where they found an increase in lipid oxidation on both refrigerated and frozen cooked
links from cattle supplemented DGS during backgrounding. Gunn et al. (2009) did not see a
finishing dietary effect on raw top round samples, however the samples were only aged for 7 d in
a vacuum package, then frozen until TBARS analysis, so no exposure to oxygen nor cooking
occurred. Comminution and cooking likely intensifies the susceptibility of beef from cattle
supplemented distillers grains, hence the increase in TBARS values of beef from cattle
supplemented distillers grains during finishing earlier in storage (Sato & Hegarty, 1971). This
concept also applies to beef from cattle supplemented higher concentrations of DGS during
backgrounding. Despite this, all cooked beef links without antioxidants regardless of diet
exceeded the 2 mg/malonaldehyde threshold after day 6 of refrigerated storage, hence
highlighting the further benefits of antioxidants.
For beef links in frozen storage, there was a time effect (P<.0001) where 0 d was less
oxidized (P<.0001) than the other days. Additionally, the control samples had greater TBARS
concentrations for day 28, 56, 112, 140 and 168 than samples with either amount of added
antioxidant (Figure 5). This is in agreement with the results from beef links in refrigerated
storage where no differences in lipid oxidation were observed among 0.13 and 0.20% antioxidant
concentrations (Figure 5). In frozen cooked ground beef, diet or antioxidant concentration
(0.13% and 0.20%) did not have any effect on oxidation. All cooked link samples with added
antioxidant were below the 2 mg malonaldehyde/ kg of sample threshold. Very little increase in
lipid oxidation was seen beyond day 0, indicating that frozen storage can slow the rate of lipid
oxidation.
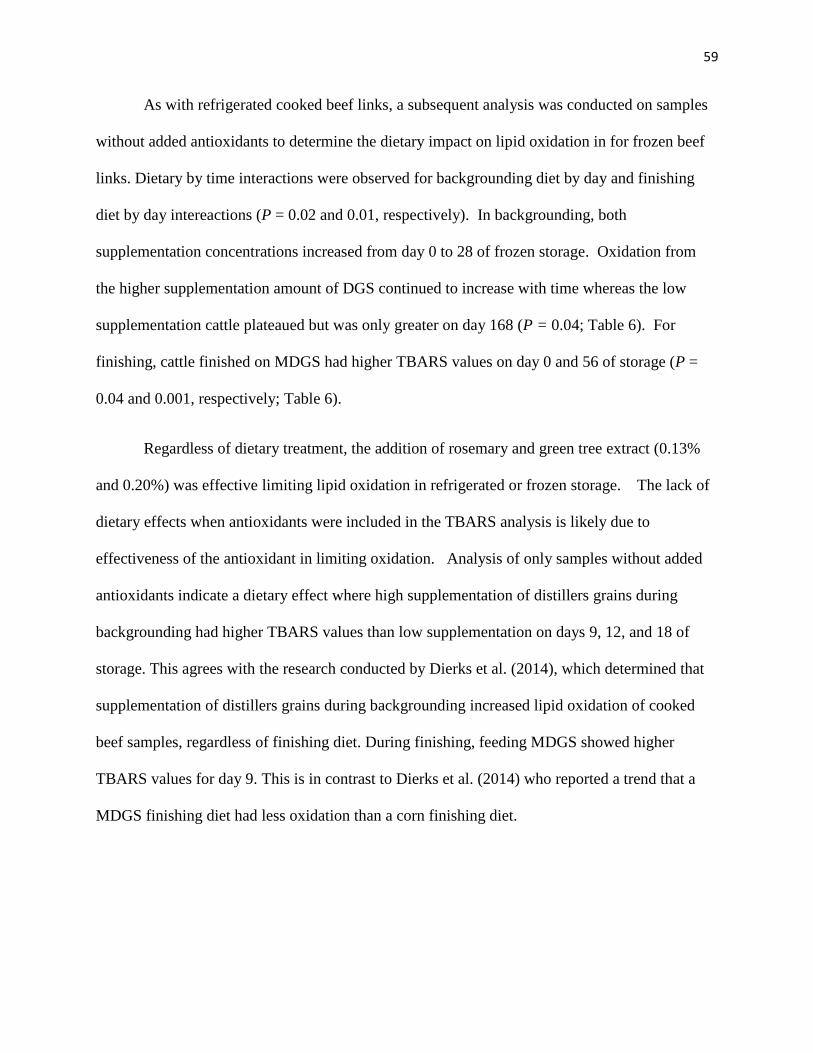
59
As with refrigerated cooked beef links, a subsequent analysis was conducted on samples
without added antioxidants to determine the dietary impact on lipid oxidation in for frozen beef
links. Dietary by time interactions were observed for backgrounding diet by day and finishing
diet by day intereactions (P = 0.02 and 0.01, respectively). In backgrounding, both
supplementation concentrations increased from day 0 to 28 of frozen storage. Oxidation from
the higher supplementation amount of DGS continued to increase with time whereas the low
supplementation cattle plateaued but was only greater on day 168 (P = 0.04; Table 6). For
finishing, cattle finished on MDGS had higher TBARS values on day 0 and 56 of storage (P =
0.04 and 0.001, respectively; Table 6).
Regardless of dietary treatment, the addition of rosemary and green tree extract (0.13%
and 0.20%) was effective limiting lipid oxidation in refrigerated or frozen storage. The lack of
dietary effects when antioxidants were included in the TBARS analysis is likely due to
effectiveness of the antioxidant in limiting oxidation. Analysis of only samples without added
antioxidants indicate a dietary effect where high supplementation of distillers grains during
backgrounding had higher TBARS values than low supplementation on days 9, 12, and 18 of
storage. This agrees with the research conducted by Dierks et al. (2014), which determined that
supplementation of distillers grains during backgrounding increased lipid oxidation of cooked
beef samples, regardless of finishing diet. During finishing, feeding MDGS showed higher
TBARS values for day 9. This is in contrast to Dierks et al. (2014) who reported a trend that a
MDGS finishing diet had less oxidation than a corn finishing diet.

60
Conclusion
Feeding distillers grain during backgrounding and finishing phases of production
impacted cooked and raw ground beef quality. Feeding distillers grains during the finishing
phase increased the PUFA concentration in composite, lean and subcutaneous fat samples while
backgrounding diet only increased UFA and UFA:SFA ratio in subcutaneous fat samples. Retail
shelf life of raw ground beef fed distillers grains during finishing is shortened due visual
discoloration, while the shelf life in cooked beef is reduced due to lipid oxidation by feeding
distillers products at any phase of production. Feeding distillers grains in the backgrounding
phase has a significant effect on the finished product, which is then masked when WDGS are fed
in the finishing phase. Cooking magnifies dietary effects on TBARS concentrations. However,
the addition of antioxidant compounds has the ability to counteract any dietary impact of feeding
distillers grains in both frozen and refrigerated cooked beef links. These findings highlight
impacts of feeding ethanol co-products on raw and cooked ground beef and demonstrate the need
to use added antioxidants in value-added beef products.
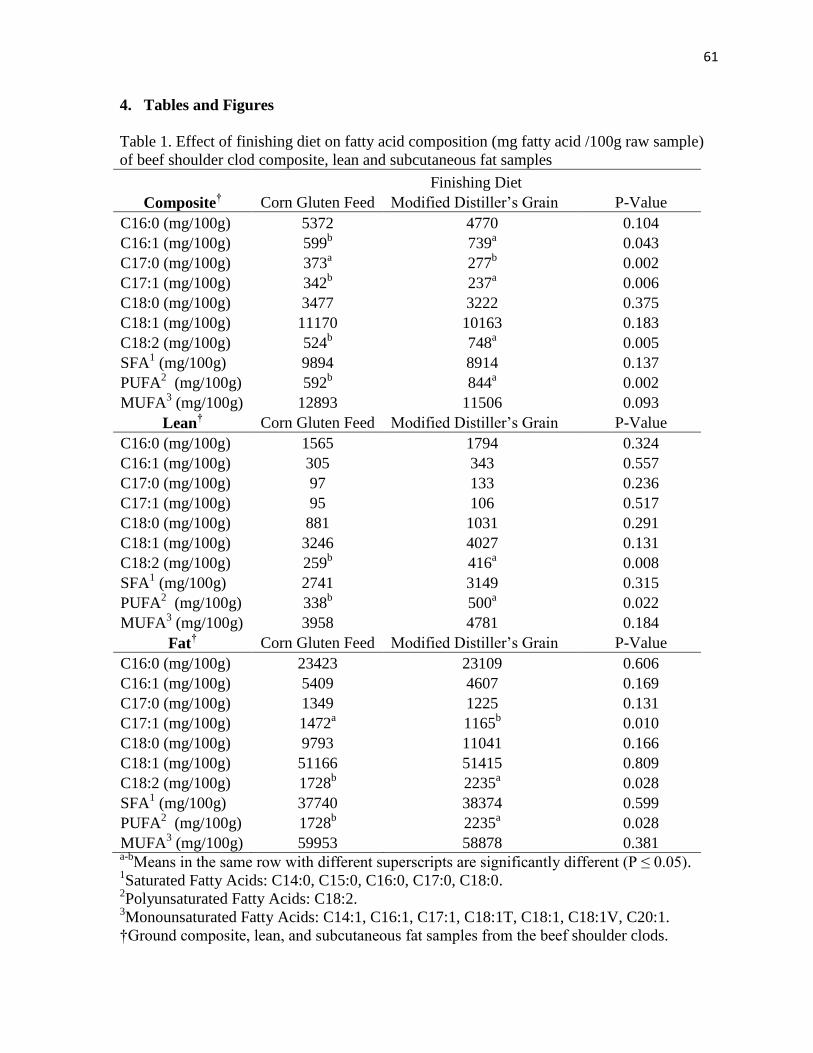
61
4. Tables and Figures
Table 1. Effect of finishing diet on fatty acid composition (mg fatty acid /100g raw sample)
of beef shoulder clod composite, lean and subcutaneous fat samples
Finishing Diet
Composite† Corn Gluten Feed Modified Distiller’s Grain P-Value
C16:0 (mg/100g) 5372 4770 0.104
C16:1 (mg/100g) 599b 739
a 0.043
C17:0 (mg/100g) 373a 277
b 0.002
C17:1 (mg/100g) 342b 237
a 0.006
C18:0 (mg/100g) 3477 3222 0.375
C18:1 (mg/100g) 11170 10163 0.183
C18:2 (mg/100g) 524b 748
a 0.005
SFA1 (mg/100g) 9894 8914 0.137
PUFA2 (mg/100g) 592
b 844
a 0.002
MUFA3 (mg/100g) 12893 11506 0.093
Lean† Corn Gluten Feed Modified Distiller’s Grain P-Value
C16:0 (mg/100g) 1565 1794 0.324
C16:1 (mg/100g) 305 343 0.557
C17:0 (mg/100g) 97 133 0.236
C17:1 (mg/100g) 95 106 0.517
C18:0 (mg/100g) 881 1031 0.291
C18:1 (mg/100g) 3246 4027 0.131
C18:2 (mg/100g) 259b
416a
0.008
SFA1 (mg/100g) 2741 3149 0.315
PUFA2 (mg/100g) 338
b 500
a 0.022
MUFA3 (mg/100g) 3958 4781 0.184
Fat† Corn Gluten Feed Modified Distiller’s Grain P-Value
C16:0 (mg/100g) 23423 23109 0.606
C16:1 (mg/100g) 5409 4607 0.169
C17:0 (mg/100g) 1349 1225 0.131
C17:1 (mg/100g) 1472a
1165b
0.010
C18:0 (mg/100g) 9793 11041 0.166
C18:1 (mg/100g) 51166 51415 0.809
C18:2 (mg/100g) 1728b
2235a
0.028
SFA1 (mg/100g) 37740 38374 0.599
PUFA2 (mg/100g) 1728
b 2235
a 0.028
MUFA3 (mg/100g) 59953 58878 0.381
a-bMeans in the same row with different superscripts are significantly different (P ≤ 0.05).
1Saturated Fatty Acids: C14:0, C15:0, C16:0, C17:0, C18:0.
2Polyunsaturated Fatty Acids: C18:2.
3Monounsaturated Fatty Acids: C14:1, C16:1, C17:1, C18:1T, C18:1, C18:1V, C20:1.
†Ground composite, lean, and subcutaneous fat samples from the beef shoulder clods.

62
Table 2. Effect of supplementation concentration (0.91 or 2.27 kg/head/day)
of wet distillers grains during backgrounding on fatty acid composition
(mg/100g raw sample) of beef shoulder clod composite, lean and
subcutaneous fat samples
Backgrounding Diet
Composite† Low High P-Value
C16:0 (mg/100g) 5052 5091 0.909
C16:1 (mg/100g) 652.14
685.76
0.596
C17:0 (mg/100g) 324.34 326.04 0.945
C17:1 (mg/100g) 281.42
297.11
0.630
C18:0 (mg/100g) 3527
3172
0.223
C18:1 (mg/100g) 10670 10664 0.994
C18:2 (mg/100g) 623.49
648.74
0.702
SFA1 (mg/100g) 9553 9255 0.636
PUFA2 (mg/100g) 695.61
740.20
0.503
MUFA3 (mg/100g) 12163 12236 0.926
UFA4 (mg/100g) 2262
2239
0.860
Lean† Low High P-Value
C16:0 (mg/100g) 1614 1745 0.567
C16:1 (mg/100g) 317.74 330.96 0.838
C17:0 (mg/100g) 113.48 116.66 0.914
C17:1 (mg/100g) 97.46
104.08
0.695
C18:0 (mg/100g) 937.37
975.71
0.783
C18:1 (mg/100g) 3574 3699 0.800
C18:2 (mg/100g) 336.85
338.52
0.974
SFA1 (mg/100g) 2849 3042 0.628
PUFA2 (mg/100g) 421.44
416.98
0.944
MUFA3 (mg/100g) 4190 4548 0.551
UFA4 (mg/100g) 1038
1266
0.300
Fat† Low High P-Value
C16:0 (mg/100g) 22879 23653 0.215
C16:1 (mg/100g) 4273b
5743a
0.020
C17:0 (mg/100g) 1295 1280 0.842
C17:1 (mg/100g) 1240
1497
0.075
C18:0 (mg/100g) 11894a
8939b
0.005
C18:1 (mg/100g) 51242 51340 0.924
C18:2 (mg/100g) 1974
1990
0.940
SFA1 (mg/100g) 39203 36911 0.075
PUFA2 (mg/100g) 1974
1990
0.940
MUFA3 (mg/100g) 58279 60552 0.079
UFA4 (mg/100g) 9011
b 11201
a 0.006
a-b Means in the same row with different superscripts are
significantly different (P ≤ 0.05). 1Saturated Fatty Acids: C14:0, C15:0, C16:0, C17:0, C18:0.
2Polyunsaturated Fatty Acids: C18:2, C20:4.
3Monounsaturated Fatty Acids: C14:1, C16:1, C17:1, C18:1T,
C18:1, C18:1V, C20:1. 4Unsaturated Fatty Acids: C14:1, C16:1, C17:1, C18:1T, C18:1,
C18:1V, C18:2, C20:1, C20:4.
†Subcutaneous fat, lean and composite samples from beef shoulder clods.

63
Table 3. Effect of day of simulated retail display on lipid
oxidation in raw ground beef patties
Day mg of malonaldehyde/kg of tissue
0 1.38e
0.5 1.64ed
1 2.38dc
2 3.11c
4 6.24b
6 10.43a
a-e Means in the same column with different superscripts
are significantly different (P ≤ 0.05).

64
Table 4. Effect of dietary treatment and time of simulated retail display on objective color on
ground beef patties
Diet Day
SB
† MDGS
† 0 0.5 1 2 3 5 6
L* 53.01a 51.73
b 51.69
dc 52.3
c 51.54
dc 52.43
bc 52.61
bc 53.55
ab 53.81
a
a* 15.07 14.91 23.79a 19.35
b 16.80
c 13.27
d 10.43
e 8.19
f 7.09
g
b* 10.49 10.42 12.16a 10.75
b 9.86
e 9.59
e 9.58
e 10.13
d 10.44
c
a-g Means in the same row with different superscripts are significantly different
(P ≤ 0.05). †SB= Corn Gluten Feed (Sweet Bran); MDGS =Modified Distillers Grains plus Solubles.
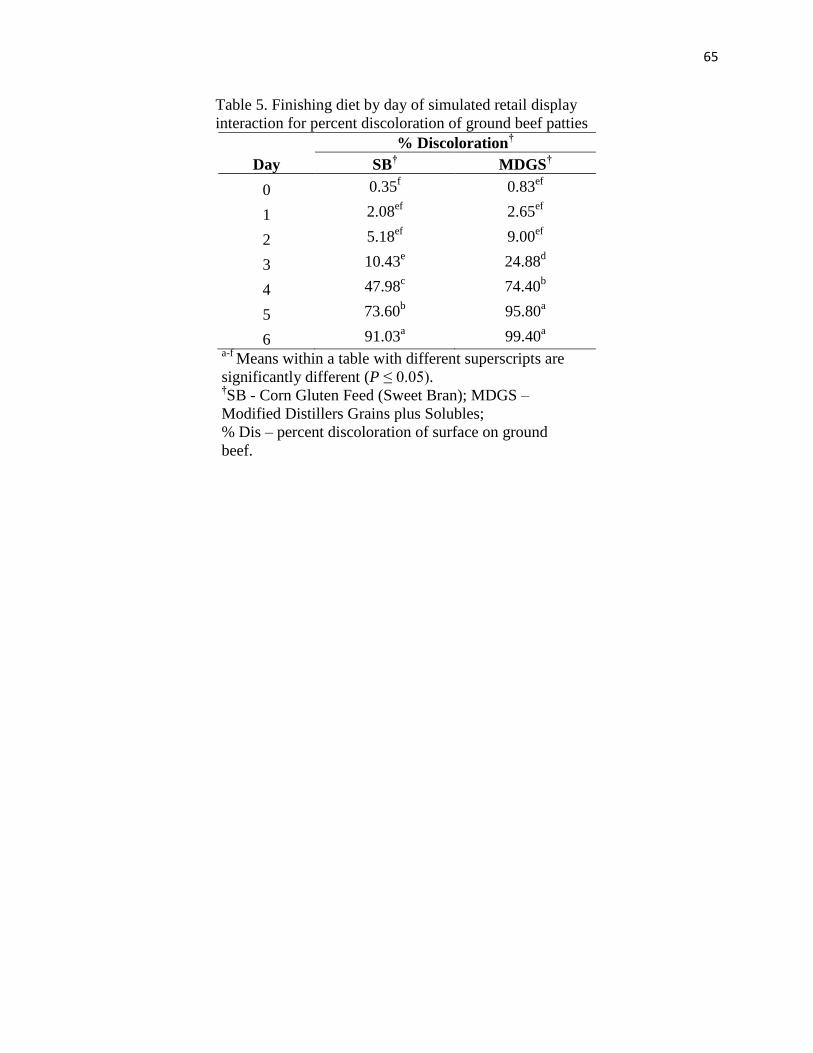
65
Table 5. Finishing diet by day of simulated retail display
interaction for percent discoloration of ground beef patties
% Discoloration
†
Day SB† MDGS
†
0 0.35f 0.83
ef
1 2.08ef
2.65ef
2 5.18ef
9.00ef
3 10.43e 24.88
d
4 47.98c 74.40
b
5 73.60b 95.80
a
6 91.03a 99.40
a
a-f Means within a table with different superscripts are
significantly different (P ≤ 0.05). †SB - Corn Gluten Feed (Sweet Bran); MDGS –
Modified Distillers Grains plus Solubles;
% Dis – percent discoloration of surface on ground
beef.
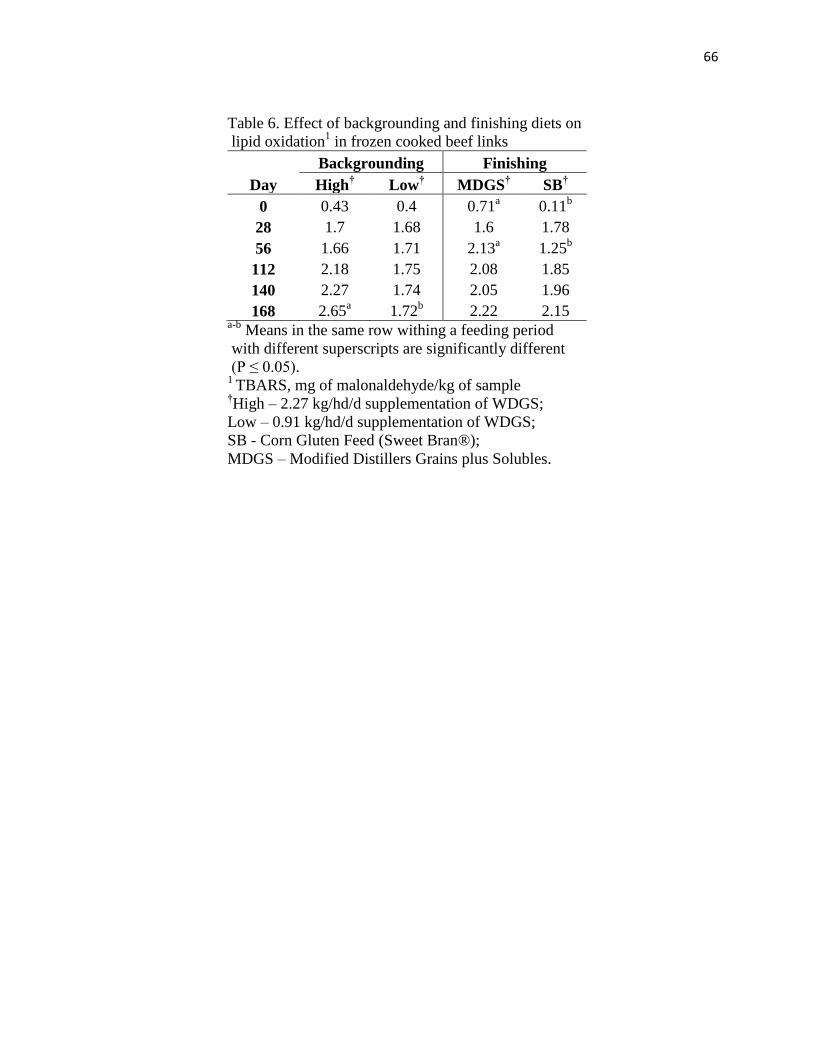
66
Table 6. Effect of backgrounding and finishing diets on
lipid oxidation1 in frozen cooked beef links
Backgrounding Finishing
Day High† Low
† MDGS
† SB
†
0 0.43 0.4 0.71a 0.11
b
28 1.7 1.68 1.6 1.78
56 1.66 1.71 2.13a 1.25
b
112 2.18 1.75 2.08 1.85
140 2.27 1.74 2.05 1.96
168 2.65a 1.72
b 2.22 2.15
a-b Means in the same row withing a feeding period
with different superscripts are significantly different
(P ≤ 0.05). 1
TBARS, mg of malonaldehyde/kg of sample †High – 2.27 kg/hd/d supplementation of WDGS;
Low – 0.91 kg/hd/d supplementation of WDGS;
SB - Corn Gluten Feed (Sweet Bran®);
MDGS – Modified Distillers Grains plus Solubles.

67
1Received 0.91 kg DM (Low) or 2.27 kg DM (High) concentration of distillers grains supplementation during winter
corn stalk grazing period 2Received a distillers grains supplement at 0.6% of body weight during summer grazing period
3Received a finishing diet consisting of either 40% Sweet Bran (SB) or 40% distillers grains (DGS)
Figure 1. Treatments for heifers fed distillers grains throughout a yearling beef production
system

68
Figure 2. Effect of adding no, low, or high concentrations (0%, 0.13%, 0.20%) of rosemary
and green tea natural plant extract on the lipid oxidation (mg of malonaldehyde/kg of
sample) in cooked beef links during refrigerated storage.
0.00
1.00
2.00
3.00
4.00
5.00
6.00
7.00
8.00
9.00
0 3 6 9 12 15 18
mg M
alonal
deh
yde/
kg o
f sa
mple
Days of Refrigerated Storage
Control (0%)
Low (0.13%)
High (0.20%)*
* *
*
*(P < 0.05)

69
Figure 3. Effect of supplementation concentration of wet distillers grains (0.91 or 2.27
kg/head/day DM basis) during backgrounding on lipid oxidation (mg of malonaldehyde/kg
of sample) in cooked beef links during refrigerated storage.
0.00
2.00
4.00
6.00
8.00
10.00
12.00
0 3 6 9 12 15 18
mg M
alonal
deh
yde/
kg o
f sa
mple
Days of Storage
High Concentration
Low Concentration
*
*
*

70
Figure 4. Effect of feeding corn gluten feed (Sweet Bran®, Bran) or modified wet distillers
grains during finishing on lipid oxidation (mg of malonaldehyde/kg of sample) in cooked
beef links during refrigerated storage.
0.00
1.00
2.00
3.00
4.00
5.00
6.00
7.00
8.00
9.00
10.00
0 3 6 9 12 15 18
mg M
alonal
deh
yde/
kg o
f sa
mple
Days Refrigerated of Storage
Corn Gluten
Feed
MWDG
*(P < 0.05)
*
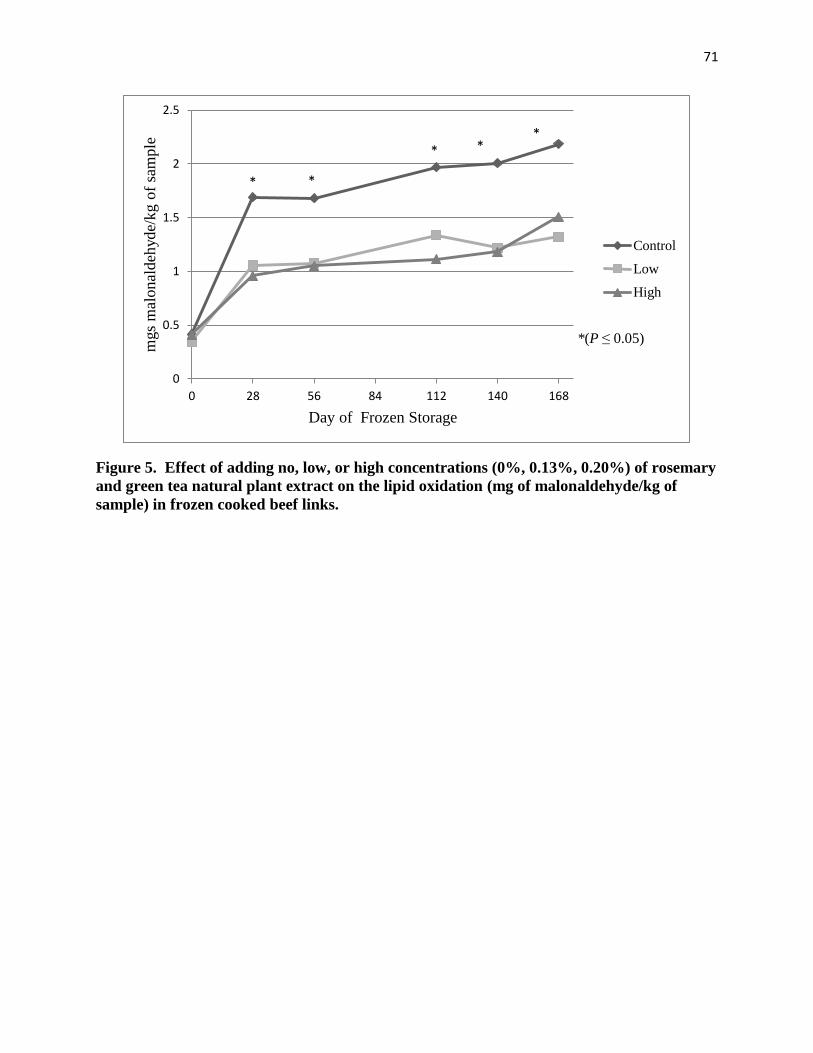
71
Figure 5. Effect of adding no, low, or high concentrations (0%, 0.13%, 0.20%) of rosemary
and green tea natural plant extract on the lipid oxidation (mg of malonaldehyde/kg of
sample) in frozen cooked beef links.
0
0.5
1
1.5
2
2.5
0 28 56 84 112 140 168
mgs
mal
onal
deh
yde/
kg o
f sa
mple
Day of Frozen Storage
Control
Low
High
*(P ≤ 0.05)
*
* *
* *
72
LITERATURE CITED
Ahn, J., Grün, I. U., & Mustapha, A. (2007). Effects of plant extracts on microbial growth, color
change, and lipid oxidation in cooked beef. Food Microbiology, 24(1), 7-14.
AOAC. 1990. Official Methods of Analysis. 15th
ed. Association of Analytic Committees.,
Arlington, VA.
Buege, J., & Aust, S. (1978). The thiobarbituric acid assay. Methods in Enzymology, 52, 306-
307.
Campo, M., Nute, G., Hughes, S., Enser, M., Wood, J., & Richardson, R. (2006). Flavour
perception of oxidation in beef. Meat Science, 72(2), 303-311.
Depenbusch, B., Coleman, C., Higgins, J., & Drouillard, J. (2009). Effects of increasing levels of
dried corn distillers grains with solubles on growth performance, carcass characteristics,
and meat quality of yearling heifers. Journal of Animal Science, 87(8), 2653-2663.
Dierks, N. T., Jones, T. F., Varnold, K. A., Schroeder, D. J., Redfield, A. L., & Sullivan, G. A.
(2014). Shelf Life of Cooked Ground Beef Patties From Cattle Fed Wet Distillers Grains
with Solubles. University of Nebraska Beef Reports. 104-105. Available online:
http://beef.unl.edu/nebeefreport2014. Accessed: 24 Feb, 2015.
Domenech, K. I., Varnold, K. A., Semler, M. E., Chao, M. D., Jones, T. F., Erickson, G. E., &
Calkins, C. R. (2014). Effect of Feeding De-oiled Wet Distillers Grains Plus Solubles on
Beef Fatty Acid Profiles. University of Nebraska Beef Reports. 114-115. Available
online: http://beef.unl.edu/nebeefreport2014. Accessed: 24 Feb, 2015.
Faustman, C., Cassens, R., Schaefer, D., Buege, D., Williams, S., & Scheller, K. (1989).
Improvement of pigment and lipid stability in Holstein steer beef by dietary
supplementation with vitamin E. Journal of Food Science, 54(4), 858-862.
Faustman, C., Sun, Q., Mancini, R., & Suman, S. P. (2010). Myoglobin and lipid oxidation
interactions: Mechanistic bases and control. Meat Science, 86(1), 86-94.
Folch, J., Lees, M., & Stanley, G. 1957. A simple method for the isolation and purification of
total lipids from animal tissues. Journal of Biological Chemistry. 226:497-509.
Forrest, J. C., Aberle, E.D., Gerrard, D.E., & Mills, E.W. (2012). Principles of Meat Science:
W.H. Freeman and Company.
Gill, R., VanOverbeke, D., Depenbusch, B., Drouillard, J., & DiCostanzo, A. (2008). Impact of
beef cattle diets containing corn or sorghum distillers grains on beef color, fatty acid
profiles, and sensory attributes. Journal of Animal Science, 86(4), 923-935.
73
Greene, B., & Cumuze, T. (1982). Relationship between TBA numbers and inexperienced
panelists’ assessments of oxidized flavor in cooked beef. Journal of Food Science, 47(1),
52-54.
Gunn, P., Weaver, A., Lemenager, R., Gerrard, D., Claeys, M., & Lake, S. (2009). Effects of
dietary fat and crude protein on feedlot performance, carcass characteristics, and meat
quality in finishing steers fed differing levels of dried distillers grains with solubles.
Journal of Animal Science, 87(9), 2882-2890.
Jenschke, B., Benton, J. R., Calkins, C. R., Carr, T. P., Eskridge, K. M., Klopfenstein, T. J., &
Erickson, G. E. (2008). Chemical and sensory properties of beef of known source and
finished on wet distillers grains diets containing varying types and levels of roughage.
Journal of Animal Science, 86(4), 949-959.
Jo, C., & Ahn, D. (1998). Fluorometric analysis of 2-thiobarbituric acid reactive substances in
turkey. Poultry Science, 77(3), 475-480.
Koger, T. J., Wulf, D. M., Weaver, A. D., Wright, C. L., Tjardes, K. E., Mateo, K. S., & Smart,
A. J. (2010). Influence of feeding various quantities of wet and dry distillers grains to
finishing steers on carcass characteristics, meat quality, retail-case life of ground beef,
and fatty acid profile of longissimus muscle. Journal of Animal Science, 88(10), 3399-
3408.
Liu, Q., Lanari, M. C., & Schaefer, D. M. (1995). A review of dietary vitamin E supplementation
for improvement of beef quality. Journal of Animal Science., 73(10), 3131-3140.
Folch, J., Lees, M., & Stanley, G. 1957. A simple method for the isolation and purification of
total lipids from animal tissues. Journal of Biological Chemistry. 226:497-509.
Metcalfe, L., Schmitz, A., Pelka, J. 1966. Rapid penetration of fatty acid esters from lipids for
gas chromatographic analysis. Analytical Chemistry. 38:514:515.
Morrison, W. & Smith, L. 1964. Preparation of fatty acid methyl esters and dimethylacetals
from lipids with boron fluoride-methanol. Journal of Lipid Research. 5:600-608.
Renewable Fuels Association, Industry Resources: Co-Products. (2014). Retrieved March 3,
2015, from http://www.ethanolrfa.org/pages/industry-resources-coproducts
Sato, K., & Hegarty, G. R. (1971). Warmed‐over flavor in cooked meats. Journal of Food
Science, 36(7), 1098-1102.
Sudbeck, K. M., Varnold, K. A., MacDonald, J. C., Calkins, C. R., & Erickson, G. E. (2014).
Effects of Feeding Distillers Grains in a Yearling Beef System on Meat Quality. .
University of Nebraska Beef Reports. 111-113. Available online:
http://beef.unl.edu/nebeefreport2014. Accessed: 24 Feb, 2015.

74
Tang, S., Kerry, J. P., Sheehan, D., Buckley, D. J., & Morrissey, P. A. (2001). Antioxidative
effect of added tea catechins on susceptibility of cooked red meat, poultry and fish patties
to lipid oxidation. Food Research International, 34(8), 651-657.
Tarladgis, B. G., Watts, B. M., Younathan, M. T., & Dugan Jr, L. (1960). A distillation method
for the quantitative determination of malonaldehyde in rancid foods. Journal of the
American Oil Chemists Society, 37(1), 44-48.
USDA Economic Research Service. U.S. Bioenergy. 2012. http://www.ers.usda.gov/data-
products/us-bioenergy-statistics.aspx. Accessed: 24 Feb, 2015
Zakrys, P., Hogan, S., O’Sullivan, M., Allen, P., & Kerry, J. (2008). Effects of oxygen
concentration on the sensory evaluation and quality indicators of beef muscle packed
under modified atmosphere. Meat Science, 79(4), 648-655.
75
Effect of feeding distillers grains and supplementing with dietary antioxidants on shelf life
of ground beef
B.D. Cleveland, J.C. MacDonald and G.A. Sullivan1
Department of Animal Science, University of Nebraska, Lincoln 68583-0908
A contribution to the University of Nebraska Agriculture Research Division, Lincoln, NE 68583
1Correspondence: [A213 Animal Science; Telephone (402) 472-6430; Fax (402) 472-6362]
Email address: [email protected] (Gary A. Sullivan)
Prepared using the guide for authors for the journal Meat Science
76
ABSTRACT
The objective was to evaluate the effect of feeding distillers grains and dietary antioxidants on
shelf life and quality of ground beef. Cattle were assigned to one of five finishing diets; corn,
wet distillers grains (WDGS), WDGS + vitamin E, WDGS + Agrado Plus, or WDGS + vitamin
E + Agrado Plus. Seven beef shoulder clods from each diet were ground and patties were
manufactured for simulated retail display, where percent discoloration, objective color and lipid
oxidation were analyzed. Cooked beef links were manufactured with salt and phosphate, placed
in refrigerated or frozen storage to measure lipid oxidation. In raw ground beef no dietary
treatment effects on color. All ground beef TBARS (cooked or raw) increased over time and
supplementation of vitamin E sustained lower TBARS values in raw patties than corn after 2 d of
simulated retail display. Diet did not impact cooked beef oxidation. An increase in PUFA and
C18:2 was observed in lean and composite fatty acids in WDGS versus corn finished cattle.
Keywords: ground beef, distillers grains, vitamin E, Agrado, color, TBARS
1. Introduction
Cattle fed distillers grains have increased polyunsaturated fatty acid (PUFA)
concentrations when compared to corn based diets, making them more prone to lipid oxidation
(Gill, VanOverbeke, Depenbush, Drouillard, & DiCostanzo, 2008, Koger, et al., 2010). Some
fats in distillers grains are protected from biohydrogenation, resulting in an increased
concentration of unsaturated fatty acids in the duodenum which could later be absorbed into the
tissue (Vander Pol, Luebbe, Crawford, Erickson, & Klopfenstein, 2009). Since greater
unsaturation makes lipids more prone to oxidation (Schultz & Sinnhuber, 1962), polyunsaturated
fatty acids tend to have less lipid stability. Polyunsaturated fatty acids are the primary lipid in
phospholipid membranes, which is often the site of lipid oxidation initiation (Christie, 1978).

77
Grinding of meat products disrupts the phospholipid membranes and allows increases exposure
to oxygen, thus increasing the rate of lipid oxidation significantly (Sato & Hegarty, 1971).
Furthermore, higher temperatures observed during cooking allow the phospholipids to become
more exposed and vulnerable to oxygen and free radicals, and cooking beef has been shown to
increase TBARS values up to four-fold in comparison to their raw counterpart (McCarthy,
Kerry, Kerry, Lynch, & Buckley, 2001).
Vitamin E cannot be synthesized by animals and must be included in the diet (Sales &
Koukolová, 2010). It can function as a primary antioxidant by donating a hydrogen atom to
quench free radicals (Berges, 1999). Absorption of vitamin E occurs in the lymphatic system,
where it is secreted into the liver and incorporated into very-low-density lipoproteins, and
transported into the interior of cells inside low-density lipoproteins (Berges, 1999). Dietary
supplementation with vitamin E in the form of ɑ-tocopherol acetate delays lipid oxidation more
effectively than direct addition to meat because it allows the vitamin E to be incorporated into
the phospholipid membranes rather than the neutral membranes (Ahn, Grun, & Fernando, 2002).
Vitamin E is heat stable and still retains the ability to act as an antioxidant in cooked meat
products (Faustman et al., 1989).
Ethoxyquin/TBHQ (Agrado Plus, Novus International, St. Louis, MO) is approved for
usage in feed rations to reduce oxidation of ingredients in diets high in unsaturated fat (Maddock,
Wulf, & McKenna, 2003). It is important to note that this ingredient prevents oxidation of the
feed itself and does not act as an antioxidant in the body. Choat et al. (2002) reported that
Agrado supplementation did not increase serum Vitamin E values directly, but could increase
vitamin E concentrations over time since Agrado is able to stabilize vitamin E in the feed ration.
Ethoxyquin/TBHQ has previously been shown to decrease lipid oxidation in beef (Walenciak,
78
Gardner, Dolezal, & Owens, 1999; Krumsiek & Owens, 1998). The contribution of Agrado to
color stability has contradictory results, where Krumsiek and Owens (1998) and Choat et al.
(2002) had an increased time period before discoloration of steaks in Agrado supplemented cattle
compared to the control. On the contrary, Walenciak et al. (1999) did not see any differences in
color stability over time. This could be contributed to the supplementation time, where
Krumsiek and Owens (1998) supplemented cattle with Agrado for 28d prior to slaughter and
Walenciak et al. (1999) supplemented cattle for 123d. Additionally, Krumsiek and Owens
(1998) and Choat et al. (2002) studied color stability on steaks only, whereas Walenciak et al.
(1999) utilized both ground and whole muscle beef. The intensity of lipid oxidation occurring in
ground products could have overwhelmed the antioxidant capabilities of vitamin E available in
that study.
Cleveland et al. (2014) determined that feeding distillers grains during the finishing
decreased lipid stability in cooked ground beef patties. No research has been conducted to
evaluating combination of feeding distillers grains and dietary antioxidants on raw or cooked
ground beef products. Therefore, the objectives of this trial were to evaluate the effect of feeding
distillers grains during the finishing phase and the addition of dietary antioxidants on ground
beef color and lipid oxidation during simulated retail display, lipid oxidation in ready-to-eat beef
links, and fatty acid composition.
2. Materials and Methods
2.1 Dietary Treatments and Product Collection
On d 14 postmortem, subcutaneous fat and lean samples were taken from each shoulder
clod on the ventral side from the triceps brachii muscle for fatty acid analysis. Each shoulder
clod was independently ground through a 1.27 cm plate and then through a 0.476 cm plate

79
(Model 4732, Hobart; Troy, OH), a composite sample taken for fatty acid analysis, and the
remainder was weighed into three 2.27 kg batches. All treatments contained 0.75% salt, 0.25%
sodium phosphate (Brifisol 85 instant, BK Giulini Corp., Simi Valley, CA). Beef and non-meat
ingredients were mixed for 1 min and the mixture was stuffed into 2.2 cm diameter skinless links
using a hydraulic piston stuffer (Talsa H31P, Talsabell S.A., Valencia, Spain) and Colosimo
press (model 200, Gale Colosimo Seasoning Co., South Salt Lake, UT). After cooking, links
were placed in individual foil trays for each shoulder clod and cooked to an internal temperature
of 71 °C. Links were placed in oxygen impermeable zip-top bags (Ziploc® Storage Bags, 1
Gallon, S. C. Johnson, Racine, Wisconsin) and placed in either dark refrigerated storage at 2°C
or dark frozen storage at -20°C until appropriate day of analysis.
2.2 Beef Link Manufacture
On d 14 postmortem, subcutaneous fat and lean samples were taken from each shoulder
clod on the ventral side from the triceps brachii muscle for fatty acid analysis. Each shoulder
clod was independently ground through a 1.27 cm plate and then through a 0.476 cm plate
(Model 4732, Hobart; Troy, OH), a composite sample taken for fatty acid analysis. All
treatments of cooked beef links contained 0.75% salt, 0.25% sodium phosphate (Brifisol 85
instant, BK Giulini Corp., Simi Valley, CA). Beef and non-meat ingredients were mixed for 1
min and the mixture was stuffed into 22 mm diameter skinless links using a hydraulic piston
stuffer (Talsa H31P, Talsabell S.A., Valencia, Spain) and Colosimo press (model 200, Gale
Colosimo Seasoning Co., South Salt Lake, UT). After cooking, links were placed in individual
foil trays for each shoulder clod and cooked to an internal temperature of 71 °C. Links were
placed in oxygen impermeable zip-top bags (Ziploc® Storage Bags, 1 Gallon, S. C. Johnson,

80
Racine, Wisconsin) and placed in either dark refrigerated storage at 2°C or dark frozen storage at
-20°C until appropriate day of analysis.
2.3 Beef Patty Manufacture and Simulated Retail Display
On d 14, six, 113-g patties from each shoulder clod were formed using a manual, single-
patty press. Patties from each shoulder clod were placed under simulated retail display for 7 d at
2.8°C. Beef patties (Two for color analysis, six half patties for TBARS, per sample) were
packaged on Styrofoam trays (13.3 × 25.6 × 1.4 cm, Styro-Tech, Denver, CO), overwrapped
with oxygen permeable polyvinyl chloride film (Prime Source Meat Film, Prime Source Sanitary
Supply, St. George, UT) and placed on a table in a cooler maintained at 0 to 2°C under
continuous 1,000 to 1,800 Lux warm white fluorescence lighting (PHILIPS F32T8/TL741
ALTO 700 Series, 32 WATT B7, Royal Philips Electronics, Amsterdam, Netherlands) to provide
simulated retail display conditions.
2.4 Proximate Analysis
Moisture and total fat of pulverized meat samples (lean tissue and ground composite from
each shoulder clod) were determined. Two g of pulverized tissue in duplicate were used to
quantify moisture using a LECO thermo-gravimetric analyzer (LECO Corporation, model 604-
100- 400, St. Joseph, MI). Total fat was determined as outlined by AOAC (1990) using the
Soxhlet extraction procedure.
2.5 Fatty Acid Analysis
Total lipid was extracted following the chloroform-methanol procedure of Folch et al.
(1957). After extraction, the lipids were converted to fatty acid methyl esters according to
81
Morrison and Smith (1964) and Metcalfe et al. (1966). Following dicing, each frozen lean,
composite and subcutaneous fat, samples from each shoulder clod was frozen in liquid nitrogen
and powdered to ensure a homogenized sample using a Waring commercial blender (Model
51BL32, Waring Commercial, Torrington, CT). Subcutaneous fat samples were prepared using
a 5 mm diameter core punch. Powdered samples and punched fats were stored at -80°C until
analysis. Fatty acid composition was determined by gas chromatography (GC) after fat
extraction from samples followed by formation of methyl esters of fatty acids. Powdered lean,
composite, and subcutaneous fat samples (1 gram for lean and composite, 0.1 g for fat) were
dissolved in 5 mL of 2:1 chloroform:methanol (v/v) to extract the lipid fraction after vortexing
for 5 s and letting them stand for 1 h at room temperature. The homogenate was filtered through
Watman #2 filter paper into a 13 × 150 mm screw-cap tube and the final volume was brought up
to 10 mL with 2:1 chloroform:methanol mix. Then, 2 mL of 0.74% KCl solution was added to
the lipid extract and vortexed for 5 s to separate extracted proteins. Samples were centrifuges at
1,000 × g for 5 m. Following centrifugation, the aqueous layer was aspirated and evaporated to
dryness under nitrogen at 60°C (Folch et al., 1957). Then, 0.5 mL of 0.5 M NaOH in methanol
was added, vortexed again for 5 s and heated for 5 m at 100°C under nitrogen for saponification.
To methylate the fatty acids, 0.5 mL of boron triflouride in 14% methanol was added and heated
for 5 m at 100°C to methylate the fatty acids (Metcalfe et al., 1966). One mL of saturated salt
solution and 1 mL of hexane were added and vortexed for 5 s. Following centrifugation at 1,000
× g for 5 m, the hexane layer was removed and placed in a GC sampling vial. Sample containing
fatty acids in the GC vial was purged with nitrogen, capped and stored at -80°C until the sample
was read on a Hewlett-Packard Gas Chromatograph (Agilent Technologies, model 5890A series,
Santa Clara, CA) attached to a Hewlett-Packard Autosampler (Agilent Technologies, model
82
6890A series, Santa Clara, CA). Fatty acid methyl esters were separated on a fused silica
column (Chrompack CP-Sil 88; 0.25 mm × 100 m, Santa Clara, CA), which was placed in an
oven programmed from 140°C for 10 m to 220°C at a rate of 2°C/m and held at 220°C for 20 m.
Total run time was 70 m. The injector and detector were programmed to operate at 270°C and
300°C, respectively. Each lipid extract was separated into fatty acids by using helium as the
carrier gas at a flow rate of 1 mL/m. Individual fatty acids of each sample were determined by
comparison of retention times with known standards. Each standard contained known fatty acids
that were ran through gas chromatography at the same time as the samples in order to provide a
reference point to identify fatty acids in the sample. Each fatty acid was expressed as weight
percentage value, which were relative proportions of all peaks observed by gas chromatography.
2.6 Objective Color Evaluation of Raw Beef Patties
The patty color was measured with a colorimeter (Chroma Meter CR-400; Konica
Minolta Sensing Americas, Inc., Ramsey, NJ) using a 2° standard observer and a D65 illuminant.
The calibration plate was read through polyvinyl chloride overwrap film used above since patties
were still within the packaging during the color measurement. The color of three locations on
each of two patties was measured, and the resulting measurements were averaged to calculate the
color values for each treatment. The same two patties were evaluated throughout display time.
Color was measured on days 0, 1, 2, 3, 4, 5, 6, and 7.
2.7 Subjective color evaluation
A five-person trained panel composed of graduate students of the Department of Animal
Science at University of Nebraska-Lincoln subjectively evaluated the percentage discoloration.
Discoloration was evaluated as percentage surface discoloration ranging from 0 to 100%. The

83
same two patties were evaluated throughout display time. Subjective color was evaluated on
days 0, 1, 2, 3, 4, 5, 6, and 7.
2.8 Lipid Oxidation
The 2-thiobarbuteric acid reactive substance assay (TBARS) described by Ahn et al.
(1998), which was a modification of the TBARS assay developed by Beuge and Aust (1978),
was used to measure the oxidation status of refrigerated and frozen cooked, ground, beef links
and fresh ground beef patties over storage time. Refrigerated links TBARS measurements were
taken every 3 d for 18 d, beginning at d 0. Frozen links TBARS measurements were taken every
28 d for 252 d, beginning at d 0.
Fourteen mL of deionized, distilled water and 1 mL of butylated hydroxyanisole solution
(10% BHA in 90% ethanol) were added to 5 g of pulverized sample. After homogenizing for 15
s using a Polytron (POLYTRON®
Kinimatica CH-6010, Switzerland), the homogenate was
centrifuged for 2,000 × g for 5 m. One mL of homogenate was mixed with 2 mL of 2-
thiobarbituric acid and trichloroacetic acid mixture (15% TCA (w/v) and 20 nM TBA in ddH20)
and vortexed for 5 s. The sample mixture was incubated at 70°C in a water bath for 30 min to
develop color. After samples were cooled in a cold-water bath for 10 m, the sample mixture was
centrifuged at 2,000 × g for 15 m. Duplicate 200 μL aliquots of each sample were transferred
into wells on a 96-well plate and the absorbance was read at 540 nm to calculate the mg of
malonaldehyde per kg of tissue using 1,1,3,3-tetraethoxypropane as the standard solution.
2.9 Statistical Analysis
Data for TBARS (refrigerated, frozen and raw patty), fatty acid analysis, proximate
analysis, objective color and percent discoloration were analyzed for dietary treatment (dietary
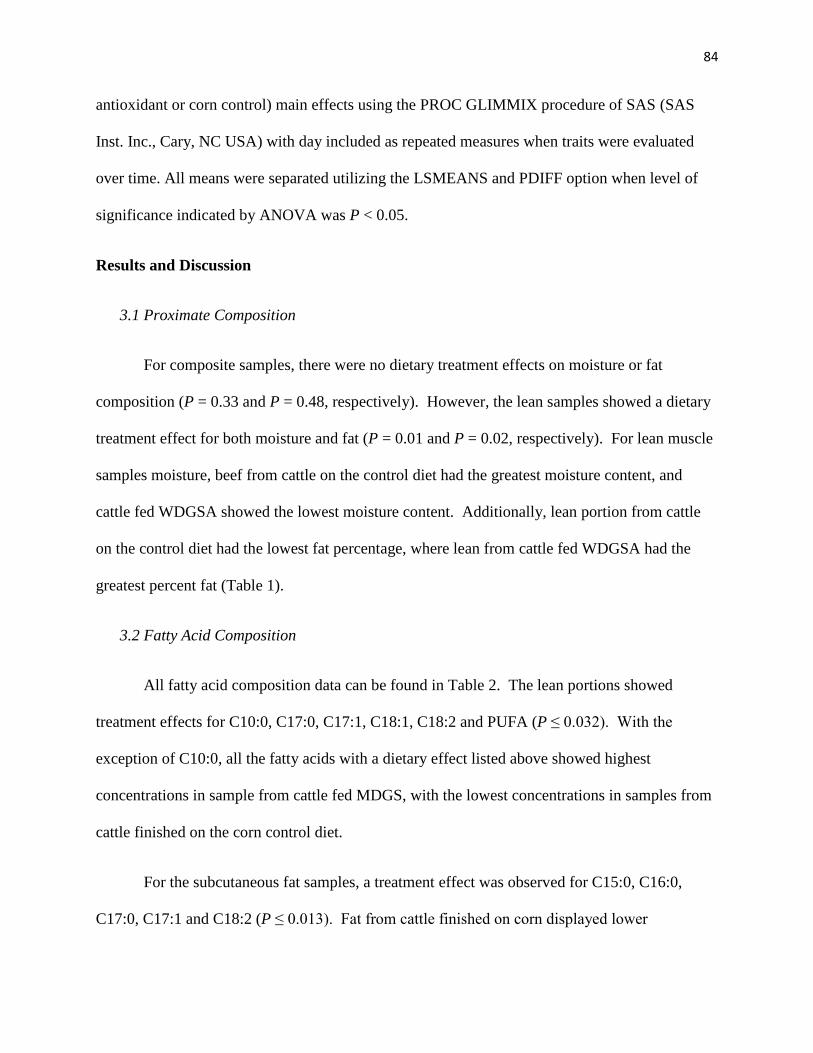
84
antioxidant or corn control) main effects using the PROC GLIMMIX procedure of SAS (SAS
Inst. Inc., Cary, NC USA) with day included as repeated measures when traits were evaluated
over time. All means were separated utilizing the LSMEANS and PDIFF option when level of
significance indicated by ANOVA was P < 0.05.
Results and Discussion
3.1 Proximate Composition
For composite samples, there were no dietary treatment effects on moisture or fat
composition (P = 0.33 and P = 0.48, respectively). However, the lean samples showed a dietary
treatment effect for both moisture and fat (P = 0.01 and P = 0.02, respectively). For lean muscle
samples moisture, beef from cattle on the control diet had the greatest moisture content, and
cattle fed WDGSA showed the lowest moisture content. Additionally, lean portion from cattle
on the control diet had the lowest fat percentage, where lean from cattle fed WDGSA had the
greatest percent fat (Table 1).
3.2 Fatty Acid Composition
All fatty acid composition data can be found in Table 2. The lean portions showed
treatment effects for C10:0, C17:0, C17:1, C18:1, C18:2 and PUFA (P ≤ 0.032). With the
exception of C10:0, all the fatty acids with a dietary effect listed above showed highest
concentrations in sample from cattle fed MDGS, with the lowest concentrations in samples from
cattle finished on the corn control diet.
For the subcutaneous fat samples, a treatment effect was observed for C15:0, C16:0,
C17:0, C17:1 and C18:2 (P ≤ 0.013). Fat from cattle finished on corn displayed lower

85
concentrations of C15:0 and C17:1 compared to all other dietary treatments. For C16:0, corn
had greater concentrations than diets with any supplementation of vitamin E (WDGSE and
WDGSAE), with WDGSA and WDGS having intermediate values. Corn-finished cattle had
lower concentrations of C17:0 than all other diets except WDGSA. WDGS and WDGSE-
finished cattle had greater concentrations of C18:2 than corn-finished cattle, with WDGSA and
WDGSAE similar to all treatments.
For the composite (ground) samples, a treatment effect was observed for C15:0, C16:1,
C17:0, C17:1, C18:0, C18:1T, C18:2, C20:3ω6, UFA, SFA:UFA and PUFA (P ≤ 0.027). Fatty
acid C15:0 and SFA:UFA in ground beef from a corn finishing diet were lower than all other
dietary treatments. Corn finished cattle also had lower concentrations of C17:0, C20:3ω6 and
PUFA than WDGS finished cattle, with all other diets similar to all treatments. For C17:1,
C18:1T and UFA, corn finished cattle had lower concentrations than WDGS and WDGSE, with
cattle supplemented Agrado having intermediate values. WDGSAE had lower concentrations of
C18:0 than WDGS, with WDGSA, WDGSE and corn having intermediate values. In C18:2,
corn had the lowest concentrations than all dietary treatments, followed by WDGSAE. WDGS
had the highest C18:2 concentrations. Fatty acid C16:1 was the only fatty acid where higher
concentrations were observed in corn cattle than WDGS and WDGSE, with Agrado
supplemented cattle having intermediate values.
It would be expected that the shift in PUFA and C18:2 concentrations in MDGS would
decrease lipid stability, which did not hold true in our raw beef study. It is likely that the dietary
antioxidant counteracted the fatty acid composition differences in lipid oxidation that would be
expected with increased PUFA content. The differences between fat, lean, and composite
samples suggest that different fat depots have different fatty acid profiles, where lean sample

86
would be indicative of intramuscular fat, fat sample would represent subcutaneous fat, and the
composite sample is homogenous representation of the whole shoulder clod.
3.3 Lipid Oxidation – Raw Patties
A day by dietary treatment effect was observed for oxidation of raw patties (P = 0.03).
On days 2 through 7 of simulated retail display, the corn control had higher TBARS values than
the patties from cattle with supplementation of vitamin E (WDGSE and WDGSAE). On days 3
and 5, the corn diet was more oxidized than all other dietary treatments. On the day 7 of
simulated retail display, beef from cattle fed WDGS displayed greater TBARS values than
WDGSAE (Table 3). All diets, with the exception of WDGSAE, displayed a significant increase
in TBARS values from day 5 to day 7 (Table 3). The inclusion of vitamin E resulted in less lipid
oxidation than the corn control on all days beyond day 0 (Table 3). In contrast, Koger et al.
(2010) determined that cattle fed distillers grains (40% DM) had higher TBARS values than
ground beef from cattle fed corn on d 2 and d 7 of display. The results of this study agreed with
those of Chao, Domenech-Perez, Voegele, Kunze, and Calkins (2015), where intact strip steaks
from the same cattle from this study showed greater lipid oxidation in the corn control than those
fed WDGS. Similar results were also seen by Domenech et al. (2014) in strip steaks, where the
corn control diet had higher mean TBARS values than any percentage of de-oiled distillers
grains (35, 50 and 65%). This is unexpected since the increase in PUFA in MDGS fed cattle
would typically result in lipid instability. However, Song et al. (2013) determined that the
increased sulfur content observed in DGS increased the concentrations of sulfur-containing
amino acids in beef. These amino acids are known to display antioxidant properties by acting a
hydrogen donor, which could explain why our corn control was more oxidized than WDGS,
despite the increase in PUFA in WDGS samples (Song et al., 2013).

87
3.4 Simulated Retail Display Color – Raw Patties
A time effect was observed for percent discoloration, where patties became more
discolored over time in simulated retail display (P < 0.0001, Table 4). No dietary effects were
observed (P = 0.60). This does not coincide with lipid oxidation, since the corn control diet had
greater oxidation than all vitamin E diets but no difference in color stability. A time effect was
observed for L*, a* and b* values (P < 0.0001) (Table 4) but no dietary effects were observed
for instrumental color measurements (P = 0.39, 0.07 and 0.60 for L*, a*, and b*, respectively).
Dietary treatment differences in TBARS concentrations observed in raw patties did not correlate
to color stability in this study. In a previous study completed on ground beef stability from cattle
fed DGS, percent discoloration was higher and L* values were lower for cattle supplement
MDGS versus corn gluten feed in the finishing phase (Buntyn et al., 2014). The increase in time
on DGS and concentration could heighten the dietary effects on color stability.
3.5 Lipid Oxidation– Cooked Beef Links
An expected a day of storage effect was observed for lipid oxidation in cooked beef links
in refrigerated storage where TBARS concentrations increased over time (P = 0.01; Table 5). A
trend for dietary effect was observed, where beef links from WDGS + Agrado cattle tended to
have higher TBARS values than the other dietary treatments (P = 0.10). Since this effect was
not observed in raw patties from the same shoulder clod, it may suggest that Ethoxyquin (EQ) or
TBHQ is heat sensitive and gains pro-oxidative activities after cooking. Phenolic antioxidants
under the right conditions may be converted to phenoxyl radicals with prooxidant activity
(Błaszczyk, Augustyniak, & Skolimowski, 2013). Therefore, ethoxyquin nitroxide, which is

88
produced by EQ oxidation, may show prooxidative properties when exposed to oxidative stress
(Błaszczyk et al., 2013).
As with beef links in refrigerated strorage, frozen beef links had greater oxidation with
increased storage. (P = <0.0001; Figure 1). No dietary treatment effects were found (P = 0.13).
As dietary treatment effects on lipid oxidation of beef links during refrigerated storage was only
a trend, this may not indicate major changes.
3 Conclusion
Raw ground beef patties discolored over time, and no dietary treatment effects were
observed. Conversely, the TBARS concentrations showed that patties from cattle fed the corn
control diet during finishing were among the most oxidized. A trend for refrigerated, cooked
beef links suggests that cattle fed WDGSA had greater lipid oxidation than other dietary
treatments and may be due to heating causing EQ to become oxidized, and acting as a pro-
oxidant. These dietary effects did not carry through to the frozen links, however, suggesting that
frozen storage may reduce the pro-oxidant effect. As expected, an increase in C18:2 (linoleic
acid) was seen for all samples from cattle finished on MDGS, as well as an increase in PUFA in
lean and composite samples. The lack of relationships between fatty acid composition, raw patty
color stability, and lipid oxidation in raw and cooked ground beef may be related to the
effectiveness of vitamin E as an antioxidant in raw and cooked ground beef.
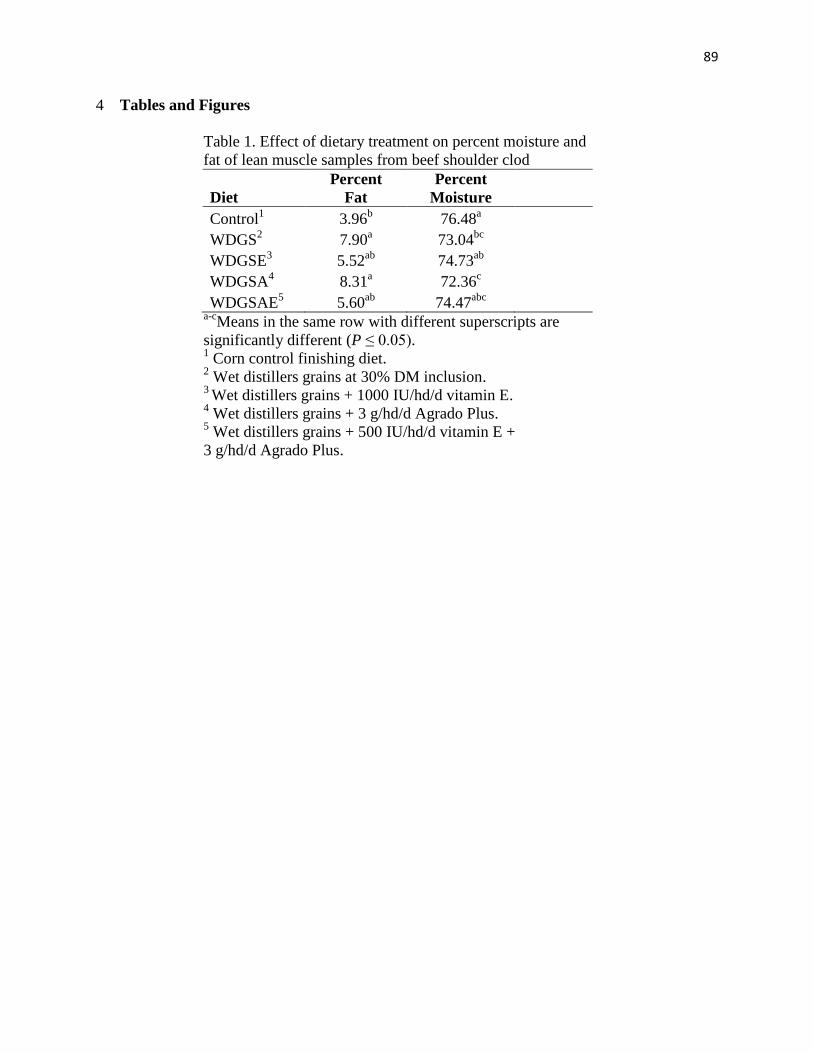
89
4 Tables and Figures
Table 1. Effect of dietary treatment on percent moisture and
fat of lean muscle samples from beef shoulder clod
Diet
Percent
Fat
Percent
Moisture
Control1
3.96b 76.48
a
WDGS2
7.90a 73.04
bc
WDGSE3
5.52ab
74.73ab
WDGSA4
8.31a 72.36
c
WDGSAE5
5.60ab
74.47abc
a-c
Means in the same row with different superscripts are
significantly different (P ≤ 0.05). 1 Corn control finishing diet.
2 Wet distillers grains at 30% DM inclusion.
3 Wet distillers grains + 1000 IU/hd/d vitamin E.
4 Wet distillers grains + 3 g/hd/d Agrado Plus.
5 Wet distillers grains + 500 IU/hd/d vitamin E +
3 g/hd/d Agrado Plus.
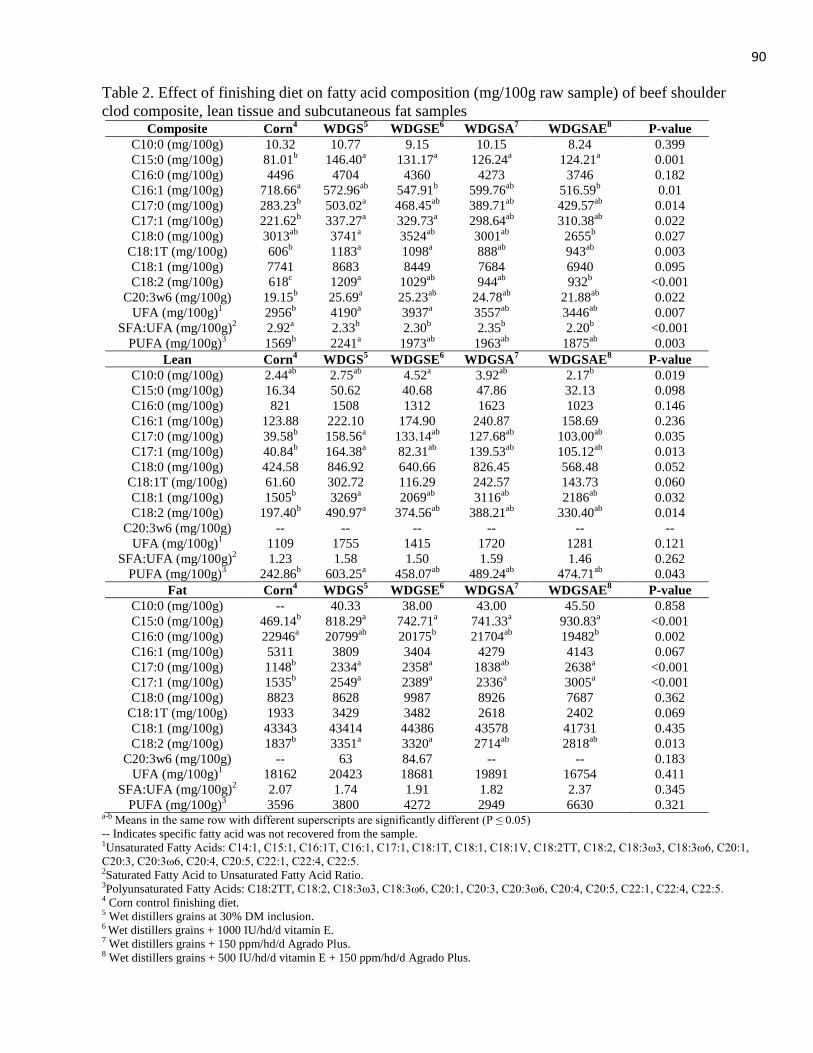
90
Table 2. Effect of finishing diet on fatty acid composition (mg/100g raw sample) of beef shoulder
clod composite, lean tissue and subcutaneous fat samples Composite Corn
4 WDGS
5 WDGSE
6 WDGSA
7 WDGSAE
8 P-value
C10:0 (mg/100g) 10.32 10.77 9.15 10.15 8.24 0.399
C15:0 (mg/100g) 81.01b 146.40
a 131.17
a 126.24
a 124.21
a 0.001
C16:0 (mg/100g) 4496 4704 4360 4273 3746 0.182
C16:1 (mg/100g) 718.66a 572.96
ab 547.91
b 599.76
ab 516.59
b 0.01
C17:0 (mg/100g) 283.23b 503.02
a 468.45
ab 389.71
ab 429.57
ab 0.014
C17:1 (mg/100g) 221.62b 337.27
a 329.73
a 298.64
ab 310.38
ab 0.022
C18:0 (mg/100g) 3013ab
3741a 3524
ab 3001
ab 2655
b 0.027
C18:1T (mg/100g) 606b 1183
a 1098
a 888
ab 943
ab 0.003
C18:1 (mg/100g) 7741 8683 8449 7684 6940 0.095
C18:2 (mg/100g) 618c 1209
a 1029
ab 944
ab 932
b <0.001
C20:3w6 (mg/100g) 19.15b 25.69
a 25.23
ab 24.78
ab 21.88
ab 0.022
UFA (mg/100g)1
2956b 4190
a 3937
a 3557
ab 3446
ab 0.007
SFA:UFA (mg/100g)2 2.92
a 2.33
b 2.30
b 2.35
b 2.20
b <0.001
PUFA (mg/100g)3 1569
b 2241
a 1973
ab 1963
ab 1875
ab 0.003
Lean Corn4
WDGS5
WDGSE6
WDGSA7
WDGSAE8
P-value
C10:0 (mg/100g) 2.44ab
2.75ab
4.52a 3.92
ab 2.17
b 0.019
C15:0 (mg/100g) 16.34 50.62 40.68 47.86 32.13 0.098
C16:0 (mg/100g) 821 1508 1312 1623 1023 0.146
C16:1 (mg/100g) 123.88 222.10 174.90 240.87 158.69 0.236
C17:0 (mg/100g) 39.58b 158.56
a 133.14
ab 127.68
ab 103.00
ab 0.035
C17:1 (mg/100g) 40.84b 164.38
a 82.31
ab 139.53
ab 105.12
ab 0.013
C18:0 (mg/100g) 424.58 846.92 640.66 826.45 568.48 0.052
C18:1T (mg/100g) 61.60 302.72 116.29 242.57 143.73 0.060
C18:1 (mg/100g) 1505b 3269
a 2069
ab 3116
ab 2186
ab 0.032
C18:2 (mg/100g) 197.40b 490.97
a 374.56
ab 388.21
ab 330.40
ab 0.014
C20:3w6 (mg/100g) -- -- -- -- -- --
UFA (mg/100g)1
1109 1755 1415 1720 1281 0.121
SFA:UFA (mg/100g)2 1.23 1.58 1.50 1.59 1.46 0.262
PUFA (mg/100g)3 242.86
b 603.25
a 458.07
ab 489.24
ab 474.71
ab 0.043
Fat Corn4
WDGS5
WDGSE6
WDGSA7
WDGSAE8
P-value
C10:0 (mg/100g) -- 40.33 38.00 43.00 45.50 0.858
C15:0 (mg/100g) 469.14b 818.29
a 742.71
a 741.33
a 930.83
a <0.001
C16:0 (mg/100g) 22946a 20799
ab 20175
b 21704
ab 19482
b 0.002
C16:1 (mg/100g) 5311 3809 3404 4279 4143 0.067
C17:0 (mg/100g) 1148b 2334
a 2358
a 1838
ab 2638
a <0.001
C17:1 (mg/100g) 1535b 2549
a 2389
a 2336
a 3005
a <0.001
C18:0 (mg/100g) 8823 8628 9987 8926 7687 0.362
C18:1T (mg/100g) 1933 3429 3482 2618 2402 0.069
C18:1 (mg/100g) 43343 43414 44386 43578 41731 0.435
C18:2 (mg/100g) 1837b 3351
a 3320
a 2714
ab 2818
ab 0.013
C20:3w6 (mg/100g) -- 63 84.67 -- -- 0.183
UFA (mg/100g)1
18162 20423 18681 19891 16754 0.411
SFA:UFA (mg/100g)2 2.07 1.74 1.91 1.82 2.37 0.345
PUFA (mg/100g)3 3596 3800 4272 2949 6630 0.321
a-b Means in the same row with different superscripts are significantly different (P ≤ 0.05)
-- Indicates specific fatty acid was not recovered from the sample. 1Unsaturated Fatty Acids: C14:1, C15:1, C16:1T, C16:1, C17:1, C18:1T, C18:1, C18:1V, C18:2TT, C18:2, C18:3ω3, C18:3ω6, C20:1,
C20:3, C20:3ω6, C20:4, C20:5, C22:1, C22:4, C22:5. 2Saturated Fatty Acid to Unsaturated Fatty Acid Ratio. 3Polyunsaturated Fatty Acids: C18:2TT, C18:2, C18:3ω3, C18:3ω6, C20:1, C20:3, C20:3ω6, C20:4, C20:5, C22:1, C22:4, C22:5. 4 Corn control finishing diet. 5 Wet distillers grains at 30% DM inclusion. 6 Wet distillers grains + 1000 IU/hd/d vitamin E. 7 Wet distillers grains + 150 ppm/hd/d Agrado Plus. 8 Wet distillers grains + 500 IU/hd/d vitamin E + 150 ppm/hd/d Agrado Plus.

91
Table 3. Effect of day of simulated retail display by dietary treatment
interaction (P = 0.03) on lipid oxidation† in raw ground beef patties
Dietary Treatment
Day Corn1
WDGS2
WDGSE WDGSA WDGSAE
0 1.6gh
1.75fgh
1.41h 1.58
gh 1.51
gh
1 2.26efg
1.45gh
1.66fgh
1.94fgh
1.94fgh
2 2.97de
2.16efg
1.78fgh
2.01efgh
1.72fgh
3 3.52dc
2.35ef
1.95fgh
2.29ef
1.88fgh
5 4.51bc
3.02de
2.28efg
2.92de
2.12efgh
7 5.94a 5.24
ab 3.69
bcd 4.58
abc 3.21
cde
a-hMeans in the same table with different superscripts are
significantly different (P ≤ 0.05). 1 Corn control finishing diet.
2 Wet distillers grains at 30% DM inclusion.
3 Wet distillers grains + 1000 IU/hd/d vitamin E.
4 Wet distillers grains + 3 g/hd/d Agrado Plus.
5 Wet distillers grains + 500 IU/hd/d vitamin E + 3 g/hd/d
Agrado Plus. † All means for lipid oxidation presented as mg of malonaldehyde/kg of sample.

92
Table 4. Effect of day of simulated retail display on percent discoloration objective color of
raw ground beef patties
Day
%
Discoloration L* a* b*
0 0.37h
52.31a 25.35
a 12.49
a
1 0.54g
50.61bcd
22.90b 11.47
b
2 0.86f
50.34cd
20.72c 10.81
c
3 1.31e
48.75e 19.58
d 10.24
d
4 6.34d
49.75d 17.41
e 9.88
e
5 25.04c
50.02d 14.97
f 9.33
f
6 66.18b
51.08cb
10.23g 9.47
f
7 86.02a 51.25
b 8.22
h 9.61
f
a-hMeans in the same row with different superscripts are significantly different (P ≤ 0.05).
93
Table 5. Effect of days of refrigerated storage on lipid oxidation in
cooked beef links
Day
Thiobarbituric Acid
Reactive Substances1
0 1.05f
3 2.12e
6 2.74cd
9 2.51de
12 3.79bc
15 4.17ab
18 4.88a
a-f Means in the same column with different superscripts
are significantly different (P ≤ 0.05) 1mg of malonaldehyde/kg of sample
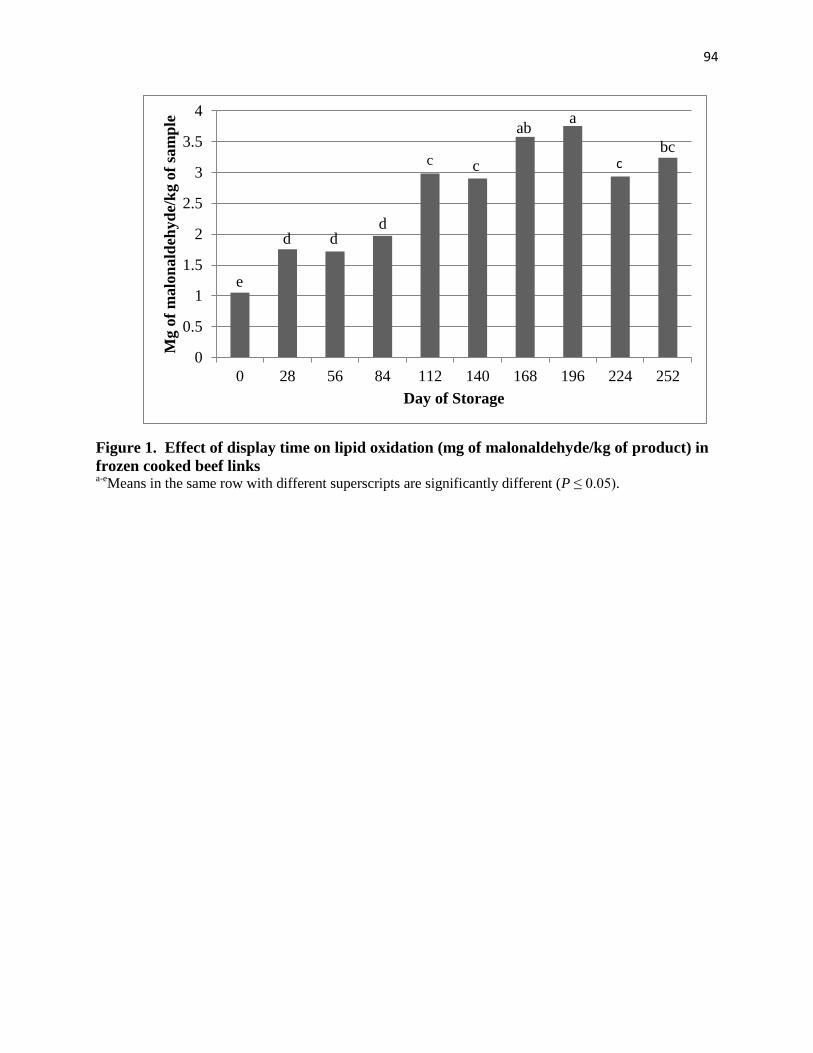
94
Figure 1. Effect of display time on lipid oxidation (mg of malonaldehyde/kg of product) in
frozen cooked beef links a-e
Means in the same row with different superscripts are significantly different (P ≤ 0.05).
0
0.5
1
1.5
2
2.5
3
3.5
4
0 28 56 84 112 140 168 196 224 252
Mg o
f m
alo
nald
ehyd
e/k
g o
f sa
mp
le
Day of Storage
e
d d d
c c c
ab a
bc
95
Literature Cited
Ahn, J., Grün, I., & Fernando, L. (2002). Antioxidant properties of natural plant extracts
containing polyphenolic compounds in cooked ground beef. Journal of Food Science,
67(4), 1364-1369.
Błaszczyk, A., Augustyniak, A. & Skolimowski, J. (2013). Ethoxyquin: An Antioxidant Used in
Animal Feed. International Journal of Food Science. vol. 2013, Article ID 585931, 12
pages.
Berges, E. (1999). Importance of vitamin E in the oxidative stability of meat: organoleptic
qualities and consequences. Cahiers Options Méditerranéennes (CIHEAM).
Buege, J., & Aust, S. (1978). The thiobarbituric acid assay. Methods in Enzymology, 52, 306-
307.
Chao, M.D., Domenech-Perez, K. I., Voegele, H. R., Kunze, E. K. & Calkins, C. R. (2015).
Effects of dietary antioxidant supplementation of cattle finished with 30% wet distillers
grains plus solubles on fatty acid profiles and display life. Submitted for the Proceedings
of 68th Reciprocal Meats Conference, Lincoln, NE.
Choat, W., Brooks, J., Krehbiel, C., Nelson, J., Gill, D., Morgan, J., & McDowell, L. (2002).
Effect of Supplementing AGRADO® Antioxidant (AOX) on Feedlot Performance and
Carcass Characteristics of Beef Steers and Shelf-Life of Beef. Oklahoma State Animal
Science Research Reports. Available online: http://ansi.okstate.edu. Accessed: 17 Feb,
2015.
Christie, W. W. (1978). The composition, structure and function of lipids in the tissues of
ruminant animals. Progress in Lipid Research, 17(2), 111-205.
Cleveland, B., Buntyn, J., Redfield, A., MacDonald, J., Erickson, G., Jones, T., & Sullivan, G.
(2014). Oxidation of cooked ground beef links from cattle fed distiller's grains in
different phases of production. University of Nebraska Beef Reports. 107-108. Available
online: http://beef.unl.edu/nebeefreport2014. Accessed: 24 Feb, 2015.
Dierks, N. T., Jones, T. F., Varnold, K. A., Schroeder, D. J., Redfield, A. L., & Sullivan, G. A.
(2014). Shelf Life of Cooked Ground Beef Patties From Cattle Fed Wet Distillers Grains
with Solubles. University of Nebraska Beef Reports. 104-105. Available online:
http://beef.unl.edu/nebeefreport2014. Accessed: 24 Feb, 2015.
Domenech, K. I., Varnold, K. A., Semler, M. E., Chao, M. D., Jones, T. F., Erickson, G. E., &
Calkins, C. R. (2014). Effect of Feeding De-oiled Wet Distillers Grains Plus Solubles on
Beef Fatty Acid Profiles. University of Nebraska Beef Reports. 114-115. Available
online: http://beef.unl.edu/nebeefreport2014. Accessed: 24 Feb, 2015.
96
Faustman, C., Cassens, R., Schaefer, D., Buege, D., & Scheller, K. (1989). Vitamin E
supplementation of Holstein steer diets improves sirloin steak color. Journal of Food
Science, 54(2), 485-486.
Folch, J., Lees, M., & Stanley, G., 1957. A simple method for the isolation and purification of
total lipids from animal tissues. Journal of Biological Chemistry. 226:497-509.
Gill, R., VanOverbeke, D., Depenbusch, B., Drouillard, J., & DiCostanzo, A. (2008). Impact of
beef cattle diets containing corn or sorghum distillers grains on beef color, fatty acid
profiles, and sensory attributes. Journal of Animal Science, 86(4), 923-935.
Jo, C., & Ahn, D. (1998). Fluorometric analysis of 2-thiobarbituric acid reactive substances in
turkey. Poultry Science, 77(3), 475-480.
Koger, T., Wulf, D., Weaver, A., Wright, C., Tjardes, K., Mateo, K.,& Smart, A. (2010).
Influence of feeding various quantities of wet and dry distillers grains to finishing steers
on carcass characteristics, meat quality, retail-case life of ground beef, and fatty acid
profile of longissimus muscle. Journal of Animal Science, 88(10), 3399-3408.
Krumsiek, C., & Owens, F. (1998). Agrado® for finishing cattle: Effects on performance,
carcass measurements. Oklahoma State Animal Science Research Reports, 64-68.
Maddock, R., Wulf, D., & McKenna, D. (2003). The effect of ethoxyquin and vitamin E
supplementation on the display life of beef steaks. Journal of Food Science, 68(3), 1072-
1074.
McCarthy, T., Kerry, J., Kerry, J., Lynch, P., & Buckley, D. (2001). Evaluation of the
antioxidant potential of natural food/plant extracts as compared with synthetic
antioxidants and vitamin E in raw and cooked pork patties. Meat Science, 58(1), 45-52.
Metcalfe, L., Schmitz, A., & Pelka, J. 1966. Rapid penetration of fatty acid esters from lipids for
gas chromatographic analysis. Analytical Chemistry. 38:514:515.
Renewable Fuels Association (RFA). (2015). Statistics. Retrieved Jan. 15, 2015, from
http://www.ethanolrfa.org/pages/statistics
Sales, J., & Koukolová, V. (2011). Dietary vitamin E and lipid and color stability of beef and
pork: Modeling of relationships. Journal of Animal Science, 89(9), 2836-2848.
Sato, K., & Hegarty, G. R. (1971). Warmed‐over flavor in cooked meats. Journal of Food
Science, 36(7), 1098-1102.
Schultz, H., & Sinnhuber, R. (1962). Proceedings of the Symposium on Foods: Lipids and Their
Oxidation.

97
Song, R., C. Chen, L. Wang, L. Johnston, B. Kerr, T. Weber, & G. Shurson. 2013. High sulfur
content in corn dried distillers grains with solubles protects against oxidized lipids by
increasing sulfur-containing antioxidants in nursery pigs. Journal of Animal Science 91:
2715-2728.
Vander Pol, K., Luebbe, M. K., Crawford, G., Erickson, G. E., & Klopfenstein, T. J. (2009).
Performance and digestibility characteristics of finishing diets containing distillers grains,
composites of corn processing coproducts, or supplemental corn oil. Journal of Animal
Science, 87(2), 639-652.
Walenciak, C., Gardner, B., Dolezal, H., & Owens, F. (1999). Effects of including Agrado in
finishing diets for beef cattle in retail case-life of ground beef and top loin steaks.
Oklahoma Agriculture Experiment Station Research Report P-973, 67-71.
98
5. Recommendations for Future Research
These studies showed the effectiveness of natural plant extract and dietary vitamin E on
increasing shelf life of both cooked and raw ground beef. Continuing to evaluate the effect of
distillers grains with different processing methods or grain source, wheat distillers, for example,
would be a good way to compare and contrast the different types of distillers and grain source.
Additionally, a study conducted using a combination of the both of the antioxidant approaches
would be helpful to determine if there are any synergistic impacts on shelf life. Further research
on the stability and effect of Agrado in tissues would be necessary, particularly in the realm of
the effect of heat treatment on antioxidant capabilities of Agrado. Guidelines could be
established for heat tolerance of different types of antioxidants to determine if certain
antioxidants gain pro-oxidative activity or lose their antioxidant abilities with different levels of
heat. Finally, an economic perspective can be evaluated on the antioxidants, in terms of cost
analysis for large scale producers and to what extent will the consumer pay for products with
natural antioxidants added.

99
6. Appendices
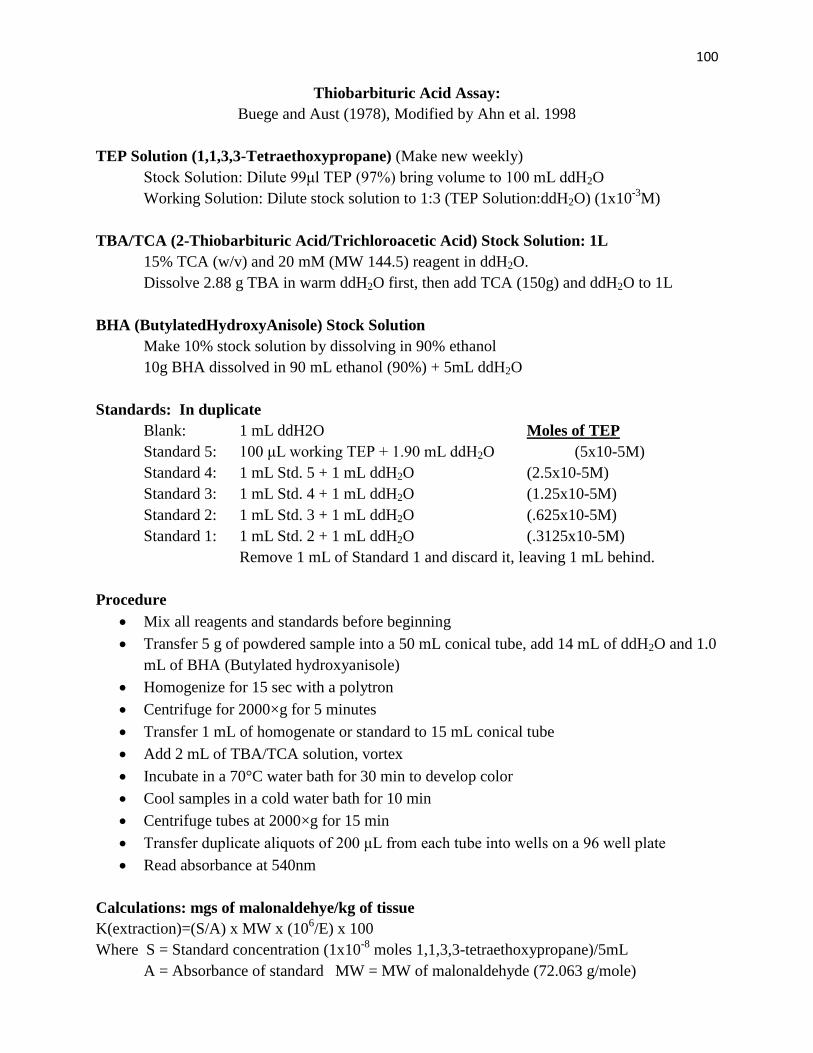
100
Thiobarbituric Acid Assay:
Buege and Aust (1978), Modified by Ahn et al. 1998
TEP Solution (1,1,3,3-Tetraethoxypropane) (Make new weekly)
Stock Solution: Dilute 99μl TEP (97%) bring volume to 100 mL ddH2O
Working Solution: Dilute stock solution to 1:3 (TEP Solution:ddH2O) (1x10⁻³
M)
TBA/TCA (2-Thiobarbituric Acid/Trichloroacetic Acid) Stock Solution: 1L
15% TCA (w/v) and 20 mM (MW 144.5) reagent in ddH2O.
Dissolve 2.88 g TBA in warm ddH2O first, then add TCA (150g) and ddH2O to 1L
BHA (ButylatedHydroxyAnisole) Stock Solution
Make 10% stock solution by dissolving in 90% ethanol
10g BHA dissolved in 90 mL ethanol (90%) + 5mL ddH2O
Standards: In duplicate
Blank: 1 mL ddH2O Moles of TEP
Standard 5: 100 μL working TEP + 1.90 mL ddH2O (5x10⁻⁵M)
Standard 4: 1 mL Std. 5 + 1 mL ddH2O (2.5x10⁻⁵M)
Standard 3: 1 mL Std. 4 + 1 mL ddH2O (1.25x10⁻⁵M)
Standard 2: 1 mL Std. 3 + 1 mL ddH2O (.625x10-5M)
Standard 1: 1 mL Std. 2 + 1 mL ddH2O (.3125x10-5M)
Remove 1 mL of Standard 1 and discard it, leaving 1 mL behind.
Procedure
Mix all reagents and standards before beginning
Transfer 5 g of powdered sample into a 50 mL conical tube, add 14 mL of ddH2O and 1.0
mL of BHA (Butylated hydroxyanisole)
Homogenize for 15 sec with a polytron
Centrifuge for 2000×g for 5 minutes
Transfer 1 mL of homogenate or standard to 15 mL conical tube
Add 2 mL of TBA/TCA solution, vortex
Incubate in a 70°C water bath for 30 min to develop color
Cool samples in a cold water bath for 10 min
Centrifuge tubes at 2000×g for 15 min
Transfer duplicate aliquots of 200 μL from each tube into wells on a 96 well plate
Read absorbance at 540nm
Calculations: mgs of malonaldehye/kg of tissue
K(extraction)=(S/A) x MW x (106/E) x 100
Where S = Standard concentration (1x10⁻⁸
moles 1,1,3,3-tetraethoxypropane)/5mL
A = Absorbance of standard MW = MW of malonaldehyde (72.063 g/mole)
101
E = sample equivalent (1) P = Percent recovery
Final calculation: .012 x concentration x 72.063x10-6 = mgs of Malonaldehyde/kg of tissue
Reagents (Sigma): TBA- T5500; TCA- T9159; TEP- T9889; BHA- B1253
References:
Buege, J., & Aust, S. (1978). The thiobarbituric acid assay. Methods in Enzymology, 52, 306-
307.
Jo, C., & Ahn, D. (1998). Fluorometric analysis of 2-thiobarbituric acid reactive substances in
turkey. Poultry Science, 77(3), 475-480.
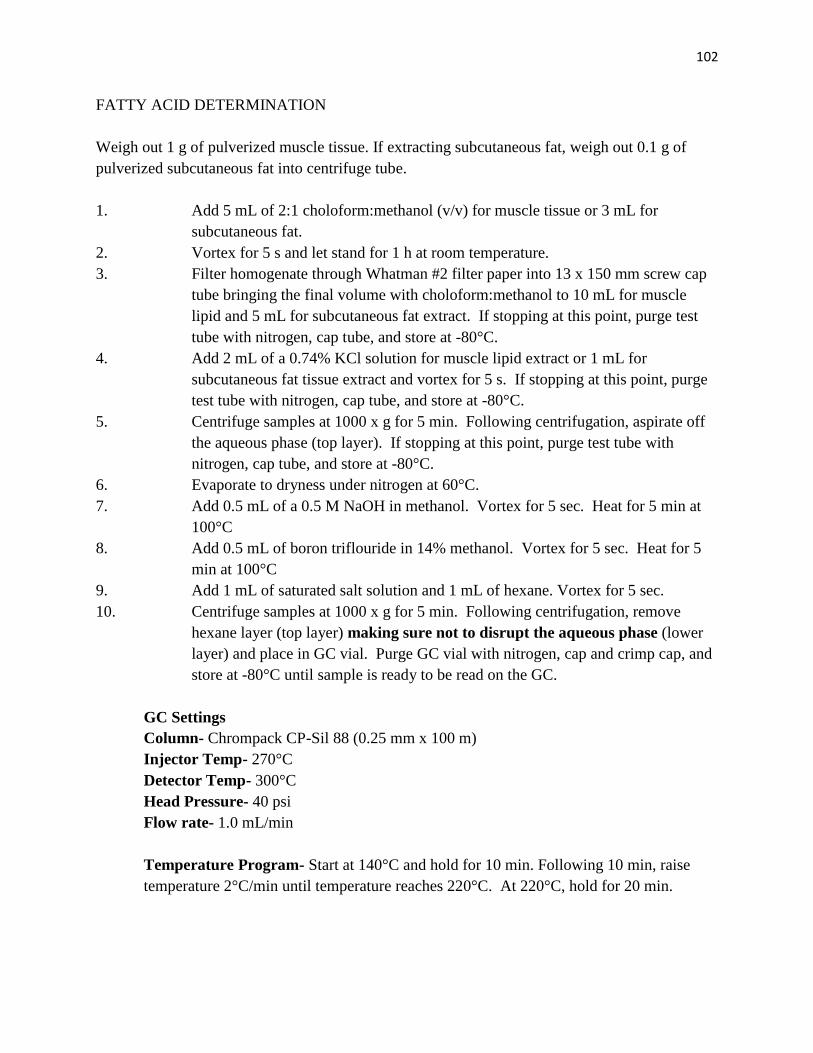
102
FATTY ACID DETERMINATION
Weigh out 1 g of pulverized muscle tissue. If extracting subcutaneous fat, weigh out 0.1 g of
pulverized subcutaneous fat into centrifuge tube.
1. Add 5 mL of 2:1 choloform:methanol (v/v) for muscle tissue or 3 mL for
subcutaneous fat.
2. Vortex for 5 s and let stand for 1 h at room temperature.
3. Filter homogenate through Whatman #2 filter paper into 13 x 150 mm screw cap
tube bringing the final volume with choloform:methanol to 10 mL for muscle
lipid and 5 mL for subcutaneous fat extract. If stopping at this point, purge test
tube with nitrogen, cap tube, and store at -80°C.
4. Add 2 mL of a 0.74% KCl solution for muscle lipid extract or 1 mL for
subcutaneous fat tissue extract and vortex for 5 s. If stopping at this point, purge
test tube with nitrogen, cap tube, and store at -80°C.
5. Centrifuge samples at 1000 x g for 5 min. Following centrifugation, aspirate off
the aqueous phase (top layer). If stopping at this point, purge test tube with
nitrogen, cap tube, and store at -80°C.
6. Evaporate to dryness under nitrogen at 60°C.
7. Add 0.5 mL of a 0.5 M NaOH in methanol. Vortex for 5 sec. Heat for 5 min at
100°C
8. Add 0.5 mL of boron triflouride in 14% methanol. Vortex for 5 sec. Heat for 5
min at 100°C
9. Add 1 mL of saturated salt solution and 1 mL of hexane. Vortex for 5 sec.
10. Centrifuge samples at 1000 x g for 5 min. Following centrifugation, remove
hexane layer (top layer) making sure not to disrupt the aqueous phase (lower
layer) and place in GC vial. Purge GC vial with nitrogen, cap and crimp cap, and
store at -80°C until sample is ready to be read on the GC.
GC Settings
Column- Chrompack CP-Sil 88 (0.25 mm x 100 m)
Injector Temp- 270°C
Detector Temp- 300°C
Head Pressure- 40 psi
Flow rate- 1.0 mL/min
Temperature Program- Start at 140°C and hold for 10 min. Following 10 min, raise
temperature 2°C/min until temperature reaches 220°C. At 220°C, hold for 20 min.

103
References:
Folch, J., Lees, M., & Stanley, G. 1957. A simple method for the isolation and purification of
total lipids from animal tissues. Journal of Biological Chemistry. 226:497-509.
Metcalfe, L., Schmitz, A., Pelka, J. 1966. Rapid penetration of fatty acid esters from lipids for
gas chromatographic analysis. Analytical Chemistry. 38:514:515.
Morrison, W. & Smith, L. 1964. Preparation of fatty acid methyl esters and dimethylacetals
from lipids with boron fluoride-methanol. Journal of Lipid Research. 5:600-608.
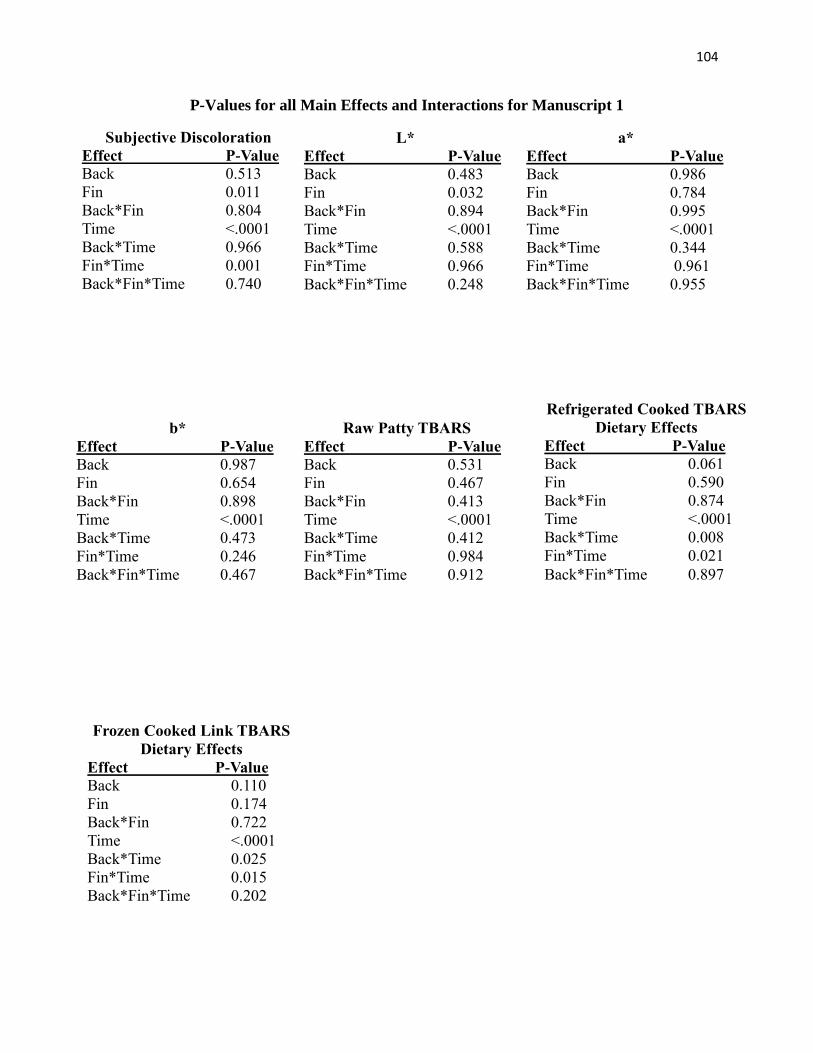
104
P-Values for all Main Effects and Interactions for Manuscript 1
Subjective Discoloration
Effect P-Value Back 0.513
Fin 0.011
Back*Fin 0.804
Time <.0001
Back*Time 0.966
Fin*Time 0.001
Back*Fin*Time 0.740
L*
Effect P-Value
Back 0.483
Fin 0.032
Back*Fin 0.894
Time <.0001
Back*Time 0.588
Fin*Time 0.966
Back*Fin*Time 0.248
a*
Effect P-Value
Back 0.986
Fin 0.784
Back*Fin 0.995
Time <.0001
Back*Time 0.344
Fin*Time 0.961
Back*Fin*Time 0.955
b*
Effect P-Value
Back 0.987
Fin 0.654
Back*Fin 0.898
Time <.0001
Back*Time 0.473
Fin*Time 0.246
Back*Fin*Time 0.467
Raw Patty TBARS
Effect P-Value
Back 0.531
Fin 0.467
Back*Fin 0.413
Time <.0001
Back*Time 0.412
Fin*Time 0.984
Back*Fin*Time 0.912
Refrigerated Cooked TBARS
Dietary Effects
Effect P-Value
Back 0.061
Fin 0.590
Back*Fin 0.874
Time <.0001
Back*Time 0.008
Fin*Time 0.021
Back*Fin*Time 0.897
Frozen Cooked Link TBARS
Dietary Effects
Effect P-Value
Back 0.110
Fin 0.174
Back*Fin 0.722
Time <.0001
Back*Time 0.025
Fin*Time 0.015
Back*Fin*Time 0.202

105
Refrigerated Cooked TBARS
Effect P-Value
Back 0.054
Fin 0.351
Antiox <.0001
Back*Fin 0.599
Antiox*Back 0.074
Antiox*Fin 0.833
Antiox*Back*Fin 0.527
Time <.0001
Antiox*Time <.0001
Back*Time 0.130
Fin*Time 0.518
Back*Fin*Time 0.960
Antiox*Back*Time 0.514
Antiox*Fin*Time 0.324
Antiox*Back*Fin*Time 0.686
Frozen Cooked Link TBARS
Effect P-Value
Back 0.069
Fin 0.172
Antiox <.0001
Back*Fin 0.558
Antiox*Back 0.830
Antiox*Fin 0.850
Antiox*Back*Fin 0.934
Time <.0001
Antiox*Time 0.009
Back*Time 0.231
Fin*Time 0.068
Back*Fin*Time 0.137
Antiox*Back*Time 0.372
Antiox*Fin*Time 0.103
Antiox*Back*Fin*Time 0.623
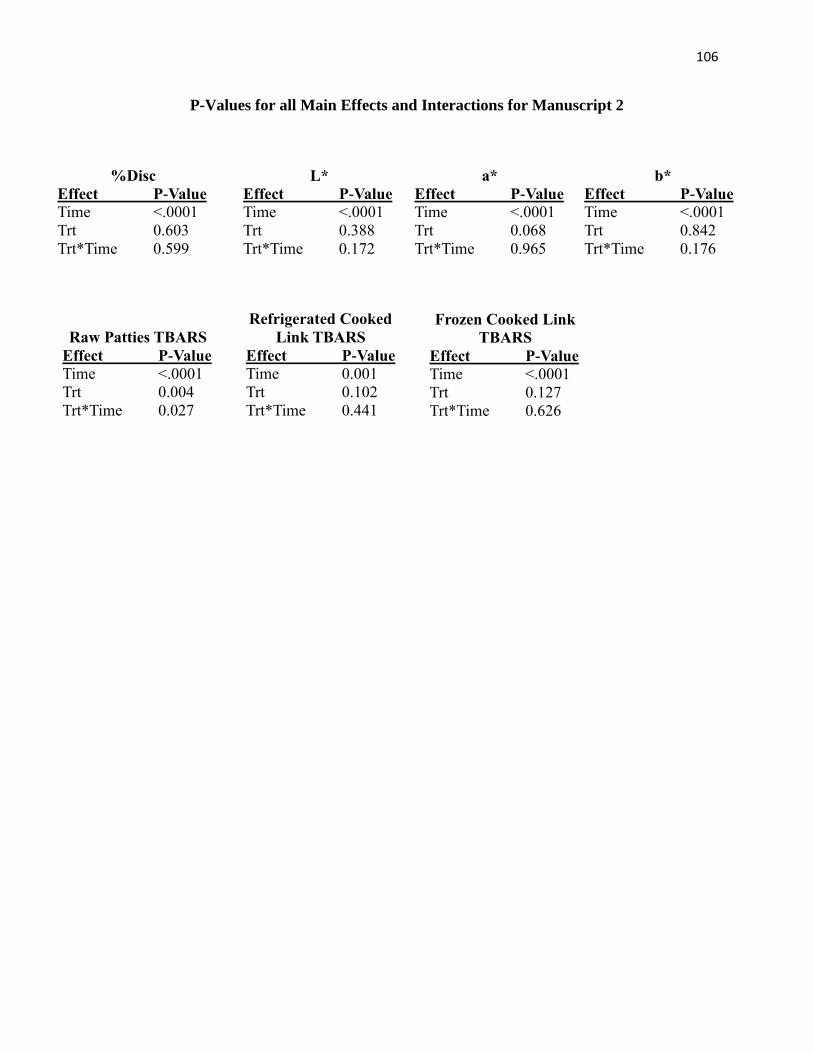
106
P-Values for all Main Effects and Interactions for Manuscript 2
%Disc
Effect P-Value
Time <.0001
Trt 0.603
Trt*Time 0.599
L*
Effect P-Value
Time <.0001
Trt 0.388
Trt*Time 0.172
a*
Effect P-Value
Time <.0001
Trt 0.068
Trt*Time 0.965
b*
Effect P-Value
Time <.0001
Trt 0.842
Trt*Time 0.176
Raw Patties TBARS
Effect P-Value
Time <.0001
Trt 0.004
Trt*Time 0.027
Refrigerated Cooked
Link TBARS
Effect P-Value
Time 0.001
Trt 0.102
Trt*Time 0.441
Frozen Cooked Link
TBARS
Effect P-Value
Time <.0001
Trt 0.127
Trt*Time 0.626