Embed Size (px)
Citation preview
AAllmmaa MMaatteerr SSttuuddiioorruumm ndashndash UUnniivveerrssiittagraveagrave ddii BBoollooggnnaa
DOTTORATO DI RICERCA IN
Colture Arboree ed Agrosistemi Forestali Ornamentali e Paesaggistici
Ciclo XXV
Settore Concorsuale di afferenza 07B2
Settore Scientifico disciplinare AGR03
EFFECTS OF GLOBAL WARMING ON BERRY COMPOSITION
OF cv SANGIOVESE BIOCHEMICAL AND MOLECULAR
ASPECTS AND AGRONOMICAL ADAPTATION APPROACHES
Presentata da Dr Nooshin Movahed
Coordinatore Dottorato Relatore Drssa Ilaria Filippetti
Prof Luca Corelli Grappadelli
CorrelatoriProf Andrea Masia
Drssa Sara Zenoni
Drssa Chiara Pastore
Esame finale anno 2013
Contents
1 GENERAL INTRODUCTION 1
11 Grape ripening 1
12 Grape berry composition 2
121 Sugars 2
122 Organic acids 2
123 Phenolic compounds 2
13 Biosynthesis of flavonoids in red grape berry 7
131 Synthesis of the early products of the phenylpropanoid pathway 7
132 Specific Steps towards flavonoid biosynthesis structural genes involved in flavonols flavan-3-ols
and anthocyanin biosynthesis 8
14 Flavonoid gene expression during berry development 11
141 Regulatory genes of anthocyanin biosynthesis pathway 13
2 Global Warming 14
3 Global warming and viticulture 15
31 The effects of global warming on berry ripening 15
4 GENERAL AIMS OF THE THESIS 20
Chapter one First partBiochemical and molecular approaches to study the effects of
temperature on grape composition in cv Sangiovese (Vitis vinifera L ) 22
1 INTRODUCTION 23
2 MATERIALS AND METHODS 24
21 Temperature monitoring 24
22 Berry sampling 25
23 degBrix titratable acidity and pH 25
24 Analyses of anthocyanins and flavonols 25
25 Tannins analysis 26
26 Real-time PCR analyses RNA extraction and RNA evaluation 27
27 Enzyme assay 30
3
27 1 PAL activity assay 30
27 2 UFGT activity assay 30
27 3 Guaiacol PODs activity assay 31
27 4 PPOs activity assay 31
28 Vegetative and Yield measurements 32
29 Statistical analyses 32
3 RESULTS AND DISCUSSION 32
31 Berry Temperature 32
32 Leaf area and Yield 34
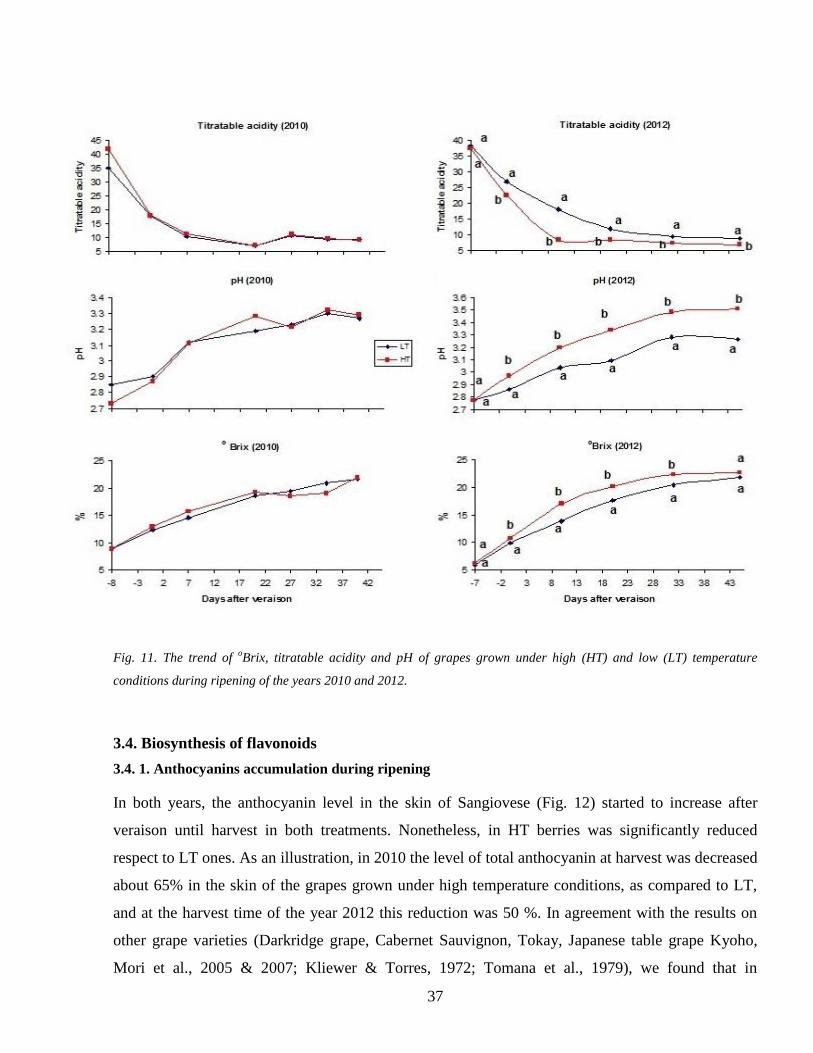
33 oBrix pH Titratable acidity 36
34 Biosynthesis of flavonoids 37
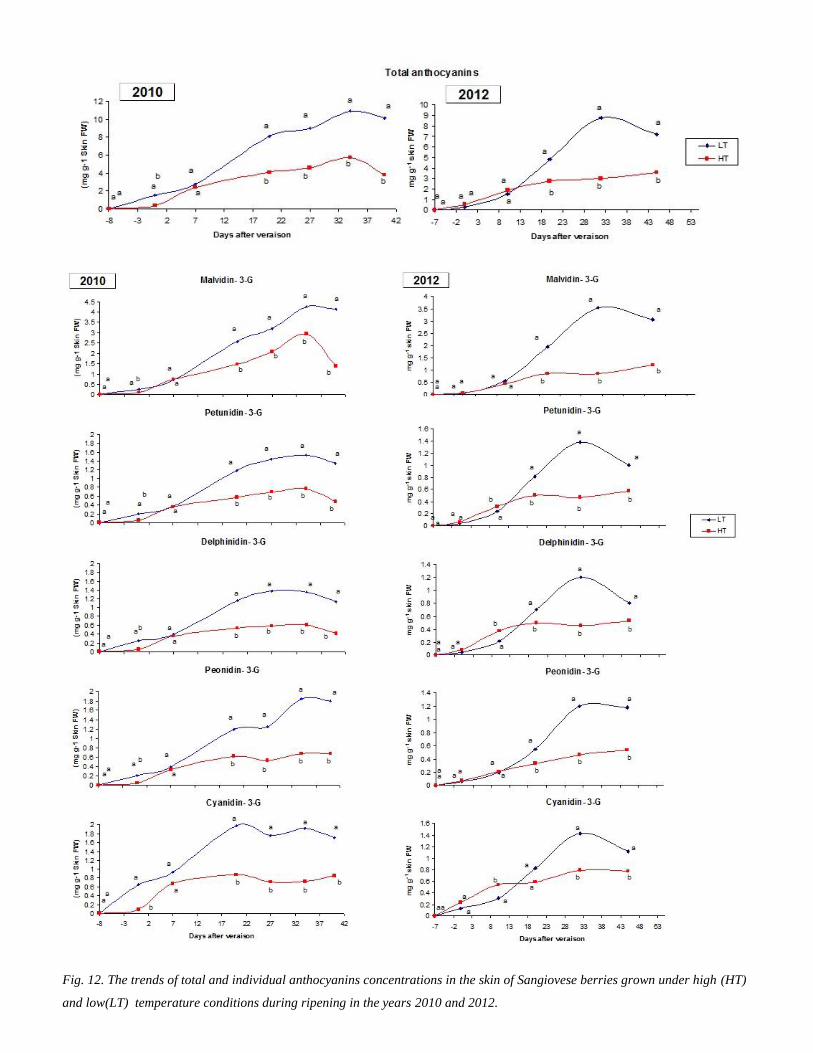
34 1 Anthocyanins accumulation during ripening 37
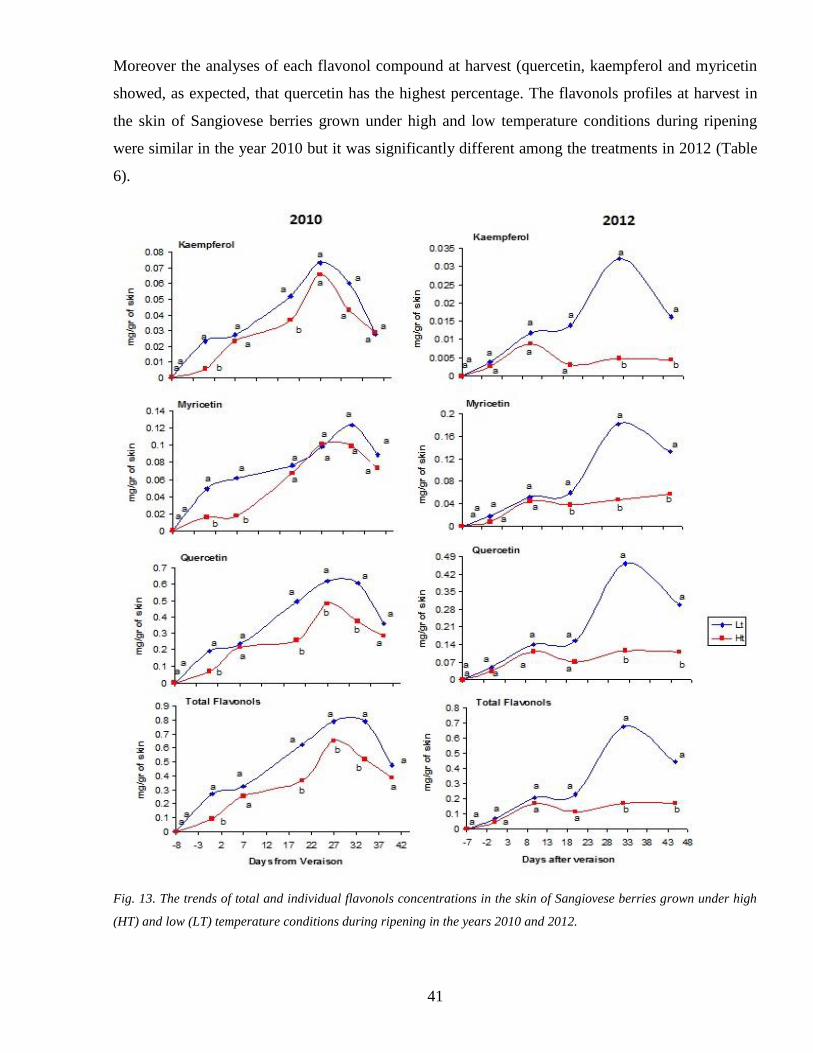
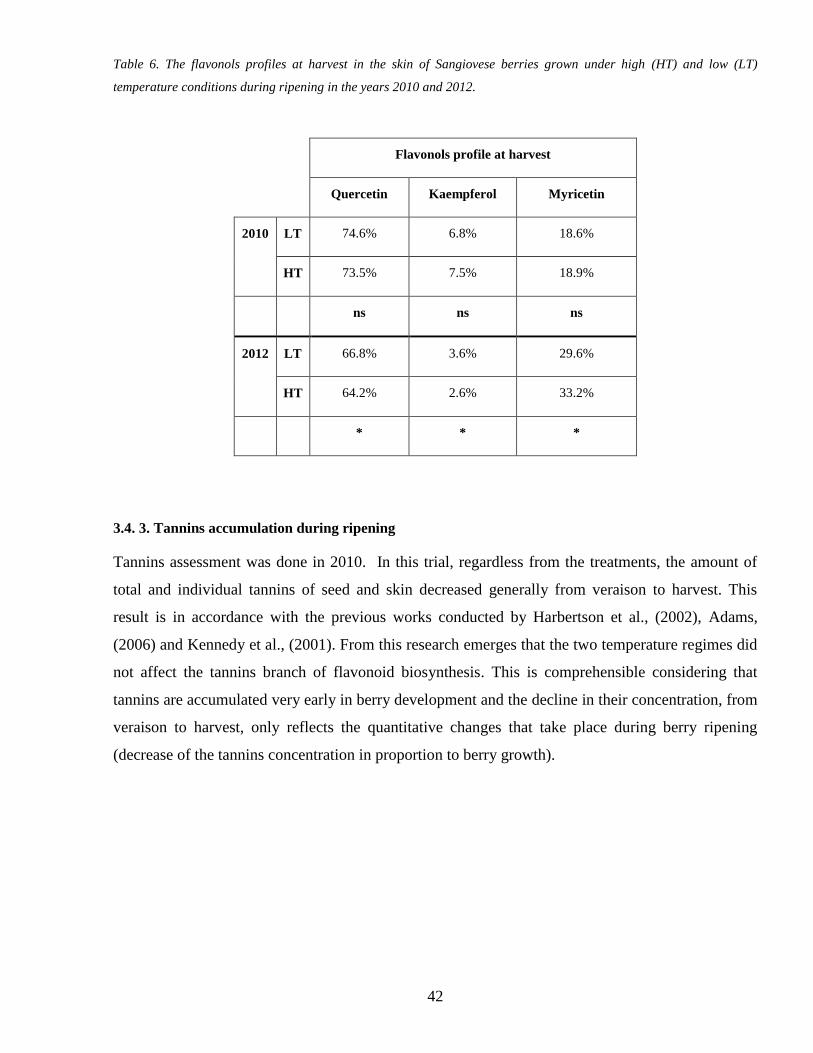
34 2 Flavonols accumulation during ripening 40
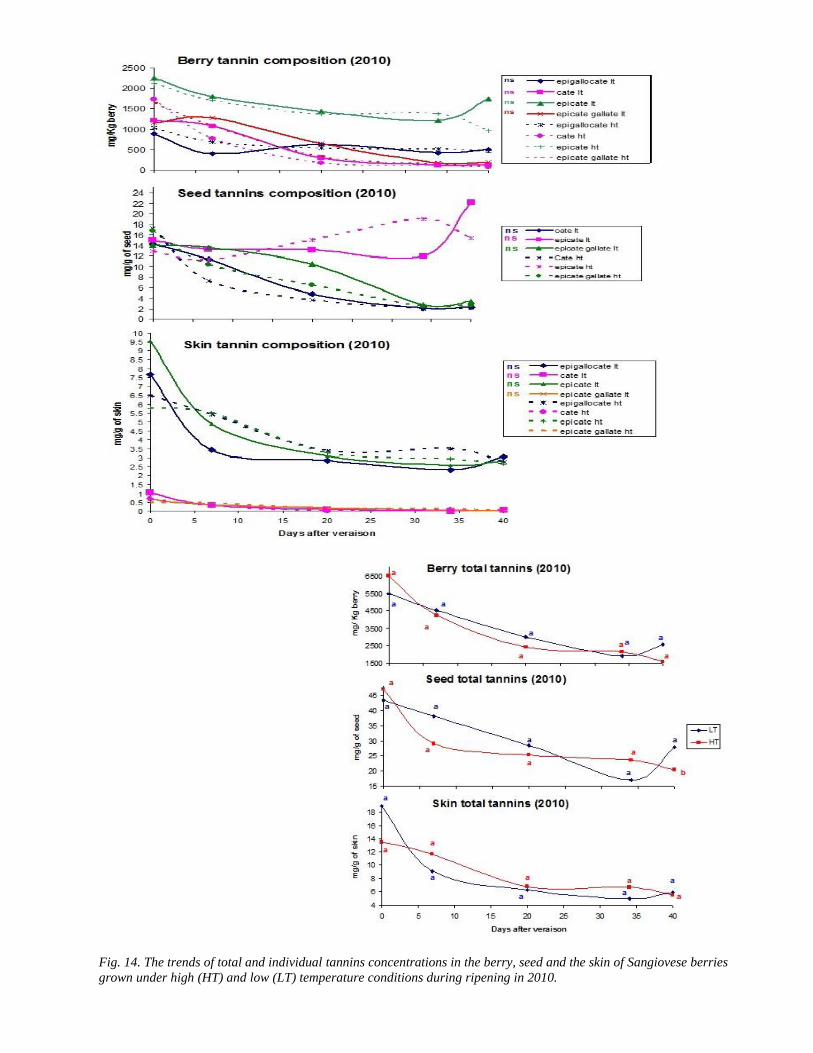
34 3 Tannins accumulation during ripening 42
35 Gene expression assessment 44
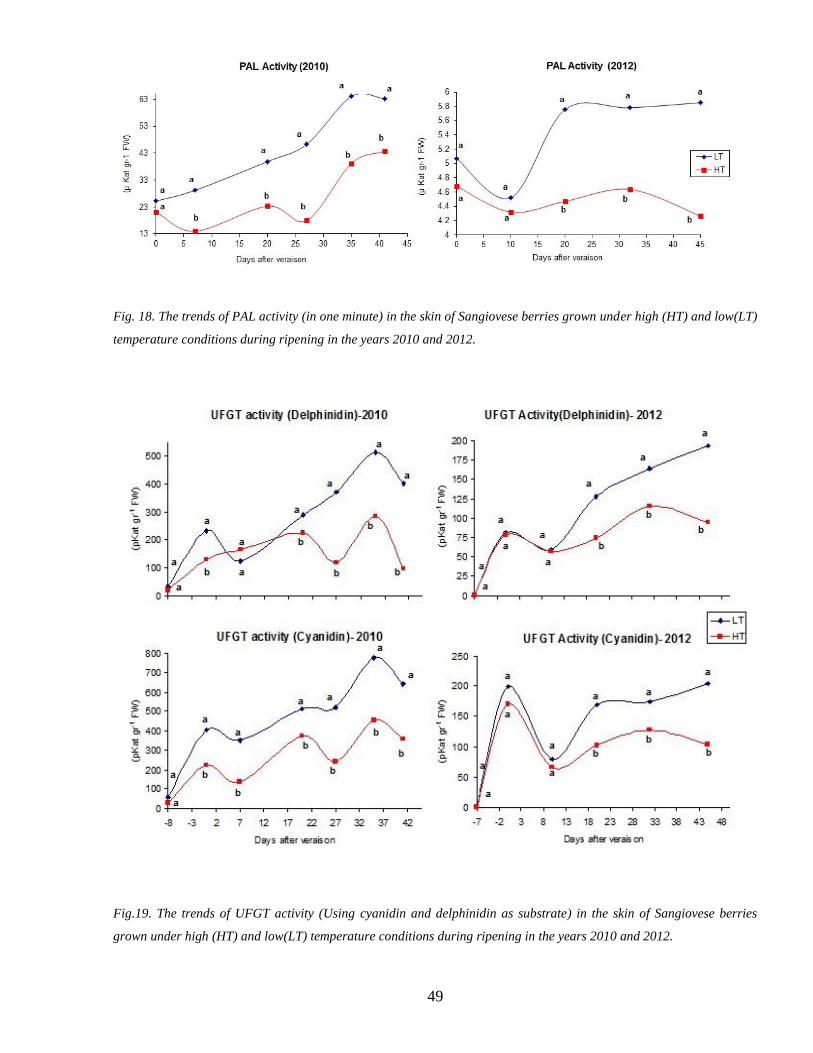
36 Activity of biosynthetic enzymes PAL and UFGT 48
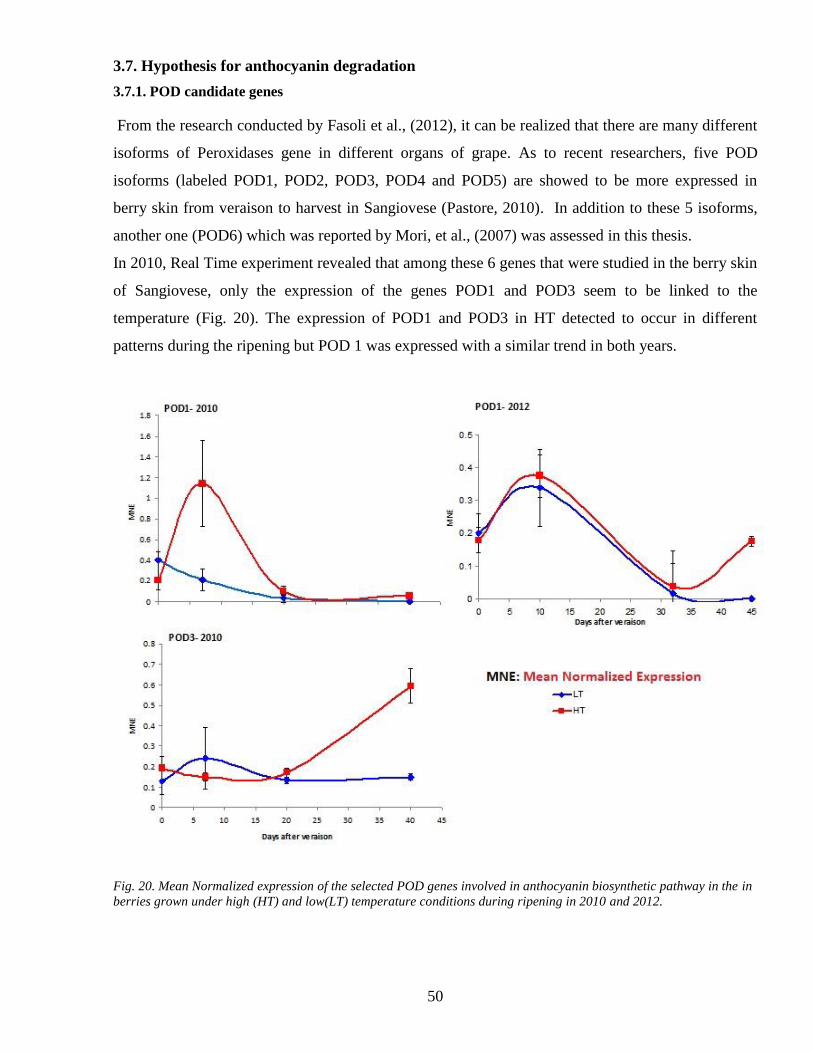
37 Hypothesis for anthocyanin degradation 50
371 POD candidate genes 50
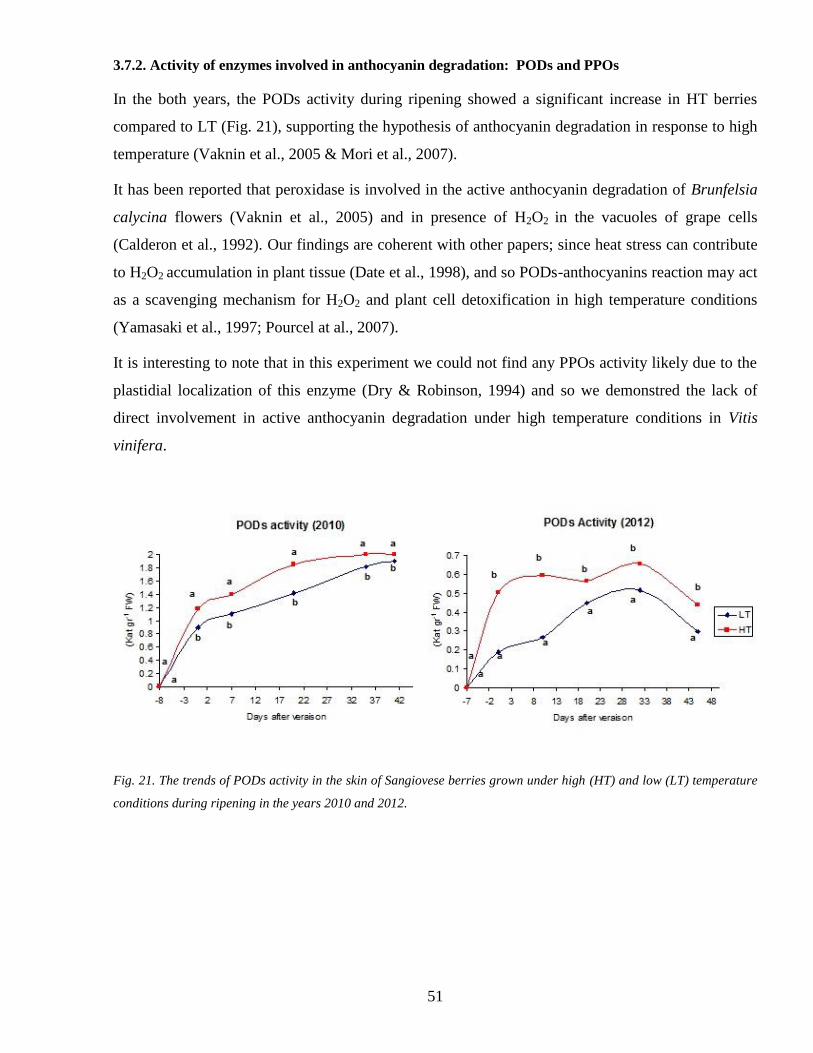
372 Activity of enzymes involved in anthocyanin degradation PODs and PPOs 51
4 CONCLUSION 52
Chapter one Second PartRecognition of putative POD genes involved in anthocyanins
degradation under high temperature condition 53
1 INTRODUCTION 54
2 MATERIALS 54
21 Gene selection 54
22 Escherichia coli strain and culture media 54
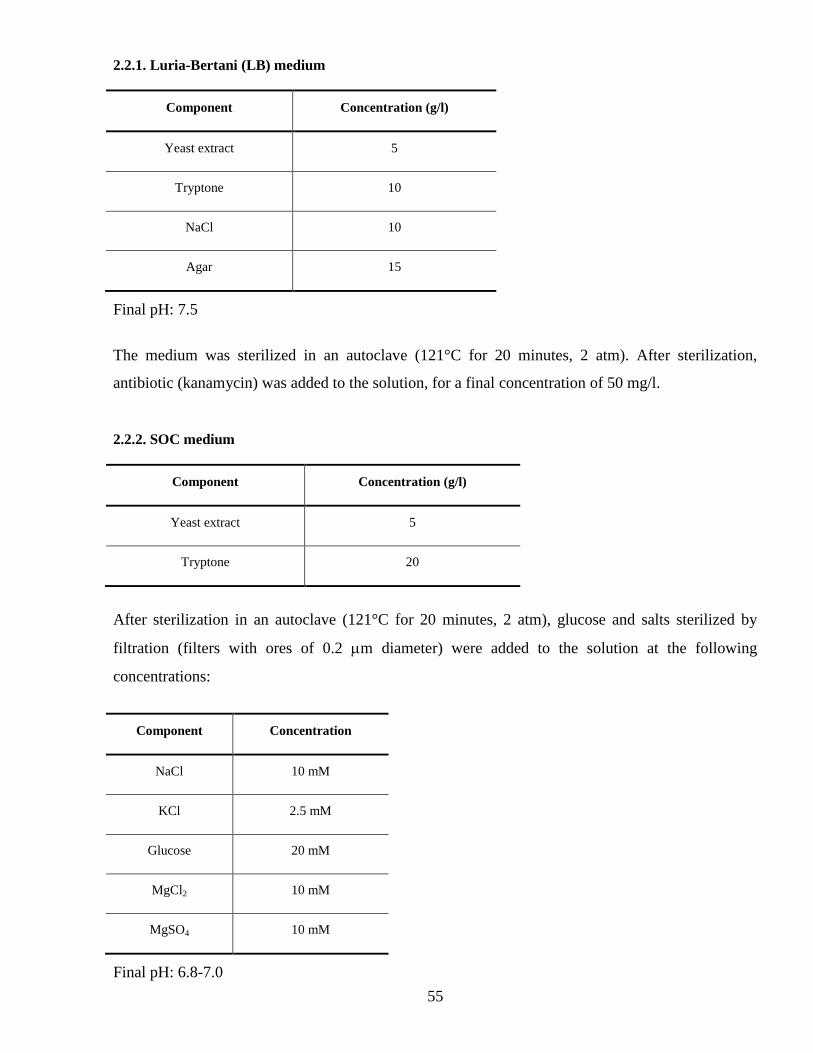
221 Luria-Bertani (LB) medium 55
222 SOC medium 55
4
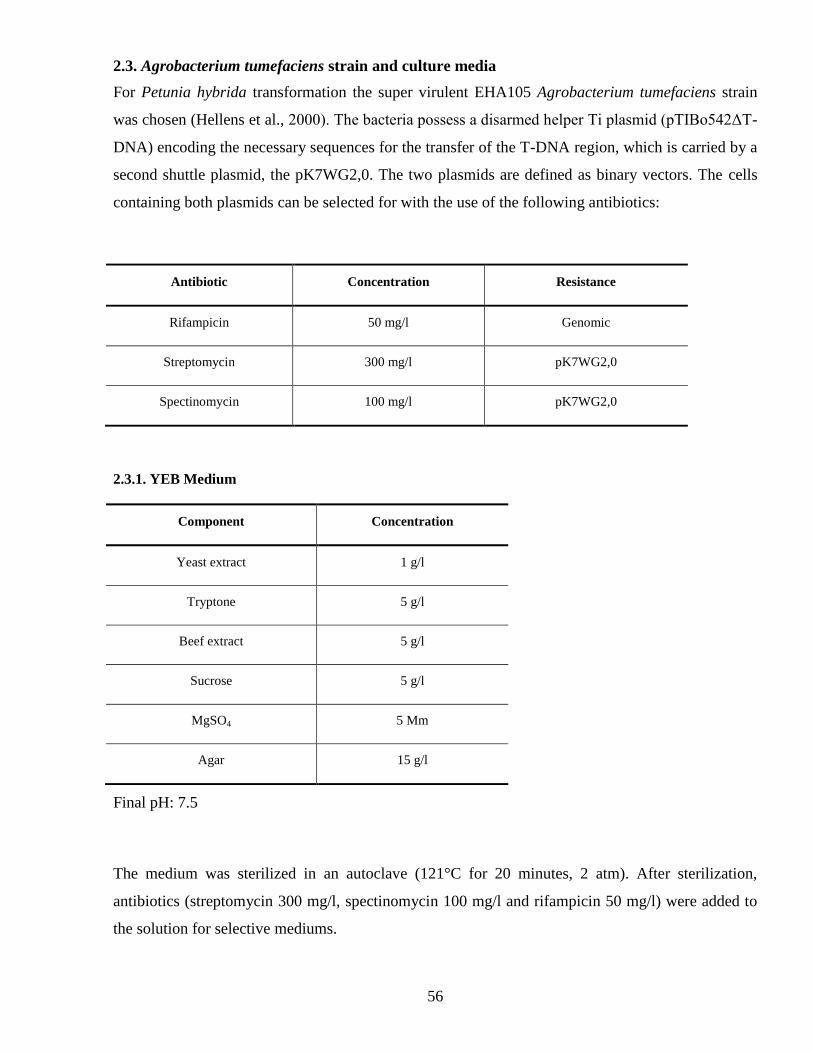
23 Agrobacterium tumefaciens strain and culture media 56
231 YEB Medium 56
24 Vectors 57
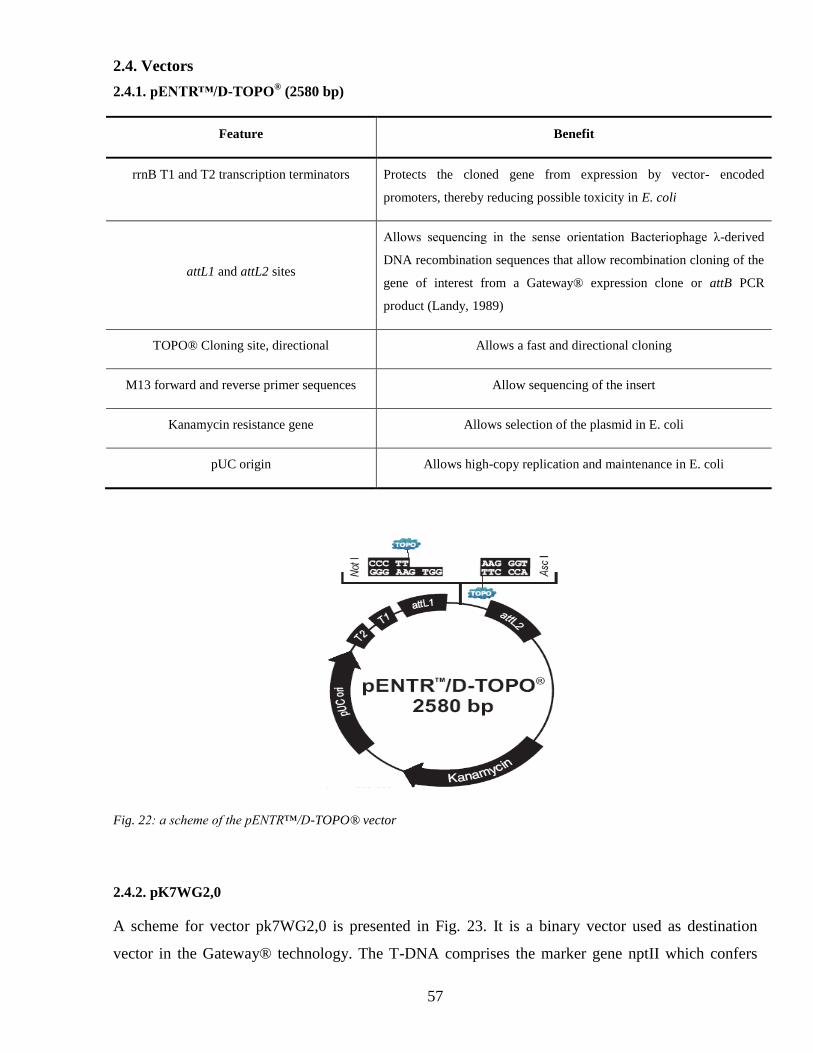
241 pENTRtradeD-TOPOreg (2580 bp) 57
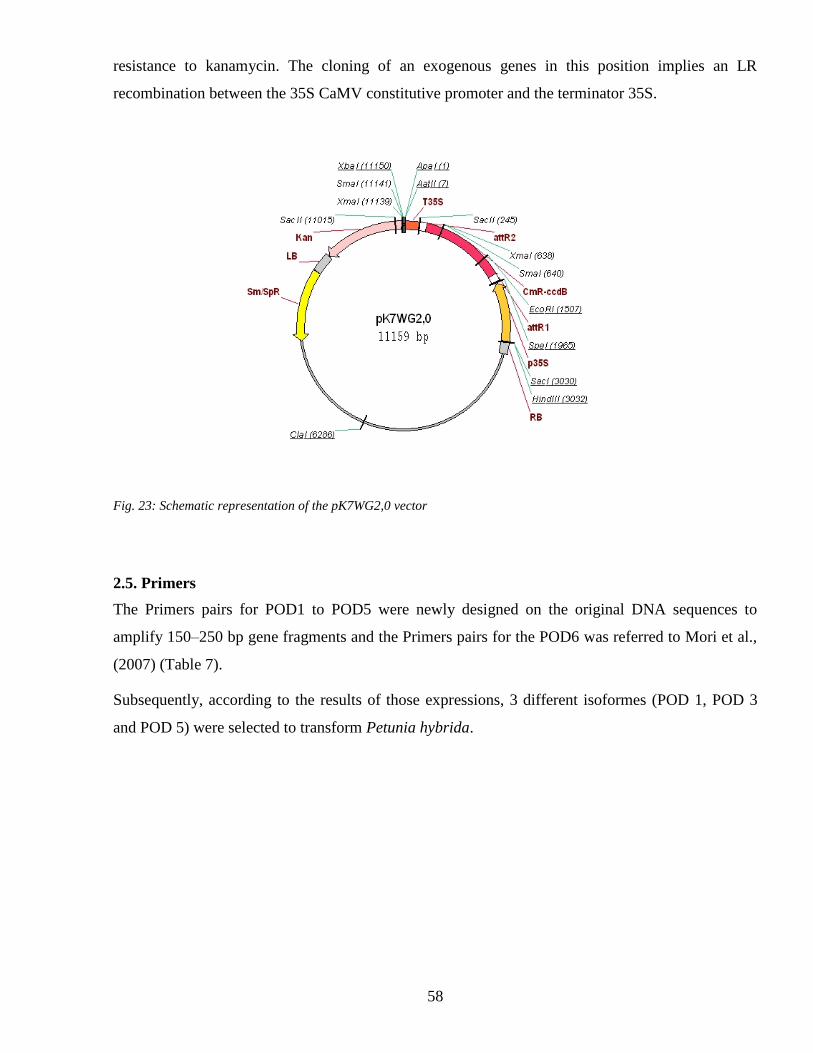
242 pK7WG20 57
25 Primers 58
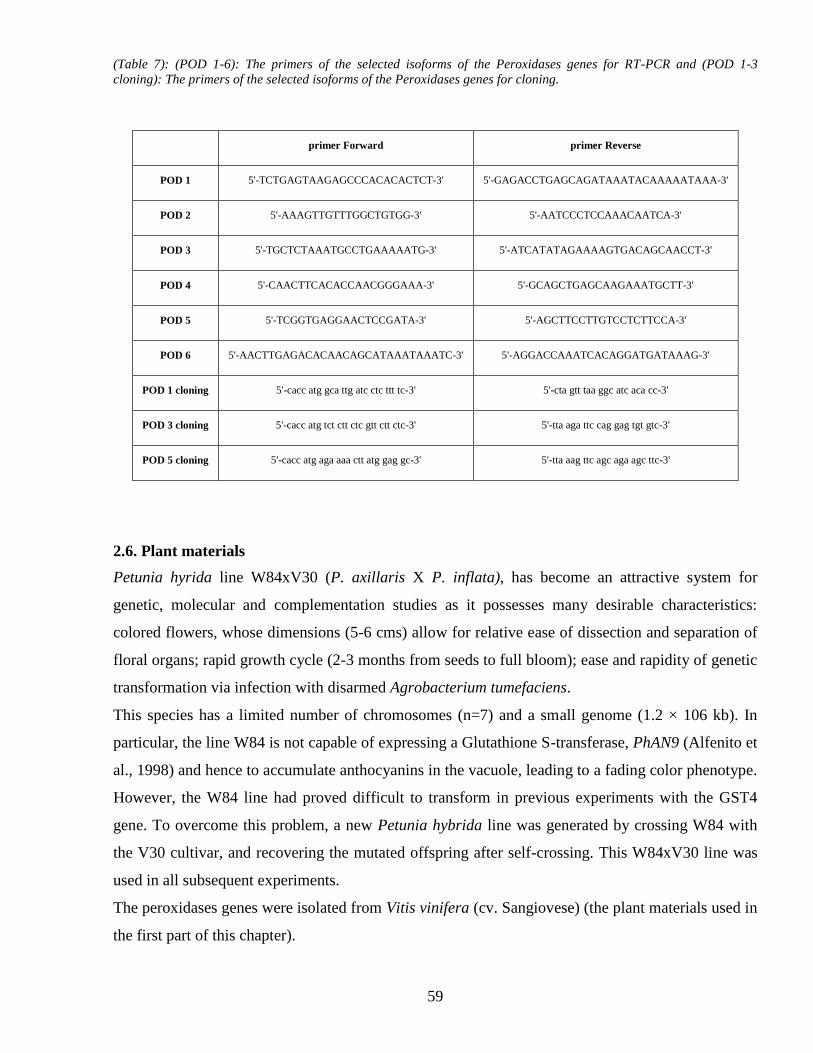
26 Plant materials 59
3 METHODS 60
31 Transformation of Escherichia coli by heat shock 60
32 Preparation of competent cells of A tumefaciens 60
33 Transformation of A Tumefaciens by electroporation 61
34 Colony PCR 61
35 Plasmid DNA extraction 61
36 Purification of PCR products 61
37 GATEWAYreg cloning system 61
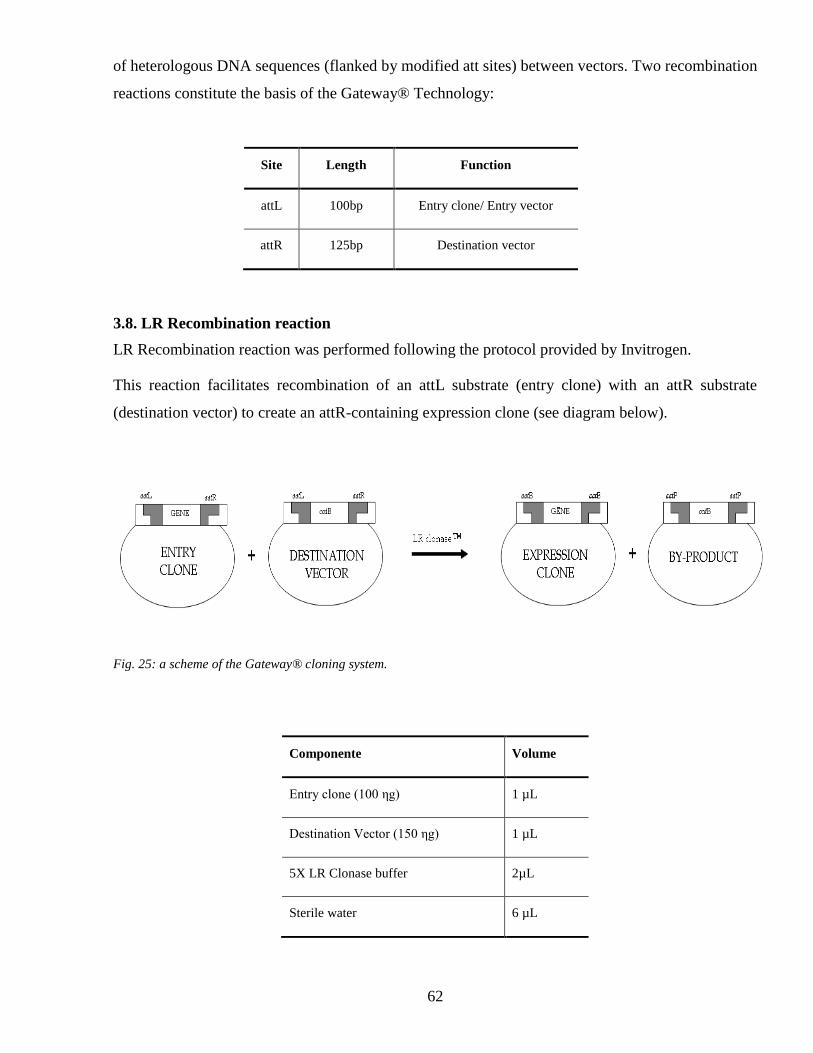
38 LR Recombination reaction 62
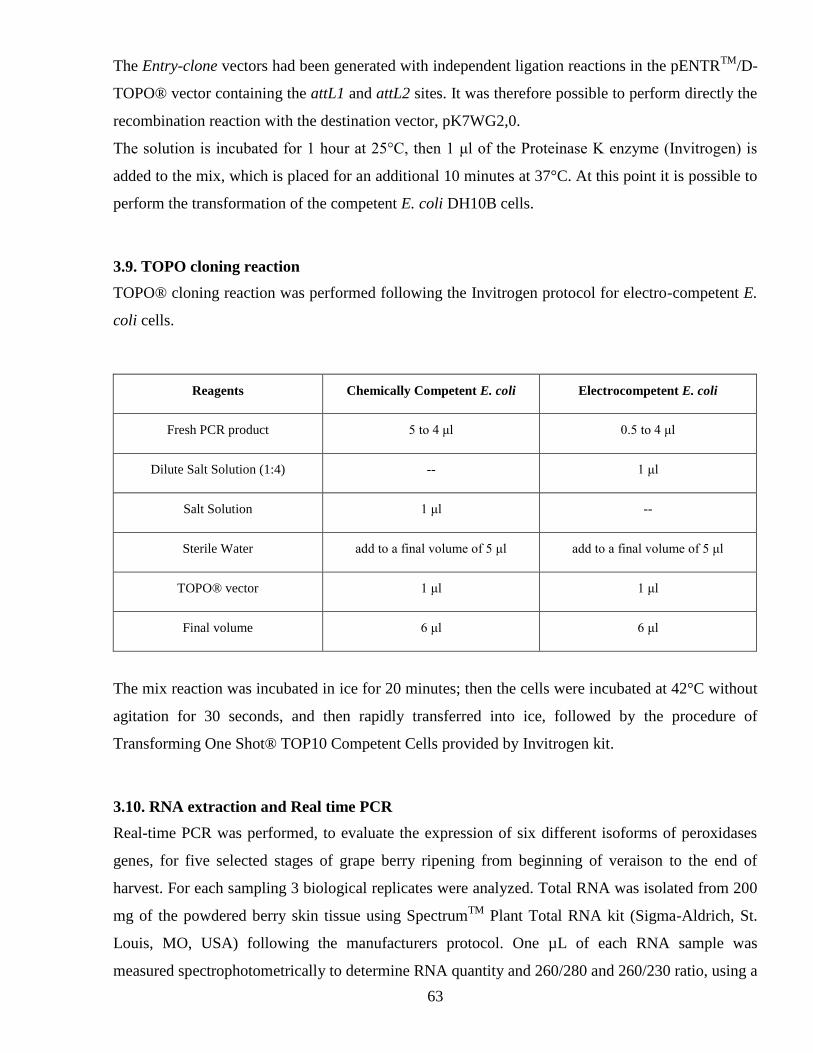
39 TOPO cloning reaction 63
310 RNA extraction and Real time PCR 63
311 Stable transformation of Petunia hybrida 64
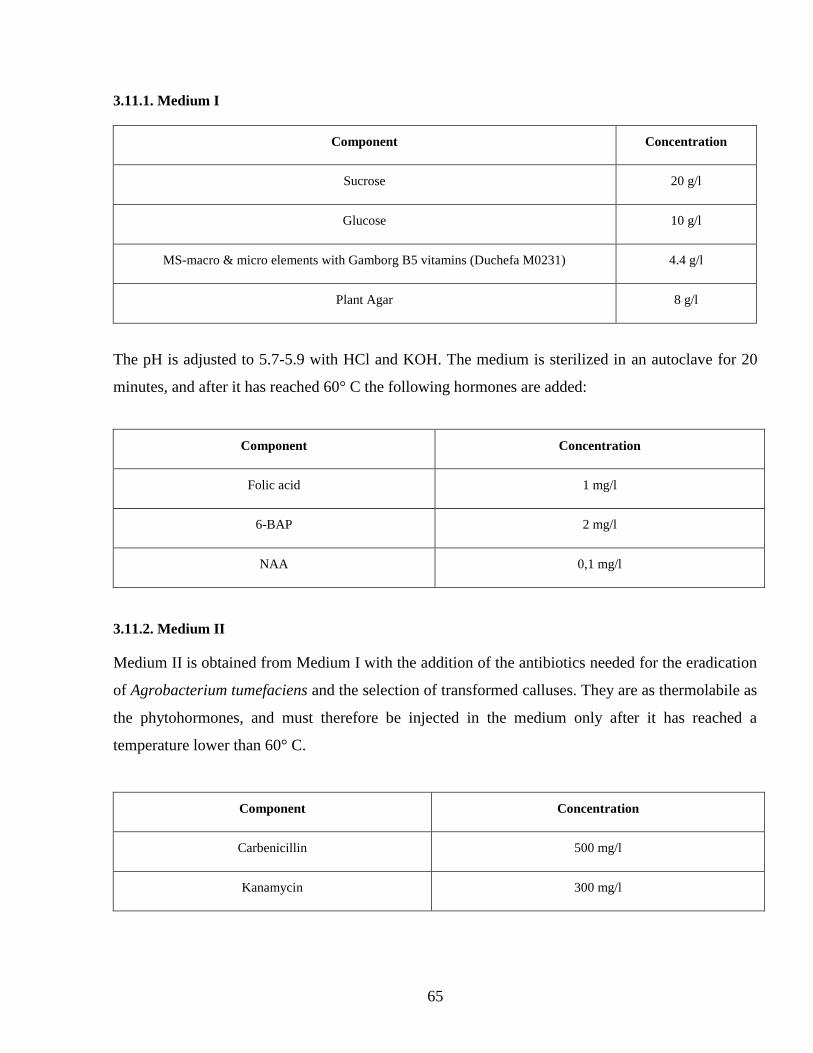
3111 Medium I 65
3112 Medium II 65
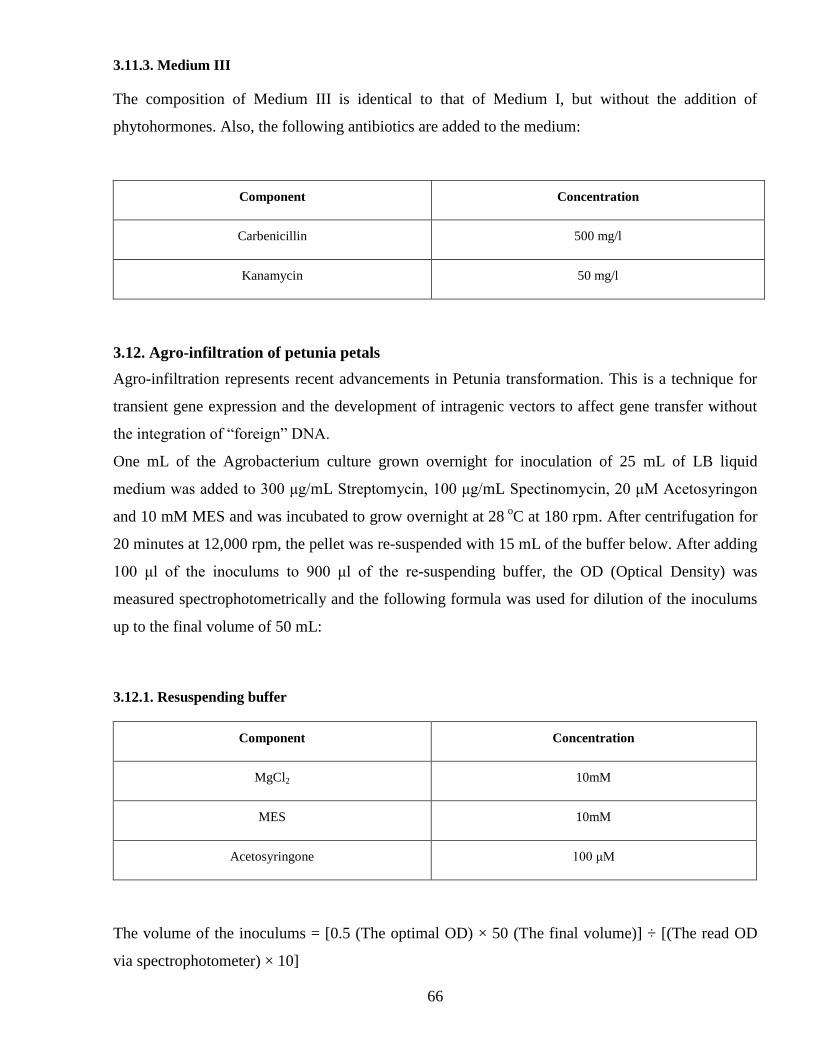
3113 Medium III 66
312 Agro-infiltration of petunia petals 66
3121 Resuspending buffer 66
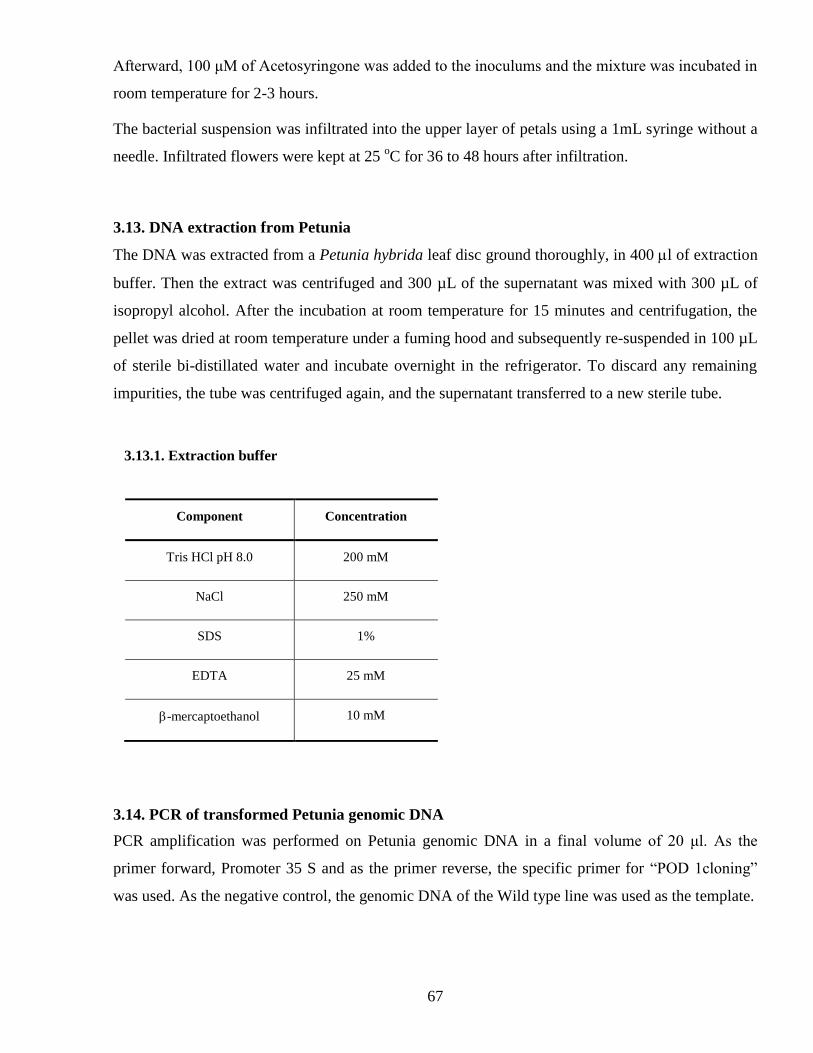
313 DNA extraction from Petunia 67
3131 Extraction buffer 67
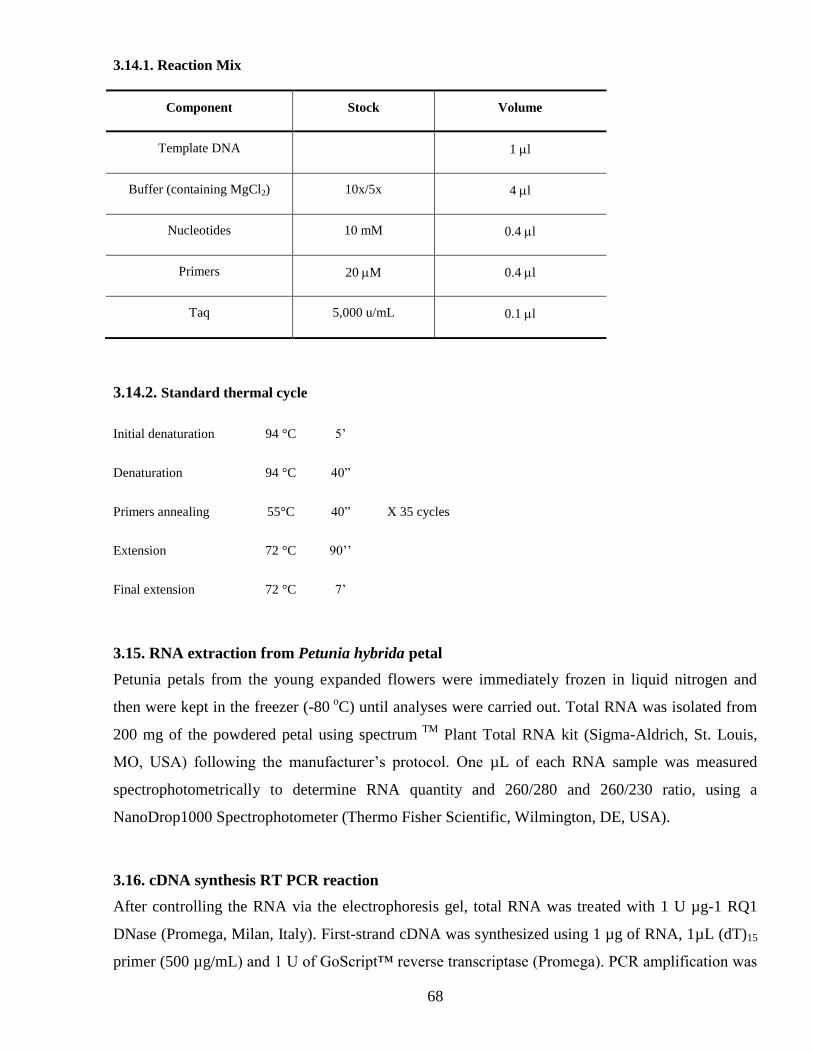
314 PCR of transformed Petunia genomic DNA 67
3141 Reaction Mix 68
5
3142 Standard thermal cycle 68
315 RNA extraction from Petunia hybrida petal 68
316 cDNA synthesis RT PCR reaction 68
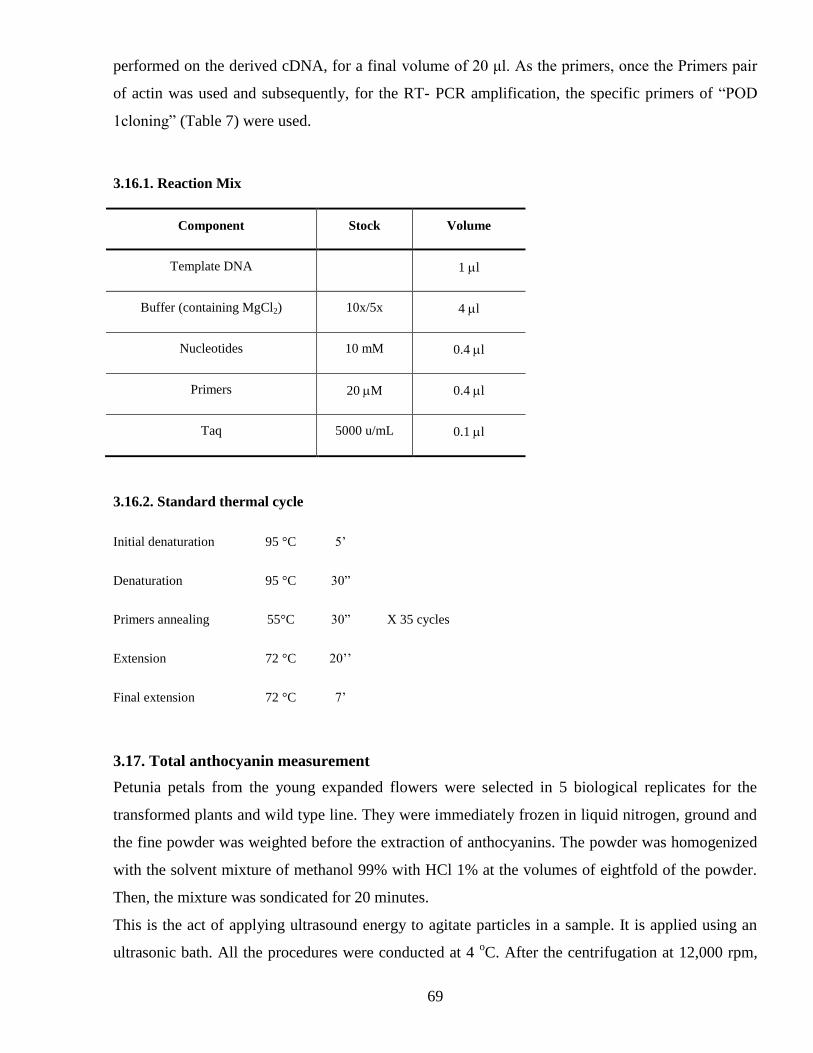
3161 Reaction Mix 69
3162 Standard thermal cycle 69
317 Total anthocyanin measurement 69
318 Heat shock performance 70
319 Guaiacol Peroxidases activity assay 70
4 RESULTS 70
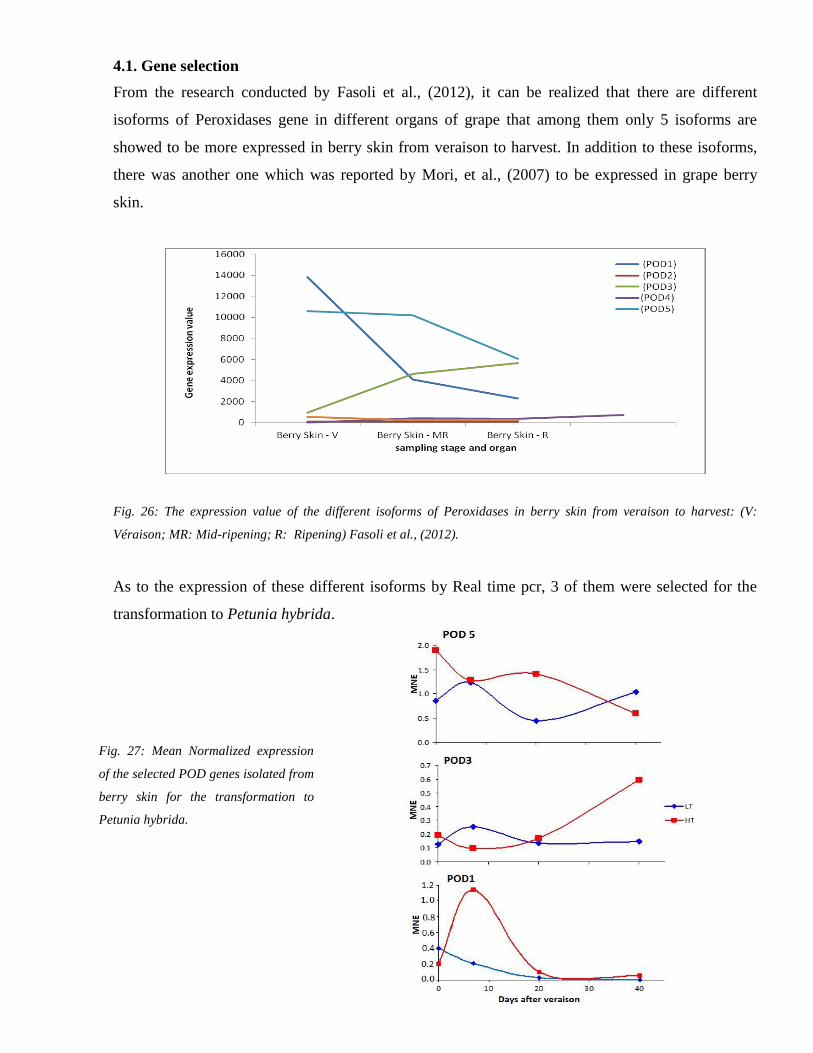
41 Gene selection 71
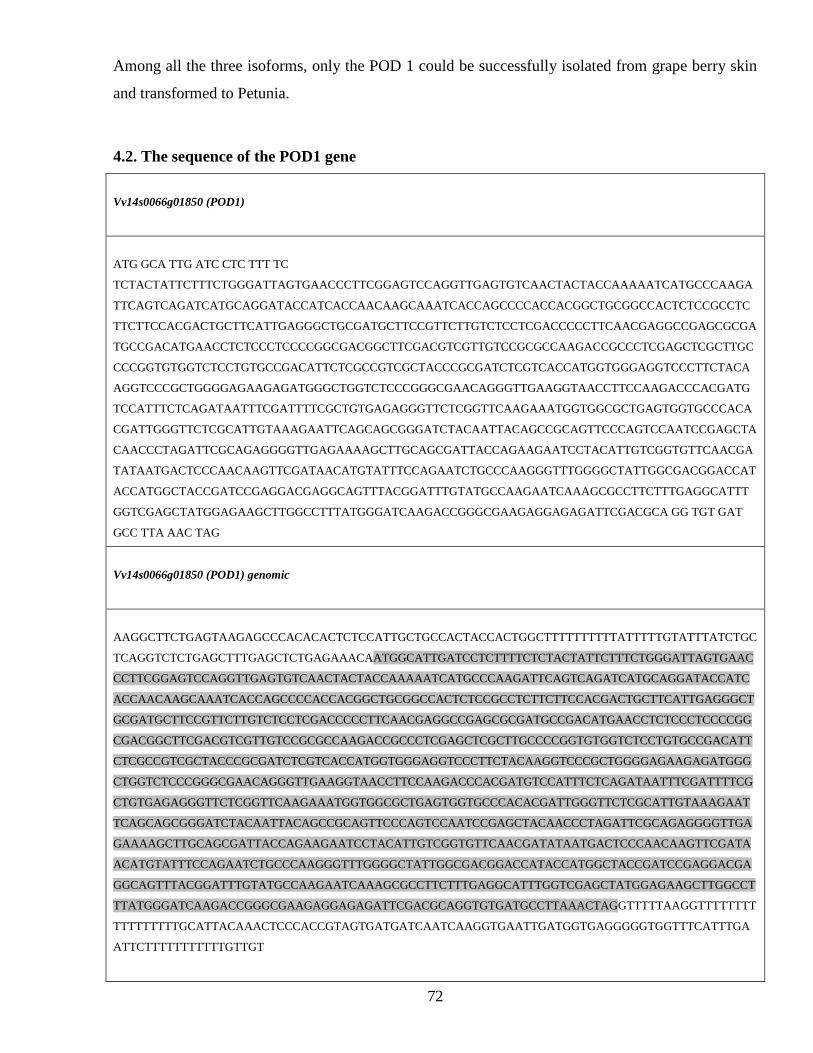
42 The sequence of the POD1 gene 72
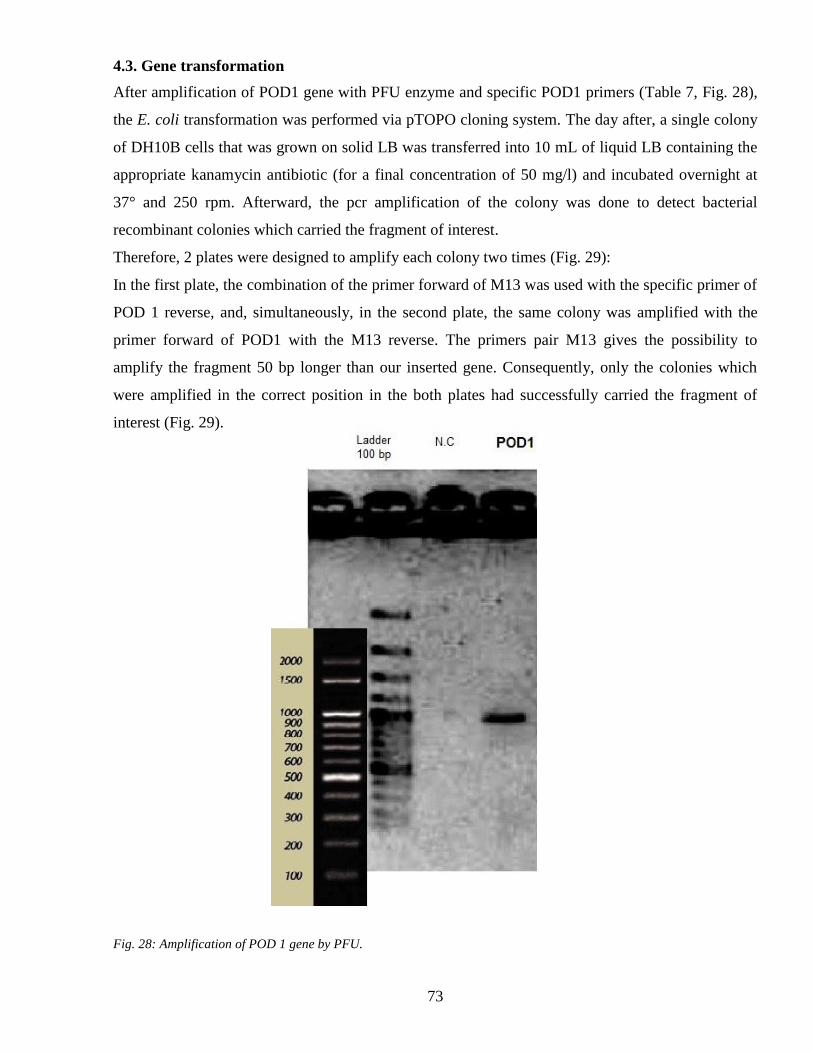
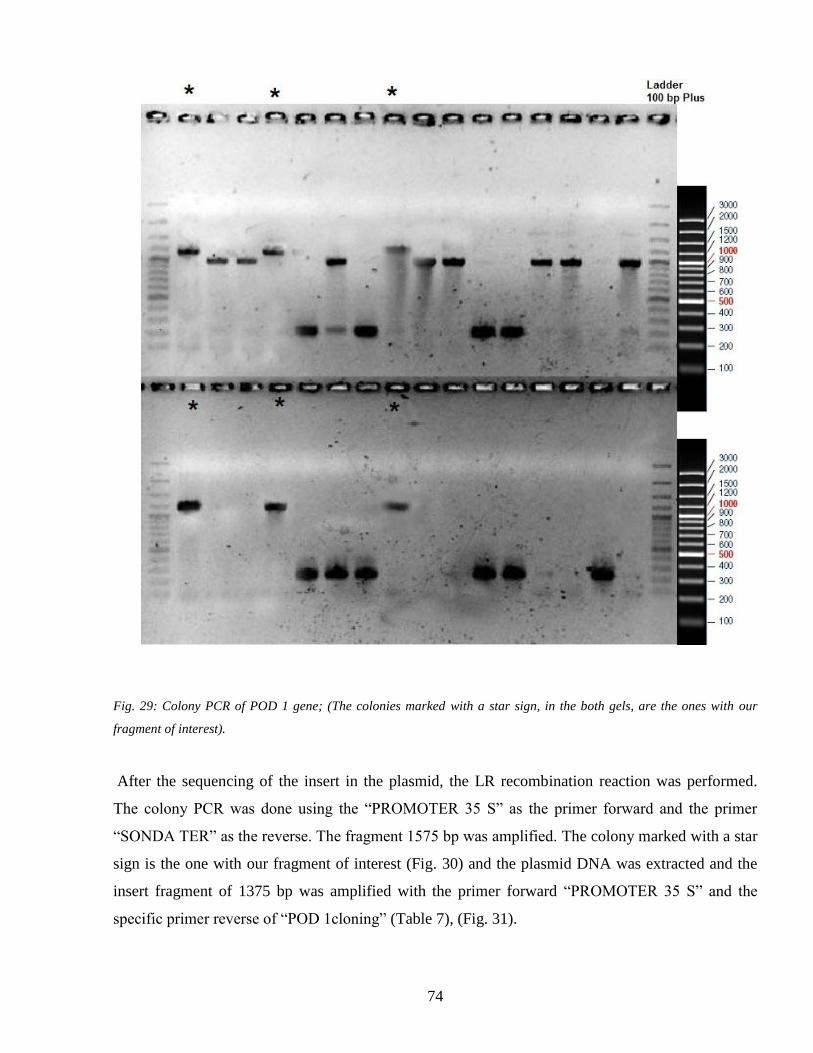
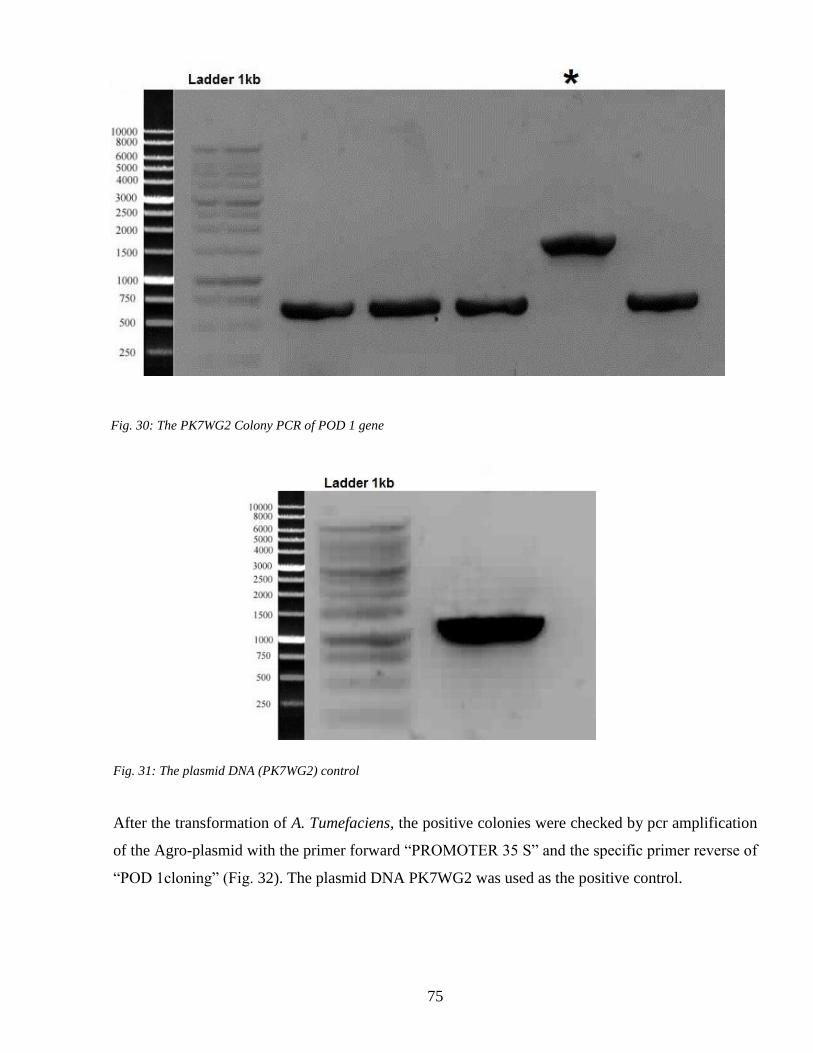
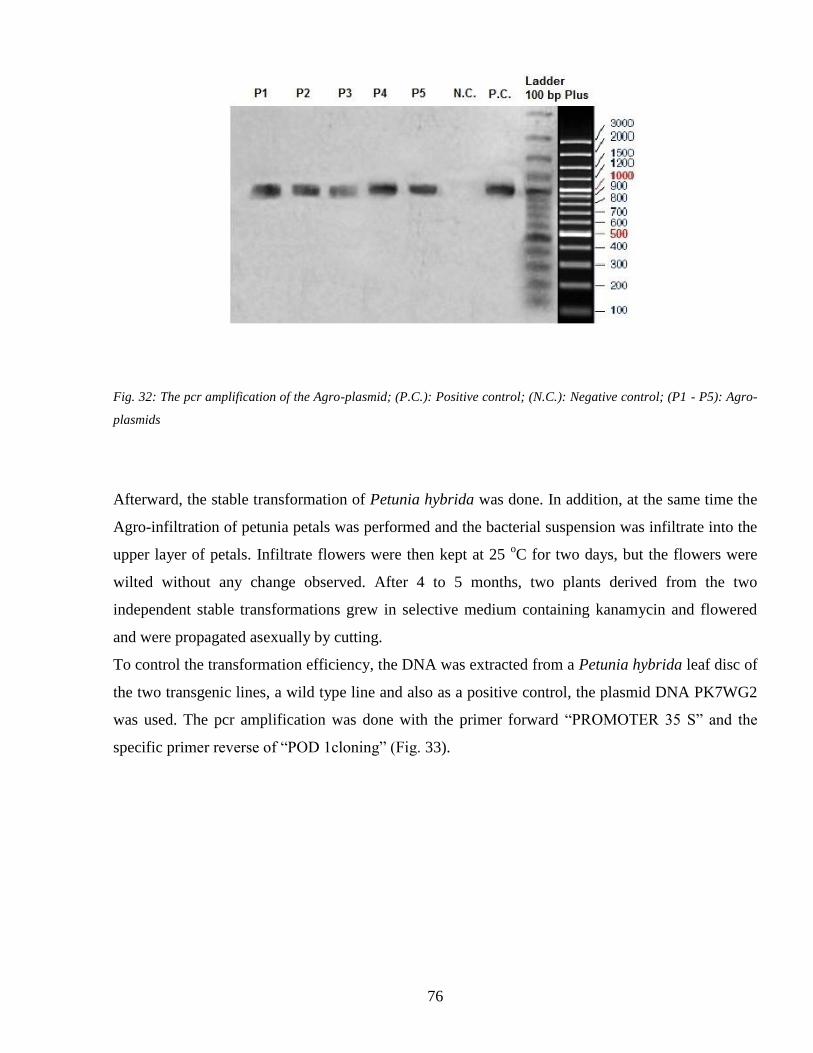
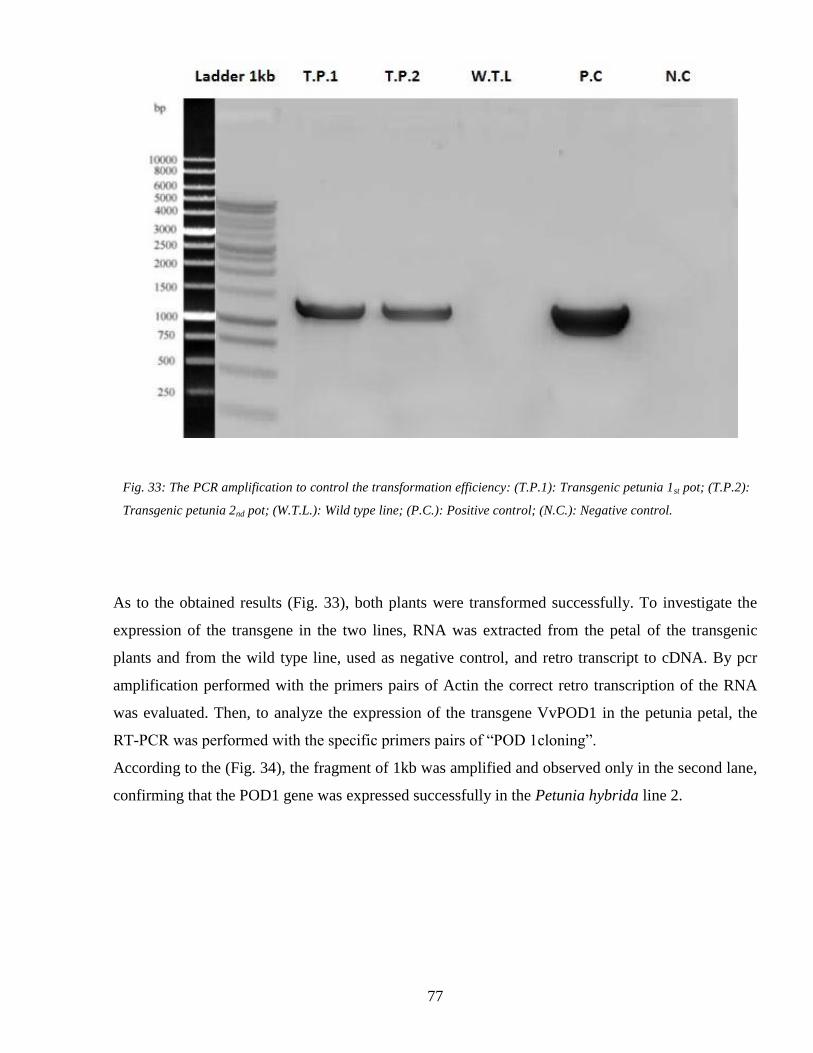
43 Gene transformation 73
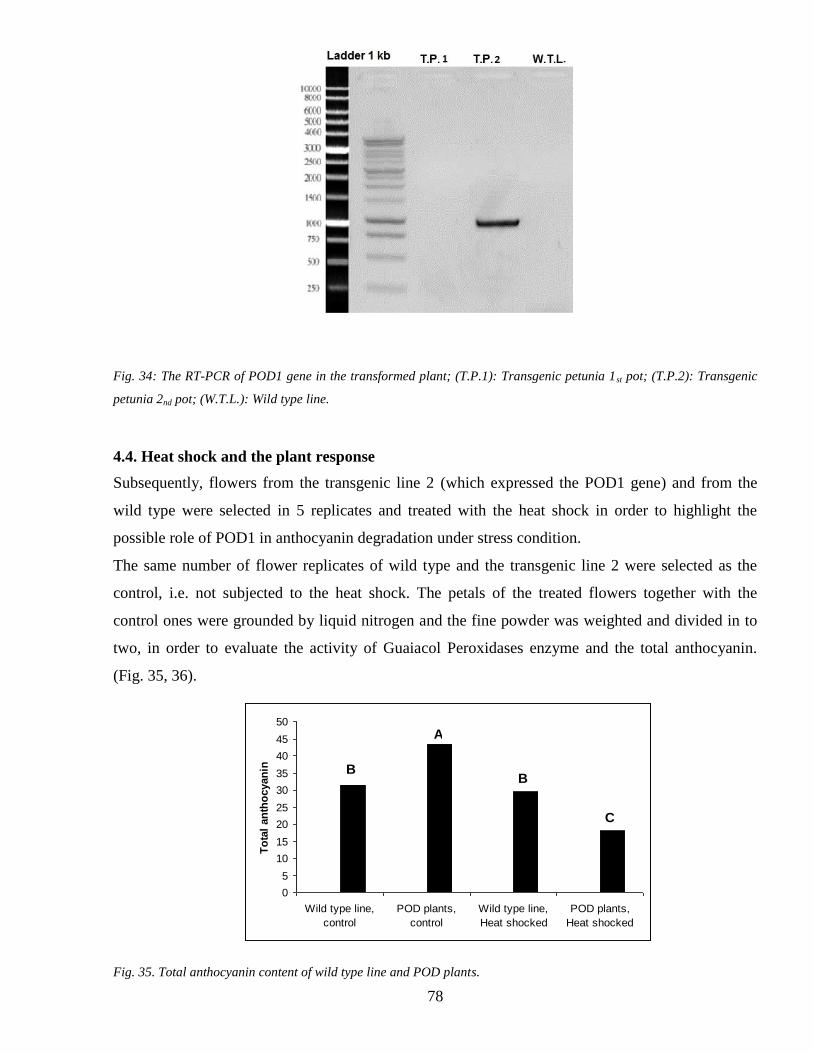
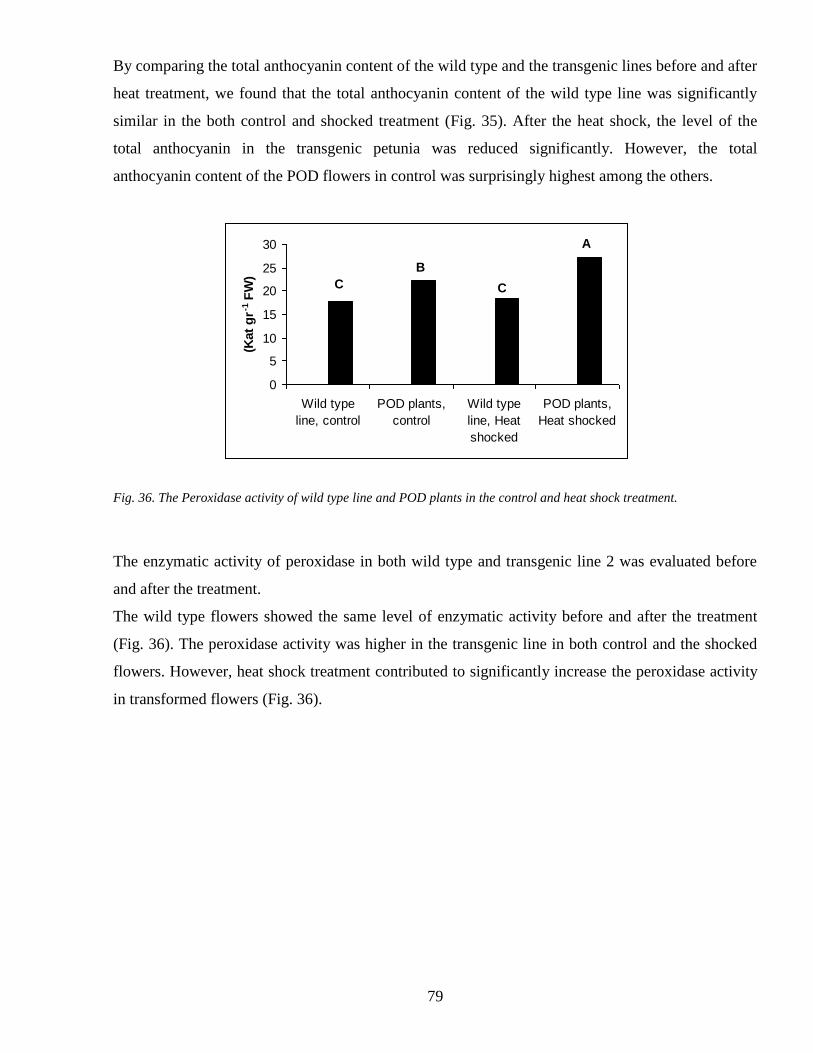
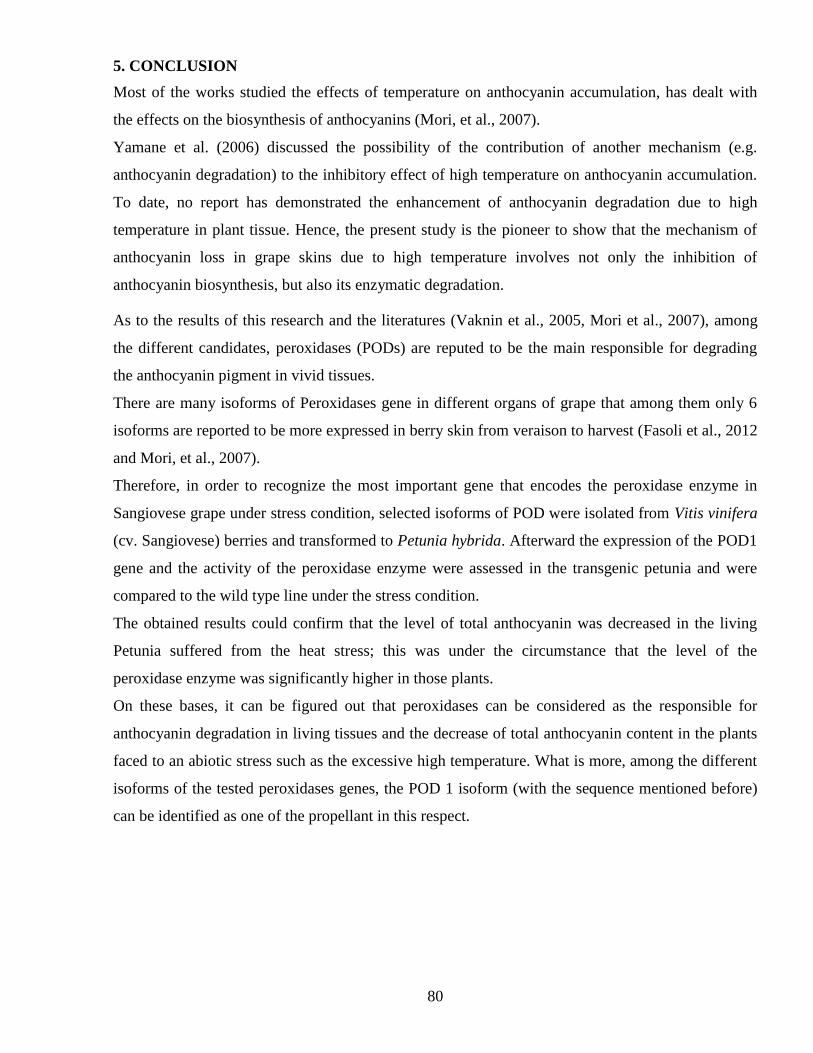
44 Heat shock and the plant response 78
5 CONCLUSION 80
Chapter twoEffects of late-season source limitations induced by trimming on grape
composition during ripening in Vitis vinifera cv Sangiovese 81
1 INTRODUCTION 82
2 MATERIAL AND METHODS 83
21 Vegetative and yield data 83
22 Berry sampling 84
23 Analyses of main must biochemical parameters 84
24 Analyses of skin anthocyanins 84
25 Tannins analysis 85
3 RESULTS AND DISCUSSION 86
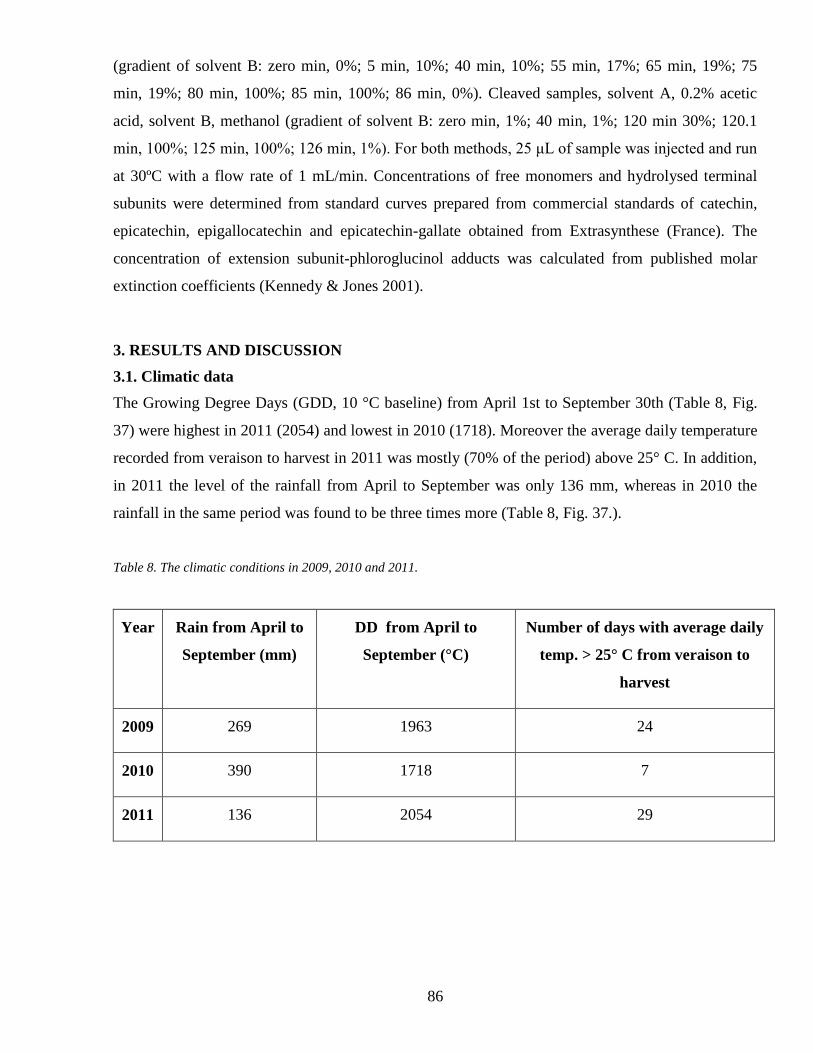
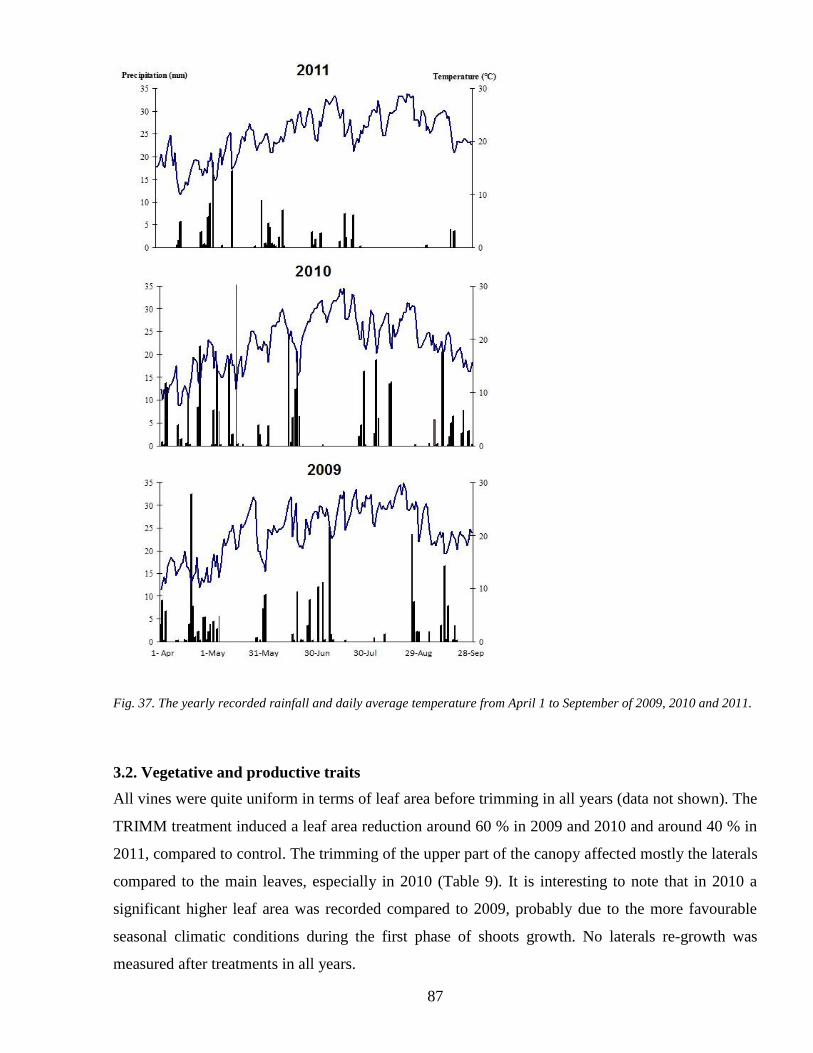
31 Climatic data 86
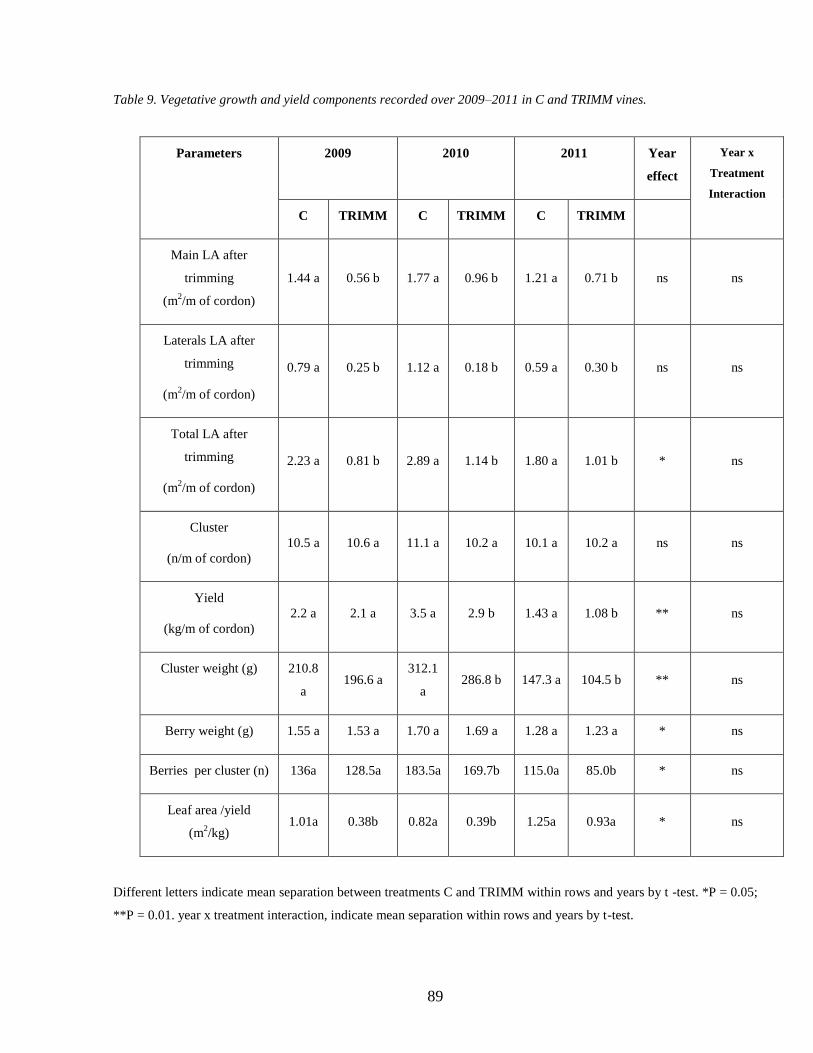
32 Vegetative and productive traits 87
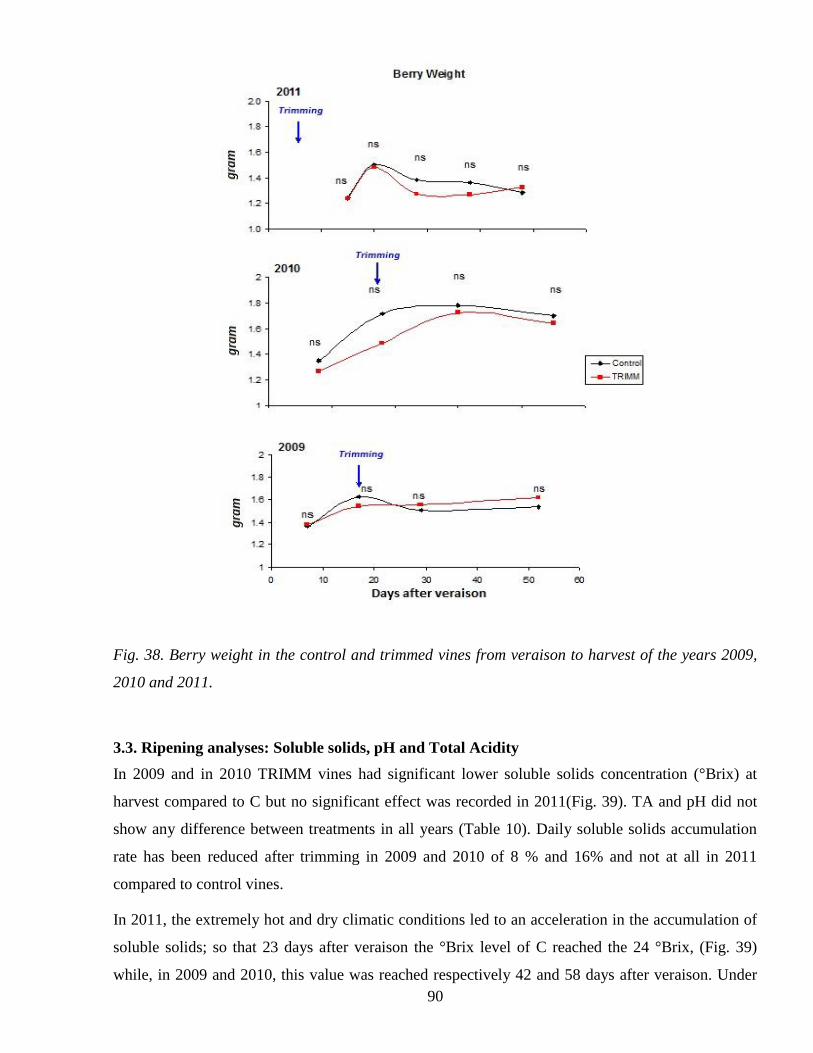
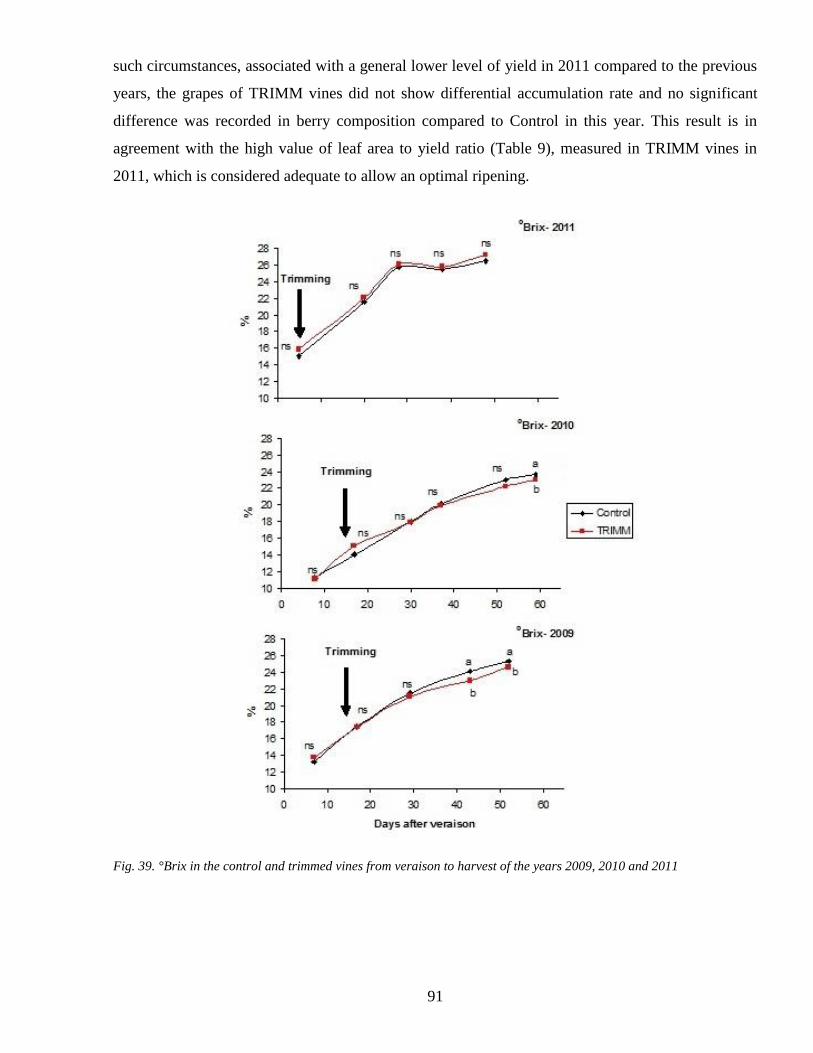
33 Ripening analyses Soluble solids pH and Total Acidity 90
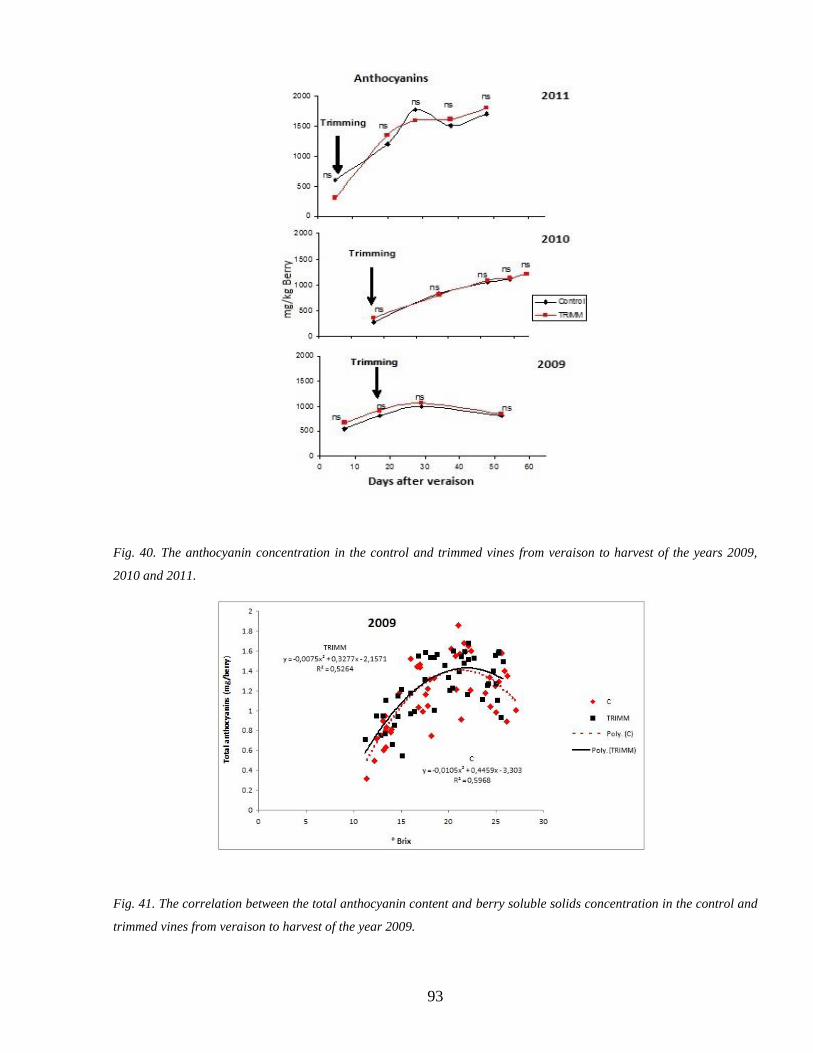
34 Anthocyanins accumulation during ripenning 92
6
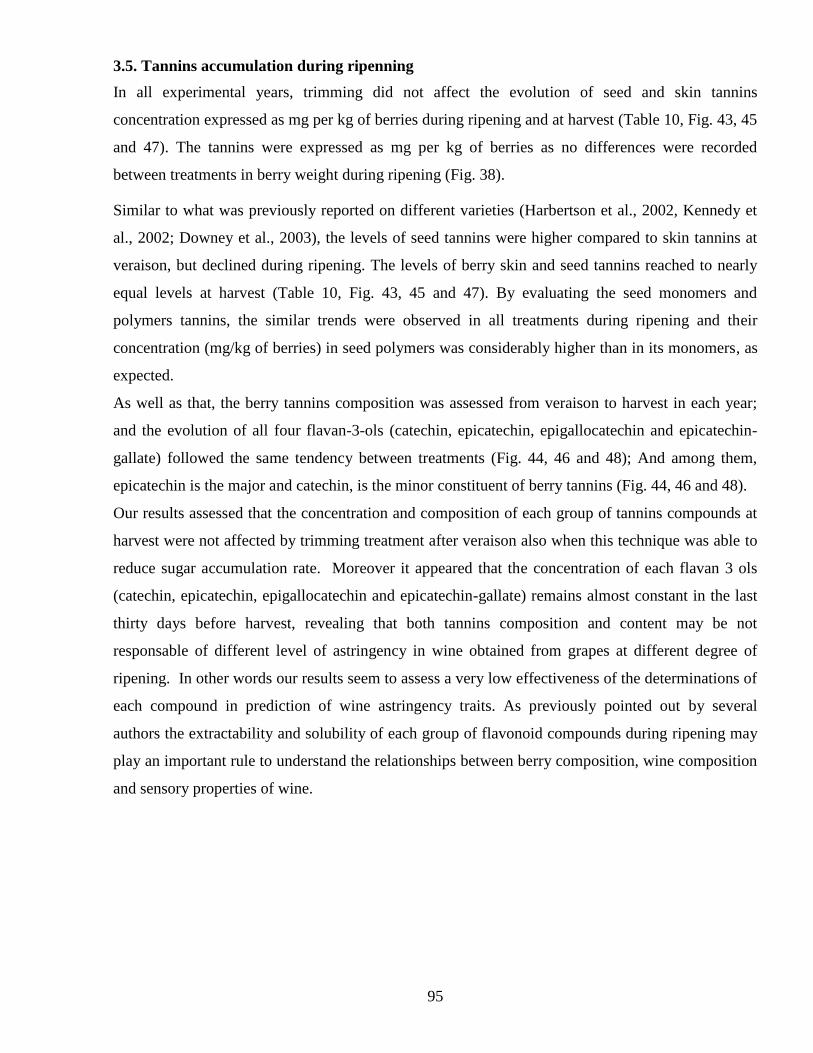
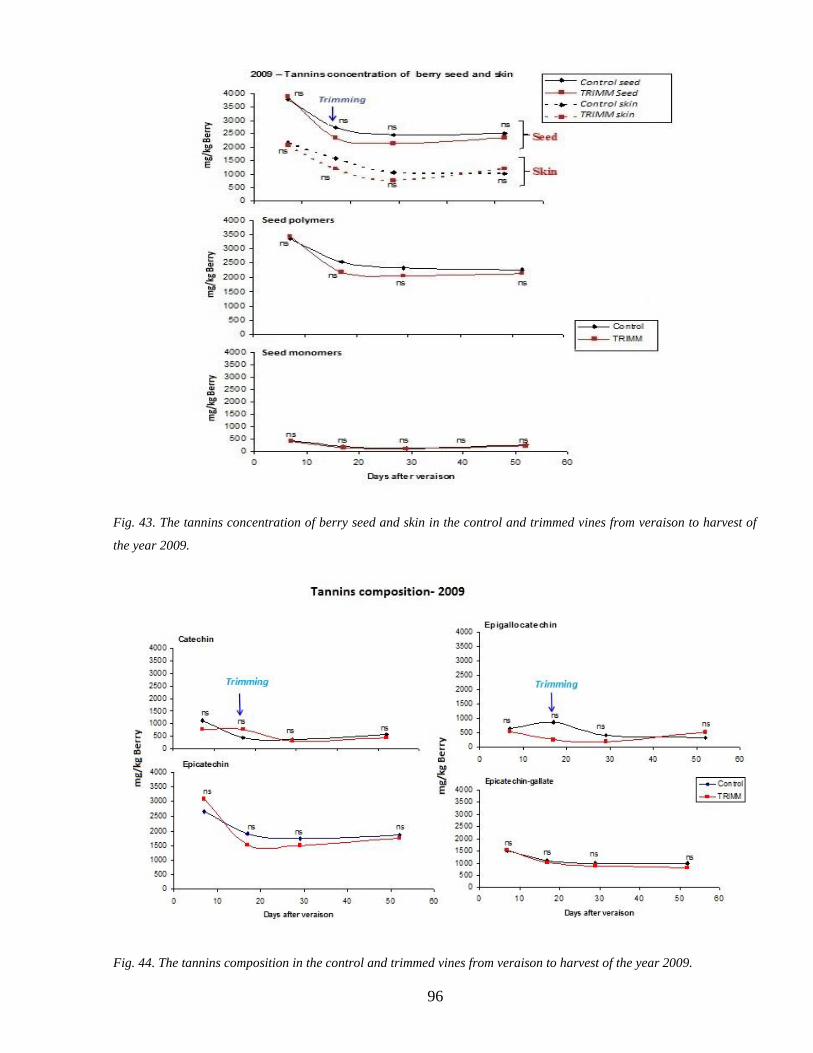
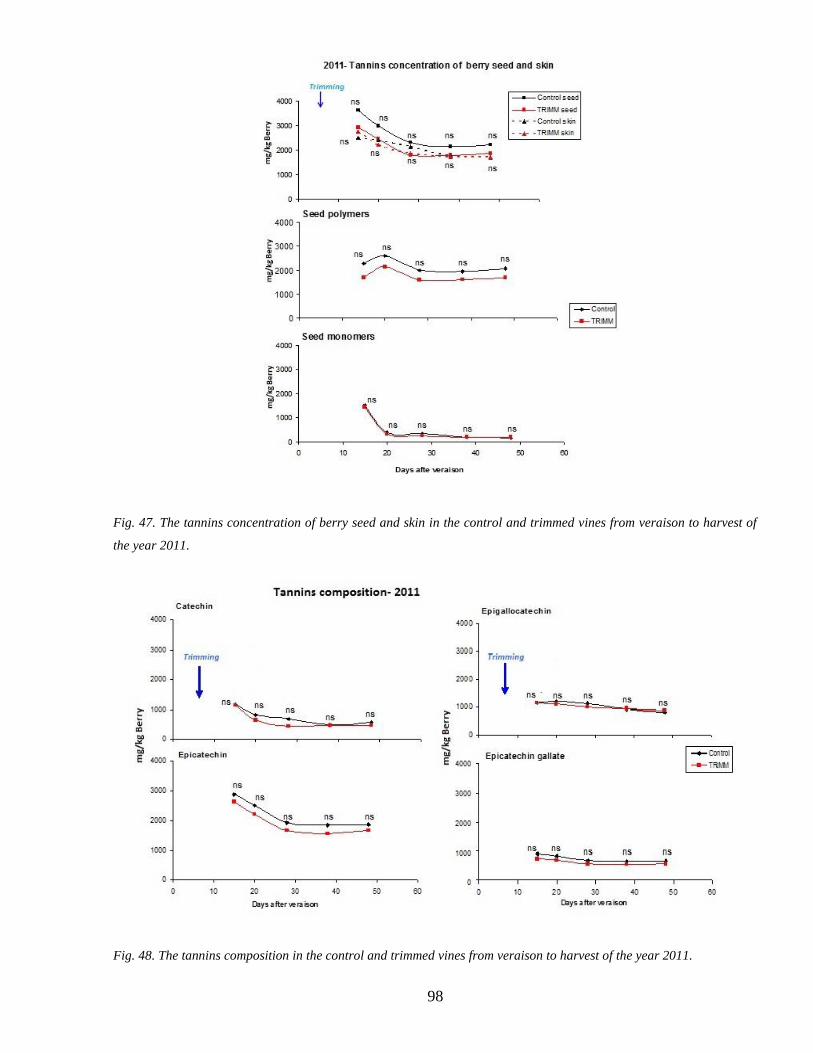
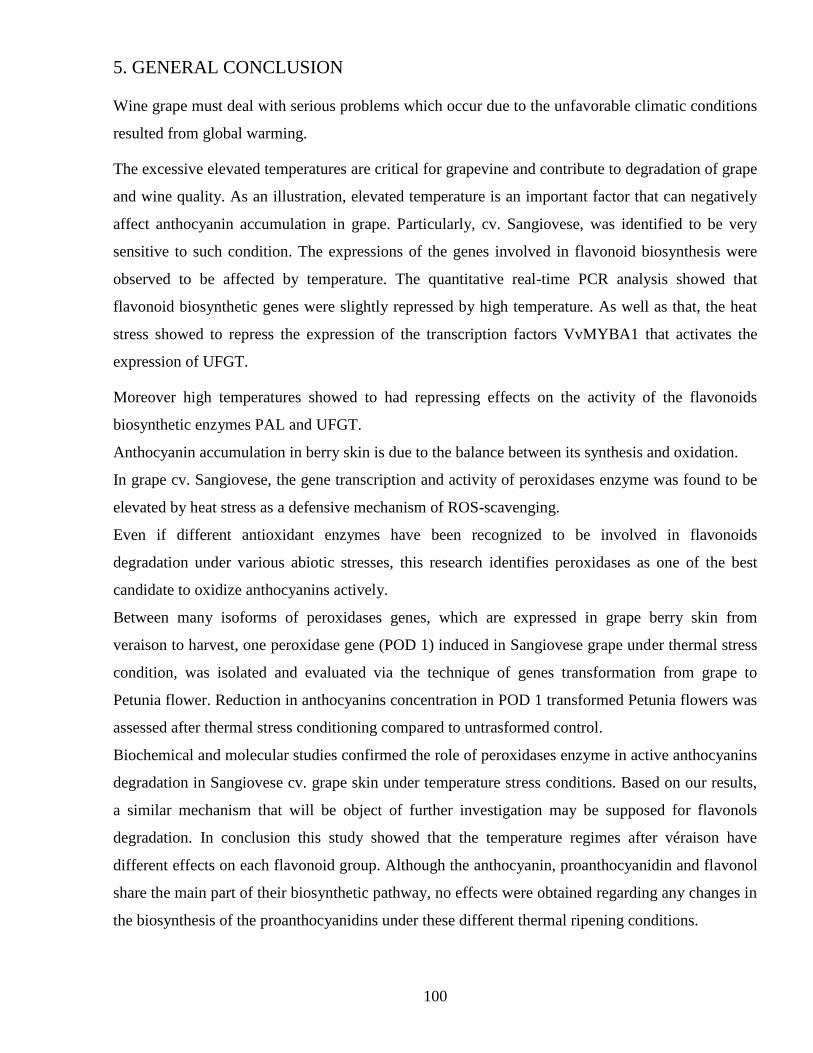
35 Tannins accumulation during ripenning 95
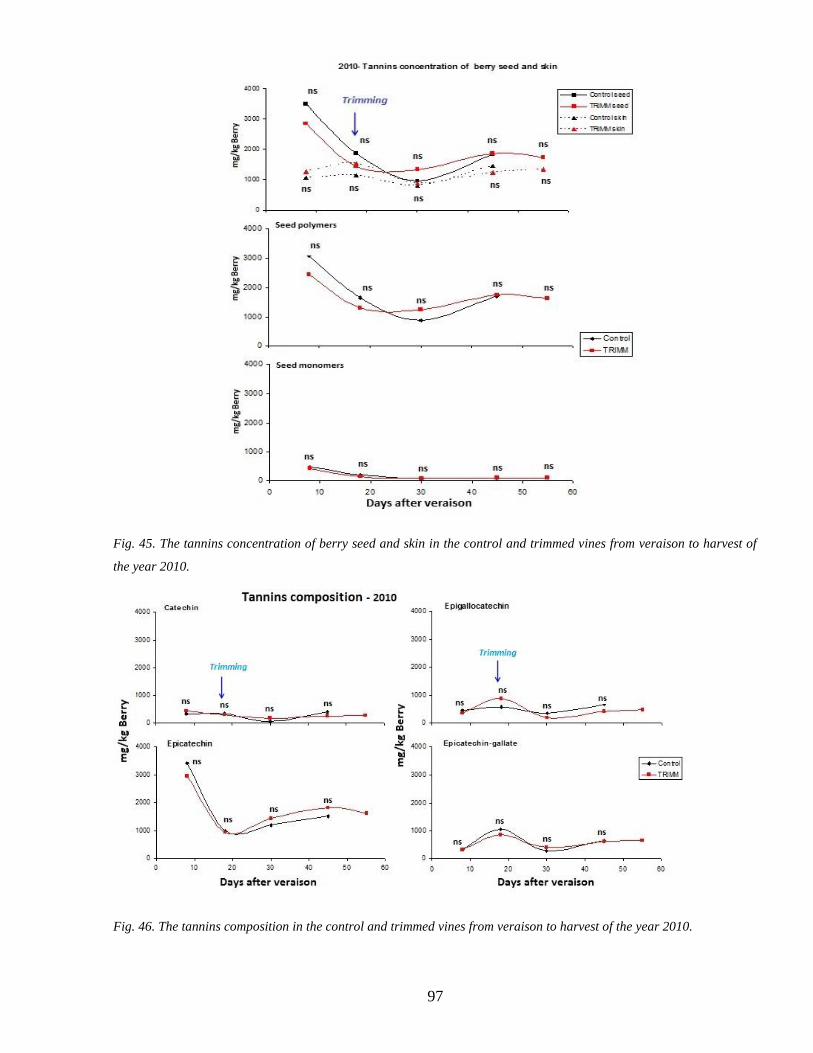
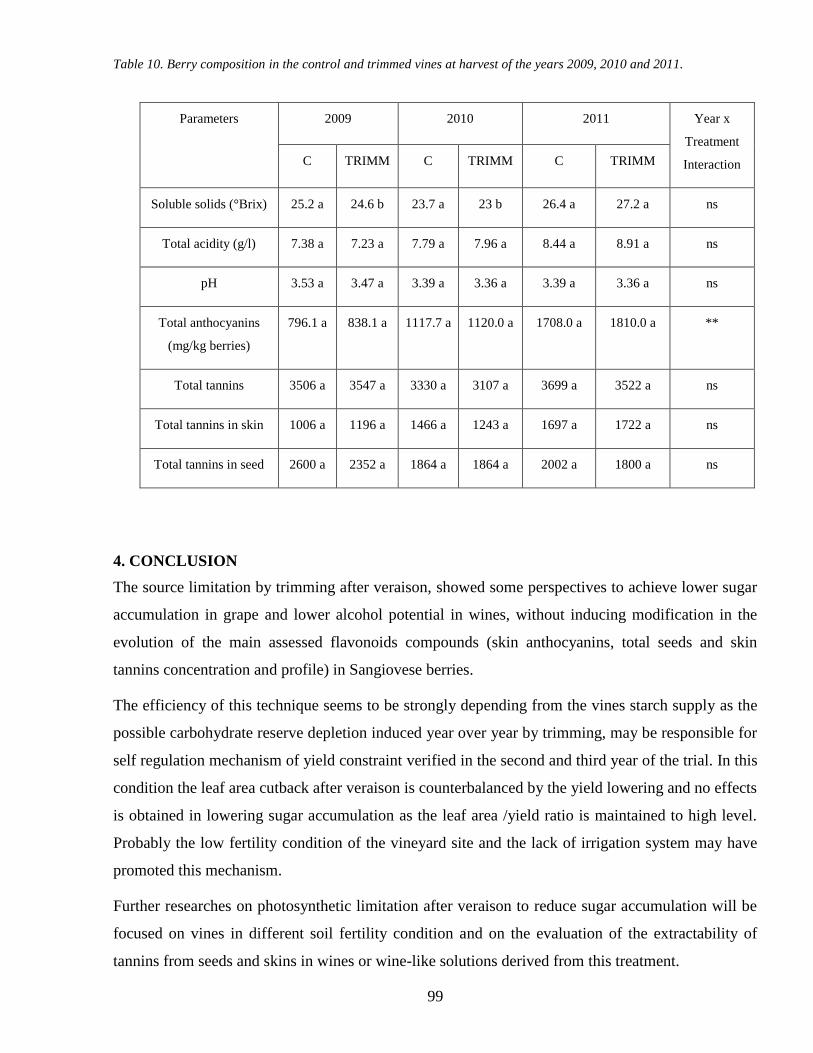
4 CONCLUSION 99
5 GENERAL CONCLUSION
1
1 GENERAL INTRODUCTION
11 Grape ripening
Grape is a non-climacteric fruit and in non-climacteric fruits ethylene does not appear to have a
major role in ripening Little is known about the factors that regulate the ripening process of grapes
However it seems likely that plant growth substances are involved (Coombe 1992) Grapes exhibit
a double sigmoid pattern of development (Fig 1) with the two distinct phases of growth separated
by a lag phase (Coombe 1992) The ripening phase of grape berry development occurs during the
second period of berry growth and results from expansion of existing pericarp cells (Hardie et al
1996) During the ripening phase a number of major physiological and biochemical changes occur
simultaneously in the grape berry and these determine the quality of the fruit at harvest The onset
of ripening (Veraison) signals the beginning of significant changes in metabolism which include
accumulation of sugar softening of berries synthesis of anthocyanins metabolism of organic acids
accumulation of flavour compounds and changes in the level of growth substances (Fig 1) These
changes are coordinated within each berry but individual berries even those on the same bunch do
not ripen synchronously (Coombe 1992) this results in significant variation between berries even
at harvest This variability represents the significant effect of berry environmental conditions on
berry composition
Fig 1 Schematic representation of grape berry development (Robinson amp Davies 2000)
2
12 Grape berry composition
The dynamic of berry ripening is fundamental to determine final berry composition and as a
consequence grape quality Sugars organic acids and phenolic compounds are the main biochemical
components of grape berry
121 Sugars
Sugar accumulation in grape berries is an important phenomenon degBrix is directly related to the
sugar content (gL) and potential titratable alcohol (vol ) and about 55 of grape berry degbrix
converses to alcohol (Fournand et al 2006) At the beginning of berry development sugars are
produced by the green berries while subsequently berry becomes a typical ldquosinkrdquo organ and uses
carbohydrates produced by photosynthesis of leaves Sucrose produced by leaves is then transported
for long distance to berries into the phloem From veacuteraison xylem flow is almost impeded hence
water may reach berries via phloem with sugars Sucrose the predominant sugar transported in the
phloem accumulates in grape berry in form of glucose and fructose Since at the end of berry
ripening the glucosefructose ratio is approximately equal to 1 the cleavage of sucrose may be
catalysed mainly by invertase (Pastore 2010) The main role of sugars in grape berry is to provide
the carbon skeleton of many compounds (such as organic acids or amino acids) and to be energy
sources for cells By now it is scientifically accepted that sugars play also an important role as
signalling molecules in control of growth and development (Rolland et al 2006)
122 Organic acids
Organic acids are some important flavor compounds in both grapes and wines and the composition
and content of organic acids are closely related to the organoleptic quality of grapes and wine (Wen
et al 2009) Tartaric and malic acids generally represent from 69 to 92 of all organic acids in
grape berries (Kliewer 1966) Small amounts of citric succinic lactic and acetic acids are also
present in the berry While tartaric acid is synthesized until veacuteraison malic acids levels vary highly
during berry ripening As to Dokoozlian 2000 green berries together with leaves are the main
grape organs able to produce organic acids
123 Phenolic compounds
Phenolic compounds of grape are divided into non-flavonoids and flavonoids groups (Robinson
2006)
3
1231 Non-flavonoids
Hydroxycinnamic acids benzoic acids and stilbenes belong to the non-flavonoids group
(Waterhouse 2002)
1231a Hydroxycinnamates
Hydroxycinnamates present in grape berries are derivatives of caffeic p-coumaric and ferulic acids
which are present both in the skin hypodermal cells and in the flesh (Adams 2006) and Caftaric
acid is the predominant hydroxycinnamates in grape (Kennedy et al 2006)
1231b Benzoic acids
Benzoic acids are the minor components in grape berry composition Six derivatives of benzoic
acids (gallic acid protocatechuic acid gentisic acid p-hydroxybenzoic acid vanillic acid and
syringic acid) have been found in grape berry Gallic acid is the major benzoic acid present in grape
berry and it is present in both skin and seeds (Pastore 2010)
1231c Stilbenes
Stilbenes are found in the skin of the grape berry and in vegetative tissues Although stilbenes are
present in low quantity both in berries and wine they have aroused a lot of interest because of their
effects on human health in particular for what concern resveratrol (Bavaresco amp Fregoni 2001)
Resveratrol could exist in different forms in monomeric unit (as dimethylated derivatives trans-
pterostilbene and as in form of 3-O-β-D-glucoside trans- and cis-piceid) or in dimer units
(viniferins) (Gatto et al 2008)
1232 Flavonoids
Flavonoids are a class of plant secondary metabolites which are synthesized from Phenylalanine or
Tyrosine condensed with a malonyl-CoA via the phenylpropanoid pathway This class comprises
more than 6500 known compounds many of which are of great biological and commercial
importance In nature they play important roles in resistance to stresses both abiotic (such as excess
light and high temperature) and biotic (such as resistance to microbes) (Mol 1998 Winkel-Shirley
2002) moreover they are of central importance in the ecological relationships with pollinator
insects and in nodule formation (Downey et al 2006) They comprise both transparent compounds
4
such as the flavanols and brightly coloured ones such as phoblaphenes anthocyanins and
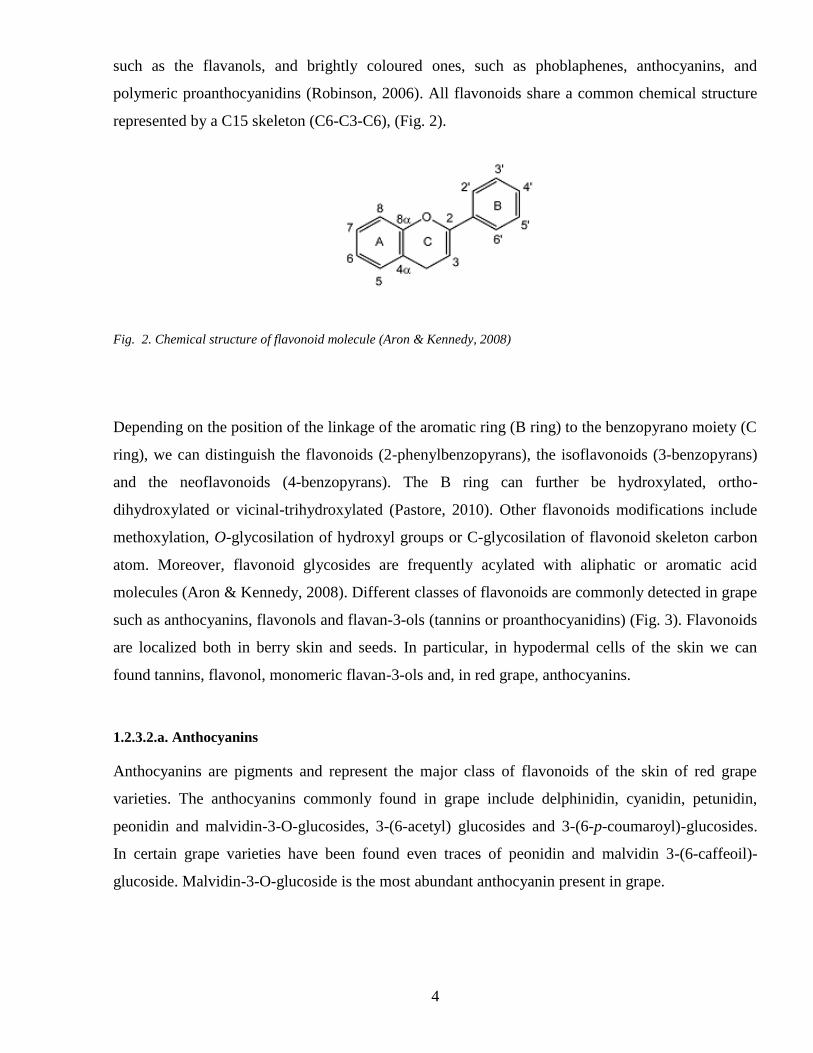
polymeric proanthocyanidins (Robinson 2006) All flavonoids share a common chemical structure
represented by a C15 skeleton (C6-C3-C6) (Fig 2)
Fig 2 Chemical structure of flavonoid molecule (Aron amp Kennedy 2008)
Depending on the position of the linkage of the aromatic ring (B ring) to the benzopyrano moiety (C
ring) we can distinguish the flavonoids (2-phenylbenzopyrans) the isoflavonoids (3-benzopyrans)
and the neoflavonoids (4-benzopyrans) The B ring can further be hydroxylated ortho-
dihydroxylated or vicinal-trihydroxylated (Pastore 2010) Other flavonoids modifications include
methoxylation O-glycosilation of hydroxyl groups or C-glycosilation of flavonoid skeleton carbon
atom Moreover flavonoid glycosides are frequently acylated with aliphatic or aromatic acid
molecules (Aron amp Kennedy 2008) Different classes of flavonoids are commonly detected in grape
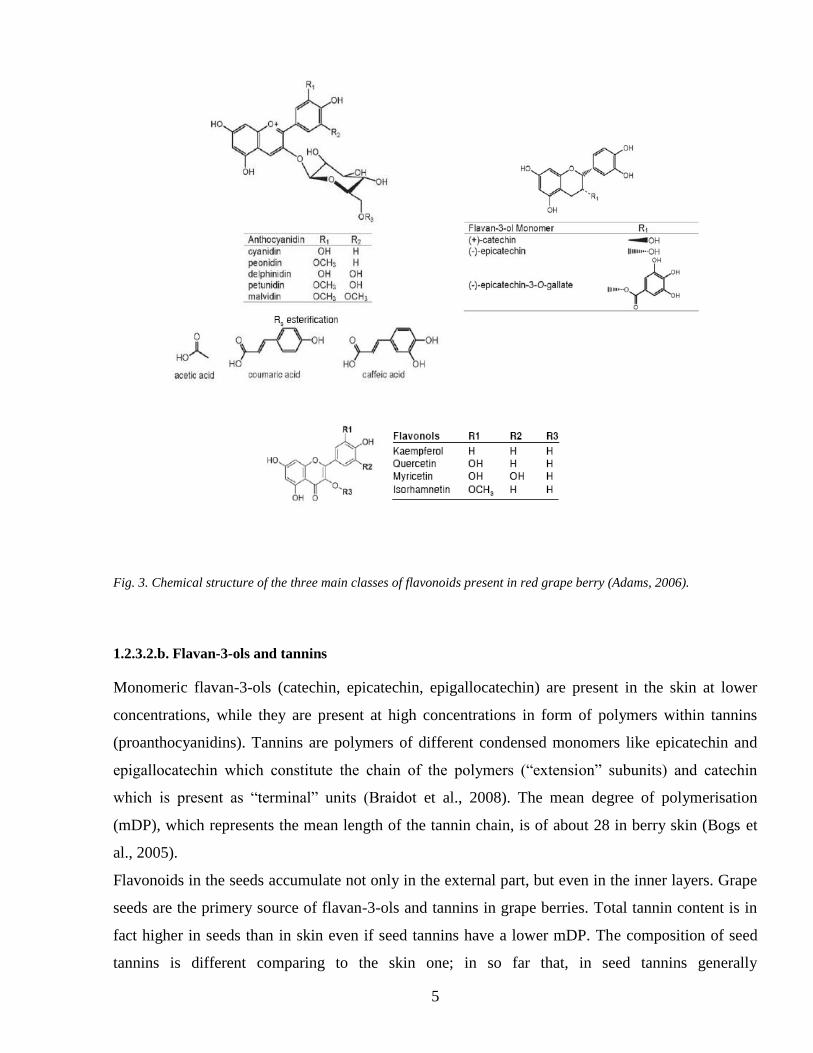
such as anthocyanins flavonols and flavan-3-ols (tannins or proanthocyanidins) (Fig 3) Flavonoids
are localized both in berry skin and seeds In particular in hypodermal cells of the skin we can
found tannins flavonol monomeric flavan-3-ols and in red grape anthocyanins
1232a Anthocyanins
Anthocyanins are pigments and represent the major class of flavonoids of the skin of red grape
varieties The anthocyanins commonly found in grape include delphinidin cyanidin petunidin
peonidin and malvidin-3-O-glucosides 3-(6-acetyl) glucosides and 3-(6-p-coumaroyl)-glucosides
In certain grape varieties have been found even traces of peonidin and malvidin 3-(6-caffeoil)-
glucoside Malvidin-3-O-glucoside is the most abundant anthocyanin present in grape
5
Fig 3 Chemical structure of the three main classes of flavonoids present in red grape berry (Adams 2006)
1232b Flavan-3-ols and tannins
Monomeric flavan-3-ols (catechin epicatechin epigallocatechin) are present in the skin at lower
concentrations while they are present at high concentrations in form of polymers within tannins
(proanthocyanidins) Tannins are polymers of different condensed monomers like epicatechin and
epigallocatechin which constitute the chain of the polymers (ldquoextensionrdquo subunits) and catechin
which is present as ldquoterminalrdquo units (Braidot et al 2008) The mean degree of polymerisation
(mDP) which represents the mean length of the tannin chain is of about 28 in berry skin (Bogs et
al 2005)
Flavonoids in the seeds accumulate not only in the external part but even in the inner layers Grape
seeds are the primery source of flavan-3-ols and tannins in grape berries Total tannin content is in
fact higher in seeds than in skin even if seed tannins have a lower mDP The composition of seed
tannins is different comparing to the skin one in so far that in seed tannins generally
6
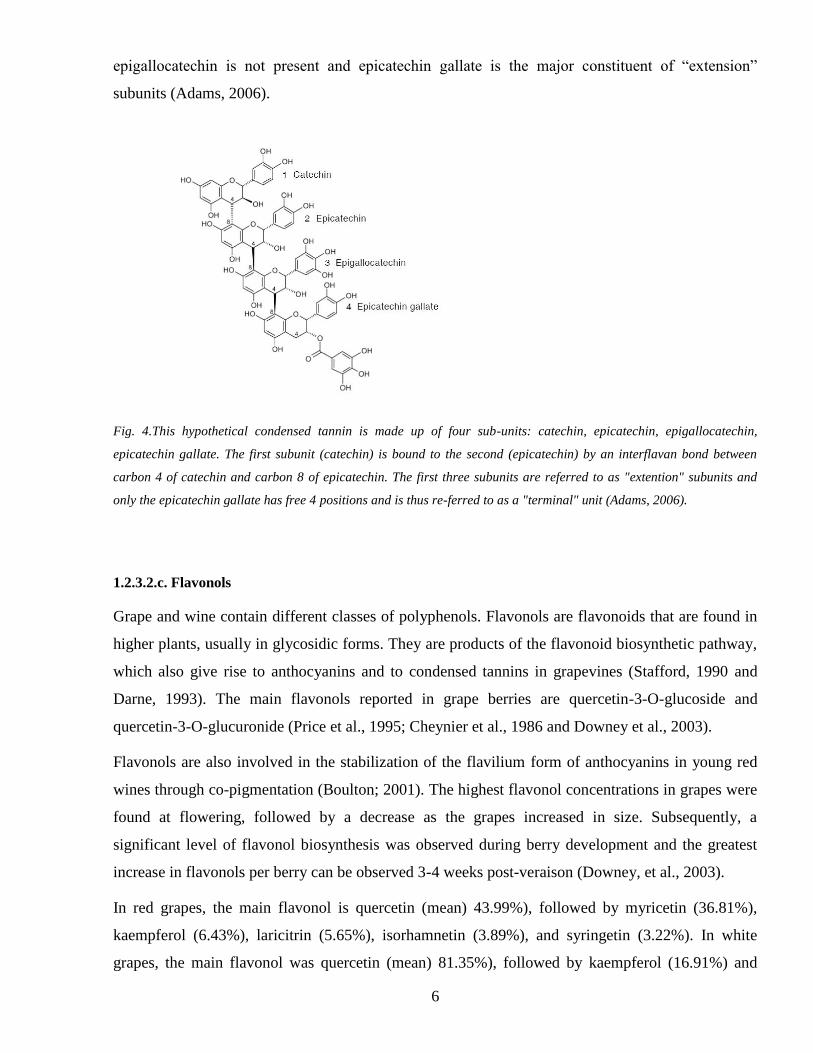
epigallocatechin is not present and epicatechin gallate is the major constituent of ldquoextensionrdquo
subunits (Adams 2006)
Fig 4This hypothetical condensed tannin is made up of four sub-units catechin epicatechin epigallocatechin
epicatechin gallate The first subunit (catechin) is bound to the second (epicatechin) by an interflavan bond between
carbon 4 of catechin and carbon 8 of epicatechin The first three subunits are referred to as extention subunits and
only the epicatechin gallate has free 4 positions and is thus re-ferred to as a terminal unit (Adams 2006)
1232c Flavonols
Grape and wine contain different classes of polyphenols Flavonols are flavonoids that are found in
higher plants usually in glycosidic forms They are products of the flavonoid biosynthetic pathway
which also give rise to anthocyanins and to condensed tannins in grapevines (Stafford 1990 and
Darne 1993) The main flavonols reported in grape berries are quercetin-3-O-glucoside and
quercetin-3-O-glucuronide (Price et al 1995 Cheynier et al 1986 and Downey et al 2003)
Flavonols are also involved in the stabilization of the flavilium form of anthocyanins in young red
wines through co-pigmentation (Boulton 2001) The highest flavonol concentrations in grapes were
found at flowering followed by a decrease as the grapes increased in size Subsequently a
significant level of flavonol biosynthesis was observed during berry development and the greatest
increase in flavonols per berry can be observed 3-4 weeks post-veraison (Downey et al 2003)
In red grapes the main flavonol is quercetin (mean) 4399) followed by myricetin (3681)
kaempferol (643) laricitrin (565) isorhamnetin (389) and syringetin (322) In white
grapes the main flavonol was quercetin (mean) 8135) followed by kaempferol (1691) and
7
isorhamnetin (174) The delphinidin-like flavonols myricetin laricitrin and syringetin were
missing in all white varieties indicating that the enzyme flavonoid 3hydroxylase is not
expressed in white grape varieties (Mattivi et al 2006)
It is interesting to observe the analogies between the hydroxylation of position 5 which leads to the
formation of the anthocyanidin delphinidin from cyanidin and the flavonol myricetin from quercetin
In addition to this O-methylation of position 3of anthocyanidin cyanidin which leads to the
formation of peonidin corresponds to the O-methylation which converts flavonol quercetin into
isorhamnetin Finally O-methylation of positions 3and 5of anthocyanidin delphinidin which
leads to the formation of petunidin and malvidin corresponds to O-methylation which converts
flavonol myricetin into laricitrin and syringetin (Fig 3)
13 Biosynthesis of flavonoids in red grape berry
Flavonoids are synthesized within the general phenylpropanoid pathway From the same precursors
and towards specific branches these pathways bring to the synthesis of anthocyanins flavonols and
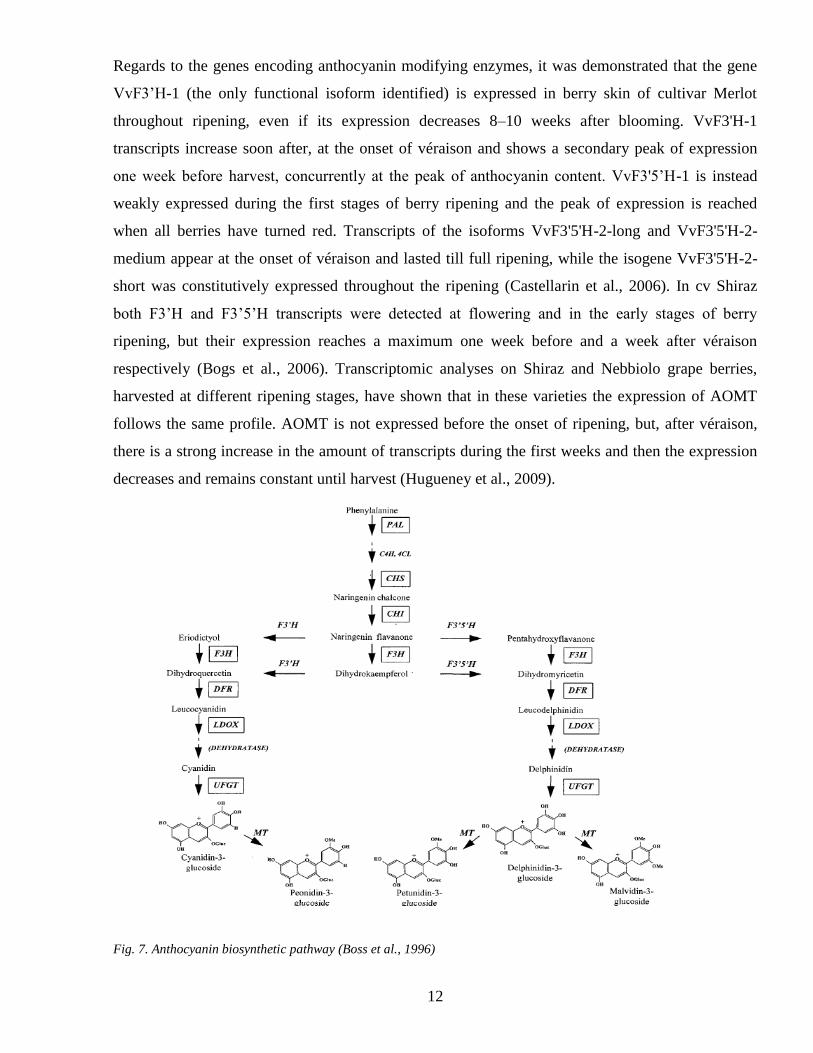
proanthocyanidins (Boss et al 1996) (Fig 5 6) The enzymes involved in flavonoid biosynthesis
are associated at the cytoplasmic surface of the endoplasmic reticulum and represent a multi-enzyme
complex
131 Synthesis of the early products of the phenylpropanoid pathway
1311 PAL
PAL is a key enzyme ubiquitous in plants which catalyzes one of the first steps in
phenylpropanoids biosynthesis (Fig 5) the hydrolysis of ammonia from phenylalanine to produce
cinnamic acid Cinnamic acid is the precursor of all phenolic compounds Recently the subcellular
localization of PAL was found in grape PAL is present in the cell walls secondarily thickened
walls and parenchyma cells of the berry tissues (Chen et al 2006) This enzyme that is a member
of a large gene family has been cloned in many plant species In grape there are probably present
15-20 PAL isoforms (Sparvoli et al 1994)
1312 C4H
The cinnamic acid produced by PAL is converted to p-coumaric acid towards the action of
cinnamate 4-hydrolase (C4H) (Fig 5) C4H belongs to the cytochrome P450 monoxygenases
8
family The enzymes of this family are able to catalyse exothermic reactions that are irreversible In
grape C4H have not yet been cloned but itrsquos known that it is present in the chloroplasts and in the
nucleus of berry tissues (Chen et al 2006)
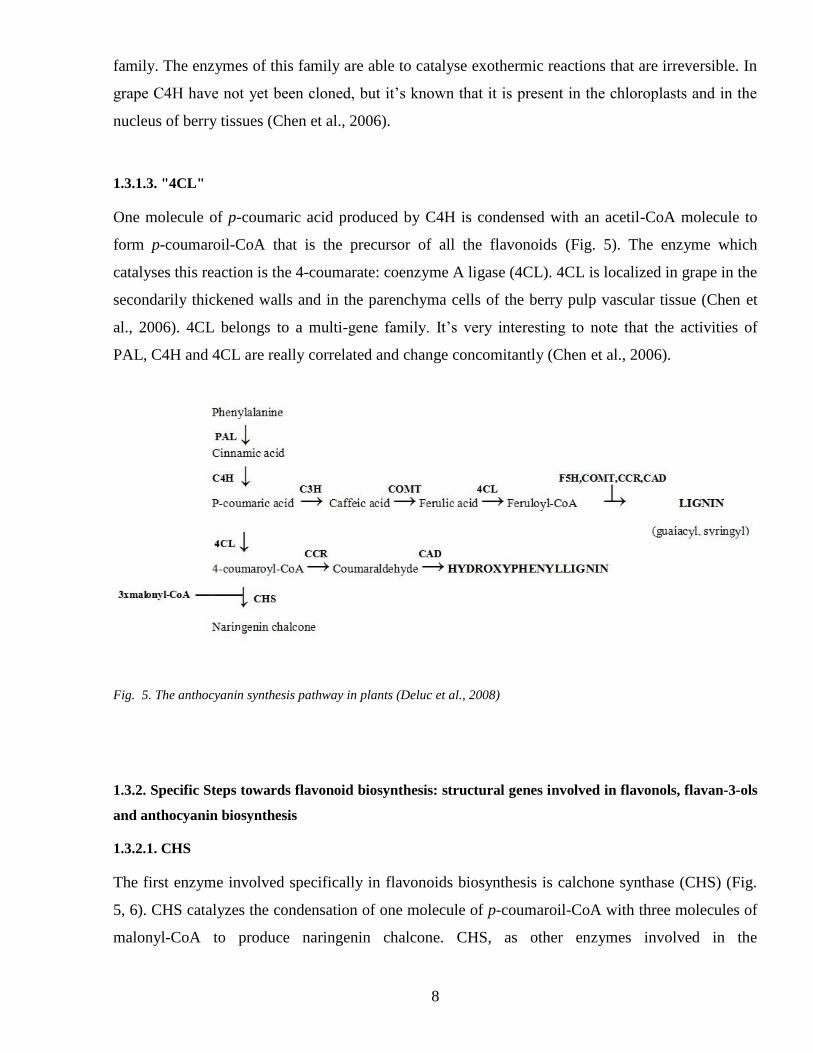
1313 4CL
One molecule of p-coumaric acid produced by C4H is condensed with an acetil-CoA molecule to
form p-coumaroil-CoA that is the precursor of all the flavonoids (Fig 5) The enzyme which
catalyses this reaction is the 4-coumarate coenzyme A ligase (4CL) 4CL is localized in grape in the
secondarily thickened walls and in the parenchyma cells of the berry pulp vascular tissue (Chen et
al 2006) 4CL belongs to a multi-gene family Itrsquos very interesting to note that the activities of
PAL C4H and 4CL are really correlated and change concomitantly (Chen et al 2006)
Fig 5 The anthocyanin synthesis pathway in plants (Deluc et al 2008)
132 Specific Steps towards flavonoid biosynthesis structural genes involved in flavonols flavan-3-ols
and anthocyanin biosynthesis
1321 CHS
The first enzyme involved specifically in flavonoids biosynthesis is calchone synthase (CHS) (Fig
5 6) CHS catalyzes the condensation of one molecule of p-coumaroil-CoA with three molecules of
malonyl-CoA to produce naringenin chalcone CHS as other enzymes involved in the
9
phenylpropanoid metabolism belongs to a large super-family of proteins the family of type III
Polykethide Synthase
1322 CHI
Naringenin calchone is converted to flavanones (naringenin) to form the flavanoid core towards a
stereo-specific ring closure catalysed by chalchone isomerase (CHI) (Jeong et al 2004) On the
basis of the CHI sequence that doesnrsquot display any detectable homology with other proteins seems
that this enzyme is unique to the plant kingdom (Fig 6)
1323 F3H FLS F3rsquoH F3rsquo5rsquoH
Naringenin is then hydroxylated at position 3 by flavanone 3-hydroxylase (F3H) to form
dihydrokaempferol the flavonols precursor Dihydrokaempferol can be substrate of three different
enzymes which directly bring to the production of the flavonol kaempferol towards the action of
flavonol synthase (FLS) or to the biosynthesis of dihydroquercetin and dihydromyricetin towards
the action respectively of flavonoid-3rsquo-hydroxylase (F3rsquoH) and flavonoid-3rsquo5rsquo-hydroxylase
(F3rsquo5rsquoH) These enzymes catalyse the hydroxylation of the B ring of dihydrokaempferol in 3rsquo or
3rsquo5rsquo positions F3rsquoH activity results in the production of cyanidin-like anthocyanins while F3rsquo5rsquoH
action brings to the production of delphinidin anthocyanins species The cloning of both F3rsquoH and
F3rsquo5rsquoH genes from grape has shown that in grape two copies of F3rsquoH and several copies of F3rsquo5rsquoH
are present in a single chromosome (Bogs et al 2006 Castellarin et al 2006) In flowers of
Petunia Hybrida has been shown that F3rsquoH and F3rsquo5rsquoH can act both on the substrates and products
of F3H (Menting et al 1994) As previously described FLS is the key enzyme in the biosynthesis
of flavonols This enzyme employs dihydrokaempferol dihydroquercetin and dihydromyricetin as
substrates to synthesize the flavonol aglicones (Chua et al 2008)
1324 DFR
FLS directly competes for its substrates with the enzyme dihydroflavonol 4-reductase (DFR) which
catalyses the first step in the conversion of dihydroflavonols to proanthocyanidins or anthocyanins
This point of the biosynthetic pathway is a key regulatory point because it determines the direction
towards flavonols or proanthocyanidins and anthocyanins synthesis DFR is in fact responsible for
the NADPH-dependent reduction at the 4 position of the C ring of dihydroquercetin and
dihydromyricetin to give respectively leucocyanidin or leucodelphinidin (Pastore 2010)
10
1325 ANR LAR LDOX and UFGT
Leucocyanidin and leucodelphinidin are respectively the substrates to the next step of the
proanthocyanidin and anthocyanin biosyntheses which involve either anthocyanidin reductase
(ANR or BAN) and leucocyanidin reductase (LAR) or leucoanthocyanidin dioxygenase (LDOX)
and UDP-glucose flavonoid 3-O-glucosyltransferase (UFGT)
In grape LAR converts leucocyanidin in the flavan-3-ol (+)-catechin with a NADPH-dependent
reduction ANR acts instead on the products of the enzyme LDOX which catalyzes the cyanidin and
delphinidin production from leucoanthocyanidins Then ANR uses these substrates to synthesize
respectively (-)-epicatechin and (-)-epicatechin-3-O-gallate (Gagneacute et al 2009)
As FLS also LDOX belongs to a family of 2-oxoglutarate-dependent oxygenase (Pastore 2010) In
a recent work has been demonstrated that in Arabidopsis Thaliana LDOX could have also a FLS
activity in vivo (Stracke et al 2009) Southern blot experiments conducted on Vitis Vinifera cv Red
Globe have shown that only a single copy of LDOX gene is present in grapevine (Gollop et al
2001) The anthocyanidins cyanidin and delphinidin produced towards the action of LDOX are
then stabilized through the addition of a glucose residue at the 3 position of the C ring This reaction
is catalysed by the enzyme UFGT and allows the anthocyanins transport into the vacuole
UFGT is the key enzyme in anthocyanin biosynthesis because it is expressed only in red skin
cultivars UFGT seems to be present in grape genome as a single copy and it is interesting to note
that its promoter and coding regions have been found also in white cultivar and are similar to the
sequences present in their red-skin sports (Kobayashi et al 2001) The 3-O-glycosilation of
anthocyanin is almost always a prerequisite for further modification as methylation and acylation
1326 OMTs
Methoxyl groups are found in three of the main anthocyanins (peonidin petunidin and malvidin-3-
O-glucoside) This reaction brings to more stable compounds for the methylation of the reactive
hydroxyl groups and the enzymes responsible are O-methyltransferases (OMTs) The first partial
purification and characterization of a methyltransferase catalyzing the methylation of cyanidin-3-
glucoside to peonidin-3-glucoside was performed on a cell suspension of Vitis vinifera cv Gamay
Freaux This enzyme is S-adenosyl-L-methionine (SAM)-dependent and it was shown that it has a
high substrate specificity reacting only with cyanidin and not with delphinidin (Pastore 2010)
11
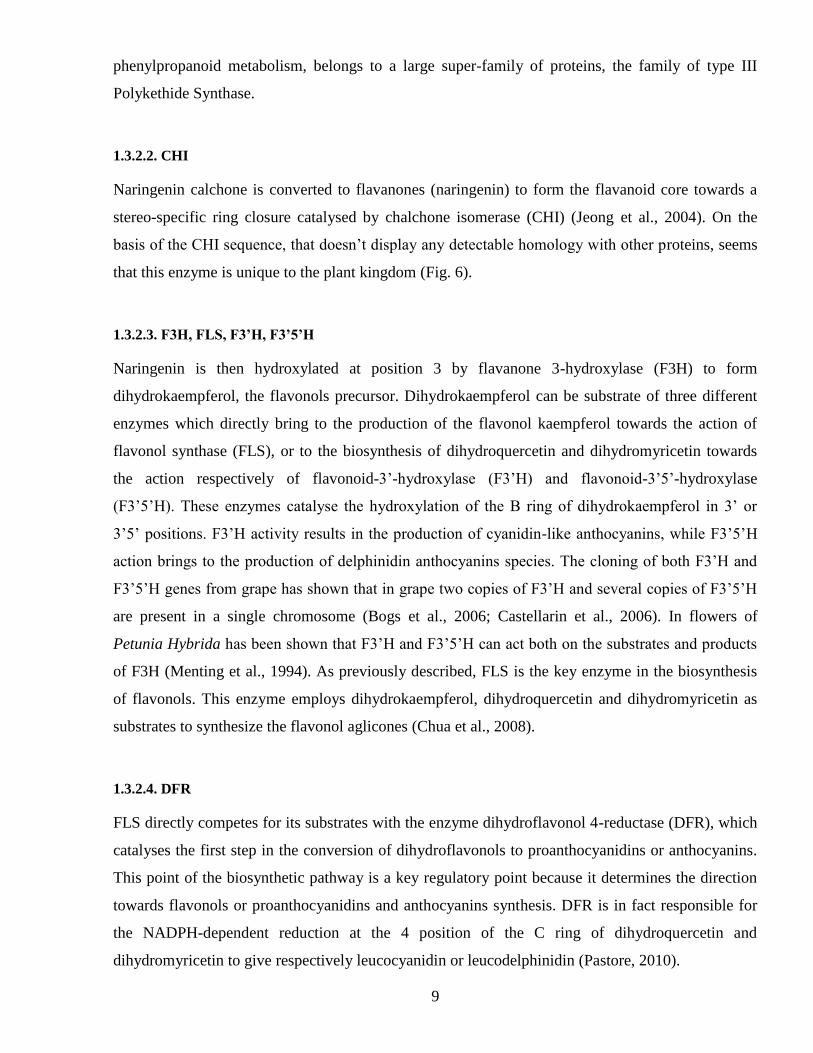
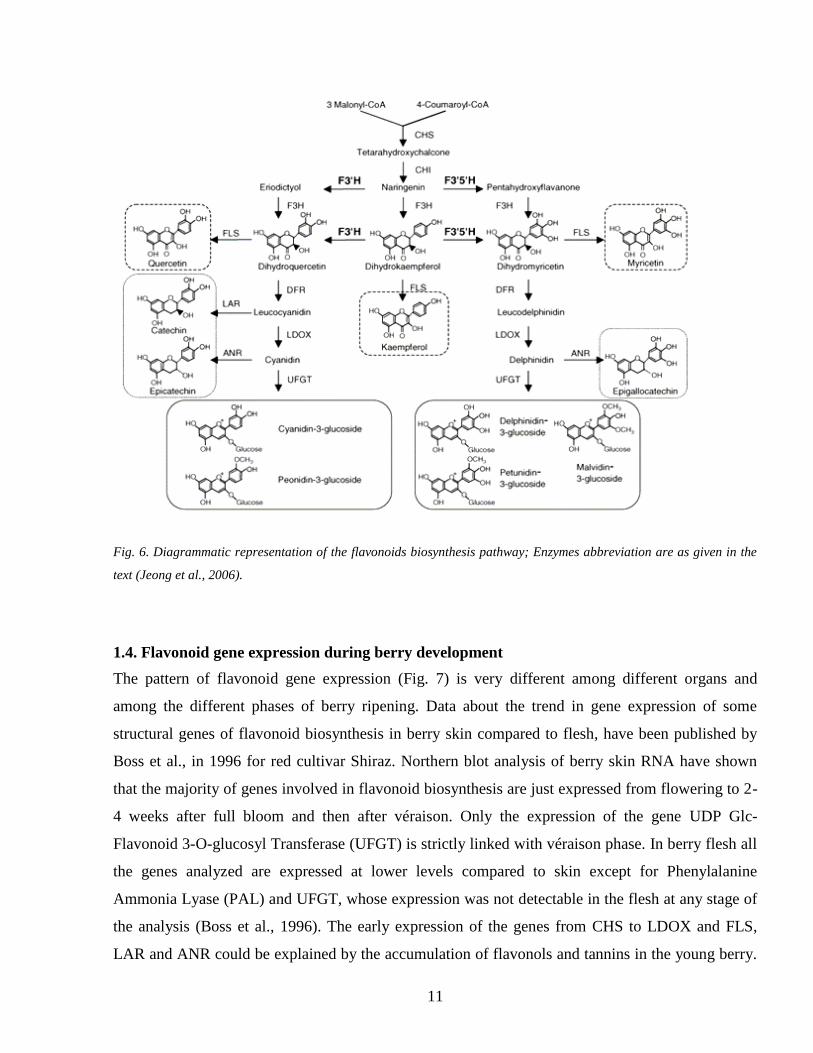
Fig 6 Diagrammatic representation of the flavonoids biosynthesis pathway Enzymes abbreviation are as given in the
text (Jeong et al 2006)
14 Flavonoid gene expression during berry development
The pattern of flavonoid gene expression (Fig 7) is very different among different organs and
among the different phases of berry ripening Data about the trend in gene expression of some
structural genes of flavonoid biosynthesis in berry skin compared to flesh have been published by
Boss et al in 1996 for red cultivar Shiraz Northern blot analysis of berry skin RNA have shown
that the majority of genes involved in flavonoid biosynthesis are just expressed from flowering to 2-
4 weeks after full bloom and then after veacuteraison Only the expression of the gene UDP Glc-
Flavonoid 3-O-glucosyl Transferase (UFGT) is strictly linked with veacuteraison phase In berry flesh all
the genes analyzed are expressed at lower levels compared to skin except for Phenylalanine
Ammonia Lyase (PAL) and UFGT whose expression was not detectable in the flesh at any stage of
the analysis (Boss et al 1996) The early expression of the genes from CHS to LDOX and FLS
LAR and ANR could be explained by the accumulation of flavonols and tannins in the young berry
12
Regards to the genes encoding anthocyanin modifying enzymes it was demonstrated that the gene
VvF3rsquoH-1 (the only functional isoform identified) is expressed in berry skin of cultivar Merlot
throughout ripening even if its expression decreases 8ndash10 weeks after blooming VvF3H-1
transcripts increase soon after at the onset of veacuteraison and shows a secondary peak of expression
one week before harvest concurrently at the peak of anthocyanin content VvF35rsquoH-1 is instead
weakly expressed during the first stages of berry ripening and the peak of expression is reached
when all berries have turned red Transcripts of the isoforms VvF35H-2-long and VvF35H-2-
medium appear at the onset of veacuteraison and lasted till full ripening while the isogene VvF35H-2-
short was constitutively expressed throughout the ripening (Castellarin et al 2006) In cv Shiraz
both F3rsquoH and F3rsquo5rsquoH transcripts were detected at flowering and in the early stages of berry
ripening but their expression reaches a maximum one week before and a week after veacuteraison
respectively (Bogs et al 2006) Transcriptomic analyses on Shiraz and Nebbiolo grape berries
harvested at different ripening stages have shown that in these varieties the expression of AOMT
follows the same profile AOMT is not expressed before the onset of ripening but after veacuteraison
there is a strong increase in the amount of transcripts during the first weeks and then the expression
decreases and remains constant until harvest (Hugueney et al 2009)
Fig 7 Anthocyanin biosynthetic pathway (Boss et al 1996)
13
141 Regulatory genes of anthocyanin biosynthesis pathway
Among the three classes of flavonoids present in grapevine the regulation of anthocyanins
biosynthesis has been the most studied thanks to the numerous available colour bud sports which
involve alterations in the red or purple berry anthocyanin content Bud sports are usually infrequent
changes in phenotype affecting shoots of woody perennials but colour bud sports are common and
examples in horticultural plants are widespread Alterations in the anthocyanins of a plant can be in
fact very distinct and easily observed and generally have no detrimental effect on the viability of the
plant The molecular basis underlying the appearance of bud sports are not yet well understood
The study of the genes regulating structural genes expression in anthocyanin biosynthesis was at
first done in maize petunia and snapdragon (Davies amp Schwinn 2003) and then full characterized in
Arabidopsis (Broun 2005) From these researches emerged that three different types of transcription
factors play a key roles in regulation of anthocyanin biosynthesis MYB bHLH (basic Helix-Loop-
Helix) and WDR (WD40 repeats) even if the WD40 proteins function seem to be only to assist
MYB and bHLH proteins MYB genes are present in plant genomes as different families The first
experience on MYB genes in grapevine was done on the cultivar Kyoho which belongs to Vitis
labruscana (V Labrusca x V Vinifera) A cDNA library has been constructed with cDNA of ripe
berries and then using random primers designed on maize MYB conserved sequences eight
different grape MYB homologue sequences were identified Among these only four species of
MYB gene can be really identified MYBA MYBB MYBC and MYBD The whole cDNA
sequences of MYBA and MYBB showed the existence of three different species for MYBA
(VlMYBA1-1 VlMYBA1-2 and VlMYBA2) and two for MYBB (VlMYBB1-1 and VlMYBB1-2)
which are different in the nucleotide sequence Transcription analyses revealed that VlMYBA is
only weakly expressed before veacuteraison but immediately after the beginning of anthocyanin
accumulation and berry softening VlMYBA expression rapidly increases VlMYBB expression was
instead detected in all the berry ripening stages analyzed even if also VlMYBB expression increases
after veacuteraison Regards to VlMYBC and VlMYBD these genes seems to be few linked to berry
veacuteraison because the first one is expressed at high levels just at the beginning of ripening and at
veacuteraison the transcription decreases in the case of VlMYBD the expression was detected only in
the early stages of berry ripening The tight relationship between VlMYBA and berry veacuteraison and
anthocyanin accumulation was further confirmed by expression analyses which revealed that
VlMYBA transcripts differentially from the others VlMYB genes identified were detected only in
berry tissues The introduction of VlMYBA1-1 VlMYBA1-2 and VlMYBA2 in embryos causes the
appearance of reddish-purple spots and so the authors concluded that VlMYBA was the
14
transcription factor regulating UFGT expression (Kobayashi et al 2002) The molecular basis of the
regulation of UFGT expression were then confirmed also for Vitis Vinifera and it was shown that
VvMYBA was probably responsible of the ancestral differentiation between red and white cultivar
The white-skinned varieties Italia and Muscat of Alexandria have in fact a GRET1 retrotransposon
inserted in both the alleles of the promoter region of VvMYBA1 gene and this causes the
inactivation of its expression In the grape varieties that have pigmented berry skin at least one
functional VvMYBA1 allele redVvMYBA1 (rVvMYBA1) and one functional VvMYBA2 allele
redVvMYBA2 (rVvMYBA2) have to exist (Walker et al 2007)
In nature the color of grape berry ranges from the lightest pink to the darkest purple tones according
to the amount and quality of anthocyanin accumulated in the berry skin This suggests a polygenic
control of anthocyanin accumulation in Vitis Vinifera despite evidence that the primery
determination of anthocyanin production in berries appeared to be controlled by a single dominant
locus (Barrit amp Einset 1969) Among the 68 unigenes identified a cluster of four VvMYBA genes
(VvMYBA1 VvMYBA2 VvMYBA3 and VvMYBA4) was considered essential to determine the
genetic bases of the quantitative variation of anthocyanin content in berry skin After the
identification of VvMYBA1 the first expression analyses of this gene in grapevine were done by
Jeong et al (2004) on conditioned berry with the aim to alter anthocyanin accumulation The
change in expression levels of VvMYBA1 coincided with the changes in the expression levels of
other tested anthocyanin biosynthetic enzyme genes (CHS1 CHS2 CHS3 CHI1 CHI2 F3H1
F3H2 DFR LDOX and UFGT) and also with the accumulation of anthocyanins in the berry skins
This suggests that the product of VvMYBA1 gene may control the transcription of not only UFGT
but also of other structural genes whose expression increase after veacuteraison
2 Global Warming
Since the beginning of the pre-industrial era around 1750 the atmospheric concentration of
greenhouse gases has increased by about 30 because of the combustion of fossil fuels and changes
in land-use practices Increased atmospheric concentrations of greenhouse gases tend to warm the
atmosphere (Watson et al 1990) The earths climate which has been relatively stable during the
past 10000 years is now changing (Fig 8) The earths surface temperature in this century is
warmer than any other centuries during the 600 years and the last few decades have been the hottest
in this century (Mann et al 1998)
It is clear that global warming will adversely affect human health ecological systems and socio-
economic sectors including human settlements and agriculture (Movahed amp Maeiyat 2009) and
15
particularly viticulture Climate is a pervasive factor in the viability of all forms of agriculture and is
never more important than with the cultivation of grapes for the production of wine (Jones et al
2005) Global warming and viticulture are interrelated processes both of which take place on a
global scale
3 Global warming and viticulture
In the last decades the majority of the worlds highest quality wine-producing regions have
experienced growing season warming trends In these regions future global warming would exceed
a threshold as a result of which the balanced fruit ripening required for existing varieties and wine
styles would become progressively more difficult While improved winemaking knowledge and
husbandry practices contributed to the better vintages it was shown that climate had and will likely
always have a significant role in quality variations (Jones et al 2005)
In northern Europe climate change may produce positive effects on viticulture through introduction
of new varieties (Fig9) higher production and expansion of suitable areas for cultivation
Nonetheless the disadvantages may be an increase in the need for plant protection the risk of
nutrient leaching and the turnover of soil organic matters (Lough et al 1983 Jones et al 2005)
However in southern areas the disadvantages will predominate The possible increase in water
shortage and extreme weather events may cause lower harvestable yields higher yield variability
and a reduction in suitable areas These effects may reinforce the current trends of intensification of
viticulture in Northern and Western Europe and extensification in the Mediterranean and
Southeastern parts of Europe (Lough et al 1983 Jones et al 2005) In general global warming is
projected to have significant impacts on conditions affecting viticulture including temperature
carbon dioxide precipitation increasing demand for irrigation to meet higher evaporation
increasing the incidence of pests and through direct temperature effects on production quality and
quantity and the interaction of these elements (Fraser 2008)
31 The effects of global warming on berry ripening
The maturation of grapevine berries is strongly influenced by the microclimate around the fruit
Global atmospheric warming trend can affect physiological functions involved in fruit maturation
(Jones et al 2005 Mori et al 2007) Acidity anthocyanins and flavonols concentrations in berries
are clearly linked to berry temperature (Haselgrove et al 2000 Bergqvist et al 2001 Spayd et al
2002 Downey et al 2004) while sugar content is strongly influenced by berry transpiration
(Rebucci et al 1997) Daily average temperature at the time of ripening is used to estimate potential
16
temperature impacts on quality Regards to the temperature the specific number of heat units
(degree days DD) that determines rate of berry ripening is typical of each variety In general the
optimum temperature for berry growth and ripening is among 20deg-25degC (Dokoozlian 2000)
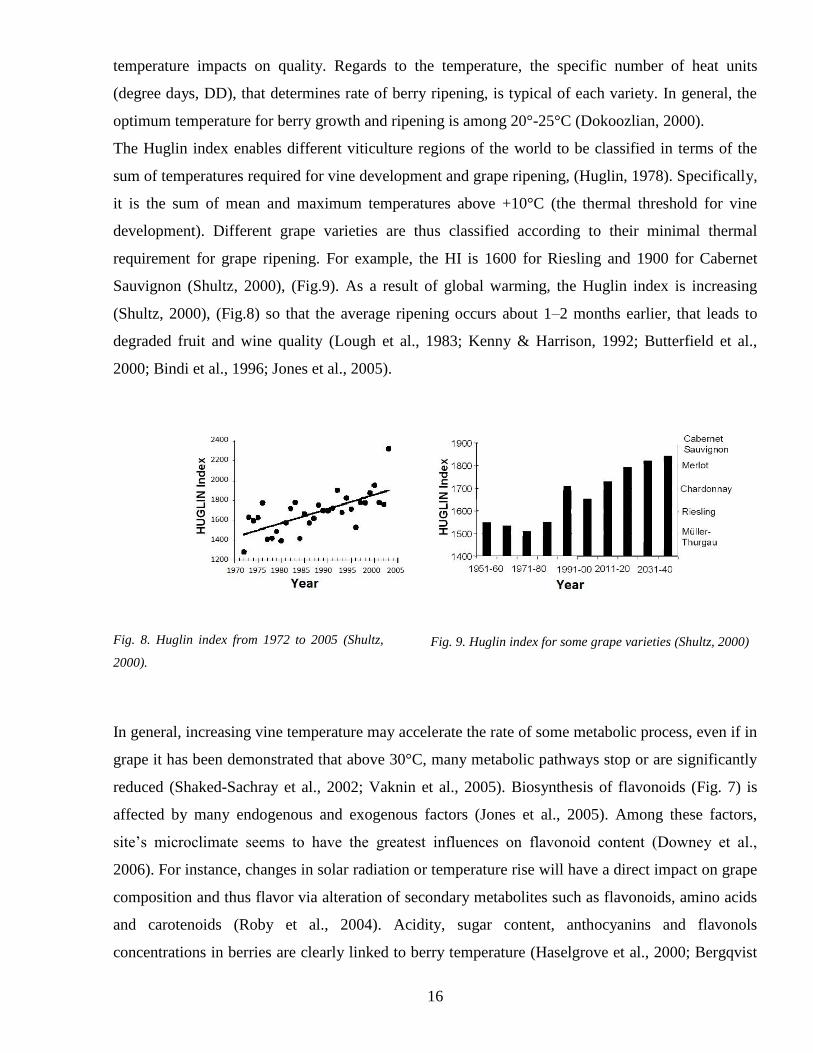
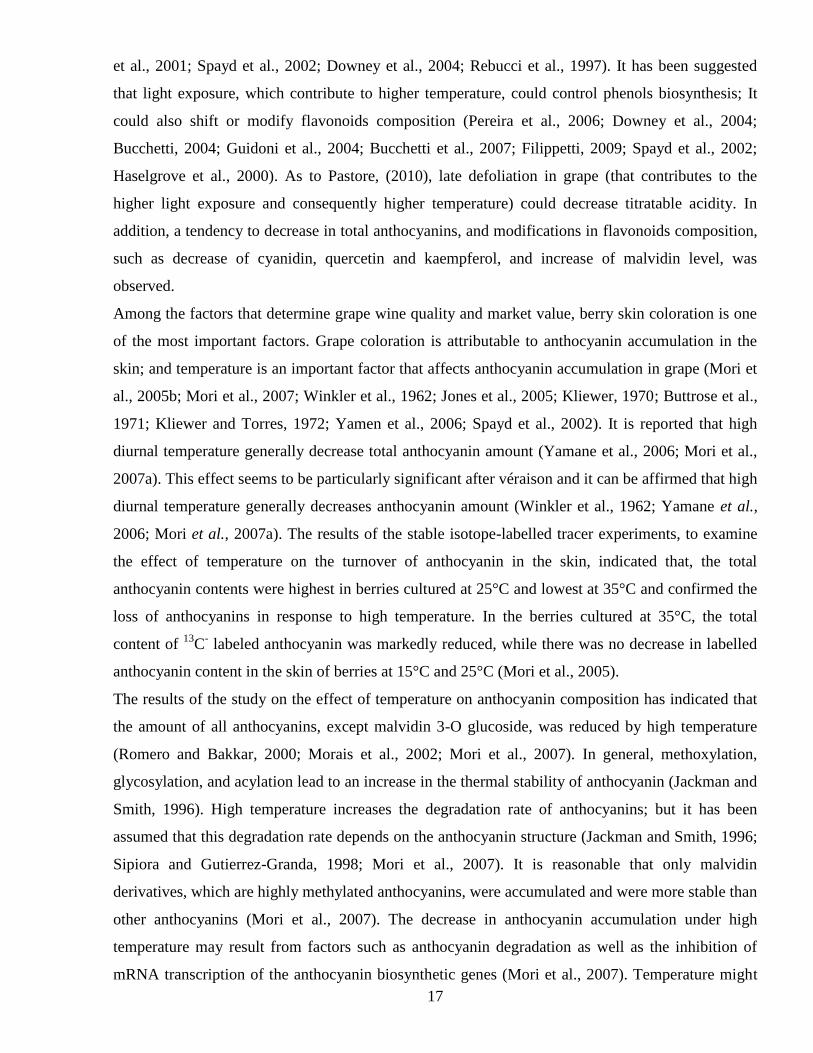
The Huglin index enables different viticulture regions of the world to be classified in terms of the
sum of temperatures required for vine development and grape ripening (Huglin 1978) Specifically
it is the sum of mean and maximum temperatures above +10degC (the thermal threshold for vine
development) Different grape varieties are thus classified according to their minimal thermal
requirement for grape ripening For example the HI is 1600 for Riesling and 1900 for Cabernet
Sauvignon (Shultz 2000) (Fig9) As a result of global warming the Huglin index is increasing
(Shultz 2000) (Fig8) so that the average ripening occurs about 1ndash2 months earlier that leads to
degraded fruit and wine quality (Lough et al 1983 Kenny amp Harrison 1992 Butterfield et al
2000 Bindi et al 1996 Jones et al 2005)
Fig 8 Huglin index from 1972 to 2005 (Shultz
2000)
Fig 9 Huglin index for some grape varieties (Shultz 2000)
In general increasing vine temperature may accelerate the rate of some metabolic process even if in
grape it has been demonstrated that above 30degC many metabolic pathways stop or are significantly
reduced (Shaked-Sachray et al 2002 Vaknin et al 2005) Biosynthesis of flavonoids (Fig 7) is
affected by many endogenous and exogenous factors (Jones et al 2005) Among these factors
sitersquos microclimate seems to have the greatest influences on flavonoid content (Downey et al
2006) For instance changes in solar radiation or temperature rise will have a direct impact on grape
composition and thus flavor via alteration of secondary metabolites such as flavonoids amino acids
and carotenoids (Roby et al 2004) Acidity sugar content anthocyanins and flavonols
concentrations in berries are clearly linked to berry temperature (Haselgrove et al 2000 Bergqvist
17
et al 2001 Spayd et al 2002 Downey et al 2004 Rebucci et al 1997) It has been suggested
that light exposure which contribute to higher temperature could control phenols biosynthesis It
could also shift or modify flavonoids composition (Pereira et al 2006 Downey et al 2004
Bucchetti 2004 Guidoni et al 2004 Bucchetti et al 2007 Filippetti 2009 Spayd et al 2002
Haselgrove et al 2000) As to Pastore (2010) late defoliation in grape (that contributes to the
higher light exposure and consequently higher temperature) could decrease titratable acidity In
addition a tendency to decrease in total anthocyanins and modifications in flavonoids composition
such as decrease of cyanidin quercetin and kaempferol and increase of malvidin level was
observed
Among the factors that determine grape wine quality and market value berry skin coloration is one
of the most important factors Grape coloration is attributable to anthocyanin accumulation in the
skin and temperature is an important factor that affects anthocyanin accumulation in grape (Mori et
al 2005b Mori et al 2007 Winkler et al 1962 Jones et al 2005 Kliewer 1970 Buttrose et al
1971 Kliewer and Torres 1972 Yamen et al 2006 Spayd et al 2002) It is reported that high
diurnal temperature generally decrease total anthocyanin amount (Yamane et al 2006 Mori et al
2007a) This effect seems to be particularly significant after veacuteraison and it can be affirmed that high
diurnal temperature generally decreases anthocyanin amount (Winkler et al 1962 Yamane et al
2006 Mori et al 2007a) The results of the stable isotope-labelled tracer experiments to examine
the effect of temperature on the turnover of anthocyanin in the skin indicated that the total
anthocyanin contents were highest in berries cultured at 25degC and lowest at 35degC and confirmed the
loss of anthocyanins in response to high temperature In the berries cultured at 35degC the total
content of 13
C- labeled anthocyanin was markedly reduced while there was no decrease in labelled
anthocyanin content in the skin of berries at 15degC and 25degC (Mori et al 2005)
The results of the study on the effect of temperature on anthocyanin composition has indicated that
the amount of all anthocyanins except malvidin 3-O glucoside was reduced by high temperature
(Romero and Bakkar 2000 Morais et al 2002 Mori et al 2007) In general methoxylation
glycosylation and acylation lead to an increase in the thermal stability of anthocyanin (Jackman and
Smith 1996) High temperature increases the degradation rate of anthocyanins but it has been
assumed that this degradation rate depends on the anthocyanin structure (Jackman and Smith 1996
Sipiora and Gutierrez-Granda 1998 Mori et al 2007) It is reasonable that only malvidin
derivatives which are highly methylated anthocyanins were accumulated and were more stable than
other anthocyanins (Mori et al 2007) The decrease in anthocyanin accumulation under high
temperature may result from factors such as anthocyanin degradation as well as the inhibition of
mRNA transcription of the anthocyanin biosynthetic genes (Mori et al 2007) Temperature might
18
affect not only the synthesis but also the stability therefore the decrease in anthocyanin
concentration at elevated temperatures might result from both decrease in synthesis and increase in
degradation (Shaked-Sachray et al 2002 Vaknin et al 2005)
In Vitis vinifera berries the most important pigments are derived from delphinidin cyanidin
petunidin peonidin and malvidin (Castellarin et al 2006) Although the corresponding
anthocyanins can be formed by the formation of acetic caffeic or p-coumaric acid esters they are
usually formed by the addition of a 3-O glucose It is therefore unsurprising that one of the genes
most up-regulated during the anthocyanin accumulation in grape berries is UFGT (Walker et al
2007) In the flavonoids biosynthesis pathway anthocyanins are the last products of
phenylpropanoid pathway It has been determined that anthocyanins are synthesized from
phenylalanine through an anthocyanin biosynthesis pathway (Fig 7) regulated by enzyme activities
(Hrazdina et al 1984) and gene expressions (Boss et al 1996) Some anthocyanin biosynthetic
pathway genes including a large number of isogenes phenylalanine ammonia lyase (PAL) chalcone
synthase (CHS) chalcone isomerase (CHI) flavanone 3-hydroxylase (F3H) dihydroflavonol 4-
reductase (DFR) leucoantho-cyanidine dioxygenase (LDOX) and UDP-glucose flavonoid 3-O-
glucosyltransferase (UFGT) etc- have been cloned (Sparvoli et al 1994) It has already been
established that in many plants the gene expression of the enzymes involved in anthocyanin
biosynthesis is affected by temperature In general the expression of the anthocyanin biosynthetic
genes was induced by low temperature in different specious (Mori et al 2005b 2007 Yamane et
al 2006 Christie et al 1994 Shvarts et al 1997 Lo Piero et al 2005 Leyva et al 1995 Shaked-
Sachray et al 2002 and Dela et al 2003) Very interesting is also the effect of different night
temperature on anthocyanin biosynthesis Warm night contributes to decrease of anthocyanin
content of grape berry skin The enzymatic activities of PAL and UFGT in the skin of Darkridge
berries grown under high (3030 degC) night temperature conditions were decreased significantly after
veraison (Mori et al 2005 Mazza and Miniati 1993 Kliewer and Torres 1972)
Flavonoids protect plants against various biotic and abiotic stresses Their oxidation reactions only
occur after senescence or an environmental stress This oxidation plays a role in defending the plant
against various biotic and abiotic stresses (Treutter 2006 Buchanan-Wollaston and Morris 2000
Munneacute-Bosch and Alegre 2004) Since grape berries grown under high temperature would receive
oxidative stress (Mori et al 2007) Flavonoids oxidation (eg Anthocyanin degradation) occurs in
order to defend the plant This reaction in plants is mainly catalyzed by polyphenol oxidases
(catechol oxidases and laccases) and peroxidases (Pourcel et al 2006) It was also reported that
among the candidates for anthocyanin degradation enzyme such as polyphenol oxidases (PPOs) and
peroxidases (PODs) peroxidases are involved in active anthocyanin degradation of Brunfelsia
19
calycina flowers (Vaknin et al 2005 Welinder et al 2002) While polyphenol oxidases increased
the rate of anthocyanin degradation in fruit extracts and juices (Kader et al 1997- 1998- 1999 Sarni
et al 1995) PPOs are not likely candidates for degrading anthocyanins in living tissues because of
their location in plastids (Vaknin et al 2005) Peroxidases in vacuoles have also been found in
grape cells and would be involved in anthocyanin degradation in the presence of H2O2 (Calderon et
al 1992) H2O2 levels in plant tissues have been shown to increase in response to heat stress (Dat
et al 1998) Flavonoid-PODs reaction might function as a mechanism for H2O2-scavenging and
therefore plant cell detoxification (Pourcel et al 2006) Gene chips micro ray analysis showed that
grape berries grown under high temperature would receive oxidative stress (since genes encoding
peroxidases and some oxidoreduction enzymes were induced (Mori et al 2007) The indication that
oxidative enzymes are involved in this process is the fact that treatment with reducing agents (such
as glutathione and DTT) and protein synthesis inhibitors (like cycloheximide and anisomycin) both
caused inhibition of anthocyanin degradation (Vaknin et al 2005) In addition the effect of
temperature on fruit foliage and flower pigmentation has shown that fading of Aster flowers color
due to high temperature could be prevented by stabilizing the pigments (Shaked-Sachray et al
2002 Nissim-levi et al 2003 Oren-Shamir and Nissim-levi 1997a 1997b 1999 Vaknin et al
2005) These findings suggest that anthocyanin degradation plays a crucial role in pigment
concentration under low rate of bisynthesis Peroxidase activity is specific and involved in the
pigment degradation (Vaknin et al 2005) Mechanisms of flavonoid oxidation lead to brown
polymers (Pourcel et al 2006 Walker and Ferrar 1998 Yoruk R and Marshall 2003 Jiang et al
2004) The browning of peel of litchi fruits has been correlated with the rapid degradation of red
anthocyanin pigments this process is associated with enzymatic oxidation of phenolics by
polyphenol oxidases (PPO) andor peroxidases (POD) (Jiang et al 2004) Although the effects of
temperature on grape berry composition and particularly on the content of anthocyanins in skins
have been studied intensively (Kliewer 1970 Buttrose et al 1971 Kliewer and Torres 1972
Spayd et al 2002 Mori et al 2005b Yamane et al 2006) the mechanisms responsible for the
poor coloration of berry skin at high temperatures have not been completely understood and no
report has demonstrate the enhancement of anthocyanin degradation due to high temperature in
grape tissues Plant responses to high temperature involve morpho-anatomical physiological
biochemical and molecular changes which sometimes have to occur very rapidly The molecular
response to heat stress involve both the induction of enzymes involved in oxidative stress (as
Peroxidase Superoxide Dismutase Ascorbate Peroxidase Catalase) and Heat Shock Proteins (HSP)
(Wahid et al 2007) As previously reported anthocyanin biosynthesis is inhibited by higher
temperature and this is confirmed by molecular studies High temperature decreased mRNA
20
accumulation of structural anthocyanin biosynthesis genes and MYBA1 in cv Aki Queen (Yamane
et al 2006) In Pinot Noir vines instead the decrease in anthocyanin content due to high
temperature treatment cannot be linked to a decrease in anthocyanin biosynthesis as no significant
differences in gene expression were found These results may contribute to suggest that the
reduction in anthocyanin biosynthesis may be also due to enzyme inhibition or anthocyanin
degradation rather than a transcriptional effect (Mori et al 2007)
4 GENERAL AIMS OF THE THESIS
The present study is mainly focused on wine grape quality with the general aim of evaluating the
impacts of high temperature condition on grape quality From 1950 the majority of the worlds
highest quality wine-producing regions have experienced warming trends in growing season and this
condition is projected to have significant impacts on grape wine production quality and yield In
particular high temperatures after veraison can negatively affect grape composition expecially skin
anthocyanin accumulation in black berry varieties On these bases the present thesis aims to analyse
two trials both on cv Sangiovese which is the most cultivated variety in Italy characterized by
peculiar anthocyanins profile
The first trial is to appraise the effects of high temperature condition on flavonoids (anthocyanins
flavonols and condensed tannins) accumulation and particularly the mechanisms responsible for
lower anthocyanin content in berries ripened under elevated temperature via assessment of the main
berry biochemical compounds during ripening and of the activities of the putative key enzymes
which are involved in anthocyanins biosynthesis (such as UFGT and PAL) and their degradation
like peroxidases and polyphenol oxidases (PODs and PPOs) In addition the expression of some
genes responsible for flavonoids biosynthesis and degradation was assessed via Real time PCR A
further step was developed to recognize the best candidate genes responsible for anthocyanin
degradation under such stress condition throught a biotechnological approach of genes
transformation from grape to Petunia flower via Agrobacterium tumefaciens
Due to global warming in the last decades and in several warm wine regions a too high level of
sugar and subsequent wine alcohol excess low acidity and in black varieties unbalanced phenolic
ripening with insufficient berry skin colour has been shown at harvest The aim of the second trial is
to evaluate the effects of management techniques applied in the field on the canopy in post-
veraison (ie trimming ) on limiting the carbohydrate availability for cluster ripening to slow down
the accumulation rate of soluble solids in berries and to avoid the ldquouncouplingrdquo of sugar
accumulation versus phenolic synthesis during ripening
21
The present work started from the data obtained in a preliminary evaluation in 2009 and both in
2010 and 2011 the quantity and quality of different flavonoids as anthocyanins flavonols and
tannins were measured during ripening in berries of treated and control vines One of the main aims
of the second trial is to evaluate if the evolution of anthocyanins and skin and seed tannins is
conditioned by the rate of sugar accumulation
22
Chapter one First part
Biochemical and molecular approaches to study the effects of temperature
on grape composition in cv Sangiovese (Vitis vinifera L )
23
1 INTRODUCTION
In the last decades the majority of the worlds highest quality wine-producing regions have
experienced warming trends in growing season and this condition is projected to have significant
impacts on grape production quality (Jones at al 2005) The optimum temperature for berry growth
is among 20deg-25degC (Dookozlian 2000) Generally higher temperatures during grape ripening lead
to an increase in the rates of sugar accumulation and organic acid degradation Flavonol content is
reported to be more influenced by UV exposure rather than temperature (Spayd et al 2002) and
little is known about the effects of temperature increase on skin and seed proanthocyanidin
especially when applied after veraison
In black berry varieties grape coloration is due to anthocyanin accumulation in the skin which could
be negatively affected by temperature (Mori et al 2005 amp 2007 Kliewer amp Torres 1972 Tomana
et al 1979) But the mechanism responsible for colour reduction in berry skin at high temperature is
not completely clear While some researches in red table grape have determined that high
temperatures suppressed the expression of anthocyanin biosynthetic genes (Yamane et al 2006)
some other studies (in Cabernet Sauvignon) did not confirm this effect as mRNA accumulation of
anthocyanin biosynthetic genes and enzyme activity of UDP-Glucose Flavonoid Transferase
(UFGT) were not inhibited under high temperature (Mori et al 2007) Therefore it can be
hypothesized that temperature would affect not only the synthesis but also the stability of
anthocyanins (Shacked-Sachray et el 2002 Vaknin et al 2005 Mori et al 2005) and chemical or
enzymatic degradation of anthocyanins can be an answer to high temperature conditions involving
in the second option polyphenol oxidase and peroxidase (Mori et al 2007 Vaknin et al 2005)
Moreover temperature has been shown to have an effect on anthocyanins composition and some
authors suggested a highest thermal stability for the tri-substituted anthocyanins (particularly
malvidin derivatives) due to their chemical structure (Mori et al 2007 Cohen et al 2012)
So it is possible to hypothize different responses to high temperature between distinct grape
cultivars according their peculiar anthocyanin composition
To date no evidence has demonstrated the effects of elevated temperature on anthocyanin
accumulation and composition of cv Sangiovese characterized by monoglucoside anthocyanins
with high percentages of hydroxylated anthocyanins (mainly cyanidine-3-glucoside)
On these bases the aim of the present research is to evaluate the effects of high temperatures on
flavonoids (anthocyanins flavonols and condensed tannins) accumulation during ripening of
Sangiovese berries And in particular the mechanisms responsible for modification of the
anthocyanins content in berries ripened under elevated temperature conditions would be studied via
24
assessment of the activities of the putative key enzymes which are involved in anthocyanins
biosynthesis (such as Phenylalanine ammonium lyase (PAL) and UDP-glucose flavonoid 3-O-
glucosyltransferase (UFGT) and their degradation (like polyphenol oxidases (PPOs) and peroxidases
(PODs) In addition the expression of some genes involved in flavonoids biosynthesis and
degradation would be appraised via Real time PCR
2 MATERIALS AND METHODS
The study was conducted in 2010 and 2012 on respectively five and three years old uniform potted
plants of Vitis vinifera cv Sangiovese The vines grafted on SO4 rootstocks were grown in pots of
30 liter containing a mixture of sand and soil (1 1) In both years before the experiment the
number of shoots was standardized (around 9 shoots in 2010 and 6 in 2012) In addition in order to
have a uniform leaf area in all the vines the tip of each shoot was removed when 20 main leaves
were produced Before veraison (27th of July 2010 and 19th of July 2012) 8 and 12 uniform vines
were selected in 2010 and 2012 respectively on the bases of size of shoots and the bunch number
The selected vines were assigned to the two treatments LT (Low Temperature) and HT (High
Temperature)
In the LT treatment the vines were placed from pre-veraison to harvest in a plastic tunnel where the
minimum temperature was about 17 degC and the mean and maximum air temperatures were
maintained with a cooler below 26deg and 35degC
In the HT treatment the air temperature was similar to the ambient as the vines were distribuited in a
plastic tunnel which was open in the basal part and covered only the canopies to maintain the light
conditions similar to the LT vines In HT tunnel during the experimental period of 2010 the
minimum temperature was about 18deg and the mean air temperature was 26 degC while in 2012 they
were measured to be about 19deg and 28 degC respectively The maximum air temperaure could instead
exceed to 43degC and 44degC in 2010 and 2012 sequentially
Both tunnels were made of polyethylene film (MOP Bologna Italy) that did not alter the spectral
composition of light while the percentage of transmission was decreased by a maximum of 12
within the visible range
All the vines were daily watered automatically and well supplied with nutrients
21 Temperature monitoring
Berry skin temperature was monitored in 10 selected clusters of the plants in low temperature tunnel
(LT) and 10 clusters of the vines in high temperature tunnel (HT) in both years In each of these two
25
treatments temperature data were recorded from one week before veraison of both years until
harvest towards 10 T- type thermocouples (RS component MI Italy) positioned in the sub-cuticle
tissues of berry skin Each probe was then connected to a CR10X data logger (Campbell Scientific
Ltd Leicestershire United Kingdom) registering temperature data every 20 minutes and each one
hour in 2010 and 2012 sequentially The air temperature inside the tunnels were also monitored and
recorded each hour during the same period by air temperature sensors (TL20 3M Milan Italy)
22 Berry sampling
Berry sampling was conducted from 1 week before the veraison to the harvest in both years of the
trial In total 45 berries per each 8 vines and 30 berries per each 12 vines were sampled every 8 and
10 days in 2010 and 2012 respectively The 180 sampled berries for each of the two treatments were
pooled separately and divided into 4 biological replicates of 45 berries each to perform biochemical
and molecular analyses The berries of the first group (15) were weighed and immediately used for
degBrix titratable acidity and pH measurment All the other sampled berries were immediately frozen
in liquid nitrogen and kept in the freezer (-80 degC) until the analyses to evaluate the quality and the
quantity of the anthocyanins and flavonols (10 berries) skin and seed tannins (10 berries) and to
assess the gene expression and the enzymatic activity (10 berries)
23 degBrix titratable acidity and pH
The sampled berries were crushed and the must were sieved and used for degBrix analysis by a
temperature-compensating CR50 refractometer (Maselli Misure Spa PR Italy) Five mL of the
same must were then diluted 7 times with bi-distilled water and used to perform a titration reaction
by a Crison Compact Tritator (Crison Barcelona Spain) with 1N 05 N or 025 N NaOH (Sigma-
Aldrich St Louis MO USA) according to the stage of berry ripening to obtain pH and TA data
(expressed as gl of tartaric acid equivalents)
24 Analyses of anthocyanins and flavonols
The berries of each replication were sampled and weighted before the extraction of anthocyanins
and flavonols Then the skin was carefully removed from the pulp and immerged in 50 mL of
HPLC-grade methanol (Carlo Erba Reagents Milano Italy) and were kept in dark for 24 hours
The day after the extract was separated from the skin residues and conserved at (-20oC) until the
anthocyanins analysis
26
To analyze the total content of each flavonol aglycon an aliquot of 5 mL of the same methanol
extract was completely dried under vacuum To achieve the acid hydrolyzation of flavonols
glucosides the pellet was re-suspended in 25 mL of methanol and 25 mL of 2M Trifluoroacetic
acid (Sigma-Aldrich St Louis MO USA) in milliQ water The reaction was conducted at 100 oC in
a boiling hot water bath with a condenser for 2 hours The reaction product was then completely
dried under vacuum and the pellet obtained re-suspended in 1mL of methanol and was kept at (-
20oC) until HPLC analysis
HPLC separation and quantification of anthocyanins and flavonols were performed on a Waters
1525 instrument equipped with a diode array detector (DAD) using a reversed-phase column
Phenomenex (Castel Maggiore BO Italy) RP18 250 mmx4mm (5microM) with precolumn Either for
anthocyanins and flavonols the eluents used were the following A= HClO4 03 in milliQ water B
= methanol
For anthocyanin analysis the methanol extract was filtered through 022 microm 13mm PTFE syringe-
tip filters (Teknokroma Barcelona Spain) and an aliquot of 270 microL was diluted to final volume of
1mL with the A eluent The binary gradient was the same as reported in Mattivi et al (2006) with
suitable modifications The time for column equilibration was 5 minutes and the injection volume
was 60 microL Separation of the main free anthocyanins was obtained at 43 oC and they were quantified
at 520 nm with a calibration curve with malvidin-3-glucoside (Sigma-Aldrich ST Louis MO
USA)
Hydrolyzed flavonols samples were filtered through 045 microm 13 mm PTFE syringe- tip filters
(Teknokroma Barcelona Spain) directly into liquid chromatography vials Flavonols aglicones
were separated at 40deg C through the linear gradient as reported in Mattivi et al (2006)
The time for equilibration column and the injection volume were the same used for the HPLC-DAD
analyses of anthocyanins Quercetin myricetin and kaempferol were quantified at 370 nm with the
corresponding external standard purchased from Extrasynthese (Genay France)
25 Tannins analysis
To extract proanthocyanidins frozen berries samples (skins and seeds) were ground separately to a
fine powder under liquid N2 01 g aliquots were separated and extracted in darkness in 2 mL screw-
top Eppendorf tubes for 24 hours with 70 acetone containing 01 ascorbate (10 mL) to prevent
oxidation of polyphenols (Kallithraka et al 1995) Samples were then centrifuged (15 min 13000 x
g) and two 400 μL aliquots of the supernatant were transferred to fresh tubes and dried down under
vacuum at 35ordmC for 120 minutes
27
One of them was re-suspended in 100 μL methanol acidified with 1 HCl then neutralized with 100
μL sodium acetate (200 mM pH 75) for the analysis of free monomers The other aliquot
underwent acid-catalyzed cleavage of the proanthocyanidins in the presence of excess
phloroglucinol following the method of Kennedy and Jones (2001) Briefly the dried sample was
re-suspended in 100 μL of phloroglucinol buffer (025 g ascorbate 125 g phloroglucinol 215 μL
conc HCl 25 mL methanol) and incubated at 50ordmC for 20 minutes then neutralized with 100 μL of
sodium acetate (200 mM pH 75) and centrifuged (15 min 13000 x g) A 200 μL aliquot each of
the acetone extract the acetone extract after acid catalyzed cleavage and the residue after cleavage
was then transferred to Sun-broker 250 μL reduced volume HPLC auto-sampler vials Samples were
run on a Waters 1525 instrument equipped with a diode array detector (DAD) using a reversed-
phase column Phenomenextrade (Castel Maggiore BO Italy) RP18 250 mmx4mm (5microM) with
precolumn A separate reversed-phase HPLC method was developed for the cleaved and uncleaved
proanthocyanidin samples reading absorbance at 280 nm Uncleaved samples solvent A 02
phosphoric acid solvent B 41 acetonitrile02 phosphoric acid (gradient of solvent B zero min
0 5 min 10 40 min 10 55 min 17 65 min 19 75 min 19 80 min 100 85 min
100 86 min 0) Cleaved samples solvent A 02 acetic acid solvent B methanol (gradient of
solvent B zero min 1 40 min 1 120 min 30 1201 min 100 125 min 100 126 min
1) For both methods 25 μL of sample was injected and run at 30ordmC with a flow rate of 1 mLmin
Concentrations of free monomers and hydrolysed terminal subunits were determined from standard
curves prepared from commercial standards of catechin epicatechin epigallocatechin and
epicatechin-gallate obtained from Extrasynthese (France) The concentration of extension subunit-
phloroglucinol adducts was calculated from published molar extinction coefficients (Kennedy amp
Jones 2001) The evaluation of skin and seeds tannins was performed only on the samples of the
year 2010
26 Real-time PCR analyses RNA extraction and RNA evaluation
Real-time PCR analyses were performed for four and five selected stages of berry ripening in 2010
and 2012 respectively from beginning of veraison to the end of harvest Total RNA was isolated
from 200 mg and 500 mg in 2010 and 2012 respectively of the powdered berry skin tissue using
spectrumTM
Plant Total RNA kit (Sigma-Aldrich St Louis MO USA) following the manufacturers
protocol One microL of each RNA sample was measured spectrophotometrically to determine RNA
quantity and 260280 and 260230 ratio using a NanoDrop1000 Spectrophotometer (Thermo Fisher
Scientific Wilmington DE USA) Total RNA was treated with 1 U microg-1 RQ1 DNase (Promega
28
Milan Italy) First-strand cDNA was synthesized using 1 microg of RNA 1microL (dT)15 primer (500
microgmL) and 1 U of GoScripttrade reverse transcriptase (Promega) Quantitative RT-PCR was carried
out on a Step One Plustrade (Applied Biosystems Foster City California USA) Each reaction (10
microL) contained 188 nM of each primer 2microL of diluted cDNA (150) 5microL U of Power SYBRreg Green
PCR Master Mix (Applied Biosystems Foster City California USA) Thermal cycling conditions
were 95 degC for 10 min followed by 95 degC for 15 s 55 degC for 1 min for 40 cycles followed by a
melting cycle which contains 95 degC for 15 sec 60 degC for 1 min and 95 degC for 15 sec Each cDNA
sample was analyzed in triplicate Primers pairs for Dihydroflavonol 4-reductase (DFR)
Leucoanthocyanidin dioxygenase (LDOX) and UDP-glucose flavonoid 3-O-glucosyltransferase
(UFGT) were retrieved from literature (Goto-Yamamoto et al 2002) primers for VvMYBA1 were
from Jeong et al (2004) for Leucocyanidin reductase (LAR) and Anthocyanidin reductase (ANR
or BAN) from Bogs et al (2005) and for Peroxidase (POD6 ) from Mori et al (2007) Primers for
Flavanone 3-hydroxylase (F3rsquoHb) Flavonoid-3rsquo5rsquo-hydroxylase (F3rsquo5rsquoHk and F3rsquo5rsquoHi)
Phenylalanine ammonium lyase (PAL) Flavonol synthase (FLS) and Peroxidases (POD1 to POD5)
were newly designed on the original DNA sequences to amplify 150ndash250 bp gene fragments (Table
1)
29
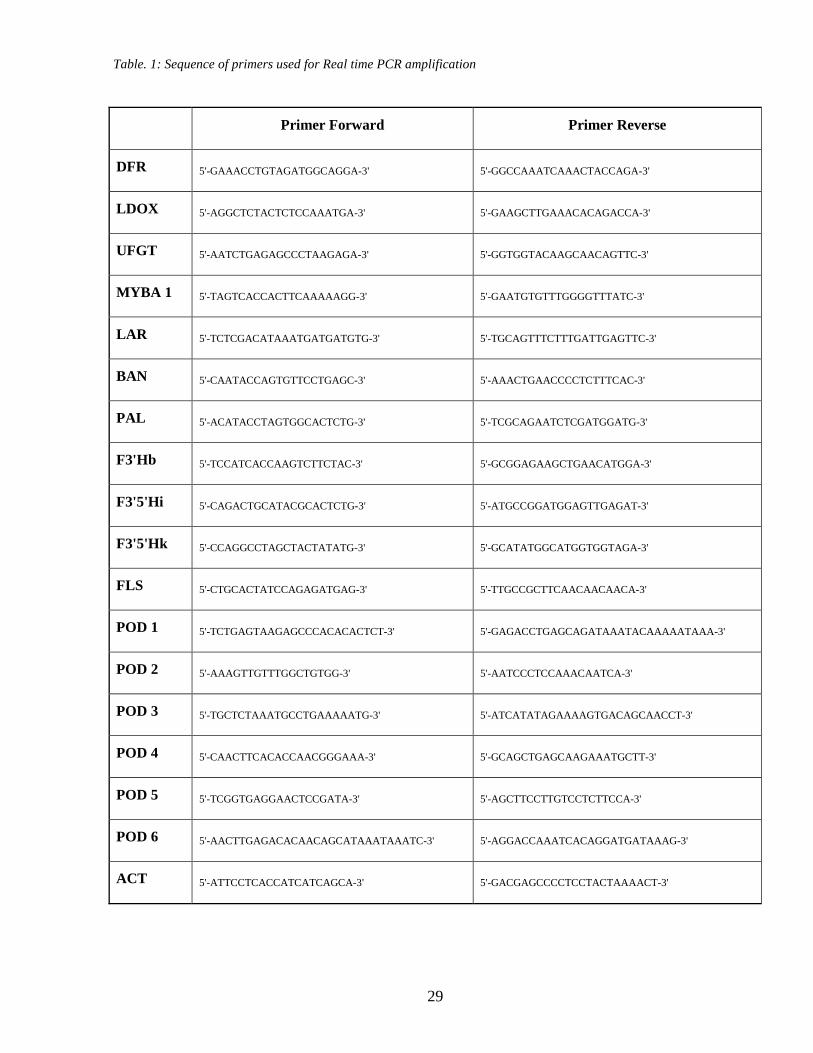
Table 1 Sequence of primers used for Real time PCR amplification
Primer Forward Primer Reverse
DFR 5-GAAACCTGTAGATGGCAGGA-3 5-GGCCAAATCAAACTACCAGA-3
LDOX 5-AGGCTCTACTCTCCAAATGA-3 5-GAAGCTTGAAACACAGACCA-3
UFGT 5-AATCTGAGAGCCCTAAGAGA-3 5-GGTGGTACAAGCAACAGTTC-3
MYBA 1 5-TAGTCACCACTTCAAAAAGG-3 5-GAATGTGTTTGGGGTTTATC-3
LAR 5-TCTCGACATAAATGATGATGTG-3 5-TGCAGTTTCTTTGATTGAGTTC-3
BAN 5-CAATACCAGTGTTCCTGAGC-3 5-AAACTGAACCCCTCTTTCAC-3
PAL 5-ACATACCTAGTGGCACTCTG-3 5-TCGCAGAATCTCGATGGATG-3
F3Hb 5-TCCATCACCAAGTCTTCTAC-3 5-GCGGAGAAGCTGAACATGGA-3
F35Hi 5-CAGACTGCATACGCACTCTG-3 5-ATGCCGGATGGAGTTGAGAT-3
F35Hk 5-CCAGGCCTAGCTACTATATG-3 5-GCATATGGCATGGTGGTAGA-3
FLS 5-CTGCACTATCCAGAGATGAG-3 5-TTGCCGCTTCAACAACAACA-3
POD 1 5-TCTGAGTAAGAGCCCACACACTCT-3 5-GAGACCTGAGCAGATAAATACAAAAATAAA-3
POD 2 5-AAAGTTGTTTGGCTGTGG-3 5-AATCCCTCCAAACAATCA-3
POD 3 5-TGCTCTAAATGCCTGAAAAATG-3 5-ATCATATAGAAAAGTGACAGCAACCT-3
POD 4 5-CAACTTCACACCAACGGGAAA-3 5-GCAGCTGAGCAAGAAATGCTT-3
POD 5 5-TCGGTGAGGAACTCCGATA-3 5-AGCTTCCTTGTCCTCTTCCA-3
POD 6 5-AACTTGAGACACAACAGCATAAATAAATC-3 5-AGGACCAAATCACAGGATGATAAAG-3
ACT 5-ATTCCTCACCATCATCAGCA-3 5-GACGAGCCCCTCCTACTAAAACT-3
30
27 Enzyme assay
27 1 PAL activity assay
The extraction was performed according to the method of Mori et al (2005) with some
modifications The following procedures for protein extraction were conducted at 4deg C For each
replication 02 g of berry skin was ground with a mortar and pestle in liquid nitrogen until a fine
powder was obtained
The skin powder was homogenized with 15 mL of a 100 mM Sodium borate buffer (pH 9)
containing 0075 g of PolyVinyl-PolyPyrrolidone (PVPP) and 100 microL of a 200 mM Dithiothreitol
After incubation in ice for 20 minutes centrifugation was done at (4deg C 15 min 10000 x g)
Then 1mL of the supernatant was desalted by passing through a NAP-10 column (Sephadex G-25
Amersham Biotech) equilibrated with 15 mL of the same buffer
For the analysis of PAL activity the reaction mixture consisted of 05 mL of Phenylalanine and 05
mL of the enzyme solution The assay mixture was incubated in 37deg C for 60 minutes The reaction
was terminated by adding 05 mL of HCl acid (18) The quantity of the product namely Trans-
cinnamic acid was calculated using its extinction coefficient of 9630 M-1
cm-1
at 290 nm One unit
of PAL was expressed as synthesis of 1 mol of Trans-cinnamic acid per minute and PAL activity
was expressed as microkat g-1 protein
27 2 UFGT activity assay
The extraction was performed according to the method of Mori et al (2007) with some
modifications The following procedures for protein extraction were conducted at 4 oC For each
replication (02 g) of berry skin was ground with a mortar and pestle in liquid nitrogen until a fine
powder was obtained The skin powder was homogenized with 13 mL of a 250 mM TRISndashHCl
buffer (pH 75) containing 10 mM Polyethylene glycol 3400 150 microL of 10 mM Na-
diethyldithiocarbamate 15 microL of 200 mM Dithiothreitol and 2 microL of 2-mercaptoethanol and was
incubated for 20 min on ice After centrifugation of the homogenate at 10000 x g for 20 min The
supernatant was passed through a NAP-10 column (Sephadex G-25 Amersham Biotech)
equilibrated with a 15 mM TRISndashHCl buffer (pH 75)
The desalted crude extract was used as the enzyme solution in the following enzyme assay using
delphinidin and cyanidin as substrates The method of Mori et al (2007) was employed with some
modifications for the analysis of UFGT activity For the first assay the reaction mixture consisted of
02 mL of the previous extraction solution (containing TRISndashHCl buffer (pH 75) Polyethylene
glycol 3400 Na-diethyldithiocarbamate Dithiothreitol and 2-mercaptoethanol) 50 microL of 1mM
31
Cyanidin 50 microL of 100mM UDP-glucose and 02 mL of the enzyme solution The assay mixture
was incubated for 5 min at 37deg C The reaction was terminated by adding 150 microL of 5 HCl The
quantity of the product namely Cyanidin-3-glucoside was measured using its extinction coefficient
of 26900 M-1
cm-1
(at 520 nm pH 1)
Therefore one unit of UFGT was defined as the production of 1 mol of Cyanidin-3-glucoside per
second and UFGT activity was expressed as pkat g-1 protein
For the second assay the reaction mixture consisted of 02 mL of the same extraction solution
(containing TRISndashHCl buffer (pH 75) Polyethylene glycol 3400 Na-diethyldithiocarbamate
Dithiothreitol and 2-mercaptoethanol) 50 microL of 1mM Delphinidin 50 microL of 100mM UDP-glucose
and 02 mL of the enzyme solution The assay mixture was incubated for 5 min at 37deg C The
reaction was terminated by adding 150 microL of 5 HCl The quantity of the product namely
Delphinidin-3-glucoside was measured using its extinction coefficient of 26000 M-1 cm-1 (at 520
nm pH 1)
Therefore one unit of UFGT was defined as the production of 1 mol of Delphinidin-3-glucoside per
second and UFGT activity was expressed as pkat g-1 protein
27 3 Guaiacol PODs activity assay
Guaiacol PODs were assayed as described by Ushimaru et al (1997) using pyrogallol as the
electron donor for the reaction The plant material (skin) was extracted in cold buffer (200 mM
sodium phosphate 5 mM sodium EDTA 1 PVPP pH 70) and incubated on ice for 30 min After
centrifugation at (10000 times g 30 min 4 degC) the desalted supernatant was used for the assay The
reaction mixture (25 mL) included 22 mL of the 10 mM sodium phosphate buffer pH 70 100 microL
of the 25 mM H2O2 50 mM pyrogallol and 100 μl extract H2O2 and pyrogallol were prepared
fresh just before use Absorbance (λ=430 nm) was taken after 5 min incubation at room temperature
and referred to a blank with no extract added One unit of Guaiacol peroxidases is defined as the
amount of enzyme that catalyzes the oxidation of 1 μmol of pyrogallol per minute under the
conditions described by Chen and Asada (1989) and PODs activity was expressed as kat g-1 skin
fresh weight An absorbance coefficient of 247 mM-1 cm-1 was assumed for calculations
27 4 PPOs activity assay
PPOs were assayed as described by Ushimaru et al (1997) using pyrogallol as the electron donor
for the reaction The plant material (skin) was extracted in cold buffer (200 mM sodium phosphate
5 mM sodium EDTA 1 PVPP pH 70) and incubated on ice for 30 min After centrifugation at
32
(10000 times g 30 min 4 degC) the desalted supernatant was used for the assay The reaction mixture
included 28 mL of the 100 mM sodium phosphate buffer pH 70 1 mM pyrogallol and 100 μl
extract the pyrogallol was prepared fresh just before use Absorbance (λ=430 nm) was taken after 5
min incubation at room temperature and referred to a blank with no extract added One unit of
Polyphenol oxidases is defined as the amount of enzyme that catalyzes the oxidation of 1 μmol of
pyrogallol per minute under the conditions described by Chen and Asada (1989) and PPOs activity
was expressed as kat g-1 skin fresh weight An absorbance coefficient of 247 mM-1 cm-1 was
assumed for calculations
28 Vegetative and Yield measurements
In both years immediately after harvest all the leaves of each vine of the both tunnels were
removed and their areas were measured using a leaf area meter (LI3000 LiCor Inc Lincoln Neb
USA) along with the number of nodes of each single shoots
The grape bunches were harvested when the total soluble solids of berries had reached to
approximately 22 o
brix All bunches were removed counted and weighed in both treatments to
determine the yield of each vine
29 Statistical analyses
Data were submitted to analysis of variance and means were separated by the Student-Newman-
Keuls test by SAS statistical software (SAS Institute Cary North Carolina USA) The experiments
were conducted with four replications from each treatment and the values were the means of four
replications
3 RESULTS AND DISCUSSION
31 Berry Temperature
The berry temperature in both tunnels was influenced by the two air temperature regimes (HT and
LT) The average berry temperature in the LT tunnel during the ripening period of 2010 was
recorded to be about 20 oC while it was about 24deg C in HT In 2012 the average berry temperature in
both treatments were recorded to be about 2deg higher than in 2010
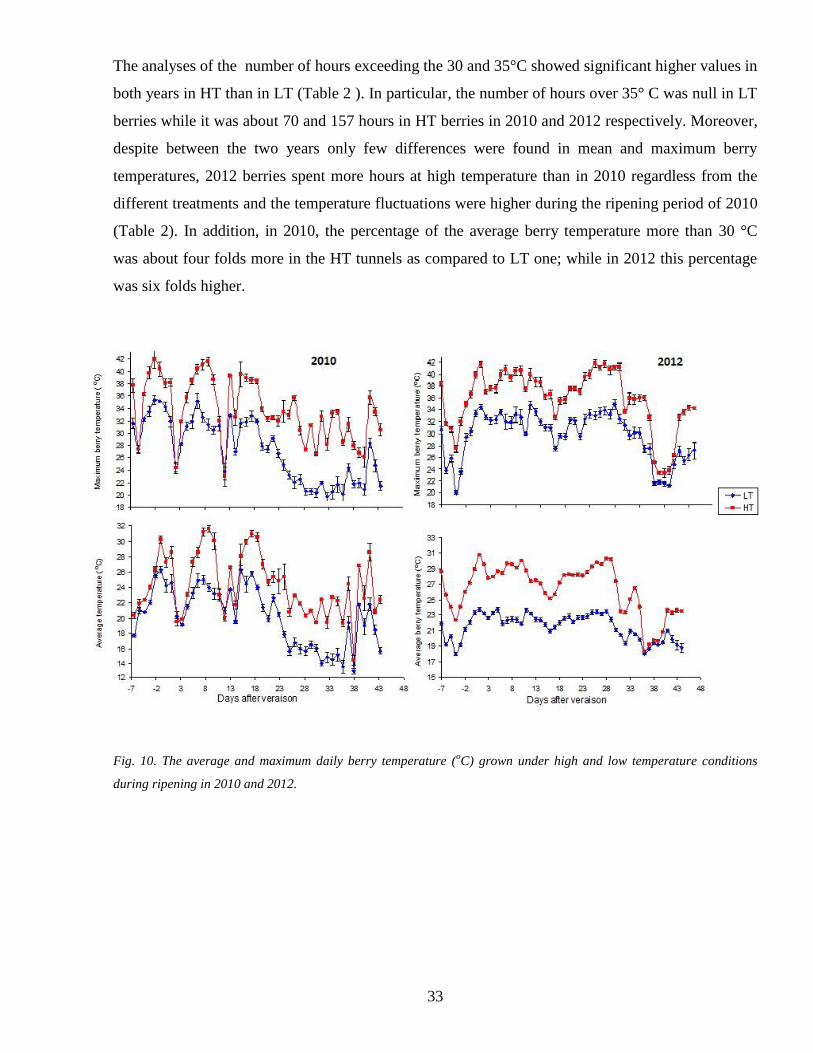
The maximum berry temperature in both years showed the highest differences between the two
treatments as it was maintained below 35 degC in LT and it might exceed to 42 degC in correspondence
of several heat weaves during the ripening in HT (Fig10)
33
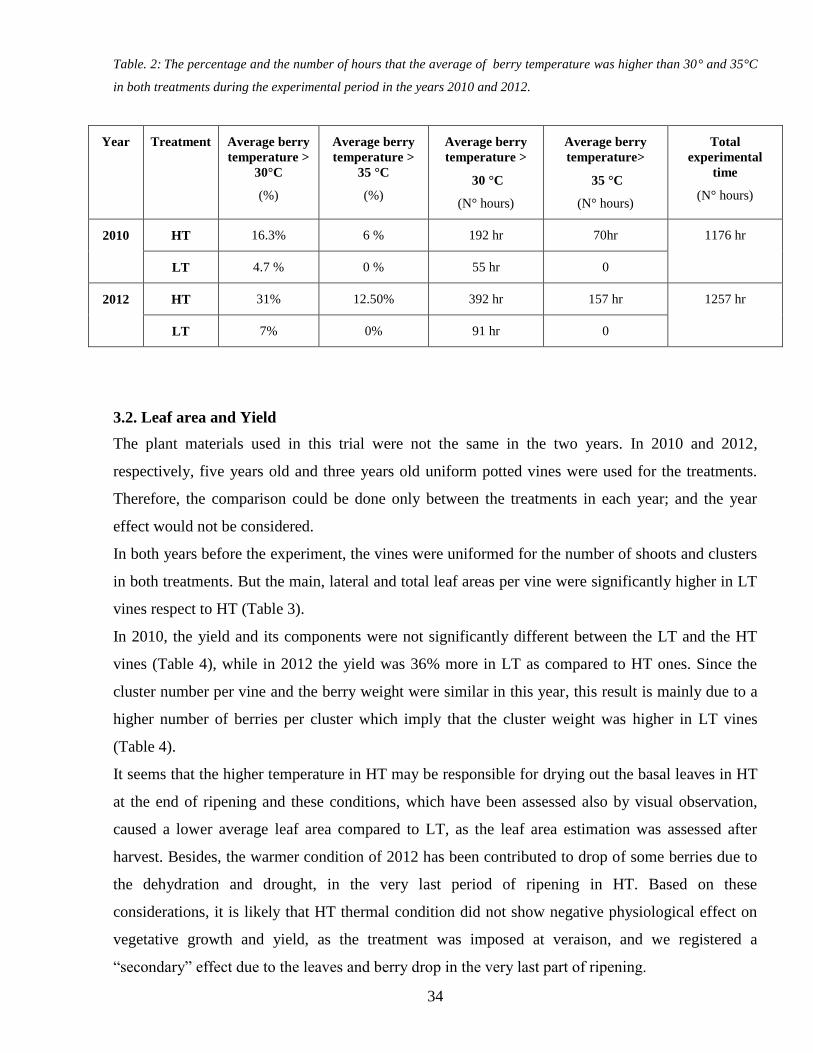
The analyses of the number of hours exceeding the 30 and 35degC showed significant higher values in
both years in HT than in LT (Table 2 ) In particular the number of hours over 35deg C was null in LT
berries while it was about 70 and 157 hours in HT berries in 2010 and 2012 respectively Moreover
despite between the two years only few differences were found in mean and maximum berry
temperatures 2012 berries spent more hours at high temperature than in 2010 regardless from the
different treatments and the temperature fluctuations were higher during the ripening period of 2010
(Table 2) In addition in 2010 the percentage of the average berry temperature more than 30 degC
was about four folds more in the HT tunnels as compared to LT one while in 2012 this percentage
was six folds higher
Fig 10 The average and maximum daily berry temperature (oC) grown under high and low temperature conditions
during ripening in 2010 and 2012
34
Table 2 The percentage and the number of hours that the average of berry temperature was higher than 30deg and 35degC
in both treatments during the experimental period in the years 2010 and 2012
Total
experimental
time
(Ndeg hours)
Average berry
temperaturegt
35 degC
(Ndeg hours)
Average berry
temperature gt
30 degC
(Ndeg hours)
Average berry
temperature gt
35 degC
()
Average berry
temperature gt
30degC
()
Treatment Year
1176 hr 70hr 192 hr 6 163 HT 2010
0 55 hr 0 47 LT
1257 hr 157 hr 392 hr 1250 31 HT 2012
0 91 hr 0 7 LT
32 Leaf area and Yield
The plant materials used in this trial were not the same in the two years In 2010 and 2012
respectively five years old and three years old uniform potted vines were used for the treatments
Therefore the comparison could be done only between the treatments in each year and the year
effect would not be considered
In both years before the experiment the vines were uniformed for the number of shoots and clusters
in both treatments But the main lateral and total leaf areas per vine were significantly higher in LT
vines respect to HT (Table 3)
In 2010 the yield and its components were not significantly different between the LT and the HT
vines (Table 4) while in 2012 the yield was 36 more in LT as compared to HT ones Since the
cluster number per vine and the berry weight were similar in this year this result is mainly due to a
higher number of berries per cluster which imply that the cluster weight was higher in LT vines
(Table 4)
It seems that the higher temperature in HT may be responsible for drying out the basal leaves in HT
at the end of ripening and these conditions which have been assessed also by visual observation
caused a lower average leaf area compared to LT as the leaf area estimation was assessed after
harvest Besides the warmer condition of 2012 has been contributed to drop of some berries due to
the dehydration and drought in the very last period of ripening in HT Based on these
considerations it is likely that HT thermal condition did not show negative physiological effect on
vegetative growth and yield as the treatment was imposed at veraison and we registered a
ldquosecondaryrdquo effect due to the leaves and berry drop in the very last part of ripening
35
Table 3 Leaf area of grapes grown under high (HT) and low (LT) temperature conditions during ripening of the years
2010 and 2012
Year Treatments
Main Leaf area
(cm2vine)
Lateral Leaf area
(cm2vine)
Total leaf area
(cm2vine)
2010 LT 117425 105785 22321
HT 71682 80629 152311
2012 LT 13460 5690 19150
HT 6715 3742 10457
Table 4 Yield and yield components of grapes grown under high (HT) and low (LT) temperature conditions during
ripening of the years 2010 and 2012
Year Treatments No Cluster
Vine
Yield
Vine
(gr)
Cluster
weight
(gr)
Berry weight
(gr)
Berries per
cluster
(n)
LA Yield
per vine
(cm2 gr)
2010 LT 11 16666
1515
24 63 134
HT 12 18245
1520 21 72 835
ns ns ns ns ns
2012 LT 6 8616
1436
22 65 222
HT 5 5355 1071 21 51 196
ns ns ns
36
33 oBrix pH Titratable acidity
The results indicated that in 2010 a similar trend in the percentage of Total Soluble Solids in berries
grown under low and high temperature was measured and no significant differences was observed
among the two treatments in titratable acidity (TA) and pH However in 2012 the advanced ripening
in HT grapes was associated with higher level of oBrix during ripening nevertheless they reached
the same level at harvest Moreover it seems that the elevated temperature contributed to
degradation of titratable acids and increase in pH (Fig 11) There are contradictory reports on the
effects of high temperature on sugar accumulation in grape during different stages of berry
development Several papers (Matsui et al 1986 Sepuacutelveda and Kliewer 1986 Kliewer et al
1977) reported a general delay in ripening which is attributed to the impact of heat on the
photosynthetic supply of sugar Photosynthesis of grapevines is reduced at temperatures above 35 oC
(Kriedemann 1968 Ferrini et al 1995 Schultz 2003 Yu et al 2009 Zsoacutefi et al 2009) and
generally the restrictions to photosynthesis are caused by stomatal limitation As to Sepuacutelveda et al
(1986) prevention of the soluble sugar accumulation in berries by high temperature cannot be
accounted for an inhibition of the phloem transport between the leaves and the bunchs In contrary
Soar et al (2009) reported an increase in photosynthesis and stomatal conductance when Shiraz
vines were heated for short periods Moreover in some other researches sugar accumulation was not
influenced by temperature increase (Yamane et al 2006 Greer and Weston 2010)
In general tartaric acid concentration decrease after veacuteraison is mainly due to a dilution effect since
berry volume increase and amount of tartrate remains constant So far no enzymes degrading
tartaric acid have been ever found in grape In contrast the decrease in malic acid amount at the
beginning of ripening is associated with respiration and enzyme degradation as well as dilution
effect Malic acid may be therefore transformed to hexoses or used as energy source Metabolic
changes occurring during grape berry development (Taureilles-Saurel et al 1995) together with
light and temperature are the main parameters controlling the malate synthesisdegradation rate
Grape berries malic acid concentration at harvest is negatively correlated with temperature during
the ripening period It has been demonstrated that the optimum temperature range for acids synthesis
is between 20degC and 25degC and that with increasing temperature synthesis of malic acid decrease
and catabolic rate accelerate (Kliever et al 1967) These results are in accordance with the results of
this study and what was observed on the effects of elevated temperature in Cabernet Franc and
Chardonnay grapes where the pH increased and TA decreased Also the effects of higher
temperature induced by veraison defoliation had similar effects on pH and titratable acidity due to
the malic acid degradation (Guidoni et al 2004 Pastore 2011)
37
Fig 11 The trend of oBrix titratable acidity and pH of grapes grown under high (HT) and low (LT) temperature
conditions during ripening of the years 2010 and 2012
34 Biosynthesis of flavonoids
34 1 Anthocyanins accumulation during ripening
In both years the anthocyanin level in the skin of Sangiovese (Fig 12) started to increase after
veraison until harvest in both treatments Nonetheless in HT berries was significantly reduced
respect to LT ones As an illustration in 2010 the level of total anthocyanin at harvest was decreased
about 65 in the skin of the grapes grown under high temperature conditions as compared to LT
and at the harvest time of the year 2012 this reduction was 50 In agreement with the results on
other grape varieties (Darkridge grape Cabernet Sauvignon Tokay Japanese table grape Kyoho
Mori et al 2005 amp 2007 Kliewer amp Torres 1972 Tomana et al 1979) we found that in
38
Sangiovese high berry temperature (over 35degC) after veraison prevented anthocyanin formation in
grapes and greatly reduced the coloration as compared to fruits ripened at lower temperatures
According to HPLC analysis of the both years as expected the major individual anthocyanin in the
berry skin of both LT and HT treatments was malvidin-3-glucoside (Fig 12)
Anyway no differences in anthocyanin profiles were recorded at harvest between HT and LT grapes
in 2010 (Table 5) In 2012 at harvest the percentage of malvidin -3-G was higher in LT compared to
HT (Table 5)
Previous studies on Cabernet Sauvignon reported the higher thermal stability of malvidin-
derivatives anthocyanins due to the high level of methoxylation and acylation (Mori et al 2007
Romero and Bakker 2000 Morais et al 2002) but it is in contrast to our findings in this respect on
Sangiovese It has to be noticed that in Sangiovese the anthocyanin composition is quite different
from Cabernet Sauvignon and it is characterized by the high level of cyanidin-3G and by the
absence of p-coumarated and acetated malvidin derivatives anthocyanins
From the data of our two-year trials it is not possible to confirm the differences in thermal stability
of the five monoglucoside anthocyanins of Sangiovese based on their chemical structure And by
assessing solely the anthocyanins quantity and profile it was not possible to understand if the
reduction of anthocyanins under high temperature is due to biosynthetic activity reduction or to a
mechanism of anthocyanins degradation Therefore additional analyses were required in order to
obtain more comprehensive information about this issue
39
Fig 12 The trends of total and individual anthocyanins concentrations in the skin of Sangiovese berries grown under high (HT)
and low(LT) temperature conditions during ripening in the years 2010 and 2012
40
Table 5 The anthocyanin profiles at harvest in the skin of Sangiovese berries grown under high (HT) and low (LT)
temperature conditions during ripening in the years 2010 and 2012
Anthocyanin profile at harvest
Malvidin-3-G Petunidin-3-G Delphinidin-3-G Peonidin-3-G Cyanidin-3-G
2010 LT 36 13 11 18 22
HT 41 13 11 18 17
ns ns ns ns ns
2012 LT 43 14 11 16 16
HT 33 16 14 16 21
ns ns ns ns
34 2 Flavonols accumulation during ripening
In the both years the levels of flavonols in HT and LT berries increased gradually after veraison
and significant decrease was observed in the level of total and individual flavonols in HT berries as
compared to LT ones in 2012 (Fig 13)
In general the highest level of flavonols in grapes was found at flowering followed by a decrease as
the grapes increased in size Subsequently a significant level of flavonol biosynthesis is in general
observed during berry development and the greatest increase in flavonols per berry can be detected
3-4 weeks post-veraison (Downey et al 2003)
Flavonols accumulation in wine grape tissues has been studied extensively While several authors
reported a solid correlation between fruit light exposure and flavonol glucosides content (Price et al
1995 Haselgrove et al 2000 Spayd et al 2002) the effect of temperature on flavonol synthesis is
not understood completely Spayd et al (2002) and Mori et al (2005) did not observe any effect of
temperature treatment on flavonol synthesis To the contrary the inhibitory effect of high
temperatures on flavonol was also reported by Goto-Yamamoto et al (2009) Since in our research
we excluded the effect of different light exposure between the two treatments the lower
accumulation of flavonols in HT berries is probably due to a regulatory mechanism which rules the
anthocyanins response to high temperature condition
41
Moreover the analyses of each flavonol compound at harvest (quercetin kaempferol and myricetin
showed as expected that quercetin has the highest percentage The flavonols profiles at harvest in
the skin of Sangiovese berries grown under high and low temperature conditions during ripening
were similar in the year 2010 but it was significantly different among the treatments in 2012 (Table
6)
Fig 13 The trends of total and individual flavonols concentrations in the skin of Sangiovese berries grown under high
(HT) and low (LT) temperature conditions during ripening in the years 2010 and 2012
42
Table 6 The flavonols profiles at harvest in the skin of Sangiovese berries grown under high (HT) and low (LT)
temperature conditions during ripening in the years 2010 and 2012
Flavonols profile at harvest
Quercetin Kaempferol Myricetin
2010 LT 746 68 186
HT 735 75 189
ns ns ns
2012 LT 668 36 296
HT 642 26 332
34 3 Tannins accumulation during ripening
Tannins assessment was done in 2010 In this trial regardless from the treatments the amount of
total and individual tannins of seed and skin decreased generally from veraison to harvest This
result is in accordance with the previous works conducted by Harbertson et al (2002) Adams
(2006) and Kennedy et al (2001) From this research emerges that the two temperature regimes did
not affect the tannins branch of flavonoid biosynthesis This is comprehensible considering that
tannins are accumulated very early in berry development and the decline in their concentration from
veraison to harvest only reflects the quantitative changes that take place during berry ripening
(decrease of the tannins concentration in proportion to berry growth)
43
Fig 14 The trends of total and individual tannins concentrations in the berry seed and the skin of Sangiovese berries
grown under high (HT) and low (LT) temperature conditions during ripening in 2010
44
35 Gene expression assessment
In the present study the expression of some genes involved in the general flavonoid biosynthetic
pathway (PAL F3rsquoHb F3rsquo5rsquoHk F3rsquo5rsquoHi DFR LDOX) and the specific genes for anthocyanins
(UFGT and VvMYBA1) flavonols (FLS) and tannins biosynthesis (LAR BAN) were studied in
berries grown under two different temperature regimes (Fig 15)
In HT berries a strong reduction of anthocyanins and flavonols concentration and no effect on tannin
biosynthesis was observed and this seems to be directly related to the general inhibition of the
expression of flavonoids biosynthetic genes detected in this research (Fig 15) Furthermore it was
interesting to observe that even if the response in terms of total flavonoid accumulation was
comparable in 2010 and 2012 the flavonoid composition and the expression profile of some of the
analyzed genes was quite different between the two years of the experiment (Fig 15 Fig 16 Table
5 and 6)
The profile of PAL gene expression was mainly similar in the both years starting to increase in the
both treatments about 15 days after veraison PAL gene seemed to be repressed by high temperature
as a considerable higher level of expression in LT berries in respect to the HT ones was recorded in
both years about 37 days after veraison even if in 2010 it was not significantly different between the
two treatments This result is in agreement with many papers in which a direct correlation between
enhanced flavonoid accumulation (in particular anthocyanins) and increase in PAL gene expression
is reported (Pastore et al 2011 Ageorges et al 2006 Ban et al 2003 Roubelakis-Angelakis and
Kliewer 1986)
F3rsquo5rsquoHs and F3rsquoHs are versatile enzymes that are able to accept several phenylpropanoid substrates
and competitively control the synthesis of cyanidin- and delphinidin-flavonoid derivatives Two
isoforms of F3rsquoHs have been detected in grapevine genome until now (Castellarin et al 2006) In
this research the transcription of F3rsquoHb showed different profile of expression between the two
years of the trial In fact the transcription level of F3Hb was not affected or even induced by high
temperature 20 days after veraison in 2010 but we found exactly an opposite result in 2012 where
in LT berries a significant increase in F3rsquoHb expression was recorded 33 days after veraison in
comparison to HT
Studying the expression of F35Hi and F3rsquo5rsquoHk genes we observed that they were affected by high
temperature during ripening in both years showing similar transcription profiles Starting from full
veraison when all berries have turned red F3rsquo5rsquoHi expression increased in LT berries reaching a
maximum from one to two weeks after veraison in both 2010 and 2012 Also F3rsquo5rsquoHk expression
showed an increase in LT berries about 7 days after veraison in 2010 in comparison to HT and a
strong enhancement on F3rsquo5rsquoHk expression was observed in LT berries in 2012 (Fig 15) Sixteen
45
copies of F3rsquo5rsquoHs are present in the grapevine genome (Falginella et al 2010) suggesting a possible
role for each of them in different developmental and environmental conditions
The different patterns of expression observed for F3rsquoHb and F3rsquo5rsquoHs could suggest that the former
may be less sensitive in comparison to the latter to critical temperature conditions Considering that
the berry temperature in HT tunnel was higher in 2012 than 2010 (Table 2) it seems that F3rsquoHb is
able to tolerate thermal stress when temperature higher than 35degC are imposed for short periods as
in 2010 whereas in 2012 when HT berries spent more than two-fold hours at temperature higher
than 35degC in comparison to 2010 the F3rsquoHb expression is repressed From this study emerges that
at transcriptomic level the intensity and the extent of thermal stress could not affect in equal manner
the transcription of the gene that preside over the 3rsquo4rsquo- and 3rsquo4rsquo5rsquo-OH flavonoid biosynthetic
pathway in Sangiovese grape berry
In this research DFR and LDOX genes exhibited different patterns of expression in 2010 and in
2012 reaching maximum values in LT compared to HT 5 days after veraison in 2010 and 28 days
later in 2012 thus showed an expression pattern independent from the trend of anthocyanins
flavonols and tannins accumulation and from the timing of the temperature increase application
Our results are in agreement with previous findings reported that the expression of neither DFR nor
LDOX was as strongly correlated as UFGT and VvMYBA1 with anthocyanin content (Castellarin et
al 2007) and it is comprehensible if we consider that they can produce substrates for other branches
of flavonoid biosynthesis
Instead of that a strong correlation was found as expected in the expression of UFGT and of its
main transcription factor VvMYBA1 with the higher anthocyanins accumulation in LT vines
comparing to HT
Flavonol synthesis involves several genes encoding flavonol synthases (FLS) which are biosynthetic
enzymes converting dihydroflavonols to flavonol (Downey et al 2003) In both years the
expressions of FLS gene were similar between LT and HT berries in the early stages suggesting a
small effect of high temperatures on the transcription of this gene during veraison However FLS
started to be significantly higher in LT berries from mid of ripening and in 2012 a similar trend was
registered excepted at harvest when a significantly higher expression of FLS was registered in HT
(Fig 16)
Among the enzyme involved in tannins synthesis leucoanthocyanidin reductase (LAR) produces
catechin while anthocyanin reductase (BAN) converts cyanidin and delphinidin into epicatechin
and epigallocatechin respectively (Xie et al 2003 and Adams 2006 Fig 17) Bogs et al (2005)
found that in grape LAR is encoded by two closely related genes (LAR) whereas BAN enzyme is
46
encoded by a single gene (Fig17) As LAR1 appeared to be seed specific (Bogs et al 2005) only
LAR2 and BAN were analyzed in this study in 2010 In general timing and expression of BAN and
LAR2 genes is consistent with the accumulation of proanthocyanidins in the berry (Adams 2006)
This was further confirmed in this research where tannins analyses conducted on berry skin in 2010
showed no differences in terms of concentration and composition and as expected no differences
were found in the transcription of LAR2 and BAN during ripening
To better understand how the differences in gene expression could have or not influenced the
anthocyanins and flavonols composition also the timing and the coordination of flavonoid
biosynthetic genes has to be considered separately for the two years
In 2010 we detected a lack of variation in anthocyanins flavonols and tannins composition
following LT and HT treatment Following the treatment a coordinated transcription of F3rsquoHb
F3rsquo5rsquoHi F3rsquo5rsquoHk DFR LDOX UFGT and MybA1 was detected in LT berries which all reached a
maximum of expression 7 days after veraison (DAV) In HT the situation was quite different as for
F3rsquoHb and LDOX we found the highest expression 20 DAV when the transcription of DFR and
UFGT was already strongly reduced This shift and lack of synchronization could have hampered in
2010 the increase in the accumulation of 3rsquo4rsquo-OH flavonoids derivatives in comparison to LT
nevertheless the stability of F3rsquoHb transcripts detected in HT berries
In 2012 we found a statistically significant increase in malvidin and quercetin percentages in LT
berries in comparison to HT The concomitant stronger upregulation of F3rsquo5rsquoHi and F3rsquo5rsquoHk
starting from veacuteraison in LT compared to HT berries has to contribute to the increase in malvidin
concentration in LT berries in the second year of the trial Moreover in the same stage of berry
ripening also an increased expression of F3rsquoHb was recorded in LT berries and therefore the
biosynthesis of 3rsquo4rsquo-OH flavonoids should have been enhanced too Differently from what was
previously discussed for 2010 DFR and LDOX maximum expression was delayed in comparison to
the recorded peak of transcription for UGFT and VvMybA1 in both treatments It has to be
considered that FLS directly competes for its substrates with the enzyme DFR because they share
dihydroflavonols as the common substrates On this base probably there was a competition between
the biosynthesis of flavonols and anthocyanins in the both treatments but that contemporary
increase in the expression of F3rsquoHb DFR and FLS led to the rise of quercetin accumulation in LT
berries as compared to HT
47
Fig 15 Mean normalized expression of the genes involved in flavonoid biosynthetic pathway in berries grown under
high(HT) and low(LT) temperature conditions during ripening in 2010 and 2012
48
Fig 16 Mean Normalized expression of the FLS genes involved in flavonol biosynthesis in berries grown under
high(HT) and low(LT) temperature conditions during ripening in 2010 and 2012
Fig17 The mean normalized expressiom of the LAR and BAN genes in berries grown under high (HT) and low (LT)
temperature conditions during ripening in 2010
36 Activity of biosynthetic enzymes PAL and UFGT
In general the activity of PAL enzyme in both LT and HT berries increased gradually during
ripening but was considerably lower in HT plants in all sampling data from the end of full veraison
to harvest (Fig 18) This result is in agreement with the higher expression of PAL genes assessed in
LT berries
Using delphinidin and cyanidin as substrates in both years the activity of UFGT enzyme showed an
increasing trend from the end of full veraison to harvest in both LT and HT berries (Fig 19)
nonetheless a strong reduction was observed in HT plants compared to the LT ones during ripening
Also irrespective from thermal conditions UFGT activity at veraison was higher for cyanidin
compared to delphinidin as substrate (Fig 19) and this could be related to earlier expression of the
F3rsquoH genes (starting after full bloom) compared to the expression of the F3rsquo5rsquoH genes which begin
after veraison Basically these results confirmed the negative effects of high temperature on
anthocyanin biosynthesis at least for PAL and UFGT enzyme activities which showed a strong
correlation with anthocyanin concentration and confirmed to be the key enzymes of anthocyanin
biosynthesis pathway (Hrazdina et al 1984 Mori et al 2005 Boss et al 1996)
49
Fig 18 The trends of PAL activity (in one minute) in the skin of Sangiovese berries grown under high (HT) and low(LT)
temperature conditions during ripening in the years 2010 and 2012
Fig19 The trends of UFGT activity (Using cyanidin and delphinidin as substrate) in the skin of Sangiovese berries
grown under high (HT) and low(LT) temperature conditions during ripening in the years 2010 and 2012
50
37 Hypothesis for anthocyanin degradation
371 POD candidate genes
From the research conducted by Fasoli et al (2012) it can be realized that there are many different
isoforms of Peroxidases gene in different organs of grape As to recent researchers five POD
isoforms (labeled POD1 POD2 POD3 POD4 and POD5) are showed to be more expressed in
berry skin from veraison to harvest in Sangiovese (Pastore 2010) In addition to these 5 isoforms
another one (POD6) which was reported by Mori et al (2007) was assessed in this thesis
In 2010 Real Time experiment revealed that among these 6 genes that were studied in the berry skin
of Sangiovese only the expression of the genes POD1 and POD3 seem to be linked to the
temperature (Fig 20) The expression of POD1 and POD3 in HT detected to occur in different
patterns during the ripening but POD 1 was expressed with a similar trend in both years
Fig 20 Mean Normalized expression of the selected POD genes involved in anthocyanin biosynthetic pathway in the in
berries grown under high (HT) and low(LT) temperature conditions during ripening in 2010 and 2012
51
372 Activity of enzymes involved in anthocyanin degradation PODs and PPOs
In the both years the PODs activity during ripening showed a significant increase in HT berries
compared to LT (Fig 21) supporting the hypothesis of anthocyanin degradation in response to high
temperature (Vaknin et al 2005 amp Mori et al 2007)
It has been reported that peroxidase is involved in the active anthocyanin degradation of Brunfelsia
calycina flowers (Vaknin et al 2005) and in presence of H2O2 in the vacuoles of grape cells
(Calderon et al 1992) Our findings are coherent with other papers since heat stress can contribute
to H2O2 accumulation in plant tissue (Date et al 1998) and so PODs-anthocyanins reaction may act
as a scavenging mechanism for H2O2 and plant cell detoxification in high temperature conditions
(Yamasaki et al 1997 Pourcel at al 2007)
It is interesting to note that in this experiment we could not find any PPOs activity likely due to the
plastidial localization of this enzyme (Dry amp Robinson 1994) and so we demonstred the lack of
direct involvement in active anthocyanin degradation under high temperature conditions in Vitis
vinifera
Fig 21 The trends of PODs activity in the skin of Sangiovese berries grown under high (HT) and low (LT) temperature
conditions during ripening in the years 2010 and 2012
52
4 CONCLUSION
In the present study we examined the contents of anthocyanins flavonols and tannins the
expression of some biosynthetic genes involved in their synthesis and the activities of some related
enzymes in grape berries of Sangiovese cv grown under different thermal conditions in two
different years
Anthocyanins and flavonols accumulation in Sangiovese cv revealed to be very sensitive to high
temperature (showing a reduction over 50 in total anthocyanin concentration at harvest) Several
mechanisms such as a general inhibition of the expression of flavonoids biosynthetic genes and of
the activities of some flavonoids biosynthetic enzymes (PAL and UFGT) associated with a
stimulation of some putative anthocyanin degradation enzymes (PODs) showed to be involved in the
inhibitory effect of high temperatures on anthocyanin accumulation A similar mechanism may be
supposed for flavonols degradation
This study showed that the temperature regimes after veacuteraison have different effects on each
flavonoid group in grape berry because in conterary to anthocyanins and flavonols that were
reduced in the skin of grapes ripened under high temperature environments after veraison seed and
skin tannins were not affected by the same conditions
Furthermore the warmer condition verified in 2012 compared to 2010 and the different flavonoid
composition and expression profile of some of the analyzed genes in the two years may suggest a
different sensitivity to high temperature of some genes involved in anthocyanins biosynthesis
53
Chapter one Second Part
Recognition of putative POD genes involved in anthocyanins degradation
under high temperature condition
54
1 INTRODUCTION
Petunia has played a central role in transformation research since the earliest reports of plant
transformation It was a key model system when the first definitive accounts of Agrobacterium-
mediated transformation and direct DNA transfer established the transfer and expression of foreign
genes in plants Petunia subsequently played an important role in elucidating many of the
characteristics of plant transformation One of the key reasons for the importance of Petunia in plant
transformation research has been the selection for andor identification of genotypes well suited to
growth and regeneration in culture Ease of transformation coupled with other favorable biological
characteristics ensures that Petunia will remain a valuable model system for studies of gene
function in plants (Conner et al 2009) Moreover Petunia hybrida is one of the classical subjects of
investigation of plants pigmentation in which the pathway of anthocyanin biosynthesis has been
analyzed genetically and biochemically (Meyer et al 1987 Quattrocchio et al 2006) Although the
information about Petunia sequenced genome is somehow limited it can be still used as model
species in this important field of study for the obvious ease of detecting mutants for this pathway It
can also be actively employed in complementation studies with genes from other species such as
grape (Venturini 2009)
Therefore in the second phase of this trial regarding to the results obtained from the assessment of
the expression of the genes involved in anthocyanin degradation at elevated temperature gene
transformation was conducted with different isoforms of peroxidases genes from Vitis vinifera (cv
Sangiovese) to Petunia hybrida with the aim of recognizing the most effective candidate genes for
anthocyanins degradation under high temperature
2 MATERIALS
21 Gene selection
In the first phase of this trial the expressions of 6 different isoforms of Peroxidases genes that were
showed to be more expressed in berry skin from veraison to harvest (Fasoli et al 2012 Mori et al
2007) were assessed via Real Time-PCR subsequently according to that results 3 different
isoformes were selected to transform Petunia hybrida
22 Escherichia coli strain and culture media
The DH10B strain was provided by Invitrogenreg and features the mutations recA1 endA1 presence
of the gene lacZM15 and high transformation efficiency Moreover it didnrsquot carry any antibiotic
resistance genes
55
221 Luria-Bertani (LB) medium
Component Concentration (gl)
Yeast extract 5
Tryptone 10
NaCl 10
Agar 15
Final pH 75
The medium was sterilized in an autoclave (121degC for 20 minutes 2 atm) After sterilization
antibiotic (kanamycin) was added to the solution for a final concentration of 50 mgl
222 SOC medium
Component Concentration (gl)
Yeast extract 5
Tryptone 20
After sterilization in an autoclave (121degC for 20 minutes 2 atm) glucose and salts sterilized by
filtration (filters with ores of 02 m diameter) were added to the solution at the following
concentrations
Component Concentration
NaCl 10 mM
KCl 25 mM
Glucose 20 mM
MgCl2 10 mM
MgSO4 10 mM
Final pH 68-70
56
23 Agrobacterium tumefaciens strain and culture media
For Petunia hybrida transformation the super virulent EHA105 Agrobacterium tumefaciens strain
was chosen (Hellens et al 2000) The bacteria possess a disarmed helper Ti plasmid (pTIBo542ΔT-
DNA) encoding the necessary sequences for the transfer of the T-DNA region which is carried by a
second shuttle plasmid the pK7WG20 The two plasmids are defined as binary vectors The cells
containing both plasmids can be selected for with the use of the following antibiotics
Antibiotic Concentration Resistance
Rifampicin 50 mgl Genomic
Streptomycin 300 mgl pK7WG20
Spectinomycin 100 mgl pK7WG20
231 YEB Medium
Component Concentration
Yeast extract 1 gl
Tryptone 5 gl
Beef extract 5 gl
Sucrose 5 gl
MgSO4 5 Mm
Agar 15 gl
Final pH 75
The medium was sterilized in an autoclave (121degC for 20 minutes 2 atm) After sterilization
antibiotics (streptomycin 300 mgl spectinomycin 100 mgl and rifampicin 50 mgl) were added to
the solution for selective mediums
57
24 Vectors
241 pENTRtradeD-TOPOreg (2580 bp)
Feature Benefit
rrnB T1 and T2 transcription terminators Protects the cloned gene from expression by vector- encoded
promoters thereby reducing possible toxicity in E coli
attL1 and attL2 sites
Allows sequencing in the sense orientation Bacteriophage λ-derived
DNA recombination sequences that allow recombination cloning of the
gene of interest from a Gatewayreg expression clone or attB PCR
product (Landy 1989)
TOPOreg Cloning site directional Allows a fast and directional cloning
M13 forward and reverse primer sequences Allow sequencing of the insert
Kanamycin resistance gene Allows selection of the plasmid in E coli
pUC origin Allows high-copy replication and maintenance in E coli
Fig 22 a scheme of the pENTRtradeD-TOPOreg vector
242 pK7WG20
A scheme for vector pk7WG20 is presented in Fig 23 It is a binary vector used as destination
vector in the Gatewayreg technology The T-DNA comprises the marker gene nptII which confers
58
resistance to kanamycin The cloning of an exogenous genes in this position implies an LR
recombination between the 35S CaMV constitutive promoter and the terminator 35S
Fig 23 Schematic representation of the pK7WG20 vector
25 Primers
The Primers pairs for POD1 to POD5 were newly designed on the original DNA sequences to
amplify 150ndash250 bp gene fragments and the Primers pairs for the POD6 was referred to Mori et al
(2007) (Table 7)
Subsequently according to the results of those expressions 3 different isoformes (POD 1 POD 3
and POD 5) were selected to transform Petunia hybrida
59
(Table 7) (POD 1-6) The primers of the selected isoforms of the Peroxidases genes for RT-PCR and (POD 1-3
cloning) The primers of the selected isoforms of the Peroxidases genes for cloning
primer Forward primer Reverse
POD 1 5-TCTGAGTAAGAGCCCACACACTCT-3 5-GAGACCTGAGCAGATAAATACAAAAATAAA-3
POD 2 5-AAAGTTGTTTGGCTGTGG-3 5-AATCCCTCCAAACAATCA-3
POD 3 5-TGCTCTAAATGCCTGAAAAATG-3 5-ATCATATAGAAAAGTGACAGCAACCT-3
POD 4 5-CAACTTCACACCAACGGGAAA-3 5-GCAGCTGAGCAAGAAATGCTT-3
POD 5 5-TCGGTGAGGAACTCCGATA-3 5-AGCTTCCTTGTCCTCTTCCA-3
POD 6 5-AACTTGAGACACAACAGCATAAATAAATC-3 5-AGGACCAAATCACAGGATGATAAAG-3
POD 1 cloning 5-cacc atg gca ttg atc ctc ttt tc-3 5-cta gtt taa ggc atc aca cc-3
POD 3 cloning 5-cacc atg tct ctt ctc gtt ctt ctc-3 5-tta aga ttc cag gag tgt gtc-3
POD 5 cloning 5-cacc atg aga aaa ctt atg gag gc-3 5-tta aag ttc agc aga agc ttc-3
26 Plant materials
Petunia hyrida line W84xV30 (P axillaris X P inflata) has become an attractive system for
genetic molecular and complementation studies as it possesses many desirable characteristics
colored flowers whose dimensions (5-6 cms) allow for relative ease of dissection and separation of
floral organs rapid growth cycle (2-3 months from seeds to full bloom) ease and rapidity of genetic
transformation via infection with disarmed Agrobacterium tumefaciens
This species has a limited number of chromosomes (n=7) and a small genome (12 times 106 kb) In
particular the line W84 is not capable of expressing a Glutathione S-transferase PhAN9 (Alfenito et
al 1998) and hence to accumulate anthocyanins in the vacuole leading to a fading color phenotype
However the W84 line had proved difficult to transform in previous experiments with the GST4
gene To overcome this problem a new Petunia hybrida line was generated by crossing W84 with
the V30 cultivar and recovering the mutated offspring after self-crossing This W84xV30 line was
used in all subsequent experiments
The peroxidases genes were isolated from Vitis vinifera (cv Sangiovese) (the plant materials used in
the first part of this chapter)
60
Fig 24 Petunia hyrida ndash line W84xV30
3 METHODS
After the PCR amplification of our selected genes with proof-editing PFU enzyme DNA
purification was done directly from the PCR product and used for the TOPOregCloning reaction
following the protocol provided by Invitrogen kit
31 Transformation of Escherichia coli by heat shock
After the TOPOregCloning reaction the DNA was added to the E coli DH10B competent cells and
the mixture left in ice for other 30 minutes Cells were incubated at 42degC without agitation for 30
seconds and then rapidly transferred into ice 250 microL of SOC medium provided by Invitrogen kit
kept at room temperature was added to the culture and the re-suspended cells were incubated at
37degC with agitation (200 rpm) for 1 hour 100- 200 l of the solution was placed on to a solid LB
medium and left at 37degC overnight
32 Preparation of competent cells of A tumefaciens
To obtain Agrobacterium tumefaciens strain EHA105 cells competent for the transformation by
electroporation a single colony was inoculated into 3 mL YEB medium containing Rifampicin (50
mgl) and incubated at 28degC overnight with vigorous shaking When the culture reaches the
exponential growth phase (usually after 12 hours characterized by an OD600 equal to 09-10) 15
mL of solution was sampled and centrifuged at 14000 rpm for 1 minute at room temperature The
pellet thus obtained was washed to eliminate antibiotic and re-suspended three times in 500 l cold
and sterile glycerol 10 (vv) at each step the solution was centrifuged at 14000 rpm for 1 minute
at room temperature Finally the pellet was re-suspended in 40 l of cold and sterile glycerol 10
(vv) The cells were ready to be electroporated
61
33 Transformation of A Tumefaciens by electroporation
A Bio-Rad device for electroporation was used for this experiment calibrated at 25 F 200 and
25 kV 1 or 2 microL of DNA plasmid (20 ng) was re-suspended in 40 l of competent cells The
operation was performed in ice The mix was transferred into a pre-cooled electroporation cuvette
the cuvette was then inserted into the Bio-Rad device and subjected to a pulse of 25 kVcm at 200
Ohm immediately after the pulse 1 mL LB without antibiotics was added in sterile conditions The
suspension was recovered and grown in a propylene tube with agitation for one hour at 28degC so that
the cells can express the resistance gene The cells were placed in 100 ndash 200 l aliquots on to YEB
solid medium containing Spectinomycin (final concentration 100 mgl) Rifampicin (final
concentration 50 mgl) and Streptomycin (final concentration 300 mgl) The Petri dishes were
incubated at 28degC for two days The transformation efficiency of this method is 8x10⁵ cfug DNA
34 Colony PCR
To detect bacterial recombinant clones which carry a fragment of interest it is possible to perform
the colony PCR consists of a single bacterial colony for a final volume of 20 μl A sterile tip is used
to sample the colony from the solid culture medium and dissolved in the reaction mix
35 Plasmid DNA extraction
To purify the plasmid DNA of colony which resulted positive by PCR bacteria were put in 5 mL of
liquid LB with the correct antibiotic to grow overnight at 37degC with agitation The extraction of
DNA plasmid was carried out on the base of ldquoQIAprepreg Spin Miniprep Kitrdquo (Qiagen) following the
manufacturersquos instruction
36 Purification of PCR products
To purify the PCR products the protocol of the kit provided by Promega Wizardreg SV Gel and PCR
clean-up system was performed
37 GATEWAYreg cloning system
The Gatewayreg Technology (Invitrogen) is based on the bacteriophage lambda site-specific
recombination system which facilitates the integration of lambda into the E coli chromosome and
the switch between the lytic and lysogenic pathways This recombination method facilitates transfer
62
of heterologous DNA sequences (flanked by modified att sites) between vectors Two recombination
reactions constitute the basis of the Gatewayreg Technology
Site Length Function
attL 100bp Entry clone Entry vector
attR 125bp Destination vector
38 LR Recombination reaction
LR Recombination reaction was performed following the protocol provided by Invitrogen
This reaction facilitates recombination of an attL substrate (entry clone) with an attR substrate
(destination vector) to create an attR-containing expression clone (see diagram below)
Fig 25 a scheme of the Gatewayreg cloning system
Componente Volume
Entry clone (100 ηg) 1 microL
Destination Vector (150 ηg) 1 microL
5X LR Clonase buffer 2microL
Sterile water 6 microL
63
The Entry-clone vectors had been generated with independent ligation reactions in the pENTRTM
D-
TOPOreg vector containing the attL1 and attL2 sites It was therefore possible to perform directly the
recombination reaction with the destination vector pK7WG20
The solution is incubated for 1 hour at 25degC then 1 μl of the Proteinase K enzyme (Invitrogen) is
added to the mix which is placed for an additional 10 minutes at 37degC At this point it is possible to
perform the transformation of the competent E coli DH10B cells
39 TOPO cloning reaction
TOPOreg cloning reaction was performed following the Invitrogen protocol for electro-competent E
coli cells
Reagents Chemically Competent E coli Electrocompetent E coli
Fresh PCR product 5 to 4 μl 05 to 4 μl
Dilute Salt Solution (14) -- 1 μl
Salt Solution 1 μl --
Sterile Water add to a final volume of 5 μl add to a final volume of 5 μl
TOPOreg vector 1 μl 1 μl
Final volume 6 μl 6 μl
The mix reaction was incubated in ice for 20 minutes then the cells were incubated at 42degC without
agitation for 30 seconds and then rapidly transferred into ice followed by the procedure of
Transforming One Shotreg TOP10 Competent Cells provided by Invitrogen kit
310 RNA extraction and Real time PCR
Real-time PCR was performed to evaluate the expression of six different isoforms of peroxidases
genes for five selected stages of grape berry ripening from beginning of veraison to the end of
harvest For each sampling 3 biological replicates were analyzed Total RNA was isolated from 200
mg of the powdered berry skin tissue using SpectrumTM
Plant Total RNA kit (Sigma-Aldrich St
Louis MO USA) following the manufacturers protocol One microL of each RNA sample was
measured spectrophotometrically to determine RNA quantity and 260280 and 260230 ratio using a
64
NanoDrop1000 Spectrophotometer (Thermo Fisher Scientific Wilmington DE USA) Total RNA
was treated with 1 U microg-1 RQ1 DNase (Promega Milan Italy) First-strand cDNA was synthesized
using 1 microg of RNA 1microL (dT)15 primer (500 microgmL) and 1 U of GoScripttrade reverse transcriptase
(Promega) Quantitative RT-PCR was carried out on a Step One Plustrade (Applied Biosystems Foster
City California USA) Each reaction (10 microL) contained 188 nM of each primer 2microL of diluted
cDNA (125) 5microL U of Power SYBRreg Green PCR Master Mix (Applied Biosystems Foster City
California USA) Thermal cycling conditions were 95 degC for 10 min followed by 95 degC for 15 s 55
degC for 1 min for 40 cycles followed by a melting cycle which contains 95 degC for 15 sec 60 degC for 1
min and 95 degC for 15 sec Each cDNA sample was analyzed in triplicate Gene transcripts were
quantified as reported by (Pastore 2010) The Primers pairs for POD1 to POD5 were newly
designed on the original DNA sequences to amplify 150ndash250 bp gene fragments and the Primers
pairs for the POD6 was referred to Mori et al (2007) (Table 7)
311 Stable transformation of Petunia hybrida
The protocol is applied under a laminar flow cabinet to ensure sterility Young apical leaves are
harvested and kept in water to avoid dehydration They are subsequently sterilized with a solution of
05 sodium hydrochloride in which they are dipped for 10 minutes followed by 5 washings of 10
minutes each in bi-distilled water The tips borders and petioles are removed with a sterilized
scalpel while the rest of the leaf is cut in three sections The leaf pieces are immersed in a solution
110 of overnight grown Agrobacterium tumefaciens transformed with a selected gene for 20
minutes so that the bacteria could attach to the explants after which they are transferred to a Petri
dish containing solidified Medium I (supplemented with Folic acid (1 mgmL) NAA (01 mgmL)
6-BAP (2 mgmL) without antibiotics) Each Petri dish can hold up to 10 discs The Petri dishes are
sealed and stored in a growth chamber at 25degC under day-night regime (with a long day light period
of 16 hours of light) After 2-3 days the explants are transferred into a new Petri dish filled with
medium II which contains two antibiotics 500 mgl carbenicillin to stop Agrobacterium growth and
300 mgl kanamycin to select the transformed explants The explants were transferred to fresh
selective plates each 2-3 weeks and the explants were constantly checked against contamination
with molds or other pathogens After about 8 weeks the shoots regenerated from the calluses were
removed and transferred onto the rooting medium (medium III supplemented with 500 mgl
carbenicillin and 50 mgl kanamycin) After the roots were sufficiently developed the medium was
washed away from the roots were put in jiffy pots and were grown in greenhouse Petunia hybrida
plants grow and flower in about 2 to 3 months
65
3111 Medium I
Component Concentration
Sucrose 20 gl
Glucose 10 gl
MS-macro amp micro elements with Gamborg B5 vitamins (Duchefa M0231) 44 gl
Plant Agar 8 gl
The pH is adjusted to 57-59 with HCl and KOH The medium is sterilized in an autoclave for 20
minutes and after it has reached 60deg C the following hormones are added
Component Concentration
Folic acid 1 mgl
6-BAP 2 mgl
NAA 01 mgl
3112 Medium II
Medium II is obtained from Medium I with the addition of the antibiotics needed for the eradication
of Agrobacterium tumefaciens and the selection of transformed calluses They are as thermolabile as
the phytohormones and must therefore be injected in the medium only after it has reached a
temperature lower than 60deg C
Component Concentration
Carbenicillin 500 mgl
Kanamycin 300 mgl
66
3113 Medium III
The composition of Medium III is identical to that of Medium I but without the addition of
phytohormones Also the following antibiotics are added to the medium
Component Concentration
Carbenicillin 500 mgl
Kanamycin 50 mgl
312 Agro-infiltration of petunia petals
Agro-infiltration represents recent advancements in Petunia transformation This is a technique for
transient gene expression and the development of intragenic vectors to affect gene transfer without
the integration of ldquoforeignrdquo DNA
One mL of the Agrobacterium culture grown overnight for inoculation of 25 mL of LB liquid
medium was added to 300 μgmL Streptomycin 100 μgmL Spectinomycin 20 μM Acetosyringon
and 10 mM MES and was incubated to grow overnight at 28 o
C at 180 rpm After centrifugation for
20 minutes at 12000 rpm the pellet was re-suspended with 15 mL of the buffer below After adding
100 μl of the inoculums to 900 μl of the re-suspending buffer the OD (Optical Density) was
measured spectrophotometrically and the following formula was used for dilution of the inoculums
up to the final volume of 50 mL
3121 Resuspending buffer
Component Concentration
MgCl2 10mM
MES 10mM
Acetosyringone 100 μM
The volume of the inoculums = [05 (The optimal OD) times 50 (The final volume)] divide [(The read OD
via spectrophotometer) times 10]
67
Afterward 100 μM of Acetosyringone was added to the inoculums and the mixture was incubated in
room temperature for 2-3 hours
The bacterial suspension was infiltrated into the upper layer of petals using a 1mL syringe without a
needle Infiltrated flowers were kept at 25 oC for 36 to 48 hours after infiltration
313 DNA extraction from Petunia
The DNA was extracted from a Petunia hybrida leaf disc ground thoroughly in 400 l of extraction
buffer Then the extract was centrifuged and 300 microL of the supernatant was mixed with 300 microL of
isopropyl alcohol After the incubation at room temperature for 15 minutes and centrifugation the
pellet was dried at room temperature under a fuming hood and subsequently re-suspended in 100 microL
of sterile bi-distillated water and incubate overnight in the refrigerator To discard any remaining
impurities the tube was centrifuged again and the supernatant transferred to a new sterile tube
3131 Extraction buffer
Component Concentration
Tris HCl pH 80 200 mM
NaCl 250 mM
SDS 1
EDTA 25 mM
-mercaptoethanol 10 mM
314 PCR of transformed Petunia genomic DNA
PCR amplification was performed on Petunia genomic DNA in a final volume of 20 μl As the
primer forward Promoter 35 S and as the primer reverse the specific primer for ldquoPOD 1cloningrdquo
was used As the negative control the genomic DNA of the Wild type line was used as the template
68
3141 Reaction Mix
Component Stock Volume
Template DNA 1 l
Buffer (containing MgCl2) 10x5x 4 l
Nucleotides 10 mM 04 l
Primers 20 M 04 l
Taq 5000 umL 01 l
3142 Standard thermal cycle
Initial denaturation 94 degC 5rsquo
Denaturation 94 degC 40rdquo
Primers annealing 55degC 40rdquo X 35 cycles
Extension 72 degC 90rsquorsquo
Final extension 72 degC 7rsquo
315 RNA extraction from Petunia hybrida petal
Petunia petals from the young expanded flowers were immediately frozen in liquid nitrogen and
then were kept in the freezer (-80 o
C) until analyses were carried out Total RNA was isolated from
200 mg of the powdered petal using spectrum TM
Plant Total RNA kit (Sigma-Aldrich St Louis
MO USA) following the manufacturerrsquos protocol One microL of each RNA sample was measured
spectrophotometrically to determine RNA quantity and 260280 and 260230 ratio using a
NanoDrop1000 Spectrophotometer (Thermo Fisher Scientific Wilmington DE USA)
316 cDNA synthesis RT PCR reaction
After controlling the RNA via the electrophoresis gel total RNA was treated with 1 U microg-1 RQ1
DNase (Promega Milan Italy) First-strand cDNA was synthesized using 1 microg of RNA 1microL (dT)15
primer (500 microgmL) and 1 U of GoScripttrade reverse transcriptase (Promega) PCR amplification was
69
performed on the derived cDNA for a final volume of 20 μl As the primers once the Primers pair
of actin was used and subsequently for the RT- PCR amplification the specific primers of ldquoPOD
1cloningrdquo (Table 7) were used
3161 Reaction Mix
Component Stock Volume
Template DNA 1 l
Buffer (containing MgCl2) 10x5x 4 l
Nucleotides 10 mM 04 l
Primers 20 M 04 l
Taq 5000 umL 01 l
3162 Standard thermal cycle
Initial denaturation 95 degC 5rsquo
Denaturation 95 degC 30rdquo
Primers annealing 55degC 30rdquo X 35 cycles
Extension 72 degC 20rsquorsquo
Final extension 72 degC 7rsquo
317 Total anthocyanin measurement
Petunia petals from the young expanded flowers were selected in 5 biological replicates for the
transformed plants and wild type line They were immediately frozen in liquid nitrogen ground and
the fine powder was weighted before the extraction of anthocyanins The powder was homogenized
with the solvent mixture of methanol 99 with HCl 1 at the volumes of eightfold of the powder
Then the mixture was sondicated for 20 minutes
This is the act of applying ultrasound energy to agitate particles in a sample It is applied using an
ultrasonic bath All the procedures were conducted at 4 oC After the centrifugation at 12000 rpm
70
for 10 minutes at 4 oC an aliquot of the supernatant was diluted 140 and the total anthocyanin was
quantified spectrophotometrically at 540 nm
318 Heat shock performance
Young petunia flowers in 5 biological replicates for the transgenic plants and wild type line were
selected for the heat shock To carry out this experiment the flowers were cut with a long pedicle
and some small leaves and were placed in a falcon of water They were kept for one hour in the
incubator at 45 oC and transferred subsequently to the room temperature After 30 hours the petals
were frozen in liquid nitrogen ground and the fine powder was weighted to evaluate the activity of
Guaiacol Peroxidases enzyme and the total anthocyanin
319 Guaiacol Peroxidases activity assay
Guaiacol peroxidases was assayed as described by Ushimaru et al (1997) using pyrogallol as the
electron donor for the reaction The plant material was extracted in cold buffer (200 mM sodium
phosphate 5 mM sodium EDTA 1 PVPP pH 70) and incubated on ice for 30 min After
centrifugation at (10000 times g 30 min 4 degC) the desalted supernatant was used for the assay The
reaction mixture (15 mL) included 1140 μl of the 100 mM sodium phosphate buffer pH 70 60 microL
of the 25 mM H2O2 60 mM pyrogallol and 240 μl extract H2O2 and pyrogallol were prepared
fresh just before use Absorbance (λ=430 nm) was taken after 25 min incubation at room
temperature and referred to a blank with no extract added One unit of Guaiacol peroxidases is
defined as the amount of enzyme that catalyzes the oxidation of 1 μmol of pyrogallol per minute
under the conditions described by Chen and Asada (1989) and PODs activity was expressed as kat
g-1
petal fresh weight An absorbance coefficient of 247 mM
-1 cm
-1 was assumed for calculations
4 RESULTS
The aim of this trial is recognizing the most effective candidate genes responsible for anthocyanins
degradation under high temperature conditions during the ripening time Among the candidates for
anthocyanin degradation peroxidases are involved in active anthocyanin degradation in living
tissues (Vaknin et al 2005 Welinder et al 2002) In addition the results obtained from the
enzymatic activity of peroxidases at elevated temperature and the expression of this gene during
ripening supports the hypothesis of its role in anthocyanin degradation On these bases the
technique of gene transformation was conducted with different isoforms of peroxidases genes from
Vitis vinifera (cv Sangiovese) to Petunia hybrida
71
41 Gene selection
From the research conducted by Fasoli et al (2012) it can be realized that there are different
isoforms of Peroxidases gene in different organs of grape that among them only 5 isoforms are
showed to be more expressed in berry skin from veraison to harvest In addition to these isoforms
there was another one which was reported by Mori et al (2007) to be expressed in grape berry
skin
Fig 26 The expression value of the different isoforms of Peroxidases in berry skin from veraison to harvest (V
Veacuteraison MR Mid-ripening R Ripening) Fasoli et al (2012)
As to the expression of these different isoforms by Real time pcr 3 of them were selected for the
transformation to Petunia hybrida
Fig 27 Mean Normalized expression
of the selected POD genes isolated from
berry skin for the transformation to
Petunia hybrida
72
Among all the three isoforms only the POD 1 could be successfully isolated from grape berry skin
and transformed to Petunia
42 The sequence of the POD1 gene
Vv14s0066g01850 (POD1)
ATG GCA TTG ATC CTC TTT TC
TCTACTATTCTTTCTGGGATTAGTGAACCCTTCGGAGTCCAGGTTGAGTGTCAACTACTACCAAAAATCATGCCCAAGA
TTCAGTCAGATCATGCAGGATACCATCACCAACAAGCAAATCACCAGCCCCACCACGGCTGCGGCCACTCTCCGCCTC
TTCTTCCACGACTGCTTCATTGAGGGCTGCGATGCTTCCGTTCTTGTCTCCTCGACCCCCTTCAACGAGGCCGAGCGCGA
TGCCGACATGAACCTCTCCCTCCCCGGCGACGGCTTCGACGTCGTTGTCCGCGCCAAGACCGCCCTCGAGCTCGCTTGC
CCCGGTGTGGTCTCCTGTGCCGACATTCTCGCCGTCGCTACCCGCGATCTCGTCACCATGGTGGGAGGTCCCTTCTACA
AGGTCCCGCTGGGGAGAAGAGATGGGCTGGTCTCCCGGGCGAACAGGGTTGAAGGTAACCTTCCAAGACCCACGATG
TCCATTTCTCAGATAATTTCGATTTTCGCTGTGAGAGGGTTCTCGGTTCAAGAAATGGTGGCGCTGAGTGGTGCCCACA
CGATTGGGTTCTCGCATTGTAAAGAATTCAGCAGCGGGATCTACAATTACAGCCGCAGTTCCCAGTCCAATCCGAGCTA
CAACCCTAGATTCGCAGAGGGGTTGAGAAAAGCTTGCAGCGATTACCAGAAGAATCCTACATTGTCGGTGTTCAACGA
TATAATGACTCCCAACAAGTTCGATAACATGTATTTCCAGAATCTGCCCAAGGGTTTGGGGCTATTGGCGACGGACCAT
ACCATGGCTACCGATCCGAGGACGAGGCAGTTTACGGATTTGTATGCCAAGAATCAAAGCGCCTTCTTTGAGGCATTT
GGTCGAGCTATGGAGAAGCTTGGCCTTTATGGGATCAAGACCGGGCGAAGAGGAGAGATTCGACGCA GG TGT GAT
GCC TTA AAC TAG
Vv14s0066g01850 (POD1) genomic
AAGGCTTCTGAGTAAGAGCCCACACACTCTCCATTGCTGCCACTACCACTGGCTTTTTTTTTTATTTTTGTATTTATCTGC
TCAGGTCTCTGAGCTTTGAGCTCTGAGAAACAATGGCATTGATCCTCTTTTCTCTACTATTCTTTCTGGGATTAGTGAAC
CCTTCGGAGTCCAGGTTGAGTGTCAACTACTACCAAAAATCATGCCCAAGATTCAGTCAGATCATGCAGGATACCATC
ACCAACAAGCAAATCACCAGCCCCACCACGGCTGCGGCCACTCTCCGCCTCTTCTTCCACGACTGCTTCATTGAGGGCT
GCGATGCTTCCGTTCTTGTCTCCTCGACCCCCTTCAACGAGGCCGAGCGCGATGCCGACATGAACCTCTCCCTCCCCGG
CGACGGCTTCGACGTCGTTGTCCGCGCCAAGACCGCCCTCGAGCTCGCTTGCCCCGGTGTGGTCTCCTGTGCCGACATT
CTCGCCGTCGCTACCCGCGATCTCGTCACCATGGTGGGAGGTCCCTTCTACAAGGTCCCGCTGGGGAGAAGAGATGGG
CTGGTCTCCCGGGCGAACAGGGTTGAAGGTAACCTTCCAAGACCCACGATGTCCATTTCTCAGATAATTTCGATTTTCG
CTGTGAGAGGGTTCTCGGTTCAAGAAATGGTGGCGCTGAGTGGTGCCCACACGATTGGGTTCTCGCATTGTAAAGAAT
TCAGCAGCGGGATCTACAATTACAGCCGCAGTTCCCAGTCCAATCCGAGCTACAACCCTAGATTCGCAGAGGGGTTGA
GAAAAGCTTGCAGCGATTACCAGAAGAATCCTACATTGTCGGTGTTCAACGATATAATGACTCCCAACAAGTTCGATA
ACATGTATTTCCAGAATCTGCCCAAGGGTTTGGGGCTATTGGCGACGGACCATACCATGGCTACCGATCCGAGGACGA
GGCAGTTTACGGATTTGTATGCCAAGAATCAAAGCGCCTTCTTTGAGGCATTTGGTCGAGCTATGGAGAAGCTTGGCCT
TTATGGGATCAAGACCGGGCGAAGAGGAGAGATTCGACGCAGGTGTGATGCCTTAAACTAGGTTTTTAAGGTTTTTTTT
TTTTTTTTTGCATTACAAACTCCCACCGTAGTGATGATCAATCAAGGTGAATTGATGGTGAGGGGGTGGTTTCATTTGA
ATTCTTTTTTTTTTTGTTGT
73
43 Gene transformation
After amplification of POD1 gene with PFU enzyme and specific POD1 primers (Table 7 Fig 28)
the E coli transformation was performed via pTOPO cloning system The day after a single colony
of DH10B cells that was grown on solid LB was transferred into 10 mL of liquid LB containing the
appropriate kanamycin antibiotic (for a final concentration of 50 mgl) and incubated overnight at
37deg and 250 rpm Afterward the pcr amplification of the colony was done to detect bacterial
recombinant colonies which carried the fragment of interest
Therefore 2 plates were designed to amplify each colony two times (Fig 29)
In the first plate the combination of the primer forward of M13 was used with the specific primer of
POD 1 reverse and simultaneously in the second plate the same colony was amplified with the
primer forward of POD1 with the M13 reverse The primers pair M13 gives the possibility to
amplify the fragment 50 bp longer than our inserted gene Consequently only the colonies which
were amplified in the correct position in the both plates had successfully carried the fragment of
interest (Fig 29)
Fig 28 Amplification of POD 1 gene by PFU
74
Fig 29 Colony PCR of POD 1 gene (The colonies marked with a star sign in the both gels are the ones with our
fragment of interest)
After the sequencing of the insert in the plasmid the LR recombination reaction was performed
The colony PCR was done using the ldquoPROMOTER 35 Srdquo as the primer forward and the primer
ldquoSONDA TERrdquo as the reverse The fragment 1575 bp was amplified The colony marked with a star
sign is the one with our fragment of interest (Fig 30) and the plasmid DNA was extracted and the
insert fragment of 1375 bp was amplified with the primer forward ldquoPROMOTER 35 Srdquo and the
specific primer reverse of ldquoPOD 1cloningrdquo (Table 7) (Fig 31)
75
Fig 31 The plasmid DNA (PK7WG2) control
After the transformation of A Tumefaciens the positive colonies were checked by pcr amplification
of the Agro-plasmid with the primer forward ldquoPROMOTER 35 Srdquo and the specific primer reverse of
ldquoPOD 1cloningrdquo (Fig 32) The plasmid DNA PK7WG2 was used as the positive control
Fig 30 The PK7WG2 Colony PCR of POD 1 gene
76
Fig 32 The pcr amplification of the Agro-plasmid (PC) Positive control (NC) Negative control (P1 - P5) Agro-
plasmids
Afterward the stable transformation of Petunia hybrida was done In addition at the same time the
Agro-infiltration of petunia petals was performed and the bacterial suspension was infiltrate into the
upper layer of petals Infiltrate flowers were then kept at 25 oC for two days but the flowers were
wilted without any change observed After 4 to 5 months two plants derived from the two
independent stable transformations grew in selective medium containing kanamycin and flowered
and were propagated asexually by cutting
To control the transformation efficiency the DNA was extracted from a Petunia hybrida leaf disc of
the two transgenic lines a wild type line and also as a positive control the plasmid DNA PK7WG2
was used The pcr amplification was done with the primer forward ldquoPROMOTER 35 Srdquo and the
specific primer reverse of ldquoPOD 1cloningrdquo (Fig 33)
77
As to the obtained results (Fig 33) both plants were transformed successfully To investigate the
expression of the transgene in the two lines RNA was extracted from the petal of the transgenic
plants and from the wild type line used as negative control and retro transcript to cDNA By pcr
amplification performed with the primers pairs of Actin the correct retro transcription of the RNA
was evaluated Then to analyze the expression of the transgene VvPOD1 in the petunia petal the
RT-PCR was performed with the specific primers pairs of ldquoPOD 1cloningrdquo
According to the (Fig 34) the fragment of 1kb was amplified and observed only in the second lane
confirming that the POD1 gene was expressed successfully in the Petunia hybrida line 2
Fig 33 The PCR amplification to control the transformation efficiency (TP1) Transgenic petunia 1st pot (TP2)
Transgenic petunia 2nd pot (WTL) Wild type line (PC) Positive control (NC) Negative control
78
0
5
10
15
20
25
30
35
40
45
50
Wild type line
control
POD plants
control
Wild type line
Heat shocked
POD plants
Heat shocked
To
tal
an
tho
cyan
in
A
BB
C
Fig 34 The RT-PCR of POD1 gene in the transformed plant (TP1) Transgenic petunia 1st pot (TP2) Transgenic
petunia 2nd pot (WTL) Wild type line
44 Heat shock and the plant response
Subsequently flowers from the transgenic line 2 (which expressed the POD1 gene) and from the
wild type were selected in 5 replicates and treated with the heat shock in order to highlight the
possible role of POD1 in anthocyanin degradation under stress condition
The same number of flower replicates of wild type and the transgenic line 2 were selected as the
control ie not subjected to the heat shock The petals of the treated flowers together with the
control ones were grounded by liquid nitrogen and the fine powder was weighted and divided in to
two in order to evaluate the activity of Guaiacol Peroxidases enzyme and the total anthocyanin
(Fig 35 36)
Fig 35 Total anthocyanin content of wild type line and POD plants
79
0
5
10
15
20
25
30
Wild type
line control
POD plants
control
Wild type
line Heat
shocked
POD plants
Heat shocked
(Kat
gr
-1 F
W)
C
B
C
A
By comparing the total anthocyanin content of the wild type and the transgenic lines before and after
heat treatment we found that the total anthocyanin content of the wild type line was significantly
similar in the both control and shocked treatment (Fig 35) After the heat shock the level of the
total anthocyanin in the transgenic petunia was reduced significantly However the total
anthocyanin content of the POD flowers in control was surprisingly highest among the others
Fig 36 The Peroxidase activity of wild type line and POD plants in the control and heat shock treatment
The enzymatic activity of peroxidase in both wild type and transgenic line 2 was evaluated before
and after the treatment
The wild type flowers showed the same level of enzymatic activity before and after the treatment
(Fig 36) The peroxidase activity was higher in the transgenic line in both control and the shocked
flowers However heat shock treatment contributed to significantly increase the peroxidase activity
in transformed flowers (Fig 36)
80
5 CONCLUSION
Most of the works studied the effects of temperature on anthocyanin accumulation has dealt with
the effects on the biosynthesis of anthocyanins (Mori et al 2007)
Yamane et al (2006) discussed the possibility of the contribution of another mechanism (eg
anthocyanin degradation) to the inhibitory effect of high temperature on anthocyanin accumulation
To date no report has demonstrated the enhancement of anthocyanin degradation due to high
temperature in plant tissue Hence the present study is the pioneer to show that the mechanism of
anthocyanin loss in grape skins due to high temperature involves not only the inhibition of
anthocyanin biosynthesis but also its enzymatic degradation
As to the results of this research and the literatures (Vaknin et al 2005 Mori et al 2007) among
the different candidates peroxidases (PODs) are reputed to be the main responsible for degrading
the anthocyanin pigment in vivid tissues
There are many isoforms of Peroxidases gene in different organs of grape that among them only 6
isoforms are reported to be more expressed in berry skin from veraison to harvest (Fasoli et al 2012
and Mori et al 2007)
Therefore in order to recognize the most important gene that encodes the peroxidase enzyme in
Sangiovese grape under stress condition selected isoforms of POD were isolated from Vitis vinifera
(cv Sangiovese) berries and transformed to Petunia hybrida Afterward the expression of the POD1
gene and the activity of the peroxidase enzyme were assessed in the transgenic petunia and were
compared to the wild type line under the stress condition
The obtained results could confirm that the level of total anthocyanin was decreased in the living
Petunia suffered from the heat stress this was under the circumstance that the level of the
peroxidase enzyme was significantly higher in those plants
On these bases it can be figured out that peroxidases can be considered as the responsible for
anthocyanin degradation in living tissues and the decrease of total anthocyanin content in the plants
faced to an abiotic stress such as the excessive high temperature What is more among the different
isoforms of the tested peroxidases genes the POD 1 isoform (with the sequence mentioned before)
can be identified as one of the propellant in this respect
81
Chapter two
Effects of late-season source limitations induced by trimming on grape
composition during ripening in Vitis vinifera cv Sangiovese
82
1 INTRODUCTION
Grape wine production showed a higher sensitivity to climate variability and the ongoing climatic
changes have already caused phenological alterations in some viticultural areas and are expected to
continue in the future (Jones et al 2005 Schultz 2000 Duchene and Schneider 2005) Besides
over the last fifty years an overall upgrading of vineyard management techniques which lead to a
general wine quality improvement has been verified As consequence in wine regions where heat
summations largely exceed technological requirements for the grown grape varieties a too high
level of sugar and subsequent wine alcohol excess low acidity alteration of aroma composition
and in black varieties unbalanced phenolic ripening with insufficient berry skin colour has been
shown at harvest
Accumulation of sugars is probably more responsive to temperature variations than accumulation of
anthocyanins because the optimal temperature for sugars biosynthesis and transport ranges from 8
to 33 degC while for anthocyanin pathway range from 17 to 26 degC Moreover high temperatures
(above 30-35 degC) have been the inhibitor of anthocyanin accumulation (Kliewer 1970- 1977 Mori
et al 2007 Movahed 2011) The relationship between tannins and high temperature is not clear but
some authors reported that seed tannin concentration was less susceptible to changes in temperature
conditions respect to anthocyanins (Cortell et al 2007a Ristic et al 2007) Moreover while soluble
solids and anthocyanins sysnthesis starts at veraison tannins were produced several weeks before
veraison and then their concentration in the berry starts to decrease following by a plateau at later
berry ripening stages (Kennedy et al 2000 2002) In other word it seems that there are differential
effects of temperature increase on the evolution of different berry traits in particular when they
occure after veraison On these bases the hypothesis is that the slowing down of sugars
accumulation rate may allow to achieve full ripeness of phenolic compounds mainly anthocyanins
and tannins As well known fruit sugar accumulation can be decreased by grape-growers for
example via bud load and yield increases but for the production of high quality wine it is not
allowed to exceed foreseen thresholds by the Appellation rules
A different approach to slow down sugar accumulation is represented by source limitation as the rate
of soluble solids increase in berries is well related to the ratio between leaf area to yield (Kliewer
and Dokoozlian 2005) In particular several researches showed that the removal around veraison of
the more young and efficient part of the canopy may be effective in reducing sugar accumulation
(Reynolds and Wardle 1989 Intrieri et al 1983 Intrieri 1994)
Although the relationship between sugar accumulation and leaf area to yield ratio is well
documented the evolution of some phenolic compounds in relation to leaf area efficiency and sugar
83
content in berries remain unclear Sugar has been shown to stimulate anthocyanin accumulation in
grape (Pirie and Mullins 1976 Larronde et al 1998 Hiratsuka et al 2001 Gollop et al 2002) but
it has been also reported that anthocyanins exhibit an initial phase of rapid increase strongly
correlated to sugar accumulation and a second phase where anthocyanins and sugars are uncoupled
(Guidoni et al 2008)
Moreover several studies with red wine cultivars in which crop was adjusted by means of cluster
thinning increasing the leaf area to yield ratio resulted in improved soluble solids anthocyanins
total phenols and colour intensity (Filippetti et al 2007 Pastore et al 2011Guidoni et al 2002
Reynolds et al 1994)
As well known the prediction of wine colour and quality based on berry composition is a difficult
task but the aim of this trial is to understand (i) if post veraison trimming is effective to slow down
the rate of sugar accumulation and (ii) to verify the possible derived alterations after treatment in
anthocyanins and tannins accumulation and in their compositional changes during ripening
compared to control in Vitis vinifera L cultivar Sangiovese
2 MATERIAL AND METHODS
This trial was conducted in 2009 2010 and 2011 on Sangiovese vines (V vinifera L clone 12T
grafted on 3309C) planted in 1994 in Ozzano Emilia Bologna Italy (44deg25N 11deg28E) Vines were
spaced 15 m on the row and 3 m between the rows and they were trained to Free Cordon (16 buds
per vine)
Twenty-four vines in four blocks (6 vines per block) were randomLy assigned within each block to
the following treatments
a) Non-trimmed control (C)
b) Shoot trimming 1 week after full veraison which left 8 nodes on every main shoot (TRIMM)
Trimming was performed when berry sugar concentration reached around 15deg -18deg Brix and
precisely 6th August 2009 (17 days after veraison) 10th August 2010 (17 days after veraison) and
4th August 2011 (6 days after veraison)
21 Vegetative and yield data
In each year before trimming and at harvest two regressions between shoot length (main and
lateral) and their actual leaf area were calculated and used to estimate leaf area of all tested vines At
84
trimming the main and lateral leaves were removed and leaf area was measured with a leaf area
meter (LI-3000A Li-Cor Bioscences Lincoln Nebraska USA) At harvest time the crops of each
individual plant were gathered separately and the number of clusters and their weights were
recorded
Weather data (mean daily air temperature and rainfall) were recorded from April to September in the
both years at a meteorological station located close to the experimental site
22 Berry sampling
In each year every ten days from veraison to harvest samples of 20 berries per plant were
collected pooled per each block (120 berries) and divided in three subsamples (40 each) for
determinations of the following parameters
a) Berry weight and must biochemical parameters (soluble solids pH and titratable acidity) on 20
berries performed immediately after sampling
b) Skin anthocyanins on 10 berries immediately stored in -20deg C and kept there until the analyses
c) Skin and seed tannins on 10 berries immediately stored in -20deg C and kept there until the
analyses
23 Analyses of main must biochemical parameters
The 20 sample berries were crushed and the must were sieved and used for degBrix analysis by a
temperature-compensating CR50 refractometer (Maselli Misure Spa PR Italy) Five mL of the
same must were then diluted 7 times with bi-distilled water and used to perform a titration reaction
by a Crison Compact Tritator (Crison Barcelona Spain) with 1N 05 N or 025 N NaOH (Sigma-
Aldrich St Louis MO USA) according to the stage of berry ripening to obtain pH and Titratable
Acidity (TA) data (expressed as gl of tartaric acid equivalents)
24 Analyses of skin anthocyanins
The berries sampled were weighted before the extraction of anthocyanins Then the skin was
carefully removed from the pulp and immerged in 50 mL of HPLC-grade methanol (Carlo Erba
Reagents Milano Italy) and were kept in dark for 24 hours The day after the extract was
separated from the skin residues and conserved at (-20degC) until the analysis
85
HPLC separation and quantification of anthocyanins were performed on a Waters 1525 instrument
equipped with a diode array detector (DAD) using a reversed-phase column Phenomenex (Castel
Maggiore BO Italy) RP18 250 mmx4mm (5microM) with precolumn The eluents used were the
following A= HClO4 03 in milliQ water B = methanol
The methanol extract was filtered through 022 microm 13mm PTFE syringe-tip filters (Teknokroma
Barcelona Spain) and an aliquot of 270microL was diluted to final volume of 1mL with the A eluent
The binary gradient was the same as reported in Mattivi et al (2006) with suitable modifications
The time for column equilibration was 5 minutes and the injection volume was 60 microL Separation of
the main free anthocyanins was obtained at 43 degC and they were quantified at 520 nm with a
calibration curve with malvidin-3-glucoside (Sigma-Aldrich ST Louis MO USA)
25 Tannins analysis
To extract proanthocyanidins the sampled berries (skins and seeds) were ground separately to a fine
powder under liquid N2 01 gr aliquots were separated and extracted in darkness in 2 mL screw-top
Eppendorf tubes for 24 hours with 70 acetone (10 mL) containing 01 ascorbate to prevent
oxidation of polyphenols Samples were then centrifuged (15 min 13000 g) and two 400 μL
aliquots of the supernatant were transferred to fresh tubes and dried down under vacuum at 35ordmC for
120 minutes
One of them was re-suspended in 100 μL methanol acidified with 1 HCl then neutralised with 100
μL sodium acetate (200 mM pH 75) for the analysis of free monomers The other aliquot
underwent acid-catalysed cleavage of the proanthocyanidins in the presence of excess
phloroglucinol following the method of Kennedy and Jones (2001) Briefly the dried sample was
resuspended in 100 μL of phloroglucinol buffer (025 g ascorbate 125 g phloroglucinol 215 μL
conc HCl 25 mL methanol) and incubated at 50ordmC for 20 minutes then neutralised with 100 μL of
sodium acetate (200 mM pH 75) and centrifuged (15 min 13000 g)
A 200 μL aliquot each of the acetone extract the acetone extract after acid catalysed cleavage and
the residue after cleavage was then transferred to Sunbroker 250 μL reduced volume HPLC
autosampler vials Samples were run on a Waters 1525 instrument equipped with a diode array
detector (DAD) using a reversed-phase column Phenomenex (Castel Maggiore BO Italy) RP18
250 mmx4mm (5microM) with precolumn A separate reversed-phase HPLC method was developed for
the cleaved and uncleaved proanthocyanidin samples reading absorbance at 280 nm Uncleaved
samples solvent A 02 phosphoric acid solvent B 41 acetonitrile02 phosphoric acid
86
(gradient of solvent B zero min 0 5 min 10 40 min 10 55 min 17 65 min 19 75
min 19 80 min 100 85 min 100 86 min 0) Cleaved samples solvent A 02 acetic
acid solvent B methanol (gradient of solvent B zero min 1 40 min 1 120 min 30 1201
min 100 125 min 100 126 min 1) For both methods 25 μL of sample was injected and run
at 30ordmC with a flow rate of 1 mLmin Concentrations of free monomers and hydrolysed terminal
subunits were determined from standard curves prepared from commercial standards of catechin
epicatechin epigallocatechin and epicatechin-gallate obtained from Extrasynthese (France) The
concentration of extension subunit-phloroglucinol adducts was calculated from published molar
extinction coefficients (Kennedy amp Jones 2001)
3 RESULTS AND DISCUSSION
31 Climatic data
The Growing Degree Days (GDD 10 degC baseline) from April 1st to September 30th (Table 8 Fig
37) were highest in 2011 (2054) and lowest in 2010 (1718) Moreover the average daily temperature
recorded from veraison to harvest in 2011 was mostly (70 of the period) above 25deg C In addition
in 2011 the level of the rainfall from April to September was only 136 mm whereas in 2010 the
rainfall in the same period was found to be three times more (Table 8 Fig 37)
Table 8 The climatic conditions in 2009 2010 and 2011
Year Rain from April to
September (mm)
DD from April to
September (degC)
Number of days with average daily
temp gt 25deg C from veraison to
harvest
2009 269 1963 24
2010 390 1718 7
2011 136 2054 29
87
Fig 37 The yearly recorded rainfall and daily average temperature from April 1 to September of 2009 2010 and 2011
32 Vegetative and productive traits
All vines were quite uniform in terms of leaf area before trimming in all years (data not shown) The
TRIMM treatment induced a leaf area reduction around 60 in 2009 and 2010 and around 40 in
2011 compared to control The trimming of the upper part of the canopy affected mostly the laterals
compared to the main leaves especially in 2010 (Table 9) It is interesting to note that in 2010 a
significant higher leaf area was recorded compared to 2009 probably due to the more favourable
seasonal climatic conditions during the first phase of shoots growth No laterals re-growth was
measured after treatments in all years
88
Starting from a uniform bunch number per meter of cordon yield cluster weight and berry weight
were unaffected by treatments in 2009 (Table 9) In 2010 and 2011 yield and cluster weight were
significantly lower in TRIMM vines compared to control while berry weight didnrsquot show any
difference A year-by-year variability in terms of yield was verified In 2010 yield was significantly
higher than in 2009 and 2011 for both treatments and due to the setting of uniform buds and
clusters number per vine it might be almost entirely a result of cluster weight increase (Table 9)
Berry weight did not differ between treatments during ripening (Fig38) in all the tested years
Moreover the number of berries per cluster was significantly lower in TRIMM vines compared to C
in 2010 and 2011 (Table 9)
At harvest the leaf areayield ratio was reduced in TRIMM vines to very low values corresponding
to 038 and 039 m2kg in 2009 and 2010 respectively compared to 101 and 082 m
2kg in the
control vines which are considered optimal for ripening in Free Cordon (Table 9) In 2011 probably
due to the low yield level registered in TRIMM vines the leaf area yield ratio reached a value of
093 m2kg which was not significantly different from C and that may allow an optimal ripening
(Table 9)
Despite we did not evaluate the starch content in the different parts of the tested vines it would be
expected that the TRIMM vines subjected to leaf area reduction ranging from 40 to 60 after
veraison induced further remobilization of reserves (Candolfi-Vasconcelos et al 1994) The
possible carbohydrate reserve depletion in 2009 and 2010 induced by defoliation could be
responsible for yield constraint mainly due to reduction of flower numbers per inflorescence
(Scholefield et al 1977 Bennett et al 2005)
89
Table 9 Vegetative growth and yield components recorded over 2009ndash2011 in C and TRIMM vines
Parameters 2009 2010 2011 Year
effect
Year x
Treatment
Interaction
C TRIMM C TRIMM C TRIMM
Main LA after
trimming
(m2m of cordon)
144 a 056 b 177 a 096 b 121 a 071 b ns ns
Laterals LA after
trimming
(m2m of cordon)
079 a 025 b 112 a 018 b 059 a 030 b ns ns
Total LA after
trimming
(m2m of cordon)
223 a 081 b 289 a 114 b 180 a 101 b ns
Cluster
(nm of cordon)
105 a 106 a 111 a 102 a 101 a 102 a ns ns
Yield
(kgm of cordon)
22 a 21 a 35 a 29 b 143 a 108 b ns
Cluster weight (g) 2108
a 1966 a
3121
a 2868 b 1473 a 1045 b ns
Berry weight (g) 155 a 153 a 170 a 169 a 128 a 123 a ns
Berries per cluster (n) 136a 1285a 1835a 1697b 1150a 850b ns
Leaf area yield
(m2kg)
101a 038b 082a 039b 125a 093a ns
Different letters indicate mean separation between treatments C and TRIMM within rows and years by t -test P = 005
P = 001 year x treatment interaction indicate mean separation within rows and years by t-test
90
Fig 38 Berry weight in the control and trimmed vines from veraison to harvest of the years 2009
2010 and 2011
33 Ripening analyses Soluble solids pH and Total Acidity
In 2009 and in 2010 TRIMM vines had significant lower soluble solids concentration (degBrix) at
harvest compared to C but no significant effect was recorded in 2011(Fig 39) TA and pH did not
show any difference between treatments in all years (Table 10) Daily soluble solids accumulation
rate has been reduced after trimming in 2009 and 2010 of 8 and 16 and not at all in 2011
compared to control vines
In 2011 the extremely hot and dry climatic conditions led to an acceleration in the accumulation of
soluble solids so that 23 days after veraison the degBrix level of C reached the 24 degBrix (Fig 39)
while in 2009 and 2010 this value was reached respectively 42 and 58 days after veraison Under
91
such circumstances associated with a general lower level of yield in 2011 compared to the previous
years the grapes of TRIMM vines did not show differential accumulation rate and no significant
difference was recorded in berry composition compared to Control in this year This result is in
agreement with the high value of leaf area to yield ratio (Table 9) measured in TRIMM vines in
2011 which is considered adequate to allow an optimal ripening
Fig 39 degBrix in the control and trimmed vines from veraison to harvest of the years 2009 2010 and 2011
92
34 Anthocyanins accumulation during ripenning
Total anthocyanin concentration (mgkg) did not differ among treatments during ripening in all the
experimental years (Fig40) and no variation was registered at harvest (Table 10) Although no
difference was recorded among the treatments the anthocyanins concentrations were different
among the years (Fig40) The lowest anthocyanin value at harvest was registered to be in 2009 and
the maximum was observed in 2011 (Fig40) These results do not seem correlated with the different
temperature trend in the experimental years because in the both 2009 and 2011 the temperature
exceeded to the critical value for anthocyanin accumulation for periods with similar length Having
the lowest berry weight in 2011 is probably the reason of the highest anthocyanin value registered at
harvest in the grapes of both treatments as compared to the previous years (Table 9 10)
Notably no relation has been verified between the reduction in soluble solids accumulation
occurred in 2009 and in 2010 and variation in anthocyanins accumulation
In particular in 2009 when the trimming was effective in slowing down the rate of sugar
accumulation the correlation between total anthocyanin content (mg per berry) and berry juice
soluble solids concentration showed similar curves for TRIMM and C (Fig 41) Both treatments
showed an increasing positive trend between 10deg Brix to 22deg Brix where there is a peak
concentration and a decline in anthocyanins during the latter stage of ripening (Fig 41) Our results
are in acordance with Guidoni et al (2008) who demonstrated that anthocyanins may accumulate in
a two-phase process with an initial phase of rapid increase and a second phase where anthocyanins
and sugars are uncoupled
As other authors pointed out sugar accumulation was shown to be more strictly associated to
thermal time whereas anthocyanin accumulation was also affected by other sources of variations
(water yield and climatic conditions) (Sadras et al 2007) and in general displays a much wider
range of variation than that of sugars
93
Fig 40 The anthocyanin concentration in the control and trimmed vines from veraison to harvest of the years 2009
2010 and 2011
Fig 41 The correlation between the total anthocyanin content and berry soluble solids concentration in the control and
trimmed vines from veraison to harvest of the year 2009
94
Besides the analysis of the anthocyanin composition at harvest did not show significant difference
between the treatments in all the three years The percentage of delfinidid 3-G cyanidin 3-G
peonidin 3-G petunidin -3-G and malvidin 3-G in berries of TRIMM and C vines showed the
typical Sangiovese grape profile with high level of cyanidin 3-G and malvidin 3-G (Fig 42) It
seems that the biosynthesis of each individual anthocyanin is not influenced by the variation of
sugar concentration in the berries at harvest as occurred in 2009 and 2010
Moreover the trimming treatment did not modify cluster microclimatic conditions which are found
to be responsible for anthocyanin profile changes as reported after cluster shading (Downey et al
2004) and temperature variation (Mori et al 2005)
Fig 42 The anthocyanin profile in the berry skin of control and trimmed vines at harvest of the years 2009 2010 and
2011
95
35 Tannins accumulation during ripenning
In all experimental years trimming did not affect the evolution of seed and skin tannins
concentration expressed as mg per kg of berries during ripening and at harvest (Table 10 Fig 43 45
and 47) The tannins were expressed as mg per kg of berries as no differences were recorded
between treatments in berry weight during ripening (Fig 38)
Similar to what was previously reported on different varieties (Harbertson et al 2002 Kennedy et
al 2002 Downey et al 2003) the levels of seed tannins were higher compared to skin tannins at
veraison but declined during ripening The levels of berry skin and seed tannins reached to nearly
equal levels at harvest (Table 10 Fig 43 45 and 47) By evaluating the seed monomers and
polymers tannins the similar trends were observed in all treatments during ripening and their
concentration (mgkg of berries) in seed polymers was considerably higher than in its monomers as
expected
As well as that the berry tannins composition was assessed from veraison to harvest in each year
and the evolution of all four flavan-3-ols (catechin epicatechin epigallocatechin and epicatechin-
gallate) followed the same tendency between treatments (Fig 44 46 and 48) And among them
epicatechin is the major and catechin is the minor constituent of berry tannins (Fig 44 46 and 48)
Our results assessed that the concentration and composition of each group of tannins compounds at
harvest were not affected by trimming treatment after veraison also when this technique was able to
reduce sugar accumulation rate Moreover it appeared that the concentration of each flavan 3 ols
(catechin epicatechin epigallocatechin and epicatechin-gallate) remains almost constant in the last
thirty days before harvest revealing that both tannins composition and content may be not
responsable of different level of astringency in wine obtained from grapes at different degree of
ripening In other words our results seem to assess a very low effectiveness of the determinations of
each compound in prediction of wine astringency traits As previously pointed out by several
authors the extractability and solubility of each group of flavonoid compounds during ripening may
play an important rule to understand the relationships between berry composition wine composition
and sensory properties of wine
96
Fig 43 The tannins concentration of berry seed and skin in the control and trimmed vines from veraison to harvest of
the year 2009
Fig 44 The tannins composition in the control and trimmed vines from veraison to harvest of the year 2009
97
Fig 45 The tannins concentration of berry seed and skin in the control and trimmed vines from veraison to harvest of
the year 2010
Fig 46 The tannins composition in the control and trimmed vines from veraison to harvest of the year 2010
98
Fig 47 The tannins concentration of berry seed and skin in the control and trimmed vines from veraison to harvest of
the year 2011
Fig 48 The tannins composition in the control and trimmed vines from veraison to harvest of the year 2011
99
Table 10 Berry composition in the control and trimmed vines at harvest of the years 2009 2010 and 2011
Parameters 2009 2010 2011 Year x
Treatment
Interaction C TRIMM C TRIMM C TRIMM
Soluble solids (degBrix) 252 a 246 b 237 a 23 b 264 a 272 a ns
Total acidity (gl) 738 a 723 a 779 a 796 a 844 a 891 a ns
pH 353 a 347 a 339 a 336 a 339 a 336 a ns
Total anthocyanins
(mgkg berries)
7961 a 8381 a 11177 a 11200 a 17080 a 18100 a
Total tannins 3506 a 3547 a 3330 a 3107 a 3699 a 3522 a ns
Total tannins in skin 1006 a 1196 a 1466 a 1243 a 1697 a 1722 a ns
Total tannins in seed 2600 a 2352 a 1864 a 1864 a 2002 a 1800 a ns
4 CONCLUSION
The source limitation by trimming after veraison showed some perspectives to achieve lower sugar
accumulation in grape and lower alcohol potential in wines without inducing modification in the
evolution of the main assessed flavonoids compounds (skin anthocyanins total seeds and skin
tannins concentration and profile) in Sangiovese berries
The efficiency of this technique seems to be strongly depending from the vines starch supply as the
possible carbohydrate reserve depletion induced year over year by trimming may be responsible for
self regulation mechanism of yield constraint verified in the second and third year of the trial In this
condition the leaf area cutback after veraison is counterbalanced by the yield lowering and no effects
is obtained in lowering sugar accumulation as the leaf area yield ratio is maintained to high level
Probably the low fertility condition of the vineyard site and the lack of irrigation system may have
promoted this mechanism
Further researches on photosynthetic limitation after veraison to reduce sugar accumulation will be
focused on vines in different soil fertility condition and on the evaluation of the extractability of
tannins from seeds and skins in wines or wine-like solutions derived from this treatment
100
5 GENERAL CONCLUSION
Wine grape must deal with serious problems which occur due to the unfavorable climatic conditions
resulted from global warming
The excessive elevated temperatures are critical for grapevine and contribute to degradation of grape
and wine quality As an illustration elevated temperature is an important factor that can negatively
affect anthocyanin accumulation in grape Particularly cv Sangiovese was identified to be very
sensitive to such condition The expressions of the genes involved in flavonoid biosynthesis were
observed to be affected by temperature The quantitative real-time PCR analysis showed that
flavonoid biosynthetic genes were slightly repressed by high temperature As well as that the heat
stress showed to repress the expression of the transcription factors VvMYBA1 that activates the
expression of UFGT
Moreover high temperatures showed to had repressing effects on the activity of the flavonoids
biosynthetic enzymes PAL and UFGT
Anthocyanin accumulation in berry skin is due to the balance between its synthesis and oxidation
In grape cv Sangiovese the gene transcription and activity of peroxidases enzyme was found to be
elevated by heat stress as a defensive mechanism of ROS-scavenging
Even if different antioxidant enzymes have been recognized to be involved in flavonoids
degradation under various abiotic stresses this research identifies peroxidases as one of the best
candidate to oxidize anthocyanins actively
Between many isoforms of peroxidases genes which are expressed in grape berry skin from
veraison to harvest one peroxidase gene (POD 1) induced in Sangiovese grape under thermal stress
condition was isolated and evaluated via the technique of genes transformation from grape to
Petunia flower Reduction in anthocyanins concentration in POD 1 transformed Petunia flowers was
assessed after thermal stress conditioning compared to untrasformed control
Biochemical and molecular studies confirmed the role of peroxidases enzyme in active anthocyanins
degradation in Sangiovese cv grape skin under temperature stress conditions Based on our results
a similar mechanism that will be object of further investigation may be supposed for flavonols
degradation In conclusion this study showed that the temperature regimes after veacuteraison have
different effects on each flavonoid group Although the anthocyanin proanthocyanidin and flavonol
share the main part of their biosynthetic pathway no effects were obtained regarding any changes in
the biosynthesis of the proanthocyanidins under these different thermal ripening conditions
101
Moreover the present study is the pioneer to approve that the mechanism of anthocyanin loss in
grape skins due to high temperature involves not only the inhibition of anthocyanin biosynthesis but
also its enzymatic degradation
What is more in wine producing regions it is inevitable for the grape growers to adopt some
adaptive strategies to alleviate grape damages to abiotic stress conditions It is necessary to
ameliorate the vintage through improvement of management techniques to face the impacts of
undesirable climatic conditions Therefore in this thesis the technique of post veraison trimming
was done to improve the coupling of the phenolic and sugar ripening in Vitis vinifera L cultivar
Sangiovese
Trimming after veraison allowed to limit the photosynthetic source and showed to be executable to
slow down the rate of sugar accumulation in grape (to decrease the alcohol potential in wines)
without inducing modification in the evolution of the main berry flavonoids compounds
Moreover the present research showed that the efficiency of this technique applied year after year is
related to the ability of the vines to recover charboidrate reserve to prevent self regulation
mechanism of yield constraint
Further researches need to be performed on the evaluation of the extractability of tannins from seeds
and skins in wines or wine-like solutions derived from grape on vines subjected to post veraison
photosynthetic limitation
102
REFERENCES
Adams D 2006 Phenolics and ripening in grape berries J Am J Enol Vitic Vol 57 (3) 249-
256
Alfenito MR Souer E Goodman CD 1998 Functional complementation of anthocyanin
sequestration in the vacuole by widely divergent Glutathione Stransferases J The Plant Cell Vol
101135-1149
Aron PM Kennedy JA 2008 Flavan-3-ols Nature occurrence and biological activity J Mol
NutrFood Res Vol 52 79-104
Bavaresco L Fregoni C 2001 Physiological role and molecular aspects of grapevine stilbenic
compounds In K A Roubelakis-Angelakis (Ed) Molecular biology and biotechnology of the
grapevine pp 153-182
Bennett J Jarvis PCreasy G Trought M 2005 Influence of defoliation on overwintering
carbohydrate reserves return bloom and yield of mature Chardonnay grapevines J Am J Enol
Vitic Vol 56(4) 386-393
Bergqvist J Dokoozlian N Ebisuda N 2001 Sunlight exposure and temperature effects on berry
growth and composition of Cabernet Sauvignon and Grenache in the central San Joaquin Valley of
California J Amer J Enol Vitic Vol 52 (1) 1-7
Bindi M Fibbi L Gozzini B Orlandini S Miglietta F 1996 Modelling the impact of future
climate scenarios on yield and yield variability of grapevine J Clim Res Vol 7 213ndash224
Bogs J Downey MO Harvey JS Ashton AR Tanner GJ Robinson SP 2005
Proanthocyanidin Synthesis and Expression of Genes Encoding Leucoanthocyanidin Reductase and
Anthocyanidin Reductase in Developing Grape Berries and Grapevine Leaves J Plant Physiol Vol
139 652ndash663
Bogs J Ebadi A McDavid D Robinson SP 2006 Identification of the flavonoid hydroxylases
from grapevine and their regulation during fruit development J Plant Physiol Vol 140(1) 279-
291
Boss PK Davies C Robinson S P 1996 Analysis of the expression of anthocyanin pathway
genes in developing Vitis Vinifera L cv Shiraz grape berries and the implications of pathway
regulation J Plant Physiol Vol 111 1059-1066
Boulton R 2001 The copigmentation of anthocyanins and its role in the color of red wine A
critical review J Am J Enol Vitic Vol 52 (2) 67-87
103
Braidot E Zancani M Petrussa E Peresson C Bertolini A Patui S Macrigrave F Vianello A
2008 Transport and accumulation of flavonoids in grapevine (Vitis vinifera L) J Plant signaling
and behavior Vol 3(9) 626 - 632
Broun P 2005 Transcriptional control of flavonoid biosynthesis a complex network of conserved
regulators involved in multiple aspects of differentiation in Arabidopsis J Current Opinion in Plant
Biology Vol 8(3) 272-279
Bucchetti B 2004 Effetti biochimici e molecolari della luce sulla maturazione dellrsquouva nella cv
Sangiovese Tesi di Dottorato di ricerca in Colture Arboree ed Agrosistemi Forestali e Paesaggistici
XVII ciclo Universita di Bologna
Bucchetti B Pastore C Filippetti I Intrieri C 2007 Effetti di diverse tecniche colturali sulla
sintesi di antociani in Sangiovese Poster VIII GIORNATE SCIENTIFICHE SOI 8-11052007
(SS)
Buchanan-Wollaston V Morris K 2000 Senescence and cell death in Brassica napus and
Arabidopsis In Programmed Cell Death in Animals and Plants (Garland JM ed) BIOS Scientific
Publishers pp 163ndash174
Butterfield RE Gawith MJ Harrison PA Lonsdale KJ Orr J 2000 Modelling climate
change impacts onwheat potato and grapevine in Great Britain in Downing T E Harrison P A
Butterfield R E and Lonsdale KG (eds) Climate Change Climatic Variability and Agriculture
in Europe An Integrated Assessment Final Report Environmental Change Institute University of
Oxford 411 p
Buttrose MS Hale CR Kliewer WM 1971 Effect of temperature on composition of
lsquoCabernet Sauvignonrsquo berries J Amer J Enol Vitic Vol 22 (2) 71ndash75
Calderon AA Garciaflorenciano E Munoz R Barcelo A R 1992 Gamay grapevine
peroxidase its role in vacuolar anthocyani( di)n degradation J VITIS Vol 31(3) 139ndash147
Candolfi-Vasconcelos M Candolfi M Kohlet W 1994Retranslocation of carbon reserves from
the woody storage tissues into the fruit as a response to defoliation stress during the ripening period
in Vitis vinifera L
Castellarin SD Pfeiffer A Sivilotti P Degan M Peterlunger E Di Gaspero G 2007
Transcriptional regulation of anthocyanin biosynthesis in ripening fruits of grapevine under seasonal
water deficit J Plant Cell and Environment Vol 30 1381ndash1399
Castellarin SD Di Gaspero G Marconi R Nonis A Peterlunger E Paillard S Adam-
Blondon AF Testolin R 2006 Colour variation in red grapevines (Vitis vinifera L) genomic
104
organisation expression of flavonoid 3-hydroxylase flavonoid 35-hydroxylase genes and related
metabolite profiling of red cyanidin-blue delphinidin-based anthocyanins in berry skin J BMC
Genomics Vol 7(12) 1471-2164
Chen G Asada K 1989 Ascorbate Peroxidase in tea leaves occurrence of two isozymes and the
differences in their enzymatic and molecular properties J plant cell physiol Vol 30 (7) 987-998
Chen J Wen P Kong W Pan Q Wan S Huang W 2006 Changes and subcellular
localizations of the enzymes involved in phenylpropanoid metabolism during grape berry
development J Plant phisiol Vol 163 (2) 115-127
Cheynier V Rigaud J 1986 HPLC separation and characterization of flavonols in the skin of
Vitis Vinifera var Cinsault J Am J Enol Vitic Vol 37 248-252
Christie P Alfenito M R Walbot V 1994 Impact of low temperature stress on general phenyl
propanoid and anthocyanin pathways enhancement of transcript abundance and anthocyanin
pigmentation in maize seedlings J Planta Vol 194 541ndash549
Chua CS Biermann D Goo K S Sim T 2008 Elucidation of active site residues
of Arabidopsis thaliana flavonol synthase provides a molecular platform for engineering flavonols
J Phytochem Vol 69 (1) 66ndash75
Cohen S Tarara J Kennedy J 2012 Diurnal temperature range compression hastens berry
development and modifies flavonoid partitioning in grapes J Am J Enol Vitic vol 63(1) 112-
120
Conde C Silva P Fontes N Dias A Tavares R M Sousa M Agasse A Delrot S Geroacutes
H 2007 Biochemical changes throughout grape berry development and fruit and wine quality
httphdlhandlenet18226820
Conner AJ Albert NW Deroles SC 2009 Transformation and regeneration of petunia C
Springer Springer Science+Business Media LLC Chapter 19 pp 395-409
Coombe B G 1992 Research on Development and Ripening of the Grape Berry J Am J Enol
Vitic Vol 43(1) 101-110
Cortell JM M Halbleib AV Gallagher T Righetti and JA Kennedy 2007a Influence of vine
vigor on grape Vitis vinifera L cv Pinot noir) anthocyanins 1 anthocyanin concentration and
composition in fruit J Agrie Food Chem 556575-6584
Darneacute G 1993 New hypothesis on anthocyanin biosynthesis in berries and leaves of grapevine J
Vitis Vol 32 77-85
105
Dat JF Foyer CH Scott IM 1998 Changes in salicylic acid and antioxidants during induced
thermotolerance in mustard seedlings J Plant Physiol Vol 118 1455ndash1461
Davies KM Schwinn KE 2003 Transcriptional regulation of secondary metabolism J
Functional Plant Biology Vol 30(9) 913 ndash 925
Dela G Or E Ovadia R Nissim-Levi A Weiss D Oren- Shamir M 2003 Changes in
anthocyanin concentration and composition in lsquoJaguarrsquo rose flowers due to transient
hightemperature conditions J Plant Sci Vol 164 333ndash340
Deluc L Bogs J Walker AR Ferrier T Decendit A Merillon JM Robinson SP Barrieu
F 2008 The transcription factor VvMYB5b contributes to the regulation of anthocyanin and
proanthocyanidin biosynthesis in developing grape berries J Plant Physiol Vol (147) 2041ndash2053
Dokoozlian NK 2000 Grape berry growth and development Raisin Production Manual Chapter
5 pp 30- 37
Downey MO Dokoozlian NK Krstic MP 2006 Cultural Practice and environmental Impacts
on the flavonoid composition of grapes and wine A review of recent research J Amer J Enol
Vitic Vol 57 (3) 257-268
Downey MO Harvey JS Robinson SP 2003 Analysis of tannins in seeds and skins of Shiraz
grapes throughout berry development J Aust J Grape Wine Res Vol 9 15-27
Downey MO Harvey JS Robinson SP 2003 Synthesis of flavonols and expression of
flavonol synthase genes in the developing grape berries of Shiraz and Chardonnay (Vitis Vinifera
L) J Aust J Grape Wine Res Vol 9 110-121
Downey MO Harvey JS Robinson SP 2004 The effect of bunch shading on berry
development and flavonoid accumulation in Shiraz grapes J Aus J Grape Wine Res Vol 10 55-
73
Dry I B Robinson S P 1994 Molecular cloning and characterization of grape berry polyphenol
oxidase J Plant Molecular Biology Vol 26 495-502
Duchene E Schneider C 2005 Grapevine and climatic changes a glance at the situation in
Alsace Agron J Sustain Dev Vol 25 93ndash99
Fasoli M Dal Santo S Zenoni S Tornielli GB Farina L Zamboni A Porceddu A
Venturini L Bicego M Murino V Ferrarini A Delledonne M Pezzotti M 2012 The
grapevine expression atlas reveals a deep transcriptome shift driving the entire plant into a
Maturation Program J The Plant Cell Vol 24 3489ndash3505
Ferrini F Mattii GB Nicese FP 1995 Effect of Temperature on Key Physiological Responses
of Grapevine Leaf J Am J Enol Vitic Vol 46(3) 375-379
106
Filippetti I 2009 Technological and Phenolic ripening synchronization in winegrape Data has not
been published
Filippetti I Ramazzotti S Centinari M Bucchetti B Intrieri C 2007 Effects of cluster
thinning on grape composition experience ldquoSangioveserdquo grapevines Proc Int Workshop on
Advance in Grapevine and Wine Research
Fournand D Vicens A Sidhoum L Souquet JM Moutounet M Cheynier V 2006
Accumulation and extractability of grape skin tannins and anthocyanins at different advanced
physiological stages J Agric Food Chem Vol 54 7331-7338
Fraser E 2008 ldquoCrop yield and climate changerdquo Retrieved on 2009-09-14
Fujita A Soma N Goto-Yamamoto N Mizuno A Kiso K Hashizume K 2007 Effect of
shading on proanthocyanidin biosynthesis in the grape berry J Japan Soc Hort Sci Vol 76 112-
119
Fujita A Goto-Yamamoto N Aramaki I Hashizume K 2006 Organ-Specific Transcription
of Putative Flavonol Synthase Genes of Grapevine and Effects of Plant Hormones and Shading on
Flavonol Biosynthesis in Grape Berry Skins J Biosci Biotech and Biochem Vol 70 (3) 632-
638
Gagneacute S Lacampagne S Claisse O Geacuteny L 2009 Leucoanthocyanidin reductase and
anthocyanidin reductase gene expression and activity in flowers young berries and skins of Vitis
vinifera L cv Cabernet-Sauvignon during development J Plant Physiol amp Biochem Vol 47 (4)
282ndash290
Gatto P Vrhovsek U Muth J Segala C Romualdi C Fontana P Pruefer D Stefanini M
Moser C Mattivi F Riccardo Velasco R 2008 Ripening and genotype control stilbene
accumulation in healthy grapes J Agric Food Chem Vol 56 (24) 11773ndash11785
Gollop R Even S Colova-Tsolova V Peri A 2002 Expression of the grape dihydroflavonol
reductase gene and analysis of its promoter region J Exp Bot Vol 53 1397ndash1409
Gollop R Farhi S Perl A 2001 Regulation of the leucoanthocyanidin dioxygenase gene
expression in Vitis vinifera J Plant Sci Vol 161 (3) 579ndash588
Goto-Yamamoto N Mori K Numata M Koyama K Kitayama M 2009 Effects of
temperature and water regimes on flavonoid contents and composition in the skin of red-wine
grapes J Int Sci Vigne Vin Vol 43 (1) 75-80
Goto-Yamamoto N Wan GH Masaki K Kobayashi S 2002 Structure and transcription of
three chalcone synthase genes of grapevine (Vitis vinifera) J Plant Sci Vol 162 867-872
107
Greer D H Weston C 2010 Heat stress affects flowering berry growth sugar accumulation and
photosynthesis of Vitis vinifera cv Semillon grapevines grown in a controlled environment J
Functional Plant Biol Vol 37(3) 206ndash214
Guidoni S Ferrandino A Novello V 2008 Effects of seasonal and agronomical practices on
skin anthocyanin profile of Nebbiolo grapes JAm J Enol Vitic Vol 59(1) 22-29
Guidoni S Ferrandino A Novello V 2004 Ruolo del clima e degli interventi colturali sulla
sintesi degli antociani nellrsquouva (Vitis Vinifera L cv Nebbiolo) J Quad Vitic Enol Univ Torino
27
Guidoni S P Allara and A Schubert 2002 Effect of cluster thinning on berry skin anthocyanin
composition of Vitis vinifera cv Nebbiolo Am J Enol Vitic V 53224-226
Harbertson JF Kennedy JA Adams DO 2002 Tannin in skins and seeds of Cabernet
Sauvignon Syrah and Pinot noir berries during ripening J Am J Enol Vitic Vol 53 (1) 54-59
Hardie WJ OrsquoBrien TP Jaudzems VG 1996 Morphology anatomy and development of the
pericarp after anthesis in grape Vitis vinifera L J Aust J Grape Wine Res Vol 2 97ndash142
Haselgrove L Botting D Van Heeswijck R Hoslashj PB Dry PR Ford C Iland PG 2000
Canopy microclimate and berry composition The effect of bunch exposure on the phenolic
composition of Vitis vinifera L cv Shiraz grape berries J Aust J Grape Wine Res Vol 6 141-
149
Hawker JS 1969a Changes in the activities of enzymes concerned with sugar metabolism during
the development of grape berries J Phytochem Vol 8 9-17
Hawker JS 1969b Insoluble invertase from grapes an artefact of extraction J Phytochem Vol
8 337-344
Hellens RP Edwards EA Leyland NR Bean S Mullineaux PM 2000 pGreen a versatile
and flexible binary Ti vector for Agrobacterium-mediated plant transformation J Plant Mol Biol
Vol 42 819-832
Hiratsuka S Onodera H Kawai Y Kubo T Itoh H Wada R 2001 ABA and sugar effects on
anthocyanin formation in grape berry cultured in vitro J Scientia Horticulturae Vol 90 (1-2) 121-
130Hrazdina G Parsons GF Mattick LR 1984 Physiological and biochemical events during
development and maturation of grape berries J Amer J Enol Vitic Vol 35 (4) 220ndash227
Huglin P 1978 Nouveau Mode drsquoEacutevaluation des Possibiliteacutes Heacuteliothermiques drsquoun Milieu
Viticole CR Acad Agr France Vol 64 1117-1126
Hugueney P Provenzano S Verriegraves C Ferrandino A Meudec E Batelli G Merdinoglu D
Cheynier V Schubert A Ageorges A 2009 A novel cation-dependent o-methyltransferase
involved in anthocyanin methylation in grapevine J Plant Physiol Vol 150 (4) 2057- 2070
108
Intrieri C 1994 Vini frizzanti interventi agronomici per il controllo della maturazione J
Lrsquoenotecnico Vol 9 65-72
Intrieri C Magnanini E Silvestroni O 1983 Effetti della potatura verde sul comportamento
vegetativo e produttivo di Albana e Sangiovese J Vignevini Vol 5 57-62
Intrieri C Silvestroni O Poni S 1994 ndash Pluker nuova defogliatrice polivalente per vigneti
Vignevini Vol 1-2 25 ndash 31
involvement of leucoanthocyanidin dioxygenase J Planta Vol 229( 2) 427-445
J Planta Vol 192(4) 567-573
Jackman RL Smith JL 1996 Anthocyanins and betalains In Hendry GAF Houghton JD eds
Natural food colorants 2nd
edn London Chapman amp Hall pp 244ndash309
Jeong ST Goto-Yamamoto N Kobayashi S Esaka M 2004 Effects of plant hormones and
shading on the accumulation of anthocyanins and the expression of anthocyanin biosynthetic genes
in grape berry skins J Plant Sci Vol 167 247-252
Jeong ST Goto-Yamamoto N Hashizume K Esaka M 2006 Expression of the flavonoid 3prime-
hydroxylase and flavonoid 3prime5prime-hydroxylase genes and flavonoid composition in grape (Vitis
vinifera) Plant Sci Vol 170 (1) 61ndash69
Jiang YM Duan X Joyce D Zhang Z Li J 2004 Advances in understanding of enzymatic
browning in harvested litchi fruit J Food Chem Vol 88 443ndash446
Jones GV White MA Cooper OR Storchmann K 2005 Climate change and global wine
quality J Climatic Change Vol 73 319ndash343
Kader F Haluk JP Nicolas JP Metche M 1998 Degradation of cyanidin 3-glucoside by
blueberry polyphenol oxidase kinetic studies and mechanisms J Agric Food Chem Vol 46
3060ndash 3065
Kader F Nicolas JP Metche M 1999 Degradation of pelargonidin 3-glucoside in the presence
of chlorogenic acid and blueberry polyphenol oxidase J Sci Food Agric Vol 79 517ndash522
Kader F Rovel B Girardin M Metche M 1997 Mechanism of browning in fresh highbush
blueberry fruit (Vaccinium corymbosum L) Role of blueberry polyphenol oxidase chlorogenic acid
and anthocyanins J Sci Food Agric Vol 74(1) 31ndash34
Karimi M Inzeacute D Depicker A 2002 GATEWAYtrade vectors for Agrobacterium-mediated plant
transformation J Trends in Plant Sci Vol 7(5) 193ndash195
Kemp BS Harrison R Creasy GL 2011 Effect of mechanical leaf removal and its timing on
flavan-3-ol composition and concentrations in Vitis vinifera L cv Pinot Noir wine J Aust J Grape
Wine Res Vol 17(2) 270ndash279
109
Kennedy JA Jones GV 2001 Analysis of Proanthocyanidin Cleavage Products Following
Acid-Catalysis in the Presence of Excess Phloroglucinol Amer J Enol Vitic Vol 49(4) 1740-
1746
Kennedy JA Matthews MA Waterhouse AL 2000 Changes in grape seed polyphenols during
fruit ripening J Phytochem Vol 55 77-85
Kennedy JA Matthews MA Waterhouse AL 2002 Effect of maturity and vine water status
on grape skin and wine flavonoids J Am J Enol Vitic Vol 53 268-274
Kennedy JA Saucier C Glories Y 2006 Grape and Wine Phenolics History and Perspective
J Am J Enol Vitic Vol 57 (3) 239-248
Kenny GJ Harrison PA 1992 The effects of climate variability and change on grape suitability
in Europe J Wine Res Vol 3 163ndash183
King P McClellan D Smart R 2012 Effect of severity of leaf and crop removal on grape and
wine composition of Merlot vines in Hawkersquos bay vineyards J Am J Enol Vitic ajev201212020
Kliewer W M 1970 Effect of day temperature and light intensity on coloration of Vitis vinifera
grapes J Amer Soci Hort Sci Vol 95 693ndash697
Kliewer W M Torres R E 1972 Effect of controlled day and night temperatures on grape
coloration J Amer J Enol Vitic Vol 23 71ndash77
Kliewer W Dokoozlian N 2005 Leaf areacrop weight ratios of grapevines influence on fruit
composition and wine quality J Am J Enol Vitic Vol 56(2) 170-181
Kliewer WM 1966 Sugars and organic acids of Vitis Vinifera J Plant PhysiolVol 41 923-931
Kliewer WM 1977 Influence of temperature solar radiation and nitrogen on coloration and
composition of Emperor Grapes J AmJ Enol Vitic Vol 28 (2) 96-103
Kobayashi S Goto-Yamamoto N Hirochika H 2004 Retrotransposon-induced mutations in
grape skin color J Sci Vol 304 (5673) 982 p
Kobayashi S Ishimaru M Ding CK Yakushiji H Goto N 2001 Comparison of UDP-
glucose flavonoid 3-O-glucosyltransferase (UFGT) gene sequences between white grapes (Vitis
vinifera) and their spots with red skin J Plant Sci Vol 160 543-550
Kobayashi S Ishimaru M Hiraoka K Honda C 2002 Myb-related genes of the Kyoho grape
(Vitis labruscana) regulate anthocyanin biosynthesis J Planta Vol 215 924-933
Kriedemann P E 1968 Photosynthesis in vine leaves as a function of light intensity temperature
and leaf age J Vitis Vol 7 213-220
Kuznetsov V V Shevyakova N I 2007 Polyamines and stress tolerance of plants Global science
books Plant stress Vol 1(1) 50-71
110
Laget F Tondut J L Deloire A Kelly M T 2008 Climate trends in a specific Mediterranean
viticultureal area between 1950 and 2006 J Int Sci Vigne Vin Vol 42 (3) 113-123
Lakso A N Kliewer W M 1975 The Influence of Temperature on Malic Acid Metabolism in
Grape Berries J Plant Physiol Vol 56 (3) 370-372
Landy A 1989 Dynamic structural and regulatory aspects of site-specific recombination J Ann
Rev Biochem Vol 58 913ndash949
Larronde F Krisa S Decendit A Chegraveze C Deffieux G Meacuterillon J M 1998 Regulation of
polyphenol production in Vitis vinifera cell suspension cultures by sugars JPlant Cell Reports Vol
17(12) 946-950
Leyva A Jarillo J Salinas J Martinez-Zapater M 1995 Low temperature induces the
accumulation of phenylalanine ammonia-lyase and chalcone synthase mRNAs of Arabidopsis
thaliana in a light-dependent manner J Plant Physiol Vol 108 39ndash46
Lin-Wang K Micheletti D Palmer J Volz R Lozano L 2011 High temperature reduces apple
fruit colour via modulation of the anthocyanin regulatory complex J Plant Cell amp Environment
Vol 34(7) 1176ndash1190
Lo Piero A R Puglisi I Rapisarda P Petrone G 2005 Anthocyanins accumulation and related
gene expression in red orange fruit induced by low temperature storage J Agric Food Chem Vol
53 9083ndash9088
Lough J M Wigley T M L Palutikof J P 1983 Climate and climate impact scenarios for
Europe in a warmer world J Clim Appl Meteorol Vol 22 1673ndash1684
Loslashvdal T Olsen K M Slimestad R Verheul M Lillo C 2010 Synergetic effects of nitrogen
depletion temperature and light on the content of phenolic compounds and gene expression in
leaves of tomato J Phytochemistry Vol 71(5ndash6) 605ndash613
Makra L Vitaacutenyi B Gaacutel A Mika J Matyasovszky I Hirsch T 2009 Wine Quantity and
Quality Variations in Relation to Climatic Factors in the Tokaj (Hungary) Winegrowing Region
Amer J Enol Vitic Vol 60 (3) 312-321
Mann M E Bradley R S Hughes M K 1998 Global-scale temperature patterns and climate
forcing over the past six centuries J Nature Vol 392 779-787
Matsui S Ryugo K Kliewer W M 1986 Growth inhibition of Thompson Seedless and Napa
Gamay berries by heat stress and its partial reversibility by applications of growth regulators J Am
J Enol Vitic Vol 37 (1) 67-71
Mattivi F Guzzon R Vrhovsek U Stefanini M Velasco R 2006 Metabolite profiling of
grape Flavonols and anthocyanins J Agric Food Chem Vol 54 (20) 7692-7702
111
Mazza G Fukumoto L Delaquis P Girard B Ewert B1999 Anthocyanins Phenolics and
Color 426 of Cabernet Franc Merlot and Pinot Noir wines from British Columbia J Agric Food
Chem 474009-427 4017 Menting J G T Scopes R K Stevenson T W 1994
Characterization of Flavonoid 3rsquo5rsquo-Hydroxylase in Microsomal Membrane Fraction of Petunia
hybrida Flowers J Plany Physiol Vol 106 (2) 633- 642
Mazza G Miniati E 1993 Color stabilization and intensification In Mazza G Miniati E (eds)
Anthocyanins in Fruits Vegetables and Grains CRC Press Boca Raton pp 1ndash20
Meyer P Heidmann I Forkmann G Saedler H 1987 A new petunia flower colour generated
by transformation of a mutant with a maize gene J Nature Vol 330 677-678
Mol J 1998 How genes paint flowers and seeds J Trends in Plant Sci Vol 3 212-217
Morais H Ramos C Forgacs E Cserhati T Matos N Almeida V Oliveira J 2002
Stability of anthocyanins extracted from grape skins J Chromatographia Vol 56 173ndash175
Mori K Goto-Yamamoto N Kitayama M Hashizume K 2007a Loss of anthocyanins in red-
wine grape under high temperature J Experimental Botany Vol 58 (8) 1935-1945
Mori K Goto-Yamamoto N Kitayama M Hashizume K 2007a Effect of high temperature on
anthocyanin composition and transcription of flavonoid hydroxylase genes in ldquoPinot noirrdquo grapes
(Vitis vionifera) J Hortic Sci Biotechnol Vol 82 (2) 199-206
Mori K Saito H Goto-Yamamoto N Kitayama M Kobayashi S Sugaya S Gemma H
Hashizume K 2005a Effects of abscisic acid treatment and night temperatures on anthocyanin
composition in lsquoPinot noirrsquo grapes J Vitis Vol 44 161ndash165
Mori K Sugaya S Gemma H 2005b Decreased anthocyanin biosynthesis in grape berries
grown under elevated night temperature condition J Sci Hortic Vol 105 319ndash330
Movahed N Maeiyat MM 2009 Phytoremediation and sustainable urban design methods (Low
Carbon Cities through Phytoremediation) 45th ISOCARP Congress Disponible en
httpwwwisocarpnet Fecha de consulta 04 Septiembre del 2009
Movahed N Masia A Cellini A Pastore C Valentini G Allegro G Filippetti I 2011
Biochemical approaches to study the effects of temperature on grape composition in cv Sangiovese
The 17th
International GIESCO Symposium Asti Italy The proceeding PP 393- 397
Munneacute-Bosch S Alegre L 2004 Die and let live leaf senescence contributes to plant survival
under drought stress J Funct Plant Biol Vol 31 203-216
Nissim-Levi A Kagan S Ovadia R Oren-Shamir M 2003 Effects of temperature UV-light
and magnesium on anthocyanin pigmentation in cocoplum leaves J Hortic Sci Biotechnol Vol
78 61-64
112
Oren-Shamir M Levi-Nissim A 1997a Temperature effects on the leaf pigmentation of Cotinus
coggygria lsquoRoyal Purplersquo J Hortic Sci Vol 72 425ndash432
Oren-Shamir M Levi-Nissim A 1997b UV-light effect on the leaf pigmentation of Cotinus
coggygria lsquoRoyal Purplersquo J Sci Hortic Vol 71 59ndash66
Oren-Shamir M Nissim-Levi A 1999 Temperature and gibberellin effects on growth and
anthocyanin pigmentation in Photinia leaves J Hortic Sci Biotechnol Vol 74 355ndash360
Palliotti A Poni S Berrios JG Bernizzoni F 2010 Vine performance and grape composition
as affected by early-season source limitation induced with anti-transpirants in two red Vitis vinifera
L cultivars J Aust J Grape Wine Res Vol 16 426ndash433
Pastore C 2010 Reserches on berry composition in red grape agronomical biochemical and
molecular approaches Tesi di Dottorato di ricerca in Colture Arboree ed Agrosistemi Forestali e
Paesaggistici XXII ciclo Faculta di Agraria Universita di Bologna
Pereira GE Gaudillere JP Pieri P Hilbert G Maucourt M Deborde C Moing A Roil D
2006 Microclimate influence in mineral and metabolic profiles of grape berries J Agric Food
Chem Vol 54 6765-6775
Pirie A Mullins M1976 Changes in anthocyanin and phenolics content of grapevine leaf and
fruit tissues treated with sucrose nitrate and abscisic acid J Plant Physiol Vol 58(4) 468-472
Pourcel L Routaboul J M Cheynier V Lepiniec L Debeaujon I 2006 Flavonoid oxidation
in plants from biochemical properties to physiological functions JTrends in Plant Sci Vol 12 (1)
29-36
Price SF Breen PJ Valladao M Watson BT 1995 Cluster sun exposure and quercetin in
Pinot noir grapes and wine AmJ Enol Vitic Vol 46 187-194
Quattrocchio F Baudry A Lepiniec L Grotewold E 2006 The regulation of flavonoid
biosynthesis J The science of flavonoids C Springer Chapter 4 pp 97ndash122
Rebucci B Poni S Intrieri C Magnanini E Lakso A N 1997 Effects of manipulated grape
berry transpiration on post-veraison sugar accumulation J Aust J Grape Wine Res Vol 3 57-65
Reynolds A Price S Wardle D Watson B 1994 Fruit environment and crop level effects on
Pinot noir I vine performance and fruit composition in British Columbia J Am J Enol Vitic Vol
45(4) 452-459
Reynolds A Wardle D 1989 Influence of fruit microclimate on monoterpene levels of
Gewuumlrztraminer J Am J Enol Vitic Vol 40(3) 149-154
113
Ristic R Bindon K Francis LI Herderich M J Iland PG 2010 Flavonoids and C13-
norisoprenoids in Vitis vinifera L cv Shiraz relationships between grape and wine composition
wine colour and wine sensory properties J Aust J Grape Wine Res Vol 16 369ndash388
Ristic R Downey M Iland P Bindon K Francis I Herderich M Robinson S 2007
Exclusion of sunlight from Shiraz grapes alters wine colour tannin and sensory properties J Aust
J Grape Wine Res Vol 13(2)53-65
Robinson S P Davies C 2000 Molecular biology of grape berry ripening J Aust J Grape Wine
Res Vol 6 175-188
Robinson S 2006 Colour and tannin during berry development and ripening In ldquoFinishing the
jobrdquo ASVO proceedings held 21 July 2006 Mildura Vic Australia pp 11-14
Roby G Harbertson J F Adams D A Matthews M A 2004 Berry size and vine water
deficits as factors in winegrape composition anthocyanins and tannins J Aust J Grape Wine Res
Vol 10 100- 107
Rolland F Baena-Gonzalez E Sheen J 2006 Sugar sensing and signaling in plants Conserved
and novel mechanisms J Ann Rev Plant Biol Vol 57 675-709
Romero C Bakker J 2000 Effect of storage temperature and pyruvate on kinetics of anthocyanin
degradation Vitisin A derivative formation and color characteristics of model solutions J Agric
Food Chem Vol 48 2135ndash2141
Sadras V 2007 Evolutionary aspects of the trade-off between seed size and number in crops J
Field crop research Vol 100(2-3) 125-138
Sadras VO Petrie P R Moran M A 2013 Effects of elevated temperature in grapevine II juice
pH titratable acidity and wine sensory attributes Australian Journal of Grape and Wine Research
Vol 19 (1) 107ndash115
Sarni P Fulcrand H Souillol V Souquet J M Cheynier V 1995 Mechanisms of anthocyanin
degradation in grape must-like model solutions J Sci Food Agr Vol 69(3) 385ndash391
Scholefield PB May P Neales TF 1977 Harvest-pruning and trellising of lsquoSultanarsquo vines II
Effects on early spring development Sci Hortic Vol 7123-132
Schultz H R 1995 Grape canopy structure light microclimate and photosynthesis I A two
dimensional model of the spatial distribution of surface area densities and leaf ages in two canopy
systems J Vitis Vol 34 211-215
Schultz H R 2000 Climate change and viticulture a European perspective on climatology carbon
dioxide and UV-B effects Aust J Grape Wine Res Vol 6 2ndash12
114
Schultz H R 2003 Extension of a Farquhar model for limitations of leaf photosynthesis induced
by light environment phenology and leaf age in grapevines (Vitis vinifera L cvv White Riesling
and Zinfandel)J Functional Plant Biol Vol 30(6) 673 ndash 687
Sepuacutelveda G Kliewer W M Ryugo K 1986 Effect of high temperature on grapevines (Vitis
vinifera L) I translocation of 14
C-photosynthates J Am J Enol Vitic Vol 37 (1) 13-19
Shaked-Sachray L Weiss D Moshe R Nissim-Levi A Oren- Shamir M 2002 Increased
anthocyanin accumulation in aster flowers at elevated temperatures due to magnesium treatment J
Physiol Plant Vol 114 559ndash565
Shvarts M Borochov A Weiss D 1997 Low temperature enhances petunia flower pigmentation
and induces chalcone synthase gene expression J Physiol Plant Vol 99 67ndash72
Sipiora M J Gutieacuterrez-Granda M J 1998 Effects of pre-veraison irrigation cutoff and skin
contact time on the composition color and phenolic content of young Cabernet Sauvignon wines in
Spain J Amer J Enol Vitic Vol 49 152ndash162
Smart R E 1985 Principles of grapevine canopy microclimate manipulation with implication for
yield and quality J Amer J Enol Vitic Vol 36 230-239
Smith G J Markham K R 1998 Tautomerism of flavonol glucosides - relevance to plant UV
protection and flower colour J Photochem Photobiol A ndash Chem Vol 118 99-105
Soar C J Collins M J Sadras V O 2009 Irrigated Shiraz vines (Vitis vinifera) up regulate gas
exchange and maintain berry growth in response to short spells of high maximum temperature in the
field J Functional Plant Biology Vol 36(9) 801ndash814
Sparvoli F Martin C Scienza A Gavazzi G Tonelli C 1994 Cloning and molecular analysis
of structural genes involved in flavonoid and stilbene biosynthesis in grape (Vitis Vinifera L) J
Plant Molecular Biology Vol 24 743-755
Spayd S E Tarara J M Mee D L Ferguson J C 2002 Separation of sunlight and
temperature effects on the composition of Vitis vinifera cv Merlot berries J Amer J Enol Vitic
Vol 53171-182
Spelt C 2002 Anthocyanin1 of petunia controls pigment synthesis vacuolar pH and seed coat
development by genetically distinct mechanisms The plant cell online Vol 14 2121-2135
Stafford H A 1990 Flavonoid Metabolism CRC Press Boca Raton FL 298 pp
Stracke R De Vos R C H Bartelniewoehner L Ishihara H Sagasser M Martens
S Weisshaar B 2009 Metabolomic and genetic analyses of flavonol synthesis in Arabidopsis
thalianasupport the in vivo
115
Taureilles-Saurel C Romieu C G Robin J P Flanzy C 1995 Grape (Vitis vinifera L) malate
dehydrogenase II Characterization of the major mitochondrial and cytosolic isoforms and their role
in ripening J Am J Enol Vitic Vol 46 (1) 29-36
Tomana T Utsunomiya N Kataoka I 1979 The effect of environmental temperatures on fruit
ripening on the tree II The effect of temperatures around whole vines and clusters on the coloration
of lsquoKyohorsquo Grapes Japan Soc Hort Sci Vol 48 261-266
Treutter D 2006 Significance of flavonoids in plant resistance a review J Environ Chem Lett
Vol 4 147ndash157
Ubi BW Honda C Bessho H Kondo S Wada M Kobayashi S Moriguchi T 2006
Expression analysis of anthocyanin biosynthetic genes in apple skin effect of UV-B and
temperature J Plant Sci Vol 170 571ndash578
Ushimaru T Maki Y Sano S Koshiba K Asada K Tsuji H 1997 Induction of enzymes
involved in the ascorbate-dependent antioxidative system namely ascorbate peroxidase
monodehydroascorbate reductase and dehydroascorbate reductase after exposure to air of rice
(Oryza sativa) seedlings germinated under water J Plant Cell Physiol Vol 38 541-549
Vaknin H Bar-Akiva A Ovadia R Nissim-Levi A Forer I Weiss D Oren-Shamir M
2005 Active anthocyanin degradation in Brunfelsia calycina (yesterday-today-tomorrow) flowers J
Planta Vol 222 19ndash26
Venturini L 2009 Study of some gene families involved in anthocyanin accumulation during Vitis
vinifera berry ripening Tesi di laurea specialistica in biotechnologie agro-industriali faculta di
scienze matematiche fisichie e naturali Universita degli studi di Verona pp7-12 30-51
Wahid A Perveen M Gelani S Basra SMA 2007 Pretreatment of seed with H2O2 improves
salt tolerance of wheat seedlings by alleviation of oxidative damage and expression of stress
proteins J Plant Physiol Vol 164 (3) 283ndash294
Walker AR Lee E Bogs J McDavid D A J Thomas M R Robinson S P 2007 White
grapes arose through the mutation of two similar and adjacent regulatory genes The Plant journal
for cell and molecular biology Vol 49 772-85
Walker J R Ferrar P H 1998 Diphenol oxidases enzymecatalysed browning and plant disease
resistance J Biotechnol Genet Eng Rev Vol 15 457ndash498
Waterhouse A L 2002 Wine Phenolics Ann NY Acad Sci Vol 957 21-36
Watson RT Rodhe H Oeschger H Siegenthaler U 1990 Greenhouse gases and aerosols
httprivernetncsuedu
116
Welinder K G Justesen A F Kjaeligrsga I V H Jensen R B Rasmussen S K Jespersen H M
Duroux L 2002 Structural diversity and transcription of class III peroxidases from Arabidopsis
thaliana J Eur J Biochem Vol 269 6063ndash6081
Wen Y Zhang Y Pan Q 2009 Progress of organic acids in grape berries Natural science
journal of Hainan University S6631
Williams R J Spencer J P Rice-Evans C 2004 Flavonoids antioxidants or signaling
molecules J Free Radic Biol Med Vol 36 838ndash849
Winkel-Shirley B 2002 Biosynthesis of flavonoids and effects of stress J Current opinion in
plant biology Vol 5 218-23
Winkler A J Cook J A Kliewer W M Lider L A 1962 Development and composition of
grapes General viticulture Berkeley CA University of California Press pp 141ndash196
Xie DY Sharma S B Paiva N L Ferreira D Dixon R A 2003 Role of anthocyanidin
reductase encoded by BANYULS in plant flavonoid biosynthesis J Science Vol 299 396ndash399
Yamane T Jeong S T Goto-Yamamoto N Koshita Y Kobayashi S 2006 Effects of
temperature on anthocyanin biosynthesis in grape berry skins J Amer J Enol Vitic Vol 57 54ndash
59
Yamasaki H Sakihama Y Ikehara N 1997 Flavonoid-peroxidase reaction as a detoxification
mechanism of plant cells against H2O2 J Plant Physiol Vol 115 1405-1412
Yokotsuka K Singleton V L 1997 Disappearance of anthocyanins as grape juice is prepared and
oxidized with PPO and PPO substrates J Am J Enol Vitic Vol 48 (1) 13-25
Yoruk R Marshal R M 2003 Physiocochemical properties and function of plant polyphenol
axidase A review J Food Biochem Vol 27 361-422
Yu D J Kim S J Lee H J 2009 Stomatal and non-stomatal limitations to photosynthesis in
field-grown grapevine cultivars J Biologia Plantarum Vol 53 (1) 133-137
Zsoacutefi Z Vaacuteradi G Baacutelo B Marschall M Nagy Z Dulai S 2009 Heat acclimation of
grapevine leaf photosynthesis mezo- and macroclimatic aspects J Functional Plant Biology
Vol 36(4) 310ndash322
Contents
1 GENERAL INTRODUCTION 1
11 Grape ripening 1
12 Grape berry composition 2
121 Sugars 2
122 Organic acids 2
123 Phenolic compounds 2
13 Biosynthesis of flavonoids in red grape berry 7
131 Synthesis of the early products of the phenylpropanoid pathway 7
132 Specific Steps towards flavonoid biosynthesis structural genes involved in flavonols flavan-3-ols
and anthocyanin biosynthesis 8
14 Flavonoid gene expression during berry development 11
141 Regulatory genes of anthocyanin biosynthesis pathway 13
2 Global Warming 14
3 Global warming and viticulture 15
31 The effects of global warming on berry ripening 15
4 GENERAL AIMS OF THE THESIS 20
Chapter one First partBiochemical and molecular approaches to study the effects of
temperature on grape composition in cv Sangiovese (Vitis vinifera L ) 22
1 INTRODUCTION 23
2 MATERIALS AND METHODS 24
21 Temperature monitoring 24
22 Berry sampling 25
23 degBrix titratable acidity and pH 25
24 Analyses of anthocyanins and flavonols 25
25 Tannins analysis 26
26 Real-time PCR analyses RNA extraction and RNA evaluation 27
27 Enzyme assay 30
3
27 1 PAL activity assay 30
27 2 UFGT activity assay 30
27 3 Guaiacol PODs activity assay 31
27 4 PPOs activity assay 31
28 Vegetative and Yield measurements 32
29 Statistical analyses 32
3 RESULTS AND DISCUSSION 32
31 Berry Temperature 32
32 Leaf area and Yield 34
33 oBrix pH Titratable acidity 36
34 Biosynthesis of flavonoids 37
34 1 Anthocyanins accumulation during ripening 37
34 2 Flavonols accumulation during ripening 40
34 3 Tannins accumulation during ripening 42
35 Gene expression assessment 44
36 Activity of biosynthetic enzymes PAL and UFGT 48
37 Hypothesis for anthocyanin degradation 50
371 POD candidate genes 50
372 Activity of enzymes involved in anthocyanin degradation PODs and PPOs 51
4 CONCLUSION 52
Chapter one Second PartRecognition of putative POD genes involved in anthocyanins
degradation under high temperature condition 53
1 INTRODUCTION 54
2 MATERIALS 54
21 Gene selection 54
22 Escherichia coli strain and culture media 54
221 Luria-Bertani (LB) medium 55
222 SOC medium 55
4
23 Agrobacterium tumefaciens strain and culture media 56
231 YEB Medium 56
24 Vectors 57
241 pENTRtradeD-TOPOreg (2580 bp) 57
242 pK7WG20 57
25 Primers 58
26 Plant materials 59
3 METHODS 60
31 Transformation of Escherichia coli by heat shock 60
32 Preparation of competent cells of A tumefaciens 60
33 Transformation of A Tumefaciens by electroporation 61
34 Colony PCR 61
35 Plasmid DNA extraction 61
36 Purification of PCR products 61
37 GATEWAYreg cloning system 61
38 LR Recombination reaction 62
39 TOPO cloning reaction 63
310 RNA extraction and Real time PCR 63
311 Stable transformation of Petunia hybrida 64
3111 Medium I 65
3112 Medium II 65
3113 Medium III 66
312 Agro-infiltration of petunia petals 66
3121 Resuspending buffer 66
313 DNA extraction from Petunia 67
3131 Extraction buffer 67
314 PCR of transformed Petunia genomic DNA 67
3141 Reaction Mix 68
5
3142 Standard thermal cycle 68
315 RNA extraction from Petunia hybrida petal 68
316 cDNA synthesis RT PCR reaction 68
3161 Reaction Mix 69
3162 Standard thermal cycle 69
317 Total anthocyanin measurement 69
318 Heat shock performance 70
319 Guaiacol Peroxidases activity assay 70
4 RESULTS 70
41 Gene selection 71
42 The sequence of the POD1 gene 72
43 Gene transformation 73
44 Heat shock and the plant response 78
5 CONCLUSION 80
Chapter twoEffects of late-season source limitations induced by trimming on grape
composition during ripening in Vitis vinifera cv Sangiovese 81
1 INTRODUCTION 82
2 MATERIAL AND METHODS 83
21 Vegetative and yield data 83
22 Berry sampling 84
23 Analyses of main must biochemical parameters 84
24 Analyses of skin anthocyanins 84
25 Tannins analysis 85
3 RESULTS AND DISCUSSION 86
31 Climatic data 86
32 Vegetative and productive traits 87
33 Ripening analyses Soluble solids pH and Total Acidity 90
34 Anthocyanins accumulation during ripenning 92
6
35 Tannins accumulation during ripenning 95
4 CONCLUSION 99
5 GENERAL CONCLUSION
1
1 GENERAL INTRODUCTION
11 Grape ripening
Grape is a non-climacteric fruit and in non-climacteric fruits ethylene does not appear to have a
major role in ripening Little is known about the factors that regulate the ripening process of grapes
However it seems likely that plant growth substances are involved (Coombe 1992) Grapes exhibit
a double sigmoid pattern of development (Fig 1) with the two distinct phases of growth separated
by a lag phase (Coombe 1992) The ripening phase of grape berry development occurs during the
second period of berry growth and results from expansion of existing pericarp cells (Hardie et al
1996) During the ripening phase a number of major physiological and biochemical changes occur
simultaneously in the grape berry and these determine the quality of the fruit at harvest The onset
of ripening (Veraison) signals the beginning of significant changes in metabolism which include
accumulation of sugar softening of berries synthesis of anthocyanins metabolism of organic acids
accumulation of flavour compounds and changes in the level of growth substances (Fig 1) These
changes are coordinated within each berry but individual berries even those on the same bunch do
not ripen synchronously (Coombe 1992) this results in significant variation between berries even
at harvest This variability represents the significant effect of berry environmental conditions on
berry composition
Fig 1 Schematic representation of grape berry development (Robinson amp Davies 2000)
2
12 Grape berry composition
The dynamic of berry ripening is fundamental to determine final berry composition and as a
consequence grape quality Sugars organic acids and phenolic compounds are the main biochemical
components of grape berry
121 Sugars
Sugar accumulation in grape berries is an important phenomenon degBrix is directly related to the
sugar content (gL) and potential titratable alcohol (vol ) and about 55 of grape berry degbrix
converses to alcohol (Fournand et al 2006) At the beginning of berry development sugars are
produced by the green berries while subsequently berry becomes a typical ldquosinkrdquo organ and uses
carbohydrates produced by photosynthesis of leaves Sucrose produced by leaves is then transported
for long distance to berries into the phloem From veacuteraison xylem flow is almost impeded hence
water may reach berries via phloem with sugars Sucrose the predominant sugar transported in the
phloem accumulates in grape berry in form of glucose and fructose Since at the end of berry
ripening the glucosefructose ratio is approximately equal to 1 the cleavage of sucrose may be
catalysed mainly by invertase (Pastore 2010) The main role of sugars in grape berry is to provide
the carbon skeleton of many compounds (such as organic acids or amino acids) and to be energy
sources for cells By now it is scientifically accepted that sugars play also an important role as
signalling molecules in control of growth and development (Rolland et al 2006)
122 Organic acids
Organic acids are some important flavor compounds in both grapes and wines and the composition
and content of organic acids are closely related to the organoleptic quality of grapes and wine (Wen
et al 2009) Tartaric and malic acids generally represent from 69 to 92 of all organic acids in
grape berries (Kliewer 1966) Small amounts of citric succinic lactic and acetic acids are also
present in the berry While tartaric acid is synthesized until veacuteraison malic acids levels vary highly
during berry ripening As to Dokoozlian 2000 green berries together with leaves are the main
grape organs able to produce organic acids
123 Phenolic compounds
Phenolic compounds of grape are divided into non-flavonoids and flavonoids groups (Robinson
2006)
3
1231 Non-flavonoids
Hydroxycinnamic acids benzoic acids and stilbenes belong to the non-flavonoids group
(Waterhouse 2002)
1231a Hydroxycinnamates
Hydroxycinnamates present in grape berries are derivatives of caffeic p-coumaric and ferulic acids
which are present both in the skin hypodermal cells and in the flesh (Adams 2006) and Caftaric
acid is the predominant hydroxycinnamates in grape (Kennedy et al 2006)
1231b Benzoic acids
Benzoic acids are the minor components in grape berry composition Six derivatives of benzoic
acids (gallic acid protocatechuic acid gentisic acid p-hydroxybenzoic acid vanillic acid and
syringic acid) have been found in grape berry Gallic acid is the major benzoic acid present in grape
berry and it is present in both skin and seeds (Pastore 2010)
1231c Stilbenes
Stilbenes are found in the skin of the grape berry and in vegetative tissues Although stilbenes are
present in low quantity both in berries and wine they have aroused a lot of interest because of their
effects on human health in particular for what concern resveratrol (Bavaresco amp Fregoni 2001)
Resveratrol could exist in different forms in monomeric unit (as dimethylated derivatives trans-
pterostilbene and as in form of 3-O-β-D-glucoside trans- and cis-piceid) or in dimer units
(viniferins) (Gatto et al 2008)
1232 Flavonoids
Flavonoids are a class of plant secondary metabolites which are synthesized from Phenylalanine or
Tyrosine condensed with a malonyl-CoA via the phenylpropanoid pathway This class comprises
more than 6500 known compounds many of which are of great biological and commercial
importance In nature they play important roles in resistance to stresses both abiotic (such as excess
light and high temperature) and biotic (such as resistance to microbes) (Mol 1998 Winkel-Shirley
2002) moreover they are of central importance in the ecological relationships with pollinator
insects and in nodule formation (Downey et al 2006) They comprise both transparent compounds
4
such as the flavanols and brightly coloured ones such as phoblaphenes anthocyanins and
polymeric proanthocyanidins (Robinson 2006) All flavonoids share a common chemical structure
represented by a C15 skeleton (C6-C3-C6) (Fig 2)
Fig 2 Chemical structure of flavonoid molecule (Aron amp Kennedy 2008)
Depending on the position of the linkage of the aromatic ring (B ring) to the benzopyrano moiety (C
ring) we can distinguish the flavonoids (2-phenylbenzopyrans) the isoflavonoids (3-benzopyrans)
and the neoflavonoids (4-benzopyrans) The B ring can further be hydroxylated ortho-
dihydroxylated or vicinal-trihydroxylated (Pastore 2010) Other flavonoids modifications include
methoxylation O-glycosilation of hydroxyl groups or C-glycosilation of flavonoid skeleton carbon
atom Moreover flavonoid glycosides are frequently acylated with aliphatic or aromatic acid
molecules (Aron amp Kennedy 2008) Different classes of flavonoids are commonly detected in grape
such as anthocyanins flavonols and flavan-3-ols (tannins or proanthocyanidins) (Fig 3) Flavonoids
are localized both in berry skin and seeds In particular in hypodermal cells of the skin we can
found tannins flavonol monomeric flavan-3-ols and in red grape anthocyanins
1232a Anthocyanins
Anthocyanins are pigments and represent the major class of flavonoids of the skin of red grape
varieties The anthocyanins commonly found in grape include delphinidin cyanidin petunidin
peonidin and malvidin-3-O-glucosides 3-(6-acetyl) glucosides and 3-(6-p-coumaroyl)-glucosides
In certain grape varieties have been found even traces of peonidin and malvidin 3-(6-caffeoil)-
glucoside Malvidin-3-O-glucoside is the most abundant anthocyanin present in grape
5
Fig 3 Chemical structure of the three main classes of flavonoids present in red grape berry (Adams 2006)
1232b Flavan-3-ols and tannins
Monomeric flavan-3-ols (catechin epicatechin epigallocatechin) are present in the skin at lower
concentrations while they are present at high concentrations in form of polymers within tannins
(proanthocyanidins) Tannins are polymers of different condensed monomers like epicatechin and
epigallocatechin which constitute the chain of the polymers (ldquoextensionrdquo subunits) and catechin
which is present as ldquoterminalrdquo units (Braidot et al 2008) The mean degree of polymerisation
(mDP) which represents the mean length of the tannin chain is of about 28 in berry skin (Bogs et
al 2005)
Flavonoids in the seeds accumulate not only in the external part but even in the inner layers Grape
seeds are the primery source of flavan-3-ols and tannins in grape berries Total tannin content is in
fact higher in seeds than in skin even if seed tannins have a lower mDP The composition of seed
tannins is different comparing to the skin one in so far that in seed tannins generally
6
epigallocatechin is not present and epicatechin gallate is the major constituent of ldquoextensionrdquo
subunits (Adams 2006)
Fig 4This hypothetical condensed tannin is made up of four sub-units catechin epicatechin epigallocatechin
epicatechin gallate The first subunit (catechin) is bound to the second (epicatechin) by an interflavan bond between
carbon 4 of catechin and carbon 8 of epicatechin The first three subunits are referred to as extention subunits and
only the epicatechin gallate has free 4 positions and is thus re-ferred to as a terminal unit (Adams 2006)
1232c Flavonols
Grape and wine contain different classes of polyphenols Flavonols are flavonoids that are found in
higher plants usually in glycosidic forms They are products of the flavonoid biosynthetic pathway
which also give rise to anthocyanins and to condensed tannins in grapevines (Stafford 1990 and
Darne 1993) The main flavonols reported in grape berries are quercetin-3-O-glucoside and
quercetin-3-O-glucuronide (Price et al 1995 Cheynier et al 1986 and Downey et al 2003)
Flavonols are also involved in the stabilization of the flavilium form of anthocyanins in young red
wines through co-pigmentation (Boulton 2001) The highest flavonol concentrations in grapes were
found at flowering followed by a decrease as the grapes increased in size Subsequently a
significant level of flavonol biosynthesis was observed during berry development and the greatest
increase in flavonols per berry can be observed 3-4 weeks post-veraison (Downey et al 2003)
In red grapes the main flavonol is quercetin (mean) 4399) followed by myricetin (3681)
kaempferol (643) laricitrin (565) isorhamnetin (389) and syringetin (322) In white
grapes the main flavonol was quercetin (mean) 8135) followed by kaempferol (1691) and
7
isorhamnetin (174) The delphinidin-like flavonols myricetin laricitrin and syringetin were
missing in all white varieties indicating that the enzyme flavonoid 3hydroxylase is not
expressed in white grape varieties (Mattivi et al 2006)
It is interesting to observe the analogies between the hydroxylation of position 5 which leads to the
formation of the anthocyanidin delphinidin from cyanidin and the flavonol myricetin from quercetin
In addition to this O-methylation of position 3of anthocyanidin cyanidin which leads to the
formation of peonidin corresponds to the O-methylation which converts flavonol quercetin into
isorhamnetin Finally O-methylation of positions 3and 5of anthocyanidin delphinidin which
leads to the formation of petunidin and malvidin corresponds to O-methylation which converts
flavonol myricetin into laricitrin and syringetin (Fig 3)
13 Biosynthesis of flavonoids in red grape berry
Flavonoids are synthesized within the general phenylpropanoid pathway From the same precursors
and towards specific branches these pathways bring to the synthesis of anthocyanins flavonols and
proanthocyanidins (Boss et al 1996) (Fig 5 6) The enzymes involved in flavonoid biosynthesis
are associated at the cytoplasmic surface of the endoplasmic reticulum and represent a multi-enzyme
complex
131 Synthesis of the early products of the phenylpropanoid pathway
1311 PAL
PAL is a key enzyme ubiquitous in plants which catalyzes one of the first steps in
phenylpropanoids biosynthesis (Fig 5) the hydrolysis of ammonia from phenylalanine to produce
cinnamic acid Cinnamic acid is the precursor of all phenolic compounds Recently the subcellular
localization of PAL was found in grape PAL is present in the cell walls secondarily thickened
walls and parenchyma cells of the berry tissues (Chen et al 2006) This enzyme that is a member
of a large gene family has been cloned in many plant species In grape there are probably present
15-20 PAL isoforms (Sparvoli et al 1994)
1312 C4H
The cinnamic acid produced by PAL is converted to p-coumaric acid towards the action of
cinnamate 4-hydrolase (C4H) (Fig 5) C4H belongs to the cytochrome P450 monoxygenases
8
family The enzymes of this family are able to catalyse exothermic reactions that are irreversible In
grape C4H have not yet been cloned but itrsquos known that it is present in the chloroplasts and in the
nucleus of berry tissues (Chen et al 2006)
1313 4CL
One molecule of p-coumaric acid produced by C4H is condensed with an acetil-CoA molecule to
form p-coumaroil-CoA that is the precursor of all the flavonoids (Fig 5) The enzyme which
catalyses this reaction is the 4-coumarate coenzyme A ligase (4CL) 4CL is localized in grape in the
secondarily thickened walls and in the parenchyma cells of the berry pulp vascular tissue (Chen et
al 2006) 4CL belongs to a multi-gene family Itrsquos very interesting to note that the activities of
PAL C4H and 4CL are really correlated and change concomitantly (Chen et al 2006)
Fig 5 The anthocyanin synthesis pathway in plants (Deluc et al 2008)
132 Specific Steps towards flavonoid biosynthesis structural genes involved in flavonols flavan-3-ols
and anthocyanin biosynthesis
1321 CHS
The first enzyme involved specifically in flavonoids biosynthesis is calchone synthase (CHS) (Fig
5 6) CHS catalyzes the condensation of one molecule of p-coumaroil-CoA with three molecules of
malonyl-CoA to produce naringenin chalcone CHS as other enzymes involved in the
9
phenylpropanoid metabolism belongs to a large super-family of proteins the family of type III
Polykethide Synthase
1322 CHI
Naringenin calchone is converted to flavanones (naringenin) to form the flavanoid core towards a
stereo-specific ring closure catalysed by chalchone isomerase (CHI) (Jeong et al 2004) On the
basis of the CHI sequence that doesnrsquot display any detectable homology with other proteins seems
that this enzyme is unique to the plant kingdom (Fig 6)
1323 F3H FLS F3rsquoH F3rsquo5rsquoH
Naringenin is then hydroxylated at position 3 by flavanone 3-hydroxylase (F3H) to form
dihydrokaempferol the flavonols precursor Dihydrokaempferol can be substrate of three different
enzymes which directly bring to the production of the flavonol kaempferol towards the action of
flavonol synthase (FLS) or to the biosynthesis of dihydroquercetin and dihydromyricetin towards
the action respectively of flavonoid-3rsquo-hydroxylase (F3rsquoH) and flavonoid-3rsquo5rsquo-hydroxylase
(F3rsquo5rsquoH) These enzymes catalyse the hydroxylation of the B ring of dihydrokaempferol in 3rsquo or
3rsquo5rsquo positions F3rsquoH activity results in the production of cyanidin-like anthocyanins while F3rsquo5rsquoH
action brings to the production of delphinidin anthocyanins species The cloning of both F3rsquoH and
F3rsquo5rsquoH genes from grape has shown that in grape two copies of F3rsquoH and several copies of F3rsquo5rsquoH
are present in a single chromosome (Bogs et al 2006 Castellarin et al 2006) In flowers of
Petunia Hybrida has been shown that F3rsquoH and F3rsquo5rsquoH can act both on the substrates and products
of F3H (Menting et al 1994) As previously described FLS is the key enzyme in the biosynthesis
of flavonols This enzyme employs dihydrokaempferol dihydroquercetin and dihydromyricetin as
substrates to synthesize the flavonol aglicones (Chua et al 2008)
1324 DFR
FLS directly competes for its substrates with the enzyme dihydroflavonol 4-reductase (DFR) which
catalyses the first step in the conversion of dihydroflavonols to proanthocyanidins or anthocyanins
This point of the biosynthetic pathway is a key regulatory point because it determines the direction
towards flavonols or proanthocyanidins and anthocyanins synthesis DFR is in fact responsible for
the NADPH-dependent reduction at the 4 position of the C ring of dihydroquercetin and
dihydromyricetin to give respectively leucocyanidin or leucodelphinidin (Pastore 2010)
10
1325 ANR LAR LDOX and UFGT
Leucocyanidin and leucodelphinidin are respectively the substrates to the next step of the
proanthocyanidin and anthocyanin biosyntheses which involve either anthocyanidin reductase
(ANR or BAN) and leucocyanidin reductase (LAR) or leucoanthocyanidin dioxygenase (LDOX)
and UDP-glucose flavonoid 3-O-glucosyltransferase (UFGT)
In grape LAR converts leucocyanidin in the flavan-3-ol (+)-catechin with a NADPH-dependent
reduction ANR acts instead on the products of the enzyme LDOX which catalyzes the cyanidin and
delphinidin production from leucoanthocyanidins Then ANR uses these substrates to synthesize
respectively (-)-epicatechin and (-)-epicatechin-3-O-gallate (Gagneacute et al 2009)
As FLS also LDOX belongs to a family of 2-oxoglutarate-dependent oxygenase (Pastore 2010) In
a recent work has been demonstrated that in Arabidopsis Thaliana LDOX could have also a FLS
activity in vivo (Stracke et al 2009) Southern blot experiments conducted on Vitis Vinifera cv Red
Globe have shown that only a single copy of LDOX gene is present in grapevine (Gollop et al
2001) The anthocyanidins cyanidin and delphinidin produced towards the action of LDOX are
then stabilized through the addition of a glucose residue at the 3 position of the C ring This reaction
is catalysed by the enzyme UFGT and allows the anthocyanins transport into the vacuole
UFGT is the key enzyme in anthocyanin biosynthesis because it is expressed only in red skin
cultivars UFGT seems to be present in grape genome as a single copy and it is interesting to note
that its promoter and coding regions have been found also in white cultivar and are similar to the
sequences present in their red-skin sports (Kobayashi et al 2001) The 3-O-glycosilation of
anthocyanin is almost always a prerequisite for further modification as methylation and acylation
1326 OMTs
Methoxyl groups are found in three of the main anthocyanins (peonidin petunidin and malvidin-3-
O-glucoside) This reaction brings to more stable compounds for the methylation of the reactive
hydroxyl groups and the enzymes responsible are O-methyltransferases (OMTs) The first partial
purification and characterization of a methyltransferase catalyzing the methylation of cyanidin-3-
glucoside to peonidin-3-glucoside was performed on a cell suspension of Vitis vinifera cv Gamay
Freaux This enzyme is S-adenosyl-L-methionine (SAM)-dependent and it was shown that it has a
high substrate specificity reacting only with cyanidin and not with delphinidin (Pastore 2010)
11
Fig 6 Diagrammatic representation of the flavonoids biosynthesis pathway Enzymes abbreviation are as given in the
text (Jeong et al 2006)
14 Flavonoid gene expression during berry development
The pattern of flavonoid gene expression (Fig 7) is very different among different organs and
among the different phases of berry ripening Data about the trend in gene expression of some
structural genes of flavonoid biosynthesis in berry skin compared to flesh have been published by
Boss et al in 1996 for red cultivar Shiraz Northern blot analysis of berry skin RNA have shown
that the majority of genes involved in flavonoid biosynthesis are just expressed from flowering to 2-
4 weeks after full bloom and then after veacuteraison Only the expression of the gene UDP Glc-
Flavonoid 3-O-glucosyl Transferase (UFGT) is strictly linked with veacuteraison phase In berry flesh all
the genes analyzed are expressed at lower levels compared to skin except for Phenylalanine
Ammonia Lyase (PAL) and UFGT whose expression was not detectable in the flesh at any stage of
the analysis (Boss et al 1996) The early expression of the genes from CHS to LDOX and FLS
LAR and ANR could be explained by the accumulation of flavonols and tannins in the young berry
12
Regards to the genes encoding anthocyanin modifying enzymes it was demonstrated that the gene
VvF3rsquoH-1 (the only functional isoform identified) is expressed in berry skin of cultivar Merlot
throughout ripening even if its expression decreases 8ndash10 weeks after blooming VvF3H-1
transcripts increase soon after at the onset of veacuteraison and shows a secondary peak of expression
one week before harvest concurrently at the peak of anthocyanin content VvF35rsquoH-1 is instead
weakly expressed during the first stages of berry ripening and the peak of expression is reached
when all berries have turned red Transcripts of the isoforms VvF35H-2-long and VvF35H-2-
medium appear at the onset of veacuteraison and lasted till full ripening while the isogene VvF35H-2-
short was constitutively expressed throughout the ripening (Castellarin et al 2006) In cv Shiraz
both F3rsquoH and F3rsquo5rsquoH transcripts were detected at flowering and in the early stages of berry
ripening but their expression reaches a maximum one week before and a week after veacuteraison
respectively (Bogs et al 2006) Transcriptomic analyses on Shiraz and Nebbiolo grape berries
harvested at different ripening stages have shown that in these varieties the expression of AOMT
follows the same profile AOMT is not expressed before the onset of ripening but after veacuteraison
there is a strong increase in the amount of transcripts during the first weeks and then the expression
decreases and remains constant until harvest (Hugueney et al 2009)
Fig 7 Anthocyanin biosynthetic pathway (Boss et al 1996)
13
141 Regulatory genes of anthocyanin biosynthesis pathway
Among the three classes of flavonoids present in grapevine the regulation of anthocyanins
biosynthesis has been the most studied thanks to the numerous available colour bud sports which
involve alterations in the red or purple berry anthocyanin content Bud sports are usually infrequent
changes in phenotype affecting shoots of woody perennials but colour bud sports are common and
examples in horticultural plants are widespread Alterations in the anthocyanins of a plant can be in
fact very distinct and easily observed and generally have no detrimental effect on the viability of the
plant The molecular basis underlying the appearance of bud sports are not yet well understood
The study of the genes regulating structural genes expression in anthocyanin biosynthesis was at
first done in maize petunia and snapdragon (Davies amp Schwinn 2003) and then full characterized in
Arabidopsis (Broun 2005) From these researches emerged that three different types of transcription
factors play a key roles in regulation of anthocyanin biosynthesis MYB bHLH (basic Helix-Loop-
Helix) and WDR (WD40 repeats) even if the WD40 proteins function seem to be only to assist
MYB and bHLH proteins MYB genes are present in plant genomes as different families The first
experience on MYB genes in grapevine was done on the cultivar Kyoho which belongs to Vitis
labruscana (V Labrusca x V Vinifera) A cDNA library has been constructed with cDNA of ripe
berries and then using random primers designed on maize MYB conserved sequences eight
different grape MYB homologue sequences were identified Among these only four species of
MYB gene can be really identified MYBA MYBB MYBC and MYBD The whole cDNA
sequences of MYBA and MYBB showed the existence of three different species for MYBA
(VlMYBA1-1 VlMYBA1-2 and VlMYBA2) and two for MYBB (VlMYBB1-1 and VlMYBB1-2)
which are different in the nucleotide sequence Transcription analyses revealed that VlMYBA is
only weakly expressed before veacuteraison but immediately after the beginning of anthocyanin
accumulation and berry softening VlMYBA expression rapidly increases VlMYBB expression was
instead detected in all the berry ripening stages analyzed even if also VlMYBB expression increases
after veacuteraison Regards to VlMYBC and VlMYBD these genes seems to be few linked to berry
veacuteraison because the first one is expressed at high levels just at the beginning of ripening and at
veacuteraison the transcription decreases in the case of VlMYBD the expression was detected only in
the early stages of berry ripening The tight relationship between VlMYBA and berry veacuteraison and
anthocyanin accumulation was further confirmed by expression analyses which revealed that
VlMYBA transcripts differentially from the others VlMYB genes identified were detected only in
berry tissues The introduction of VlMYBA1-1 VlMYBA1-2 and VlMYBA2 in embryos causes the
appearance of reddish-purple spots and so the authors concluded that VlMYBA was the
14
transcription factor regulating UFGT expression (Kobayashi et al 2002) The molecular basis of the
regulation of UFGT expression were then confirmed also for Vitis Vinifera and it was shown that
VvMYBA was probably responsible of the ancestral differentiation between red and white cultivar
The white-skinned varieties Italia and Muscat of Alexandria have in fact a GRET1 retrotransposon
inserted in both the alleles of the promoter region of VvMYBA1 gene and this causes the
inactivation of its expression In the grape varieties that have pigmented berry skin at least one
functional VvMYBA1 allele redVvMYBA1 (rVvMYBA1) and one functional VvMYBA2 allele
redVvMYBA2 (rVvMYBA2) have to exist (Walker et al 2007)
In nature the color of grape berry ranges from the lightest pink to the darkest purple tones according
to the amount and quality of anthocyanin accumulated in the berry skin This suggests a polygenic
control of anthocyanin accumulation in Vitis Vinifera despite evidence that the primery
determination of anthocyanin production in berries appeared to be controlled by a single dominant
locus (Barrit amp Einset 1969) Among the 68 unigenes identified a cluster of four VvMYBA genes
(VvMYBA1 VvMYBA2 VvMYBA3 and VvMYBA4) was considered essential to determine the
genetic bases of the quantitative variation of anthocyanin content in berry skin After the
identification of VvMYBA1 the first expression analyses of this gene in grapevine were done by
Jeong et al (2004) on conditioned berry with the aim to alter anthocyanin accumulation The
change in expression levels of VvMYBA1 coincided with the changes in the expression levels of
other tested anthocyanin biosynthetic enzyme genes (CHS1 CHS2 CHS3 CHI1 CHI2 F3H1
F3H2 DFR LDOX and UFGT) and also with the accumulation of anthocyanins in the berry skins
This suggests that the product of VvMYBA1 gene may control the transcription of not only UFGT
but also of other structural genes whose expression increase after veacuteraison
2 Global Warming
Since the beginning of the pre-industrial era around 1750 the atmospheric concentration of
greenhouse gases has increased by about 30 because of the combustion of fossil fuels and changes
in land-use practices Increased atmospheric concentrations of greenhouse gases tend to warm the
atmosphere (Watson et al 1990) The earths climate which has been relatively stable during the
past 10000 years is now changing (Fig 8) The earths surface temperature in this century is
warmer than any other centuries during the 600 years and the last few decades have been the hottest
in this century (Mann et al 1998)
It is clear that global warming will adversely affect human health ecological systems and socio-
economic sectors including human settlements and agriculture (Movahed amp Maeiyat 2009) and
15
particularly viticulture Climate is a pervasive factor in the viability of all forms of agriculture and is
never more important than with the cultivation of grapes for the production of wine (Jones et al
2005) Global warming and viticulture are interrelated processes both of which take place on a
global scale
3 Global warming and viticulture
In the last decades the majority of the worlds highest quality wine-producing regions have
experienced growing season warming trends In these regions future global warming would exceed
a threshold as a result of which the balanced fruit ripening required for existing varieties and wine
styles would become progressively more difficult While improved winemaking knowledge and
husbandry practices contributed to the better vintages it was shown that climate had and will likely
always have a significant role in quality variations (Jones et al 2005)
In northern Europe climate change may produce positive effects on viticulture through introduction
of new varieties (Fig9) higher production and expansion of suitable areas for cultivation
Nonetheless the disadvantages may be an increase in the need for plant protection the risk of
nutrient leaching and the turnover of soil organic matters (Lough et al 1983 Jones et al 2005)
However in southern areas the disadvantages will predominate The possible increase in water
shortage and extreme weather events may cause lower harvestable yields higher yield variability
and a reduction in suitable areas These effects may reinforce the current trends of intensification of
viticulture in Northern and Western Europe and extensification in the Mediterranean and
Southeastern parts of Europe (Lough et al 1983 Jones et al 2005) In general global warming is
projected to have significant impacts on conditions affecting viticulture including temperature
carbon dioxide precipitation increasing demand for irrigation to meet higher evaporation
increasing the incidence of pests and through direct temperature effects on production quality and
quantity and the interaction of these elements (Fraser 2008)
31 The effects of global warming on berry ripening
The maturation of grapevine berries is strongly influenced by the microclimate around the fruit
Global atmospheric warming trend can affect physiological functions involved in fruit maturation
(Jones et al 2005 Mori et al 2007) Acidity anthocyanins and flavonols concentrations in berries
are clearly linked to berry temperature (Haselgrove et al 2000 Bergqvist et al 2001 Spayd et al
2002 Downey et al 2004) while sugar content is strongly influenced by berry transpiration
(Rebucci et al 1997) Daily average temperature at the time of ripening is used to estimate potential
16
temperature impacts on quality Regards to the temperature the specific number of heat units
(degree days DD) that determines rate of berry ripening is typical of each variety In general the
optimum temperature for berry growth and ripening is among 20deg-25degC (Dokoozlian 2000)
The Huglin index enables different viticulture regions of the world to be classified in terms of the
sum of temperatures required for vine development and grape ripening (Huglin 1978) Specifically
it is the sum of mean and maximum temperatures above +10degC (the thermal threshold for vine
development) Different grape varieties are thus classified according to their minimal thermal
requirement for grape ripening For example the HI is 1600 for Riesling and 1900 for Cabernet
Sauvignon (Shultz 2000) (Fig9) As a result of global warming the Huglin index is increasing
(Shultz 2000) (Fig8) so that the average ripening occurs about 1ndash2 months earlier that leads to
degraded fruit and wine quality (Lough et al 1983 Kenny amp Harrison 1992 Butterfield et al
2000 Bindi et al 1996 Jones et al 2005)
Fig 8 Huglin index from 1972 to 2005 (Shultz
2000)
Fig 9 Huglin index for some grape varieties (Shultz 2000)
In general increasing vine temperature may accelerate the rate of some metabolic process even if in
grape it has been demonstrated that above 30degC many metabolic pathways stop or are significantly
reduced (Shaked-Sachray et al 2002 Vaknin et al 2005) Biosynthesis of flavonoids (Fig 7) is
affected by many endogenous and exogenous factors (Jones et al 2005) Among these factors
sitersquos microclimate seems to have the greatest influences on flavonoid content (Downey et al
2006) For instance changes in solar radiation or temperature rise will have a direct impact on grape
composition and thus flavor via alteration of secondary metabolites such as flavonoids amino acids
and carotenoids (Roby et al 2004) Acidity sugar content anthocyanins and flavonols
concentrations in berries are clearly linked to berry temperature (Haselgrove et al 2000 Bergqvist
17
et al 2001 Spayd et al 2002 Downey et al 2004 Rebucci et al 1997) It has been suggested
that light exposure which contribute to higher temperature could control phenols biosynthesis It
could also shift or modify flavonoids composition (Pereira et al 2006 Downey et al 2004
Bucchetti 2004 Guidoni et al 2004 Bucchetti et al 2007 Filippetti 2009 Spayd et al 2002
Haselgrove et al 2000) As to Pastore (2010) late defoliation in grape (that contributes to the
higher light exposure and consequently higher temperature) could decrease titratable acidity In
addition a tendency to decrease in total anthocyanins and modifications in flavonoids composition
such as decrease of cyanidin quercetin and kaempferol and increase of malvidin level was
observed
Among the factors that determine grape wine quality and market value berry skin coloration is one
of the most important factors Grape coloration is attributable to anthocyanin accumulation in the
skin and temperature is an important factor that affects anthocyanin accumulation in grape (Mori et
al 2005b Mori et al 2007 Winkler et al 1962 Jones et al 2005 Kliewer 1970 Buttrose et al
1971 Kliewer and Torres 1972 Yamen et al 2006 Spayd et al 2002) It is reported that high
diurnal temperature generally decrease total anthocyanin amount (Yamane et al 2006 Mori et al
2007a) This effect seems to be particularly significant after veacuteraison and it can be affirmed that high
diurnal temperature generally decreases anthocyanin amount (Winkler et al 1962 Yamane et al
2006 Mori et al 2007a) The results of the stable isotope-labelled tracer experiments to examine
the effect of temperature on the turnover of anthocyanin in the skin indicated that the total
anthocyanin contents were highest in berries cultured at 25degC and lowest at 35degC and confirmed the
loss of anthocyanins in response to high temperature In the berries cultured at 35degC the total
content of 13
C- labeled anthocyanin was markedly reduced while there was no decrease in labelled
anthocyanin content in the skin of berries at 15degC and 25degC (Mori et al 2005)
The results of the study on the effect of temperature on anthocyanin composition has indicated that
the amount of all anthocyanins except malvidin 3-O glucoside was reduced by high temperature
(Romero and Bakkar 2000 Morais et al 2002 Mori et al 2007) In general methoxylation
glycosylation and acylation lead to an increase in the thermal stability of anthocyanin (Jackman and
Smith 1996) High temperature increases the degradation rate of anthocyanins but it has been
assumed that this degradation rate depends on the anthocyanin structure (Jackman and Smith 1996
Sipiora and Gutierrez-Granda 1998 Mori et al 2007) It is reasonable that only malvidin
derivatives which are highly methylated anthocyanins were accumulated and were more stable than
other anthocyanins (Mori et al 2007) The decrease in anthocyanin accumulation under high
temperature may result from factors such as anthocyanin degradation as well as the inhibition of
mRNA transcription of the anthocyanin biosynthetic genes (Mori et al 2007) Temperature might
18
affect not only the synthesis but also the stability therefore the decrease in anthocyanin
concentration at elevated temperatures might result from both decrease in synthesis and increase in
degradation (Shaked-Sachray et al 2002 Vaknin et al 2005)
In Vitis vinifera berries the most important pigments are derived from delphinidin cyanidin
petunidin peonidin and malvidin (Castellarin et al 2006) Although the corresponding
anthocyanins can be formed by the formation of acetic caffeic or p-coumaric acid esters they are
usually formed by the addition of a 3-O glucose It is therefore unsurprising that one of the genes
most up-regulated during the anthocyanin accumulation in grape berries is UFGT (Walker et al
2007) In the flavonoids biosynthesis pathway anthocyanins are the last products of
phenylpropanoid pathway It has been determined that anthocyanins are synthesized from
phenylalanine through an anthocyanin biosynthesis pathway (Fig 7) regulated by enzyme activities
(Hrazdina et al 1984) and gene expressions (Boss et al 1996) Some anthocyanin biosynthetic
pathway genes including a large number of isogenes phenylalanine ammonia lyase (PAL) chalcone
synthase (CHS) chalcone isomerase (CHI) flavanone 3-hydroxylase (F3H) dihydroflavonol 4-
reductase (DFR) leucoantho-cyanidine dioxygenase (LDOX) and UDP-glucose flavonoid 3-O-
glucosyltransferase (UFGT) etc- have been cloned (Sparvoli et al 1994) It has already been
established that in many plants the gene expression of the enzymes involved in anthocyanin
biosynthesis is affected by temperature In general the expression of the anthocyanin biosynthetic
genes was induced by low temperature in different specious (Mori et al 2005b 2007 Yamane et
al 2006 Christie et al 1994 Shvarts et al 1997 Lo Piero et al 2005 Leyva et al 1995 Shaked-
Sachray et al 2002 and Dela et al 2003) Very interesting is also the effect of different night
temperature on anthocyanin biosynthesis Warm night contributes to decrease of anthocyanin
content of grape berry skin The enzymatic activities of PAL and UFGT in the skin of Darkridge
berries grown under high (3030 degC) night temperature conditions were decreased significantly after
veraison (Mori et al 2005 Mazza and Miniati 1993 Kliewer and Torres 1972)
Flavonoids protect plants against various biotic and abiotic stresses Their oxidation reactions only
occur after senescence or an environmental stress This oxidation plays a role in defending the plant
against various biotic and abiotic stresses (Treutter 2006 Buchanan-Wollaston and Morris 2000
Munneacute-Bosch and Alegre 2004) Since grape berries grown under high temperature would receive
oxidative stress (Mori et al 2007) Flavonoids oxidation (eg Anthocyanin degradation) occurs in
order to defend the plant This reaction in plants is mainly catalyzed by polyphenol oxidases
(catechol oxidases and laccases) and peroxidases (Pourcel et al 2006) It was also reported that
among the candidates for anthocyanin degradation enzyme such as polyphenol oxidases (PPOs) and
peroxidases (PODs) peroxidases are involved in active anthocyanin degradation of Brunfelsia
19
calycina flowers (Vaknin et al 2005 Welinder et al 2002) While polyphenol oxidases increased
the rate of anthocyanin degradation in fruit extracts and juices (Kader et al 1997- 1998- 1999 Sarni
et al 1995) PPOs are not likely candidates for degrading anthocyanins in living tissues because of
their location in plastids (Vaknin et al 2005) Peroxidases in vacuoles have also been found in
grape cells and would be involved in anthocyanin degradation in the presence of H2O2 (Calderon et
al 1992) H2O2 levels in plant tissues have been shown to increase in response to heat stress (Dat
et al 1998) Flavonoid-PODs reaction might function as a mechanism for H2O2-scavenging and
therefore plant cell detoxification (Pourcel et al 2006) Gene chips micro ray analysis showed that
grape berries grown under high temperature would receive oxidative stress (since genes encoding
peroxidases and some oxidoreduction enzymes were induced (Mori et al 2007) The indication that
oxidative enzymes are involved in this process is the fact that treatment with reducing agents (such
as glutathione and DTT) and protein synthesis inhibitors (like cycloheximide and anisomycin) both
caused inhibition of anthocyanin degradation (Vaknin et al 2005) In addition the effect of
temperature on fruit foliage and flower pigmentation has shown that fading of Aster flowers color
due to high temperature could be prevented by stabilizing the pigments (Shaked-Sachray et al
2002 Nissim-levi et al 2003 Oren-Shamir and Nissim-levi 1997a 1997b 1999 Vaknin et al
2005) These findings suggest that anthocyanin degradation plays a crucial role in pigment
concentration under low rate of bisynthesis Peroxidase activity is specific and involved in the
pigment degradation (Vaknin et al 2005) Mechanisms of flavonoid oxidation lead to brown
polymers (Pourcel et al 2006 Walker and Ferrar 1998 Yoruk R and Marshall 2003 Jiang et al
2004) The browning of peel of litchi fruits has been correlated with the rapid degradation of red
anthocyanin pigments this process is associated with enzymatic oxidation of phenolics by
polyphenol oxidases (PPO) andor peroxidases (POD) (Jiang et al 2004) Although the effects of
temperature on grape berry composition and particularly on the content of anthocyanins in skins
have been studied intensively (Kliewer 1970 Buttrose et al 1971 Kliewer and Torres 1972
Spayd et al 2002 Mori et al 2005b Yamane et al 2006) the mechanisms responsible for the
poor coloration of berry skin at high temperatures have not been completely understood and no
report has demonstrate the enhancement of anthocyanin degradation due to high temperature in
grape tissues Plant responses to high temperature involve morpho-anatomical physiological
biochemical and molecular changes which sometimes have to occur very rapidly The molecular
response to heat stress involve both the induction of enzymes involved in oxidative stress (as
Peroxidase Superoxide Dismutase Ascorbate Peroxidase Catalase) and Heat Shock Proteins (HSP)
(Wahid et al 2007) As previously reported anthocyanin biosynthesis is inhibited by higher
temperature and this is confirmed by molecular studies High temperature decreased mRNA
20
accumulation of structural anthocyanin biosynthesis genes and MYBA1 in cv Aki Queen (Yamane
et al 2006) In Pinot Noir vines instead the decrease in anthocyanin content due to high
temperature treatment cannot be linked to a decrease in anthocyanin biosynthesis as no significant
differences in gene expression were found These results may contribute to suggest that the
reduction in anthocyanin biosynthesis may be also due to enzyme inhibition or anthocyanin
degradation rather than a transcriptional effect (Mori et al 2007)
4 GENERAL AIMS OF THE THESIS
The present study is mainly focused on wine grape quality with the general aim of evaluating the
impacts of high temperature condition on grape quality From 1950 the majority of the worlds
highest quality wine-producing regions have experienced warming trends in growing season and this
condition is projected to have significant impacts on grape wine production quality and yield In
particular high temperatures after veraison can negatively affect grape composition expecially skin
anthocyanin accumulation in black berry varieties On these bases the present thesis aims to analyse
two trials both on cv Sangiovese which is the most cultivated variety in Italy characterized by
peculiar anthocyanins profile
The first trial is to appraise the effects of high temperature condition on flavonoids (anthocyanins
flavonols and condensed tannins) accumulation and particularly the mechanisms responsible for
lower anthocyanin content in berries ripened under elevated temperature via assessment of the main
berry biochemical compounds during ripening and of the activities of the putative key enzymes
which are involved in anthocyanins biosynthesis (such as UFGT and PAL) and their degradation
like peroxidases and polyphenol oxidases (PODs and PPOs) In addition the expression of some
genes responsible for flavonoids biosynthesis and degradation was assessed via Real time PCR A
further step was developed to recognize the best candidate genes responsible for anthocyanin
degradation under such stress condition throught a biotechnological approach of genes
transformation from grape to Petunia flower via Agrobacterium tumefaciens
Due to global warming in the last decades and in several warm wine regions a too high level of
sugar and subsequent wine alcohol excess low acidity and in black varieties unbalanced phenolic
ripening with insufficient berry skin colour has been shown at harvest The aim of the second trial is
to evaluate the effects of management techniques applied in the field on the canopy in post-
veraison (ie trimming ) on limiting the carbohydrate availability for cluster ripening to slow down
the accumulation rate of soluble solids in berries and to avoid the ldquouncouplingrdquo of sugar
accumulation versus phenolic synthesis during ripening
21
The present work started from the data obtained in a preliminary evaluation in 2009 and both in
2010 and 2011 the quantity and quality of different flavonoids as anthocyanins flavonols and
tannins were measured during ripening in berries of treated and control vines One of the main aims
of the second trial is to evaluate if the evolution of anthocyanins and skin and seed tannins is
conditioned by the rate of sugar accumulation
22
Chapter one First part
Biochemical and molecular approaches to study the effects of temperature
on grape composition in cv Sangiovese (Vitis vinifera L )
23
1 INTRODUCTION
In the last decades the majority of the worlds highest quality wine-producing regions have
experienced warming trends in growing season and this condition is projected to have significant
impacts on grape production quality (Jones at al 2005) The optimum temperature for berry growth
is among 20deg-25degC (Dookozlian 2000) Generally higher temperatures during grape ripening lead
to an increase in the rates of sugar accumulation and organic acid degradation Flavonol content is
reported to be more influenced by UV exposure rather than temperature (Spayd et al 2002) and
little is known about the effects of temperature increase on skin and seed proanthocyanidin
especially when applied after veraison
In black berry varieties grape coloration is due to anthocyanin accumulation in the skin which could
be negatively affected by temperature (Mori et al 2005 amp 2007 Kliewer amp Torres 1972 Tomana
et al 1979) But the mechanism responsible for colour reduction in berry skin at high temperature is
not completely clear While some researches in red table grape have determined that high
temperatures suppressed the expression of anthocyanin biosynthetic genes (Yamane et al 2006)
some other studies (in Cabernet Sauvignon) did not confirm this effect as mRNA accumulation of
anthocyanin biosynthetic genes and enzyme activity of UDP-Glucose Flavonoid Transferase
(UFGT) were not inhibited under high temperature (Mori et al 2007) Therefore it can be
hypothesized that temperature would affect not only the synthesis but also the stability of
anthocyanins (Shacked-Sachray et el 2002 Vaknin et al 2005 Mori et al 2005) and chemical or
enzymatic degradation of anthocyanins can be an answer to high temperature conditions involving
in the second option polyphenol oxidase and peroxidase (Mori et al 2007 Vaknin et al 2005)
Moreover temperature has been shown to have an effect on anthocyanins composition and some
authors suggested a highest thermal stability for the tri-substituted anthocyanins (particularly
malvidin derivatives) due to their chemical structure (Mori et al 2007 Cohen et al 2012)
So it is possible to hypothize different responses to high temperature between distinct grape
cultivars according their peculiar anthocyanin composition
To date no evidence has demonstrated the effects of elevated temperature on anthocyanin
accumulation and composition of cv Sangiovese characterized by monoglucoside anthocyanins
with high percentages of hydroxylated anthocyanins (mainly cyanidine-3-glucoside)
On these bases the aim of the present research is to evaluate the effects of high temperatures on
flavonoids (anthocyanins flavonols and condensed tannins) accumulation during ripening of
Sangiovese berries And in particular the mechanisms responsible for modification of the
anthocyanins content in berries ripened under elevated temperature conditions would be studied via
24
assessment of the activities of the putative key enzymes which are involved in anthocyanins
biosynthesis (such as Phenylalanine ammonium lyase (PAL) and UDP-glucose flavonoid 3-O-
glucosyltransferase (UFGT) and their degradation (like polyphenol oxidases (PPOs) and peroxidases
(PODs) In addition the expression of some genes involved in flavonoids biosynthesis and
degradation would be appraised via Real time PCR
2 MATERIALS AND METHODS
The study was conducted in 2010 and 2012 on respectively five and three years old uniform potted
plants of Vitis vinifera cv Sangiovese The vines grafted on SO4 rootstocks were grown in pots of
30 liter containing a mixture of sand and soil (1 1) In both years before the experiment the
number of shoots was standardized (around 9 shoots in 2010 and 6 in 2012) In addition in order to
have a uniform leaf area in all the vines the tip of each shoot was removed when 20 main leaves
were produced Before veraison (27th of July 2010 and 19th of July 2012) 8 and 12 uniform vines
were selected in 2010 and 2012 respectively on the bases of size of shoots and the bunch number
The selected vines were assigned to the two treatments LT (Low Temperature) and HT (High
Temperature)
In the LT treatment the vines were placed from pre-veraison to harvest in a plastic tunnel where the
minimum temperature was about 17 degC and the mean and maximum air temperatures were
maintained with a cooler below 26deg and 35degC
In the HT treatment the air temperature was similar to the ambient as the vines were distribuited in a
plastic tunnel which was open in the basal part and covered only the canopies to maintain the light
conditions similar to the LT vines In HT tunnel during the experimental period of 2010 the
minimum temperature was about 18deg and the mean air temperature was 26 degC while in 2012 they
were measured to be about 19deg and 28 degC respectively The maximum air temperaure could instead
exceed to 43degC and 44degC in 2010 and 2012 sequentially
Both tunnels were made of polyethylene film (MOP Bologna Italy) that did not alter the spectral
composition of light while the percentage of transmission was decreased by a maximum of 12
within the visible range
All the vines were daily watered automatically and well supplied with nutrients
21 Temperature monitoring
Berry skin temperature was monitored in 10 selected clusters of the plants in low temperature tunnel
(LT) and 10 clusters of the vines in high temperature tunnel (HT) in both years In each of these two
25
treatments temperature data were recorded from one week before veraison of both years until
harvest towards 10 T- type thermocouples (RS component MI Italy) positioned in the sub-cuticle
tissues of berry skin Each probe was then connected to a CR10X data logger (Campbell Scientific
Ltd Leicestershire United Kingdom) registering temperature data every 20 minutes and each one
hour in 2010 and 2012 sequentially The air temperature inside the tunnels were also monitored and
recorded each hour during the same period by air temperature sensors (TL20 3M Milan Italy)
22 Berry sampling
Berry sampling was conducted from 1 week before the veraison to the harvest in both years of the
trial In total 45 berries per each 8 vines and 30 berries per each 12 vines were sampled every 8 and
10 days in 2010 and 2012 respectively The 180 sampled berries for each of the two treatments were
pooled separately and divided into 4 biological replicates of 45 berries each to perform biochemical
and molecular analyses The berries of the first group (15) were weighed and immediately used for
degBrix titratable acidity and pH measurment All the other sampled berries were immediately frozen
in liquid nitrogen and kept in the freezer (-80 degC) until the analyses to evaluate the quality and the
quantity of the anthocyanins and flavonols (10 berries) skin and seed tannins (10 berries) and to
assess the gene expression and the enzymatic activity (10 berries)
23 degBrix titratable acidity and pH
The sampled berries were crushed and the must were sieved and used for degBrix analysis by a
temperature-compensating CR50 refractometer (Maselli Misure Spa PR Italy) Five mL of the
same must were then diluted 7 times with bi-distilled water and used to perform a titration reaction
by a Crison Compact Tritator (Crison Barcelona Spain) with 1N 05 N or 025 N NaOH (Sigma-
Aldrich St Louis MO USA) according to the stage of berry ripening to obtain pH and TA data
(expressed as gl of tartaric acid equivalents)
24 Analyses of anthocyanins and flavonols
The berries of each replication were sampled and weighted before the extraction of anthocyanins
and flavonols Then the skin was carefully removed from the pulp and immerged in 50 mL of
HPLC-grade methanol (Carlo Erba Reagents Milano Italy) and were kept in dark for 24 hours
The day after the extract was separated from the skin residues and conserved at (-20oC) until the
anthocyanins analysis
26
To analyze the total content of each flavonol aglycon an aliquot of 5 mL of the same methanol
extract was completely dried under vacuum To achieve the acid hydrolyzation of flavonols
glucosides the pellet was re-suspended in 25 mL of methanol and 25 mL of 2M Trifluoroacetic
acid (Sigma-Aldrich St Louis MO USA) in milliQ water The reaction was conducted at 100 oC in
a boiling hot water bath with a condenser for 2 hours The reaction product was then completely
dried under vacuum and the pellet obtained re-suspended in 1mL of methanol and was kept at (-
20oC) until HPLC analysis
HPLC separation and quantification of anthocyanins and flavonols were performed on a Waters
1525 instrument equipped with a diode array detector (DAD) using a reversed-phase column
Phenomenex (Castel Maggiore BO Italy) RP18 250 mmx4mm (5microM) with precolumn Either for
anthocyanins and flavonols the eluents used were the following A= HClO4 03 in milliQ water B
= methanol
For anthocyanin analysis the methanol extract was filtered through 022 microm 13mm PTFE syringe-
tip filters (Teknokroma Barcelona Spain) and an aliquot of 270 microL was diluted to final volume of
1mL with the A eluent The binary gradient was the same as reported in Mattivi et al (2006) with
suitable modifications The time for column equilibration was 5 minutes and the injection volume
was 60 microL Separation of the main free anthocyanins was obtained at 43 oC and they were quantified
at 520 nm with a calibration curve with malvidin-3-glucoside (Sigma-Aldrich ST Louis MO
USA)
Hydrolyzed flavonols samples were filtered through 045 microm 13 mm PTFE syringe- tip filters
(Teknokroma Barcelona Spain) directly into liquid chromatography vials Flavonols aglicones
were separated at 40deg C through the linear gradient as reported in Mattivi et al (2006)
The time for equilibration column and the injection volume were the same used for the HPLC-DAD
analyses of anthocyanins Quercetin myricetin and kaempferol were quantified at 370 nm with the
corresponding external standard purchased from Extrasynthese (Genay France)
25 Tannins analysis
To extract proanthocyanidins frozen berries samples (skins and seeds) were ground separately to a
fine powder under liquid N2 01 g aliquots were separated and extracted in darkness in 2 mL screw-
top Eppendorf tubes for 24 hours with 70 acetone containing 01 ascorbate (10 mL) to prevent
oxidation of polyphenols (Kallithraka et al 1995) Samples were then centrifuged (15 min 13000 x
g) and two 400 μL aliquots of the supernatant were transferred to fresh tubes and dried down under
vacuum at 35ordmC for 120 minutes
27
One of them was re-suspended in 100 μL methanol acidified with 1 HCl then neutralized with 100
μL sodium acetate (200 mM pH 75) for the analysis of free monomers The other aliquot
underwent acid-catalyzed cleavage of the proanthocyanidins in the presence of excess
phloroglucinol following the method of Kennedy and Jones (2001) Briefly the dried sample was
re-suspended in 100 μL of phloroglucinol buffer (025 g ascorbate 125 g phloroglucinol 215 μL
conc HCl 25 mL methanol) and incubated at 50ordmC for 20 minutes then neutralized with 100 μL of
sodium acetate (200 mM pH 75) and centrifuged (15 min 13000 x g) A 200 μL aliquot each of
the acetone extract the acetone extract after acid catalyzed cleavage and the residue after cleavage
was then transferred to Sun-broker 250 μL reduced volume HPLC auto-sampler vials Samples were
run on a Waters 1525 instrument equipped with a diode array detector (DAD) using a reversed-
phase column Phenomenextrade (Castel Maggiore BO Italy) RP18 250 mmx4mm (5microM) with
precolumn A separate reversed-phase HPLC method was developed for the cleaved and uncleaved
proanthocyanidin samples reading absorbance at 280 nm Uncleaved samples solvent A 02
phosphoric acid solvent B 41 acetonitrile02 phosphoric acid (gradient of solvent B zero min
0 5 min 10 40 min 10 55 min 17 65 min 19 75 min 19 80 min 100 85 min
100 86 min 0) Cleaved samples solvent A 02 acetic acid solvent B methanol (gradient of
solvent B zero min 1 40 min 1 120 min 30 1201 min 100 125 min 100 126 min
1) For both methods 25 μL of sample was injected and run at 30ordmC with a flow rate of 1 mLmin
Concentrations of free monomers and hydrolysed terminal subunits were determined from standard
curves prepared from commercial standards of catechin epicatechin epigallocatechin and
epicatechin-gallate obtained from Extrasynthese (France) The concentration of extension subunit-
phloroglucinol adducts was calculated from published molar extinction coefficients (Kennedy amp
Jones 2001) The evaluation of skin and seeds tannins was performed only on the samples of the
year 2010
26 Real-time PCR analyses RNA extraction and RNA evaluation
Real-time PCR analyses were performed for four and five selected stages of berry ripening in 2010
and 2012 respectively from beginning of veraison to the end of harvest Total RNA was isolated
from 200 mg and 500 mg in 2010 and 2012 respectively of the powdered berry skin tissue using
spectrumTM
Plant Total RNA kit (Sigma-Aldrich St Louis MO USA) following the manufacturers
protocol One microL of each RNA sample was measured spectrophotometrically to determine RNA
quantity and 260280 and 260230 ratio using a NanoDrop1000 Spectrophotometer (Thermo Fisher
Scientific Wilmington DE USA) Total RNA was treated with 1 U microg-1 RQ1 DNase (Promega
28
Milan Italy) First-strand cDNA was synthesized using 1 microg of RNA 1microL (dT)15 primer (500
microgmL) and 1 U of GoScripttrade reverse transcriptase (Promega) Quantitative RT-PCR was carried
out on a Step One Plustrade (Applied Biosystems Foster City California USA) Each reaction (10
microL) contained 188 nM of each primer 2microL of diluted cDNA (150) 5microL U of Power SYBRreg Green
PCR Master Mix (Applied Biosystems Foster City California USA) Thermal cycling conditions
were 95 degC for 10 min followed by 95 degC for 15 s 55 degC for 1 min for 40 cycles followed by a
melting cycle which contains 95 degC for 15 sec 60 degC for 1 min and 95 degC for 15 sec Each cDNA
sample was analyzed in triplicate Primers pairs for Dihydroflavonol 4-reductase (DFR)
Leucoanthocyanidin dioxygenase (LDOX) and UDP-glucose flavonoid 3-O-glucosyltransferase
(UFGT) were retrieved from literature (Goto-Yamamoto et al 2002) primers for VvMYBA1 were
from Jeong et al (2004) for Leucocyanidin reductase (LAR) and Anthocyanidin reductase (ANR
or BAN) from Bogs et al (2005) and for Peroxidase (POD6 ) from Mori et al (2007) Primers for
Flavanone 3-hydroxylase (F3rsquoHb) Flavonoid-3rsquo5rsquo-hydroxylase (F3rsquo5rsquoHk and F3rsquo5rsquoHi)
Phenylalanine ammonium lyase (PAL) Flavonol synthase (FLS) and Peroxidases (POD1 to POD5)
were newly designed on the original DNA sequences to amplify 150ndash250 bp gene fragments (Table
1)
29
Table 1 Sequence of primers used for Real time PCR amplification
Primer Forward Primer Reverse
DFR 5-GAAACCTGTAGATGGCAGGA-3 5-GGCCAAATCAAACTACCAGA-3
LDOX 5-AGGCTCTACTCTCCAAATGA-3 5-GAAGCTTGAAACACAGACCA-3
UFGT 5-AATCTGAGAGCCCTAAGAGA-3 5-GGTGGTACAAGCAACAGTTC-3
MYBA 1 5-TAGTCACCACTTCAAAAAGG-3 5-GAATGTGTTTGGGGTTTATC-3
LAR 5-TCTCGACATAAATGATGATGTG-3 5-TGCAGTTTCTTTGATTGAGTTC-3
BAN 5-CAATACCAGTGTTCCTGAGC-3 5-AAACTGAACCCCTCTTTCAC-3
PAL 5-ACATACCTAGTGGCACTCTG-3 5-TCGCAGAATCTCGATGGATG-3
F3Hb 5-TCCATCACCAAGTCTTCTAC-3 5-GCGGAGAAGCTGAACATGGA-3
F35Hi 5-CAGACTGCATACGCACTCTG-3 5-ATGCCGGATGGAGTTGAGAT-3
F35Hk 5-CCAGGCCTAGCTACTATATG-3 5-GCATATGGCATGGTGGTAGA-3
FLS 5-CTGCACTATCCAGAGATGAG-3 5-TTGCCGCTTCAACAACAACA-3
POD 1 5-TCTGAGTAAGAGCCCACACACTCT-3 5-GAGACCTGAGCAGATAAATACAAAAATAAA-3
POD 2 5-AAAGTTGTTTGGCTGTGG-3 5-AATCCCTCCAAACAATCA-3
POD 3 5-TGCTCTAAATGCCTGAAAAATG-3 5-ATCATATAGAAAAGTGACAGCAACCT-3
POD 4 5-CAACTTCACACCAACGGGAAA-3 5-GCAGCTGAGCAAGAAATGCTT-3
POD 5 5-TCGGTGAGGAACTCCGATA-3 5-AGCTTCCTTGTCCTCTTCCA-3
POD 6 5-AACTTGAGACACAACAGCATAAATAAATC-3 5-AGGACCAAATCACAGGATGATAAAG-3
ACT 5-ATTCCTCACCATCATCAGCA-3 5-GACGAGCCCCTCCTACTAAAACT-3
30
27 Enzyme assay
27 1 PAL activity assay
The extraction was performed according to the method of Mori et al (2005) with some
modifications The following procedures for protein extraction were conducted at 4deg C For each
replication 02 g of berry skin was ground with a mortar and pestle in liquid nitrogen until a fine
powder was obtained
The skin powder was homogenized with 15 mL of a 100 mM Sodium borate buffer (pH 9)
containing 0075 g of PolyVinyl-PolyPyrrolidone (PVPP) and 100 microL of a 200 mM Dithiothreitol
After incubation in ice for 20 minutes centrifugation was done at (4deg C 15 min 10000 x g)
Then 1mL of the supernatant was desalted by passing through a NAP-10 column (Sephadex G-25
Amersham Biotech) equilibrated with 15 mL of the same buffer
For the analysis of PAL activity the reaction mixture consisted of 05 mL of Phenylalanine and 05
mL of the enzyme solution The assay mixture was incubated in 37deg C for 60 minutes The reaction
was terminated by adding 05 mL of HCl acid (18) The quantity of the product namely Trans-
cinnamic acid was calculated using its extinction coefficient of 9630 M-1
cm-1
at 290 nm One unit
of PAL was expressed as synthesis of 1 mol of Trans-cinnamic acid per minute and PAL activity
was expressed as microkat g-1 protein
27 2 UFGT activity assay
The extraction was performed according to the method of Mori et al (2007) with some
modifications The following procedures for protein extraction were conducted at 4 oC For each
replication (02 g) of berry skin was ground with a mortar and pestle in liquid nitrogen until a fine
powder was obtained The skin powder was homogenized with 13 mL of a 250 mM TRISndashHCl
buffer (pH 75) containing 10 mM Polyethylene glycol 3400 150 microL of 10 mM Na-
diethyldithiocarbamate 15 microL of 200 mM Dithiothreitol and 2 microL of 2-mercaptoethanol and was
incubated for 20 min on ice After centrifugation of the homogenate at 10000 x g for 20 min The
supernatant was passed through a NAP-10 column (Sephadex G-25 Amersham Biotech)
equilibrated with a 15 mM TRISndashHCl buffer (pH 75)
The desalted crude extract was used as the enzyme solution in the following enzyme assay using
delphinidin and cyanidin as substrates The method of Mori et al (2007) was employed with some
modifications for the analysis of UFGT activity For the first assay the reaction mixture consisted of
02 mL of the previous extraction solution (containing TRISndashHCl buffer (pH 75) Polyethylene
glycol 3400 Na-diethyldithiocarbamate Dithiothreitol and 2-mercaptoethanol) 50 microL of 1mM
31
Cyanidin 50 microL of 100mM UDP-glucose and 02 mL of the enzyme solution The assay mixture
was incubated for 5 min at 37deg C The reaction was terminated by adding 150 microL of 5 HCl The
quantity of the product namely Cyanidin-3-glucoside was measured using its extinction coefficient
of 26900 M-1
cm-1
(at 520 nm pH 1)
Therefore one unit of UFGT was defined as the production of 1 mol of Cyanidin-3-glucoside per
second and UFGT activity was expressed as pkat g-1 protein
For the second assay the reaction mixture consisted of 02 mL of the same extraction solution
(containing TRISndashHCl buffer (pH 75) Polyethylene glycol 3400 Na-diethyldithiocarbamate
Dithiothreitol and 2-mercaptoethanol) 50 microL of 1mM Delphinidin 50 microL of 100mM UDP-glucose
and 02 mL of the enzyme solution The assay mixture was incubated for 5 min at 37deg C The
reaction was terminated by adding 150 microL of 5 HCl The quantity of the product namely
Delphinidin-3-glucoside was measured using its extinction coefficient of 26000 M-1 cm-1 (at 520
nm pH 1)
Therefore one unit of UFGT was defined as the production of 1 mol of Delphinidin-3-glucoside per
second and UFGT activity was expressed as pkat g-1 protein
27 3 Guaiacol PODs activity assay
Guaiacol PODs were assayed as described by Ushimaru et al (1997) using pyrogallol as the
electron donor for the reaction The plant material (skin) was extracted in cold buffer (200 mM
sodium phosphate 5 mM sodium EDTA 1 PVPP pH 70) and incubated on ice for 30 min After
centrifugation at (10000 times g 30 min 4 degC) the desalted supernatant was used for the assay The
reaction mixture (25 mL) included 22 mL of the 10 mM sodium phosphate buffer pH 70 100 microL
of the 25 mM H2O2 50 mM pyrogallol and 100 μl extract H2O2 and pyrogallol were prepared
fresh just before use Absorbance (λ=430 nm) was taken after 5 min incubation at room temperature
and referred to a blank with no extract added One unit of Guaiacol peroxidases is defined as the
amount of enzyme that catalyzes the oxidation of 1 μmol of pyrogallol per minute under the
conditions described by Chen and Asada (1989) and PODs activity was expressed as kat g-1 skin
fresh weight An absorbance coefficient of 247 mM-1 cm-1 was assumed for calculations
27 4 PPOs activity assay
PPOs were assayed as described by Ushimaru et al (1997) using pyrogallol as the electron donor
for the reaction The plant material (skin) was extracted in cold buffer (200 mM sodium phosphate
5 mM sodium EDTA 1 PVPP pH 70) and incubated on ice for 30 min After centrifugation at
32
(10000 times g 30 min 4 degC) the desalted supernatant was used for the assay The reaction mixture
included 28 mL of the 100 mM sodium phosphate buffer pH 70 1 mM pyrogallol and 100 μl
extract the pyrogallol was prepared fresh just before use Absorbance (λ=430 nm) was taken after 5
min incubation at room temperature and referred to a blank with no extract added One unit of
Polyphenol oxidases is defined as the amount of enzyme that catalyzes the oxidation of 1 μmol of
pyrogallol per minute under the conditions described by Chen and Asada (1989) and PPOs activity
was expressed as kat g-1 skin fresh weight An absorbance coefficient of 247 mM-1 cm-1 was
assumed for calculations
28 Vegetative and Yield measurements
In both years immediately after harvest all the leaves of each vine of the both tunnels were
removed and their areas were measured using a leaf area meter (LI3000 LiCor Inc Lincoln Neb
USA) along with the number of nodes of each single shoots
The grape bunches were harvested when the total soluble solids of berries had reached to
approximately 22 o
brix All bunches were removed counted and weighed in both treatments to
determine the yield of each vine
29 Statistical analyses
Data were submitted to analysis of variance and means were separated by the Student-Newman-
Keuls test by SAS statistical software (SAS Institute Cary North Carolina USA) The experiments
were conducted with four replications from each treatment and the values were the means of four
replications
3 RESULTS AND DISCUSSION
31 Berry Temperature
The berry temperature in both tunnels was influenced by the two air temperature regimes (HT and
LT) The average berry temperature in the LT tunnel during the ripening period of 2010 was
recorded to be about 20 oC while it was about 24deg C in HT In 2012 the average berry temperature in
both treatments were recorded to be about 2deg higher than in 2010
The maximum berry temperature in both years showed the highest differences between the two
treatments as it was maintained below 35 degC in LT and it might exceed to 42 degC in correspondence
of several heat weaves during the ripening in HT (Fig10)
33
The analyses of the number of hours exceeding the 30 and 35degC showed significant higher values in
both years in HT than in LT (Table 2 ) In particular the number of hours over 35deg C was null in LT
berries while it was about 70 and 157 hours in HT berries in 2010 and 2012 respectively Moreover
despite between the two years only few differences were found in mean and maximum berry
temperatures 2012 berries spent more hours at high temperature than in 2010 regardless from the
different treatments and the temperature fluctuations were higher during the ripening period of 2010
(Table 2) In addition in 2010 the percentage of the average berry temperature more than 30 degC
was about four folds more in the HT tunnels as compared to LT one while in 2012 this percentage
was six folds higher
Fig 10 The average and maximum daily berry temperature (oC) grown under high and low temperature conditions
during ripening in 2010 and 2012
34
Table 2 The percentage and the number of hours that the average of berry temperature was higher than 30deg and 35degC
in both treatments during the experimental period in the years 2010 and 2012
Total
experimental
time
(Ndeg hours)
Average berry
temperaturegt
35 degC
(Ndeg hours)
Average berry
temperature gt
30 degC
(Ndeg hours)
Average berry
temperature gt
35 degC
()
Average berry
temperature gt
30degC
()
Treatment Year
1176 hr 70hr 192 hr 6 163 HT 2010
0 55 hr 0 47 LT
1257 hr 157 hr 392 hr 1250 31 HT 2012
0 91 hr 0 7 LT
32 Leaf area and Yield
The plant materials used in this trial were not the same in the two years In 2010 and 2012
respectively five years old and three years old uniform potted vines were used for the treatments
Therefore the comparison could be done only between the treatments in each year and the year
effect would not be considered
In both years before the experiment the vines were uniformed for the number of shoots and clusters
in both treatments But the main lateral and total leaf areas per vine were significantly higher in LT
vines respect to HT (Table 3)
In 2010 the yield and its components were not significantly different between the LT and the HT
vines (Table 4) while in 2012 the yield was 36 more in LT as compared to HT ones Since the
cluster number per vine and the berry weight were similar in this year this result is mainly due to a
higher number of berries per cluster which imply that the cluster weight was higher in LT vines
(Table 4)
It seems that the higher temperature in HT may be responsible for drying out the basal leaves in HT
at the end of ripening and these conditions which have been assessed also by visual observation
caused a lower average leaf area compared to LT as the leaf area estimation was assessed after
harvest Besides the warmer condition of 2012 has been contributed to drop of some berries due to
the dehydration and drought in the very last period of ripening in HT Based on these
considerations it is likely that HT thermal condition did not show negative physiological effect on
vegetative growth and yield as the treatment was imposed at veraison and we registered a
ldquosecondaryrdquo effect due to the leaves and berry drop in the very last part of ripening
35
Table 3 Leaf area of grapes grown under high (HT) and low (LT) temperature conditions during ripening of the years
2010 and 2012
Year Treatments
Main Leaf area
(cm2vine)
Lateral Leaf area
(cm2vine)
Total leaf area
(cm2vine)
2010 LT 117425 105785 22321
HT 71682 80629 152311
2012 LT 13460 5690 19150
HT 6715 3742 10457
Table 4 Yield and yield components of grapes grown under high (HT) and low (LT) temperature conditions during
ripening of the years 2010 and 2012
Year Treatments No Cluster
Vine
Yield
Vine
(gr)
Cluster
weight
(gr)
Berry weight
(gr)
Berries per
cluster
(n)
LA Yield
per vine
(cm2 gr)
2010 LT 11 16666
1515
24 63 134
HT 12 18245
1520 21 72 835
ns ns ns ns ns
2012 LT 6 8616
1436
22 65 222
HT 5 5355 1071 21 51 196
ns ns ns
36
33 oBrix pH Titratable acidity
The results indicated that in 2010 a similar trend in the percentage of Total Soluble Solids in berries
grown under low and high temperature was measured and no significant differences was observed
among the two treatments in titratable acidity (TA) and pH However in 2012 the advanced ripening
in HT grapes was associated with higher level of oBrix during ripening nevertheless they reached
the same level at harvest Moreover it seems that the elevated temperature contributed to
degradation of titratable acids and increase in pH (Fig 11) There are contradictory reports on the
effects of high temperature on sugar accumulation in grape during different stages of berry
development Several papers (Matsui et al 1986 Sepuacutelveda and Kliewer 1986 Kliewer et al
1977) reported a general delay in ripening which is attributed to the impact of heat on the
photosynthetic supply of sugar Photosynthesis of grapevines is reduced at temperatures above 35 oC
(Kriedemann 1968 Ferrini et al 1995 Schultz 2003 Yu et al 2009 Zsoacutefi et al 2009) and
generally the restrictions to photosynthesis are caused by stomatal limitation As to Sepuacutelveda et al
(1986) prevention of the soluble sugar accumulation in berries by high temperature cannot be
accounted for an inhibition of the phloem transport between the leaves and the bunchs In contrary
Soar et al (2009) reported an increase in photosynthesis and stomatal conductance when Shiraz
vines were heated for short periods Moreover in some other researches sugar accumulation was not
influenced by temperature increase (Yamane et al 2006 Greer and Weston 2010)
In general tartaric acid concentration decrease after veacuteraison is mainly due to a dilution effect since
berry volume increase and amount of tartrate remains constant So far no enzymes degrading
tartaric acid have been ever found in grape In contrast the decrease in malic acid amount at the
beginning of ripening is associated with respiration and enzyme degradation as well as dilution
effect Malic acid may be therefore transformed to hexoses or used as energy source Metabolic
changes occurring during grape berry development (Taureilles-Saurel et al 1995) together with
light and temperature are the main parameters controlling the malate synthesisdegradation rate
Grape berries malic acid concentration at harvest is negatively correlated with temperature during
the ripening period It has been demonstrated that the optimum temperature range for acids synthesis
is between 20degC and 25degC and that with increasing temperature synthesis of malic acid decrease
and catabolic rate accelerate (Kliever et al 1967) These results are in accordance with the results of
this study and what was observed on the effects of elevated temperature in Cabernet Franc and
Chardonnay grapes where the pH increased and TA decreased Also the effects of higher
temperature induced by veraison defoliation had similar effects on pH and titratable acidity due to
the malic acid degradation (Guidoni et al 2004 Pastore 2011)
37
Fig 11 The trend of oBrix titratable acidity and pH of grapes grown under high (HT) and low (LT) temperature
conditions during ripening of the years 2010 and 2012
34 Biosynthesis of flavonoids
34 1 Anthocyanins accumulation during ripening
In both years the anthocyanin level in the skin of Sangiovese (Fig 12) started to increase after
veraison until harvest in both treatments Nonetheless in HT berries was significantly reduced
respect to LT ones As an illustration in 2010 the level of total anthocyanin at harvest was decreased
about 65 in the skin of the grapes grown under high temperature conditions as compared to LT
and at the harvest time of the year 2012 this reduction was 50 In agreement with the results on
other grape varieties (Darkridge grape Cabernet Sauvignon Tokay Japanese table grape Kyoho
Mori et al 2005 amp 2007 Kliewer amp Torres 1972 Tomana et al 1979) we found that in
38
Sangiovese high berry temperature (over 35degC) after veraison prevented anthocyanin formation in
grapes and greatly reduced the coloration as compared to fruits ripened at lower temperatures
According to HPLC analysis of the both years as expected the major individual anthocyanin in the
berry skin of both LT and HT treatments was malvidin-3-glucoside (Fig 12)
Anyway no differences in anthocyanin profiles were recorded at harvest between HT and LT grapes
in 2010 (Table 5) In 2012 at harvest the percentage of malvidin -3-G was higher in LT compared to
HT (Table 5)
Previous studies on Cabernet Sauvignon reported the higher thermal stability of malvidin-
derivatives anthocyanins due to the high level of methoxylation and acylation (Mori et al 2007
Romero and Bakker 2000 Morais et al 2002) but it is in contrast to our findings in this respect on
Sangiovese It has to be noticed that in Sangiovese the anthocyanin composition is quite different
from Cabernet Sauvignon and it is characterized by the high level of cyanidin-3G and by the
absence of p-coumarated and acetated malvidin derivatives anthocyanins
From the data of our two-year trials it is not possible to confirm the differences in thermal stability
of the five monoglucoside anthocyanins of Sangiovese based on their chemical structure And by
assessing solely the anthocyanins quantity and profile it was not possible to understand if the
reduction of anthocyanins under high temperature is due to biosynthetic activity reduction or to a
mechanism of anthocyanins degradation Therefore additional analyses were required in order to
obtain more comprehensive information about this issue
39
Fig 12 The trends of total and individual anthocyanins concentrations in the skin of Sangiovese berries grown under high (HT)
and low(LT) temperature conditions during ripening in the years 2010 and 2012
40
Table 5 The anthocyanin profiles at harvest in the skin of Sangiovese berries grown under high (HT) and low (LT)
temperature conditions during ripening in the years 2010 and 2012
Anthocyanin profile at harvest
Malvidin-3-G Petunidin-3-G Delphinidin-3-G Peonidin-3-G Cyanidin-3-G
2010 LT 36 13 11 18 22
HT 41 13 11 18 17
ns ns ns ns ns
2012 LT 43 14 11 16 16
HT 33 16 14 16 21
ns ns ns ns
34 2 Flavonols accumulation during ripening
In the both years the levels of flavonols in HT and LT berries increased gradually after veraison
and significant decrease was observed in the level of total and individual flavonols in HT berries as
compared to LT ones in 2012 (Fig 13)
In general the highest level of flavonols in grapes was found at flowering followed by a decrease as
the grapes increased in size Subsequently a significant level of flavonol biosynthesis is in general
observed during berry development and the greatest increase in flavonols per berry can be detected
3-4 weeks post-veraison (Downey et al 2003)
Flavonols accumulation in wine grape tissues has been studied extensively While several authors
reported a solid correlation between fruit light exposure and flavonol glucosides content (Price et al
1995 Haselgrove et al 2000 Spayd et al 2002) the effect of temperature on flavonol synthesis is
not understood completely Spayd et al (2002) and Mori et al (2005) did not observe any effect of
temperature treatment on flavonol synthesis To the contrary the inhibitory effect of high
temperatures on flavonol was also reported by Goto-Yamamoto et al (2009) Since in our research
we excluded the effect of different light exposure between the two treatments the lower
accumulation of flavonols in HT berries is probably due to a regulatory mechanism which rules the
anthocyanins response to high temperature condition
41
Moreover the analyses of each flavonol compound at harvest (quercetin kaempferol and myricetin
showed as expected that quercetin has the highest percentage The flavonols profiles at harvest in
the skin of Sangiovese berries grown under high and low temperature conditions during ripening
were similar in the year 2010 but it was significantly different among the treatments in 2012 (Table
6)
Fig 13 The trends of total and individual flavonols concentrations in the skin of Sangiovese berries grown under high
(HT) and low (LT) temperature conditions during ripening in the years 2010 and 2012
42
Table 6 The flavonols profiles at harvest in the skin of Sangiovese berries grown under high (HT) and low (LT)
temperature conditions during ripening in the years 2010 and 2012
Flavonols profile at harvest
Quercetin Kaempferol Myricetin
2010 LT 746 68 186
HT 735 75 189
ns ns ns
2012 LT 668 36 296
HT 642 26 332
34 3 Tannins accumulation during ripening
Tannins assessment was done in 2010 In this trial regardless from the treatments the amount of
total and individual tannins of seed and skin decreased generally from veraison to harvest This
result is in accordance with the previous works conducted by Harbertson et al (2002) Adams
(2006) and Kennedy et al (2001) From this research emerges that the two temperature regimes did
not affect the tannins branch of flavonoid biosynthesis This is comprehensible considering that
tannins are accumulated very early in berry development and the decline in their concentration from
veraison to harvest only reflects the quantitative changes that take place during berry ripening
(decrease of the tannins concentration in proportion to berry growth)
43
Fig 14 The trends of total and individual tannins concentrations in the berry seed and the skin of Sangiovese berries
grown under high (HT) and low (LT) temperature conditions during ripening in 2010
44
35 Gene expression assessment
In the present study the expression of some genes involved in the general flavonoid biosynthetic
pathway (PAL F3rsquoHb F3rsquo5rsquoHk F3rsquo5rsquoHi DFR LDOX) and the specific genes for anthocyanins
(UFGT and VvMYBA1) flavonols (FLS) and tannins biosynthesis (LAR BAN) were studied in
berries grown under two different temperature regimes (Fig 15)
In HT berries a strong reduction of anthocyanins and flavonols concentration and no effect on tannin
biosynthesis was observed and this seems to be directly related to the general inhibition of the
expression of flavonoids biosynthetic genes detected in this research (Fig 15) Furthermore it was
interesting to observe that even if the response in terms of total flavonoid accumulation was
comparable in 2010 and 2012 the flavonoid composition and the expression profile of some of the
analyzed genes was quite different between the two years of the experiment (Fig 15 Fig 16 Table
5 and 6)
The profile of PAL gene expression was mainly similar in the both years starting to increase in the
both treatments about 15 days after veraison PAL gene seemed to be repressed by high temperature
as a considerable higher level of expression in LT berries in respect to the HT ones was recorded in
both years about 37 days after veraison even if in 2010 it was not significantly different between the
two treatments This result is in agreement with many papers in which a direct correlation between
enhanced flavonoid accumulation (in particular anthocyanins) and increase in PAL gene expression
is reported (Pastore et al 2011 Ageorges et al 2006 Ban et al 2003 Roubelakis-Angelakis and
Kliewer 1986)
F3rsquo5rsquoHs and F3rsquoHs are versatile enzymes that are able to accept several phenylpropanoid substrates
and competitively control the synthesis of cyanidin- and delphinidin-flavonoid derivatives Two
isoforms of F3rsquoHs have been detected in grapevine genome until now (Castellarin et al 2006) In
this research the transcription of F3rsquoHb showed different profile of expression between the two
years of the trial In fact the transcription level of F3Hb was not affected or even induced by high
temperature 20 days after veraison in 2010 but we found exactly an opposite result in 2012 where
in LT berries a significant increase in F3rsquoHb expression was recorded 33 days after veraison in
comparison to HT
Studying the expression of F35Hi and F3rsquo5rsquoHk genes we observed that they were affected by high
temperature during ripening in both years showing similar transcription profiles Starting from full
veraison when all berries have turned red F3rsquo5rsquoHi expression increased in LT berries reaching a
maximum from one to two weeks after veraison in both 2010 and 2012 Also F3rsquo5rsquoHk expression
showed an increase in LT berries about 7 days after veraison in 2010 in comparison to HT and a
strong enhancement on F3rsquo5rsquoHk expression was observed in LT berries in 2012 (Fig 15) Sixteen
45
copies of F3rsquo5rsquoHs are present in the grapevine genome (Falginella et al 2010) suggesting a possible
role for each of them in different developmental and environmental conditions
The different patterns of expression observed for F3rsquoHb and F3rsquo5rsquoHs could suggest that the former
may be less sensitive in comparison to the latter to critical temperature conditions Considering that
the berry temperature in HT tunnel was higher in 2012 than 2010 (Table 2) it seems that F3rsquoHb is
able to tolerate thermal stress when temperature higher than 35degC are imposed for short periods as
in 2010 whereas in 2012 when HT berries spent more than two-fold hours at temperature higher
than 35degC in comparison to 2010 the F3rsquoHb expression is repressed From this study emerges that
at transcriptomic level the intensity and the extent of thermal stress could not affect in equal manner
the transcription of the gene that preside over the 3rsquo4rsquo- and 3rsquo4rsquo5rsquo-OH flavonoid biosynthetic
pathway in Sangiovese grape berry
In this research DFR and LDOX genes exhibited different patterns of expression in 2010 and in
2012 reaching maximum values in LT compared to HT 5 days after veraison in 2010 and 28 days
later in 2012 thus showed an expression pattern independent from the trend of anthocyanins
flavonols and tannins accumulation and from the timing of the temperature increase application
Our results are in agreement with previous findings reported that the expression of neither DFR nor
LDOX was as strongly correlated as UFGT and VvMYBA1 with anthocyanin content (Castellarin et
al 2007) and it is comprehensible if we consider that they can produce substrates for other branches
of flavonoid biosynthesis
Instead of that a strong correlation was found as expected in the expression of UFGT and of its
main transcription factor VvMYBA1 with the higher anthocyanins accumulation in LT vines
comparing to HT
Flavonol synthesis involves several genes encoding flavonol synthases (FLS) which are biosynthetic
enzymes converting dihydroflavonols to flavonol (Downey et al 2003) In both years the
expressions of FLS gene were similar between LT and HT berries in the early stages suggesting a
small effect of high temperatures on the transcription of this gene during veraison However FLS
started to be significantly higher in LT berries from mid of ripening and in 2012 a similar trend was
registered excepted at harvest when a significantly higher expression of FLS was registered in HT
(Fig 16)
Among the enzyme involved in tannins synthesis leucoanthocyanidin reductase (LAR) produces
catechin while anthocyanin reductase (BAN) converts cyanidin and delphinidin into epicatechin
and epigallocatechin respectively (Xie et al 2003 and Adams 2006 Fig 17) Bogs et al (2005)
found that in grape LAR is encoded by two closely related genes (LAR) whereas BAN enzyme is
46
encoded by a single gene (Fig17) As LAR1 appeared to be seed specific (Bogs et al 2005) only
LAR2 and BAN were analyzed in this study in 2010 In general timing and expression of BAN and
LAR2 genes is consistent with the accumulation of proanthocyanidins in the berry (Adams 2006)
This was further confirmed in this research where tannins analyses conducted on berry skin in 2010
showed no differences in terms of concentration and composition and as expected no differences
were found in the transcription of LAR2 and BAN during ripening
To better understand how the differences in gene expression could have or not influenced the
anthocyanins and flavonols composition also the timing and the coordination of flavonoid
biosynthetic genes has to be considered separately for the two years
In 2010 we detected a lack of variation in anthocyanins flavonols and tannins composition
following LT and HT treatment Following the treatment a coordinated transcription of F3rsquoHb
F3rsquo5rsquoHi F3rsquo5rsquoHk DFR LDOX UFGT and MybA1 was detected in LT berries which all reached a
maximum of expression 7 days after veraison (DAV) In HT the situation was quite different as for
F3rsquoHb and LDOX we found the highest expression 20 DAV when the transcription of DFR and
UFGT was already strongly reduced This shift and lack of synchronization could have hampered in
2010 the increase in the accumulation of 3rsquo4rsquo-OH flavonoids derivatives in comparison to LT
nevertheless the stability of F3rsquoHb transcripts detected in HT berries
In 2012 we found a statistically significant increase in malvidin and quercetin percentages in LT
berries in comparison to HT The concomitant stronger upregulation of F3rsquo5rsquoHi and F3rsquo5rsquoHk
starting from veacuteraison in LT compared to HT berries has to contribute to the increase in malvidin
concentration in LT berries in the second year of the trial Moreover in the same stage of berry
ripening also an increased expression of F3rsquoHb was recorded in LT berries and therefore the
biosynthesis of 3rsquo4rsquo-OH flavonoids should have been enhanced too Differently from what was
previously discussed for 2010 DFR and LDOX maximum expression was delayed in comparison to
the recorded peak of transcription for UGFT and VvMybA1 in both treatments It has to be
considered that FLS directly competes for its substrates with the enzyme DFR because they share
dihydroflavonols as the common substrates On this base probably there was a competition between
the biosynthesis of flavonols and anthocyanins in the both treatments but that contemporary
increase in the expression of F3rsquoHb DFR and FLS led to the rise of quercetin accumulation in LT
berries as compared to HT
47
Fig 15 Mean normalized expression of the genes involved in flavonoid biosynthetic pathway in berries grown under
high(HT) and low(LT) temperature conditions during ripening in 2010 and 2012
48
Fig 16 Mean Normalized expression of the FLS genes involved in flavonol biosynthesis in berries grown under
high(HT) and low(LT) temperature conditions during ripening in 2010 and 2012
Fig17 The mean normalized expressiom of the LAR and BAN genes in berries grown under high (HT) and low (LT)
temperature conditions during ripening in 2010
36 Activity of biosynthetic enzymes PAL and UFGT
In general the activity of PAL enzyme in both LT and HT berries increased gradually during
ripening but was considerably lower in HT plants in all sampling data from the end of full veraison
to harvest (Fig 18) This result is in agreement with the higher expression of PAL genes assessed in
LT berries
Using delphinidin and cyanidin as substrates in both years the activity of UFGT enzyme showed an
increasing trend from the end of full veraison to harvest in both LT and HT berries (Fig 19)
nonetheless a strong reduction was observed in HT plants compared to the LT ones during ripening
Also irrespective from thermal conditions UFGT activity at veraison was higher for cyanidin
compared to delphinidin as substrate (Fig 19) and this could be related to earlier expression of the
F3rsquoH genes (starting after full bloom) compared to the expression of the F3rsquo5rsquoH genes which begin
after veraison Basically these results confirmed the negative effects of high temperature on
anthocyanin biosynthesis at least for PAL and UFGT enzyme activities which showed a strong
correlation with anthocyanin concentration and confirmed to be the key enzymes of anthocyanin
biosynthesis pathway (Hrazdina et al 1984 Mori et al 2005 Boss et al 1996)
49
Fig 18 The trends of PAL activity (in one minute) in the skin of Sangiovese berries grown under high (HT) and low(LT)
temperature conditions during ripening in the years 2010 and 2012
Fig19 The trends of UFGT activity (Using cyanidin and delphinidin as substrate) in the skin of Sangiovese berries
grown under high (HT) and low(LT) temperature conditions during ripening in the years 2010 and 2012
50
37 Hypothesis for anthocyanin degradation
371 POD candidate genes
From the research conducted by Fasoli et al (2012) it can be realized that there are many different
isoforms of Peroxidases gene in different organs of grape As to recent researchers five POD
isoforms (labeled POD1 POD2 POD3 POD4 and POD5) are showed to be more expressed in
berry skin from veraison to harvest in Sangiovese (Pastore 2010) In addition to these 5 isoforms
another one (POD6) which was reported by Mori et al (2007) was assessed in this thesis
In 2010 Real Time experiment revealed that among these 6 genes that were studied in the berry skin
of Sangiovese only the expression of the genes POD1 and POD3 seem to be linked to the
temperature (Fig 20) The expression of POD1 and POD3 in HT detected to occur in different
patterns during the ripening but POD 1 was expressed with a similar trend in both years
Fig 20 Mean Normalized expression of the selected POD genes involved in anthocyanin biosynthetic pathway in the in
berries grown under high (HT) and low(LT) temperature conditions during ripening in 2010 and 2012
51
372 Activity of enzymes involved in anthocyanin degradation PODs and PPOs
In the both years the PODs activity during ripening showed a significant increase in HT berries
compared to LT (Fig 21) supporting the hypothesis of anthocyanin degradation in response to high
temperature (Vaknin et al 2005 amp Mori et al 2007)
It has been reported that peroxidase is involved in the active anthocyanin degradation of Brunfelsia
calycina flowers (Vaknin et al 2005) and in presence of H2O2 in the vacuoles of grape cells
(Calderon et al 1992) Our findings are coherent with other papers since heat stress can contribute
to H2O2 accumulation in plant tissue (Date et al 1998) and so PODs-anthocyanins reaction may act
as a scavenging mechanism for H2O2 and plant cell detoxification in high temperature conditions
(Yamasaki et al 1997 Pourcel at al 2007)
It is interesting to note that in this experiment we could not find any PPOs activity likely due to the
plastidial localization of this enzyme (Dry amp Robinson 1994) and so we demonstred the lack of
direct involvement in active anthocyanin degradation under high temperature conditions in Vitis
vinifera
Fig 21 The trends of PODs activity in the skin of Sangiovese berries grown under high (HT) and low (LT) temperature
conditions during ripening in the years 2010 and 2012
52
4 CONCLUSION
In the present study we examined the contents of anthocyanins flavonols and tannins the
expression of some biosynthetic genes involved in their synthesis and the activities of some related
enzymes in grape berries of Sangiovese cv grown under different thermal conditions in two
different years
Anthocyanins and flavonols accumulation in Sangiovese cv revealed to be very sensitive to high
temperature (showing a reduction over 50 in total anthocyanin concentration at harvest) Several
mechanisms such as a general inhibition of the expression of flavonoids biosynthetic genes and of
the activities of some flavonoids biosynthetic enzymes (PAL and UFGT) associated with a
stimulation of some putative anthocyanin degradation enzymes (PODs) showed to be involved in the
inhibitory effect of high temperatures on anthocyanin accumulation A similar mechanism may be
supposed for flavonols degradation
This study showed that the temperature regimes after veacuteraison have different effects on each
flavonoid group in grape berry because in conterary to anthocyanins and flavonols that were
reduced in the skin of grapes ripened under high temperature environments after veraison seed and
skin tannins were not affected by the same conditions
Furthermore the warmer condition verified in 2012 compared to 2010 and the different flavonoid
composition and expression profile of some of the analyzed genes in the two years may suggest a
different sensitivity to high temperature of some genes involved in anthocyanins biosynthesis
53
Chapter one Second Part
Recognition of putative POD genes involved in anthocyanins degradation
under high temperature condition
54
1 INTRODUCTION
Petunia has played a central role in transformation research since the earliest reports of plant
transformation It was a key model system when the first definitive accounts of Agrobacterium-
mediated transformation and direct DNA transfer established the transfer and expression of foreign
genes in plants Petunia subsequently played an important role in elucidating many of the
characteristics of plant transformation One of the key reasons for the importance of Petunia in plant
transformation research has been the selection for andor identification of genotypes well suited to
growth and regeneration in culture Ease of transformation coupled with other favorable biological
characteristics ensures that Petunia will remain a valuable model system for studies of gene
function in plants (Conner et al 2009) Moreover Petunia hybrida is one of the classical subjects of
investigation of plants pigmentation in which the pathway of anthocyanin biosynthesis has been
analyzed genetically and biochemically (Meyer et al 1987 Quattrocchio et al 2006) Although the
information about Petunia sequenced genome is somehow limited it can be still used as model
species in this important field of study for the obvious ease of detecting mutants for this pathway It
can also be actively employed in complementation studies with genes from other species such as
grape (Venturini 2009)
Therefore in the second phase of this trial regarding to the results obtained from the assessment of
the expression of the genes involved in anthocyanin degradation at elevated temperature gene
transformation was conducted with different isoforms of peroxidases genes from Vitis vinifera (cv
Sangiovese) to Petunia hybrida with the aim of recognizing the most effective candidate genes for
anthocyanins degradation under high temperature
2 MATERIALS
21 Gene selection
In the first phase of this trial the expressions of 6 different isoforms of Peroxidases genes that were
showed to be more expressed in berry skin from veraison to harvest (Fasoli et al 2012 Mori et al
2007) were assessed via Real Time-PCR subsequently according to that results 3 different
isoformes were selected to transform Petunia hybrida
22 Escherichia coli strain and culture media
The DH10B strain was provided by Invitrogenreg and features the mutations recA1 endA1 presence
of the gene lacZM15 and high transformation efficiency Moreover it didnrsquot carry any antibiotic
resistance genes
55
221 Luria-Bertani (LB) medium
Component Concentration (gl)
Yeast extract 5
Tryptone 10
NaCl 10
Agar 15
Final pH 75
The medium was sterilized in an autoclave (121degC for 20 minutes 2 atm) After sterilization
antibiotic (kanamycin) was added to the solution for a final concentration of 50 mgl
222 SOC medium
Component Concentration (gl)
Yeast extract 5
Tryptone 20
After sterilization in an autoclave (121degC for 20 minutes 2 atm) glucose and salts sterilized by
filtration (filters with ores of 02 m diameter) were added to the solution at the following
concentrations
Component Concentration
NaCl 10 mM
KCl 25 mM
Glucose 20 mM
MgCl2 10 mM
MgSO4 10 mM
Final pH 68-70
56
23 Agrobacterium tumefaciens strain and culture media
For Petunia hybrida transformation the super virulent EHA105 Agrobacterium tumefaciens strain
was chosen (Hellens et al 2000) The bacteria possess a disarmed helper Ti plasmid (pTIBo542ΔT-
DNA) encoding the necessary sequences for the transfer of the T-DNA region which is carried by a
second shuttle plasmid the pK7WG20 The two plasmids are defined as binary vectors The cells
containing both plasmids can be selected for with the use of the following antibiotics
Antibiotic Concentration Resistance
Rifampicin 50 mgl Genomic
Streptomycin 300 mgl pK7WG20
Spectinomycin 100 mgl pK7WG20
231 YEB Medium
Component Concentration
Yeast extract 1 gl
Tryptone 5 gl
Beef extract 5 gl
Sucrose 5 gl
MgSO4 5 Mm
Agar 15 gl
Final pH 75
The medium was sterilized in an autoclave (121degC for 20 minutes 2 atm) After sterilization
antibiotics (streptomycin 300 mgl spectinomycin 100 mgl and rifampicin 50 mgl) were added to
the solution for selective mediums
57
24 Vectors
241 pENTRtradeD-TOPOreg (2580 bp)
Feature Benefit
rrnB T1 and T2 transcription terminators Protects the cloned gene from expression by vector- encoded
promoters thereby reducing possible toxicity in E coli
attL1 and attL2 sites
Allows sequencing in the sense orientation Bacteriophage λ-derived
DNA recombination sequences that allow recombination cloning of the
gene of interest from a Gatewayreg expression clone or attB PCR
product (Landy 1989)
TOPOreg Cloning site directional Allows a fast and directional cloning
M13 forward and reverse primer sequences Allow sequencing of the insert
Kanamycin resistance gene Allows selection of the plasmid in E coli
pUC origin Allows high-copy replication and maintenance in E coli
Fig 22 a scheme of the pENTRtradeD-TOPOreg vector
242 pK7WG20
A scheme for vector pk7WG20 is presented in Fig 23 It is a binary vector used as destination
vector in the Gatewayreg technology The T-DNA comprises the marker gene nptII which confers
58
resistance to kanamycin The cloning of an exogenous genes in this position implies an LR
recombination between the 35S CaMV constitutive promoter and the terminator 35S
Fig 23 Schematic representation of the pK7WG20 vector
25 Primers
The Primers pairs for POD1 to POD5 were newly designed on the original DNA sequences to
amplify 150ndash250 bp gene fragments and the Primers pairs for the POD6 was referred to Mori et al
(2007) (Table 7)
Subsequently according to the results of those expressions 3 different isoformes (POD 1 POD 3
and POD 5) were selected to transform Petunia hybrida
59
(Table 7) (POD 1-6) The primers of the selected isoforms of the Peroxidases genes for RT-PCR and (POD 1-3
cloning) The primers of the selected isoforms of the Peroxidases genes for cloning
primer Forward primer Reverse
POD 1 5-TCTGAGTAAGAGCCCACACACTCT-3 5-GAGACCTGAGCAGATAAATACAAAAATAAA-3
POD 2 5-AAAGTTGTTTGGCTGTGG-3 5-AATCCCTCCAAACAATCA-3
POD 3 5-TGCTCTAAATGCCTGAAAAATG-3 5-ATCATATAGAAAAGTGACAGCAACCT-3
POD 4 5-CAACTTCACACCAACGGGAAA-3 5-GCAGCTGAGCAAGAAATGCTT-3
POD 5 5-TCGGTGAGGAACTCCGATA-3 5-AGCTTCCTTGTCCTCTTCCA-3
POD 6 5-AACTTGAGACACAACAGCATAAATAAATC-3 5-AGGACCAAATCACAGGATGATAAAG-3
POD 1 cloning 5-cacc atg gca ttg atc ctc ttt tc-3 5-cta gtt taa ggc atc aca cc-3
POD 3 cloning 5-cacc atg tct ctt ctc gtt ctt ctc-3 5-tta aga ttc cag gag tgt gtc-3
POD 5 cloning 5-cacc atg aga aaa ctt atg gag gc-3 5-tta aag ttc agc aga agc ttc-3
26 Plant materials
Petunia hyrida line W84xV30 (P axillaris X P inflata) has become an attractive system for
genetic molecular and complementation studies as it possesses many desirable characteristics
colored flowers whose dimensions (5-6 cms) allow for relative ease of dissection and separation of
floral organs rapid growth cycle (2-3 months from seeds to full bloom) ease and rapidity of genetic
transformation via infection with disarmed Agrobacterium tumefaciens
This species has a limited number of chromosomes (n=7) and a small genome (12 times 106 kb) In
particular the line W84 is not capable of expressing a Glutathione S-transferase PhAN9 (Alfenito et
al 1998) and hence to accumulate anthocyanins in the vacuole leading to a fading color phenotype
However the W84 line had proved difficult to transform in previous experiments with the GST4
gene To overcome this problem a new Petunia hybrida line was generated by crossing W84 with
the V30 cultivar and recovering the mutated offspring after self-crossing This W84xV30 line was
used in all subsequent experiments
The peroxidases genes were isolated from Vitis vinifera (cv Sangiovese) (the plant materials used in
the first part of this chapter)
60
Fig 24 Petunia hyrida ndash line W84xV30
3 METHODS
After the PCR amplification of our selected genes with proof-editing PFU enzyme DNA
purification was done directly from the PCR product and used for the TOPOregCloning reaction
following the protocol provided by Invitrogen kit
31 Transformation of Escherichia coli by heat shock
After the TOPOregCloning reaction the DNA was added to the E coli DH10B competent cells and
the mixture left in ice for other 30 minutes Cells were incubated at 42degC without agitation for 30
seconds and then rapidly transferred into ice 250 microL of SOC medium provided by Invitrogen kit
kept at room temperature was added to the culture and the re-suspended cells were incubated at
37degC with agitation (200 rpm) for 1 hour 100- 200 l of the solution was placed on to a solid LB
medium and left at 37degC overnight
32 Preparation of competent cells of A tumefaciens
To obtain Agrobacterium tumefaciens strain EHA105 cells competent for the transformation by
electroporation a single colony was inoculated into 3 mL YEB medium containing Rifampicin (50
mgl) and incubated at 28degC overnight with vigorous shaking When the culture reaches the
exponential growth phase (usually after 12 hours characterized by an OD600 equal to 09-10) 15
mL of solution was sampled and centrifuged at 14000 rpm for 1 minute at room temperature The
pellet thus obtained was washed to eliminate antibiotic and re-suspended three times in 500 l cold
and sterile glycerol 10 (vv) at each step the solution was centrifuged at 14000 rpm for 1 minute
at room temperature Finally the pellet was re-suspended in 40 l of cold and sterile glycerol 10
(vv) The cells were ready to be electroporated
61
33 Transformation of A Tumefaciens by electroporation
A Bio-Rad device for electroporation was used for this experiment calibrated at 25 F 200 and
25 kV 1 or 2 microL of DNA plasmid (20 ng) was re-suspended in 40 l of competent cells The
operation was performed in ice The mix was transferred into a pre-cooled electroporation cuvette
the cuvette was then inserted into the Bio-Rad device and subjected to a pulse of 25 kVcm at 200
Ohm immediately after the pulse 1 mL LB without antibiotics was added in sterile conditions The
suspension was recovered and grown in a propylene tube with agitation for one hour at 28degC so that
the cells can express the resistance gene The cells were placed in 100 ndash 200 l aliquots on to YEB
solid medium containing Spectinomycin (final concentration 100 mgl) Rifampicin (final
concentration 50 mgl) and Streptomycin (final concentration 300 mgl) The Petri dishes were
incubated at 28degC for two days The transformation efficiency of this method is 8x10⁵ cfug DNA
34 Colony PCR
To detect bacterial recombinant clones which carry a fragment of interest it is possible to perform
the colony PCR consists of a single bacterial colony for a final volume of 20 μl A sterile tip is used
to sample the colony from the solid culture medium and dissolved in the reaction mix
35 Plasmid DNA extraction
To purify the plasmid DNA of colony which resulted positive by PCR bacteria were put in 5 mL of
liquid LB with the correct antibiotic to grow overnight at 37degC with agitation The extraction of
DNA plasmid was carried out on the base of ldquoQIAprepreg Spin Miniprep Kitrdquo (Qiagen) following the
manufacturersquos instruction
36 Purification of PCR products
To purify the PCR products the protocol of the kit provided by Promega Wizardreg SV Gel and PCR
clean-up system was performed
37 GATEWAYreg cloning system
The Gatewayreg Technology (Invitrogen) is based on the bacteriophage lambda site-specific
recombination system which facilitates the integration of lambda into the E coli chromosome and
the switch between the lytic and lysogenic pathways This recombination method facilitates transfer
62
of heterologous DNA sequences (flanked by modified att sites) between vectors Two recombination
reactions constitute the basis of the Gatewayreg Technology
Site Length Function
attL 100bp Entry clone Entry vector
attR 125bp Destination vector
38 LR Recombination reaction
LR Recombination reaction was performed following the protocol provided by Invitrogen
This reaction facilitates recombination of an attL substrate (entry clone) with an attR substrate
(destination vector) to create an attR-containing expression clone (see diagram below)
Fig 25 a scheme of the Gatewayreg cloning system
Componente Volume
Entry clone (100 ηg) 1 microL
Destination Vector (150 ηg) 1 microL
5X LR Clonase buffer 2microL
Sterile water 6 microL
63
The Entry-clone vectors had been generated with independent ligation reactions in the pENTRTM
D-
TOPOreg vector containing the attL1 and attL2 sites It was therefore possible to perform directly the
recombination reaction with the destination vector pK7WG20
The solution is incubated for 1 hour at 25degC then 1 μl of the Proteinase K enzyme (Invitrogen) is
added to the mix which is placed for an additional 10 minutes at 37degC At this point it is possible to
perform the transformation of the competent E coli DH10B cells
39 TOPO cloning reaction
TOPOreg cloning reaction was performed following the Invitrogen protocol for electro-competent E
coli cells
Reagents Chemically Competent E coli Electrocompetent E coli
Fresh PCR product 5 to 4 μl 05 to 4 μl
Dilute Salt Solution (14) -- 1 μl
Salt Solution 1 μl --
Sterile Water add to a final volume of 5 μl add to a final volume of 5 μl
TOPOreg vector 1 μl 1 μl
Final volume 6 μl 6 μl
The mix reaction was incubated in ice for 20 minutes then the cells were incubated at 42degC without
agitation for 30 seconds and then rapidly transferred into ice followed by the procedure of
Transforming One Shotreg TOP10 Competent Cells provided by Invitrogen kit
310 RNA extraction and Real time PCR
Real-time PCR was performed to evaluate the expression of six different isoforms of peroxidases
genes for five selected stages of grape berry ripening from beginning of veraison to the end of
harvest For each sampling 3 biological replicates were analyzed Total RNA was isolated from 200
mg of the powdered berry skin tissue using SpectrumTM
Plant Total RNA kit (Sigma-Aldrich St
Louis MO USA) following the manufacturers protocol One microL of each RNA sample was
measured spectrophotometrically to determine RNA quantity and 260280 and 260230 ratio using a
64
NanoDrop1000 Spectrophotometer (Thermo Fisher Scientific Wilmington DE USA) Total RNA
was treated with 1 U microg-1 RQ1 DNase (Promega Milan Italy) First-strand cDNA was synthesized
using 1 microg of RNA 1microL (dT)15 primer (500 microgmL) and 1 U of GoScripttrade reverse transcriptase
(Promega) Quantitative RT-PCR was carried out on a Step One Plustrade (Applied Biosystems Foster
City California USA) Each reaction (10 microL) contained 188 nM of each primer 2microL of diluted
cDNA (125) 5microL U of Power SYBRreg Green PCR Master Mix (Applied Biosystems Foster City
California USA) Thermal cycling conditions were 95 degC for 10 min followed by 95 degC for 15 s 55
degC for 1 min for 40 cycles followed by a melting cycle which contains 95 degC for 15 sec 60 degC for 1
min and 95 degC for 15 sec Each cDNA sample was analyzed in triplicate Gene transcripts were
quantified as reported by (Pastore 2010) The Primers pairs for POD1 to POD5 were newly
designed on the original DNA sequences to amplify 150ndash250 bp gene fragments and the Primers
pairs for the POD6 was referred to Mori et al (2007) (Table 7)
311 Stable transformation of Petunia hybrida
The protocol is applied under a laminar flow cabinet to ensure sterility Young apical leaves are
harvested and kept in water to avoid dehydration They are subsequently sterilized with a solution of
05 sodium hydrochloride in which they are dipped for 10 minutes followed by 5 washings of 10
minutes each in bi-distilled water The tips borders and petioles are removed with a sterilized
scalpel while the rest of the leaf is cut in three sections The leaf pieces are immersed in a solution
110 of overnight grown Agrobacterium tumefaciens transformed with a selected gene for 20
minutes so that the bacteria could attach to the explants after which they are transferred to a Petri
dish containing solidified Medium I (supplemented with Folic acid (1 mgmL) NAA (01 mgmL)
6-BAP (2 mgmL) without antibiotics) Each Petri dish can hold up to 10 discs The Petri dishes are
sealed and stored in a growth chamber at 25degC under day-night regime (with a long day light period
of 16 hours of light) After 2-3 days the explants are transferred into a new Petri dish filled with
medium II which contains two antibiotics 500 mgl carbenicillin to stop Agrobacterium growth and
300 mgl kanamycin to select the transformed explants The explants were transferred to fresh
selective plates each 2-3 weeks and the explants were constantly checked against contamination
with molds or other pathogens After about 8 weeks the shoots regenerated from the calluses were
removed and transferred onto the rooting medium (medium III supplemented with 500 mgl
carbenicillin and 50 mgl kanamycin) After the roots were sufficiently developed the medium was
washed away from the roots were put in jiffy pots and were grown in greenhouse Petunia hybrida
plants grow and flower in about 2 to 3 months
65
3111 Medium I
Component Concentration
Sucrose 20 gl
Glucose 10 gl
MS-macro amp micro elements with Gamborg B5 vitamins (Duchefa M0231) 44 gl
Plant Agar 8 gl
The pH is adjusted to 57-59 with HCl and KOH The medium is sterilized in an autoclave for 20
minutes and after it has reached 60deg C the following hormones are added
Component Concentration
Folic acid 1 mgl
6-BAP 2 mgl
NAA 01 mgl
3112 Medium II
Medium II is obtained from Medium I with the addition of the antibiotics needed for the eradication
of Agrobacterium tumefaciens and the selection of transformed calluses They are as thermolabile as
the phytohormones and must therefore be injected in the medium only after it has reached a
temperature lower than 60deg C
Component Concentration
Carbenicillin 500 mgl
Kanamycin 300 mgl
66
3113 Medium III
The composition of Medium III is identical to that of Medium I but without the addition of
phytohormones Also the following antibiotics are added to the medium
Component Concentration
Carbenicillin 500 mgl
Kanamycin 50 mgl
312 Agro-infiltration of petunia petals
Agro-infiltration represents recent advancements in Petunia transformation This is a technique for
transient gene expression and the development of intragenic vectors to affect gene transfer without
the integration of ldquoforeignrdquo DNA
One mL of the Agrobacterium culture grown overnight for inoculation of 25 mL of LB liquid
medium was added to 300 μgmL Streptomycin 100 μgmL Spectinomycin 20 μM Acetosyringon
and 10 mM MES and was incubated to grow overnight at 28 o
C at 180 rpm After centrifugation for
20 minutes at 12000 rpm the pellet was re-suspended with 15 mL of the buffer below After adding
100 μl of the inoculums to 900 μl of the re-suspending buffer the OD (Optical Density) was
measured spectrophotometrically and the following formula was used for dilution of the inoculums
up to the final volume of 50 mL
3121 Resuspending buffer
Component Concentration
MgCl2 10mM
MES 10mM
Acetosyringone 100 μM
The volume of the inoculums = [05 (The optimal OD) times 50 (The final volume)] divide [(The read OD
via spectrophotometer) times 10]
67
Afterward 100 μM of Acetosyringone was added to the inoculums and the mixture was incubated in
room temperature for 2-3 hours
The bacterial suspension was infiltrated into the upper layer of petals using a 1mL syringe without a
needle Infiltrated flowers were kept at 25 oC for 36 to 48 hours after infiltration
313 DNA extraction from Petunia
The DNA was extracted from a Petunia hybrida leaf disc ground thoroughly in 400 l of extraction
buffer Then the extract was centrifuged and 300 microL of the supernatant was mixed with 300 microL of
isopropyl alcohol After the incubation at room temperature for 15 minutes and centrifugation the
pellet was dried at room temperature under a fuming hood and subsequently re-suspended in 100 microL
of sterile bi-distillated water and incubate overnight in the refrigerator To discard any remaining
impurities the tube was centrifuged again and the supernatant transferred to a new sterile tube
3131 Extraction buffer
Component Concentration
Tris HCl pH 80 200 mM
NaCl 250 mM
SDS 1
EDTA 25 mM
-mercaptoethanol 10 mM
314 PCR of transformed Petunia genomic DNA
PCR amplification was performed on Petunia genomic DNA in a final volume of 20 μl As the
primer forward Promoter 35 S and as the primer reverse the specific primer for ldquoPOD 1cloningrdquo
was used As the negative control the genomic DNA of the Wild type line was used as the template
68
3141 Reaction Mix
Component Stock Volume
Template DNA 1 l
Buffer (containing MgCl2) 10x5x 4 l
Nucleotides 10 mM 04 l
Primers 20 M 04 l
Taq 5000 umL 01 l
3142 Standard thermal cycle
Initial denaturation 94 degC 5rsquo
Denaturation 94 degC 40rdquo
Primers annealing 55degC 40rdquo X 35 cycles
Extension 72 degC 90rsquorsquo
Final extension 72 degC 7rsquo
315 RNA extraction from Petunia hybrida petal
Petunia petals from the young expanded flowers were immediately frozen in liquid nitrogen and
then were kept in the freezer (-80 o
C) until analyses were carried out Total RNA was isolated from
200 mg of the powdered petal using spectrum TM
Plant Total RNA kit (Sigma-Aldrich St Louis
MO USA) following the manufacturerrsquos protocol One microL of each RNA sample was measured
spectrophotometrically to determine RNA quantity and 260280 and 260230 ratio using a
NanoDrop1000 Spectrophotometer (Thermo Fisher Scientific Wilmington DE USA)
316 cDNA synthesis RT PCR reaction
After controlling the RNA via the electrophoresis gel total RNA was treated with 1 U microg-1 RQ1
DNase (Promega Milan Italy) First-strand cDNA was synthesized using 1 microg of RNA 1microL (dT)15
primer (500 microgmL) and 1 U of GoScripttrade reverse transcriptase (Promega) PCR amplification was
69
performed on the derived cDNA for a final volume of 20 μl As the primers once the Primers pair
of actin was used and subsequently for the RT- PCR amplification the specific primers of ldquoPOD
1cloningrdquo (Table 7) were used
3161 Reaction Mix
Component Stock Volume
Template DNA 1 l
Buffer (containing MgCl2) 10x5x 4 l
Nucleotides 10 mM 04 l
Primers 20 M 04 l
Taq 5000 umL 01 l
3162 Standard thermal cycle
Initial denaturation 95 degC 5rsquo
Denaturation 95 degC 30rdquo
Primers annealing 55degC 30rdquo X 35 cycles
Extension 72 degC 20rsquorsquo
Final extension 72 degC 7rsquo
317 Total anthocyanin measurement
Petunia petals from the young expanded flowers were selected in 5 biological replicates for the
transformed plants and wild type line They were immediately frozen in liquid nitrogen ground and
the fine powder was weighted before the extraction of anthocyanins The powder was homogenized
with the solvent mixture of methanol 99 with HCl 1 at the volumes of eightfold of the powder
Then the mixture was sondicated for 20 minutes
This is the act of applying ultrasound energy to agitate particles in a sample It is applied using an
ultrasonic bath All the procedures were conducted at 4 oC After the centrifugation at 12000 rpm
70
for 10 minutes at 4 oC an aliquot of the supernatant was diluted 140 and the total anthocyanin was
quantified spectrophotometrically at 540 nm
318 Heat shock performance
Young petunia flowers in 5 biological replicates for the transgenic plants and wild type line were
selected for the heat shock To carry out this experiment the flowers were cut with a long pedicle
and some small leaves and were placed in a falcon of water They were kept for one hour in the
incubator at 45 oC and transferred subsequently to the room temperature After 30 hours the petals
were frozen in liquid nitrogen ground and the fine powder was weighted to evaluate the activity of
Guaiacol Peroxidases enzyme and the total anthocyanin
319 Guaiacol Peroxidases activity assay
Guaiacol peroxidases was assayed as described by Ushimaru et al (1997) using pyrogallol as the
electron donor for the reaction The plant material was extracted in cold buffer (200 mM sodium
phosphate 5 mM sodium EDTA 1 PVPP pH 70) and incubated on ice for 30 min After
centrifugation at (10000 times g 30 min 4 degC) the desalted supernatant was used for the assay The
reaction mixture (15 mL) included 1140 μl of the 100 mM sodium phosphate buffer pH 70 60 microL
of the 25 mM H2O2 60 mM pyrogallol and 240 μl extract H2O2 and pyrogallol were prepared
fresh just before use Absorbance (λ=430 nm) was taken after 25 min incubation at room
temperature and referred to a blank with no extract added One unit of Guaiacol peroxidases is
defined as the amount of enzyme that catalyzes the oxidation of 1 μmol of pyrogallol per minute
under the conditions described by Chen and Asada (1989) and PODs activity was expressed as kat
g-1
petal fresh weight An absorbance coefficient of 247 mM
-1 cm
-1 was assumed for calculations
4 RESULTS
The aim of this trial is recognizing the most effective candidate genes responsible for anthocyanins
degradation under high temperature conditions during the ripening time Among the candidates for
anthocyanin degradation peroxidases are involved in active anthocyanin degradation in living
tissues (Vaknin et al 2005 Welinder et al 2002) In addition the results obtained from the
enzymatic activity of peroxidases at elevated temperature and the expression of this gene during
ripening supports the hypothesis of its role in anthocyanin degradation On these bases the
technique of gene transformation was conducted with different isoforms of peroxidases genes from
Vitis vinifera (cv Sangiovese) to Petunia hybrida
71
41 Gene selection
From the research conducted by Fasoli et al (2012) it can be realized that there are different
isoforms of Peroxidases gene in different organs of grape that among them only 5 isoforms are
showed to be more expressed in berry skin from veraison to harvest In addition to these isoforms
there was another one which was reported by Mori et al (2007) to be expressed in grape berry
skin
Fig 26 The expression value of the different isoforms of Peroxidases in berry skin from veraison to harvest (V
Veacuteraison MR Mid-ripening R Ripening) Fasoli et al (2012)
As to the expression of these different isoforms by Real time pcr 3 of them were selected for the
transformation to Petunia hybrida
Fig 27 Mean Normalized expression
of the selected POD genes isolated from
berry skin for the transformation to
Petunia hybrida
72
Among all the three isoforms only the POD 1 could be successfully isolated from grape berry skin
and transformed to Petunia
42 The sequence of the POD1 gene
Vv14s0066g01850 (POD1)
ATG GCA TTG ATC CTC TTT TC
TCTACTATTCTTTCTGGGATTAGTGAACCCTTCGGAGTCCAGGTTGAGTGTCAACTACTACCAAAAATCATGCCCAAGA
TTCAGTCAGATCATGCAGGATACCATCACCAACAAGCAAATCACCAGCCCCACCACGGCTGCGGCCACTCTCCGCCTC
TTCTTCCACGACTGCTTCATTGAGGGCTGCGATGCTTCCGTTCTTGTCTCCTCGACCCCCTTCAACGAGGCCGAGCGCGA
TGCCGACATGAACCTCTCCCTCCCCGGCGACGGCTTCGACGTCGTTGTCCGCGCCAAGACCGCCCTCGAGCTCGCTTGC
CCCGGTGTGGTCTCCTGTGCCGACATTCTCGCCGTCGCTACCCGCGATCTCGTCACCATGGTGGGAGGTCCCTTCTACA
AGGTCCCGCTGGGGAGAAGAGATGGGCTGGTCTCCCGGGCGAACAGGGTTGAAGGTAACCTTCCAAGACCCACGATG
TCCATTTCTCAGATAATTTCGATTTTCGCTGTGAGAGGGTTCTCGGTTCAAGAAATGGTGGCGCTGAGTGGTGCCCACA
CGATTGGGTTCTCGCATTGTAAAGAATTCAGCAGCGGGATCTACAATTACAGCCGCAGTTCCCAGTCCAATCCGAGCTA
CAACCCTAGATTCGCAGAGGGGTTGAGAAAAGCTTGCAGCGATTACCAGAAGAATCCTACATTGTCGGTGTTCAACGA
TATAATGACTCCCAACAAGTTCGATAACATGTATTTCCAGAATCTGCCCAAGGGTTTGGGGCTATTGGCGACGGACCAT
ACCATGGCTACCGATCCGAGGACGAGGCAGTTTACGGATTTGTATGCCAAGAATCAAAGCGCCTTCTTTGAGGCATTT
GGTCGAGCTATGGAGAAGCTTGGCCTTTATGGGATCAAGACCGGGCGAAGAGGAGAGATTCGACGCA GG TGT GAT
GCC TTA AAC TAG
Vv14s0066g01850 (POD1) genomic
AAGGCTTCTGAGTAAGAGCCCACACACTCTCCATTGCTGCCACTACCACTGGCTTTTTTTTTTATTTTTGTATTTATCTGC
TCAGGTCTCTGAGCTTTGAGCTCTGAGAAACAATGGCATTGATCCTCTTTTCTCTACTATTCTTTCTGGGATTAGTGAAC
CCTTCGGAGTCCAGGTTGAGTGTCAACTACTACCAAAAATCATGCCCAAGATTCAGTCAGATCATGCAGGATACCATC
ACCAACAAGCAAATCACCAGCCCCACCACGGCTGCGGCCACTCTCCGCCTCTTCTTCCACGACTGCTTCATTGAGGGCT
GCGATGCTTCCGTTCTTGTCTCCTCGACCCCCTTCAACGAGGCCGAGCGCGATGCCGACATGAACCTCTCCCTCCCCGG
CGACGGCTTCGACGTCGTTGTCCGCGCCAAGACCGCCCTCGAGCTCGCTTGCCCCGGTGTGGTCTCCTGTGCCGACATT
CTCGCCGTCGCTACCCGCGATCTCGTCACCATGGTGGGAGGTCCCTTCTACAAGGTCCCGCTGGGGAGAAGAGATGGG
CTGGTCTCCCGGGCGAACAGGGTTGAAGGTAACCTTCCAAGACCCACGATGTCCATTTCTCAGATAATTTCGATTTTCG
CTGTGAGAGGGTTCTCGGTTCAAGAAATGGTGGCGCTGAGTGGTGCCCACACGATTGGGTTCTCGCATTGTAAAGAAT
TCAGCAGCGGGATCTACAATTACAGCCGCAGTTCCCAGTCCAATCCGAGCTACAACCCTAGATTCGCAGAGGGGTTGA
GAAAAGCTTGCAGCGATTACCAGAAGAATCCTACATTGTCGGTGTTCAACGATATAATGACTCCCAACAAGTTCGATA
ACATGTATTTCCAGAATCTGCCCAAGGGTTTGGGGCTATTGGCGACGGACCATACCATGGCTACCGATCCGAGGACGA
GGCAGTTTACGGATTTGTATGCCAAGAATCAAAGCGCCTTCTTTGAGGCATTTGGTCGAGCTATGGAGAAGCTTGGCCT
TTATGGGATCAAGACCGGGCGAAGAGGAGAGATTCGACGCAGGTGTGATGCCTTAAACTAGGTTTTTAAGGTTTTTTTT
TTTTTTTTTGCATTACAAACTCCCACCGTAGTGATGATCAATCAAGGTGAATTGATGGTGAGGGGGTGGTTTCATTTGA
ATTCTTTTTTTTTTTGTTGT
73
43 Gene transformation
After amplification of POD1 gene with PFU enzyme and specific POD1 primers (Table 7 Fig 28)
the E coli transformation was performed via pTOPO cloning system The day after a single colony
of DH10B cells that was grown on solid LB was transferred into 10 mL of liquid LB containing the
appropriate kanamycin antibiotic (for a final concentration of 50 mgl) and incubated overnight at
37deg and 250 rpm Afterward the pcr amplification of the colony was done to detect bacterial
recombinant colonies which carried the fragment of interest
Therefore 2 plates were designed to amplify each colony two times (Fig 29)
In the first plate the combination of the primer forward of M13 was used with the specific primer of
POD 1 reverse and simultaneously in the second plate the same colony was amplified with the
primer forward of POD1 with the M13 reverse The primers pair M13 gives the possibility to
amplify the fragment 50 bp longer than our inserted gene Consequently only the colonies which
were amplified in the correct position in the both plates had successfully carried the fragment of
interest (Fig 29)
Fig 28 Amplification of POD 1 gene by PFU
74
Fig 29 Colony PCR of POD 1 gene (The colonies marked with a star sign in the both gels are the ones with our
fragment of interest)
After the sequencing of the insert in the plasmid the LR recombination reaction was performed
The colony PCR was done using the ldquoPROMOTER 35 Srdquo as the primer forward and the primer
ldquoSONDA TERrdquo as the reverse The fragment 1575 bp was amplified The colony marked with a star
sign is the one with our fragment of interest (Fig 30) and the plasmid DNA was extracted and the
insert fragment of 1375 bp was amplified with the primer forward ldquoPROMOTER 35 Srdquo and the
specific primer reverse of ldquoPOD 1cloningrdquo (Table 7) (Fig 31)
75
Fig 31 The plasmid DNA (PK7WG2) control
After the transformation of A Tumefaciens the positive colonies were checked by pcr amplification
of the Agro-plasmid with the primer forward ldquoPROMOTER 35 Srdquo and the specific primer reverse of
ldquoPOD 1cloningrdquo (Fig 32) The plasmid DNA PK7WG2 was used as the positive control
Fig 30 The PK7WG2 Colony PCR of POD 1 gene
76
Fig 32 The pcr amplification of the Agro-plasmid (PC) Positive control (NC) Negative control (P1 - P5) Agro-
plasmids
Afterward the stable transformation of Petunia hybrida was done In addition at the same time the
Agro-infiltration of petunia petals was performed and the bacterial suspension was infiltrate into the
upper layer of petals Infiltrate flowers were then kept at 25 oC for two days but the flowers were
wilted without any change observed After 4 to 5 months two plants derived from the two
independent stable transformations grew in selective medium containing kanamycin and flowered
and were propagated asexually by cutting
To control the transformation efficiency the DNA was extracted from a Petunia hybrida leaf disc of
the two transgenic lines a wild type line and also as a positive control the plasmid DNA PK7WG2
was used The pcr amplification was done with the primer forward ldquoPROMOTER 35 Srdquo and the
specific primer reverse of ldquoPOD 1cloningrdquo (Fig 33)
77
As to the obtained results (Fig 33) both plants were transformed successfully To investigate the
expression of the transgene in the two lines RNA was extracted from the petal of the transgenic
plants and from the wild type line used as negative control and retro transcript to cDNA By pcr
amplification performed with the primers pairs of Actin the correct retro transcription of the RNA
was evaluated Then to analyze the expression of the transgene VvPOD1 in the petunia petal the
RT-PCR was performed with the specific primers pairs of ldquoPOD 1cloningrdquo
According to the (Fig 34) the fragment of 1kb was amplified and observed only in the second lane
confirming that the POD1 gene was expressed successfully in the Petunia hybrida line 2
Fig 33 The PCR amplification to control the transformation efficiency (TP1) Transgenic petunia 1st pot (TP2)
Transgenic petunia 2nd pot (WTL) Wild type line (PC) Positive control (NC) Negative control
78
0
5
10
15
20
25
30
35
40
45
50
Wild type line
control
POD plants
control
Wild type line
Heat shocked
POD plants
Heat shocked
To
tal
an
tho
cyan
in
A
BB
C
Fig 34 The RT-PCR of POD1 gene in the transformed plant (TP1) Transgenic petunia 1st pot (TP2) Transgenic
petunia 2nd pot (WTL) Wild type line
44 Heat shock and the plant response
Subsequently flowers from the transgenic line 2 (which expressed the POD1 gene) and from the
wild type were selected in 5 replicates and treated with the heat shock in order to highlight the
possible role of POD1 in anthocyanin degradation under stress condition
The same number of flower replicates of wild type and the transgenic line 2 were selected as the
control ie not subjected to the heat shock The petals of the treated flowers together with the
control ones were grounded by liquid nitrogen and the fine powder was weighted and divided in to
two in order to evaluate the activity of Guaiacol Peroxidases enzyme and the total anthocyanin
(Fig 35 36)
Fig 35 Total anthocyanin content of wild type line and POD plants
79
0
5
10
15
20
25
30
Wild type
line control
POD plants
control
Wild type
line Heat
shocked
POD plants
Heat shocked
(Kat
gr
-1 F
W)
C
B
C
A
By comparing the total anthocyanin content of the wild type and the transgenic lines before and after
heat treatment we found that the total anthocyanin content of the wild type line was significantly
similar in the both control and shocked treatment (Fig 35) After the heat shock the level of the
total anthocyanin in the transgenic petunia was reduced significantly However the total
anthocyanin content of the POD flowers in control was surprisingly highest among the others
Fig 36 The Peroxidase activity of wild type line and POD plants in the control and heat shock treatment
The enzymatic activity of peroxidase in both wild type and transgenic line 2 was evaluated before
and after the treatment
The wild type flowers showed the same level of enzymatic activity before and after the treatment
(Fig 36) The peroxidase activity was higher in the transgenic line in both control and the shocked
flowers However heat shock treatment contributed to significantly increase the peroxidase activity
in transformed flowers (Fig 36)
80
5 CONCLUSION
Most of the works studied the effects of temperature on anthocyanin accumulation has dealt with
the effects on the biosynthesis of anthocyanins (Mori et al 2007)
Yamane et al (2006) discussed the possibility of the contribution of another mechanism (eg
anthocyanin degradation) to the inhibitory effect of high temperature on anthocyanin accumulation
To date no report has demonstrated the enhancement of anthocyanin degradation due to high
temperature in plant tissue Hence the present study is the pioneer to show that the mechanism of
anthocyanin loss in grape skins due to high temperature involves not only the inhibition of
anthocyanin biosynthesis but also its enzymatic degradation
As to the results of this research and the literatures (Vaknin et al 2005 Mori et al 2007) among
the different candidates peroxidases (PODs) are reputed to be the main responsible for degrading
the anthocyanin pigment in vivid tissues
There are many isoforms of Peroxidases gene in different organs of grape that among them only 6
isoforms are reported to be more expressed in berry skin from veraison to harvest (Fasoli et al 2012
and Mori et al 2007)
Therefore in order to recognize the most important gene that encodes the peroxidase enzyme in
Sangiovese grape under stress condition selected isoforms of POD were isolated from Vitis vinifera
(cv Sangiovese) berries and transformed to Petunia hybrida Afterward the expression of the POD1
gene and the activity of the peroxidase enzyme were assessed in the transgenic petunia and were
compared to the wild type line under the stress condition
The obtained results could confirm that the level of total anthocyanin was decreased in the living
Petunia suffered from the heat stress this was under the circumstance that the level of the
peroxidase enzyme was significantly higher in those plants
On these bases it can be figured out that peroxidases can be considered as the responsible for
anthocyanin degradation in living tissues and the decrease of total anthocyanin content in the plants
faced to an abiotic stress such as the excessive high temperature What is more among the different
isoforms of the tested peroxidases genes the POD 1 isoform (with the sequence mentioned before)
can be identified as one of the propellant in this respect
81
Chapter two
Effects of late-season source limitations induced by trimming on grape
composition during ripening in Vitis vinifera cv Sangiovese
82
1 INTRODUCTION
Grape wine production showed a higher sensitivity to climate variability and the ongoing climatic
changes have already caused phenological alterations in some viticultural areas and are expected to
continue in the future (Jones et al 2005 Schultz 2000 Duchene and Schneider 2005) Besides
over the last fifty years an overall upgrading of vineyard management techniques which lead to a
general wine quality improvement has been verified As consequence in wine regions where heat
summations largely exceed technological requirements for the grown grape varieties a too high
level of sugar and subsequent wine alcohol excess low acidity alteration of aroma composition
and in black varieties unbalanced phenolic ripening with insufficient berry skin colour has been
shown at harvest
Accumulation of sugars is probably more responsive to temperature variations than accumulation of
anthocyanins because the optimal temperature for sugars biosynthesis and transport ranges from 8
to 33 degC while for anthocyanin pathway range from 17 to 26 degC Moreover high temperatures
(above 30-35 degC) have been the inhibitor of anthocyanin accumulation (Kliewer 1970- 1977 Mori
et al 2007 Movahed 2011) The relationship between tannins and high temperature is not clear but
some authors reported that seed tannin concentration was less susceptible to changes in temperature
conditions respect to anthocyanins (Cortell et al 2007a Ristic et al 2007) Moreover while soluble
solids and anthocyanins sysnthesis starts at veraison tannins were produced several weeks before
veraison and then their concentration in the berry starts to decrease following by a plateau at later
berry ripening stages (Kennedy et al 2000 2002) In other word it seems that there are differential
effects of temperature increase on the evolution of different berry traits in particular when they
occure after veraison On these bases the hypothesis is that the slowing down of sugars
accumulation rate may allow to achieve full ripeness of phenolic compounds mainly anthocyanins
and tannins As well known fruit sugar accumulation can be decreased by grape-growers for
example via bud load and yield increases but for the production of high quality wine it is not
allowed to exceed foreseen thresholds by the Appellation rules
A different approach to slow down sugar accumulation is represented by source limitation as the rate
of soluble solids increase in berries is well related to the ratio between leaf area to yield (Kliewer
and Dokoozlian 2005) In particular several researches showed that the removal around veraison of
the more young and efficient part of the canopy may be effective in reducing sugar accumulation
(Reynolds and Wardle 1989 Intrieri et al 1983 Intrieri 1994)
Although the relationship between sugar accumulation and leaf area to yield ratio is well
documented the evolution of some phenolic compounds in relation to leaf area efficiency and sugar
83
content in berries remain unclear Sugar has been shown to stimulate anthocyanin accumulation in
grape (Pirie and Mullins 1976 Larronde et al 1998 Hiratsuka et al 2001 Gollop et al 2002) but
it has been also reported that anthocyanins exhibit an initial phase of rapid increase strongly
correlated to sugar accumulation and a second phase where anthocyanins and sugars are uncoupled
(Guidoni et al 2008)
Moreover several studies with red wine cultivars in which crop was adjusted by means of cluster
thinning increasing the leaf area to yield ratio resulted in improved soluble solids anthocyanins
total phenols and colour intensity (Filippetti et al 2007 Pastore et al 2011Guidoni et al 2002
Reynolds et al 1994)
As well known the prediction of wine colour and quality based on berry composition is a difficult
task but the aim of this trial is to understand (i) if post veraison trimming is effective to slow down
the rate of sugar accumulation and (ii) to verify the possible derived alterations after treatment in
anthocyanins and tannins accumulation and in their compositional changes during ripening
compared to control in Vitis vinifera L cultivar Sangiovese
2 MATERIAL AND METHODS
This trial was conducted in 2009 2010 and 2011 on Sangiovese vines (V vinifera L clone 12T
grafted on 3309C) planted in 1994 in Ozzano Emilia Bologna Italy (44deg25N 11deg28E) Vines were
spaced 15 m on the row and 3 m between the rows and they were trained to Free Cordon (16 buds
per vine)
Twenty-four vines in four blocks (6 vines per block) were randomLy assigned within each block to
the following treatments
a) Non-trimmed control (C)
b) Shoot trimming 1 week after full veraison which left 8 nodes on every main shoot (TRIMM)
Trimming was performed when berry sugar concentration reached around 15deg -18deg Brix and
precisely 6th August 2009 (17 days after veraison) 10th August 2010 (17 days after veraison) and
4th August 2011 (6 days after veraison)
21 Vegetative and yield data
In each year before trimming and at harvest two regressions between shoot length (main and
lateral) and their actual leaf area were calculated and used to estimate leaf area of all tested vines At
84
trimming the main and lateral leaves were removed and leaf area was measured with a leaf area
meter (LI-3000A Li-Cor Bioscences Lincoln Nebraska USA) At harvest time the crops of each
individual plant were gathered separately and the number of clusters and their weights were
recorded
Weather data (mean daily air temperature and rainfall) were recorded from April to September in the
both years at a meteorological station located close to the experimental site
22 Berry sampling
In each year every ten days from veraison to harvest samples of 20 berries per plant were
collected pooled per each block (120 berries) and divided in three subsamples (40 each) for
determinations of the following parameters
a) Berry weight and must biochemical parameters (soluble solids pH and titratable acidity) on 20
berries performed immediately after sampling
b) Skin anthocyanins on 10 berries immediately stored in -20deg C and kept there until the analyses
c) Skin and seed tannins on 10 berries immediately stored in -20deg C and kept there until the
analyses
23 Analyses of main must biochemical parameters
The 20 sample berries were crushed and the must were sieved and used for degBrix analysis by a
temperature-compensating CR50 refractometer (Maselli Misure Spa PR Italy) Five mL of the
same must were then diluted 7 times with bi-distilled water and used to perform a titration reaction
by a Crison Compact Tritator (Crison Barcelona Spain) with 1N 05 N or 025 N NaOH (Sigma-
Aldrich St Louis MO USA) according to the stage of berry ripening to obtain pH and Titratable
Acidity (TA) data (expressed as gl of tartaric acid equivalents)
24 Analyses of skin anthocyanins
The berries sampled were weighted before the extraction of anthocyanins Then the skin was
carefully removed from the pulp and immerged in 50 mL of HPLC-grade methanol (Carlo Erba
Reagents Milano Italy) and were kept in dark for 24 hours The day after the extract was
separated from the skin residues and conserved at (-20degC) until the analysis
85
HPLC separation and quantification of anthocyanins were performed on a Waters 1525 instrument
equipped with a diode array detector (DAD) using a reversed-phase column Phenomenex (Castel
Maggiore BO Italy) RP18 250 mmx4mm (5microM) with precolumn The eluents used were the
following A= HClO4 03 in milliQ water B = methanol
The methanol extract was filtered through 022 microm 13mm PTFE syringe-tip filters (Teknokroma
Barcelona Spain) and an aliquot of 270microL was diluted to final volume of 1mL with the A eluent
The binary gradient was the same as reported in Mattivi et al (2006) with suitable modifications
The time for column equilibration was 5 minutes and the injection volume was 60 microL Separation of
the main free anthocyanins was obtained at 43 degC and they were quantified at 520 nm with a
calibration curve with malvidin-3-glucoside (Sigma-Aldrich ST Louis MO USA)
25 Tannins analysis
To extract proanthocyanidins the sampled berries (skins and seeds) were ground separately to a fine
powder under liquid N2 01 gr aliquots were separated and extracted in darkness in 2 mL screw-top
Eppendorf tubes for 24 hours with 70 acetone (10 mL) containing 01 ascorbate to prevent
oxidation of polyphenols Samples were then centrifuged (15 min 13000 g) and two 400 μL
aliquots of the supernatant were transferred to fresh tubes and dried down under vacuum at 35ordmC for
120 minutes
One of them was re-suspended in 100 μL methanol acidified with 1 HCl then neutralised with 100
μL sodium acetate (200 mM pH 75) for the analysis of free monomers The other aliquot
underwent acid-catalysed cleavage of the proanthocyanidins in the presence of excess
phloroglucinol following the method of Kennedy and Jones (2001) Briefly the dried sample was
resuspended in 100 μL of phloroglucinol buffer (025 g ascorbate 125 g phloroglucinol 215 μL
conc HCl 25 mL methanol) and incubated at 50ordmC for 20 minutes then neutralised with 100 μL of
sodium acetate (200 mM pH 75) and centrifuged (15 min 13000 g)
A 200 μL aliquot each of the acetone extract the acetone extract after acid catalysed cleavage and
the residue after cleavage was then transferred to Sunbroker 250 μL reduced volume HPLC
autosampler vials Samples were run on a Waters 1525 instrument equipped with a diode array
detector (DAD) using a reversed-phase column Phenomenex (Castel Maggiore BO Italy) RP18
250 mmx4mm (5microM) with precolumn A separate reversed-phase HPLC method was developed for
the cleaved and uncleaved proanthocyanidin samples reading absorbance at 280 nm Uncleaved
samples solvent A 02 phosphoric acid solvent B 41 acetonitrile02 phosphoric acid
86
(gradient of solvent B zero min 0 5 min 10 40 min 10 55 min 17 65 min 19 75
min 19 80 min 100 85 min 100 86 min 0) Cleaved samples solvent A 02 acetic
acid solvent B methanol (gradient of solvent B zero min 1 40 min 1 120 min 30 1201
min 100 125 min 100 126 min 1) For both methods 25 μL of sample was injected and run
at 30ordmC with a flow rate of 1 mLmin Concentrations of free monomers and hydrolysed terminal
subunits were determined from standard curves prepared from commercial standards of catechin
epicatechin epigallocatechin and epicatechin-gallate obtained from Extrasynthese (France) The
concentration of extension subunit-phloroglucinol adducts was calculated from published molar
extinction coefficients (Kennedy amp Jones 2001)
3 RESULTS AND DISCUSSION
31 Climatic data
The Growing Degree Days (GDD 10 degC baseline) from April 1st to September 30th (Table 8 Fig
37) were highest in 2011 (2054) and lowest in 2010 (1718) Moreover the average daily temperature
recorded from veraison to harvest in 2011 was mostly (70 of the period) above 25deg C In addition
in 2011 the level of the rainfall from April to September was only 136 mm whereas in 2010 the
rainfall in the same period was found to be three times more (Table 8 Fig 37)
Table 8 The climatic conditions in 2009 2010 and 2011
Year Rain from April to
September (mm)
DD from April to
September (degC)
Number of days with average daily
temp gt 25deg C from veraison to
harvest
2009 269 1963 24
2010 390 1718 7
2011 136 2054 29
87
Fig 37 The yearly recorded rainfall and daily average temperature from April 1 to September of 2009 2010 and 2011
32 Vegetative and productive traits
All vines were quite uniform in terms of leaf area before trimming in all years (data not shown) The
TRIMM treatment induced a leaf area reduction around 60 in 2009 and 2010 and around 40 in
2011 compared to control The trimming of the upper part of the canopy affected mostly the laterals
compared to the main leaves especially in 2010 (Table 9) It is interesting to note that in 2010 a
significant higher leaf area was recorded compared to 2009 probably due to the more favourable
seasonal climatic conditions during the first phase of shoots growth No laterals re-growth was
measured after treatments in all years
88
Starting from a uniform bunch number per meter of cordon yield cluster weight and berry weight
were unaffected by treatments in 2009 (Table 9) In 2010 and 2011 yield and cluster weight were
significantly lower in TRIMM vines compared to control while berry weight didnrsquot show any
difference A year-by-year variability in terms of yield was verified In 2010 yield was significantly
higher than in 2009 and 2011 for both treatments and due to the setting of uniform buds and
clusters number per vine it might be almost entirely a result of cluster weight increase (Table 9)
Berry weight did not differ between treatments during ripening (Fig38) in all the tested years
Moreover the number of berries per cluster was significantly lower in TRIMM vines compared to C
in 2010 and 2011 (Table 9)
At harvest the leaf areayield ratio was reduced in TRIMM vines to very low values corresponding
to 038 and 039 m2kg in 2009 and 2010 respectively compared to 101 and 082 m
2kg in the
control vines which are considered optimal for ripening in Free Cordon (Table 9) In 2011 probably
due to the low yield level registered in TRIMM vines the leaf area yield ratio reached a value of
093 m2kg which was not significantly different from C and that may allow an optimal ripening
(Table 9)
Despite we did not evaluate the starch content in the different parts of the tested vines it would be
expected that the TRIMM vines subjected to leaf area reduction ranging from 40 to 60 after
veraison induced further remobilization of reserves (Candolfi-Vasconcelos et al 1994) The
possible carbohydrate reserve depletion in 2009 and 2010 induced by defoliation could be
responsible for yield constraint mainly due to reduction of flower numbers per inflorescence
(Scholefield et al 1977 Bennett et al 2005)
89
Table 9 Vegetative growth and yield components recorded over 2009ndash2011 in C and TRIMM vines
Parameters 2009 2010 2011 Year
effect
Year x
Treatment
Interaction
C TRIMM C TRIMM C TRIMM
Main LA after
trimming
(m2m of cordon)
144 a 056 b 177 a 096 b 121 a 071 b ns ns
Laterals LA after
trimming
(m2m of cordon)
079 a 025 b 112 a 018 b 059 a 030 b ns ns
Total LA after
trimming
(m2m of cordon)
223 a 081 b 289 a 114 b 180 a 101 b ns
Cluster
(nm of cordon)
105 a 106 a 111 a 102 a 101 a 102 a ns ns
Yield
(kgm of cordon)
22 a 21 a 35 a 29 b 143 a 108 b ns
Cluster weight (g) 2108
a 1966 a
3121
a 2868 b 1473 a 1045 b ns
Berry weight (g) 155 a 153 a 170 a 169 a 128 a 123 a ns
Berries per cluster (n) 136a 1285a 1835a 1697b 1150a 850b ns
Leaf area yield
(m2kg)
101a 038b 082a 039b 125a 093a ns
Different letters indicate mean separation between treatments C and TRIMM within rows and years by t -test P = 005
P = 001 year x treatment interaction indicate mean separation within rows and years by t-test
90
Fig 38 Berry weight in the control and trimmed vines from veraison to harvest of the years 2009
2010 and 2011
33 Ripening analyses Soluble solids pH and Total Acidity
In 2009 and in 2010 TRIMM vines had significant lower soluble solids concentration (degBrix) at
harvest compared to C but no significant effect was recorded in 2011(Fig 39) TA and pH did not
show any difference between treatments in all years (Table 10) Daily soluble solids accumulation
rate has been reduced after trimming in 2009 and 2010 of 8 and 16 and not at all in 2011
compared to control vines
In 2011 the extremely hot and dry climatic conditions led to an acceleration in the accumulation of
soluble solids so that 23 days after veraison the degBrix level of C reached the 24 degBrix (Fig 39)
while in 2009 and 2010 this value was reached respectively 42 and 58 days after veraison Under
91
such circumstances associated with a general lower level of yield in 2011 compared to the previous
years the grapes of TRIMM vines did not show differential accumulation rate and no significant
difference was recorded in berry composition compared to Control in this year This result is in
agreement with the high value of leaf area to yield ratio (Table 9) measured in TRIMM vines in
2011 which is considered adequate to allow an optimal ripening
Fig 39 degBrix in the control and trimmed vines from veraison to harvest of the years 2009 2010 and 2011
92
34 Anthocyanins accumulation during ripenning
Total anthocyanin concentration (mgkg) did not differ among treatments during ripening in all the
experimental years (Fig40) and no variation was registered at harvest (Table 10) Although no
difference was recorded among the treatments the anthocyanins concentrations were different
among the years (Fig40) The lowest anthocyanin value at harvest was registered to be in 2009 and
the maximum was observed in 2011 (Fig40) These results do not seem correlated with the different
temperature trend in the experimental years because in the both 2009 and 2011 the temperature
exceeded to the critical value for anthocyanin accumulation for periods with similar length Having
the lowest berry weight in 2011 is probably the reason of the highest anthocyanin value registered at
harvest in the grapes of both treatments as compared to the previous years (Table 9 10)
Notably no relation has been verified between the reduction in soluble solids accumulation
occurred in 2009 and in 2010 and variation in anthocyanins accumulation
In particular in 2009 when the trimming was effective in slowing down the rate of sugar
accumulation the correlation between total anthocyanin content (mg per berry) and berry juice
soluble solids concentration showed similar curves for TRIMM and C (Fig 41) Both treatments
showed an increasing positive trend between 10deg Brix to 22deg Brix where there is a peak
concentration and a decline in anthocyanins during the latter stage of ripening (Fig 41) Our results
are in acordance with Guidoni et al (2008) who demonstrated that anthocyanins may accumulate in
a two-phase process with an initial phase of rapid increase and a second phase where anthocyanins
and sugars are uncoupled
As other authors pointed out sugar accumulation was shown to be more strictly associated to
thermal time whereas anthocyanin accumulation was also affected by other sources of variations
(water yield and climatic conditions) (Sadras et al 2007) and in general displays a much wider
range of variation than that of sugars
93
Fig 40 The anthocyanin concentration in the control and trimmed vines from veraison to harvest of the years 2009
2010 and 2011
Fig 41 The correlation between the total anthocyanin content and berry soluble solids concentration in the control and
trimmed vines from veraison to harvest of the year 2009
94
Besides the analysis of the anthocyanin composition at harvest did not show significant difference
between the treatments in all the three years The percentage of delfinidid 3-G cyanidin 3-G
peonidin 3-G petunidin -3-G and malvidin 3-G in berries of TRIMM and C vines showed the
typical Sangiovese grape profile with high level of cyanidin 3-G and malvidin 3-G (Fig 42) It
seems that the biosynthesis of each individual anthocyanin is not influenced by the variation of
sugar concentration in the berries at harvest as occurred in 2009 and 2010
Moreover the trimming treatment did not modify cluster microclimatic conditions which are found
to be responsible for anthocyanin profile changes as reported after cluster shading (Downey et al
2004) and temperature variation (Mori et al 2005)
Fig 42 The anthocyanin profile in the berry skin of control and trimmed vines at harvest of the years 2009 2010 and
2011
95
35 Tannins accumulation during ripenning
In all experimental years trimming did not affect the evolution of seed and skin tannins
concentration expressed as mg per kg of berries during ripening and at harvest (Table 10 Fig 43 45
and 47) The tannins were expressed as mg per kg of berries as no differences were recorded
between treatments in berry weight during ripening (Fig 38)
Similar to what was previously reported on different varieties (Harbertson et al 2002 Kennedy et
al 2002 Downey et al 2003) the levels of seed tannins were higher compared to skin tannins at
veraison but declined during ripening The levels of berry skin and seed tannins reached to nearly
equal levels at harvest (Table 10 Fig 43 45 and 47) By evaluating the seed monomers and
polymers tannins the similar trends were observed in all treatments during ripening and their
concentration (mgkg of berries) in seed polymers was considerably higher than in its monomers as
expected
As well as that the berry tannins composition was assessed from veraison to harvest in each year
and the evolution of all four flavan-3-ols (catechin epicatechin epigallocatechin and epicatechin-
gallate) followed the same tendency between treatments (Fig 44 46 and 48) And among them
epicatechin is the major and catechin is the minor constituent of berry tannins (Fig 44 46 and 48)
Our results assessed that the concentration and composition of each group of tannins compounds at
harvest were not affected by trimming treatment after veraison also when this technique was able to
reduce sugar accumulation rate Moreover it appeared that the concentration of each flavan 3 ols
(catechin epicatechin epigallocatechin and epicatechin-gallate) remains almost constant in the last
thirty days before harvest revealing that both tannins composition and content may be not
responsable of different level of astringency in wine obtained from grapes at different degree of
ripening In other words our results seem to assess a very low effectiveness of the determinations of
each compound in prediction of wine astringency traits As previously pointed out by several
authors the extractability and solubility of each group of flavonoid compounds during ripening may
play an important rule to understand the relationships between berry composition wine composition
and sensory properties of wine
96
Fig 43 The tannins concentration of berry seed and skin in the control and trimmed vines from veraison to harvest of
the year 2009
Fig 44 The tannins composition in the control and trimmed vines from veraison to harvest of the year 2009
97
Fig 45 The tannins concentration of berry seed and skin in the control and trimmed vines from veraison to harvest of
the year 2010
Fig 46 The tannins composition in the control and trimmed vines from veraison to harvest of the year 2010
98
Fig 47 The tannins concentration of berry seed and skin in the control and trimmed vines from veraison to harvest of
the year 2011
Fig 48 The tannins composition in the control and trimmed vines from veraison to harvest of the year 2011
99
Table 10 Berry composition in the control and trimmed vines at harvest of the years 2009 2010 and 2011
Parameters 2009 2010 2011 Year x
Treatment
Interaction C TRIMM C TRIMM C TRIMM
Soluble solids (degBrix) 252 a 246 b 237 a 23 b 264 a 272 a ns
Total acidity (gl) 738 a 723 a 779 a 796 a 844 a 891 a ns
pH 353 a 347 a 339 a 336 a 339 a 336 a ns
Total anthocyanins
(mgkg berries)
7961 a 8381 a 11177 a 11200 a 17080 a 18100 a
Total tannins 3506 a 3547 a 3330 a 3107 a 3699 a 3522 a ns
Total tannins in skin 1006 a 1196 a 1466 a 1243 a 1697 a 1722 a ns
Total tannins in seed 2600 a 2352 a 1864 a 1864 a 2002 a 1800 a ns
4 CONCLUSION
The source limitation by trimming after veraison showed some perspectives to achieve lower sugar
accumulation in grape and lower alcohol potential in wines without inducing modification in the
evolution of the main assessed flavonoids compounds (skin anthocyanins total seeds and skin
tannins concentration and profile) in Sangiovese berries
The efficiency of this technique seems to be strongly depending from the vines starch supply as the
possible carbohydrate reserve depletion induced year over year by trimming may be responsible for
self regulation mechanism of yield constraint verified in the second and third year of the trial In this
condition the leaf area cutback after veraison is counterbalanced by the yield lowering and no effects
is obtained in lowering sugar accumulation as the leaf area yield ratio is maintained to high level
Probably the low fertility condition of the vineyard site and the lack of irrigation system may have
promoted this mechanism
Further researches on photosynthetic limitation after veraison to reduce sugar accumulation will be
focused on vines in different soil fertility condition and on the evaluation of the extractability of
tannins from seeds and skins in wines or wine-like solutions derived from this treatment
100
5 GENERAL CONCLUSION
Wine grape must deal with serious problems which occur due to the unfavorable climatic conditions
resulted from global warming
The excessive elevated temperatures are critical for grapevine and contribute to degradation of grape
and wine quality As an illustration elevated temperature is an important factor that can negatively
affect anthocyanin accumulation in grape Particularly cv Sangiovese was identified to be very
sensitive to such condition The expressions of the genes involved in flavonoid biosynthesis were
observed to be affected by temperature The quantitative real-time PCR analysis showed that
flavonoid biosynthetic genes were slightly repressed by high temperature As well as that the heat
stress showed to repress the expression of the transcription factors VvMYBA1 that activates the
expression of UFGT
Moreover high temperatures showed to had repressing effects on the activity of the flavonoids
biosynthetic enzymes PAL and UFGT
Anthocyanin accumulation in berry skin is due to the balance between its synthesis and oxidation
In grape cv Sangiovese the gene transcription and activity of peroxidases enzyme was found to be
elevated by heat stress as a defensive mechanism of ROS-scavenging
Even if different antioxidant enzymes have been recognized to be involved in flavonoids
degradation under various abiotic stresses this research identifies peroxidases as one of the best
candidate to oxidize anthocyanins actively
Between many isoforms of peroxidases genes which are expressed in grape berry skin from
veraison to harvest one peroxidase gene (POD 1) induced in Sangiovese grape under thermal stress
condition was isolated and evaluated via the technique of genes transformation from grape to
Petunia flower Reduction in anthocyanins concentration in POD 1 transformed Petunia flowers was
assessed after thermal stress conditioning compared to untrasformed control
Biochemical and molecular studies confirmed the role of peroxidases enzyme in active anthocyanins
degradation in Sangiovese cv grape skin under temperature stress conditions Based on our results
a similar mechanism that will be object of further investigation may be supposed for flavonols
degradation In conclusion this study showed that the temperature regimes after veacuteraison have
different effects on each flavonoid group Although the anthocyanin proanthocyanidin and flavonol
share the main part of their biosynthetic pathway no effects were obtained regarding any changes in
the biosynthesis of the proanthocyanidins under these different thermal ripening conditions
101
Moreover the present study is the pioneer to approve that the mechanism of anthocyanin loss in
grape skins due to high temperature involves not only the inhibition of anthocyanin biosynthesis but
also its enzymatic degradation
What is more in wine producing regions it is inevitable for the grape growers to adopt some
adaptive strategies to alleviate grape damages to abiotic stress conditions It is necessary to
ameliorate the vintage through improvement of management techniques to face the impacts of
undesirable climatic conditions Therefore in this thesis the technique of post veraison trimming
was done to improve the coupling of the phenolic and sugar ripening in Vitis vinifera L cultivar
Sangiovese
Trimming after veraison allowed to limit the photosynthetic source and showed to be executable to
slow down the rate of sugar accumulation in grape (to decrease the alcohol potential in wines)
without inducing modification in the evolution of the main berry flavonoids compounds
Moreover the present research showed that the efficiency of this technique applied year after year is
related to the ability of the vines to recover charboidrate reserve to prevent self regulation
mechanism of yield constraint
Further researches need to be performed on the evaluation of the extractability of tannins from seeds
and skins in wines or wine-like solutions derived from grape on vines subjected to post veraison
photosynthetic limitation
102
REFERENCES
Adams D 2006 Phenolics and ripening in grape berries J Am J Enol Vitic Vol 57 (3) 249-
256
Alfenito MR Souer E Goodman CD 1998 Functional complementation of anthocyanin
sequestration in the vacuole by widely divergent Glutathione Stransferases J The Plant Cell Vol
101135-1149
Aron PM Kennedy JA 2008 Flavan-3-ols Nature occurrence and biological activity J Mol
NutrFood Res Vol 52 79-104
Bavaresco L Fregoni C 2001 Physiological role and molecular aspects of grapevine stilbenic
compounds In K A Roubelakis-Angelakis (Ed) Molecular biology and biotechnology of the
grapevine pp 153-182
Bennett J Jarvis PCreasy G Trought M 2005 Influence of defoliation on overwintering
carbohydrate reserves return bloom and yield of mature Chardonnay grapevines J Am J Enol
Vitic Vol 56(4) 386-393
Bergqvist J Dokoozlian N Ebisuda N 2001 Sunlight exposure and temperature effects on berry
growth and composition of Cabernet Sauvignon and Grenache in the central San Joaquin Valley of
California J Amer J Enol Vitic Vol 52 (1) 1-7
Bindi M Fibbi L Gozzini B Orlandini S Miglietta F 1996 Modelling the impact of future
climate scenarios on yield and yield variability of grapevine J Clim Res Vol 7 213ndash224
Bogs J Downey MO Harvey JS Ashton AR Tanner GJ Robinson SP 2005
Proanthocyanidin Synthesis and Expression of Genes Encoding Leucoanthocyanidin Reductase and
Anthocyanidin Reductase in Developing Grape Berries and Grapevine Leaves J Plant Physiol Vol
139 652ndash663
Bogs J Ebadi A McDavid D Robinson SP 2006 Identification of the flavonoid hydroxylases
from grapevine and their regulation during fruit development J Plant Physiol Vol 140(1) 279-
291
Boss PK Davies C Robinson S P 1996 Analysis of the expression of anthocyanin pathway
genes in developing Vitis Vinifera L cv Shiraz grape berries and the implications of pathway
regulation J Plant Physiol Vol 111 1059-1066
Boulton R 2001 The copigmentation of anthocyanins and its role in the color of red wine A
critical review J Am J Enol Vitic Vol 52 (2) 67-87
103
Braidot E Zancani M Petrussa E Peresson C Bertolini A Patui S Macrigrave F Vianello A
2008 Transport and accumulation of flavonoids in grapevine (Vitis vinifera L) J Plant signaling
and behavior Vol 3(9) 626 - 632
Broun P 2005 Transcriptional control of flavonoid biosynthesis a complex network of conserved
regulators involved in multiple aspects of differentiation in Arabidopsis J Current Opinion in Plant
Biology Vol 8(3) 272-279
Bucchetti B 2004 Effetti biochimici e molecolari della luce sulla maturazione dellrsquouva nella cv
Sangiovese Tesi di Dottorato di ricerca in Colture Arboree ed Agrosistemi Forestali e Paesaggistici
XVII ciclo Universita di Bologna
Bucchetti B Pastore C Filippetti I Intrieri C 2007 Effetti di diverse tecniche colturali sulla
sintesi di antociani in Sangiovese Poster VIII GIORNATE SCIENTIFICHE SOI 8-11052007
(SS)
Buchanan-Wollaston V Morris K 2000 Senescence and cell death in Brassica napus and
Arabidopsis In Programmed Cell Death in Animals and Plants (Garland JM ed) BIOS Scientific
Publishers pp 163ndash174
Butterfield RE Gawith MJ Harrison PA Lonsdale KJ Orr J 2000 Modelling climate
change impacts onwheat potato and grapevine in Great Britain in Downing T E Harrison P A
Butterfield R E and Lonsdale KG (eds) Climate Change Climatic Variability and Agriculture
in Europe An Integrated Assessment Final Report Environmental Change Institute University of
Oxford 411 p
Buttrose MS Hale CR Kliewer WM 1971 Effect of temperature on composition of
lsquoCabernet Sauvignonrsquo berries J Amer J Enol Vitic Vol 22 (2) 71ndash75
Calderon AA Garciaflorenciano E Munoz R Barcelo A R 1992 Gamay grapevine
peroxidase its role in vacuolar anthocyani( di)n degradation J VITIS Vol 31(3) 139ndash147
Candolfi-Vasconcelos M Candolfi M Kohlet W 1994Retranslocation of carbon reserves from
the woody storage tissues into the fruit as a response to defoliation stress during the ripening period
in Vitis vinifera L
Castellarin SD Pfeiffer A Sivilotti P Degan M Peterlunger E Di Gaspero G 2007
Transcriptional regulation of anthocyanin biosynthesis in ripening fruits of grapevine under seasonal
water deficit J Plant Cell and Environment Vol 30 1381ndash1399
Castellarin SD Di Gaspero G Marconi R Nonis A Peterlunger E Paillard S Adam-
Blondon AF Testolin R 2006 Colour variation in red grapevines (Vitis vinifera L) genomic
104
organisation expression of flavonoid 3-hydroxylase flavonoid 35-hydroxylase genes and related
metabolite profiling of red cyanidin-blue delphinidin-based anthocyanins in berry skin J BMC
Genomics Vol 7(12) 1471-2164
Chen G Asada K 1989 Ascorbate Peroxidase in tea leaves occurrence of two isozymes and the
differences in their enzymatic and molecular properties J plant cell physiol Vol 30 (7) 987-998
Chen J Wen P Kong W Pan Q Wan S Huang W 2006 Changes and subcellular
localizations of the enzymes involved in phenylpropanoid metabolism during grape berry
development J Plant phisiol Vol 163 (2) 115-127
Cheynier V Rigaud J 1986 HPLC separation and characterization of flavonols in the skin of
Vitis Vinifera var Cinsault J Am J Enol Vitic Vol 37 248-252
Christie P Alfenito M R Walbot V 1994 Impact of low temperature stress on general phenyl
propanoid and anthocyanin pathways enhancement of transcript abundance and anthocyanin
pigmentation in maize seedlings J Planta Vol 194 541ndash549
Chua CS Biermann D Goo K S Sim T 2008 Elucidation of active site residues
of Arabidopsis thaliana flavonol synthase provides a molecular platform for engineering flavonols
J Phytochem Vol 69 (1) 66ndash75
Cohen S Tarara J Kennedy J 2012 Diurnal temperature range compression hastens berry
development and modifies flavonoid partitioning in grapes J Am J Enol Vitic vol 63(1) 112-
120
Conde C Silva P Fontes N Dias A Tavares R M Sousa M Agasse A Delrot S Geroacutes
H 2007 Biochemical changes throughout grape berry development and fruit and wine quality
httphdlhandlenet18226820
Conner AJ Albert NW Deroles SC 2009 Transformation and regeneration of petunia C
Springer Springer Science+Business Media LLC Chapter 19 pp 395-409
Coombe B G 1992 Research on Development and Ripening of the Grape Berry J Am J Enol
Vitic Vol 43(1) 101-110
Cortell JM M Halbleib AV Gallagher T Righetti and JA Kennedy 2007a Influence of vine
vigor on grape Vitis vinifera L cv Pinot noir) anthocyanins 1 anthocyanin concentration and
composition in fruit J Agrie Food Chem 556575-6584
Darneacute G 1993 New hypothesis on anthocyanin biosynthesis in berries and leaves of grapevine J
Vitis Vol 32 77-85
105
Dat JF Foyer CH Scott IM 1998 Changes in salicylic acid and antioxidants during induced
thermotolerance in mustard seedlings J Plant Physiol Vol 118 1455ndash1461
Davies KM Schwinn KE 2003 Transcriptional regulation of secondary metabolism J
Functional Plant Biology Vol 30(9) 913 ndash 925
Dela G Or E Ovadia R Nissim-Levi A Weiss D Oren- Shamir M 2003 Changes in
anthocyanin concentration and composition in lsquoJaguarrsquo rose flowers due to transient
hightemperature conditions J Plant Sci Vol 164 333ndash340
Deluc L Bogs J Walker AR Ferrier T Decendit A Merillon JM Robinson SP Barrieu
F 2008 The transcription factor VvMYB5b contributes to the regulation of anthocyanin and
proanthocyanidin biosynthesis in developing grape berries J Plant Physiol Vol (147) 2041ndash2053
Dokoozlian NK 2000 Grape berry growth and development Raisin Production Manual Chapter
5 pp 30- 37
Downey MO Dokoozlian NK Krstic MP 2006 Cultural Practice and environmental Impacts
on the flavonoid composition of grapes and wine A review of recent research J Amer J Enol
Vitic Vol 57 (3) 257-268
Downey MO Harvey JS Robinson SP 2003 Analysis of tannins in seeds and skins of Shiraz
grapes throughout berry development J Aust J Grape Wine Res Vol 9 15-27
Downey MO Harvey JS Robinson SP 2003 Synthesis of flavonols and expression of
flavonol synthase genes in the developing grape berries of Shiraz and Chardonnay (Vitis Vinifera
L) J Aust J Grape Wine Res Vol 9 110-121
Downey MO Harvey JS Robinson SP 2004 The effect of bunch shading on berry
development and flavonoid accumulation in Shiraz grapes J Aus J Grape Wine Res Vol 10 55-
73
Dry I B Robinson S P 1994 Molecular cloning and characterization of grape berry polyphenol
oxidase J Plant Molecular Biology Vol 26 495-502
Duchene E Schneider C 2005 Grapevine and climatic changes a glance at the situation in
Alsace Agron J Sustain Dev Vol 25 93ndash99
Fasoli M Dal Santo S Zenoni S Tornielli GB Farina L Zamboni A Porceddu A
Venturini L Bicego M Murino V Ferrarini A Delledonne M Pezzotti M 2012 The
grapevine expression atlas reveals a deep transcriptome shift driving the entire plant into a
Maturation Program J The Plant Cell Vol 24 3489ndash3505
Ferrini F Mattii GB Nicese FP 1995 Effect of Temperature on Key Physiological Responses
of Grapevine Leaf J Am J Enol Vitic Vol 46(3) 375-379
106
Filippetti I 2009 Technological and Phenolic ripening synchronization in winegrape Data has not
been published
Filippetti I Ramazzotti S Centinari M Bucchetti B Intrieri C 2007 Effects of cluster
thinning on grape composition experience ldquoSangioveserdquo grapevines Proc Int Workshop on
Advance in Grapevine and Wine Research
Fournand D Vicens A Sidhoum L Souquet JM Moutounet M Cheynier V 2006
Accumulation and extractability of grape skin tannins and anthocyanins at different advanced
physiological stages J Agric Food Chem Vol 54 7331-7338
Fraser E 2008 ldquoCrop yield and climate changerdquo Retrieved on 2009-09-14
Fujita A Soma N Goto-Yamamoto N Mizuno A Kiso K Hashizume K 2007 Effect of
shading on proanthocyanidin biosynthesis in the grape berry J Japan Soc Hort Sci Vol 76 112-
119
Fujita A Goto-Yamamoto N Aramaki I Hashizume K 2006 Organ-Specific Transcription
of Putative Flavonol Synthase Genes of Grapevine and Effects of Plant Hormones and Shading on
Flavonol Biosynthesis in Grape Berry Skins J Biosci Biotech and Biochem Vol 70 (3) 632-
638
Gagneacute S Lacampagne S Claisse O Geacuteny L 2009 Leucoanthocyanidin reductase and
anthocyanidin reductase gene expression and activity in flowers young berries and skins of Vitis
vinifera L cv Cabernet-Sauvignon during development J Plant Physiol amp Biochem Vol 47 (4)
282ndash290
Gatto P Vrhovsek U Muth J Segala C Romualdi C Fontana P Pruefer D Stefanini M
Moser C Mattivi F Riccardo Velasco R 2008 Ripening and genotype control stilbene
accumulation in healthy grapes J Agric Food Chem Vol 56 (24) 11773ndash11785
Gollop R Even S Colova-Tsolova V Peri A 2002 Expression of the grape dihydroflavonol
reductase gene and analysis of its promoter region J Exp Bot Vol 53 1397ndash1409
Gollop R Farhi S Perl A 2001 Regulation of the leucoanthocyanidin dioxygenase gene
expression in Vitis vinifera J Plant Sci Vol 161 (3) 579ndash588
Goto-Yamamoto N Mori K Numata M Koyama K Kitayama M 2009 Effects of
temperature and water regimes on flavonoid contents and composition in the skin of red-wine
grapes J Int Sci Vigne Vin Vol 43 (1) 75-80
Goto-Yamamoto N Wan GH Masaki K Kobayashi S 2002 Structure and transcription of
three chalcone synthase genes of grapevine (Vitis vinifera) J Plant Sci Vol 162 867-872
107
Greer D H Weston C 2010 Heat stress affects flowering berry growth sugar accumulation and
photosynthesis of Vitis vinifera cv Semillon grapevines grown in a controlled environment J
Functional Plant Biol Vol 37(3) 206ndash214
Guidoni S Ferrandino A Novello V 2008 Effects of seasonal and agronomical practices on
skin anthocyanin profile of Nebbiolo grapes JAm J Enol Vitic Vol 59(1) 22-29
Guidoni S Ferrandino A Novello V 2004 Ruolo del clima e degli interventi colturali sulla
sintesi degli antociani nellrsquouva (Vitis Vinifera L cv Nebbiolo) J Quad Vitic Enol Univ Torino
27
Guidoni S P Allara and A Schubert 2002 Effect of cluster thinning on berry skin anthocyanin
composition of Vitis vinifera cv Nebbiolo Am J Enol Vitic V 53224-226
Harbertson JF Kennedy JA Adams DO 2002 Tannin in skins and seeds of Cabernet
Sauvignon Syrah and Pinot noir berries during ripening J Am J Enol Vitic Vol 53 (1) 54-59
Hardie WJ OrsquoBrien TP Jaudzems VG 1996 Morphology anatomy and development of the
pericarp after anthesis in grape Vitis vinifera L J Aust J Grape Wine Res Vol 2 97ndash142
Haselgrove L Botting D Van Heeswijck R Hoslashj PB Dry PR Ford C Iland PG 2000
Canopy microclimate and berry composition The effect of bunch exposure on the phenolic
composition of Vitis vinifera L cv Shiraz grape berries J Aust J Grape Wine Res Vol 6 141-
149
Hawker JS 1969a Changes in the activities of enzymes concerned with sugar metabolism during
the development of grape berries J Phytochem Vol 8 9-17
Hawker JS 1969b Insoluble invertase from grapes an artefact of extraction J Phytochem Vol
8 337-344
Hellens RP Edwards EA Leyland NR Bean S Mullineaux PM 2000 pGreen a versatile
and flexible binary Ti vector for Agrobacterium-mediated plant transformation J Plant Mol Biol
Vol 42 819-832
Hiratsuka S Onodera H Kawai Y Kubo T Itoh H Wada R 2001 ABA and sugar effects on
anthocyanin formation in grape berry cultured in vitro J Scientia Horticulturae Vol 90 (1-2) 121-
130Hrazdina G Parsons GF Mattick LR 1984 Physiological and biochemical events during
development and maturation of grape berries J Amer J Enol Vitic Vol 35 (4) 220ndash227
Huglin P 1978 Nouveau Mode drsquoEacutevaluation des Possibiliteacutes Heacuteliothermiques drsquoun Milieu
Viticole CR Acad Agr France Vol 64 1117-1126
Hugueney P Provenzano S Verriegraves C Ferrandino A Meudec E Batelli G Merdinoglu D
Cheynier V Schubert A Ageorges A 2009 A novel cation-dependent o-methyltransferase
involved in anthocyanin methylation in grapevine J Plant Physiol Vol 150 (4) 2057- 2070
108
Intrieri C 1994 Vini frizzanti interventi agronomici per il controllo della maturazione J
Lrsquoenotecnico Vol 9 65-72
Intrieri C Magnanini E Silvestroni O 1983 Effetti della potatura verde sul comportamento
vegetativo e produttivo di Albana e Sangiovese J Vignevini Vol 5 57-62
Intrieri C Silvestroni O Poni S 1994 ndash Pluker nuova defogliatrice polivalente per vigneti
Vignevini Vol 1-2 25 ndash 31
involvement of leucoanthocyanidin dioxygenase J Planta Vol 229( 2) 427-445
J Planta Vol 192(4) 567-573
Jackman RL Smith JL 1996 Anthocyanins and betalains In Hendry GAF Houghton JD eds
Natural food colorants 2nd
edn London Chapman amp Hall pp 244ndash309
Jeong ST Goto-Yamamoto N Kobayashi S Esaka M 2004 Effects of plant hormones and
shading on the accumulation of anthocyanins and the expression of anthocyanin biosynthetic genes
in grape berry skins J Plant Sci Vol 167 247-252
Jeong ST Goto-Yamamoto N Hashizume K Esaka M 2006 Expression of the flavonoid 3prime-
hydroxylase and flavonoid 3prime5prime-hydroxylase genes and flavonoid composition in grape (Vitis
vinifera) Plant Sci Vol 170 (1) 61ndash69
Jiang YM Duan X Joyce D Zhang Z Li J 2004 Advances in understanding of enzymatic
browning in harvested litchi fruit J Food Chem Vol 88 443ndash446
Jones GV White MA Cooper OR Storchmann K 2005 Climate change and global wine
quality J Climatic Change Vol 73 319ndash343
Kader F Haluk JP Nicolas JP Metche M 1998 Degradation of cyanidin 3-glucoside by
blueberry polyphenol oxidase kinetic studies and mechanisms J Agric Food Chem Vol 46
3060ndash 3065
Kader F Nicolas JP Metche M 1999 Degradation of pelargonidin 3-glucoside in the presence
of chlorogenic acid and blueberry polyphenol oxidase J Sci Food Agric Vol 79 517ndash522
Kader F Rovel B Girardin M Metche M 1997 Mechanism of browning in fresh highbush
blueberry fruit (Vaccinium corymbosum L) Role of blueberry polyphenol oxidase chlorogenic acid
and anthocyanins J Sci Food Agric Vol 74(1) 31ndash34
Karimi M Inzeacute D Depicker A 2002 GATEWAYtrade vectors for Agrobacterium-mediated plant
transformation J Trends in Plant Sci Vol 7(5) 193ndash195
Kemp BS Harrison R Creasy GL 2011 Effect of mechanical leaf removal and its timing on
flavan-3-ol composition and concentrations in Vitis vinifera L cv Pinot Noir wine J Aust J Grape
Wine Res Vol 17(2) 270ndash279
109
Kennedy JA Jones GV 2001 Analysis of Proanthocyanidin Cleavage Products Following
Acid-Catalysis in the Presence of Excess Phloroglucinol Amer J Enol Vitic Vol 49(4) 1740-
1746
Kennedy JA Matthews MA Waterhouse AL 2000 Changes in grape seed polyphenols during
fruit ripening J Phytochem Vol 55 77-85
Kennedy JA Matthews MA Waterhouse AL 2002 Effect of maturity and vine water status
on grape skin and wine flavonoids J Am J Enol Vitic Vol 53 268-274
Kennedy JA Saucier C Glories Y 2006 Grape and Wine Phenolics History and Perspective
J Am J Enol Vitic Vol 57 (3) 239-248
Kenny GJ Harrison PA 1992 The effects of climate variability and change on grape suitability
in Europe J Wine Res Vol 3 163ndash183
King P McClellan D Smart R 2012 Effect of severity of leaf and crop removal on grape and
wine composition of Merlot vines in Hawkersquos bay vineyards J Am J Enol Vitic ajev201212020
Kliewer W M 1970 Effect of day temperature and light intensity on coloration of Vitis vinifera
grapes J Amer Soci Hort Sci Vol 95 693ndash697
Kliewer W M Torres R E 1972 Effect of controlled day and night temperatures on grape
coloration J Amer J Enol Vitic Vol 23 71ndash77
Kliewer W Dokoozlian N 2005 Leaf areacrop weight ratios of grapevines influence on fruit
composition and wine quality J Am J Enol Vitic Vol 56(2) 170-181
Kliewer WM 1966 Sugars and organic acids of Vitis Vinifera J Plant PhysiolVol 41 923-931
Kliewer WM 1977 Influence of temperature solar radiation and nitrogen on coloration and
composition of Emperor Grapes J AmJ Enol Vitic Vol 28 (2) 96-103
Kobayashi S Goto-Yamamoto N Hirochika H 2004 Retrotransposon-induced mutations in
grape skin color J Sci Vol 304 (5673) 982 p
Kobayashi S Ishimaru M Ding CK Yakushiji H Goto N 2001 Comparison of UDP-
glucose flavonoid 3-O-glucosyltransferase (UFGT) gene sequences between white grapes (Vitis
vinifera) and their spots with red skin J Plant Sci Vol 160 543-550
Kobayashi S Ishimaru M Hiraoka K Honda C 2002 Myb-related genes of the Kyoho grape
(Vitis labruscana) regulate anthocyanin biosynthesis J Planta Vol 215 924-933
Kriedemann P E 1968 Photosynthesis in vine leaves as a function of light intensity temperature
and leaf age J Vitis Vol 7 213-220
Kuznetsov V V Shevyakova N I 2007 Polyamines and stress tolerance of plants Global science
books Plant stress Vol 1(1) 50-71
110
Laget F Tondut J L Deloire A Kelly M T 2008 Climate trends in a specific Mediterranean
viticultureal area between 1950 and 2006 J Int Sci Vigne Vin Vol 42 (3) 113-123
Lakso A N Kliewer W M 1975 The Influence of Temperature on Malic Acid Metabolism in
Grape Berries J Plant Physiol Vol 56 (3) 370-372
Landy A 1989 Dynamic structural and regulatory aspects of site-specific recombination J Ann
Rev Biochem Vol 58 913ndash949
Larronde F Krisa S Decendit A Chegraveze C Deffieux G Meacuterillon J M 1998 Regulation of
polyphenol production in Vitis vinifera cell suspension cultures by sugars JPlant Cell Reports Vol
17(12) 946-950
Leyva A Jarillo J Salinas J Martinez-Zapater M 1995 Low temperature induces the
accumulation of phenylalanine ammonia-lyase and chalcone synthase mRNAs of Arabidopsis
thaliana in a light-dependent manner J Plant Physiol Vol 108 39ndash46
Lin-Wang K Micheletti D Palmer J Volz R Lozano L 2011 High temperature reduces apple
fruit colour via modulation of the anthocyanin regulatory complex J Plant Cell amp Environment
Vol 34(7) 1176ndash1190
Lo Piero A R Puglisi I Rapisarda P Petrone G 2005 Anthocyanins accumulation and related
gene expression in red orange fruit induced by low temperature storage J Agric Food Chem Vol
53 9083ndash9088
Lough J M Wigley T M L Palutikof J P 1983 Climate and climate impact scenarios for
Europe in a warmer world J Clim Appl Meteorol Vol 22 1673ndash1684
Loslashvdal T Olsen K M Slimestad R Verheul M Lillo C 2010 Synergetic effects of nitrogen
depletion temperature and light on the content of phenolic compounds and gene expression in
leaves of tomato J Phytochemistry Vol 71(5ndash6) 605ndash613
Makra L Vitaacutenyi B Gaacutel A Mika J Matyasovszky I Hirsch T 2009 Wine Quantity and
Quality Variations in Relation to Climatic Factors in the Tokaj (Hungary) Winegrowing Region
Amer J Enol Vitic Vol 60 (3) 312-321
Mann M E Bradley R S Hughes M K 1998 Global-scale temperature patterns and climate
forcing over the past six centuries J Nature Vol 392 779-787
Matsui S Ryugo K Kliewer W M 1986 Growth inhibition of Thompson Seedless and Napa
Gamay berries by heat stress and its partial reversibility by applications of growth regulators J Am
J Enol Vitic Vol 37 (1) 67-71
Mattivi F Guzzon R Vrhovsek U Stefanini M Velasco R 2006 Metabolite profiling of
grape Flavonols and anthocyanins J Agric Food Chem Vol 54 (20) 7692-7702
111
Mazza G Fukumoto L Delaquis P Girard B Ewert B1999 Anthocyanins Phenolics and
Color 426 of Cabernet Franc Merlot and Pinot Noir wines from British Columbia J Agric Food
Chem 474009-427 4017 Menting J G T Scopes R K Stevenson T W 1994
Characterization of Flavonoid 3rsquo5rsquo-Hydroxylase in Microsomal Membrane Fraction of Petunia
hybrida Flowers J Plany Physiol Vol 106 (2) 633- 642
Mazza G Miniati E 1993 Color stabilization and intensification In Mazza G Miniati E (eds)
Anthocyanins in Fruits Vegetables and Grains CRC Press Boca Raton pp 1ndash20
Meyer P Heidmann I Forkmann G Saedler H 1987 A new petunia flower colour generated
by transformation of a mutant with a maize gene J Nature Vol 330 677-678
Mol J 1998 How genes paint flowers and seeds J Trends in Plant Sci Vol 3 212-217
Morais H Ramos C Forgacs E Cserhati T Matos N Almeida V Oliveira J 2002
Stability of anthocyanins extracted from grape skins J Chromatographia Vol 56 173ndash175
Mori K Goto-Yamamoto N Kitayama M Hashizume K 2007a Loss of anthocyanins in red-
wine grape under high temperature J Experimental Botany Vol 58 (8) 1935-1945
Mori K Goto-Yamamoto N Kitayama M Hashizume K 2007a Effect of high temperature on
anthocyanin composition and transcription of flavonoid hydroxylase genes in ldquoPinot noirrdquo grapes
(Vitis vionifera) J Hortic Sci Biotechnol Vol 82 (2) 199-206
Mori K Saito H Goto-Yamamoto N Kitayama M Kobayashi S Sugaya S Gemma H
Hashizume K 2005a Effects of abscisic acid treatment and night temperatures on anthocyanin
composition in lsquoPinot noirrsquo grapes J Vitis Vol 44 161ndash165
Mori K Sugaya S Gemma H 2005b Decreased anthocyanin biosynthesis in grape berries
grown under elevated night temperature condition J Sci Hortic Vol 105 319ndash330
Movahed N Maeiyat MM 2009 Phytoremediation and sustainable urban design methods (Low
Carbon Cities through Phytoremediation) 45th ISOCARP Congress Disponible en
httpwwwisocarpnet Fecha de consulta 04 Septiembre del 2009
Movahed N Masia A Cellini A Pastore C Valentini G Allegro G Filippetti I 2011
Biochemical approaches to study the effects of temperature on grape composition in cv Sangiovese
The 17th
International GIESCO Symposium Asti Italy The proceeding PP 393- 397
Munneacute-Bosch S Alegre L 2004 Die and let live leaf senescence contributes to plant survival
under drought stress J Funct Plant Biol Vol 31 203-216
Nissim-Levi A Kagan S Ovadia R Oren-Shamir M 2003 Effects of temperature UV-light
and magnesium on anthocyanin pigmentation in cocoplum leaves J Hortic Sci Biotechnol Vol
78 61-64
112
Oren-Shamir M Levi-Nissim A 1997a Temperature effects on the leaf pigmentation of Cotinus
coggygria lsquoRoyal Purplersquo J Hortic Sci Vol 72 425ndash432
Oren-Shamir M Levi-Nissim A 1997b UV-light effect on the leaf pigmentation of Cotinus
coggygria lsquoRoyal Purplersquo J Sci Hortic Vol 71 59ndash66
Oren-Shamir M Nissim-Levi A 1999 Temperature and gibberellin effects on growth and
anthocyanin pigmentation in Photinia leaves J Hortic Sci Biotechnol Vol 74 355ndash360
Palliotti A Poni S Berrios JG Bernizzoni F 2010 Vine performance and grape composition
as affected by early-season source limitation induced with anti-transpirants in two red Vitis vinifera
L cultivars J Aust J Grape Wine Res Vol 16 426ndash433
Pastore C 2010 Reserches on berry composition in red grape agronomical biochemical and
molecular approaches Tesi di Dottorato di ricerca in Colture Arboree ed Agrosistemi Forestali e
Paesaggistici XXII ciclo Faculta di Agraria Universita di Bologna
Pereira GE Gaudillere JP Pieri P Hilbert G Maucourt M Deborde C Moing A Roil D
2006 Microclimate influence in mineral and metabolic profiles of grape berries J Agric Food
Chem Vol 54 6765-6775
Pirie A Mullins M1976 Changes in anthocyanin and phenolics content of grapevine leaf and
fruit tissues treated with sucrose nitrate and abscisic acid J Plant Physiol Vol 58(4) 468-472
Pourcel L Routaboul J M Cheynier V Lepiniec L Debeaujon I 2006 Flavonoid oxidation
in plants from biochemical properties to physiological functions JTrends in Plant Sci Vol 12 (1)
29-36
Price SF Breen PJ Valladao M Watson BT 1995 Cluster sun exposure and quercetin in
Pinot noir grapes and wine AmJ Enol Vitic Vol 46 187-194
Quattrocchio F Baudry A Lepiniec L Grotewold E 2006 The regulation of flavonoid
biosynthesis J The science of flavonoids C Springer Chapter 4 pp 97ndash122
Rebucci B Poni S Intrieri C Magnanini E Lakso A N 1997 Effects of manipulated grape
berry transpiration on post-veraison sugar accumulation J Aust J Grape Wine Res Vol 3 57-65
Reynolds A Price S Wardle D Watson B 1994 Fruit environment and crop level effects on
Pinot noir I vine performance and fruit composition in British Columbia J Am J Enol Vitic Vol
45(4) 452-459
Reynolds A Wardle D 1989 Influence of fruit microclimate on monoterpene levels of
Gewuumlrztraminer J Am J Enol Vitic Vol 40(3) 149-154
113
Ristic R Bindon K Francis LI Herderich M J Iland PG 2010 Flavonoids and C13-
norisoprenoids in Vitis vinifera L cv Shiraz relationships between grape and wine composition
wine colour and wine sensory properties J Aust J Grape Wine Res Vol 16 369ndash388
Ristic R Downey M Iland P Bindon K Francis I Herderich M Robinson S 2007
Exclusion of sunlight from Shiraz grapes alters wine colour tannin and sensory properties J Aust
J Grape Wine Res Vol 13(2)53-65
Robinson S P Davies C 2000 Molecular biology of grape berry ripening J Aust J Grape Wine
Res Vol 6 175-188
Robinson S 2006 Colour and tannin during berry development and ripening In ldquoFinishing the
jobrdquo ASVO proceedings held 21 July 2006 Mildura Vic Australia pp 11-14
Roby G Harbertson J F Adams D A Matthews M A 2004 Berry size and vine water
deficits as factors in winegrape composition anthocyanins and tannins J Aust J Grape Wine Res
Vol 10 100- 107
Rolland F Baena-Gonzalez E Sheen J 2006 Sugar sensing and signaling in plants Conserved
and novel mechanisms J Ann Rev Plant Biol Vol 57 675-709
Romero C Bakker J 2000 Effect of storage temperature and pyruvate on kinetics of anthocyanin
degradation Vitisin A derivative formation and color characteristics of model solutions J Agric
Food Chem Vol 48 2135ndash2141
Sadras V 2007 Evolutionary aspects of the trade-off between seed size and number in crops J
Field crop research Vol 100(2-3) 125-138
Sadras VO Petrie P R Moran M A 2013 Effects of elevated temperature in grapevine II juice
pH titratable acidity and wine sensory attributes Australian Journal of Grape and Wine Research
Vol 19 (1) 107ndash115
Sarni P Fulcrand H Souillol V Souquet J M Cheynier V 1995 Mechanisms of anthocyanin
degradation in grape must-like model solutions J Sci Food Agr Vol 69(3) 385ndash391
Scholefield PB May P Neales TF 1977 Harvest-pruning and trellising of lsquoSultanarsquo vines II
Effects on early spring development Sci Hortic Vol 7123-132
Schultz H R 1995 Grape canopy structure light microclimate and photosynthesis I A two
dimensional model of the spatial distribution of surface area densities and leaf ages in two canopy
systems J Vitis Vol 34 211-215
Schultz H R 2000 Climate change and viticulture a European perspective on climatology carbon
dioxide and UV-B effects Aust J Grape Wine Res Vol 6 2ndash12
114
Schultz H R 2003 Extension of a Farquhar model for limitations of leaf photosynthesis induced
by light environment phenology and leaf age in grapevines (Vitis vinifera L cvv White Riesling
and Zinfandel)J Functional Plant Biol Vol 30(6) 673 ndash 687
Sepuacutelveda G Kliewer W M Ryugo K 1986 Effect of high temperature on grapevines (Vitis
vinifera L) I translocation of 14
C-photosynthates J Am J Enol Vitic Vol 37 (1) 13-19
Shaked-Sachray L Weiss D Moshe R Nissim-Levi A Oren- Shamir M 2002 Increased
anthocyanin accumulation in aster flowers at elevated temperatures due to magnesium treatment J
Physiol Plant Vol 114 559ndash565
Shvarts M Borochov A Weiss D 1997 Low temperature enhances petunia flower pigmentation
and induces chalcone synthase gene expression J Physiol Plant Vol 99 67ndash72
Sipiora M J Gutieacuterrez-Granda M J 1998 Effects of pre-veraison irrigation cutoff and skin
contact time on the composition color and phenolic content of young Cabernet Sauvignon wines in
Spain J Amer J Enol Vitic Vol 49 152ndash162
Smart R E 1985 Principles of grapevine canopy microclimate manipulation with implication for
yield and quality J Amer J Enol Vitic Vol 36 230-239
Smith G J Markham K R 1998 Tautomerism of flavonol glucosides - relevance to plant UV
protection and flower colour J Photochem Photobiol A ndash Chem Vol 118 99-105
Soar C J Collins M J Sadras V O 2009 Irrigated Shiraz vines (Vitis vinifera) up regulate gas
exchange and maintain berry growth in response to short spells of high maximum temperature in the
field J Functional Plant Biology Vol 36(9) 801ndash814
Sparvoli F Martin C Scienza A Gavazzi G Tonelli C 1994 Cloning and molecular analysis
of structural genes involved in flavonoid and stilbene biosynthesis in grape (Vitis Vinifera L) J
Plant Molecular Biology Vol 24 743-755
Spayd S E Tarara J M Mee D L Ferguson J C 2002 Separation of sunlight and
temperature effects on the composition of Vitis vinifera cv Merlot berries J Amer J Enol Vitic
Vol 53171-182
Spelt C 2002 Anthocyanin1 of petunia controls pigment synthesis vacuolar pH and seed coat
development by genetically distinct mechanisms The plant cell online Vol 14 2121-2135
Stafford H A 1990 Flavonoid Metabolism CRC Press Boca Raton FL 298 pp
Stracke R De Vos R C H Bartelniewoehner L Ishihara H Sagasser M Martens
S Weisshaar B 2009 Metabolomic and genetic analyses of flavonol synthesis in Arabidopsis
thalianasupport the in vivo
115
Taureilles-Saurel C Romieu C G Robin J P Flanzy C 1995 Grape (Vitis vinifera L) malate
dehydrogenase II Characterization of the major mitochondrial and cytosolic isoforms and their role
in ripening J Am J Enol Vitic Vol 46 (1) 29-36
Tomana T Utsunomiya N Kataoka I 1979 The effect of environmental temperatures on fruit
ripening on the tree II The effect of temperatures around whole vines and clusters on the coloration
of lsquoKyohorsquo Grapes Japan Soc Hort Sci Vol 48 261-266
Treutter D 2006 Significance of flavonoids in plant resistance a review J Environ Chem Lett
Vol 4 147ndash157
Ubi BW Honda C Bessho H Kondo S Wada M Kobayashi S Moriguchi T 2006
Expression analysis of anthocyanin biosynthetic genes in apple skin effect of UV-B and
temperature J Plant Sci Vol 170 571ndash578
Ushimaru T Maki Y Sano S Koshiba K Asada K Tsuji H 1997 Induction of enzymes
involved in the ascorbate-dependent antioxidative system namely ascorbate peroxidase
monodehydroascorbate reductase and dehydroascorbate reductase after exposure to air of rice
(Oryza sativa) seedlings germinated under water J Plant Cell Physiol Vol 38 541-549
Vaknin H Bar-Akiva A Ovadia R Nissim-Levi A Forer I Weiss D Oren-Shamir M
2005 Active anthocyanin degradation in Brunfelsia calycina (yesterday-today-tomorrow) flowers J
Planta Vol 222 19ndash26
Venturini L 2009 Study of some gene families involved in anthocyanin accumulation during Vitis
vinifera berry ripening Tesi di laurea specialistica in biotechnologie agro-industriali faculta di
scienze matematiche fisichie e naturali Universita degli studi di Verona pp7-12 30-51
Wahid A Perveen M Gelani S Basra SMA 2007 Pretreatment of seed with H2O2 improves
salt tolerance of wheat seedlings by alleviation of oxidative damage and expression of stress
proteins J Plant Physiol Vol 164 (3) 283ndash294
Walker AR Lee E Bogs J McDavid D A J Thomas M R Robinson S P 2007 White
grapes arose through the mutation of two similar and adjacent regulatory genes The Plant journal
for cell and molecular biology Vol 49 772-85
Walker J R Ferrar P H 1998 Diphenol oxidases enzymecatalysed browning and plant disease
resistance J Biotechnol Genet Eng Rev Vol 15 457ndash498
Waterhouse A L 2002 Wine Phenolics Ann NY Acad Sci Vol 957 21-36
Watson RT Rodhe H Oeschger H Siegenthaler U 1990 Greenhouse gases and aerosols
httprivernetncsuedu
116
Welinder K G Justesen A F Kjaeligrsga I V H Jensen R B Rasmussen S K Jespersen H M
Duroux L 2002 Structural diversity and transcription of class III peroxidases from Arabidopsis
thaliana J Eur J Biochem Vol 269 6063ndash6081
Wen Y Zhang Y Pan Q 2009 Progress of organic acids in grape berries Natural science
journal of Hainan University S6631
Williams R J Spencer J P Rice-Evans C 2004 Flavonoids antioxidants or signaling
molecules J Free Radic Biol Med Vol 36 838ndash849
Winkel-Shirley B 2002 Biosynthesis of flavonoids and effects of stress J Current opinion in
plant biology Vol 5 218-23
Winkler A J Cook J A Kliewer W M Lider L A 1962 Development and composition of
grapes General viticulture Berkeley CA University of California Press pp 141ndash196
Xie DY Sharma S B Paiva N L Ferreira D Dixon R A 2003 Role of anthocyanidin
reductase encoded by BANYULS in plant flavonoid biosynthesis J Science Vol 299 396ndash399
Yamane T Jeong S T Goto-Yamamoto N Koshita Y Kobayashi S 2006 Effects of
temperature on anthocyanin biosynthesis in grape berry skins J Amer J Enol Vitic Vol 57 54ndash
59
Yamasaki H Sakihama Y Ikehara N 1997 Flavonoid-peroxidase reaction as a detoxification
mechanism of plant cells against H2O2 J Plant Physiol Vol 115 1405-1412
Yokotsuka K Singleton V L 1997 Disappearance of anthocyanins as grape juice is prepared and
oxidized with PPO and PPO substrates J Am J Enol Vitic Vol 48 (1) 13-25
Yoruk R Marshal R M 2003 Physiocochemical properties and function of plant polyphenol
axidase A review J Food Biochem Vol 27 361-422
Yu D J Kim S J Lee H J 2009 Stomatal and non-stomatal limitations to photosynthesis in
field-grown grapevine cultivars J Biologia Plantarum Vol 53 (1) 133-137
Zsoacutefi Z Vaacuteradi G Baacutelo B Marschall M Nagy Z Dulai S 2009 Heat acclimation of
grapevine leaf photosynthesis mezo- and macroclimatic aspects J Functional Plant Biology
Vol 36(4) 310ndash322
3
27 1 PAL activity assay 30
27 2 UFGT activity assay 30
27 3 Guaiacol PODs activity assay 31
27 4 PPOs activity assay 31
28 Vegetative and Yield measurements 32
29 Statistical analyses 32
3 RESULTS AND DISCUSSION 32
31 Berry Temperature 32
32 Leaf area and Yield 34
33 oBrix pH Titratable acidity 36
34 Biosynthesis of flavonoids 37
34 1 Anthocyanins accumulation during ripening 37
34 2 Flavonols accumulation during ripening 40
34 3 Tannins accumulation during ripening 42
35 Gene expression assessment 44
36 Activity of biosynthetic enzymes PAL and UFGT 48
37 Hypothesis for anthocyanin degradation 50
371 POD candidate genes 50
372 Activity of enzymes involved in anthocyanin degradation PODs and PPOs 51
4 CONCLUSION 52
Chapter one Second PartRecognition of putative POD genes involved in anthocyanins
degradation under high temperature condition 53
1 INTRODUCTION 54
2 MATERIALS 54
21 Gene selection 54
22 Escherichia coli strain and culture media 54
221 Luria-Bertani (LB) medium 55
222 SOC medium 55
4
23 Agrobacterium tumefaciens strain and culture media 56
231 YEB Medium 56
24 Vectors 57
241 pENTRtradeD-TOPOreg (2580 bp) 57
242 pK7WG20 57
25 Primers 58
26 Plant materials 59
3 METHODS 60
31 Transformation of Escherichia coli by heat shock 60
32 Preparation of competent cells of A tumefaciens 60
33 Transformation of A Tumefaciens by electroporation 61
34 Colony PCR 61
35 Plasmid DNA extraction 61
36 Purification of PCR products 61
37 GATEWAYreg cloning system 61
38 LR Recombination reaction 62
39 TOPO cloning reaction 63
310 RNA extraction and Real time PCR 63
311 Stable transformation of Petunia hybrida 64
3111 Medium I 65
3112 Medium II 65
3113 Medium III 66
312 Agro-infiltration of petunia petals 66
3121 Resuspending buffer 66
313 DNA extraction from Petunia 67
3131 Extraction buffer 67
314 PCR of transformed Petunia genomic DNA 67
3141 Reaction Mix 68
5
3142 Standard thermal cycle 68
315 RNA extraction from Petunia hybrida petal 68
316 cDNA synthesis RT PCR reaction 68
3161 Reaction Mix 69
3162 Standard thermal cycle 69
317 Total anthocyanin measurement 69
318 Heat shock performance 70
319 Guaiacol Peroxidases activity assay 70
4 RESULTS 70
41 Gene selection 71
42 The sequence of the POD1 gene 72
43 Gene transformation 73
44 Heat shock and the plant response 78
5 CONCLUSION 80
Chapter twoEffects of late-season source limitations induced by trimming on grape
composition during ripening in Vitis vinifera cv Sangiovese 81
1 INTRODUCTION 82
2 MATERIAL AND METHODS 83
21 Vegetative and yield data 83
22 Berry sampling 84
23 Analyses of main must biochemical parameters 84
24 Analyses of skin anthocyanins 84
25 Tannins analysis 85
3 RESULTS AND DISCUSSION 86
31 Climatic data 86
32 Vegetative and productive traits 87
33 Ripening analyses Soluble solids pH and Total Acidity 90
34 Anthocyanins accumulation during ripenning 92
6
35 Tannins accumulation during ripenning 95
4 CONCLUSION 99
5 GENERAL CONCLUSION
1
1 GENERAL INTRODUCTION
11 Grape ripening
Grape is a non-climacteric fruit and in non-climacteric fruits ethylene does not appear to have a
major role in ripening Little is known about the factors that regulate the ripening process of grapes
However it seems likely that plant growth substances are involved (Coombe 1992) Grapes exhibit
a double sigmoid pattern of development (Fig 1) with the two distinct phases of growth separated
by a lag phase (Coombe 1992) The ripening phase of grape berry development occurs during the
second period of berry growth and results from expansion of existing pericarp cells (Hardie et al
1996) During the ripening phase a number of major physiological and biochemical changes occur
simultaneously in the grape berry and these determine the quality of the fruit at harvest The onset
of ripening (Veraison) signals the beginning of significant changes in metabolism which include
accumulation of sugar softening of berries synthesis of anthocyanins metabolism of organic acids
accumulation of flavour compounds and changes in the level of growth substances (Fig 1) These
changes are coordinated within each berry but individual berries even those on the same bunch do
not ripen synchronously (Coombe 1992) this results in significant variation between berries even
at harvest This variability represents the significant effect of berry environmental conditions on
berry composition
Fig 1 Schematic representation of grape berry development (Robinson amp Davies 2000)
2
12 Grape berry composition
The dynamic of berry ripening is fundamental to determine final berry composition and as a
consequence grape quality Sugars organic acids and phenolic compounds are the main biochemical
components of grape berry
121 Sugars
Sugar accumulation in grape berries is an important phenomenon degBrix is directly related to the
sugar content (gL) and potential titratable alcohol (vol ) and about 55 of grape berry degbrix
converses to alcohol (Fournand et al 2006) At the beginning of berry development sugars are
produced by the green berries while subsequently berry becomes a typical ldquosinkrdquo organ and uses
carbohydrates produced by photosynthesis of leaves Sucrose produced by leaves is then transported
for long distance to berries into the phloem From veacuteraison xylem flow is almost impeded hence
water may reach berries via phloem with sugars Sucrose the predominant sugar transported in the
phloem accumulates in grape berry in form of glucose and fructose Since at the end of berry
ripening the glucosefructose ratio is approximately equal to 1 the cleavage of sucrose may be
catalysed mainly by invertase (Pastore 2010) The main role of sugars in grape berry is to provide
the carbon skeleton of many compounds (such as organic acids or amino acids) and to be energy
sources for cells By now it is scientifically accepted that sugars play also an important role as
signalling molecules in control of growth and development (Rolland et al 2006)
122 Organic acids
Organic acids are some important flavor compounds in both grapes and wines and the composition
and content of organic acids are closely related to the organoleptic quality of grapes and wine (Wen
et al 2009) Tartaric and malic acids generally represent from 69 to 92 of all organic acids in
grape berries (Kliewer 1966) Small amounts of citric succinic lactic and acetic acids are also
present in the berry While tartaric acid is synthesized until veacuteraison malic acids levels vary highly
during berry ripening As to Dokoozlian 2000 green berries together with leaves are the main
grape organs able to produce organic acids
123 Phenolic compounds
Phenolic compounds of grape are divided into non-flavonoids and flavonoids groups (Robinson
2006)
3
1231 Non-flavonoids
Hydroxycinnamic acids benzoic acids and stilbenes belong to the non-flavonoids group
(Waterhouse 2002)
1231a Hydroxycinnamates
Hydroxycinnamates present in grape berries are derivatives of caffeic p-coumaric and ferulic acids
which are present both in the skin hypodermal cells and in the flesh (Adams 2006) and Caftaric
acid is the predominant hydroxycinnamates in grape (Kennedy et al 2006)
1231b Benzoic acids
Benzoic acids are the minor components in grape berry composition Six derivatives of benzoic
acids (gallic acid protocatechuic acid gentisic acid p-hydroxybenzoic acid vanillic acid and
syringic acid) have been found in grape berry Gallic acid is the major benzoic acid present in grape
berry and it is present in both skin and seeds (Pastore 2010)
1231c Stilbenes
Stilbenes are found in the skin of the grape berry and in vegetative tissues Although stilbenes are
present in low quantity both in berries and wine they have aroused a lot of interest because of their
effects on human health in particular for what concern resveratrol (Bavaresco amp Fregoni 2001)
Resveratrol could exist in different forms in monomeric unit (as dimethylated derivatives trans-
pterostilbene and as in form of 3-O-β-D-glucoside trans- and cis-piceid) or in dimer units
(viniferins) (Gatto et al 2008)
1232 Flavonoids
Flavonoids are a class of plant secondary metabolites which are synthesized from Phenylalanine or
Tyrosine condensed with a malonyl-CoA via the phenylpropanoid pathway This class comprises
more than 6500 known compounds many of which are of great biological and commercial
importance In nature they play important roles in resistance to stresses both abiotic (such as excess
light and high temperature) and biotic (such as resistance to microbes) (Mol 1998 Winkel-Shirley
2002) moreover they are of central importance in the ecological relationships with pollinator
insects and in nodule formation (Downey et al 2006) They comprise both transparent compounds
4
such as the flavanols and brightly coloured ones such as phoblaphenes anthocyanins and
polymeric proanthocyanidins (Robinson 2006) All flavonoids share a common chemical structure
represented by a C15 skeleton (C6-C3-C6) (Fig 2)
Fig 2 Chemical structure of flavonoid molecule (Aron amp Kennedy 2008)
Depending on the position of the linkage of the aromatic ring (B ring) to the benzopyrano moiety (C
ring) we can distinguish the flavonoids (2-phenylbenzopyrans) the isoflavonoids (3-benzopyrans)
and the neoflavonoids (4-benzopyrans) The B ring can further be hydroxylated ortho-
dihydroxylated or vicinal-trihydroxylated (Pastore 2010) Other flavonoids modifications include
methoxylation O-glycosilation of hydroxyl groups or C-glycosilation of flavonoid skeleton carbon
atom Moreover flavonoid glycosides are frequently acylated with aliphatic or aromatic acid
molecules (Aron amp Kennedy 2008) Different classes of flavonoids are commonly detected in grape
such as anthocyanins flavonols and flavan-3-ols (tannins or proanthocyanidins) (Fig 3) Flavonoids
are localized both in berry skin and seeds In particular in hypodermal cells of the skin we can
found tannins flavonol monomeric flavan-3-ols and in red grape anthocyanins
1232a Anthocyanins
Anthocyanins are pigments and represent the major class of flavonoids of the skin of red grape
varieties The anthocyanins commonly found in grape include delphinidin cyanidin petunidin
peonidin and malvidin-3-O-glucosides 3-(6-acetyl) glucosides and 3-(6-p-coumaroyl)-glucosides
In certain grape varieties have been found even traces of peonidin and malvidin 3-(6-caffeoil)-
glucoside Malvidin-3-O-glucoside is the most abundant anthocyanin present in grape
5
Fig 3 Chemical structure of the three main classes of flavonoids present in red grape berry (Adams 2006)
1232b Flavan-3-ols and tannins
Monomeric flavan-3-ols (catechin epicatechin epigallocatechin) are present in the skin at lower
concentrations while they are present at high concentrations in form of polymers within tannins
(proanthocyanidins) Tannins are polymers of different condensed monomers like epicatechin and
epigallocatechin which constitute the chain of the polymers (ldquoextensionrdquo subunits) and catechin
which is present as ldquoterminalrdquo units (Braidot et al 2008) The mean degree of polymerisation
(mDP) which represents the mean length of the tannin chain is of about 28 in berry skin (Bogs et
al 2005)
Flavonoids in the seeds accumulate not only in the external part but even in the inner layers Grape
seeds are the primery source of flavan-3-ols and tannins in grape berries Total tannin content is in
fact higher in seeds than in skin even if seed tannins have a lower mDP The composition of seed
tannins is different comparing to the skin one in so far that in seed tannins generally
6
epigallocatechin is not present and epicatechin gallate is the major constituent of ldquoextensionrdquo
subunits (Adams 2006)
Fig 4This hypothetical condensed tannin is made up of four sub-units catechin epicatechin epigallocatechin
epicatechin gallate The first subunit (catechin) is bound to the second (epicatechin) by an interflavan bond between
carbon 4 of catechin and carbon 8 of epicatechin The first three subunits are referred to as extention subunits and
only the epicatechin gallate has free 4 positions and is thus re-ferred to as a terminal unit (Adams 2006)
1232c Flavonols
Grape and wine contain different classes of polyphenols Flavonols are flavonoids that are found in
higher plants usually in glycosidic forms They are products of the flavonoid biosynthetic pathway
which also give rise to anthocyanins and to condensed tannins in grapevines (Stafford 1990 and
Darne 1993) The main flavonols reported in grape berries are quercetin-3-O-glucoside and
quercetin-3-O-glucuronide (Price et al 1995 Cheynier et al 1986 and Downey et al 2003)
Flavonols are also involved in the stabilization of the flavilium form of anthocyanins in young red
wines through co-pigmentation (Boulton 2001) The highest flavonol concentrations in grapes were
found at flowering followed by a decrease as the grapes increased in size Subsequently a
significant level of flavonol biosynthesis was observed during berry development and the greatest
increase in flavonols per berry can be observed 3-4 weeks post-veraison (Downey et al 2003)
In red grapes the main flavonol is quercetin (mean) 4399) followed by myricetin (3681)
kaempferol (643) laricitrin (565) isorhamnetin (389) and syringetin (322) In white
grapes the main flavonol was quercetin (mean) 8135) followed by kaempferol (1691) and
7
isorhamnetin (174) The delphinidin-like flavonols myricetin laricitrin and syringetin were
missing in all white varieties indicating that the enzyme flavonoid 3hydroxylase is not
expressed in white grape varieties (Mattivi et al 2006)
It is interesting to observe the analogies between the hydroxylation of position 5 which leads to the
formation of the anthocyanidin delphinidin from cyanidin and the flavonol myricetin from quercetin
In addition to this O-methylation of position 3of anthocyanidin cyanidin which leads to the
formation of peonidin corresponds to the O-methylation which converts flavonol quercetin into
isorhamnetin Finally O-methylation of positions 3and 5of anthocyanidin delphinidin which
leads to the formation of petunidin and malvidin corresponds to O-methylation which converts
flavonol myricetin into laricitrin and syringetin (Fig 3)
13 Biosynthesis of flavonoids in red grape berry
Flavonoids are synthesized within the general phenylpropanoid pathway From the same precursors
and towards specific branches these pathways bring to the synthesis of anthocyanins flavonols and
proanthocyanidins (Boss et al 1996) (Fig 5 6) The enzymes involved in flavonoid biosynthesis
are associated at the cytoplasmic surface of the endoplasmic reticulum and represent a multi-enzyme
complex
131 Synthesis of the early products of the phenylpropanoid pathway
1311 PAL
PAL is a key enzyme ubiquitous in plants which catalyzes one of the first steps in
phenylpropanoids biosynthesis (Fig 5) the hydrolysis of ammonia from phenylalanine to produce
cinnamic acid Cinnamic acid is the precursor of all phenolic compounds Recently the subcellular
localization of PAL was found in grape PAL is present in the cell walls secondarily thickened
walls and parenchyma cells of the berry tissues (Chen et al 2006) This enzyme that is a member
of a large gene family has been cloned in many plant species In grape there are probably present
15-20 PAL isoforms (Sparvoli et al 1994)
1312 C4H
The cinnamic acid produced by PAL is converted to p-coumaric acid towards the action of
cinnamate 4-hydrolase (C4H) (Fig 5) C4H belongs to the cytochrome P450 monoxygenases
8
family The enzymes of this family are able to catalyse exothermic reactions that are irreversible In
grape C4H have not yet been cloned but itrsquos known that it is present in the chloroplasts and in the
nucleus of berry tissues (Chen et al 2006)
1313 4CL
One molecule of p-coumaric acid produced by C4H is condensed with an acetil-CoA molecule to
form p-coumaroil-CoA that is the precursor of all the flavonoids (Fig 5) The enzyme which
catalyses this reaction is the 4-coumarate coenzyme A ligase (4CL) 4CL is localized in grape in the
secondarily thickened walls and in the parenchyma cells of the berry pulp vascular tissue (Chen et
al 2006) 4CL belongs to a multi-gene family Itrsquos very interesting to note that the activities of
PAL C4H and 4CL are really correlated and change concomitantly (Chen et al 2006)
Fig 5 The anthocyanin synthesis pathway in plants (Deluc et al 2008)
132 Specific Steps towards flavonoid biosynthesis structural genes involved in flavonols flavan-3-ols
and anthocyanin biosynthesis
1321 CHS
The first enzyme involved specifically in flavonoids biosynthesis is calchone synthase (CHS) (Fig
5 6) CHS catalyzes the condensation of one molecule of p-coumaroil-CoA with three molecules of
malonyl-CoA to produce naringenin chalcone CHS as other enzymes involved in the
9
phenylpropanoid metabolism belongs to a large super-family of proteins the family of type III
Polykethide Synthase
1322 CHI
Naringenin calchone is converted to flavanones (naringenin) to form the flavanoid core towards a
stereo-specific ring closure catalysed by chalchone isomerase (CHI) (Jeong et al 2004) On the
basis of the CHI sequence that doesnrsquot display any detectable homology with other proteins seems
that this enzyme is unique to the plant kingdom (Fig 6)
1323 F3H FLS F3rsquoH F3rsquo5rsquoH
Naringenin is then hydroxylated at position 3 by flavanone 3-hydroxylase (F3H) to form
dihydrokaempferol the flavonols precursor Dihydrokaempferol can be substrate of three different
enzymes which directly bring to the production of the flavonol kaempferol towards the action of
flavonol synthase (FLS) or to the biosynthesis of dihydroquercetin and dihydromyricetin towards
the action respectively of flavonoid-3rsquo-hydroxylase (F3rsquoH) and flavonoid-3rsquo5rsquo-hydroxylase
(F3rsquo5rsquoH) These enzymes catalyse the hydroxylation of the B ring of dihydrokaempferol in 3rsquo or
3rsquo5rsquo positions F3rsquoH activity results in the production of cyanidin-like anthocyanins while F3rsquo5rsquoH
action brings to the production of delphinidin anthocyanins species The cloning of both F3rsquoH and
F3rsquo5rsquoH genes from grape has shown that in grape two copies of F3rsquoH and several copies of F3rsquo5rsquoH
are present in a single chromosome (Bogs et al 2006 Castellarin et al 2006) In flowers of
Petunia Hybrida has been shown that F3rsquoH and F3rsquo5rsquoH can act both on the substrates and products
of F3H (Menting et al 1994) As previously described FLS is the key enzyme in the biosynthesis
of flavonols This enzyme employs dihydrokaempferol dihydroquercetin and dihydromyricetin as
substrates to synthesize the flavonol aglicones (Chua et al 2008)
1324 DFR
FLS directly competes for its substrates with the enzyme dihydroflavonol 4-reductase (DFR) which
catalyses the first step in the conversion of dihydroflavonols to proanthocyanidins or anthocyanins
This point of the biosynthetic pathway is a key regulatory point because it determines the direction
towards flavonols or proanthocyanidins and anthocyanins synthesis DFR is in fact responsible for
the NADPH-dependent reduction at the 4 position of the C ring of dihydroquercetin and
dihydromyricetin to give respectively leucocyanidin or leucodelphinidin (Pastore 2010)
10
1325 ANR LAR LDOX and UFGT
Leucocyanidin and leucodelphinidin are respectively the substrates to the next step of the
proanthocyanidin and anthocyanin biosyntheses which involve either anthocyanidin reductase
(ANR or BAN) and leucocyanidin reductase (LAR) or leucoanthocyanidin dioxygenase (LDOX)
and UDP-glucose flavonoid 3-O-glucosyltransferase (UFGT)
In grape LAR converts leucocyanidin in the flavan-3-ol (+)-catechin with a NADPH-dependent
reduction ANR acts instead on the products of the enzyme LDOX which catalyzes the cyanidin and
delphinidin production from leucoanthocyanidins Then ANR uses these substrates to synthesize
respectively (-)-epicatechin and (-)-epicatechin-3-O-gallate (Gagneacute et al 2009)
As FLS also LDOX belongs to a family of 2-oxoglutarate-dependent oxygenase (Pastore 2010) In
a recent work has been demonstrated that in Arabidopsis Thaliana LDOX could have also a FLS
activity in vivo (Stracke et al 2009) Southern blot experiments conducted on Vitis Vinifera cv Red
Globe have shown that only a single copy of LDOX gene is present in grapevine (Gollop et al
2001) The anthocyanidins cyanidin and delphinidin produced towards the action of LDOX are
then stabilized through the addition of a glucose residue at the 3 position of the C ring This reaction
is catalysed by the enzyme UFGT and allows the anthocyanins transport into the vacuole
UFGT is the key enzyme in anthocyanin biosynthesis because it is expressed only in red skin
cultivars UFGT seems to be present in grape genome as a single copy and it is interesting to note
that its promoter and coding regions have been found also in white cultivar and are similar to the
sequences present in their red-skin sports (Kobayashi et al 2001) The 3-O-glycosilation of
anthocyanin is almost always a prerequisite for further modification as methylation and acylation
1326 OMTs
Methoxyl groups are found in three of the main anthocyanins (peonidin petunidin and malvidin-3-
O-glucoside) This reaction brings to more stable compounds for the methylation of the reactive
hydroxyl groups and the enzymes responsible are O-methyltransferases (OMTs) The first partial
purification and characterization of a methyltransferase catalyzing the methylation of cyanidin-3-
glucoside to peonidin-3-glucoside was performed on a cell suspension of Vitis vinifera cv Gamay
Freaux This enzyme is S-adenosyl-L-methionine (SAM)-dependent and it was shown that it has a
high substrate specificity reacting only with cyanidin and not with delphinidin (Pastore 2010)
11
Fig 6 Diagrammatic representation of the flavonoids biosynthesis pathway Enzymes abbreviation are as given in the
text (Jeong et al 2006)
14 Flavonoid gene expression during berry development
The pattern of flavonoid gene expression (Fig 7) is very different among different organs and
among the different phases of berry ripening Data about the trend in gene expression of some
structural genes of flavonoid biosynthesis in berry skin compared to flesh have been published by
Boss et al in 1996 for red cultivar Shiraz Northern blot analysis of berry skin RNA have shown
that the majority of genes involved in flavonoid biosynthesis are just expressed from flowering to 2-
4 weeks after full bloom and then after veacuteraison Only the expression of the gene UDP Glc-
Flavonoid 3-O-glucosyl Transferase (UFGT) is strictly linked with veacuteraison phase In berry flesh all
the genes analyzed are expressed at lower levels compared to skin except for Phenylalanine
Ammonia Lyase (PAL) and UFGT whose expression was not detectable in the flesh at any stage of
the analysis (Boss et al 1996) The early expression of the genes from CHS to LDOX and FLS
LAR and ANR could be explained by the accumulation of flavonols and tannins in the young berry
12
Regards to the genes encoding anthocyanin modifying enzymes it was demonstrated that the gene
VvF3rsquoH-1 (the only functional isoform identified) is expressed in berry skin of cultivar Merlot
throughout ripening even if its expression decreases 8ndash10 weeks after blooming VvF3H-1
transcripts increase soon after at the onset of veacuteraison and shows a secondary peak of expression
one week before harvest concurrently at the peak of anthocyanin content VvF35rsquoH-1 is instead
weakly expressed during the first stages of berry ripening and the peak of expression is reached
when all berries have turned red Transcripts of the isoforms VvF35H-2-long and VvF35H-2-
medium appear at the onset of veacuteraison and lasted till full ripening while the isogene VvF35H-2-
short was constitutively expressed throughout the ripening (Castellarin et al 2006) In cv Shiraz
both F3rsquoH and F3rsquo5rsquoH transcripts were detected at flowering and in the early stages of berry
ripening but their expression reaches a maximum one week before and a week after veacuteraison
respectively (Bogs et al 2006) Transcriptomic analyses on Shiraz and Nebbiolo grape berries
harvested at different ripening stages have shown that in these varieties the expression of AOMT
follows the same profile AOMT is not expressed before the onset of ripening but after veacuteraison
there is a strong increase in the amount of transcripts during the first weeks and then the expression
decreases and remains constant until harvest (Hugueney et al 2009)
Fig 7 Anthocyanin biosynthetic pathway (Boss et al 1996)
13
141 Regulatory genes of anthocyanin biosynthesis pathway
Among the three classes of flavonoids present in grapevine the regulation of anthocyanins
biosynthesis has been the most studied thanks to the numerous available colour bud sports which
involve alterations in the red or purple berry anthocyanin content Bud sports are usually infrequent
changes in phenotype affecting shoots of woody perennials but colour bud sports are common and
examples in horticultural plants are widespread Alterations in the anthocyanins of a plant can be in
fact very distinct and easily observed and generally have no detrimental effect on the viability of the
plant The molecular basis underlying the appearance of bud sports are not yet well understood
The study of the genes regulating structural genes expression in anthocyanin biosynthesis was at
first done in maize petunia and snapdragon (Davies amp Schwinn 2003) and then full characterized in
Arabidopsis (Broun 2005) From these researches emerged that three different types of transcription
factors play a key roles in regulation of anthocyanin biosynthesis MYB bHLH (basic Helix-Loop-
Helix) and WDR (WD40 repeats) even if the WD40 proteins function seem to be only to assist
MYB and bHLH proteins MYB genes are present in plant genomes as different families The first
experience on MYB genes in grapevine was done on the cultivar Kyoho which belongs to Vitis
labruscana (V Labrusca x V Vinifera) A cDNA library has been constructed with cDNA of ripe
berries and then using random primers designed on maize MYB conserved sequences eight
different grape MYB homologue sequences were identified Among these only four species of
MYB gene can be really identified MYBA MYBB MYBC and MYBD The whole cDNA
sequences of MYBA and MYBB showed the existence of three different species for MYBA
(VlMYBA1-1 VlMYBA1-2 and VlMYBA2) and two for MYBB (VlMYBB1-1 and VlMYBB1-2)
which are different in the nucleotide sequence Transcription analyses revealed that VlMYBA is
only weakly expressed before veacuteraison but immediately after the beginning of anthocyanin
accumulation and berry softening VlMYBA expression rapidly increases VlMYBB expression was
instead detected in all the berry ripening stages analyzed even if also VlMYBB expression increases
after veacuteraison Regards to VlMYBC and VlMYBD these genes seems to be few linked to berry
veacuteraison because the first one is expressed at high levels just at the beginning of ripening and at
veacuteraison the transcription decreases in the case of VlMYBD the expression was detected only in
the early stages of berry ripening The tight relationship between VlMYBA and berry veacuteraison and
anthocyanin accumulation was further confirmed by expression analyses which revealed that
VlMYBA transcripts differentially from the others VlMYB genes identified were detected only in
berry tissues The introduction of VlMYBA1-1 VlMYBA1-2 and VlMYBA2 in embryos causes the
appearance of reddish-purple spots and so the authors concluded that VlMYBA was the
14
transcription factor regulating UFGT expression (Kobayashi et al 2002) The molecular basis of the
regulation of UFGT expression were then confirmed also for Vitis Vinifera and it was shown that
VvMYBA was probably responsible of the ancestral differentiation between red and white cultivar
The white-skinned varieties Italia and Muscat of Alexandria have in fact a GRET1 retrotransposon
inserted in both the alleles of the promoter region of VvMYBA1 gene and this causes the
inactivation of its expression In the grape varieties that have pigmented berry skin at least one
functional VvMYBA1 allele redVvMYBA1 (rVvMYBA1) and one functional VvMYBA2 allele
redVvMYBA2 (rVvMYBA2) have to exist (Walker et al 2007)
In nature the color of grape berry ranges from the lightest pink to the darkest purple tones according
to the amount and quality of anthocyanin accumulated in the berry skin This suggests a polygenic
control of anthocyanin accumulation in Vitis Vinifera despite evidence that the primery
determination of anthocyanin production in berries appeared to be controlled by a single dominant
locus (Barrit amp Einset 1969) Among the 68 unigenes identified a cluster of four VvMYBA genes
(VvMYBA1 VvMYBA2 VvMYBA3 and VvMYBA4) was considered essential to determine the
genetic bases of the quantitative variation of anthocyanin content in berry skin After the
identification of VvMYBA1 the first expression analyses of this gene in grapevine were done by
Jeong et al (2004) on conditioned berry with the aim to alter anthocyanin accumulation The
change in expression levels of VvMYBA1 coincided with the changes in the expression levels of
other tested anthocyanin biosynthetic enzyme genes (CHS1 CHS2 CHS3 CHI1 CHI2 F3H1
F3H2 DFR LDOX and UFGT) and also with the accumulation of anthocyanins in the berry skins
This suggests that the product of VvMYBA1 gene may control the transcription of not only UFGT
but also of other structural genes whose expression increase after veacuteraison
2 Global Warming
Since the beginning of the pre-industrial era around 1750 the atmospheric concentration of
greenhouse gases has increased by about 30 because of the combustion of fossil fuels and changes
in land-use practices Increased atmospheric concentrations of greenhouse gases tend to warm the
atmosphere (Watson et al 1990) The earths climate which has been relatively stable during the
past 10000 years is now changing (Fig 8) The earths surface temperature in this century is
warmer than any other centuries during the 600 years and the last few decades have been the hottest
in this century (Mann et al 1998)
It is clear that global warming will adversely affect human health ecological systems and socio-
economic sectors including human settlements and agriculture (Movahed amp Maeiyat 2009) and
15
particularly viticulture Climate is a pervasive factor in the viability of all forms of agriculture and is
never more important than with the cultivation of grapes for the production of wine (Jones et al
2005) Global warming and viticulture are interrelated processes both of which take place on a
global scale
3 Global warming and viticulture
In the last decades the majority of the worlds highest quality wine-producing regions have
experienced growing season warming trends In these regions future global warming would exceed
a threshold as a result of which the balanced fruit ripening required for existing varieties and wine
styles would become progressively more difficult While improved winemaking knowledge and
husbandry practices contributed to the better vintages it was shown that climate had and will likely
always have a significant role in quality variations (Jones et al 2005)
In northern Europe climate change may produce positive effects on viticulture through introduction
of new varieties (Fig9) higher production and expansion of suitable areas for cultivation
Nonetheless the disadvantages may be an increase in the need for plant protection the risk of
nutrient leaching and the turnover of soil organic matters (Lough et al 1983 Jones et al 2005)
However in southern areas the disadvantages will predominate The possible increase in water
shortage and extreme weather events may cause lower harvestable yields higher yield variability
and a reduction in suitable areas These effects may reinforce the current trends of intensification of
viticulture in Northern and Western Europe and extensification in the Mediterranean and
Southeastern parts of Europe (Lough et al 1983 Jones et al 2005) In general global warming is
projected to have significant impacts on conditions affecting viticulture including temperature
carbon dioxide precipitation increasing demand for irrigation to meet higher evaporation
increasing the incidence of pests and through direct temperature effects on production quality and
quantity and the interaction of these elements (Fraser 2008)
31 The effects of global warming on berry ripening
The maturation of grapevine berries is strongly influenced by the microclimate around the fruit
Global atmospheric warming trend can affect physiological functions involved in fruit maturation
(Jones et al 2005 Mori et al 2007) Acidity anthocyanins and flavonols concentrations in berries
are clearly linked to berry temperature (Haselgrove et al 2000 Bergqvist et al 2001 Spayd et al
2002 Downey et al 2004) while sugar content is strongly influenced by berry transpiration
(Rebucci et al 1997) Daily average temperature at the time of ripening is used to estimate potential
16
temperature impacts on quality Regards to the temperature the specific number of heat units
(degree days DD) that determines rate of berry ripening is typical of each variety In general the
optimum temperature for berry growth and ripening is among 20deg-25degC (Dokoozlian 2000)
The Huglin index enables different viticulture regions of the world to be classified in terms of the
sum of temperatures required for vine development and grape ripening (Huglin 1978) Specifically
it is the sum of mean and maximum temperatures above +10degC (the thermal threshold for vine
development) Different grape varieties are thus classified according to their minimal thermal
requirement for grape ripening For example the HI is 1600 for Riesling and 1900 for Cabernet
Sauvignon (Shultz 2000) (Fig9) As a result of global warming the Huglin index is increasing
(Shultz 2000) (Fig8) so that the average ripening occurs about 1ndash2 months earlier that leads to
degraded fruit and wine quality (Lough et al 1983 Kenny amp Harrison 1992 Butterfield et al
2000 Bindi et al 1996 Jones et al 2005)
Fig 8 Huglin index from 1972 to 2005 (Shultz
2000)
Fig 9 Huglin index for some grape varieties (Shultz 2000)
In general increasing vine temperature may accelerate the rate of some metabolic process even if in
grape it has been demonstrated that above 30degC many metabolic pathways stop or are significantly
reduced (Shaked-Sachray et al 2002 Vaknin et al 2005) Biosynthesis of flavonoids (Fig 7) is
affected by many endogenous and exogenous factors (Jones et al 2005) Among these factors
sitersquos microclimate seems to have the greatest influences on flavonoid content (Downey et al
2006) For instance changes in solar radiation or temperature rise will have a direct impact on grape
composition and thus flavor via alteration of secondary metabolites such as flavonoids amino acids
and carotenoids (Roby et al 2004) Acidity sugar content anthocyanins and flavonols
concentrations in berries are clearly linked to berry temperature (Haselgrove et al 2000 Bergqvist
17
et al 2001 Spayd et al 2002 Downey et al 2004 Rebucci et al 1997) It has been suggested
that light exposure which contribute to higher temperature could control phenols biosynthesis It
could also shift or modify flavonoids composition (Pereira et al 2006 Downey et al 2004
Bucchetti 2004 Guidoni et al 2004 Bucchetti et al 2007 Filippetti 2009 Spayd et al 2002
Haselgrove et al 2000) As to Pastore (2010) late defoliation in grape (that contributes to the
higher light exposure and consequently higher temperature) could decrease titratable acidity In
addition a tendency to decrease in total anthocyanins and modifications in flavonoids composition
such as decrease of cyanidin quercetin and kaempferol and increase of malvidin level was
observed
Among the factors that determine grape wine quality and market value berry skin coloration is one
of the most important factors Grape coloration is attributable to anthocyanin accumulation in the
skin and temperature is an important factor that affects anthocyanin accumulation in grape (Mori et
al 2005b Mori et al 2007 Winkler et al 1962 Jones et al 2005 Kliewer 1970 Buttrose et al
1971 Kliewer and Torres 1972 Yamen et al 2006 Spayd et al 2002) It is reported that high
diurnal temperature generally decrease total anthocyanin amount (Yamane et al 2006 Mori et al
2007a) This effect seems to be particularly significant after veacuteraison and it can be affirmed that high
diurnal temperature generally decreases anthocyanin amount (Winkler et al 1962 Yamane et al
2006 Mori et al 2007a) The results of the stable isotope-labelled tracer experiments to examine
the effect of temperature on the turnover of anthocyanin in the skin indicated that the total
anthocyanin contents were highest in berries cultured at 25degC and lowest at 35degC and confirmed the
loss of anthocyanins in response to high temperature In the berries cultured at 35degC the total
content of 13
C- labeled anthocyanin was markedly reduced while there was no decrease in labelled
anthocyanin content in the skin of berries at 15degC and 25degC (Mori et al 2005)
The results of the study on the effect of temperature on anthocyanin composition has indicated that
the amount of all anthocyanins except malvidin 3-O glucoside was reduced by high temperature
(Romero and Bakkar 2000 Morais et al 2002 Mori et al 2007) In general methoxylation
glycosylation and acylation lead to an increase in the thermal stability of anthocyanin (Jackman and
Smith 1996) High temperature increases the degradation rate of anthocyanins but it has been
assumed that this degradation rate depends on the anthocyanin structure (Jackman and Smith 1996
Sipiora and Gutierrez-Granda 1998 Mori et al 2007) It is reasonable that only malvidin
derivatives which are highly methylated anthocyanins were accumulated and were more stable than
other anthocyanins (Mori et al 2007) The decrease in anthocyanin accumulation under high
temperature may result from factors such as anthocyanin degradation as well as the inhibition of
mRNA transcription of the anthocyanin biosynthetic genes (Mori et al 2007) Temperature might
18
affect not only the synthesis but also the stability therefore the decrease in anthocyanin
concentration at elevated temperatures might result from both decrease in synthesis and increase in
degradation (Shaked-Sachray et al 2002 Vaknin et al 2005)
In Vitis vinifera berries the most important pigments are derived from delphinidin cyanidin
petunidin peonidin and malvidin (Castellarin et al 2006) Although the corresponding
anthocyanins can be formed by the formation of acetic caffeic or p-coumaric acid esters they are
usually formed by the addition of a 3-O glucose It is therefore unsurprising that one of the genes
most up-regulated during the anthocyanin accumulation in grape berries is UFGT (Walker et al
2007) In the flavonoids biosynthesis pathway anthocyanins are the last products of
phenylpropanoid pathway It has been determined that anthocyanins are synthesized from
phenylalanine through an anthocyanin biosynthesis pathway (Fig 7) regulated by enzyme activities
(Hrazdina et al 1984) and gene expressions (Boss et al 1996) Some anthocyanin biosynthetic
pathway genes including a large number of isogenes phenylalanine ammonia lyase (PAL) chalcone
synthase (CHS) chalcone isomerase (CHI) flavanone 3-hydroxylase (F3H) dihydroflavonol 4-
reductase (DFR) leucoantho-cyanidine dioxygenase (LDOX) and UDP-glucose flavonoid 3-O-
glucosyltransferase (UFGT) etc- have been cloned (Sparvoli et al 1994) It has already been
established that in many plants the gene expression of the enzymes involved in anthocyanin
biosynthesis is affected by temperature In general the expression of the anthocyanin biosynthetic
genes was induced by low temperature in different specious (Mori et al 2005b 2007 Yamane et
al 2006 Christie et al 1994 Shvarts et al 1997 Lo Piero et al 2005 Leyva et al 1995 Shaked-
Sachray et al 2002 and Dela et al 2003) Very interesting is also the effect of different night
temperature on anthocyanin biosynthesis Warm night contributes to decrease of anthocyanin
content of grape berry skin The enzymatic activities of PAL and UFGT in the skin of Darkridge
berries grown under high (3030 degC) night temperature conditions were decreased significantly after
veraison (Mori et al 2005 Mazza and Miniati 1993 Kliewer and Torres 1972)
Flavonoids protect plants against various biotic and abiotic stresses Their oxidation reactions only
occur after senescence or an environmental stress This oxidation plays a role in defending the plant
against various biotic and abiotic stresses (Treutter 2006 Buchanan-Wollaston and Morris 2000
Munneacute-Bosch and Alegre 2004) Since grape berries grown under high temperature would receive
oxidative stress (Mori et al 2007) Flavonoids oxidation (eg Anthocyanin degradation) occurs in
order to defend the plant This reaction in plants is mainly catalyzed by polyphenol oxidases
(catechol oxidases and laccases) and peroxidases (Pourcel et al 2006) It was also reported that
among the candidates for anthocyanin degradation enzyme such as polyphenol oxidases (PPOs) and
peroxidases (PODs) peroxidases are involved in active anthocyanin degradation of Brunfelsia
19
calycina flowers (Vaknin et al 2005 Welinder et al 2002) While polyphenol oxidases increased
the rate of anthocyanin degradation in fruit extracts and juices (Kader et al 1997- 1998- 1999 Sarni
et al 1995) PPOs are not likely candidates for degrading anthocyanins in living tissues because of
their location in plastids (Vaknin et al 2005) Peroxidases in vacuoles have also been found in
grape cells and would be involved in anthocyanin degradation in the presence of H2O2 (Calderon et
al 1992) H2O2 levels in plant tissues have been shown to increase in response to heat stress (Dat
et al 1998) Flavonoid-PODs reaction might function as a mechanism for H2O2-scavenging and
therefore plant cell detoxification (Pourcel et al 2006) Gene chips micro ray analysis showed that
grape berries grown under high temperature would receive oxidative stress (since genes encoding
peroxidases and some oxidoreduction enzymes were induced (Mori et al 2007) The indication that
oxidative enzymes are involved in this process is the fact that treatment with reducing agents (such
as glutathione and DTT) and protein synthesis inhibitors (like cycloheximide and anisomycin) both
caused inhibition of anthocyanin degradation (Vaknin et al 2005) In addition the effect of
temperature on fruit foliage and flower pigmentation has shown that fading of Aster flowers color
due to high temperature could be prevented by stabilizing the pigments (Shaked-Sachray et al
2002 Nissim-levi et al 2003 Oren-Shamir and Nissim-levi 1997a 1997b 1999 Vaknin et al
2005) These findings suggest that anthocyanin degradation plays a crucial role in pigment
concentration under low rate of bisynthesis Peroxidase activity is specific and involved in the
pigment degradation (Vaknin et al 2005) Mechanisms of flavonoid oxidation lead to brown
polymers (Pourcel et al 2006 Walker and Ferrar 1998 Yoruk R and Marshall 2003 Jiang et al
2004) The browning of peel of litchi fruits has been correlated with the rapid degradation of red
anthocyanin pigments this process is associated with enzymatic oxidation of phenolics by
polyphenol oxidases (PPO) andor peroxidases (POD) (Jiang et al 2004) Although the effects of
temperature on grape berry composition and particularly on the content of anthocyanins in skins
have been studied intensively (Kliewer 1970 Buttrose et al 1971 Kliewer and Torres 1972
Spayd et al 2002 Mori et al 2005b Yamane et al 2006) the mechanisms responsible for the
poor coloration of berry skin at high temperatures have not been completely understood and no
report has demonstrate the enhancement of anthocyanin degradation due to high temperature in
grape tissues Plant responses to high temperature involve morpho-anatomical physiological
biochemical and molecular changes which sometimes have to occur very rapidly The molecular
response to heat stress involve both the induction of enzymes involved in oxidative stress (as
Peroxidase Superoxide Dismutase Ascorbate Peroxidase Catalase) and Heat Shock Proteins (HSP)
(Wahid et al 2007) As previously reported anthocyanin biosynthesis is inhibited by higher
temperature and this is confirmed by molecular studies High temperature decreased mRNA
20
accumulation of structural anthocyanin biosynthesis genes and MYBA1 in cv Aki Queen (Yamane
et al 2006) In Pinot Noir vines instead the decrease in anthocyanin content due to high
temperature treatment cannot be linked to a decrease in anthocyanin biosynthesis as no significant
differences in gene expression were found These results may contribute to suggest that the
reduction in anthocyanin biosynthesis may be also due to enzyme inhibition or anthocyanin
degradation rather than a transcriptional effect (Mori et al 2007)
4 GENERAL AIMS OF THE THESIS
The present study is mainly focused on wine grape quality with the general aim of evaluating the
impacts of high temperature condition on grape quality From 1950 the majority of the worlds
highest quality wine-producing regions have experienced warming trends in growing season and this
condition is projected to have significant impacts on grape wine production quality and yield In
particular high temperatures after veraison can negatively affect grape composition expecially skin
anthocyanin accumulation in black berry varieties On these bases the present thesis aims to analyse
two trials both on cv Sangiovese which is the most cultivated variety in Italy characterized by
peculiar anthocyanins profile
The first trial is to appraise the effects of high temperature condition on flavonoids (anthocyanins
flavonols and condensed tannins) accumulation and particularly the mechanisms responsible for
lower anthocyanin content in berries ripened under elevated temperature via assessment of the main
berry biochemical compounds during ripening and of the activities of the putative key enzymes
which are involved in anthocyanins biosynthesis (such as UFGT and PAL) and their degradation
like peroxidases and polyphenol oxidases (PODs and PPOs) In addition the expression of some
genes responsible for flavonoids biosynthesis and degradation was assessed via Real time PCR A
further step was developed to recognize the best candidate genes responsible for anthocyanin
degradation under such stress condition throught a biotechnological approach of genes
transformation from grape to Petunia flower via Agrobacterium tumefaciens
Due to global warming in the last decades and in several warm wine regions a too high level of
sugar and subsequent wine alcohol excess low acidity and in black varieties unbalanced phenolic
ripening with insufficient berry skin colour has been shown at harvest The aim of the second trial is
to evaluate the effects of management techniques applied in the field on the canopy in post-
veraison (ie trimming ) on limiting the carbohydrate availability for cluster ripening to slow down
the accumulation rate of soluble solids in berries and to avoid the ldquouncouplingrdquo of sugar
accumulation versus phenolic synthesis during ripening
21
The present work started from the data obtained in a preliminary evaluation in 2009 and both in
2010 and 2011 the quantity and quality of different flavonoids as anthocyanins flavonols and
tannins were measured during ripening in berries of treated and control vines One of the main aims
of the second trial is to evaluate if the evolution of anthocyanins and skin and seed tannins is
conditioned by the rate of sugar accumulation
22
Chapter one First part
Biochemical and molecular approaches to study the effects of temperature
on grape composition in cv Sangiovese (Vitis vinifera L )
23
1 INTRODUCTION
In the last decades the majority of the worlds highest quality wine-producing regions have
experienced warming trends in growing season and this condition is projected to have significant
impacts on grape production quality (Jones at al 2005) The optimum temperature for berry growth
is among 20deg-25degC (Dookozlian 2000) Generally higher temperatures during grape ripening lead
to an increase in the rates of sugar accumulation and organic acid degradation Flavonol content is
reported to be more influenced by UV exposure rather than temperature (Spayd et al 2002) and
little is known about the effects of temperature increase on skin and seed proanthocyanidin
especially when applied after veraison
In black berry varieties grape coloration is due to anthocyanin accumulation in the skin which could
be negatively affected by temperature (Mori et al 2005 amp 2007 Kliewer amp Torres 1972 Tomana
et al 1979) But the mechanism responsible for colour reduction in berry skin at high temperature is
not completely clear While some researches in red table grape have determined that high
temperatures suppressed the expression of anthocyanin biosynthetic genes (Yamane et al 2006)
some other studies (in Cabernet Sauvignon) did not confirm this effect as mRNA accumulation of
anthocyanin biosynthetic genes and enzyme activity of UDP-Glucose Flavonoid Transferase
(UFGT) were not inhibited under high temperature (Mori et al 2007) Therefore it can be
hypothesized that temperature would affect not only the synthesis but also the stability of
anthocyanins (Shacked-Sachray et el 2002 Vaknin et al 2005 Mori et al 2005) and chemical or
enzymatic degradation of anthocyanins can be an answer to high temperature conditions involving
in the second option polyphenol oxidase and peroxidase (Mori et al 2007 Vaknin et al 2005)
Moreover temperature has been shown to have an effect on anthocyanins composition and some
authors suggested a highest thermal stability for the tri-substituted anthocyanins (particularly
malvidin derivatives) due to their chemical structure (Mori et al 2007 Cohen et al 2012)
So it is possible to hypothize different responses to high temperature between distinct grape
cultivars according their peculiar anthocyanin composition
To date no evidence has demonstrated the effects of elevated temperature on anthocyanin
accumulation and composition of cv Sangiovese characterized by monoglucoside anthocyanins
with high percentages of hydroxylated anthocyanins (mainly cyanidine-3-glucoside)
On these bases the aim of the present research is to evaluate the effects of high temperatures on
flavonoids (anthocyanins flavonols and condensed tannins) accumulation during ripening of
Sangiovese berries And in particular the mechanisms responsible for modification of the
anthocyanins content in berries ripened under elevated temperature conditions would be studied via
24
assessment of the activities of the putative key enzymes which are involved in anthocyanins
biosynthesis (such as Phenylalanine ammonium lyase (PAL) and UDP-glucose flavonoid 3-O-
glucosyltransferase (UFGT) and their degradation (like polyphenol oxidases (PPOs) and peroxidases
(PODs) In addition the expression of some genes involved in flavonoids biosynthesis and
degradation would be appraised via Real time PCR
2 MATERIALS AND METHODS
The study was conducted in 2010 and 2012 on respectively five and three years old uniform potted
plants of Vitis vinifera cv Sangiovese The vines grafted on SO4 rootstocks were grown in pots of
30 liter containing a mixture of sand and soil (1 1) In both years before the experiment the
number of shoots was standardized (around 9 shoots in 2010 and 6 in 2012) In addition in order to
have a uniform leaf area in all the vines the tip of each shoot was removed when 20 main leaves
were produced Before veraison (27th of July 2010 and 19th of July 2012) 8 and 12 uniform vines
were selected in 2010 and 2012 respectively on the bases of size of shoots and the bunch number
The selected vines were assigned to the two treatments LT (Low Temperature) and HT (High
Temperature)
In the LT treatment the vines were placed from pre-veraison to harvest in a plastic tunnel where the
minimum temperature was about 17 degC and the mean and maximum air temperatures were
maintained with a cooler below 26deg and 35degC
In the HT treatment the air temperature was similar to the ambient as the vines were distribuited in a
plastic tunnel which was open in the basal part and covered only the canopies to maintain the light
conditions similar to the LT vines In HT tunnel during the experimental period of 2010 the
minimum temperature was about 18deg and the mean air temperature was 26 degC while in 2012 they
were measured to be about 19deg and 28 degC respectively The maximum air temperaure could instead
exceed to 43degC and 44degC in 2010 and 2012 sequentially
Both tunnels were made of polyethylene film (MOP Bologna Italy) that did not alter the spectral
composition of light while the percentage of transmission was decreased by a maximum of 12
within the visible range
All the vines were daily watered automatically and well supplied with nutrients
21 Temperature monitoring
Berry skin temperature was monitored in 10 selected clusters of the plants in low temperature tunnel
(LT) and 10 clusters of the vines in high temperature tunnel (HT) in both years In each of these two
25
treatments temperature data were recorded from one week before veraison of both years until
harvest towards 10 T- type thermocouples (RS component MI Italy) positioned in the sub-cuticle
tissues of berry skin Each probe was then connected to a CR10X data logger (Campbell Scientific
Ltd Leicestershire United Kingdom) registering temperature data every 20 minutes and each one
hour in 2010 and 2012 sequentially The air temperature inside the tunnels were also monitored and
recorded each hour during the same period by air temperature sensors (TL20 3M Milan Italy)
22 Berry sampling
Berry sampling was conducted from 1 week before the veraison to the harvest in both years of the
trial In total 45 berries per each 8 vines and 30 berries per each 12 vines were sampled every 8 and
10 days in 2010 and 2012 respectively The 180 sampled berries for each of the two treatments were
pooled separately and divided into 4 biological replicates of 45 berries each to perform biochemical
and molecular analyses The berries of the first group (15) were weighed and immediately used for
degBrix titratable acidity and pH measurment All the other sampled berries were immediately frozen
in liquid nitrogen and kept in the freezer (-80 degC) until the analyses to evaluate the quality and the
quantity of the anthocyanins and flavonols (10 berries) skin and seed tannins (10 berries) and to
assess the gene expression and the enzymatic activity (10 berries)
23 degBrix titratable acidity and pH
The sampled berries were crushed and the must were sieved and used for degBrix analysis by a
temperature-compensating CR50 refractometer (Maselli Misure Spa PR Italy) Five mL of the
same must were then diluted 7 times with bi-distilled water and used to perform a titration reaction
by a Crison Compact Tritator (Crison Barcelona Spain) with 1N 05 N or 025 N NaOH (Sigma-
Aldrich St Louis MO USA) according to the stage of berry ripening to obtain pH and TA data
(expressed as gl of tartaric acid equivalents)
24 Analyses of anthocyanins and flavonols
The berries of each replication were sampled and weighted before the extraction of anthocyanins
and flavonols Then the skin was carefully removed from the pulp and immerged in 50 mL of
HPLC-grade methanol (Carlo Erba Reagents Milano Italy) and were kept in dark for 24 hours
The day after the extract was separated from the skin residues and conserved at (-20oC) until the
anthocyanins analysis
26
To analyze the total content of each flavonol aglycon an aliquot of 5 mL of the same methanol
extract was completely dried under vacuum To achieve the acid hydrolyzation of flavonols
glucosides the pellet was re-suspended in 25 mL of methanol and 25 mL of 2M Trifluoroacetic
acid (Sigma-Aldrich St Louis MO USA) in milliQ water The reaction was conducted at 100 oC in
a boiling hot water bath with a condenser for 2 hours The reaction product was then completely
dried under vacuum and the pellet obtained re-suspended in 1mL of methanol and was kept at (-
20oC) until HPLC analysis
HPLC separation and quantification of anthocyanins and flavonols were performed on a Waters
1525 instrument equipped with a diode array detector (DAD) using a reversed-phase column
Phenomenex (Castel Maggiore BO Italy) RP18 250 mmx4mm (5microM) with precolumn Either for
anthocyanins and flavonols the eluents used were the following A= HClO4 03 in milliQ water B
= methanol
For anthocyanin analysis the methanol extract was filtered through 022 microm 13mm PTFE syringe-
tip filters (Teknokroma Barcelona Spain) and an aliquot of 270 microL was diluted to final volume of
1mL with the A eluent The binary gradient was the same as reported in Mattivi et al (2006) with
suitable modifications The time for column equilibration was 5 minutes and the injection volume
was 60 microL Separation of the main free anthocyanins was obtained at 43 oC and they were quantified
at 520 nm with a calibration curve with malvidin-3-glucoside (Sigma-Aldrich ST Louis MO
USA)
Hydrolyzed flavonols samples were filtered through 045 microm 13 mm PTFE syringe- tip filters
(Teknokroma Barcelona Spain) directly into liquid chromatography vials Flavonols aglicones
were separated at 40deg C through the linear gradient as reported in Mattivi et al (2006)
The time for equilibration column and the injection volume were the same used for the HPLC-DAD
analyses of anthocyanins Quercetin myricetin and kaempferol were quantified at 370 nm with the
corresponding external standard purchased from Extrasynthese (Genay France)
25 Tannins analysis
To extract proanthocyanidins frozen berries samples (skins and seeds) were ground separately to a
fine powder under liquid N2 01 g aliquots were separated and extracted in darkness in 2 mL screw-
top Eppendorf tubes for 24 hours with 70 acetone containing 01 ascorbate (10 mL) to prevent
oxidation of polyphenols (Kallithraka et al 1995) Samples were then centrifuged (15 min 13000 x
g) and two 400 μL aliquots of the supernatant were transferred to fresh tubes and dried down under
vacuum at 35ordmC for 120 minutes
27
One of them was re-suspended in 100 μL methanol acidified with 1 HCl then neutralized with 100
μL sodium acetate (200 mM pH 75) for the analysis of free monomers The other aliquot
underwent acid-catalyzed cleavage of the proanthocyanidins in the presence of excess
phloroglucinol following the method of Kennedy and Jones (2001) Briefly the dried sample was
re-suspended in 100 μL of phloroglucinol buffer (025 g ascorbate 125 g phloroglucinol 215 μL
conc HCl 25 mL methanol) and incubated at 50ordmC for 20 minutes then neutralized with 100 μL of
sodium acetate (200 mM pH 75) and centrifuged (15 min 13000 x g) A 200 μL aliquot each of
the acetone extract the acetone extract after acid catalyzed cleavage and the residue after cleavage
was then transferred to Sun-broker 250 μL reduced volume HPLC auto-sampler vials Samples were
run on a Waters 1525 instrument equipped with a diode array detector (DAD) using a reversed-
phase column Phenomenextrade (Castel Maggiore BO Italy) RP18 250 mmx4mm (5microM) with
precolumn A separate reversed-phase HPLC method was developed for the cleaved and uncleaved
proanthocyanidin samples reading absorbance at 280 nm Uncleaved samples solvent A 02
phosphoric acid solvent B 41 acetonitrile02 phosphoric acid (gradient of solvent B zero min
0 5 min 10 40 min 10 55 min 17 65 min 19 75 min 19 80 min 100 85 min
100 86 min 0) Cleaved samples solvent A 02 acetic acid solvent B methanol (gradient of
solvent B zero min 1 40 min 1 120 min 30 1201 min 100 125 min 100 126 min
1) For both methods 25 μL of sample was injected and run at 30ordmC with a flow rate of 1 mLmin
Concentrations of free monomers and hydrolysed terminal subunits were determined from standard
curves prepared from commercial standards of catechin epicatechin epigallocatechin and
epicatechin-gallate obtained from Extrasynthese (France) The concentration of extension subunit-
phloroglucinol adducts was calculated from published molar extinction coefficients (Kennedy amp
Jones 2001) The evaluation of skin and seeds tannins was performed only on the samples of the
year 2010
26 Real-time PCR analyses RNA extraction and RNA evaluation
Real-time PCR analyses were performed for four and five selected stages of berry ripening in 2010
and 2012 respectively from beginning of veraison to the end of harvest Total RNA was isolated
from 200 mg and 500 mg in 2010 and 2012 respectively of the powdered berry skin tissue using
spectrumTM
Plant Total RNA kit (Sigma-Aldrich St Louis MO USA) following the manufacturers
protocol One microL of each RNA sample was measured spectrophotometrically to determine RNA
quantity and 260280 and 260230 ratio using a NanoDrop1000 Spectrophotometer (Thermo Fisher
Scientific Wilmington DE USA) Total RNA was treated with 1 U microg-1 RQ1 DNase (Promega
28
Milan Italy) First-strand cDNA was synthesized using 1 microg of RNA 1microL (dT)15 primer (500
microgmL) and 1 U of GoScripttrade reverse transcriptase (Promega) Quantitative RT-PCR was carried
out on a Step One Plustrade (Applied Biosystems Foster City California USA) Each reaction (10
microL) contained 188 nM of each primer 2microL of diluted cDNA (150) 5microL U of Power SYBRreg Green
PCR Master Mix (Applied Biosystems Foster City California USA) Thermal cycling conditions
were 95 degC for 10 min followed by 95 degC for 15 s 55 degC for 1 min for 40 cycles followed by a
melting cycle which contains 95 degC for 15 sec 60 degC for 1 min and 95 degC for 15 sec Each cDNA
sample was analyzed in triplicate Primers pairs for Dihydroflavonol 4-reductase (DFR)
Leucoanthocyanidin dioxygenase (LDOX) and UDP-glucose flavonoid 3-O-glucosyltransferase
(UFGT) were retrieved from literature (Goto-Yamamoto et al 2002) primers for VvMYBA1 were
from Jeong et al (2004) for Leucocyanidin reductase (LAR) and Anthocyanidin reductase (ANR
or BAN) from Bogs et al (2005) and for Peroxidase (POD6 ) from Mori et al (2007) Primers for
Flavanone 3-hydroxylase (F3rsquoHb) Flavonoid-3rsquo5rsquo-hydroxylase (F3rsquo5rsquoHk and F3rsquo5rsquoHi)
Phenylalanine ammonium lyase (PAL) Flavonol synthase (FLS) and Peroxidases (POD1 to POD5)
were newly designed on the original DNA sequences to amplify 150ndash250 bp gene fragments (Table
1)
29
Table 1 Sequence of primers used for Real time PCR amplification
Primer Forward Primer Reverse
DFR 5-GAAACCTGTAGATGGCAGGA-3 5-GGCCAAATCAAACTACCAGA-3
LDOX 5-AGGCTCTACTCTCCAAATGA-3 5-GAAGCTTGAAACACAGACCA-3
UFGT 5-AATCTGAGAGCCCTAAGAGA-3 5-GGTGGTACAAGCAACAGTTC-3
MYBA 1 5-TAGTCACCACTTCAAAAAGG-3 5-GAATGTGTTTGGGGTTTATC-3
LAR 5-TCTCGACATAAATGATGATGTG-3 5-TGCAGTTTCTTTGATTGAGTTC-3
BAN 5-CAATACCAGTGTTCCTGAGC-3 5-AAACTGAACCCCTCTTTCAC-3
PAL 5-ACATACCTAGTGGCACTCTG-3 5-TCGCAGAATCTCGATGGATG-3
F3Hb 5-TCCATCACCAAGTCTTCTAC-3 5-GCGGAGAAGCTGAACATGGA-3
F35Hi 5-CAGACTGCATACGCACTCTG-3 5-ATGCCGGATGGAGTTGAGAT-3
F35Hk 5-CCAGGCCTAGCTACTATATG-3 5-GCATATGGCATGGTGGTAGA-3
FLS 5-CTGCACTATCCAGAGATGAG-3 5-TTGCCGCTTCAACAACAACA-3
POD 1 5-TCTGAGTAAGAGCCCACACACTCT-3 5-GAGACCTGAGCAGATAAATACAAAAATAAA-3
POD 2 5-AAAGTTGTTTGGCTGTGG-3 5-AATCCCTCCAAACAATCA-3
POD 3 5-TGCTCTAAATGCCTGAAAAATG-3 5-ATCATATAGAAAAGTGACAGCAACCT-3
POD 4 5-CAACTTCACACCAACGGGAAA-3 5-GCAGCTGAGCAAGAAATGCTT-3
POD 5 5-TCGGTGAGGAACTCCGATA-3 5-AGCTTCCTTGTCCTCTTCCA-3
POD 6 5-AACTTGAGACACAACAGCATAAATAAATC-3 5-AGGACCAAATCACAGGATGATAAAG-3
ACT 5-ATTCCTCACCATCATCAGCA-3 5-GACGAGCCCCTCCTACTAAAACT-3
30
27 Enzyme assay
27 1 PAL activity assay
The extraction was performed according to the method of Mori et al (2005) with some
modifications The following procedures for protein extraction were conducted at 4deg C For each
replication 02 g of berry skin was ground with a mortar and pestle in liquid nitrogen until a fine
powder was obtained
The skin powder was homogenized with 15 mL of a 100 mM Sodium borate buffer (pH 9)
containing 0075 g of PolyVinyl-PolyPyrrolidone (PVPP) and 100 microL of a 200 mM Dithiothreitol
After incubation in ice for 20 minutes centrifugation was done at (4deg C 15 min 10000 x g)
Then 1mL of the supernatant was desalted by passing through a NAP-10 column (Sephadex G-25
Amersham Biotech) equilibrated with 15 mL of the same buffer
For the analysis of PAL activity the reaction mixture consisted of 05 mL of Phenylalanine and 05
mL of the enzyme solution The assay mixture was incubated in 37deg C for 60 minutes The reaction
was terminated by adding 05 mL of HCl acid (18) The quantity of the product namely Trans-
cinnamic acid was calculated using its extinction coefficient of 9630 M-1
cm-1
at 290 nm One unit
of PAL was expressed as synthesis of 1 mol of Trans-cinnamic acid per minute and PAL activity
was expressed as microkat g-1 protein
27 2 UFGT activity assay
The extraction was performed according to the method of Mori et al (2007) with some
modifications The following procedures for protein extraction were conducted at 4 oC For each
replication (02 g) of berry skin was ground with a mortar and pestle in liquid nitrogen until a fine
powder was obtained The skin powder was homogenized with 13 mL of a 250 mM TRISndashHCl
buffer (pH 75) containing 10 mM Polyethylene glycol 3400 150 microL of 10 mM Na-
diethyldithiocarbamate 15 microL of 200 mM Dithiothreitol and 2 microL of 2-mercaptoethanol and was
incubated for 20 min on ice After centrifugation of the homogenate at 10000 x g for 20 min The
supernatant was passed through a NAP-10 column (Sephadex G-25 Amersham Biotech)
equilibrated with a 15 mM TRISndashHCl buffer (pH 75)
The desalted crude extract was used as the enzyme solution in the following enzyme assay using
delphinidin and cyanidin as substrates The method of Mori et al (2007) was employed with some
modifications for the analysis of UFGT activity For the first assay the reaction mixture consisted of
02 mL of the previous extraction solution (containing TRISndashHCl buffer (pH 75) Polyethylene
glycol 3400 Na-diethyldithiocarbamate Dithiothreitol and 2-mercaptoethanol) 50 microL of 1mM
31
Cyanidin 50 microL of 100mM UDP-glucose and 02 mL of the enzyme solution The assay mixture
was incubated for 5 min at 37deg C The reaction was terminated by adding 150 microL of 5 HCl The
quantity of the product namely Cyanidin-3-glucoside was measured using its extinction coefficient
of 26900 M-1
cm-1
(at 520 nm pH 1)
Therefore one unit of UFGT was defined as the production of 1 mol of Cyanidin-3-glucoside per
second and UFGT activity was expressed as pkat g-1 protein
For the second assay the reaction mixture consisted of 02 mL of the same extraction solution
(containing TRISndashHCl buffer (pH 75) Polyethylene glycol 3400 Na-diethyldithiocarbamate
Dithiothreitol and 2-mercaptoethanol) 50 microL of 1mM Delphinidin 50 microL of 100mM UDP-glucose
and 02 mL of the enzyme solution The assay mixture was incubated for 5 min at 37deg C The
reaction was terminated by adding 150 microL of 5 HCl The quantity of the product namely
Delphinidin-3-glucoside was measured using its extinction coefficient of 26000 M-1 cm-1 (at 520
nm pH 1)
Therefore one unit of UFGT was defined as the production of 1 mol of Delphinidin-3-glucoside per
second and UFGT activity was expressed as pkat g-1 protein
27 3 Guaiacol PODs activity assay
Guaiacol PODs were assayed as described by Ushimaru et al (1997) using pyrogallol as the
electron donor for the reaction The plant material (skin) was extracted in cold buffer (200 mM
sodium phosphate 5 mM sodium EDTA 1 PVPP pH 70) and incubated on ice for 30 min After
centrifugation at (10000 times g 30 min 4 degC) the desalted supernatant was used for the assay The
reaction mixture (25 mL) included 22 mL of the 10 mM sodium phosphate buffer pH 70 100 microL
of the 25 mM H2O2 50 mM pyrogallol and 100 μl extract H2O2 and pyrogallol were prepared
fresh just before use Absorbance (λ=430 nm) was taken after 5 min incubation at room temperature
and referred to a blank with no extract added One unit of Guaiacol peroxidases is defined as the
amount of enzyme that catalyzes the oxidation of 1 μmol of pyrogallol per minute under the
conditions described by Chen and Asada (1989) and PODs activity was expressed as kat g-1 skin
fresh weight An absorbance coefficient of 247 mM-1 cm-1 was assumed for calculations
27 4 PPOs activity assay
PPOs were assayed as described by Ushimaru et al (1997) using pyrogallol as the electron donor
for the reaction The plant material (skin) was extracted in cold buffer (200 mM sodium phosphate
5 mM sodium EDTA 1 PVPP pH 70) and incubated on ice for 30 min After centrifugation at
32
(10000 times g 30 min 4 degC) the desalted supernatant was used for the assay The reaction mixture
included 28 mL of the 100 mM sodium phosphate buffer pH 70 1 mM pyrogallol and 100 μl
extract the pyrogallol was prepared fresh just before use Absorbance (λ=430 nm) was taken after 5
min incubation at room temperature and referred to a blank with no extract added One unit of
Polyphenol oxidases is defined as the amount of enzyme that catalyzes the oxidation of 1 μmol of
pyrogallol per minute under the conditions described by Chen and Asada (1989) and PPOs activity
was expressed as kat g-1 skin fresh weight An absorbance coefficient of 247 mM-1 cm-1 was
assumed for calculations
28 Vegetative and Yield measurements
In both years immediately after harvest all the leaves of each vine of the both tunnels were
removed and their areas were measured using a leaf area meter (LI3000 LiCor Inc Lincoln Neb
USA) along with the number of nodes of each single shoots
The grape bunches were harvested when the total soluble solids of berries had reached to
approximately 22 o
brix All bunches were removed counted and weighed in both treatments to
determine the yield of each vine
29 Statistical analyses
Data were submitted to analysis of variance and means were separated by the Student-Newman-
Keuls test by SAS statistical software (SAS Institute Cary North Carolina USA) The experiments
were conducted with four replications from each treatment and the values were the means of four
replications
3 RESULTS AND DISCUSSION
31 Berry Temperature
The berry temperature in both tunnels was influenced by the two air temperature regimes (HT and
LT) The average berry temperature in the LT tunnel during the ripening period of 2010 was
recorded to be about 20 oC while it was about 24deg C in HT In 2012 the average berry temperature in
both treatments were recorded to be about 2deg higher than in 2010
The maximum berry temperature in both years showed the highest differences between the two
treatments as it was maintained below 35 degC in LT and it might exceed to 42 degC in correspondence
of several heat weaves during the ripening in HT (Fig10)
33
The analyses of the number of hours exceeding the 30 and 35degC showed significant higher values in
both years in HT than in LT (Table 2 ) In particular the number of hours over 35deg C was null in LT
berries while it was about 70 and 157 hours in HT berries in 2010 and 2012 respectively Moreover
despite between the two years only few differences were found in mean and maximum berry
temperatures 2012 berries spent more hours at high temperature than in 2010 regardless from the
different treatments and the temperature fluctuations were higher during the ripening period of 2010
(Table 2) In addition in 2010 the percentage of the average berry temperature more than 30 degC
was about four folds more in the HT tunnels as compared to LT one while in 2012 this percentage
was six folds higher
Fig 10 The average and maximum daily berry temperature (oC) grown under high and low temperature conditions
during ripening in 2010 and 2012
34
Table 2 The percentage and the number of hours that the average of berry temperature was higher than 30deg and 35degC
in both treatments during the experimental period in the years 2010 and 2012
Total
experimental
time
(Ndeg hours)
Average berry
temperaturegt
35 degC
(Ndeg hours)
Average berry
temperature gt
30 degC
(Ndeg hours)
Average berry
temperature gt
35 degC
()
Average berry
temperature gt
30degC
()
Treatment Year
1176 hr 70hr 192 hr 6 163 HT 2010
0 55 hr 0 47 LT
1257 hr 157 hr 392 hr 1250 31 HT 2012
0 91 hr 0 7 LT
32 Leaf area and Yield
The plant materials used in this trial were not the same in the two years In 2010 and 2012
respectively five years old and three years old uniform potted vines were used for the treatments
Therefore the comparison could be done only between the treatments in each year and the year
effect would not be considered
In both years before the experiment the vines were uniformed for the number of shoots and clusters
in both treatments But the main lateral and total leaf areas per vine were significantly higher in LT
vines respect to HT (Table 3)
In 2010 the yield and its components were not significantly different between the LT and the HT
vines (Table 4) while in 2012 the yield was 36 more in LT as compared to HT ones Since the
cluster number per vine and the berry weight were similar in this year this result is mainly due to a
higher number of berries per cluster which imply that the cluster weight was higher in LT vines
(Table 4)
It seems that the higher temperature in HT may be responsible for drying out the basal leaves in HT
at the end of ripening and these conditions which have been assessed also by visual observation
caused a lower average leaf area compared to LT as the leaf area estimation was assessed after
harvest Besides the warmer condition of 2012 has been contributed to drop of some berries due to
the dehydration and drought in the very last period of ripening in HT Based on these
considerations it is likely that HT thermal condition did not show negative physiological effect on
vegetative growth and yield as the treatment was imposed at veraison and we registered a
ldquosecondaryrdquo effect due to the leaves and berry drop in the very last part of ripening
35
Table 3 Leaf area of grapes grown under high (HT) and low (LT) temperature conditions during ripening of the years
2010 and 2012
Year Treatments
Main Leaf area
(cm2vine)
Lateral Leaf area
(cm2vine)
Total leaf area
(cm2vine)
2010 LT 117425 105785 22321
HT 71682 80629 152311
2012 LT 13460 5690 19150
HT 6715 3742 10457
Table 4 Yield and yield components of grapes grown under high (HT) and low (LT) temperature conditions during
ripening of the years 2010 and 2012
Year Treatments No Cluster
Vine
Yield
Vine
(gr)
Cluster
weight
(gr)
Berry weight
(gr)
Berries per
cluster
(n)
LA Yield
per vine
(cm2 gr)
2010 LT 11 16666
1515
24 63 134
HT 12 18245
1520 21 72 835
ns ns ns ns ns
2012 LT 6 8616
1436
22 65 222
HT 5 5355 1071 21 51 196
ns ns ns
36
33 oBrix pH Titratable acidity
The results indicated that in 2010 a similar trend in the percentage of Total Soluble Solids in berries
grown under low and high temperature was measured and no significant differences was observed
among the two treatments in titratable acidity (TA) and pH However in 2012 the advanced ripening
in HT grapes was associated with higher level of oBrix during ripening nevertheless they reached
the same level at harvest Moreover it seems that the elevated temperature contributed to
degradation of titratable acids and increase in pH (Fig 11) There are contradictory reports on the
effects of high temperature on sugar accumulation in grape during different stages of berry
development Several papers (Matsui et al 1986 Sepuacutelveda and Kliewer 1986 Kliewer et al
1977) reported a general delay in ripening which is attributed to the impact of heat on the
photosynthetic supply of sugar Photosynthesis of grapevines is reduced at temperatures above 35 oC
(Kriedemann 1968 Ferrini et al 1995 Schultz 2003 Yu et al 2009 Zsoacutefi et al 2009) and
generally the restrictions to photosynthesis are caused by stomatal limitation As to Sepuacutelveda et al
(1986) prevention of the soluble sugar accumulation in berries by high temperature cannot be
accounted for an inhibition of the phloem transport between the leaves and the bunchs In contrary
Soar et al (2009) reported an increase in photosynthesis and stomatal conductance when Shiraz
vines were heated for short periods Moreover in some other researches sugar accumulation was not
influenced by temperature increase (Yamane et al 2006 Greer and Weston 2010)
In general tartaric acid concentration decrease after veacuteraison is mainly due to a dilution effect since
berry volume increase and amount of tartrate remains constant So far no enzymes degrading
tartaric acid have been ever found in grape In contrast the decrease in malic acid amount at the
beginning of ripening is associated with respiration and enzyme degradation as well as dilution
effect Malic acid may be therefore transformed to hexoses or used as energy source Metabolic
changes occurring during grape berry development (Taureilles-Saurel et al 1995) together with
light and temperature are the main parameters controlling the malate synthesisdegradation rate
Grape berries malic acid concentration at harvest is negatively correlated with temperature during
the ripening period It has been demonstrated that the optimum temperature range for acids synthesis
is between 20degC and 25degC and that with increasing temperature synthesis of malic acid decrease
and catabolic rate accelerate (Kliever et al 1967) These results are in accordance with the results of
this study and what was observed on the effects of elevated temperature in Cabernet Franc and
Chardonnay grapes where the pH increased and TA decreased Also the effects of higher
temperature induced by veraison defoliation had similar effects on pH and titratable acidity due to
the malic acid degradation (Guidoni et al 2004 Pastore 2011)
37
Fig 11 The trend of oBrix titratable acidity and pH of grapes grown under high (HT) and low (LT) temperature
conditions during ripening of the years 2010 and 2012
34 Biosynthesis of flavonoids
34 1 Anthocyanins accumulation during ripening
In both years the anthocyanin level in the skin of Sangiovese (Fig 12) started to increase after
veraison until harvest in both treatments Nonetheless in HT berries was significantly reduced
respect to LT ones As an illustration in 2010 the level of total anthocyanin at harvest was decreased
about 65 in the skin of the grapes grown under high temperature conditions as compared to LT
and at the harvest time of the year 2012 this reduction was 50 In agreement with the results on
other grape varieties (Darkridge grape Cabernet Sauvignon Tokay Japanese table grape Kyoho
Mori et al 2005 amp 2007 Kliewer amp Torres 1972 Tomana et al 1979) we found that in
38
Sangiovese high berry temperature (over 35degC) after veraison prevented anthocyanin formation in
grapes and greatly reduced the coloration as compared to fruits ripened at lower temperatures
According to HPLC analysis of the both years as expected the major individual anthocyanin in the
berry skin of both LT and HT treatments was malvidin-3-glucoside (Fig 12)
Anyway no differences in anthocyanin profiles were recorded at harvest between HT and LT grapes
in 2010 (Table 5) In 2012 at harvest the percentage of malvidin -3-G was higher in LT compared to
HT (Table 5)
Previous studies on Cabernet Sauvignon reported the higher thermal stability of malvidin-
derivatives anthocyanins due to the high level of methoxylation and acylation (Mori et al 2007
Romero and Bakker 2000 Morais et al 2002) but it is in contrast to our findings in this respect on
Sangiovese It has to be noticed that in Sangiovese the anthocyanin composition is quite different
from Cabernet Sauvignon and it is characterized by the high level of cyanidin-3G and by the
absence of p-coumarated and acetated malvidin derivatives anthocyanins
From the data of our two-year trials it is not possible to confirm the differences in thermal stability
of the five monoglucoside anthocyanins of Sangiovese based on their chemical structure And by
assessing solely the anthocyanins quantity and profile it was not possible to understand if the
reduction of anthocyanins under high temperature is due to biosynthetic activity reduction or to a
mechanism of anthocyanins degradation Therefore additional analyses were required in order to
obtain more comprehensive information about this issue
39
Fig 12 The trends of total and individual anthocyanins concentrations in the skin of Sangiovese berries grown under high (HT)
and low(LT) temperature conditions during ripening in the years 2010 and 2012
40
Table 5 The anthocyanin profiles at harvest in the skin of Sangiovese berries grown under high (HT) and low (LT)
temperature conditions during ripening in the years 2010 and 2012
Anthocyanin profile at harvest
Malvidin-3-G Petunidin-3-G Delphinidin-3-G Peonidin-3-G Cyanidin-3-G
2010 LT 36 13 11 18 22
HT 41 13 11 18 17
ns ns ns ns ns
2012 LT 43 14 11 16 16
HT 33 16 14 16 21
ns ns ns ns
34 2 Flavonols accumulation during ripening
In the both years the levels of flavonols in HT and LT berries increased gradually after veraison
and significant decrease was observed in the level of total and individual flavonols in HT berries as
compared to LT ones in 2012 (Fig 13)
In general the highest level of flavonols in grapes was found at flowering followed by a decrease as
the grapes increased in size Subsequently a significant level of flavonol biosynthesis is in general
observed during berry development and the greatest increase in flavonols per berry can be detected
3-4 weeks post-veraison (Downey et al 2003)
Flavonols accumulation in wine grape tissues has been studied extensively While several authors
reported a solid correlation between fruit light exposure and flavonol glucosides content (Price et al
1995 Haselgrove et al 2000 Spayd et al 2002) the effect of temperature on flavonol synthesis is
not understood completely Spayd et al (2002) and Mori et al (2005) did not observe any effect of
temperature treatment on flavonol synthesis To the contrary the inhibitory effect of high
temperatures on flavonol was also reported by Goto-Yamamoto et al (2009) Since in our research
we excluded the effect of different light exposure between the two treatments the lower
accumulation of flavonols in HT berries is probably due to a regulatory mechanism which rules the
anthocyanins response to high temperature condition
41
Moreover the analyses of each flavonol compound at harvest (quercetin kaempferol and myricetin
showed as expected that quercetin has the highest percentage The flavonols profiles at harvest in
the skin of Sangiovese berries grown under high and low temperature conditions during ripening
were similar in the year 2010 but it was significantly different among the treatments in 2012 (Table
6)
Fig 13 The trends of total and individual flavonols concentrations in the skin of Sangiovese berries grown under high
(HT) and low (LT) temperature conditions during ripening in the years 2010 and 2012
42
Table 6 The flavonols profiles at harvest in the skin of Sangiovese berries grown under high (HT) and low (LT)
temperature conditions during ripening in the years 2010 and 2012
Flavonols profile at harvest
Quercetin Kaempferol Myricetin
2010 LT 746 68 186
HT 735 75 189
ns ns ns
2012 LT 668 36 296
HT 642 26 332
34 3 Tannins accumulation during ripening
Tannins assessment was done in 2010 In this trial regardless from the treatments the amount of
total and individual tannins of seed and skin decreased generally from veraison to harvest This
result is in accordance with the previous works conducted by Harbertson et al (2002) Adams
(2006) and Kennedy et al (2001) From this research emerges that the two temperature regimes did
not affect the tannins branch of flavonoid biosynthesis This is comprehensible considering that
tannins are accumulated very early in berry development and the decline in their concentration from
veraison to harvest only reflects the quantitative changes that take place during berry ripening
(decrease of the tannins concentration in proportion to berry growth)
43
Fig 14 The trends of total and individual tannins concentrations in the berry seed and the skin of Sangiovese berries
grown under high (HT) and low (LT) temperature conditions during ripening in 2010
44
35 Gene expression assessment
In the present study the expression of some genes involved in the general flavonoid biosynthetic
pathway (PAL F3rsquoHb F3rsquo5rsquoHk F3rsquo5rsquoHi DFR LDOX) and the specific genes for anthocyanins
(UFGT and VvMYBA1) flavonols (FLS) and tannins biosynthesis (LAR BAN) were studied in
berries grown under two different temperature regimes (Fig 15)
In HT berries a strong reduction of anthocyanins and flavonols concentration and no effect on tannin
biosynthesis was observed and this seems to be directly related to the general inhibition of the
expression of flavonoids biosynthetic genes detected in this research (Fig 15) Furthermore it was
interesting to observe that even if the response in terms of total flavonoid accumulation was
comparable in 2010 and 2012 the flavonoid composition and the expression profile of some of the
analyzed genes was quite different between the two years of the experiment (Fig 15 Fig 16 Table
5 and 6)
The profile of PAL gene expression was mainly similar in the both years starting to increase in the
both treatments about 15 days after veraison PAL gene seemed to be repressed by high temperature
as a considerable higher level of expression in LT berries in respect to the HT ones was recorded in
both years about 37 days after veraison even if in 2010 it was not significantly different between the
two treatments This result is in agreement with many papers in which a direct correlation between
enhanced flavonoid accumulation (in particular anthocyanins) and increase in PAL gene expression
is reported (Pastore et al 2011 Ageorges et al 2006 Ban et al 2003 Roubelakis-Angelakis and
Kliewer 1986)
F3rsquo5rsquoHs and F3rsquoHs are versatile enzymes that are able to accept several phenylpropanoid substrates
and competitively control the synthesis of cyanidin- and delphinidin-flavonoid derivatives Two
isoforms of F3rsquoHs have been detected in grapevine genome until now (Castellarin et al 2006) In
this research the transcription of F3rsquoHb showed different profile of expression between the two
years of the trial In fact the transcription level of F3Hb was not affected or even induced by high
temperature 20 days after veraison in 2010 but we found exactly an opposite result in 2012 where
in LT berries a significant increase in F3rsquoHb expression was recorded 33 days after veraison in
comparison to HT
Studying the expression of F35Hi and F3rsquo5rsquoHk genes we observed that they were affected by high
temperature during ripening in both years showing similar transcription profiles Starting from full
veraison when all berries have turned red F3rsquo5rsquoHi expression increased in LT berries reaching a
maximum from one to two weeks after veraison in both 2010 and 2012 Also F3rsquo5rsquoHk expression
showed an increase in LT berries about 7 days after veraison in 2010 in comparison to HT and a
strong enhancement on F3rsquo5rsquoHk expression was observed in LT berries in 2012 (Fig 15) Sixteen
45
copies of F3rsquo5rsquoHs are present in the grapevine genome (Falginella et al 2010) suggesting a possible
role for each of them in different developmental and environmental conditions
The different patterns of expression observed for F3rsquoHb and F3rsquo5rsquoHs could suggest that the former
may be less sensitive in comparison to the latter to critical temperature conditions Considering that
the berry temperature in HT tunnel was higher in 2012 than 2010 (Table 2) it seems that F3rsquoHb is
able to tolerate thermal stress when temperature higher than 35degC are imposed for short periods as
in 2010 whereas in 2012 when HT berries spent more than two-fold hours at temperature higher
than 35degC in comparison to 2010 the F3rsquoHb expression is repressed From this study emerges that
at transcriptomic level the intensity and the extent of thermal stress could not affect in equal manner
the transcription of the gene that preside over the 3rsquo4rsquo- and 3rsquo4rsquo5rsquo-OH flavonoid biosynthetic
pathway in Sangiovese grape berry
In this research DFR and LDOX genes exhibited different patterns of expression in 2010 and in
2012 reaching maximum values in LT compared to HT 5 days after veraison in 2010 and 28 days
later in 2012 thus showed an expression pattern independent from the trend of anthocyanins
flavonols and tannins accumulation and from the timing of the temperature increase application
Our results are in agreement with previous findings reported that the expression of neither DFR nor
LDOX was as strongly correlated as UFGT and VvMYBA1 with anthocyanin content (Castellarin et
al 2007) and it is comprehensible if we consider that they can produce substrates for other branches
of flavonoid biosynthesis
Instead of that a strong correlation was found as expected in the expression of UFGT and of its
main transcription factor VvMYBA1 with the higher anthocyanins accumulation in LT vines
comparing to HT
Flavonol synthesis involves several genes encoding flavonol synthases (FLS) which are biosynthetic
enzymes converting dihydroflavonols to flavonol (Downey et al 2003) In both years the
expressions of FLS gene were similar between LT and HT berries in the early stages suggesting a
small effect of high temperatures on the transcription of this gene during veraison However FLS
started to be significantly higher in LT berries from mid of ripening and in 2012 a similar trend was
registered excepted at harvest when a significantly higher expression of FLS was registered in HT
(Fig 16)
Among the enzyme involved in tannins synthesis leucoanthocyanidin reductase (LAR) produces
catechin while anthocyanin reductase (BAN) converts cyanidin and delphinidin into epicatechin
and epigallocatechin respectively (Xie et al 2003 and Adams 2006 Fig 17) Bogs et al (2005)
found that in grape LAR is encoded by two closely related genes (LAR) whereas BAN enzyme is
46
encoded by a single gene (Fig17) As LAR1 appeared to be seed specific (Bogs et al 2005) only
LAR2 and BAN were analyzed in this study in 2010 In general timing and expression of BAN and
LAR2 genes is consistent with the accumulation of proanthocyanidins in the berry (Adams 2006)
This was further confirmed in this research where tannins analyses conducted on berry skin in 2010
showed no differences in terms of concentration and composition and as expected no differences
were found in the transcription of LAR2 and BAN during ripening
To better understand how the differences in gene expression could have or not influenced the
anthocyanins and flavonols composition also the timing and the coordination of flavonoid
biosynthetic genes has to be considered separately for the two years
In 2010 we detected a lack of variation in anthocyanins flavonols and tannins composition
following LT and HT treatment Following the treatment a coordinated transcription of F3rsquoHb
F3rsquo5rsquoHi F3rsquo5rsquoHk DFR LDOX UFGT and MybA1 was detected in LT berries which all reached a
maximum of expression 7 days after veraison (DAV) In HT the situation was quite different as for
F3rsquoHb and LDOX we found the highest expression 20 DAV when the transcription of DFR and
UFGT was already strongly reduced This shift and lack of synchronization could have hampered in
2010 the increase in the accumulation of 3rsquo4rsquo-OH flavonoids derivatives in comparison to LT
nevertheless the stability of F3rsquoHb transcripts detected in HT berries
In 2012 we found a statistically significant increase in malvidin and quercetin percentages in LT
berries in comparison to HT The concomitant stronger upregulation of F3rsquo5rsquoHi and F3rsquo5rsquoHk
starting from veacuteraison in LT compared to HT berries has to contribute to the increase in malvidin
concentration in LT berries in the second year of the trial Moreover in the same stage of berry
ripening also an increased expression of F3rsquoHb was recorded in LT berries and therefore the
biosynthesis of 3rsquo4rsquo-OH flavonoids should have been enhanced too Differently from what was
previously discussed for 2010 DFR and LDOX maximum expression was delayed in comparison to
the recorded peak of transcription for UGFT and VvMybA1 in both treatments It has to be
considered that FLS directly competes for its substrates with the enzyme DFR because they share
dihydroflavonols as the common substrates On this base probably there was a competition between
the biosynthesis of flavonols and anthocyanins in the both treatments but that contemporary
increase in the expression of F3rsquoHb DFR and FLS led to the rise of quercetin accumulation in LT
berries as compared to HT
47
Fig 15 Mean normalized expression of the genes involved in flavonoid biosynthetic pathway in berries grown under
high(HT) and low(LT) temperature conditions during ripening in 2010 and 2012
48
Fig 16 Mean Normalized expression of the FLS genes involved in flavonol biosynthesis in berries grown under
high(HT) and low(LT) temperature conditions during ripening in 2010 and 2012
Fig17 The mean normalized expressiom of the LAR and BAN genes in berries grown under high (HT) and low (LT)
temperature conditions during ripening in 2010
36 Activity of biosynthetic enzymes PAL and UFGT
In general the activity of PAL enzyme in both LT and HT berries increased gradually during
ripening but was considerably lower in HT plants in all sampling data from the end of full veraison
to harvest (Fig 18) This result is in agreement with the higher expression of PAL genes assessed in
LT berries
Using delphinidin and cyanidin as substrates in both years the activity of UFGT enzyme showed an
increasing trend from the end of full veraison to harvest in both LT and HT berries (Fig 19)
nonetheless a strong reduction was observed in HT plants compared to the LT ones during ripening
Also irrespective from thermal conditions UFGT activity at veraison was higher for cyanidin
compared to delphinidin as substrate (Fig 19) and this could be related to earlier expression of the
F3rsquoH genes (starting after full bloom) compared to the expression of the F3rsquo5rsquoH genes which begin
after veraison Basically these results confirmed the negative effects of high temperature on
anthocyanin biosynthesis at least for PAL and UFGT enzyme activities which showed a strong
correlation with anthocyanin concentration and confirmed to be the key enzymes of anthocyanin
biosynthesis pathway (Hrazdina et al 1984 Mori et al 2005 Boss et al 1996)
49
Fig 18 The trends of PAL activity (in one minute) in the skin of Sangiovese berries grown under high (HT) and low(LT)
temperature conditions during ripening in the years 2010 and 2012
Fig19 The trends of UFGT activity (Using cyanidin and delphinidin as substrate) in the skin of Sangiovese berries
grown under high (HT) and low(LT) temperature conditions during ripening in the years 2010 and 2012
50
37 Hypothesis for anthocyanin degradation
371 POD candidate genes
From the research conducted by Fasoli et al (2012) it can be realized that there are many different
isoforms of Peroxidases gene in different organs of grape As to recent researchers five POD
isoforms (labeled POD1 POD2 POD3 POD4 and POD5) are showed to be more expressed in
berry skin from veraison to harvest in Sangiovese (Pastore 2010) In addition to these 5 isoforms
another one (POD6) which was reported by Mori et al (2007) was assessed in this thesis
In 2010 Real Time experiment revealed that among these 6 genes that were studied in the berry skin
of Sangiovese only the expression of the genes POD1 and POD3 seem to be linked to the
temperature (Fig 20) The expression of POD1 and POD3 in HT detected to occur in different
patterns during the ripening but POD 1 was expressed with a similar trend in both years
Fig 20 Mean Normalized expression of the selected POD genes involved in anthocyanin biosynthetic pathway in the in
berries grown under high (HT) and low(LT) temperature conditions during ripening in 2010 and 2012
51
372 Activity of enzymes involved in anthocyanin degradation PODs and PPOs
In the both years the PODs activity during ripening showed a significant increase in HT berries
compared to LT (Fig 21) supporting the hypothesis of anthocyanin degradation in response to high
temperature (Vaknin et al 2005 amp Mori et al 2007)
It has been reported that peroxidase is involved in the active anthocyanin degradation of Brunfelsia
calycina flowers (Vaknin et al 2005) and in presence of H2O2 in the vacuoles of grape cells
(Calderon et al 1992) Our findings are coherent with other papers since heat stress can contribute
to H2O2 accumulation in plant tissue (Date et al 1998) and so PODs-anthocyanins reaction may act
as a scavenging mechanism for H2O2 and plant cell detoxification in high temperature conditions
(Yamasaki et al 1997 Pourcel at al 2007)
It is interesting to note that in this experiment we could not find any PPOs activity likely due to the
plastidial localization of this enzyme (Dry amp Robinson 1994) and so we demonstred the lack of
direct involvement in active anthocyanin degradation under high temperature conditions in Vitis
vinifera
Fig 21 The trends of PODs activity in the skin of Sangiovese berries grown under high (HT) and low (LT) temperature
conditions during ripening in the years 2010 and 2012
52
4 CONCLUSION
In the present study we examined the contents of anthocyanins flavonols and tannins the
expression of some biosynthetic genes involved in their synthesis and the activities of some related
enzymes in grape berries of Sangiovese cv grown under different thermal conditions in two
different years
Anthocyanins and flavonols accumulation in Sangiovese cv revealed to be very sensitive to high
temperature (showing a reduction over 50 in total anthocyanin concentration at harvest) Several
mechanisms such as a general inhibition of the expression of flavonoids biosynthetic genes and of
the activities of some flavonoids biosynthetic enzymes (PAL and UFGT) associated with a
stimulation of some putative anthocyanin degradation enzymes (PODs) showed to be involved in the
inhibitory effect of high temperatures on anthocyanin accumulation A similar mechanism may be
supposed for flavonols degradation
This study showed that the temperature regimes after veacuteraison have different effects on each
flavonoid group in grape berry because in conterary to anthocyanins and flavonols that were
reduced in the skin of grapes ripened under high temperature environments after veraison seed and
skin tannins were not affected by the same conditions
Furthermore the warmer condition verified in 2012 compared to 2010 and the different flavonoid
composition and expression profile of some of the analyzed genes in the two years may suggest a
different sensitivity to high temperature of some genes involved in anthocyanins biosynthesis
53
Chapter one Second Part
Recognition of putative POD genes involved in anthocyanins degradation
under high temperature condition
54
1 INTRODUCTION
Petunia has played a central role in transformation research since the earliest reports of plant
transformation It was a key model system when the first definitive accounts of Agrobacterium-
mediated transformation and direct DNA transfer established the transfer and expression of foreign
genes in plants Petunia subsequently played an important role in elucidating many of the
characteristics of plant transformation One of the key reasons for the importance of Petunia in plant
transformation research has been the selection for andor identification of genotypes well suited to
growth and regeneration in culture Ease of transformation coupled with other favorable biological
characteristics ensures that Petunia will remain a valuable model system for studies of gene
function in plants (Conner et al 2009) Moreover Petunia hybrida is one of the classical subjects of
investigation of plants pigmentation in which the pathway of anthocyanin biosynthesis has been
analyzed genetically and biochemically (Meyer et al 1987 Quattrocchio et al 2006) Although the
information about Petunia sequenced genome is somehow limited it can be still used as model
species in this important field of study for the obvious ease of detecting mutants for this pathway It
can also be actively employed in complementation studies with genes from other species such as
grape (Venturini 2009)
Therefore in the second phase of this trial regarding to the results obtained from the assessment of
the expression of the genes involved in anthocyanin degradation at elevated temperature gene
transformation was conducted with different isoforms of peroxidases genes from Vitis vinifera (cv
Sangiovese) to Petunia hybrida with the aim of recognizing the most effective candidate genes for
anthocyanins degradation under high temperature
2 MATERIALS
21 Gene selection
In the first phase of this trial the expressions of 6 different isoforms of Peroxidases genes that were
showed to be more expressed in berry skin from veraison to harvest (Fasoli et al 2012 Mori et al
2007) were assessed via Real Time-PCR subsequently according to that results 3 different
isoformes were selected to transform Petunia hybrida
22 Escherichia coli strain and culture media
The DH10B strain was provided by Invitrogenreg and features the mutations recA1 endA1 presence
of the gene lacZM15 and high transformation efficiency Moreover it didnrsquot carry any antibiotic
resistance genes
55
221 Luria-Bertani (LB) medium
Component Concentration (gl)
Yeast extract 5
Tryptone 10
NaCl 10
Agar 15
Final pH 75
The medium was sterilized in an autoclave (121degC for 20 minutes 2 atm) After sterilization
antibiotic (kanamycin) was added to the solution for a final concentration of 50 mgl
222 SOC medium
Component Concentration (gl)
Yeast extract 5
Tryptone 20
After sterilization in an autoclave (121degC for 20 minutes 2 atm) glucose and salts sterilized by
filtration (filters with ores of 02 m diameter) were added to the solution at the following
concentrations
Component Concentration
NaCl 10 mM
KCl 25 mM
Glucose 20 mM
MgCl2 10 mM
MgSO4 10 mM
Final pH 68-70
56
23 Agrobacterium tumefaciens strain and culture media
For Petunia hybrida transformation the super virulent EHA105 Agrobacterium tumefaciens strain
was chosen (Hellens et al 2000) The bacteria possess a disarmed helper Ti plasmid (pTIBo542ΔT-
DNA) encoding the necessary sequences for the transfer of the T-DNA region which is carried by a
second shuttle plasmid the pK7WG20 The two plasmids are defined as binary vectors The cells
containing both plasmids can be selected for with the use of the following antibiotics
Antibiotic Concentration Resistance
Rifampicin 50 mgl Genomic
Streptomycin 300 mgl pK7WG20
Spectinomycin 100 mgl pK7WG20
231 YEB Medium
Component Concentration
Yeast extract 1 gl
Tryptone 5 gl
Beef extract 5 gl
Sucrose 5 gl
MgSO4 5 Mm
Agar 15 gl
Final pH 75
The medium was sterilized in an autoclave (121degC for 20 minutes 2 atm) After sterilization
antibiotics (streptomycin 300 mgl spectinomycin 100 mgl and rifampicin 50 mgl) were added to
the solution for selective mediums
57
24 Vectors
241 pENTRtradeD-TOPOreg (2580 bp)
Feature Benefit
rrnB T1 and T2 transcription terminators Protects the cloned gene from expression by vector- encoded
promoters thereby reducing possible toxicity in E coli
attL1 and attL2 sites
Allows sequencing in the sense orientation Bacteriophage λ-derived
DNA recombination sequences that allow recombination cloning of the
gene of interest from a Gatewayreg expression clone or attB PCR
product (Landy 1989)
TOPOreg Cloning site directional Allows a fast and directional cloning
M13 forward and reverse primer sequences Allow sequencing of the insert
Kanamycin resistance gene Allows selection of the plasmid in E coli
pUC origin Allows high-copy replication and maintenance in E coli
Fig 22 a scheme of the pENTRtradeD-TOPOreg vector
242 pK7WG20
A scheme for vector pk7WG20 is presented in Fig 23 It is a binary vector used as destination
vector in the Gatewayreg technology The T-DNA comprises the marker gene nptII which confers
58
resistance to kanamycin The cloning of an exogenous genes in this position implies an LR
recombination between the 35S CaMV constitutive promoter and the terminator 35S
Fig 23 Schematic representation of the pK7WG20 vector
25 Primers
The Primers pairs for POD1 to POD5 were newly designed on the original DNA sequences to
amplify 150ndash250 bp gene fragments and the Primers pairs for the POD6 was referred to Mori et al
(2007) (Table 7)
Subsequently according to the results of those expressions 3 different isoformes (POD 1 POD 3
and POD 5) were selected to transform Petunia hybrida
59
(Table 7) (POD 1-6) The primers of the selected isoforms of the Peroxidases genes for RT-PCR and (POD 1-3
cloning) The primers of the selected isoforms of the Peroxidases genes for cloning
primer Forward primer Reverse
POD 1 5-TCTGAGTAAGAGCCCACACACTCT-3 5-GAGACCTGAGCAGATAAATACAAAAATAAA-3
POD 2 5-AAAGTTGTTTGGCTGTGG-3 5-AATCCCTCCAAACAATCA-3
POD 3 5-TGCTCTAAATGCCTGAAAAATG-3 5-ATCATATAGAAAAGTGACAGCAACCT-3
POD 4 5-CAACTTCACACCAACGGGAAA-3 5-GCAGCTGAGCAAGAAATGCTT-3
POD 5 5-TCGGTGAGGAACTCCGATA-3 5-AGCTTCCTTGTCCTCTTCCA-3
POD 6 5-AACTTGAGACACAACAGCATAAATAAATC-3 5-AGGACCAAATCACAGGATGATAAAG-3
POD 1 cloning 5-cacc atg gca ttg atc ctc ttt tc-3 5-cta gtt taa ggc atc aca cc-3
POD 3 cloning 5-cacc atg tct ctt ctc gtt ctt ctc-3 5-tta aga ttc cag gag tgt gtc-3
POD 5 cloning 5-cacc atg aga aaa ctt atg gag gc-3 5-tta aag ttc agc aga agc ttc-3
26 Plant materials
Petunia hyrida line W84xV30 (P axillaris X P inflata) has become an attractive system for
genetic molecular and complementation studies as it possesses many desirable characteristics
colored flowers whose dimensions (5-6 cms) allow for relative ease of dissection and separation of
floral organs rapid growth cycle (2-3 months from seeds to full bloom) ease and rapidity of genetic
transformation via infection with disarmed Agrobacterium tumefaciens
This species has a limited number of chromosomes (n=7) and a small genome (12 times 106 kb) In
particular the line W84 is not capable of expressing a Glutathione S-transferase PhAN9 (Alfenito et
al 1998) and hence to accumulate anthocyanins in the vacuole leading to a fading color phenotype
However the W84 line had proved difficult to transform in previous experiments with the GST4
gene To overcome this problem a new Petunia hybrida line was generated by crossing W84 with
the V30 cultivar and recovering the mutated offspring after self-crossing This W84xV30 line was
used in all subsequent experiments
The peroxidases genes were isolated from Vitis vinifera (cv Sangiovese) (the plant materials used in
the first part of this chapter)
60
Fig 24 Petunia hyrida ndash line W84xV30
3 METHODS
After the PCR amplification of our selected genes with proof-editing PFU enzyme DNA
purification was done directly from the PCR product and used for the TOPOregCloning reaction
following the protocol provided by Invitrogen kit
31 Transformation of Escherichia coli by heat shock
After the TOPOregCloning reaction the DNA was added to the E coli DH10B competent cells and
the mixture left in ice for other 30 minutes Cells were incubated at 42degC without agitation for 30
seconds and then rapidly transferred into ice 250 microL of SOC medium provided by Invitrogen kit
kept at room temperature was added to the culture and the re-suspended cells were incubated at
37degC with agitation (200 rpm) for 1 hour 100- 200 l of the solution was placed on to a solid LB
medium and left at 37degC overnight
32 Preparation of competent cells of A tumefaciens
To obtain Agrobacterium tumefaciens strain EHA105 cells competent for the transformation by
electroporation a single colony was inoculated into 3 mL YEB medium containing Rifampicin (50
mgl) and incubated at 28degC overnight with vigorous shaking When the culture reaches the
exponential growth phase (usually after 12 hours characterized by an OD600 equal to 09-10) 15
mL of solution was sampled and centrifuged at 14000 rpm for 1 minute at room temperature The
pellet thus obtained was washed to eliminate antibiotic and re-suspended three times in 500 l cold
and sterile glycerol 10 (vv) at each step the solution was centrifuged at 14000 rpm for 1 minute
at room temperature Finally the pellet was re-suspended in 40 l of cold and sterile glycerol 10
(vv) The cells were ready to be electroporated
61
33 Transformation of A Tumefaciens by electroporation
A Bio-Rad device for electroporation was used for this experiment calibrated at 25 F 200 and
25 kV 1 or 2 microL of DNA plasmid (20 ng) was re-suspended in 40 l of competent cells The
operation was performed in ice The mix was transferred into a pre-cooled electroporation cuvette
the cuvette was then inserted into the Bio-Rad device and subjected to a pulse of 25 kVcm at 200
Ohm immediately after the pulse 1 mL LB without antibiotics was added in sterile conditions The
suspension was recovered and grown in a propylene tube with agitation for one hour at 28degC so that
the cells can express the resistance gene The cells were placed in 100 ndash 200 l aliquots on to YEB
solid medium containing Spectinomycin (final concentration 100 mgl) Rifampicin (final
concentration 50 mgl) and Streptomycin (final concentration 300 mgl) The Petri dishes were
incubated at 28degC for two days The transformation efficiency of this method is 8x10⁵ cfug DNA
34 Colony PCR
To detect bacterial recombinant clones which carry a fragment of interest it is possible to perform
the colony PCR consists of a single bacterial colony for a final volume of 20 μl A sterile tip is used
to sample the colony from the solid culture medium and dissolved in the reaction mix
35 Plasmid DNA extraction
To purify the plasmid DNA of colony which resulted positive by PCR bacteria were put in 5 mL of
liquid LB with the correct antibiotic to grow overnight at 37degC with agitation The extraction of
DNA plasmid was carried out on the base of ldquoQIAprepreg Spin Miniprep Kitrdquo (Qiagen) following the
manufacturersquos instruction
36 Purification of PCR products
To purify the PCR products the protocol of the kit provided by Promega Wizardreg SV Gel and PCR
clean-up system was performed
37 GATEWAYreg cloning system
The Gatewayreg Technology (Invitrogen) is based on the bacteriophage lambda site-specific
recombination system which facilitates the integration of lambda into the E coli chromosome and
the switch between the lytic and lysogenic pathways This recombination method facilitates transfer
62
of heterologous DNA sequences (flanked by modified att sites) between vectors Two recombination
reactions constitute the basis of the Gatewayreg Technology
Site Length Function
attL 100bp Entry clone Entry vector
attR 125bp Destination vector
38 LR Recombination reaction
LR Recombination reaction was performed following the protocol provided by Invitrogen
This reaction facilitates recombination of an attL substrate (entry clone) with an attR substrate
(destination vector) to create an attR-containing expression clone (see diagram below)
Fig 25 a scheme of the Gatewayreg cloning system
Componente Volume
Entry clone (100 ηg) 1 microL
Destination Vector (150 ηg) 1 microL
5X LR Clonase buffer 2microL
Sterile water 6 microL
63
The Entry-clone vectors had been generated with independent ligation reactions in the pENTRTM
D-
TOPOreg vector containing the attL1 and attL2 sites It was therefore possible to perform directly the
recombination reaction with the destination vector pK7WG20
The solution is incubated for 1 hour at 25degC then 1 μl of the Proteinase K enzyme (Invitrogen) is
added to the mix which is placed for an additional 10 minutes at 37degC At this point it is possible to
perform the transformation of the competent E coli DH10B cells
39 TOPO cloning reaction
TOPOreg cloning reaction was performed following the Invitrogen protocol for electro-competent E
coli cells
Reagents Chemically Competent E coli Electrocompetent E coli
Fresh PCR product 5 to 4 μl 05 to 4 μl
Dilute Salt Solution (14) -- 1 μl
Salt Solution 1 μl --
Sterile Water add to a final volume of 5 μl add to a final volume of 5 μl
TOPOreg vector 1 μl 1 μl
Final volume 6 μl 6 μl
The mix reaction was incubated in ice for 20 minutes then the cells were incubated at 42degC without
agitation for 30 seconds and then rapidly transferred into ice followed by the procedure of
Transforming One Shotreg TOP10 Competent Cells provided by Invitrogen kit
310 RNA extraction and Real time PCR
Real-time PCR was performed to evaluate the expression of six different isoforms of peroxidases
genes for five selected stages of grape berry ripening from beginning of veraison to the end of
harvest For each sampling 3 biological replicates were analyzed Total RNA was isolated from 200
mg of the powdered berry skin tissue using SpectrumTM
Plant Total RNA kit (Sigma-Aldrich St
Louis MO USA) following the manufacturers protocol One microL of each RNA sample was
measured spectrophotometrically to determine RNA quantity and 260280 and 260230 ratio using a
64
NanoDrop1000 Spectrophotometer (Thermo Fisher Scientific Wilmington DE USA) Total RNA
was treated with 1 U microg-1 RQ1 DNase (Promega Milan Italy) First-strand cDNA was synthesized
using 1 microg of RNA 1microL (dT)15 primer (500 microgmL) and 1 U of GoScripttrade reverse transcriptase
(Promega) Quantitative RT-PCR was carried out on a Step One Plustrade (Applied Biosystems Foster
City California USA) Each reaction (10 microL) contained 188 nM of each primer 2microL of diluted
cDNA (125) 5microL U of Power SYBRreg Green PCR Master Mix (Applied Biosystems Foster City
California USA) Thermal cycling conditions were 95 degC for 10 min followed by 95 degC for 15 s 55
degC for 1 min for 40 cycles followed by a melting cycle which contains 95 degC for 15 sec 60 degC for 1
min and 95 degC for 15 sec Each cDNA sample was analyzed in triplicate Gene transcripts were
quantified as reported by (Pastore 2010) The Primers pairs for POD1 to POD5 were newly
designed on the original DNA sequences to amplify 150ndash250 bp gene fragments and the Primers
pairs for the POD6 was referred to Mori et al (2007) (Table 7)
311 Stable transformation of Petunia hybrida
The protocol is applied under a laminar flow cabinet to ensure sterility Young apical leaves are
harvested and kept in water to avoid dehydration They are subsequently sterilized with a solution of
05 sodium hydrochloride in which they are dipped for 10 minutes followed by 5 washings of 10
minutes each in bi-distilled water The tips borders and petioles are removed with a sterilized
scalpel while the rest of the leaf is cut in three sections The leaf pieces are immersed in a solution
110 of overnight grown Agrobacterium tumefaciens transformed with a selected gene for 20
minutes so that the bacteria could attach to the explants after which they are transferred to a Petri
dish containing solidified Medium I (supplemented with Folic acid (1 mgmL) NAA (01 mgmL)
6-BAP (2 mgmL) without antibiotics) Each Petri dish can hold up to 10 discs The Petri dishes are
sealed and stored in a growth chamber at 25degC under day-night regime (with a long day light period
of 16 hours of light) After 2-3 days the explants are transferred into a new Petri dish filled with
medium II which contains two antibiotics 500 mgl carbenicillin to stop Agrobacterium growth and
300 mgl kanamycin to select the transformed explants The explants were transferred to fresh
selective plates each 2-3 weeks and the explants were constantly checked against contamination
with molds or other pathogens After about 8 weeks the shoots regenerated from the calluses were
removed and transferred onto the rooting medium (medium III supplemented with 500 mgl
carbenicillin and 50 mgl kanamycin) After the roots were sufficiently developed the medium was
washed away from the roots were put in jiffy pots and were grown in greenhouse Petunia hybrida
plants grow and flower in about 2 to 3 months
65
3111 Medium I
Component Concentration
Sucrose 20 gl
Glucose 10 gl
MS-macro amp micro elements with Gamborg B5 vitamins (Duchefa M0231) 44 gl
Plant Agar 8 gl
The pH is adjusted to 57-59 with HCl and KOH The medium is sterilized in an autoclave for 20
minutes and after it has reached 60deg C the following hormones are added
Component Concentration
Folic acid 1 mgl
6-BAP 2 mgl
NAA 01 mgl
3112 Medium II
Medium II is obtained from Medium I with the addition of the antibiotics needed for the eradication
of Agrobacterium tumefaciens and the selection of transformed calluses They are as thermolabile as
the phytohormones and must therefore be injected in the medium only after it has reached a
temperature lower than 60deg C
Component Concentration
Carbenicillin 500 mgl
Kanamycin 300 mgl
66
3113 Medium III
The composition of Medium III is identical to that of Medium I but without the addition of
phytohormones Also the following antibiotics are added to the medium
Component Concentration
Carbenicillin 500 mgl
Kanamycin 50 mgl
312 Agro-infiltration of petunia petals
Agro-infiltration represents recent advancements in Petunia transformation This is a technique for
transient gene expression and the development of intragenic vectors to affect gene transfer without
the integration of ldquoforeignrdquo DNA
One mL of the Agrobacterium culture grown overnight for inoculation of 25 mL of LB liquid
medium was added to 300 μgmL Streptomycin 100 μgmL Spectinomycin 20 μM Acetosyringon
and 10 mM MES and was incubated to grow overnight at 28 o
C at 180 rpm After centrifugation for
20 minutes at 12000 rpm the pellet was re-suspended with 15 mL of the buffer below After adding
100 μl of the inoculums to 900 μl of the re-suspending buffer the OD (Optical Density) was
measured spectrophotometrically and the following formula was used for dilution of the inoculums
up to the final volume of 50 mL
3121 Resuspending buffer
Component Concentration
MgCl2 10mM
MES 10mM
Acetosyringone 100 μM
The volume of the inoculums = [05 (The optimal OD) times 50 (The final volume)] divide [(The read OD
via spectrophotometer) times 10]
67
Afterward 100 μM of Acetosyringone was added to the inoculums and the mixture was incubated in
room temperature for 2-3 hours
The bacterial suspension was infiltrated into the upper layer of petals using a 1mL syringe without a
needle Infiltrated flowers were kept at 25 oC for 36 to 48 hours after infiltration
313 DNA extraction from Petunia
The DNA was extracted from a Petunia hybrida leaf disc ground thoroughly in 400 l of extraction
buffer Then the extract was centrifuged and 300 microL of the supernatant was mixed with 300 microL of
isopropyl alcohol After the incubation at room temperature for 15 minutes and centrifugation the
pellet was dried at room temperature under a fuming hood and subsequently re-suspended in 100 microL
of sterile bi-distillated water and incubate overnight in the refrigerator To discard any remaining
impurities the tube was centrifuged again and the supernatant transferred to a new sterile tube
3131 Extraction buffer
Component Concentration
Tris HCl pH 80 200 mM
NaCl 250 mM
SDS 1
EDTA 25 mM
-mercaptoethanol 10 mM
314 PCR of transformed Petunia genomic DNA
PCR amplification was performed on Petunia genomic DNA in a final volume of 20 μl As the
primer forward Promoter 35 S and as the primer reverse the specific primer for ldquoPOD 1cloningrdquo
was used As the negative control the genomic DNA of the Wild type line was used as the template
68
3141 Reaction Mix
Component Stock Volume
Template DNA 1 l
Buffer (containing MgCl2) 10x5x 4 l
Nucleotides 10 mM 04 l
Primers 20 M 04 l
Taq 5000 umL 01 l
3142 Standard thermal cycle
Initial denaturation 94 degC 5rsquo
Denaturation 94 degC 40rdquo
Primers annealing 55degC 40rdquo X 35 cycles
Extension 72 degC 90rsquorsquo
Final extension 72 degC 7rsquo
315 RNA extraction from Petunia hybrida petal
Petunia petals from the young expanded flowers were immediately frozen in liquid nitrogen and
then were kept in the freezer (-80 o
C) until analyses were carried out Total RNA was isolated from
200 mg of the powdered petal using spectrum TM
Plant Total RNA kit (Sigma-Aldrich St Louis
MO USA) following the manufacturerrsquos protocol One microL of each RNA sample was measured
spectrophotometrically to determine RNA quantity and 260280 and 260230 ratio using a
NanoDrop1000 Spectrophotometer (Thermo Fisher Scientific Wilmington DE USA)
316 cDNA synthesis RT PCR reaction
After controlling the RNA via the electrophoresis gel total RNA was treated with 1 U microg-1 RQ1
DNase (Promega Milan Italy) First-strand cDNA was synthesized using 1 microg of RNA 1microL (dT)15
primer (500 microgmL) and 1 U of GoScripttrade reverse transcriptase (Promega) PCR amplification was
69
performed on the derived cDNA for a final volume of 20 μl As the primers once the Primers pair
of actin was used and subsequently for the RT- PCR amplification the specific primers of ldquoPOD
1cloningrdquo (Table 7) were used
3161 Reaction Mix
Component Stock Volume
Template DNA 1 l
Buffer (containing MgCl2) 10x5x 4 l
Nucleotides 10 mM 04 l
Primers 20 M 04 l
Taq 5000 umL 01 l
3162 Standard thermal cycle
Initial denaturation 95 degC 5rsquo
Denaturation 95 degC 30rdquo
Primers annealing 55degC 30rdquo X 35 cycles
Extension 72 degC 20rsquorsquo
Final extension 72 degC 7rsquo
317 Total anthocyanin measurement
Petunia petals from the young expanded flowers were selected in 5 biological replicates for the
transformed plants and wild type line They were immediately frozen in liquid nitrogen ground and
the fine powder was weighted before the extraction of anthocyanins The powder was homogenized
with the solvent mixture of methanol 99 with HCl 1 at the volumes of eightfold of the powder
Then the mixture was sondicated for 20 minutes
This is the act of applying ultrasound energy to agitate particles in a sample It is applied using an
ultrasonic bath All the procedures were conducted at 4 oC After the centrifugation at 12000 rpm
70
for 10 minutes at 4 oC an aliquot of the supernatant was diluted 140 and the total anthocyanin was
quantified spectrophotometrically at 540 nm
318 Heat shock performance
Young petunia flowers in 5 biological replicates for the transgenic plants and wild type line were
selected for the heat shock To carry out this experiment the flowers were cut with a long pedicle
and some small leaves and were placed in a falcon of water They were kept for one hour in the
incubator at 45 oC and transferred subsequently to the room temperature After 30 hours the petals
were frozen in liquid nitrogen ground and the fine powder was weighted to evaluate the activity of
Guaiacol Peroxidases enzyme and the total anthocyanin
319 Guaiacol Peroxidases activity assay
Guaiacol peroxidases was assayed as described by Ushimaru et al (1997) using pyrogallol as the
electron donor for the reaction The plant material was extracted in cold buffer (200 mM sodium
phosphate 5 mM sodium EDTA 1 PVPP pH 70) and incubated on ice for 30 min After
centrifugation at (10000 times g 30 min 4 degC) the desalted supernatant was used for the assay The
reaction mixture (15 mL) included 1140 μl of the 100 mM sodium phosphate buffer pH 70 60 microL
of the 25 mM H2O2 60 mM pyrogallol and 240 μl extract H2O2 and pyrogallol were prepared
fresh just before use Absorbance (λ=430 nm) was taken after 25 min incubation at room
temperature and referred to a blank with no extract added One unit of Guaiacol peroxidases is
defined as the amount of enzyme that catalyzes the oxidation of 1 μmol of pyrogallol per minute
under the conditions described by Chen and Asada (1989) and PODs activity was expressed as kat
g-1
petal fresh weight An absorbance coefficient of 247 mM
-1 cm
-1 was assumed for calculations
4 RESULTS
The aim of this trial is recognizing the most effective candidate genes responsible for anthocyanins
degradation under high temperature conditions during the ripening time Among the candidates for
anthocyanin degradation peroxidases are involved in active anthocyanin degradation in living
tissues (Vaknin et al 2005 Welinder et al 2002) In addition the results obtained from the
enzymatic activity of peroxidases at elevated temperature and the expression of this gene during
ripening supports the hypothesis of its role in anthocyanin degradation On these bases the
technique of gene transformation was conducted with different isoforms of peroxidases genes from
Vitis vinifera (cv Sangiovese) to Petunia hybrida
71
41 Gene selection
From the research conducted by Fasoli et al (2012) it can be realized that there are different
isoforms of Peroxidases gene in different organs of grape that among them only 5 isoforms are
showed to be more expressed in berry skin from veraison to harvest In addition to these isoforms
there was another one which was reported by Mori et al (2007) to be expressed in grape berry
skin
Fig 26 The expression value of the different isoforms of Peroxidases in berry skin from veraison to harvest (V
Veacuteraison MR Mid-ripening R Ripening) Fasoli et al (2012)
As to the expression of these different isoforms by Real time pcr 3 of them were selected for the
transformation to Petunia hybrida
Fig 27 Mean Normalized expression
of the selected POD genes isolated from
berry skin for the transformation to
Petunia hybrida
72
Among all the three isoforms only the POD 1 could be successfully isolated from grape berry skin
and transformed to Petunia
42 The sequence of the POD1 gene
Vv14s0066g01850 (POD1)
ATG GCA TTG ATC CTC TTT TC
TCTACTATTCTTTCTGGGATTAGTGAACCCTTCGGAGTCCAGGTTGAGTGTCAACTACTACCAAAAATCATGCCCAAGA
TTCAGTCAGATCATGCAGGATACCATCACCAACAAGCAAATCACCAGCCCCACCACGGCTGCGGCCACTCTCCGCCTC
TTCTTCCACGACTGCTTCATTGAGGGCTGCGATGCTTCCGTTCTTGTCTCCTCGACCCCCTTCAACGAGGCCGAGCGCGA
TGCCGACATGAACCTCTCCCTCCCCGGCGACGGCTTCGACGTCGTTGTCCGCGCCAAGACCGCCCTCGAGCTCGCTTGC
CCCGGTGTGGTCTCCTGTGCCGACATTCTCGCCGTCGCTACCCGCGATCTCGTCACCATGGTGGGAGGTCCCTTCTACA
AGGTCCCGCTGGGGAGAAGAGATGGGCTGGTCTCCCGGGCGAACAGGGTTGAAGGTAACCTTCCAAGACCCACGATG
TCCATTTCTCAGATAATTTCGATTTTCGCTGTGAGAGGGTTCTCGGTTCAAGAAATGGTGGCGCTGAGTGGTGCCCACA
CGATTGGGTTCTCGCATTGTAAAGAATTCAGCAGCGGGATCTACAATTACAGCCGCAGTTCCCAGTCCAATCCGAGCTA
CAACCCTAGATTCGCAGAGGGGTTGAGAAAAGCTTGCAGCGATTACCAGAAGAATCCTACATTGTCGGTGTTCAACGA
TATAATGACTCCCAACAAGTTCGATAACATGTATTTCCAGAATCTGCCCAAGGGTTTGGGGCTATTGGCGACGGACCAT
ACCATGGCTACCGATCCGAGGACGAGGCAGTTTACGGATTTGTATGCCAAGAATCAAAGCGCCTTCTTTGAGGCATTT
GGTCGAGCTATGGAGAAGCTTGGCCTTTATGGGATCAAGACCGGGCGAAGAGGAGAGATTCGACGCA GG TGT GAT
GCC TTA AAC TAG
Vv14s0066g01850 (POD1) genomic
AAGGCTTCTGAGTAAGAGCCCACACACTCTCCATTGCTGCCACTACCACTGGCTTTTTTTTTTATTTTTGTATTTATCTGC
TCAGGTCTCTGAGCTTTGAGCTCTGAGAAACAATGGCATTGATCCTCTTTTCTCTACTATTCTTTCTGGGATTAGTGAAC
CCTTCGGAGTCCAGGTTGAGTGTCAACTACTACCAAAAATCATGCCCAAGATTCAGTCAGATCATGCAGGATACCATC
ACCAACAAGCAAATCACCAGCCCCACCACGGCTGCGGCCACTCTCCGCCTCTTCTTCCACGACTGCTTCATTGAGGGCT
GCGATGCTTCCGTTCTTGTCTCCTCGACCCCCTTCAACGAGGCCGAGCGCGATGCCGACATGAACCTCTCCCTCCCCGG
CGACGGCTTCGACGTCGTTGTCCGCGCCAAGACCGCCCTCGAGCTCGCTTGCCCCGGTGTGGTCTCCTGTGCCGACATT
CTCGCCGTCGCTACCCGCGATCTCGTCACCATGGTGGGAGGTCCCTTCTACAAGGTCCCGCTGGGGAGAAGAGATGGG
CTGGTCTCCCGGGCGAACAGGGTTGAAGGTAACCTTCCAAGACCCACGATGTCCATTTCTCAGATAATTTCGATTTTCG
CTGTGAGAGGGTTCTCGGTTCAAGAAATGGTGGCGCTGAGTGGTGCCCACACGATTGGGTTCTCGCATTGTAAAGAAT
TCAGCAGCGGGATCTACAATTACAGCCGCAGTTCCCAGTCCAATCCGAGCTACAACCCTAGATTCGCAGAGGGGTTGA
GAAAAGCTTGCAGCGATTACCAGAAGAATCCTACATTGTCGGTGTTCAACGATATAATGACTCCCAACAAGTTCGATA
ACATGTATTTCCAGAATCTGCCCAAGGGTTTGGGGCTATTGGCGACGGACCATACCATGGCTACCGATCCGAGGACGA
GGCAGTTTACGGATTTGTATGCCAAGAATCAAAGCGCCTTCTTTGAGGCATTTGGTCGAGCTATGGAGAAGCTTGGCCT
TTATGGGATCAAGACCGGGCGAAGAGGAGAGATTCGACGCAGGTGTGATGCCTTAAACTAGGTTTTTAAGGTTTTTTTT
TTTTTTTTTGCATTACAAACTCCCACCGTAGTGATGATCAATCAAGGTGAATTGATGGTGAGGGGGTGGTTTCATTTGA
ATTCTTTTTTTTTTTGTTGT
73
43 Gene transformation
After amplification of POD1 gene with PFU enzyme and specific POD1 primers (Table 7 Fig 28)
the E coli transformation was performed via pTOPO cloning system The day after a single colony
of DH10B cells that was grown on solid LB was transferred into 10 mL of liquid LB containing the
appropriate kanamycin antibiotic (for a final concentration of 50 mgl) and incubated overnight at
37deg and 250 rpm Afterward the pcr amplification of the colony was done to detect bacterial
recombinant colonies which carried the fragment of interest
Therefore 2 plates were designed to amplify each colony two times (Fig 29)
In the first plate the combination of the primer forward of M13 was used with the specific primer of
POD 1 reverse and simultaneously in the second plate the same colony was amplified with the
primer forward of POD1 with the M13 reverse The primers pair M13 gives the possibility to
amplify the fragment 50 bp longer than our inserted gene Consequently only the colonies which
were amplified in the correct position in the both plates had successfully carried the fragment of
interest (Fig 29)
Fig 28 Amplification of POD 1 gene by PFU
74
Fig 29 Colony PCR of POD 1 gene (The colonies marked with a star sign in the both gels are the ones with our
fragment of interest)
After the sequencing of the insert in the plasmid the LR recombination reaction was performed
The colony PCR was done using the ldquoPROMOTER 35 Srdquo as the primer forward and the primer
ldquoSONDA TERrdquo as the reverse The fragment 1575 bp was amplified The colony marked with a star
sign is the one with our fragment of interest (Fig 30) and the plasmid DNA was extracted and the
insert fragment of 1375 bp was amplified with the primer forward ldquoPROMOTER 35 Srdquo and the
specific primer reverse of ldquoPOD 1cloningrdquo (Table 7) (Fig 31)
75
Fig 31 The plasmid DNA (PK7WG2) control
After the transformation of A Tumefaciens the positive colonies were checked by pcr amplification
of the Agro-plasmid with the primer forward ldquoPROMOTER 35 Srdquo and the specific primer reverse of
ldquoPOD 1cloningrdquo (Fig 32) The plasmid DNA PK7WG2 was used as the positive control
Fig 30 The PK7WG2 Colony PCR of POD 1 gene
76
Fig 32 The pcr amplification of the Agro-plasmid (PC) Positive control (NC) Negative control (P1 - P5) Agro-
plasmids
Afterward the stable transformation of Petunia hybrida was done In addition at the same time the
Agro-infiltration of petunia petals was performed and the bacterial suspension was infiltrate into the
upper layer of petals Infiltrate flowers were then kept at 25 oC for two days but the flowers were
wilted without any change observed After 4 to 5 months two plants derived from the two
independent stable transformations grew in selective medium containing kanamycin and flowered
and were propagated asexually by cutting
To control the transformation efficiency the DNA was extracted from a Petunia hybrida leaf disc of
the two transgenic lines a wild type line and also as a positive control the plasmid DNA PK7WG2
was used The pcr amplification was done with the primer forward ldquoPROMOTER 35 Srdquo and the
specific primer reverse of ldquoPOD 1cloningrdquo (Fig 33)
77
As to the obtained results (Fig 33) both plants were transformed successfully To investigate the
expression of the transgene in the two lines RNA was extracted from the petal of the transgenic
plants and from the wild type line used as negative control and retro transcript to cDNA By pcr
amplification performed with the primers pairs of Actin the correct retro transcription of the RNA
was evaluated Then to analyze the expression of the transgene VvPOD1 in the petunia petal the
RT-PCR was performed with the specific primers pairs of ldquoPOD 1cloningrdquo
According to the (Fig 34) the fragment of 1kb was amplified and observed only in the second lane
confirming that the POD1 gene was expressed successfully in the Petunia hybrida line 2
Fig 33 The PCR amplification to control the transformation efficiency (TP1) Transgenic petunia 1st pot (TP2)
Transgenic petunia 2nd pot (WTL) Wild type line (PC) Positive control (NC) Negative control
78
0
5
10
15
20
25
30
35
40
45
50
Wild type line
control
POD plants
control
Wild type line
Heat shocked
POD plants
Heat shocked
To
tal
an
tho
cyan
in
A
BB
C
Fig 34 The RT-PCR of POD1 gene in the transformed plant (TP1) Transgenic petunia 1st pot (TP2) Transgenic
petunia 2nd pot (WTL) Wild type line
44 Heat shock and the plant response
Subsequently flowers from the transgenic line 2 (which expressed the POD1 gene) and from the
wild type were selected in 5 replicates and treated with the heat shock in order to highlight the
possible role of POD1 in anthocyanin degradation under stress condition
The same number of flower replicates of wild type and the transgenic line 2 were selected as the
control ie not subjected to the heat shock The petals of the treated flowers together with the
control ones were grounded by liquid nitrogen and the fine powder was weighted and divided in to
two in order to evaluate the activity of Guaiacol Peroxidases enzyme and the total anthocyanin
(Fig 35 36)
Fig 35 Total anthocyanin content of wild type line and POD plants
79
0
5
10
15
20
25
30
Wild type
line control
POD plants
control
Wild type
line Heat
shocked
POD plants
Heat shocked
(Kat
gr
-1 F
W)
C
B
C
A
By comparing the total anthocyanin content of the wild type and the transgenic lines before and after
heat treatment we found that the total anthocyanin content of the wild type line was significantly
similar in the both control and shocked treatment (Fig 35) After the heat shock the level of the
total anthocyanin in the transgenic petunia was reduced significantly However the total
anthocyanin content of the POD flowers in control was surprisingly highest among the others
Fig 36 The Peroxidase activity of wild type line and POD plants in the control and heat shock treatment
The enzymatic activity of peroxidase in both wild type and transgenic line 2 was evaluated before
and after the treatment
The wild type flowers showed the same level of enzymatic activity before and after the treatment
(Fig 36) The peroxidase activity was higher in the transgenic line in both control and the shocked
flowers However heat shock treatment contributed to significantly increase the peroxidase activity
in transformed flowers (Fig 36)
80
5 CONCLUSION
Most of the works studied the effects of temperature on anthocyanin accumulation has dealt with
the effects on the biosynthesis of anthocyanins (Mori et al 2007)
Yamane et al (2006) discussed the possibility of the contribution of another mechanism (eg
anthocyanin degradation) to the inhibitory effect of high temperature on anthocyanin accumulation
To date no report has demonstrated the enhancement of anthocyanin degradation due to high
temperature in plant tissue Hence the present study is the pioneer to show that the mechanism of
anthocyanin loss in grape skins due to high temperature involves not only the inhibition of
anthocyanin biosynthesis but also its enzymatic degradation
As to the results of this research and the literatures (Vaknin et al 2005 Mori et al 2007) among
the different candidates peroxidases (PODs) are reputed to be the main responsible for degrading
the anthocyanin pigment in vivid tissues
There are many isoforms of Peroxidases gene in different organs of grape that among them only 6
isoforms are reported to be more expressed in berry skin from veraison to harvest (Fasoli et al 2012
and Mori et al 2007)
Therefore in order to recognize the most important gene that encodes the peroxidase enzyme in
Sangiovese grape under stress condition selected isoforms of POD were isolated from Vitis vinifera
(cv Sangiovese) berries and transformed to Petunia hybrida Afterward the expression of the POD1
gene and the activity of the peroxidase enzyme were assessed in the transgenic petunia and were
compared to the wild type line under the stress condition
The obtained results could confirm that the level of total anthocyanin was decreased in the living
Petunia suffered from the heat stress this was under the circumstance that the level of the
peroxidase enzyme was significantly higher in those plants
On these bases it can be figured out that peroxidases can be considered as the responsible for
anthocyanin degradation in living tissues and the decrease of total anthocyanin content in the plants
faced to an abiotic stress such as the excessive high temperature What is more among the different
isoforms of the tested peroxidases genes the POD 1 isoform (with the sequence mentioned before)
can be identified as one of the propellant in this respect
81
Chapter two
Effects of late-season source limitations induced by trimming on grape
composition during ripening in Vitis vinifera cv Sangiovese
82
1 INTRODUCTION
Grape wine production showed a higher sensitivity to climate variability and the ongoing climatic
changes have already caused phenological alterations in some viticultural areas and are expected to
continue in the future (Jones et al 2005 Schultz 2000 Duchene and Schneider 2005) Besides
over the last fifty years an overall upgrading of vineyard management techniques which lead to a
general wine quality improvement has been verified As consequence in wine regions where heat
summations largely exceed technological requirements for the grown grape varieties a too high
level of sugar and subsequent wine alcohol excess low acidity alteration of aroma composition
and in black varieties unbalanced phenolic ripening with insufficient berry skin colour has been
shown at harvest
Accumulation of sugars is probably more responsive to temperature variations than accumulation of
anthocyanins because the optimal temperature for sugars biosynthesis and transport ranges from 8
to 33 degC while for anthocyanin pathway range from 17 to 26 degC Moreover high temperatures
(above 30-35 degC) have been the inhibitor of anthocyanin accumulation (Kliewer 1970- 1977 Mori
et al 2007 Movahed 2011) The relationship between tannins and high temperature is not clear but
some authors reported that seed tannin concentration was less susceptible to changes in temperature
conditions respect to anthocyanins (Cortell et al 2007a Ristic et al 2007) Moreover while soluble
solids and anthocyanins sysnthesis starts at veraison tannins were produced several weeks before
veraison and then their concentration in the berry starts to decrease following by a plateau at later
berry ripening stages (Kennedy et al 2000 2002) In other word it seems that there are differential
effects of temperature increase on the evolution of different berry traits in particular when they
occure after veraison On these bases the hypothesis is that the slowing down of sugars
accumulation rate may allow to achieve full ripeness of phenolic compounds mainly anthocyanins
and tannins As well known fruit sugar accumulation can be decreased by grape-growers for
example via bud load and yield increases but for the production of high quality wine it is not
allowed to exceed foreseen thresholds by the Appellation rules
A different approach to slow down sugar accumulation is represented by source limitation as the rate
of soluble solids increase in berries is well related to the ratio between leaf area to yield (Kliewer
and Dokoozlian 2005) In particular several researches showed that the removal around veraison of
the more young and efficient part of the canopy may be effective in reducing sugar accumulation
(Reynolds and Wardle 1989 Intrieri et al 1983 Intrieri 1994)
Although the relationship between sugar accumulation and leaf area to yield ratio is well
documented the evolution of some phenolic compounds in relation to leaf area efficiency and sugar
83
content in berries remain unclear Sugar has been shown to stimulate anthocyanin accumulation in
grape (Pirie and Mullins 1976 Larronde et al 1998 Hiratsuka et al 2001 Gollop et al 2002) but
it has been also reported that anthocyanins exhibit an initial phase of rapid increase strongly
correlated to sugar accumulation and a second phase where anthocyanins and sugars are uncoupled
(Guidoni et al 2008)
Moreover several studies with red wine cultivars in which crop was adjusted by means of cluster
thinning increasing the leaf area to yield ratio resulted in improved soluble solids anthocyanins
total phenols and colour intensity (Filippetti et al 2007 Pastore et al 2011Guidoni et al 2002
Reynolds et al 1994)
As well known the prediction of wine colour and quality based on berry composition is a difficult
task but the aim of this trial is to understand (i) if post veraison trimming is effective to slow down
the rate of sugar accumulation and (ii) to verify the possible derived alterations after treatment in
anthocyanins and tannins accumulation and in their compositional changes during ripening
compared to control in Vitis vinifera L cultivar Sangiovese
2 MATERIAL AND METHODS
This trial was conducted in 2009 2010 and 2011 on Sangiovese vines (V vinifera L clone 12T
grafted on 3309C) planted in 1994 in Ozzano Emilia Bologna Italy (44deg25N 11deg28E) Vines were
spaced 15 m on the row and 3 m between the rows and they were trained to Free Cordon (16 buds
per vine)
Twenty-four vines in four blocks (6 vines per block) were randomLy assigned within each block to
the following treatments
a) Non-trimmed control (C)
b) Shoot trimming 1 week after full veraison which left 8 nodes on every main shoot (TRIMM)
Trimming was performed when berry sugar concentration reached around 15deg -18deg Brix and
precisely 6th August 2009 (17 days after veraison) 10th August 2010 (17 days after veraison) and
4th August 2011 (6 days after veraison)
21 Vegetative and yield data
In each year before trimming and at harvest two regressions between shoot length (main and
lateral) and their actual leaf area were calculated and used to estimate leaf area of all tested vines At
84
trimming the main and lateral leaves were removed and leaf area was measured with a leaf area
meter (LI-3000A Li-Cor Bioscences Lincoln Nebraska USA) At harvest time the crops of each
individual plant were gathered separately and the number of clusters and their weights were
recorded
Weather data (mean daily air temperature and rainfall) were recorded from April to September in the
both years at a meteorological station located close to the experimental site
22 Berry sampling
In each year every ten days from veraison to harvest samples of 20 berries per plant were
collected pooled per each block (120 berries) and divided in three subsamples (40 each) for
determinations of the following parameters
a) Berry weight and must biochemical parameters (soluble solids pH and titratable acidity) on 20
berries performed immediately after sampling
b) Skin anthocyanins on 10 berries immediately stored in -20deg C and kept there until the analyses
c) Skin and seed tannins on 10 berries immediately stored in -20deg C and kept there until the
analyses
23 Analyses of main must biochemical parameters
The 20 sample berries were crushed and the must were sieved and used for degBrix analysis by a
temperature-compensating CR50 refractometer (Maselli Misure Spa PR Italy) Five mL of the
same must were then diluted 7 times with bi-distilled water and used to perform a titration reaction
by a Crison Compact Tritator (Crison Barcelona Spain) with 1N 05 N or 025 N NaOH (Sigma-
Aldrich St Louis MO USA) according to the stage of berry ripening to obtain pH and Titratable
Acidity (TA) data (expressed as gl of tartaric acid equivalents)
24 Analyses of skin anthocyanins
The berries sampled were weighted before the extraction of anthocyanins Then the skin was
carefully removed from the pulp and immerged in 50 mL of HPLC-grade methanol (Carlo Erba
Reagents Milano Italy) and were kept in dark for 24 hours The day after the extract was
separated from the skin residues and conserved at (-20degC) until the analysis
85
HPLC separation and quantification of anthocyanins were performed on a Waters 1525 instrument
equipped with a diode array detector (DAD) using a reversed-phase column Phenomenex (Castel
Maggiore BO Italy) RP18 250 mmx4mm (5microM) with precolumn The eluents used were the
following A= HClO4 03 in milliQ water B = methanol
The methanol extract was filtered through 022 microm 13mm PTFE syringe-tip filters (Teknokroma
Barcelona Spain) and an aliquot of 270microL was diluted to final volume of 1mL with the A eluent
The binary gradient was the same as reported in Mattivi et al (2006) with suitable modifications
The time for column equilibration was 5 minutes and the injection volume was 60 microL Separation of
the main free anthocyanins was obtained at 43 degC and they were quantified at 520 nm with a
calibration curve with malvidin-3-glucoside (Sigma-Aldrich ST Louis MO USA)
25 Tannins analysis
To extract proanthocyanidins the sampled berries (skins and seeds) were ground separately to a fine
powder under liquid N2 01 gr aliquots were separated and extracted in darkness in 2 mL screw-top
Eppendorf tubes for 24 hours with 70 acetone (10 mL) containing 01 ascorbate to prevent
oxidation of polyphenols Samples were then centrifuged (15 min 13000 g) and two 400 μL
aliquots of the supernatant were transferred to fresh tubes and dried down under vacuum at 35ordmC for
120 minutes
One of them was re-suspended in 100 μL methanol acidified with 1 HCl then neutralised with 100
μL sodium acetate (200 mM pH 75) for the analysis of free monomers The other aliquot
underwent acid-catalysed cleavage of the proanthocyanidins in the presence of excess
phloroglucinol following the method of Kennedy and Jones (2001) Briefly the dried sample was
resuspended in 100 μL of phloroglucinol buffer (025 g ascorbate 125 g phloroglucinol 215 μL
conc HCl 25 mL methanol) and incubated at 50ordmC for 20 minutes then neutralised with 100 μL of
sodium acetate (200 mM pH 75) and centrifuged (15 min 13000 g)
A 200 μL aliquot each of the acetone extract the acetone extract after acid catalysed cleavage and
the residue after cleavage was then transferred to Sunbroker 250 μL reduced volume HPLC
autosampler vials Samples were run on a Waters 1525 instrument equipped with a diode array
detector (DAD) using a reversed-phase column Phenomenex (Castel Maggiore BO Italy) RP18
250 mmx4mm (5microM) with precolumn A separate reversed-phase HPLC method was developed for
the cleaved and uncleaved proanthocyanidin samples reading absorbance at 280 nm Uncleaved
samples solvent A 02 phosphoric acid solvent B 41 acetonitrile02 phosphoric acid
86
(gradient of solvent B zero min 0 5 min 10 40 min 10 55 min 17 65 min 19 75
min 19 80 min 100 85 min 100 86 min 0) Cleaved samples solvent A 02 acetic
acid solvent B methanol (gradient of solvent B zero min 1 40 min 1 120 min 30 1201
min 100 125 min 100 126 min 1) For both methods 25 μL of sample was injected and run
at 30ordmC with a flow rate of 1 mLmin Concentrations of free monomers and hydrolysed terminal
subunits were determined from standard curves prepared from commercial standards of catechin
epicatechin epigallocatechin and epicatechin-gallate obtained from Extrasynthese (France) The
concentration of extension subunit-phloroglucinol adducts was calculated from published molar
extinction coefficients (Kennedy amp Jones 2001)
3 RESULTS AND DISCUSSION
31 Climatic data
The Growing Degree Days (GDD 10 degC baseline) from April 1st to September 30th (Table 8 Fig
37) were highest in 2011 (2054) and lowest in 2010 (1718) Moreover the average daily temperature
recorded from veraison to harvest in 2011 was mostly (70 of the period) above 25deg C In addition
in 2011 the level of the rainfall from April to September was only 136 mm whereas in 2010 the
rainfall in the same period was found to be three times more (Table 8 Fig 37)
Table 8 The climatic conditions in 2009 2010 and 2011
Year Rain from April to
September (mm)
DD from April to
September (degC)
Number of days with average daily
temp gt 25deg C from veraison to
harvest
2009 269 1963 24
2010 390 1718 7
2011 136 2054 29
87
Fig 37 The yearly recorded rainfall and daily average temperature from April 1 to September of 2009 2010 and 2011
32 Vegetative and productive traits
All vines were quite uniform in terms of leaf area before trimming in all years (data not shown) The
TRIMM treatment induced a leaf area reduction around 60 in 2009 and 2010 and around 40 in
2011 compared to control The trimming of the upper part of the canopy affected mostly the laterals
compared to the main leaves especially in 2010 (Table 9) It is interesting to note that in 2010 a
significant higher leaf area was recorded compared to 2009 probably due to the more favourable
seasonal climatic conditions during the first phase of shoots growth No laterals re-growth was
measured after treatments in all years
88
Starting from a uniform bunch number per meter of cordon yield cluster weight and berry weight
were unaffected by treatments in 2009 (Table 9) In 2010 and 2011 yield and cluster weight were
significantly lower in TRIMM vines compared to control while berry weight didnrsquot show any
difference A year-by-year variability in terms of yield was verified In 2010 yield was significantly
higher than in 2009 and 2011 for both treatments and due to the setting of uniform buds and
clusters number per vine it might be almost entirely a result of cluster weight increase (Table 9)
Berry weight did not differ between treatments during ripening (Fig38) in all the tested years
Moreover the number of berries per cluster was significantly lower in TRIMM vines compared to C
in 2010 and 2011 (Table 9)
At harvest the leaf areayield ratio was reduced in TRIMM vines to very low values corresponding
to 038 and 039 m2kg in 2009 and 2010 respectively compared to 101 and 082 m
2kg in the
control vines which are considered optimal for ripening in Free Cordon (Table 9) In 2011 probably
due to the low yield level registered in TRIMM vines the leaf area yield ratio reached a value of
093 m2kg which was not significantly different from C and that may allow an optimal ripening
(Table 9)
Despite we did not evaluate the starch content in the different parts of the tested vines it would be
expected that the TRIMM vines subjected to leaf area reduction ranging from 40 to 60 after
veraison induced further remobilization of reserves (Candolfi-Vasconcelos et al 1994) The
possible carbohydrate reserve depletion in 2009 and 2010 induced by defoliation could be
responsible for yield constraint mainly due to reduction of flower numbers per inflorescence
(Scholefield et al 1977 Bennett et al 2005)
89
Table 9 Vegetative growth and yield components recorded over 2009ndash2011 in C and TRIMM vines
Parameters 2009 2010 2011 Year
effect
Year x
Treatment
Interaction
C TRIMM C TRIMM C TRIMM
Main LA after
trimming
(m2m of cordon)
144 a 056 b 177 a 096 b 121 a 071 b ns ns
Laterals LA after
trimming
(m2m of cordon)
079 a 025 b 112 a 018 b 059 a 030 b ns ns
Total LA after
trimming
(m2m of cordon)
223 a 081 b 289 a 114 b 180 a 101 b ns
Cluster
(nm of cordon)
105 a 106 a 111 a 102 a 101 a 102 a ns ns
Yield
(kgm of cordon)
22 a 21 a 35 a 29 b 143 a 108 b ns
Cluster weight (g) 2108
a 1966 a
3121
a 2868 b 1473 a 1045 b ns
Berry weight (g) 155 a 153 a 170 a 169 a 128 a 123 a ns
Berries per cluster (n) 136a 1285a 1835a 1697b 1150a 850b ns
Leaf area yield
(m2kg)
101a 038b 082a 039b 125a 093a ns
Different letters indicate mean separation between treatments C and TRIMM within rows and years by t -test P = 005
P = 001 year x treatment interaction indicate mean separation within rows and years by t-test
90
Fig 38 Berry weight in the control and trimmed vines from veraison to harvest of the years 2009
2010 and 2011
33 Ripening analyses Soluble solids pH and Total Acidity
In 2009 and in 2010 TRIMM vines had significant lower soluble solids concentration (degBrix) at
harvest compared to C but no significant effect was recorded in 2011(Fig 39) TA and pH did not
show any difference between treatments in all years (Table 10) Daily soluble solids accumulation
rate has been reduced after trimming in 2009 and 2010 of 8 and 16 and not at all in 2011
compared to control vines
In 2011 the extremely hot and dry climatic conditions led to an acceleration in the accumulation of
soluble solids so that 23 days after veraison the degBrix level of C reached the 24 degBrix (Fig 39)
while in 2009 and 2010 this value was reached respectively 42 and 58 days after veraison Under
91
such circumstances associated with a general lower level of yield in 2011 compared to the previous
years the grapes of TRIMM vines did not show differential accumulation rate and no significant
difference was recorded in berry composition compared to Control in this year This result is in
agreement with the high value of leaf area to yield ratio (Table 9) measured in TRIMM vines in
2011 which is considered adequate to allow an optimal ripening
Fig 39 degBrix in the control and trimmed vines from veraison to harvest of the years 2009 2010 and 2011
92
34 Anthocyanins accumulation during ripenning
Total anthocyanin concentration (mgkg) did not differ among treatments during ripening in all the
experimental years (Fig40) and no variation was registered at harvest (Table 10) Although no
difference was recorded among the treatments the anthocyanins concentrations were different
among the years (Fig40) The lowest anthocyanin value at harvest was registered to be in 2009 and
the maximum was observed in 2011 (Fig40) These results do not seem correlated with the different
temperature trend in the experimental years because in the both 2009 and 2011 the temperature
exceeded to the critical value for anthocyanin accumulation for periods with similar length Having
the lowest berry weight in 2011 is probably the reason of the highest anthocyanin value registered at
harvest in the grapes of both treatments as compared to the previous years (Table 9 10)
Notably no relation has been verified between the reduction in soluble solids accumulation
occurred in 2009 and in 2010 and variation in anthocyanins accumulation
In particular in 2009 when the trimming was effective in slowing down the rate of sugar
accumulation the correlation between total anthocyanin content (mg per berry) and berry juice
soluble solids concentration showed similar curves for TRIMM and C (Fig 41) Both treatments
showed an increasing positive trend between 10deg Brix to 22deg Brix where there is a peak
concentration and a decline in anthocyanins during the latter stage of ripening (Fig 41) Our results
are in acordance with Guidoni et al (2008) who demonstrated that anthocyanins may accumulate in
a two-phase process with an initial phase of rapid increase and a second phase where anthocyanins
and sugars are uncoupled
As other authors pointed out sugar accumulation was shown to be more strictly associated to
thermal time whereas anthocyanin accumulation was also affected by other sources of variations
(water yield and climatic conditions) (Sadras et al 2007) and in general displays a much wider
range of variation than that of sugars
93
Fig 40 The anthocyanin concentration in the control and trimmed vines from veraison to harvest of the years 2009
2010 and 2011
Fig 41 The correlation between the total anthocyanin content and berry soluble solids concentration in the control and
trimmed vines from veraison to harvest of the year 2009
94
Besides the analysis of the anthocyanin composition at harvest did not show significant difference
between the treatments in all the three years The percentage of delfinidid 3-G cyanidin 3-G
peonidin 3-G petunidin -3-G and malvidin 3-G in berries of TRIMM and C vines showed the
typical Sangiovese grape profile with high level of cyanidin 3-G and malvidin 3-G (Fig 42) It
seems that the biosynthesis of each individual anthocyanin is not influenced by the variation of
sugar concentration in the berries at harvest as occurred in 2009 and 2010
Moreover the trimming treatment did not modify cluster microclimatic conditions which are found
to be responsible for anthocyanin profile changes as reported after cluster shading (Downey et al
2004) and temperature variation (Mori et al 2005)
Fig 42 The anthocyanin profile in the berry skin of control and trimmed vines at harvest of the years 2009 2010 and
2011
95
35 Tannins accumulation during ripenning
In all experimental years trimming did not affect the evolution of seed and skin tannins
concentration expressed as mg per kg of berries during ripening and at harvest (Table 10 Fig 43 45
and 47) The tannins were expressed as mg per kg of berries as no differences were recorded
between treatments in berry weight during ripening (Fig 38)
Similar to what was previously reported on different varieties (Harbertson et al 2002 Kennedy et
al 2002 Downey et al 2003) the levels of seed tannins were higher compared to skin tannins at
veraison but declined during ripening The levels of berry skin and seed tannins reached to nearly
equal levels at harvest (Table 10 Fig 43 45 and 47) By evaluating the seed monomers and
polymers tannins the similar trends were observed in all treatments during ripening and their
concentration (mgkg of berries) in seed polymers was considerably higher than in its monomers as
expected
As well as that the berry tannins composition was assessed from veraison to harvest in each year
and the evolution of all four flavan-3-ols (catechin epicatechin epigallocatechin and epicatechin-
gallate) followed the same tendency between treatments (Fig 44 46 and 48) And among them
epicatechin is the major and catechin is the minor constituent of berry tannins (Fig 44 46 and 48)
Our results assessed that the concentration and composition of each group of tannins compounds at
harvest were not affected by trimming treatment after veraison also when this technique was able to
reduce sugar accumulation rate Moreover it appeared that the concentration of each flavan 3 ols
(catechin epicatechin epigallocatechin and epicatechin-gallate) remains almost constant in the last
thirty days before harvest revealing that both tannins composition and content may be not
responsable of different level of astringency in wine obtained from grapes at different degree of
ripening In other words our results seem to assess a very low effectiveness of the determinations of
each compound in prediction of wine astringency traits As previously pointed out by several
authors the extractability and solubility of each group of flavonoid compounds during ripening may
play an important rule to understand the relationships between berry composition wine composition
and sensory properties of wine
96
Fig 43 The tannins concentration of berry seed and skin in the control and trimmed vines from veraison to harvest of
the year 2009
Fig 44 The tannins composition in the control and trimmed vines from veraison to harvest of the year 2009
97
Fig 45 The tannins concentration of berry seed and skin in the control and trimmed vines from veraison to harvest of
the year 2010
Fig 46 The tannins composition in the control and trimmed vines from veraison to harvest of the year 2010
98
Fig 47 The tannins concentration of berry seed and skin in the control and trimmed vines from veraison to harvest of
the year 2011
Fig 48 The tannins composition in the control and trimmed vines from veraison to harvest of the year 2011
99
Table 10 Berry composition in the control and trimmed vines at harvest of the years 2009 2010 and 2011
Parameters 2009 2010 2011 Year x
Treatment
Interaction C TRIMM C TRIMM C TRIMM
Soluble solids (degBrix) 252 a 246 b 237 a 23 b 264 a 272 a ns
Total acidity (gl) 738 a 723 a 779 a 796 a 844 a 891 a ns
pH 353 a 347 a 339 a 336 a 339 a 336 a ns
Total anthocyanins
(mgkg berries)
7961 a 8381 a 11177 a 11200 a 17080 a 18100 a
Total tannins 3506 a 3547 a 3330 a 3107 a 3699 a 3522 a ns
Total tannins in skin 1006 a 1196 a 1466 a 1243 a 1697 a 1722 a ns
Total tannins in seed 2600 a 2352 a 1864 a 1864 a 2002 a 1800 a ns
4 CONCLUSION
The source limitation by trimming after veraison showed some perspectives to achieve lower sugar
accumulation in grape and lower alcohol potential in wines without inducing modification in the
evolution of the main assessed flavonoids compounds (skin anthocyanins total seeds and skin
tannins concentration and profile) in Sangiovese berries
The efficiency of this technique seems to be strongly depending from the vines starch supply as the
possible carbohydrate reserve depletion induced year over year by trimming may be responsible for
self regulation mechanism of yield constraint verified in the second and third year of the trial In this
condition the leaf area cutback after veraison is counterbalanced by the yield lowering and no effects
is obtained in lowering sugar accumulation as the leaf area yield ratio is maintained to high level
Probably the low fertility condition of the vineyard site and the lack of irrigation system may have
promoted this mechanism
Further researches on photosynthetic limitation after veraison to reduce sugar accumulation will be
focused on vines in different soil fertility condition and on the evaluation of the extractability of
tannins from seeds and skins in wines or wine-like solutions derived from this treatment
100
5 GENERAL CONCLUSION
Wine grape must deal with serious problems which occur due to the unfavorable climatic conditions
resulted from global warming
The excessive elevated temperatures are critical for grapevine and contribute to degradation of grape
and wine quality As an illustration elevated temperature is an important factor that can negatively
affect anthocyanin accumulation in grape Particularly cv Sangiovese was identified to be very
sensitive to such condition The expressions of the genes involved in flavonoid biosynthesis were
observed to be affected by temperature The quantitative real-time PCR analysis showed that
flavonoid biosynthetic genes were slightly repressed by high temperature As well as that the heat
stress showed to repress the expression of the transcription factors VvMYBA1 that activates the
expression of UFGT
Moreover high temperatures showed to had repressing effects on the activity of the flavonoids
biosynthetic enzymes PAL and UFGT
Anthocyanin accumulation in berry skin is due to the balance between its synthesis and oxidation
In grape cv Sangiovese the gene transcription and activity of peroxidases enzyme was found to be
elevated by heat stress as a defensive mechanism of ROS-scavenging
Even if different antioxidant enzymes have been recognized to be involved in flavonoids
degradation under various abiotic stresses this research identifies peroxidases as one of the best
candidate to oxidize anthocyanins actively
Between many isoforms of peroxidases genes which are expressed in grape berry skin from
veraison to harvest one peroxidase gene (POD 1) induced in Sangiovese grape under thermal stress
condition was isolated and evaluated via the technique of genes transformation from grape to
Petunia flower Reduction in anthocyanins concentration in POD 1 transformed Petunia flowers was
assessed after thermal stress conditioning compared to untrasformed control
Biochemical and molecular studies confirmed the role of peroxidases enzyme in active anthocyanins
degradation in Sangiovese cv grape skin under temperature stress conditions Based on our results
a similar mechanism that will be object of further investigation may be supposed for flavonols
degradation In conclusion this study showed that the temperature regimes after veacuteraison have
different effects on each flavonoid group Although the anthocyanin proanthocyanidin and flavonol
share the main part of their biosynthetic pathway no effects were obtained regarding any changes in
the biosynthesis of the proanthocyanidins under these different thermal ripening conditions
101
Moreover the present study is the pioneer to approve that the mechanism of anthocyanin loss in
grape skins due to high temperature involves not only the inhibition of anthocyanin biosynthesis but
also its enzymatic degradation
What is more in wine producing regions it is inevitable for the grape growers to adopt some
adaptive strategies to alleviate grape damages to abiotic stress conditions It is necessary to
ameliorate the vintage through improvement of management techniques to face the impacts of
undesirable climatic conditions Therefore in this thesis the technique of post veraison trimming
was done to improve the coupling of the phenolic and sugar ripening in Vitis vinifera L cultivar
Sangiovese
Trimming after veraison allowed to limit the photosynthetic source and showed to be executable to
slow down the rate of sugar accumulation in grape (to decrease the alcohol potential in wines)
without inducing modification in the evolution of the main berry flavonoids compounds
Moreover the present research showed that the efficiency of this technique applied year after year is
related to the ability of the vines to recover charboidrate reserve to prevent self regulation
mechanism of yield constraint
Further researches need to be performed on the evaluation of the extractability of tannins from seeds
and skins in wines or wine-like solutions derived from grape on vines subjected to post veraison
photosynthetic limitation
102
REFERENCES
Adams D 2006 Phenolics and ripening in grape berries J Am J Enol Vitic Vol 57 (3) 249-
256
Alfenito MR Souer E Goodman CD 1998 Functional complementation of anthocyanin
sequestration in the vacuole by widely divergent Glutathione Stransferases J The Plant Cell Vol
101135-1149
Aron PM Kennedy JA 2008 Flavan-3-ols Nature occurrence and biological activity J Mol
NutrFood Res Vol 52 79-104
Bavaresco L Fregoni C 2001 Physiological role and molecular aspects of grapevine stilbenic
compounds In K A Roubelakis-Angelakis (Ed) Molecular biology and biotechnology of the
grapevine pp 153-182
Bennett J Jarvis PCreasy G Trought M 2005 Influence of defoliation on overwintering
carbohydrate reserves return bloom and yield of mature Chardonnay grapevines J Am J Enol
Vitic Vol 56(4) 386-393
Bergqvist J Dokoozlian N Ebisuda N 2001 Sunlight exposure and temperature effects on berry
growth and composition of Cabernet Sauvignon and Grenache in the central San Joaquin Valley of
California J Amer J Enol Vitic Vol 52 (1) 1-7
Bindi M Fibbi L Gozzini B Orlandini S Miglietta F 1996 Modelling the impact of future
climate scenarios on yield and yield variability of grapevine J Clim Res Vol 7 213ndash224
Bogs J Downey MO Harvey JS Ashton AR Tanner GJ Robinson SP 2005
Proanthocyanidin Synthesis and Expression of Genes Encoding Leucoanthocyanidin Reductase and
Anthocyanidin Reductase in Developing Grape Berries and Grapevine Leaves J Plant Physiol Vol
139 652ndash663
Bogs J Ebadi A McDavid D Robinson SP 2006 Identification of the flavonoid hydroxylases
from grapevine and their regulation during fruit development J Plant Physiol Vol 140(1) 279-
291
Boss PK Davies C Robinson S P 1996 Analysis of the expression of anthocyanin pathway
genes in developing Vitis Vinifera L cv Shiraz grape berries and the implications of pathway
regulation J Plant Physiol Vol 111 1059-1066
Boulton R 2001 The copigmentation of anthocyanins and its role in the color of red wine A
critical review J Am J Enol Vitic Vol 52 (2) 67-87
103
Braidot E Zancani M Petrussa E Peresson C Bertolini A Patui S Macrigrave F Vianello A
2008 Transport and accumulation of flavonoids in grapevine (Vitis vinifera L) J Plant signaling
and behavior Vol 3(9) 626 - 632
Broun P 2005 Transcriptional control of flavonoid biosynthesis a complex network of conserved
regulators involved in multiple aspects of differentiation in Arabidopsis J Current Opinion in Plant
Biology Vol 8(3) 272-279
Bucchetti B 2004 Effetti biochimici e molecolari della luce sulla maturazione dellrsquouva nella cv
Sangiovese Tesi di Dottorato di ricerca in Colture Arboree ed Agrosistemi Forestali e Paesaggistici
XVII ciclo Universita di Bologna
Bucchetti B Pastore C Filippetti I Intrieri C 2007 Effetti di diverse tecniche colturali sulla
sintesi di antociani in Sangiovese Poster VIII GIORNATE SCIENTIFICHE SOI 8-11052007
(SS)
Buchanan-Wollaston V Morris K 2000 Senescence and cell death in Brassica napus and
Arabidopsis In Programmed Cell Death in Animals and Plants (Garland JM ed) BIOS Scientific
Publishers pp 163ndash174
Butterfield RE Gawith MJ Harrison PA Lonsdale KJ Orr J 2000 Modelling climate
change impacts onwheat potato and grapevine in Great Britain in Downing T E Harrison P A
Butterfield R E and Lonsdale KG (eds) Climate Change Climatic Variability and Agriculture
in Europe An Integrated Assessment Final Report Environmental Change Institute University of
Oxford 411 p
Buttrose MS Hale CR Kliewer WM 1971 Effect of temperature on composition of
lsquoCabernet Sauvignonrsquo berries J Amer J Enol Vitic Vol 22 (2) 71ndash75
Calderon AA Garciaflorenciano E Munoz R Barcelo A R 1992 Gamay grapevine
peroxidase its role in vacuolar anthocyani( di)n degradation J VITIS Vol 31(3) 139ndash147
Candolfi-Vasconcelos M Candolfi M Kohlet W 1994Retranslocation of carbon reserves from
the woody storage tissues into the fruit as a response to defoliation stress during the ripening period
in Vitis vinifera L
Castellarin SD Pfeiffer A Sivilotti P Degan M Peterlunger E Di Gaspero G 2007
Transcriptional regulation of anthocyanin biosynthesis in ripening fruits of grapevine under seasonal
water deficit J Plant Cell and Environment Vol 30 1381ndash1399
Castellarin SD Di Gaspero G Marconi R Nonis A Peterlunger E Paillard S Adam-
Blondon AF Testolin R 2006 Colour variation in red grapevines (Vitis vinifera L) genomic
104
organisation expression of flavonoid 3-hydroxylase flavonoid 35-hydroxylase genes and related
metabolite profiling of red cyanidin-blue delphinidin-based anthocyanins in berry skin J BMC
Genomics Vol 7(12) 1471-2164
Chen G Asada K 1989 Ascorbate Peroxidase in tea leaves occurrence of two isozymes and the
differences in their enzymatic and molecular properties J plant cell physiol Vol 30 (7) 987-998
Chen J Wen P Kong W Pan Q Wan S Huang W 2006 Changes and subcellular
localizations of the enzymes involved in phenylpropanoid metabolism during grape berry
development J Plant phisiol Vol 163 (2) 115-127
Cheynier V Rigaud J 1986 HPLC separation and characterization of flavonols in the skin of
Vitis Vinifera var Cinsault J Am J Enol Vitic Vol 37 248-252
Christie P Alfenito M R Walbot V 1994 Impact of low temperature stress on general phenyl
propanoid and anthocyanin pathways enhancement of transcript abundance and anthocyanin
pigmentation in maize seedlings J Planta Vol 194 541ndash549
Chua CS Biermann D Goo K S Sim T 2008 Elucidation of active site residues
of Arabidopsis thaliana flavonol synthase provides a molecular platform for engineering flavonols
J Phytochem Vol 69 (1) 66ndash75
Cohen S Tarara J Kennedy J 2012 Diurnal temperature range compression hastens berry
development and modifies flavonoid partitioning in grapes J Am J Enol Vitic vol 63(1) 112-
120
Conde C Silva P Fontes N Dias A Tavares R M Sousa M Agasse A Delrot S Geroacutes
H 2007 Biochemical changes throughout grape berry development and fruit and wine quality
httphdlhandlenet18226820
Conner AJ Albert NW Deroles SC 2009 Transformation and regeneration of petunia C
Springer Springer Science+Business Media LLC Chapter 19 pp 395-409
Coombe B G 1992 Research on Development and Ripening of the Grape Berry J Am J Enol
Vitic Vol 43(1) 101-110
Cortell JM M Halbleib AV Gallagher T Righetti and JA Kennedy 2007a Influence of vine
vigor on grape Vitis vinifera L cv Pinot noir) anthocyanins 1 anthocyanin concentration and
composition in fruit J Agrie Food Chem 556575-6584
Darneacute G 1993 New hypothesis on anthocyanin biosynthesis in berries and leaves of grapevine J
Vitis Vol 32 77-85
105
Dat JF Foyer CH Scott IM 1998 Changes in salicylic acid and antioxidants during induced
thermotolerance in mustard seedlings J Plant Physiol Vol 118 1455ndash1461
Davies KM Schwinn KE 2003 Transcriptional regulation of secondary metabolism J
Functional Plant Biology Vol 30(9) 913 ndash 925
Dela G Or E Ovadia R Nissim-Levi A Weiss D Oren- Shamir M 2003 Changes in
anthocyanin concentration and composition in lsquoJaguarrsquo rose flowers due to transient
hightemperature conditions J Plant Sci Vol 164 333ndash340
Deluc L Bogs J Walker AR Ferrier T Decendit A Merillon JM Robinson SP Barrieu
F 2008 The transcription factor VvMYB5b contributes to the regulation of anthocyanin and
proanthocyanidin biosynthesis in developing grape berries J Plant Physiol Vol (147) 2041ndash2053
Dokoozlian NK 2000 Grape berry growth and development Raisin Production Manual Chapter
5 pp 30- 37
Downey MO Dokoozlian NK Krstic MP 2006 Cultural Practice and environmental Impacts
on the flavonoid composition of grapes and wine A review of recent research J Amer J Enol
Vitic Vol 57 (3) 257-268
Downey MO Harvey JS Robinson SP 2003 Analysis of tannins in seeds and skins of Shiraz
grapes throughout berry development J Aust J Grape Wine Res Vol 9 15-27
Downey MO Harvey JS Robinson SP 2003 Synthesis of flavonols and expression of
flavonol synthase genes in the developing grape berries of Shiraz and Chardonnay (Vitis Vinifera
L) J Aust J Grape Wine Res Vol 9 110-121
Downey MO Harvey JS Robinson SP 2004 The effect of bunch shading on berry
development and flavonoid accumulation in Shiraz grapes J Aus J Grape Wine Res Vol 10 55-
73
Dry I B Robinson S P 1994 Molecular cloning and characterization of grape berry polyphenol
oxidase J Plant Molecular Biology Vol 26 495-502
Duchene E Schneider C 2005 Grapevine and climatic changes a glance at the situation in
Alsace Agron J Sustain Dev Vol 25 93ndash99
Fasoli M Dal Santo S Zenoni S Tornielli GB Farina L Zamboni A Porceddu A
Venturini L Bicego M Murino V Ferrarini A Delledonne M Pezzotti M 2012 The
grapevine expression atlas reveals a deep transcriptome shift driving the entire plant into a
Maturation Program J The Plant Cell Vol 24 3489ndash3505
Ferrini F Mattii GB Nicese FP 1995 Effect of Temperature on Key Physiological Responses
of Grapevine Leaf J Am J Enol Vitic Vol 46(3) 375-379
106
Filippetti I 2009 Technological and Phenolic ripening synchronization in winegrape Data has not
been published
Filippetti I Ramazzotti S Centinari M Bucchetti B Intrieri C 2007 Effects of cluster
thinning on grape composition experience ldquoSangioveserdquo grapevines Proc Int Workshop on
Advance in Grapevine and Wine Research
Fournand D Vicens A Sidhoum L Souquet JM Moutounet M Cheynier V 2006
Accumulation and extractability of grape skin tannins and anthocyanins at different advanced
physiological stages J Agric Food Chem Vol 54 7331-7338
Fraser E 2008 ldquoCrop yield and climate changerdquo Retrieved on 2009-09-14
Fujita A Soma N Goto-Yamamoto N Mizuno A Kiso K Hashizume K 2007 Effect of
shading on proanthocyanidin biosynthesis in the grape berry J Japan Soc Hort Sci Vol 76 112-
119
Fujita A Goto-Yamamoto N Aramaki I Hashizume K 2006 Organ-Specific Transcription
of Putative Flavonol Synthase Genes of Grapevine and Effects of Plant Hormones and Shading on
Flavonol Biosynthesis in Grape Berry Skins J Biosci Biotech and Biochem Vol 70 (3) 632-
638
Gagneacute S Lacampagne S Claisse O Geacuteny L 2009 Leucoanthocyanidin reductase and
anthocyanidin reductase gene expression and activity in flowers young berries and skins of Vitis
vinifera L cv Cabernet-Sauvignon during development J Plant Physiol amp Biochem Vol 47 (4)
282ndash290
Gatto P Vrhovsek U Muth J Segala C Romualdi C Fontana P Pruefer D Stefanini M
Moser C Mattivi F Riccardo Velasco R 2008 Ripening and genotype control stilbene
accumulation in healthy grapes J Agric Food Chem Vol 56 (24) 11773ndash11785
Gollop R Even S Colova-Tsolova V Peri A 2002 Expression of the grape dihydroflavonol
reductase gene and analysis of its promoter region J Exp Bot Vol 53 1397ndash1409
Gollop R Farhi S Perl A 2001 Regulation of the leucoanthocyanidin dioxygenase gene
expression in Vitis vinifera J Plant Sci Vol 161 (3) 579ndash588
Goto-Yamamoto N Mori K Numata M Koyama K Kitayama M 2009 Effects of
temperature and water regimes on flavonoid contents and composition in the skin of red-wine
grapes J Int Sci Vigne Vin Vol 43 (1) 75-80
Goto-Yamamoto N Wan GH Masaki K Kobayashi S 2002 Structure and transcription of
three chalcone synthase genes of grapevine (Vitis vinifera) J Plant Sci Vol 162 867-872
107
Greer D H Weston C 2010 Heat stress affects flowering berry growth sugar accumulation and
photosynthesis of Vitis vinifera cv Semillon grapevines grown in a controlled environment J
Functional Plant Biol Vol 37(3) 206ndash214
Guidoni S Ferrandino A Novello V 2008 Effects of seasonal and agronomical practices on
skin anthocyanin profile of Nebbiolo grapes JAm J Enol Vitic Vol 59(1) 22-29
Guidoni S Ferrandino A Novello V 2004 Ruolo del clima e degli interventi colturali sulla
sintesi degli antociani nellrsquouva (Vitis Vinifera L cv Nebbiolo) J Quad Vitic Enol Univ Torino
27
Guidoni S P Allara and A Schubert 2002 Effect of cluster thinning on berry skin anthocyanin
composition of Vitis vinifera cv Nebbiolo Am J Enol Vitic V 53224-226
Harbertson JF Kennedy JA Adams DO 2002 Tannin in skins and seeds of Cabernet
Sauvignon Syrah and Pinot noir berries during ripening J Am J Enol Vitic Vol 53 (1) 54-59
Hardie WJ OrsquoBrien TP Jaudzems VG 1996 Morphology anatomy and development of the
pericarp after anthesis in grape Vitis vinifera L J Aust J Grape Wine Res Vol 2 97ndash142
Haselgrove L Botting D Van Heeswijck R Hoslashj PB Dry PR Ford C Iland PG 2000
Canopy microclimate and berry composition The effect of bunch exposure on the phenolic
composition of Vitis vinifera L cv Shiraz grape berries J Aust J Grape Wine Res Vol 6 141-
149
Hawker JS 1969a Changes in the activities of enzymes concerned with sugar metabolism during
the development of grape berries J Phytochem Vol 8 9-17
Hawker JS 1969b Insoluble invertase from grapes an artefact of extraction J Phytochem Vol
8 337-344
Hellens RP Edwards EA Leyland NR Bean S Mullineaux PM 2000 pGreen a versatile
and flexible binary Ti vector for Agrobacterium-mediated plant transformation J Plant Mol Biol
Vol 42 819-832
Hiratsuka S Onodera H Kawai Y Kubo T Itoh H Wada R 2001 ABA and sugar effects on
anthocyanin formation in grape berry cultured in vitro J Scientia Horticulturae Vol 90 (1-2) 121-
130Hrazdina G Parsons GF Mattick LR 1984 Physiological and biochemical events during
development and maturation of grape berries J Amer J Enol Vitic Vol 35 (4) 220ndash227
Huglin P 1978 Nouveau Mode drsquoEacutevaluation des Possibiliteacutes Heacuteliothermiques drsquoun Milieu
Viticole CR Acad Agr France Vol 64 1117-1126
Hugueney P Provenzano S Verriegraves C Ferrandino A Meudec E Batelli G Merdinoglu D
Cheynier V Schubert A Ageorges A 2009 A novel cation-dependent o-methyltransferase
involved in anthocyanin methylation in grapevine J Plant Physiol Vol 150 (4) 2057- 2070
108
Intrieri C 1994 Vini frizzanti interventi agronomici per il controllo della maturazione J
Lrsquoenotecnico Vol 9 65-72
Intrieri C Magnanini E Silvestroni O 1983 Effetti della potatura verde sul comportamento
vegetativo e produttivo di Albana e Sangiovese J Vignevini Vol 5 57-62
Intrieri C Silvestroni O Poni S 1994 ndash Pluker nuova defogliatrice polivalente per vigneti
Vignevini Vol 1-2 25 ndash 31
involvement of leucoanthocyanidin dioxygenase J Planta Vol 229( 2) 427-445
J Planta Vol 192(4) 567-573
Jackman RL Smith JL 1996 Anthocyanins and betalains In Hendry GAF Houghton JD eds
Natural food colorants 2nd
edn London Chapman amp Hall pp 244ndash309
Jeong ST Goto-Yamamoto N Kobayashi S Esaka M 2004 Effects of plant hormones and
shading on the accumulation of anthocyanins and the expression of anthocyanin biosynthetic genes
in grape berry skins J Plant Sci Vol 167 247-252
Jeong ST Goto-Yamamoto N Hashizume K Esaka M 2006 Expression of the flavonoid 3prime-
hydroxylase and flavonoid 3prime5prime-hydroxylase genes and flavonoid composition in grape (Vitis
vinifera) Plant Sci Vol 170 (1) 61ndash69
Jiang YM Duan X Joyce D Zhang Z Li J 2004 Advances in understanding of enzymatic
browning in harvested litchi fruit J Food Chem Vol 88 443ndash446
Jones GV White MA Cooper OR Storchmann K 2005 Climate change and global wine
quality J Climatic Change Vol 73 319ndash343
Kader F Haluk JP Nicolas JP Metche M 1998 Degradation of cyanidin 3-glucoside by
blueberry polyphenol oxidase kinetic studies and mechanisms J Agric Food Chem Vol 46
3060ndash 3065
Kader F Nicolas JP Metche M 1999 Degradation of pelargonidin 3-glucoside in the presence
of chlorogenic acid and blueberry polyphenol oxidase J Sci Food Agric Vol 79 517ndash522
Kader F Rovel B Girardin M Metche M 1997 Mechanism of browning in fresh highbush
blueberry fruit (Vaccinium corymbosum L) Role of blueberry polyphenol oxidase chlorogenic acid
and anthocyanins J Sci Food Agric Vol 74(1) 31ndash34
Karimi M Inzeacute D Depicker A 2002 GATEWAYtrade vectors for Agrobacterium-mediated plant
transformation J Trends in Plant Sci Vol 7(5) 193ndash195
Kemp BS Harrison R Creasy GL 2011 Effect of mechanical leaf removal and its timing on
flavan-3-ol composition and concentrations in Vitis vinifera L cv Pinot Noir wine J Aust J Grape
Wine Res Vol 17(2) 270ndash279
109
Kennedy JA Jones GV 2001 Analysis of Proanthocyanidin Cleavage Products Following
Acid-Catalysis in the Presence of Excess Phloroglucinol Amer J Enol Vitic Vol 49(4) 1740-
1746
Kennedy JA Matthews MA Waterhouse AL 2000 Changes in grape seed polyphenols during
fruit ripening J Phytochem Vol 55 77-85
Kennedy JA Matthews MA Waterhouse AL 2002 Effect of maturity and vine water status
on grape skin and wine flavonoids J Am J Enol Vitic Vol 53 268-274
Kennedy JA Saucier C Glories Y 2006 Grape and Wine Phenolics History and Perspective
J Am J Enol Vitic Vol 57 (3) 239-248
Kenny GJ Harrison PA 1992 The effects of climate variability and change on grape suitability
in Europe J Wine Res Vol 3 163ndash183
King P McClellan D Smart R 2012 Effect of severity of leaf and crop removal on grape and
wine composition of Merlot vines in Hawkersquos bay vineyards J Am J Enol Vitic ajev201212020
Kliewer W M 1970 Effect of day temperature and light intensity on coloration of Vitis vinifera
grapes J Amer Soci Hort Sci Vol 95 693ndash697
Kliewer W M Torres R E 1972 Effect of controlled day and night temperatures on grape
coloration J Amer J Enol Vitic Vol 23 71ndash77
Kliewer W Dokoozlian N 2005 Leaf areacrop weight ratios of grapevines influence on fruit
composition and wine quality J Am J Enol Vitic Vol 56(2) 170-181
Kliewer WM 1966 Sugars and organic acids of Vitis Vinifera J Plant PhysiolVol 41 923-931
Kliewer WM 1977 Influence of temperature solar radiation and nitrogen on coloration and
composition of Emperor Grapes J AmJ Enol Vitic Vol 28 (2) 96-103
Kobayashi S Goto-Yamamoto N Hirochika H 2004 Retrotransposon-induced mutations in
grape skin color J Sci Vol 304 (5673) 982 p
Kobayashi S Ishimaru M Ding CK Yakushiji H Goto N 2001 Comparison of UDP-
glucose flavonoid 3-O-glucosyltransferase (UFGT) gene sequences between white grapes (Vitis
vinifera) and their spots with red skin J Plant Sci Vol 160 543-550
Kobayashi S Ishimaru M Hiraoka K Honda C 2002 Myb-related genes of the Kyoho grape
(Vitis labruscana) regulate anthocyanin biosynthesis J Planta Vol 215 924-933
Kriedemann P E 1968 Photosynthesis in vine leaves as a function of light intensity temperature
and leaf age J Vitis Vol 7 213-220
Kuznetsov V V Shevyakova N I 2007 Polyamines and stress tolerance of plants Global science
books Plant stress Vol 1(1) 50-71
110
Laget F Tondut J L Deloire A Kelly M T 2008 Climate trends in a specific Mediterranean
viticultureal area between 1950 and 2006 J Int Sci Vigne Vin Vol 42 (3) 113-123
Lakso A N Kliewer W M 1975 The Influence of Temperature on Malic Acid Metabolism in
Grape Berries J Plant Physiol Vol 56 (3) 370-372
Landy A 1989 Dynamic structural and regulatory aspects of site-specific recombination J Ann
Rev Biochem Vol 58 913ndash949
Larronde F Krisa S Decendit A Chegraveze C Deffieux G Meacuterillon J M 1998 Regulation of
polyphenol production in Vitis vinifera cell suspension cultures by sugars JPlant Cell Reports Vol
17(12) 946-950
Leyva A Jarillo J Salinas J Martinez-Zapater M 1995 Low temperature induces the
accumulation of phenylalanine ammonia-lyase and chalcone synthase mRNAs of Arabidopsis
thaliana in a light-dependent manner J Plant Physiol Vol 108 39ndash46
Lin-Wang K Micheletti D Palmer J Volz R Lozano L 2011 High temperature reduces apple
fruit colour via modulation of the anthocyanin regulatory complex J Plant Cell amp Environment
Vol 34(7) 1176ndash1190
Lo Piero A R Puglisi I Rapisarda P Petrone G 2005 Anthocyanins accumulation and related
gene expression in red orange fruit induced by low temperature storage J Agric Food Chem Vol
53 9083ndash9088
Lough J M Wigley T M L Palutikof J P 1983 Climate and climate impact scenarios for
Europe in a warmer world J Clim Appl Meteorol Vol 22 1673ndash1684
Loslashvdal T Olsen K M Slimestad R Verheul M Lillo C 2010 Synergetic effects of nitrogen
depletion temperature and light on the content of phenolic compounds and gene expression in
leaves of tomato J Phytochemistry Vol 71(5ndash6) 605ndash613
Makra L Vitaacutenyi B Gaacutel A Mika J Matyasovszky I Hirsch T 2009 Wine Quantity and
Quality Variations in Relation to Climatic Factors in the Tokaj (Hungary) Winegrowing Region
Amer J Enol Vitic Vol 60 (3) 312-321
Mann M E Bradley R S Hughes M K 1998 Global-scale temperature patterns and climate
forcing over the past six centuries J Nature Vol 392 779-787
Matsui S Ryugo K Kliewer W M 1986 Growth inhibition of Thompson Seedless and Napa
Gamay berries by heat stress and its partial reversibility by applications of growth regulators J Am
J Enol Vitic Vol 37 (1) 67-71
Mattivi F Guzzon R Vrhovsek U Stefanini M Velasco R 2006 Metabolite profiling of
grape Flavonols and anthocyanins J Agric Food Chem Vol 54 (20) 7692-7702
111
Mazza G Fukumoto L Delaquis P Girard B Ewert B1999 Anthocyanins Phenolics and
Color 426 of Cabernet Franc Merlot and Pinot Noir wines from British Columbia J Agric Food
Chem 474009-427 4017 Menting J G T Scopes R K Stevenson T W 1994
Characterization of Flavonoid 3rsquo5rsquo-Hydroxylase in Microsomal Membrane Fraction of Petunia
hybrida Flowers J Plany Physiol Vol 106 (2) 633- 642
Mazza G Miniati E 1993 Color stabilization and intensification In Mazza G Miniati E (eds)
Anthocyanins in Fruits Vegetables and Grains CRC Press Boca Raton pp 1ndash20
Meyer P Heidmann I Forkmann G Saedler H 1987 A new petunia flower colour generated
by transformation of a mutant with a maize gene J Nature Vol 330 677-678
Mol J 1998 How genes paint flowers and seeds J Trends in Plant Sci Vol 3 212-217
Morais H Ramos C Forgacs E Cserhati T Matos N Almeida V Oliveira J 2002
Stability of anthocyanins extracted from grape skins J Chromatographia Vol 56 173ndash175
Mori K Goto-Yamamoto N Kitayama M Hashizume K 2007a Loss of anthocyanins in red-
wine grape under high temperature J Experimental Botany Vol 58 (8) 1935-1945
Mori K Goto-Yamamoto N Kitayama M Hashizume K 2007a Effect of high temperature on
anthocyanin composition and transcription of flavonoid hydroxylase genes in ldquoPinot noirrdquo grapes
(Vitis vionifera) J Hortic Sci Biotechnol Vol 82 (2) 199-206
Mori K Saito H Goto-Yamamoto N Kitayama M Kobayashi S Sugaya S Gemma H
Hashizume K 2005a Effects of abscisic acid treatment and night temperatures on anthocyanin
composition in lsquoPinot noirrsquo grapes J Vitis Vol 44 161ndash165
Mori K Sugaya S Gemma H 2005b Decreased anthocyanin biosynthesis in grape berries
grown under elevated night temperature condition J Sci Hortic Vol 105 319ndash330
Movahed N Maeiyat MM 2009 Phytoremediation and sustainable urban design methods (Low
Carbon Cities through Phytoremediation) 45th ISOCARP Congress Disponible en
httpwwwisocarpnet Fecha de consulta 04 Septiembre del 2009
Movahed N Masia A Cellini A Pastore C Valentini G Allegro G Filippetti I 2011
Biochemical approaches to study the effects of temperature on grape composition in cv Sangiovese
The 17th
International GIESCO Symposium Asti Italy The proceeding PP 393- 397
Munneacute-Bosch S Alegre L 2004 Die and let live leaf senescence contributes to plant survival
under drought stress J Funct Plant Biol Vol 31 203-216
Nissim-Levi A Kagan S Ovadia R Oren-Shamir M 2003 Effects of temperature UV-light
and magnesium on anthocyanin pigmentation in cocoplum leaves J Hortic Sci Biotechnol Vol
78 61-64
112
Oren-Shamir M Levi-Nissim A 1997a Temperature effects on the leaf pigmentation of Cotinus
coggygria lsquoRoyal Purplersquo J Hortic Sci Vol 72 425ndash432
Oren-Shamir M Levi-Nissim A 1997b UV-light effect on the leaf pigmentation of Cotinus
coggygria lsquoRoyal Purplersquo J Sci Hortic Vol 71 59ndash66
Oren-Shamir M Nissim-Levi A 1999 Temperature and gibberellin effects on growth and
anthocyanin pigmentation in Photinia leaves J Hortic Sci Biotechnol Vol 74 355ndash360
Palliotti A Poni S Berrios JG Bernizzoni F 2010 Vine performance and grape composition
as affected by early-season source limitation induced with anti-transpirants in two red Vitis vinifera
L cultivars J Aust J Grape Wine Res Vol 16 426ndash433
Pastore C 2010 Reserches on berry composition in red grape agronomical biochemical and
molecular approaches Tesi di Dottorato di ricerca in Colture Arboree ed Agrosistemi Forestali e
Paesaggistici XXII ciclo Faculta di Agraria Universita di Bologna
Pereira GE Gaudillere JP Pieri P Hilbert G Maucourt M Deborde C Moing A Roil D
2006 Microclimate influence in mineral and metabolic profiles of grape berries J Agric Food
Chem Vol 54 6765-6775
Pirie A Mullins M1976 Changes in anthocyanin and phenolics content of grapevine leaf and
fruit tissues treated with sucrose nitrate and abscisic acid J Plant Physiol Vol 58(4) 468-472
Pourcel L Routaboul J M Cheynier V Lepiniec L Debeaujon I 2006 Flavonoid oxidation
in plants from biochemical properties to physiological functions JTrends in Plant Sci Vol 12 (1)
29-36
Price SF Breen PJ Valladao M Watson BT 1995 Cluster sun exposure and quercetin in
Pinot noir grapes and wine AmJ Enol Vitic Vol 46 187-194
Quattrocchio F Baudry A Lepiniec L Grotewold E 2006 The regulation of flavonoid
biosynthesis J The science of flavonoids C Springer Chapter 4 pp 97ndash122
Rebucci B Poni S Intrieri C Magnanini E Lakso A N 1997 Effects of manipulated grape
berry transpiration on post-veraison sugar accumulation J Aust J Grape Wine Res Vol 3 57-65
Reynolds A Price S Wardle D Watson B 1994 Fruit environment and crop level effects on
Pinot noir I vine performance and fruit composition in British Columbia J Am J Enol Vitic Vol
45(4) 452-459
Reynolds A Wardle D 1989 Influence of fruit microclimate on monoterpene levels of
Gewuumlrztraminer J Am J Enol Vitic Vol 40(3) 149-154
113
Ristic R Bindon K Francis LI Herderich M J Iland PG 2010 Flavonoids and C13-
norisoprenoids in Vitis vinifera L cv Shiraz relationships between grape and wine composition
wine colour and wine sensory properties J Aust J Grape Wine Res Vol 16 369ndash388
Ristic R Downey M Iland P Bindon K Francis I Herderich M Robinson S 2007
Exclusion of sunlight from Shiraz grapes alters wine colour tannin and sensory properties J Aust
J Grape Wine Res Vol 13(2)53-65
Robinson S P Davies C 2000 Molecular biology of grape berry ripening J Aust J Grape Wine
Res Vol 6 175-188
Robinson S 2006 Colour and tannin during berry development and ripening In ldquoFinishing the
jobrdquo ASVO proceedings held 21 July 2006 Mildura Vic Australia pp 11-14
Roby G Harbertson J F Adams D A Matthews M A 2004 Berry size and vine water
deficits as factors in winegrape composition anthocyanins and tannins J Aust J Grape Wine Res
Vol 10 100- 107
Rolland F Baena-Gonzalez E Sheen J 2006 Sugar sensing and signaling in plants Conserved
and novel mechanisms J Ann Rev Plant Biol Vol 57 675-709
Romero C Bakker J 2000 Effect of storage temperature and pyruvate on kinetics of anthocyanin
degradation Vitisin A derivative formation and color characteristics of model solutions J Agric
Food Chem Vol 48 2135ndash2141
Sadras V 2007 Evolutionary aspects of the trade-off between seed size and number in crops J
Field crop research Vol 100(2-3) 125-138
Sadras VO Petrie P R Moran M A 2013 Effects of elevated temperature in grapevine II juice
pH titratable acidity and wine sensory attributes Australian Journal of Grape and Wine Research
Vol 19 (1) 107ndash115
Sarni P Fulcrand H Souillol V Souquet J M Cheynier V 1995 Mechanisms of anthocyanin
degradation in grape must-like model solutions J Sci Food Agr Vol 69(3) 385ndash391
Scholefield PB May P Neales TF 1977 Harvest-pruning and trellising of lsquoSultanarsquo vines II
Effects on early spring development Sci Hortic Vol 7123-132
Schultz H R 1995 Grape canopy structure light microclimate and photosynthesis I A two
dimensional model of the spatial distribution of surface area densities and leaf ages in two canopy
systems J Vitis Vol 34 211-215
Schultz H R 2000 Climate change and viticulture a European perspective on climatology carbon
dioxide and UV-B effects Aust J Grape Wine Res Vol 6 2ndash12
114
Schultz H R 2003 Extension of a Farquhar model for limitations of leaf photosynthesis induced
by light environment phenology and leaf age in grapevines (Vitis vinifera L cvv White Riesling
and Zinfandel)J Functional Plant Biol Vol 30(6) 673 ndash 687
Sepuacutelveda G Kliewer W M Ryugo K 1986 Effect of high temperature on grapevines (Vitis
vinifera L) I translocation of 14
C-photosynthates J Am J Enol Vitic Vol 37 (1) 13-19
Shaked-Sachray L Weiss D Moshe R Nissim-Levi A Oren- Shamir M 2002 Increased
anthocyanin accumulation in aster flowers at elevated temperatures due to magnesium treatment J
Physiol Plant Vol 114 559ndash565
Shvarts M Borochov A Weiss D 1997 Low temperature enhances petunia flower pigmentation
and induces chalcone synthase gene expression J Physiol Plant Vol 99 67ndash72
Sipiora M J Gutieacuterrez-Granda M J 1998 Effects of pre-veraison irrigation cutoff and skin
contact time on the composition color and phenolic content of young Cabernet Sauvignon wines in
Spain J Amer J Enol Vitic Vol 49 152ndash162
Smart R E 1985 Principles of grapevine canopy microclimate manipulation with implication for
yield and quality J Amer J Enol Vitic Vol 36 230-239
Smith G J Markham K R 1998 Tautomerism of flavonol glucosides - relevance to plant UV
protection and flower colour J Photochem Photobiol A ndash Chem Vol 118 99-105
Soar C J Collins M J Sadras V O 2009 Irrigated Shiraz vines (Vitis vinifera) up regulate gas
exchange and maintain berry growth in response to short spells of high maximum temperature in the
field J Functional Plant Biology Vol 36(9) 801ndash814
Sparvoli F Martin C Scienza A Gavazzi G Tonelli C 1994 Cloning and molecular analysis
of structural genes involved in flavonoid and stilbene biosynthesis in grape (Vitis Vinifera L) J
Plant Molecular Biology Vol 24 743-755
Spayd S E Tarara J M Mee D L Ferguson J C 2002 Separation of sunlight and
temperature effects on the composition of Vitis vinifera cv Merlot berries J Amer J Enol Vitic
Vol 53171-182
Spelt C 2002 Anthocyanin1 of petunia controls pigment synthesis vacuolar pH and seed coat
development by genetically distinct mechanisms The plant cell online Vol 14 2121-2135
Stafford H A 1990 Flavonoid Metabolism CRC Press Boca Raton FL 298 pp
Stracke R De Vos R C H Bartelniewoehner L Ishihara H Sagasser M Martens
S Weisshaar B 2009 Metabolomic and genetic analyses of flavonol synthesis in Arabidopsis
thalianasupport the in vivo
115
Taureilles-Saurel C Romieu C G Robin J P Flanzy C 1995 Grape (Vitis vinifera L) malate
dehydrogenase II Characterization of the major mitochondrial and cytosolic isoforms and their role
in ripening J Am J Enol Vitic Vol 46 (1) 29-36
Tomana T Utsunomiya N Kataoka I 1979 The effect of environmental temperatures on fruit
ripening on the tree II The effect of temperatures around whole vines and clusters on the coloration
of lsquoKyohorsquo Grapes Japan Soc Hort Sci Vol 48 261-266
Treutter D 2006 Significance of flavonoids in plant resistance a review J Environ Chem Lett
Vol 4 147ndash157
Ubi BW Honda C Bessho H Kondo S Wada M Kobayashi S Moriguchi T 2006
Expression analysis of anthocyanin biosynthetic genes in apple skin effect of UV-B and
temperature J Plant Sci Vol 170 571ndash578
Ushimaru T Maki Y Sano S Koshiba K Asada K Tsuji H 1997 Induction of enzymes
involved in the ascorbate-dependent antioxidative system namely ascorbate peroxidase
monodehydroascorbate reductase and dehydroascorbate reductase after exposure to air of rice
(Oryza sativa) seedlings germinated under water J Plant Cell Physiol Vol 38 541-549
Vaknin H Bar-Akiva A Ovadia R Nissim-Levi A Forer I Weiss D Oren-Shamir M
2005 Active anthocyanin degradation in Brunfelsia calycina (yesterday-today-tomorrow) flowers J
Planta Vol 222 19ndash26
Venturini L 2009 Study of some gene families involved in anthocyanin accumulation during Vitis
vinifera berry ripening Tesi di laurea specialistica in biotechnologie agro-industriali faculta di
scienze matematiche fisichie e naturali Universita degli studi di Verona pp7-12 30-51
Wahid A Perveen M Gelani S Basra SMA 2007 Pretreatment of seed with H2O2 improves
salt tolerance of wheat seedlings by alleviation of oxidative damage and expression of stress
proteins J Plant Physiol Vol 164 (3) 283ndash294
Walker AR Lee E Bogs J McDavid D A J Thomas M R Robinson S P 2007 White
grapes arose through the mutation of two similar and adjacent regulatory genes The Plant journal
for cell and molecular biology Vol 49 772-85
Walker J R Ferrar P H 1998 Diphenol oxidases enzymecatalysed browning and plant disease
resistance J Biotechnol Genet Eng Rev Vol 15 457ndash498
Waterhouse A L 2002 Wine Phenolics Ann NY Acad Sci Vol 957 21-36
Watson RT Rodhe H Oeschger H Siegenthaler U 1990 Greenhouse gases and aerosols
httprivernetncsuedu
116
Welinder K G Justesen A F Kjaeligrsga I V H Jensen R B Rasmussen S K Jespersen H M
Duroux L 2002 Structural diversity and transcription of class III peroxidases from Arabidopsis
thaliana J Eur J Biochem Vol 269 6063ndash6081
Wen Y Zhang Y Pan Q 2009 Progress of organic acids in grape berries Natural science
journal of Hainan University S6631
Williams R J Spencer J P Rice-Evans C 2004 Flavonoids antioxidants or signaling
molecules J Free Radic Biol Med Vol 36 838ndash849
Winkel-Shirley B 2002 Biosynthesis of flavonoids and effects of stress J Current opinion in
plant biology Vol 5 218-23
Winkler A J Cook J A Kliewer W M Lider L A 1962 Development and composition of
grapes General viticulture Berkeley CA University of California Press pp 141ndash196
Xie DY Sharma S B Paiva N L Ferreira D Dixon R A 2003 Role of anthocyanidin
reductase encoded by BANYULS in plant flavonoid biosynthesis J Science Vol 299 396ndash399
Yamane T Jeong S T Goto-Yamamoto N Koshita Y Kobayashi S 2006 Effects of
temperature on anthocyanin biosynthesis in grape berry skins J Amer J Enol Vitic Vol 57 54ndash
59
Yamasaki H Sakihama Y Ikehara N 1997 Flavonoid-peroxidase reaction as a detoxification
mechanism of plant cells against H2O2 J Plant Physiol Vol 115 1405-1412
Yokotsuka K Singleton V L 1997 Disappearance of anthocyanins as grape juice is prepared and
oxidized with PPO and PPO substrates J Am J Enol Vitic Vol 48 (1) 13-25
Yoruk R Marshal R M 2003 Physiocochemical properties and function of plant polyphenol
axidase A review J Food Biochem Vol 27 361-422
Yu D J Kim S J Lee H J 2009 Stomatal and non-stomatal limitations to photosynthesis in
field-grown grapevine cultivars J Biologia Plantarum Vol 53 (1) 133-137
Zsoacutefi Z Vaacuteradi G Baacutelo B Marschall M Nagy Z Dulai S 2009 Heat acclimation of
grapevine leaf photosynthesis mezo- and macroclimatic aspects J Functional Plant Biology
Vol 36(4) 310ndash322
4
23 Agrobacterium tumefaciens strain and culture media 56
231 YEB Medium 56
24 Vectors 57
241 pENTRtradeD-TOPOreg (2580 bp) 57
242 pK7WG20 57
25 Primers 58
26 Plant materials 59
3 METHODS 60
31 Transformation of Escherichia coli by heat shock 60
32 Preparation of competent cells of A tumefaciens 60
33 Transformation of A Tumefaciens by electroporation 61
34 Colony PCR 61
35 Plasmid DNA extraction 61
36 Purification of PCR products 61
37 GATEWAYreg cloning system 61
38 LR Recombination reaction 62
39 TOPO cloning reaction 63
310 RNA extraction and Real time PCR 63
311 Stable transformation of Petunia hybrida 64
3111 Medium I 65
3112 Medium II 65
3113 Medium III 66
312 Agro-infiltration of petunia petals 66
3121 Resuspending buffer 66
313 DNA extraction from Petunia 67
3131 Extraction buffer 67
314 PCR of transformed Petunia genomic DNA 67
3141 Reaction Mix 68
5
3142 Standard thermal cycle 68
315 RNA extraction from Petunia hybrida petal 68
316 cDNA synthesis RT PCR reaction 68
3161 Reaction Mix 69
3162 Standard thermal cycle 69
317 Total anthocyanin measurement 69
318 Heat shock performance 70
319 Guaiacol Peroxidases activity assay 70
4 RESULTS 70
41 Gene selection 71
42 The sequence of the POD1 gene 72
43 Gene transformation 73
44 Heat shock and the plant response 78
5 CONCLUSION 80
Chapter twoEffects of late-season source limitations induced by trimming on grape
composition during ripening in Vitis vinifera cv Sangiovese 81
1 INTRODUCTION 82
2 MATERIAL AND METHODS 83
21 Vegetative and yield data 83
22 Berry sampling 84
23 Analyses of main must biochemical parameters 84
24 Analyses of skin anthocyanins 84
25 Tannins analysis 85
3 RESULTS AND DISCUSSION 86
31 Climatic data 86
32 Vegetative and productive traits 87
33 Ripening analyses Soluble solids pH and Total Acidity 90
34 Anthocyanins accumulation during ripenning 92
6
35 Tannins accumulation during ripenning 95
4 CONCLUSION 99
5 GENERAL CONCLUSION
1
1 GENERAL INTRODUCTION
11 Grape ripening
Grape is a non-climacteric fruit and in non-climacteric fruits ethylene does not appear to have a
major role in ripening Little is known about the factors that regulate the ripening process of grapes
However it seems likely that plant growth substances are involved (Coombe 1992) Grapes exhibit
a double sigmoid pattern of development (Fig 1) with the two distinct phases of growth separated
by a lag phase (Coombe 1992) The ripening phase of grape berry development occurs during the
second period of berry growth and results from expansion of existing pericarp cells (Hardie et al
1996) During the ripening phase a number of major physiological and biochemical changes occur
simultaneously in the grape berry and these determine the quality of the fruit at harvest The onset
of ripening (Veraison) signals the beginning of significant changes in metabolism which include
accumulation of sugar softening of berries synthesis of anthocyanins metabolism of organic acids
accumulation of flavour compounds and changes in the level of growth substances (Fig 1) These
changes are coordinated within each berry but individual berries even those on the same bunch do
not ripen synchronously (Coombe 1992) this results in significant variation between berries even
at harvest This variability represents the significant effect of berry environmental conditions on
berry composition
Fig 1 Schematic representation of grape berry development (Robinson amp Davies 2000)
2
12 Grape berry composition
The dynamic of berry ripening is fundamental to determine final berry composition and as a
consequence grape quality Sugars organic acids and phenolic compounds are the main biochemical
components of grape berry
121 Sugars
Sugar accumulation in grape berries is an important phenomenon degBrix is directly related to the
sugar content (gL) and potential titratable alcohol (vol ) and about 55 of grape berry degbrix
converses to alcohol (Fournand et al 2006) At the beginning of berry development sugars are
produced by the green berries while subsequently berry becomes a typical ldquosinkrdquo organ and uses
carbohydrates produced by photosynthesis of leaves Sucrose produced by leaves is then transported
for long distance to berries into the phloem From veacuteraison xylem flow is almost impeded hence
water may reach berries via phloem with sugars Sucrose the predominant sugar transported in the
phloem accumulates in grape berry in form of glucose and fructose Since at the end of berry
ripening the glucosefructose ratio is approximately equal to 1 the cleavage of sucrose may be
catalysed mainly by invertase (Pastore 2010) The main role of sugars in grape berry is to provide
the carbon skeleton of many compounds (such as organic acids or amino acids) and to be energy
sources for cells By now it is scientifically accepted that sugars play also an important role as
signalling molecules in control of growth and development (Rolland et al 2006)
122 Organic acids
Organic acids are some important flavor compounds in both grapes and wines and the composition
and content of organic acids are closely related to the organoleptic quality of grapes and wine (Wen
et al 2009) Tartaric and malic acids generally represent from 69 to 92 of all organic acids in
grape berries (Kliewer 1966) Small amounts of citric succinic lactic and acetic acids are also
present in the berry While tartaric acid is synthesized until veacuteraison malic acids levels vary highly
during berry ripening As to Dokoozlian 2000 green berries together with leaves are the main
grape organs able to produce organic acids
123 Phenolic compounds
Phenolic compounds of grape are divided into non-flavonoids and flavonoids groups (Robinson
2006)
3
1231 Non-flavonoids
Hydroxycinnamic acids benzoic acids and stilbenes belong to the non-flavonoids group
(Waterhouse 2002)
1231a Hydroxycinnamates
Hydroxycinnamates present in grape berries are derivatives of caffeic p-coumaric and ferulic acids
which are present both in the skin hypodermal cells and in the flesh (Adams 2006) and Caftaric
acid is the predominant hydroxycinnamates in grape (Kennedy et al 2006)
1231b Benzoic acids
Benzoic acids are the minor components in grape berry composition Six derivatives of benzoic
acids (gallic acid protocatechuic acid gentisic acid p-hydroxybenzoic acid vanillic acid and
syringic acid) have been found in grape berry Gallic acid is the major benzoic acid present in grape
berry and it is present in both skin and seeds (Pastore 2010)
1231c Stilbenes
Stilbenes are found in the skin of the grape berry and in vegetative tissues Although stilbenes are
present in low quantity both in berries and wine they have aroused a lot of interest because of their
effects on human health in particular for what concern resveratrol (Bavaresco amp Fregoni 2001)
Resveratrol could exist in different forms in monomeric unit (as dimethylated derivatives trans-
pterostilbene and as in form of 3-O-β-D-glucoside trans- and cis-piceid) or in dimer units
(viniferins) (Gatto et al 2008)
1232 Flavonoids
Flavonoids are a class of plant secondary metabolites which are synthesized from Phenylalanine or
Tyrosine condensed with a malonyl-CoA via the phenylpropanoid pathway This class comprises
more than 6500 known compounds many of which are of great biological and commercial
importance In nature they play important roles in resistance to stresses both abiotic (such as excess
light and high temperature) and biotic (such as resistance to microbes) (Mol 1998 Winkel-Shirley
2002) moreover they are of central importance in the ecological relationships with pollinator
insects and in nodule formation (Downey et al 2006) They comprise both transparent compounds
4
such as the flavanols and brightly coloured ones such as phoblaphenes anthocyanins and
polymeric proanthocyanidins (Robinson 2006) All flavonoids share a common chemical structure
represented by a C15 skeleton (C6-C3-C6) (Fig 2)
Fig 2 Chemical structure of flavonoid molecule (Aron amp Kennedy 2008)
Depending on the position of the linkage of the aromatic ring (B ring) to the benzopyrano moiety (C
ring) we can distinguish the flavonoids (2-phenylbenzopyrans) the isoflavonoids (3-benzopyrans)
and the neoflavonoids (4-benzopyrans) The B ring can further be hydroxylated ortho-
dihydroxylated or vicinal-trihydroxylated (Pastore 2010) Other flavonoids modifications include
methoxylation O-glycosilation of hydroxyl groups or C-glycosilation of flavonoid skeleton carbon
atom Moreover flavonoid glycosides are frequently acylated with aliphatic or aromatic acid
molecules (Aron amp Kennedy 2008) Different classes of flavonoids are commonly detected in grape
such as anthocyanins flavonols and flavan-3-ols (tannins or proanthocyanidins) (Fig 3) Flavonoids
are localized both in berry skin and seeds In particular in hypodermal cells of the skin we can
found tannins flavonol monomeric flavan-3-ols and in red grape anthocyanins
1232a Anthocyanins
Anthocyanins are pigments and represent the major class of flavonoids of the skin of red grape
varieties The anthocyanins commonly found in grape include delphinidin cyanidin petunidin
peonidin and malvidin-3-O-glucosides 3-(6-acetyl) glucosides and 3-(6-p-coumaroyl)-glucosides
In certain grape varieties have been found even traces of peonidin and malvidin 3-(6-caffeoil)-
glucoside Malvidin-3-O-glucoside is the most abundant anthocyanin present in grape
5
Fig 3 Chemical structure of the three main classes of flavonoids present in red grape berry (Adams 2006)
1232b Flavan-3-ols and tannins
Monomeric flavan-3-ols (catechin epicatechin epigallocatechin) are present in the skin at lower
concentrations while they are present at high concentrations in form of polymers within tannins
(proanthocyanidins) Tannins are polymers of different condensed monomers like epicatechin and
epigallocatechin which constitute the chain of the polymers (ldquoextensionrdquo subunits) and catechin
which is present as ldquoterminalrdquo units (Braidot et al 2008) The mean degree of polymerisation
(mDP) which represents the mean length of the tannin chain is of about 28 in berry skin (Bogs et
al 2005)
Flavonoids in the seeds accumulate not only in the external part but even in the inner layers Grape
seeds are the primery source of flavan-3-ols and tannins in grape berries Total tannin content is in
fact higher in seeds than in skin even if seed tannins have a lower mDP The composition of seed
tannins is different comparing to the skin one in so far that in seed tannins generally
6
epigallocatechin is not present and epicatechin gallate is the major constituent of ldquoextensionrdquo
subunits (Adams 2006)
Fig 4This hypothetical condensed tannin is made up of four sub-units catechin epicatechin epigallocatechin
epicatechin gallate The first subunit (catechin) is bound to the second (epicatechin) by an interflavan bond between
carbon 4 of catechin and carbon 8 of epicatechin The first three subunits are referred to as extention subunits and
only the epicatechin gallate has free 4 positions and is thus re-ferred to as a terminal unit (Adams 2006)
1232c Flavonols
Grape and wine contain different classes of polyphenols Flavonols are flavonoids that are found in
higher plants usually in glycosidic forms They are products of the flavonoid biosynthetic pathway
which also give rise to anthocyanins and to condensed tannins in grapevines (Stafford 1990 and
Darne 1993) The main flavonols reported in grape berries are quercetin-3-O-glucoside and
quercetin-3-O-glucuronide (Price et al 1995 Cheynier et al 1986 and Downey et al 2003)
Flavonols are also involved in the stabilization of the flavilium form of anthocyanins in young red
wines through co-pigmentation (Boulton 2001) The highest flavonol concentrations in grapes were
found at flowering followed by a decrease as the grapes increased in size Subsequently a
significant level of flavonol biosynthesis was observed during berry development and the greatest
increase in flavonols per berry can be observed 3-4 weeks post-veraison (Downey et al 2003)
In red grapes the main flavonol is quercetin (mean) 4399) followed by myricetin (3681)
kaempferol (643) laricitrin (565) isorhamnetin (389) and syringetin (322) In white
grapes the main flavonol was quercetin (mean) 8135) followed by kaempferol (1691) and
7
isorhamnetin (174) The delphinidin-like flavonols myricetin laricitrin and syringetin were
missing in all white varieties indicating that the enzyme flavonoid 3hydroxylase is not
expressed in white grape varieties (Mattivi et al 2006)
It is interesting to observe the analogies between the hydroxylation of position 5 which leads to the
formation of the anthocyanidin delphinidin from cyanidin and the flavonol myricetin from quercetin
In addition to this O-methylation of position 3of anthocyanidin cyanidin which leads to the
formation of peonidin corresponds to the O-methylation which converts flavonol quercetin into
isorhamnetin Finally O-methylation of positions 3and 5of anthocyanidin delphinidin which
leads to the formation of petunidin and malvidin corresponds to O-methylation which converts
flavonol myricetin into laricitrin and syringetin (Fig 3)
13 Biosynthesis of flavonoids in red grape berry
Flavonoids are synthesized within the general phenylpropanoid pathway From the same precursors
and towards specific branches these pathways bring to the synthesis of anthocyanins flavonols and
proanthocyanidins (Boss et al 1996) (Fig 5 6) The enzymes involved in flavonoid biosynthesis
are associated at the cytoplasmic surface of the endoplasmic reticulum and represent a multi-enzyme
complex
131 Synthesis of the early products of the phenylpropanoid pathway
1311 PAL
PAL is a key enzyme ubiquitous in plants which catalyzes one of the first steps in
phenylpropanoids biosynthesis (Fig 5) the hydrolysis of ammonia from phenylalanine to produce
cinnamic acid Cinnamic acid is the precursor of all phenolic compounds Recently the subcellular
localization of PAL was found in grape PAL is present in the cell walls secondarily thickened
walls and parenchyma cells of the berry tissues (Chen et al 2006) This enzyme that is a member
of a large gene family has been cloned in many plant species In grape there are probably present
15-20 PAL isoforms (Sparvoli et al 1994)
1312 C4H
The cinnamic acid produced by PAL is converted to p-coumaric acid towards the action of
cinnamate 4-hydrolase (C4H) (Fig 5) C4H belongs to the cytochrome P450 monoxygenases
8
family The enzymes of this family are able to catalyse exothermic reactions that are irreversible In
grape C4H have not yet been cloned but itrsquos known that it is present in the chloroplasts and in the
nucleus of berry tissues (Chen et al 2006)
1313 4CL
One molecule of p-coumaric acid produced by C4H is condensed with an acetil-CoA molecule to
form p-coumaroil-CoA that is the precursor of all the flavonoids (Fig 5) The enzyme which
catalyses this reaction is the 4-coumarate coenzyme A ligase (4CL) 4CL is localized in grape in the
secondarily thickened walls and in the parenchyma cells of the berry pulp vascular tissue (Chen et
al 2006) 4CL belongs to a multi-gene family Itrsquos very interesting to note that the activities of
PAL C4H and 4CL are really correlated and change concomitantly (Chen et al 2006)
Fig 5 The anthocyanin synthesis pathway in plants (Deluc et al 2008)
132 Specific Steps towards flavonoid biosynthesis structural genes involved in flavonols flavan-3-ols
and anthocyanin biosynthesis
1321 CHS
The first enzyme involved specifically in flavonoids biosynthesis is calchone synthase (CHS) (Fig
5 6) CHS catalyzes the condensation of one molecule of p-coumaroil-CoA with three molecules of
malonyl-CoA to produce naringenin chalcone CHS as other enzymes involved in the
9
phenylpropanoid metabolism belongs to a large super-family of proteins the family of type III
Polykethide Synthase
1322 CHI
Naringenin calchone is converted to flavanones (naringenin) to form the flavanoid core towards a
stereo-specific ring closure catalysed by chalchone isomerase (CHI) (Jeong et al 2004) On the
basis of the CHI sequence that doesnrsquot display any detectable homology with other proteins seems
that this enzyme is unique to the plant kingdom (Fig 6)
1323 F3H FLS F3rsquoH F3rsquo5rsquoH
Naringenin is then hydroxylated at position 3 by flavanone 3-hydroxylase (F3H) to form
dihydrokaempferol the flavonols precursor Dihydrokaempferol can be substrate of three different
enzymes which directly bring to the production of the flavonol kaempferol towards the action of
flavonol synthase (FLS) or to the biosynthesis of dihydroquercetin and dihydromyricetin towards
the action respectively of flavonoid-3rsquo-hydroxylase (F3rsquoH) and flavonoid-3rsquo5rsquo-hydroxylase
(F3rsquo5rsquoH) These enzymes catalyse the hydroxylation of the B ring of dihydrokaempferol in 3rsquo or
3rsquo5rsquo positions F3rsquoH activity results in the production of cyanidin-like anthocyanins while F3rsquo5rsquoH
action brings to the production of delphinidin anthocyanins species The cloning of both F3rsquoH and
F3rsquo5rsquoH genes from grape has shown that in grape two copies of F3rsquoH and several copies of F3rsquo5rsquoH
are present in a single chromosome (Bogs et al 2006 Castellarin et al 2006) In flowers of
Petunia Hybrida has been shown that F3rsquoH and F3rsquo5rsquoH can act both on the substrates and products
of F3H (Menting et al 1994) As previously described FLS is the key enzyme in the biosynthesis
of flavonols This enzyme employs dihydrokaempferol dihydroquercetin and dihydromyricetin as
substrates to synthesize the flavonol aglicones (Chua et al 2008)
1324 DFR
FLS directly competes for its substrates with the enzyme dihydroflavonol 4-reductase (DFR) which
catalyses the first step in the conversion of dihydroflavonols to proanthocyanidins or anthocyanins
This point of the biosynthetic pathway is a key regulatory point because it determines the direction
towards flavonols or proanthocyanidins and anthocyanins synthesis DFR is in fact responsible for
the NADPH-dependent reduction at the 4 position of the C ring of dihydroquercetin and
dihydromyricetin to give respectively leucocyanidin or leucodelphinidin (Pastore 2010)
10
1325 ANR LAR LDOX and UFGT
Leucocyanidin and leucodelphinidin are respectively the substrates to the next step of the
proanthocyanidin and anthocyanin biosyntheses which involve either anthocyanidin reductase
(ANR or BAN) and leucocyanidin reductase (LAR) or leucoanthocyanidin dioxygenase (LDOX)
and UDP-glucose flavonoid 3-O-glucosyltransferase (UFGT)
In grape LAR converts leucocyanidin in the flavan-3-ol (+)-catechin with a NADPH-dependent
reduction ANR acts instead on the products of the enzyme LDOX which catalyzes the cyanidin and
delphinidin production from leucoanthocyanidins Then ANR uses these substrates to synthesize
respectively (-)-epicatechin and (-)-epicatechin-3-O-gallate (Gagneacute et al 2009)
As FLS also LDOX belongs to a family of 2-oxoglutarate-dependent oxygenase (Pastore 2010) In
a recent work has been demonstrated that in Arabidopsis Thaliana LDOX could have also a FLS
activity in vivo (Stracke et al 2009) Southern blot experiments conducted on Vitis Vinifera cv Red
Globe have shown that only a single copy of LDOX gene is present in grapevine (Gollop et al
2001) The anthocyanidins cyanidin and delphinidin produced towards the action of LDOX are
then stabilized through the addition of a glucose residue at the 3 position of the C ring This reaction
is catalysed by the enzyme UFGT and allows the anthocyanins transport into the vacuole
UFGT is the key enzyme in anthocyanin biosynthesis because it is expressed only in red skin
cultivars UFGT seems to be present in grape genome as a single copy and it is interesting to note
that its promoter and coding regions have been found also in white cultivar and are similar to the
sequences present in their red-skin sports (Kobayashi et al 2001) The 3-O-glycosilation of
anthocyanin is almost always a prerequisite for further modification as methylation and acylation
1326 OMTs
Methoxyl groups are found in three of the main anthocyanins (peonidin petunidin and malvidin-3-
O-glucoside) This reaction brings to more stable compounds for the methylation of the reactive
hydroxyl groups and the enzymes responsible are O-methyltransferases (OMTs) The first partial
purification and characterization of a methyltransferase catalyzing the methylation of cyanidin-3-
glucoside to peonidin-3-glucoside was performed on a cell suspension of Vitis vinifera cv Gamay
Freaux This enzyme is S-adenosyl-L-methionine (SAM)-dependent and it was shown that it has a
high substrate specificity reacting only with cyanidin and not with delphinidin (Pastore 2010)
11
Fig 6 Diagrammatic representation of the flavonoids biosynthesis pathway Enzymes abbreviation are as given in the
text (Jeong et al 2006)
14 Flavonoid gene expression during berry development
The pattern of flavonoid gene expression (Fig 7) is very different among different organs and
among the different phases of berry ripening Data about the trend in gene expression of some
structural genes of flavonoid biosynthesis in berry skin compared to flesh have been published by
Boss et al in 1996 for red cultivar Shiraz Northern blot analysis of berry skin RNA have shown
that the majority of genes involved in flavonoid biosynthesis are just expressed from flowering to 2-
4 weeks after full bloom and then after veacuteraison Only the expression of the gene UDP Glc-
Flavonoid 3-O-glucosyl Transferase (UFGT) is strictly linked with veacuteraison phase In berry flesh all
the genes analyzed are expressed at lower levels compared to skin except for Phenylalanine
Ammonia Lyase (PAL) and UFGT whose expression was not detectable in the flesh at any stage of
the analysis (Boss et al 1996) The early expression of the genes from CHS to LDOX and FLS
LAR and ANR could be explained by the accumulation of flavonols and tannins in the young berry
12
Regards to the genes encoding anthocyanin modifying enzymes it was demonstrated that the gene
VvF3rsquoH-1 (the only functional isoform identified) is expressed in berry skin of cultivar Merlot
throughout ripening even if its expression decreases 8ndash10 weeks after blooming VvF3H-1
transcripts increase soon after at the onset of veacuteraison and shows a secondary peak of expression
one week before harvest concurrently at the peak of anthocyanin content VvF35rsquoH-1 is instead
weakly expressed during the first stages of berry ripening and the peak of expression is reached
when all berries have turned red Transcripts of the isoforms VvF35H-2-long and VvF35H-2-
medium appear at the onset of veacuteraison and lasted till full ripening while the isogene VvF35H-2-
short was constitutively expressed throughout the ripening (Castellarin et al 2006) In cv Shiraz
both F3rsquoH and F3rsquo5rsquoH transcripts were detected at flowering and in the early stages of berry
ripening but their expression reaches a maximum one week before and a week after veacuteraison
respectively (Bogs et al 2006) Transcriptomic analyses on Shiraz and Nebbiolo grape berries
harvested at different ripening stages have shown that in these varieties the expression of AOMT
follows the same profile AOMT is not expressed before the onset of ripening but after veacuteraison
there is a strong increase in the amount of transcripts during the first weeks and then the expression
decreases and remains constant until harvest (Hugueney et al 2009)
Fig 7 Anthocyanin biosynthetic pathway (Boss et al 1996)
13
141 Regulatory genes of anthocyanin biosynthesis pathway
Among the three classes of flavonoids present in grapevine the regulation of anthocyanins
biosynthesis has been the most studied thanks to the numerous available colour bud sports which
involve alterations in the red or purple berry anthocyanin content Bud sports are usually infrequent
changes in phenotype affecting shoots of woody perennials but colour bud sports are common and
examples in horticultural plants are widespread Alterations in the anthocyanins of a plant can be in
fact very distinct and easily observed and generally have no detrimental effect on the viability of the
plant The molecular basis underlying the appearance of bud sports are not yet well understood
The study of the genes regulating structural genes expression in anthocyanin biosynthesis was at
first done in maize petunia and snapdragon (Davies amp Schwinn 2003) and then full characterized in
Arabidopsis (Broun 2005) From these researches emerged that three different types of transcription
factors play a key roles in regulation of anthocyanin biosynthesis MYB bHLH (basic Helix-Loop-
Helix) and WDR (WD40 repeats) even if the WD40 proteins function seem to be only to assist
MYB and bHLH proteins MYB genes are present in plant genomes as different families The first
experience on MYB genes in grapevine was done on the cultivar Kyoho which belongs to Vitis
labruscana (V Labrusca x V Vinifera) A cDNA library has been constructed with cDNA of ripe
berries and then using random primers designed on maize MYB conserved sequences eight
different grape MYB homologue sequences were identified Among these only four species of
MYB gene can be really identified MYBA MYBB MYBC and MYBD The whole cDNA
sequences of MYBA and MYBB showed the existence of three different species for MYBA
(VlMYBA1-1 VlMYBA1-2 and VlMYBA2) and two for MYBB (VlMYBB1-1 and VlMYBB1-2)
which are different in the nucleotide sequence Transcription analyses revealed that VlMYBA is
only weakly expressed before veacuteraison but immediately after the beginning of anthocyanin
accumulation and berry softening VlMYBA expression rapidly increases VlMYBB expression was
instead detected in all the berry ripening stages analyzed even if also VlMYBB expression increases
after veacuteraison Regards to VlMYBC and VlMYBD these genes seems to be few linked to berry
veacuteraison because the first one is expressed at high levels just at the beginning of ripening and at
veacuteraison the transcription decreases in the case of VlMYBD the expression was detected only in
the early stages of berry ripening The tight relationship between VlMYBA and berry veacuteraison and
anthocyanin accumulation was further confirmed by expression analyses which revealed that
VlMYBA transcripts differentially from the others VlMYB genes identified were detected only in
berry tissues The introduction of VlMYBA1-1 VlMYBA1-2 and VlMYBA2 in embryos causes the
appearance of reddish-purple spots and so the authors concluded that VlMYBA was the
14
transcription factor regulating UFGT expression (Kobayashi et al 2002) The molecular basis of the
regulation of UFGT expression were then confirmed also for Vitis Vinifera and it was shown that
VvMYBA was probably responsible of the ancestral differentiation between red and white cultivar
The white-skinned varieties Italia and Muscat of Alexandria have in fact a GRET1 retrotransposon
inserted in both the alleles of the promoter region of VvMYBA1 gene and this causes the
inactivation of its expression In the grape varieties that have pigmented berry skin at least one
functional VvMYBA1 allele redVvMYBA1 (rVvMYBA1) and one functional VvMYBA2 allele
redVvMYBA2 (rVvMYBA2) have to exist (Walker et al 2007)
In nature the color of grape berry ranges from the lightest pink to the darkest purple tones according
to the amount and quality of anthocyanin accumulated in the berry skin This suggests a polygenic
control of anthocyanin accumulation in Vitis Vinifera despite evidence that the primery
determination of anthocyanin production in berries appeared to be controlled by a single dominant
locus (Barrit amp Einset 1969) Among the 68 unigenes identified a cluster of four VvMYBA genes
(VvMYBA1 VvMYBA2 VvMYBA3 and VvMYBA4) was considered essential to determine the
genetic bases of the quantitative variation of anthocyanin content in berry skin After the
identification of VvMYBA1 the first expression analyses of this gene in grapevine were done by
Jeong et al (2004) on conditioned berry with the aim to alter anthocyanin accumulation The
change in expression levels of VvMYBA1 coincided with the changes in the expression levels of
other tested anthocyanin biosynthetic enzyme genes (CHS1 CHS2 CHS3 CHI1 CHI2 F3H1
F3H2 DFR LDOX and UFGT) and also with the accumulation of anthocyanins in the berry skins
This suggests that the product of VvMYBA1 gene may control the transcription of not only UFGT
but also of other structural genes whose expression increase after veacuteraison
2 Global Warming
Since the beginning of the pre-industrial era around 1750 the atmospheric concentration of
greenhouse gases has increased by about 30 because of the combustion of fossil fuels and changes
in land-use practices Increased atmospheric concentrations of greenhouse gases tend to warm the
atmosphere (Watson et al 1990) The earths climate which has been relatively stable during the
past 10000 years is now changing (Fig 8) The earths surface temperature in this century is
warmer than any other centuries during the 600 years and the last few decades have been the hottest
in this century (Mann et al 1998)
It is clear that global warming will adversely affect human health ecological systems and socio-
economic sectors including human settlements and agriculture (Movahed amp Maeiyat 2009) and
15
particularly viticulture Climate is a pervasive factor in the viability of all forms of agriculture and is
never more important than with the cultivation of grapes for the production of wine (Jones et al
2005) Global warming and viticulture are interrelated processes both of which take place on a
global scale
3 Global warming and viticulture
In the last decades the majority of the worlds highest quality wine-producing regions have
experienced growing season warming trends In these regions future global warming would exceed
a threshold as a result of which the balanced fruit ripening required for existing varieties and wine
styles would become progressively more difficult While improved winemaking knowledge and
husbandry practices contributed to the better vintages it was shown that climate had and will likely
always have a significant role in quality variations (Jones et al 2005)
In northern Europe climate change may produce positive effects on viticulture through introduction
of new varieties (Fig9) higher production and expansion of suitable areas for cultivation
Nonetheless the disadvantages may be an increase in the need for plant protection the risk of
nutrient leaching and the turnover of soil organic matters (Lough et al 1983 Jones et al 2005)
However in southern areas the disadvantages will predominate The possible increase in water
shortage and extreme weather events may cause lower harvestable yields higher yield variability
and a reduction in suitable areas These effects may reinforce the current trends of intensification of
viticulture in Northern and Western Europe and extensification in the Mediterranean and
Southeastern parts of Europe (Lough et al 1983 Jones et al 2005) In general global warming is
projected to have significant impacts on conditions affecting viticulture including temperature
carbon dioxide precipitation increasing demand for irrigation to meet higher evaporation
increasing the incidence of pests and through direct temperature effects on production quality and
quantity and the interaction of these elements (Fraser 2008)
31 The effects of global warming on berry ripening
The maturation of grapevine berries is strongly influenced by the microclimate around the fruit
Global atmospheric warming trend can affect physiological functions involved in fruit maturation
(Jones et al 2005 Mori et al 2007) Acidity anthocyanins and flavonols concentrations in berries
are clearly linked to berry temperature (Haselgrove et al 2000 Bergqvist et al 2001 Spayd et al
2002 Downey et al 2004) while sugar content is strongly influenced by berry transpiration
(Rebucci et al 1997) Daily average temperature at the time of ripening is used to estimate potential
16
temperature impacts on quality Regards to the temperature the specific number of heat units
(degree days DD) that determines rate of berry ripening is typical of each variety In general the
optimum temperature for berry growth and ripening is among 20deg-25degC (Dokoozlian 2000)
The Huglin index enables different viticulture regions of the world to be classified in terms of the
sum of temperatures required for vine development and grape ripening (Huglin 1978) Specifically
it is the sum of mean and maximum temperatures above +10degC (the thermal threshold for vine
development) Different grape varieties are thus classified according to their minimal thermal
requirement for grape ripening For example the HI is 1600 for Riesling and 1900 for Cabernet
Sauvignon (Shultz 2000) (Fig9) As a result of global warming the Huglin index is increasing
(Shultz 2000) (Fig8) so that the average ripening occurs about 1ndash2 months earlier that leads to
degraded fruit and wine quality (Lough et al 1983 Kenny amp Harrison 1992 Butterfield et al
2000 Bindi et al 1996 Jones et al 2005)
Fig 8 Huglin index from 1972 to 2005 (Shultz
2000)
Fig 9 Huglin index for some grape varieties (Shultz 2000)
In general increasing vine temperature may accelerate the rate of some metabolic process even if in
grape it has been demonstrated that above 30degC many metabolic pathways stop or are significantly
reduced (Shaked-Sachray et al 2002 Vaknin et al 2005) Biosynthesis of flavonoids (Fig 7) is
affected by many endogenous and exogenous factors (Jones et al 2005) Among these factors
sitersquos microclimate seems to have the greatest influences on flavonoid content (Downey et al
2006) For instance changes in solar radiation or temperature rise will have a direct impact on grape
composition and thus flavor via alteration of secondary metabolites such as flavonoids amino acids
and carotenoids (Roby et al 2004) Acidity sugar content anthocyanins and flavonols
concentrations in berries are clearly linked to berry temperature (Haselgrove et al 2000 Bergqvist
17
et al 2001 Spayd et al 2002 Downey et al 2004 Rebucci et al 1997) It has been suggested
that light exposure which contribute to higher temperature could control phenols biosynthesis It
could also shift or modify flavonoids composition (Pereira et al 2006 Downey et al 2004
Bucchetti 2004 Guidoni et al 2004 Bucchetti et al 2007 Filippetti 2009 Spayd et al 2002
Haselgrove et al 2000) As to Pastore (2010) late defoliation in grape (that contributes to the
higher light exposure and consequently higher temperature) could decrease titratable acidity In
addition a tendency to decrease in total anthocyanins and modifications in flavonoids composition
such as decrease of cyanidin quercetin and kaempferol and increase of malvidin level was
observed
Among the factors that determine grape wine quality and market value berry skin coloration is one
of the most important factors Grape coloration is attributable to anthocyanin accumulation in the
skin and temperature is an important factor that affects anthocyanin accumulation in grape (Mori et
al 2005b Mori et al 2007 Winkler et al 1962 Jones et al 2005 Kliewer 1970 Buttrose et al
1971 Kliewer and Torres 1972 Yamen et al 2006 Spayd et al 2002) It is reported that high
diurnal temperature generally decrease total anthocyanin amount (Yamane et al 2006 Mori et al
2007a) This effect seems to be particularly significant after veacuteraison and it can be affirmed that high
diurnal temperature generally decreases anthocyanin amount (Winkler et al 1962 Yamane et al
2006 Mori et al 2007a) The results of the stable isotope-labelled tracer experiments to examine
the effect of temperature on the turnover of anthocyanin in the skin indicated that the total
anthocyanin contents were highest in berries cultured at 25degC and lowest at 35degC and confirmed the
loss of anthocyanins in response to high temperature In the berries cultured at 35degC the total
content of 13
C- labeled anthocyanin was markedly reduced while there was no decrease in labelled
anthocyanin content in the skin of berries at 15degC and 25degC (Mori et al 2005)
The results of the study on the effect of temperature on anthocyanin composition has indicated that
the amount of all anthocyanins except malvidin 3-O glucoside was reduced by high temperature
(Romero and Bakkar 2000 Morais et al 2002 Mori et al 2007) In general methoxylation
glycosylation and acylation lead to an increase in the thermal stability of anthocyanin (Jackman and
Smith 1996) High temperature increases the degradation rate of anthocyanins but it has been
assumed that this degradation rate depends on the anthocyanin structure (Jackman and Smith 1996
Sipiora and Gutierrez-Granda 1998 Mori et al 2007) It is reasonable that only malvidin
derivatives which are highly methylated anthocyanins were accumulated and were more stable than
other anthocyanins (Mori et al 2007) The decrease in anthocyanin accumulation under high
temperature may result from factors such as anthocyanin degradation as well as the inhibition of
mRNA transcription of the anthocyanin biosynthetic genes (Mori et al 2007) Temperature might
18
affect not only the synthesis but also the stability therefore the decrease in anthocyanin
concentration at elevated temperatures might result from both decrease in synthesis and increase in
degradation (Shaked-Sachray et al 2002 Vaknin et al 2005)
In Vitis vinifera berries the most important pigments are derived from delphinidin cyanidin
petunidin peonidin and malvidin (Castellarin et al 2006) Although the corresponding
anthocyanins can be formed by the formation of acetic caffeic or p-coumaric acid esters they are
usually formed by the addition of a 3-O glucose It is therefore unsurprising that one of the genes
most up-regulated during the anthocyanin accumulation in grape berries is UFGT (Walker et al
2007) In the flavonoids biosynthesis pathway anthocyanins are the last products of
phenylpropanoid pathway It has been determined that anthocyanins are synthesized from
phenylalanine through an anthocyanin biosynthesis pathway (Fig 7) regulated by enzyme activities
(Hrazdina et al 1984) and gene expressions (Boss et al 1996) Some anthocyanin biosynthetic
pathway genes including a large number of isogenes phenylalanine ammonia lyase (PAL) chalcone
synthase (CHS) chalcone isomerase (CHI) flavanone 3-hydroxylase (F3H) dihydroflavonol 4-
reductase (DFR) leucoantho-cyanidine dioxygenase (LDOX) and UDP-glucose flavonoid 3-O-
glucosyltransferase (UFGT) etc- have been cloned (Sparvoli et al 1994) It has already been
established that in many plants the gene expression of the enzymes involved in anthocyanin
biosynthesis is affected by temperature In general the expression of the anthocyanin biosynthetic
genes was induced by low temperature in different specious (Mori et al 2005b 2007 Yamane et
al 2006 Christie et al 1994 Shvarts et al 1997 Lo Piero et al 2005 Leyva et al 1995 Shaked-
Sachray et al 2002 and Dela et al 2003) Very interesting is also the effect of different night
temperature on anthocyanin biosynthesis Warm night contributes to decrease of anthocyanin
content of grape berry skin The enzymatic activities of PAL and UFGT in the skin of Darkridge
berries grown under high (3030 degC) night temperature conditions were decreased significantly after
veraison (Mori et al 2005 Mazza and Miniati 1993 Kliewer and Torres 1972)
Flavonoids protect plants against various biotic and abiotic stresses Their oxidation reactions only
occur after senescence or an environmental stress This oxidation plays a role in defending the plant
against various biotic and abiotic stresses (Treutter 2006 Buchanan-Wollaston and Morris 2000
Munneacute-Bosch and Alegre 2004) Since grape berries grown under high temperature would receive
oxidative stress (Mori et al 2007) Flavonoids oxidation (eg Anthocyanin degradation) occurs in
order to defend the plant This reaction in plants is mainly catalyzed by polyphenol oxidases
(catechol oxidases and laccases) and peroxidases (Pourcel et al 2006) It was also reported that
among the candidates for anthocyanin degradation enzyme such as polyphenol oxidases (PPOs) and
peroxidases (PODs) peroxidases are involved in active anthocyanin degradation of Brunfelsia
19
calycina flowers (Vaknin et al 2005 Welinder et al 2002) While polyphenol oxidases increased
the rate of anthocyanin degradation in fruit extracts and juices (Kader et al 1997- 1998- 1999 Sarni
et al 1995) PPOs are not likely candidates for degrading anthocyanins in living tissues because of
their location in plastids (Vaknin et al 2005) Peroxidases in vacuoles have also been found in
grape cells and would be involved in anthocyanin degradation in the presence of H2O2 (Calderon et
al 1992) H2O2 levels in plant tissues have been shown to increase in response to heat stress (Dat
et al 1998) Flavonoid-PODs reaction might function as a mechanism for H2O2-scavenging and
therefore plant cell detoxification (Pourcel et al 2006) Gene chips micro ray analysis showed that
grape berries grown under high temperature would receive oxidative stress (since genes encoding
peroxidases and some oxidoreduction enzymes were induced (Mori et al 2007) The indication that
oxidative enzymes are involved in this process is the fact that treatment with reducing agents (such
as glutathione and DTT) and protein synthesis inhibitors (like cycloheximide and anisomycin) both
caused inhibition of anthocyanin degradation (Vaknin et al 2005) In addition the effect of
temperature on fruit foliage and flower pigmentation has shown that fading of Aster flowers color
due to high temperature could be prevented by stabilizing the pigments (Shaked-Sachray et al
2002 Nissim-levi et al 2003 Oren-Shamir and Nissim-levi 1997a 1997b 1999 Vaknin et al
2005) These findings suggest that anthocyanin degradation plays a crucial role in pigment
concentration under low rate of bisynthesis Peroxidase activity is specific and involved in the
pigment degradation (Vaknin et al 2005) Mechanisms of flavonoid oxidation lead to brown
polymers (Pourcel et al 2006 Walker and Ferrar 1998 Yoruk R and Marshall 2003 Jiang et al
2004) The browning of peel of litchi fruits has been correlated with the rapid degradation of red
anthocyanin pigments this process is associated with enzymatic oxidation of phenolics by
polyphenol oxidases (PPO) andor peroxidases (POD) (Jiang et al 2004) Although the effects of
temperature on grape berry composition and particularly on the content of anthocyanins in skins
have been studied intensively (Kliewer 1970 Buttrose et al 1971 Kliewer and Torres 1972
Spayd et al 2002 Mori et al 2005b Yamane et al 2006) the mechanisms responsible for the
poor coloration of berry skin at high temperatures have not been completely understood and no
report has demonstrate the enhancement of anthocyanin degradation due to high temperature in
grape tissues Plant responses to high temperature involve morpho-anatomical physiological
biochemical and molecular changes which sometimes have to occur very rapidly The molecular
response to heat stress involve both the induction of enzymes involved in oxidative stress (as
Peroxidase Superoxide Dismutase Ascorbate Peroxidase Catalase) and Heat Shock Proteins (HSP)
(Wahid et al 2007) As previously reported anthocyanin biosynthesis is inhibited by higher
temperature and this is confirmed by molecular studies High temperature decreased mRNA
20
accumulation of structural anthocyanin biosynthesis genes and MYBA1 in cv Aki Queen (Yamane
et al 2006) In Pinot Noir vines instead the decrease in anthocyanin content due to high
temperature treatment cannot be linked to a decrease in anthocyanin biosynthesis as no significant
differences in gene expression were found These results may contribute to suggest that the
reduction in anthocyanin biosynthesis may be also due to enzyme inhibition or anthocyanin
degradation rather than a transcriptional effect (Mori et al 2007)
4 GENERAL AIMS OF THE THESIS
The present study is mainly focused on wine grape quality with the general aim of evaluating the
impacts of high temperature condition on grape quality From 1950 the majority of the worlds
highest quality wine-producing regions have experienced warming trends in growing season and this
condition is projected to have significant impacts on grape wine production quality and yield In
particular high temperatures after veraison can negatively affect grape composition expecially skin
anthocyanin accumulation in black berry varieties On these bases the present thesis aims to analyse
two trials both on cv Sangiovese which is the most cultivated variety in Italy characterized by
peculiar anthocyanins profile
The first trial is to appraise the effects of high temperature condition on flavonoids (anthocyanins
flavonols and condensed tannins) accumulation and particularly the mechanisms responsible for
lower anthocyanin content in berries ripened under elevated temperature via assessment of the main
berry biochemical compounds during ripening and of the activities of the putative key enzymes
which are involved in anthocyanins biosynthesis (such as UFGT and PAL) and their degradation
like peroxidases and polyphenol oxidases (PODs and PPOs) In addition the expression of some
genes responsible for flavonoids biosynthesis and degradation was assessed via Real time PCR A
further step was developed to recognize the best candidate genes responsible for anthocyanin
degradation under such stress condition throught a biotechnological approach of genes
transformation from grape to Petunia flower via Agrobacterium tumefaciens
Due to global warming in the last decades and in several warm wine regions a too high level of
sugar and subsequent wine alcohol excess low acidity and in black varieties unbalanced phenolic
ripening with insufficient berry skin colour has been shown at harvest The aim of the second trial is
to evaluate the effects of management techniques applied in the field on the canopy in post-
veraison (ie trimming ) on limiting the carbohydrate availability for cluster ripening to slow down
the accumulation rate of soluble solids in berries and to avoid the ldquouncouplingrdquo of sugar
accumulation versus phenolic synthesis during ripening
21
The present work started from the data obtained in a preliminary evaluation in 2009 and both in
2010 and 2011 the quantity and quality of different flavonoids as anthocyanins flavonols and
tannins were measured during ripening in berries of treated and control vines One of the main aims
of the second trial is to evaluate if the evolution of anthocyanins and skin and seed tannins is
conditioned by the rate of sugar accumulation
22
Chapter one First part
Biochemical and molecular approaches to study the effects of temperature
on grape composition in cv Sangiovese (Vitis vinifera L )
23
1 INTRODUCTION
In the last decades the majority of the worlds highest quality wine-producing regions have
experienced warming trends in growing season and this condition is projected to have significant
impacts on grape production quality (Jones at al 2005) The optimum temperature for berry growth
is among 20deg-25degC (Dookozlian 2000) Generally higher temperatures during grape ripening lead
to an increase in the rates of sugar accumulation and organic acid degradation Flavonol content is
reported to be more influenced by UV exposure rather than temperature (Spayd et al 2002) and
little is known about the effects of temperature increase on skin and seed proanthocyanidin
especially when applied after veraison
In black berry varieties grape coloration is due to anthocyanin accumulation in the skin which could
be negatively affected by temperature (Mori et al 2005 amp 2007 Kliewer amp Torres 1972 Tomana
et al 1979) But the mechanism responsible for colour reduction in berry skin at high temperature is
not completely clear While some researches in red table grape have determined that high
temperatures suppressed the expression of anthocyanin biosynthetic genes (Yamane et al 2006)
some other studies (in Cabernet Sauvignon) did not confirm this effect as mRNA accumulation of
anthocyanin biosynthetic genes and enzyme activity of UDP-Glucose Flavonoid Transferase
(UFGT) were not inhibited under high temperature (Mori et al 2007) Therefore it can be
hypothesized that temperature would affect not only the synthesis but also the stability of
anthocyanins (Shacked-Sachray et el 2002 Vaknin et al 2005 Mori et al 2005) and chemical or
enzymatic degradation of anthocyanins can be an answer to high temperature conditions involving
in the second option polyphenol oxidase and peroxidase (Mori et al 2007 Vaknin et al 2005)
Moreover temperature has been shown to have an effect on anthocyanins composition and some
authors suggested a highest thermal stability for the tri-substituted anthocyanins (particularly
malvidin derivatives) due to their chemical structure (Mori et al 2007 Cohen et al 2012)
So it is possible to hypothize different responses to high temperature between distinct grape
cultivars according their peculiar anthocyanin composition
To date no evidence has demonstrated the effects of elevated temperature on anthocyanin
accumulation and composition of cv Sangiovese characterized by monoglucoside anthocyanins
with high percentages of hydroxylated anthocyanins (mainly cyanidine-3-glucoside)
On these bases the aim of the present research is to evaluate the effects of high temperatures on
flavonoids (anthocyanins flavonols and condensed tannins) accumulation during ripening of
Sangiovese berries And in particular the mechanisms responsible for modification of the
anthocyanins content in berries ripened under elevated temperature conditions would be studied via
24
assessment of the activities of the putative key enzymes which are involved in anthocyanins
biosynthesis (such as Phenylalanine ammonium lyase (PAL) and UDP-glucose flavonoid 3-O-
glucosyltransferase (UFGT) and their degradation (like polyphenol oxidases (PPOs) and peroxidases
(PODs) In addition the expression of some genes involved in flavonoids biosynthesis and
degradation would be appraised via Real time PCR
2 MATERIALS AND METHODS
The study was conducted in 2010 and 2012 on respectively five and three years old uniform potted
plants of Vitis vinifera cv Sangiovese The vines grafted on SO4 rootstocks were grown in pots of
30 liter containing a mixture of sand and soil (1 1) In both years before the experiment the
number of shoots was standardized (around 9 shoots in 2010 and 6 in 2012) In addition in order to
have a uniform leaf area in all the vines the tip of each shoot was removed when 20 main leaves
were produced Before veraison (27th of July 2010 and 19th of July 2012) 8 and 12 uniform vines
were selected in 2010 and 2012 respectively on the bases of size of shoots and the bunch number
The selected vines were assigned to the two treatments LT (Low Temperature) and HT (High
Temperature)
In the LT treatment the vines were placed from pre-veraison to harvest in a plastic tunnel where the
minimum temperature was about 17 degC and the mean and maximum air temperatures were
maintained with a cooler below 26deg and 35degC
In the HT treatment the air temperature was similar to the ambient as the vines were distribuited in a
plastic tunnel which was open in the basal part and covered only the canopies to maintain the light
conditions similar to the LT vines In HT tunnel during the experimental period of 2010 the
minimum temperature was about 18deg and the mean air temperature was 26 degC while in 2012 they
were measured to be about 19deg and 28 degC respectively The maximum air temperaure could instead
exceed to 43degC and 44degC in 2010 and 2012 sequentially
Both tunnels were made of polyethylene film (MOP Bologna Italy) that did not alter the spectral
composition of light while the percentage of transmission was decreased by a maximum of 12
within the visible range
All the vines were daily watered automatically and well supplied with nutrients
21 Temperature monitoring
Berry skin temperature was monitored in 10 selected clusters of the plants in low temperature tunnel
(LT) and 10 clusters of the vines in high temperature tunnel (HT) in both years In each of these two
25
treatments temperature data were recorded from one week before veraison of both years until
harvest towards 10 T- type thermocouples (RS component MI Italy) positioned in the sub-cuticle
tissues of berry skin Each probe was then connected to a CR10X data logger (Campbell Scientific
Ltd Leicestershire United Kingdom) registering temperature data every 20 minutes and each one
hour in 2010 and 2012 sequentially The air temperature inside the tunnels were also monitored and
recorded each hour during the same period by air temperature sensors (TL20 3M Milan Italy)
22 Berry sampling
Berry sampling was conducted from 1 week before the veraison to the harvest in both years of the
trial In total 45 berries per each 8 vines and 30 berries per each 12 vines were sampled every 8 and
10 days in 2010 and 2012 respectively The 180 sampled berries for each of the two treatments were
pooled separately and divided into 4 biological replicates of 45 berries each to perform biochemical
and molecular analyses The berries of the first group (15) were weighed and immediately used for
degBrix titratable acidity and pH measurment All the other sampled berries were immediately frozen
in liquid nitrogen and kept in the freezer (-80 degC) until the analyses to evaluate the quality and the
quantity of the anthocyanins and flavonols (10 berries) skin and seed tannins (10 berries) and to
assess the gene expression and the enzymatic activity (10 berries)
23 degBrix titratable acidity and pH
The sampled berries were crushed and the must were sieved and used for degBrix analysis by a
temperature-compensating CR50 refractometer (Maselli Misure Spa PR Italy) Five mL of the
same must were then diluted 7 times with bi-distilled water and used to perform a titration reaction
by a Crison Compact Tritator (Crison Barcelona Spain) with 1N 05 N or 025 N NaOH (Sigma-
Aldrich St Louis MO USA) according to the stage of berry ripening to obtain pH and TA data
(expressed as gl of tartaric acid equivalents)
24 Analyses of anthocyanins and flavonols
The berries of each replication were sampled and weighted before the extraction of anthocyanins
and flavonols Then the skin was carefully removed from the pulp and immerged in 50 mL of
HPLC-grade methanol (Carlo Erba Reagents Milano Italy) and were kept in dark for 24 hours
The day after the extract was separated from the skin residues and conserved at (-20oC) until the
anthocyanins analysis
26
To analyze the total content of each flavonol aglycon an aliquot of 5 mL of the same methanol
extract was completely dried under vacuum To achieve the acid hydrolyzation of flavonols
glucosides the pellet was re-suspended in 25 mL of methanol and 25 mL of 2M Trifluoroacetic
acid (Sigma-Aldrich St Louis MO USA) in milliQ water The reaction was conducted at 100 oC in
a boiling hot water bath with a condenser for 2 hours The reaction product was then completely
dried under vacuum and the pellet obtained re-suspended in 1mL of methanol and was kept at (-
20oC) until HPLC analysis
HPLC separation and quantification of anthocyanins and flavonols were performed on a Waters
1525 instrument equipped with a diode array detector (DAD) using a reversed-phase column
Phenomenex (Castel Maggiore BO Italy) RP18 250 mmx4mm (5microM) with precolumn Either for
anthocyanins and flavonols the eluents used were the following A= HClO4 03 in milliQ water B
= methanol
For anthocyanin analysis the methanol extract was filtered through 022 microm 13mm PTFE syringe-
tip filters (Teknokroma Barcelona Spain) and an aliquot of 270 microL was diluted to final volume of
1mL with the A eluent The binary gradient was the same as reported in Mattivi et al (2006) with
suitable modifications The time for column equilibration was 5 minutes and the injection volume
was 60 microL Separation of the main free anthocyanins was obtained at 43 oC and they were quantified
at 520 nm with a calibration curve with malvidin-3-glucoside (Sigma-Aldrich ST Louis MO
USA)
Hydrolyzed flavonols samples were filtered through 045 microm 13 mm PTFE syringe- tip filters
(Teknokroma Barcelona Spain) directly into liquid chromatography vials Flavonols aglicones
were separated at 40deg C through the linear gradient as reported in Mattivi et al (2006)
The time for equilibration column and the injection volume were the same used for the HPLC-DAD
analyses of anthocyanins Quercetin myricetin and kaempferol were quantified at 370 nm with the
corresponding external standard purchased from Extrasynthese (Genay France)
25 Tannins analysis
To extract proanthocyanidins frozen berries samples (skins and seeds) were ground separately to a
fine powder under liquid N2 01 g aliquots were separated and extracted in darkness in 2 mL screw-
top Eppendorf tubes for 24 hours with 70 acetone containing 01 ascorbate (10 mL) to prevent
oxidation of polyphenols (Kallithraka et al 1995) Samples were then centrifuged (15 min 13000 x
g) and two 400 μL aliquots of the supernatant were transferred to fresh tubes and dried down under
vacuum at 35ordmC for 120 minutes
27
One of them was re-suspended in 100 μL methanol acidified with 1 HCl then neutralized with 100
μL sodium acetate (200 mM pH 75) for the analysis of free monomers The other aliquot
underwent acid-catalyzed cleavage of the proanthocyanidins in the presence of excess
phloroglucinol following the method of Kennedy and Jones (2001) Briefly the dried sample was
re-suspended in 100 μL of phloroglucinol buffer (025 g ascorbate 125 g phloroglucinol 215 μL
conc HCl 25 mL methanol) and incubated at 50ordmC for 20 minutes then neutralized with 100 μL of
sodium acetate (200 mM pH 75) and centrifuged (15 min 13000 x g) A 200 μL aliquot each of
the acetone extract the acetone extract after acid catalyzed cleavage and the residue after cleavage
was then transferred to Sun-broker 250 μL reduced volume HPLC auto-sampler vials Samples were
run on a Waters 1525 instrument equipped with a diode array detector (DAD) using a reversed-
phase column Phenomenextrade (Castel Maggiore BO Italy) RP18 250 mmx4mm (5microM) with
precolumn A separate reversed-phase HPLC method was developed for the cleaved and uncleaved
proanthocyanidin samples reading absorbance at 280 nm Uncleaved samples solvent A 02
phosphoric acid solvent B 41 acetonitrile02 phosphoric acid (gradient of solvent B zero min
0 5 min 10 40 min 10 55 min 17 65 min 19 75 min 19 80 min 100 85 min
100 86 min 0) Cleaved samples solvent A 02 acetic acid solvent B methanol (gradient of
solvent B zero min 1 40 min 1 120 min 30 1201 min 100 125 min 100 126 min
1) For both methods 25 μL of sample was injected and run at 30ordmC with a flow rate of 1 mLmin
Concentrations of free monomers and hydrolysed terminal subunits were determined from standard
curves prepared from commercial standards of catechin epicatechin epigallocatechin and
epicatechin-gallate obtained from Extrasynthese (France) The concentration of extension subunit-
phloroglucinol adducts was calculated from published molar extinction coefficients (Kennedy amp
Jones 2001) The evaluation of skin and seeds tannins was performed only on the samples of the
year 2010
26 Real-time PCR analyses RNA extraction and RNA evaluation
Real-time PCR analyses were performed for four and five selected stages of berry ripening in 2010
and 2012 respectively from beginning of veraison to the end of harvest Total RNA was isolated
from 200 mg and 500 mg in 2010 and 2012 respectively of the powdered berry skin tissue using
spectrumTM
Plant Total RNA kit (Sigma-Aldrich St Louis MO USA) following the manufacturers
protocol One microL of each RNA sample was measured spectrophotometrically to determine RNA
quantity and 260280 and 260230 ratio using a NanoDrop1000 Spectrophotometer (Thermo Fisher
Scientific Wilmington DE USA) Total RNA was treated with 1 U microg-1 RQ1 DNase (Promega
28
Milan Italy) First-strand cDNA was synthesized using 1 microg of RNA 1microL (dT)15 primer (500
microgmL) and 1 U of GoScripttrade reverse transcriptase (Promega) Quantitative RT-PCR was carried
out on a Step One Plustrade (Applied Biosystems Foster City California USA) Each reaction (10
microL) contained 188 nM of each primer 2microL of diluted cDNA (150) 5microL U of Power SYBRreg Green
PCR Master Mix (Applied Biosystems Foster City California USA) Thermal cycling conditions
were 95 degC for 10 min followed by 95 degC for 15 s 55 degC for 1 min for 40 cycles followed by a
melting cycle which contains 95 degC for 15 sec 60 degC for 1 min and 95 degC for 15 sec Each cDNA
sample was analyzed in triplicate Primers pairs for Dihydroflavonol 4-reductase (DFR)
Leucoanthocyanidin dioxygenase (LDOX) and UDP-glucose flavonoid 3-O-glucosyltransferase
(UFGT) were retrieved from literature (Goto-Yamamoto et al 2002) primers for VvMYBA1 were
from Jeong et al (2004) for Leucocyanidin reductase (LAR) and Anthocyanidin reductase (ANR
or BAN) from Bogs et al (2005) and for Peroxidase (POD6 ) from Mori et al (2007) Primers for
Flavanone 3-hydroxylase (F3rsquoHb) Flavonoid-3rsquo5rsquo-hydroxylase (F3rsquo5rsquoHk and F3rsquo5rsquoHi)
Phenylalanine ammonium lyase (PAL) Flavonol synthase (FLS) and Peroxidases (POD1 to POD5)
were newly designed on the original DNA sequences to amplify 150ndash250 bp gene fragments (Table
1)
29
Table 1 Sequence of primers used for Real time PCR amplification
Primer Forward Primer Reverse
DFR 5-GAAACCTGTAGATGGCAGGA-3 5-GGCCAAATCAAACTACCAGA-3
LDOX 5-AGGCTCTACTCTCCAAATGA-3 5-GAAGCTTGAAACACAGACCA-3
UFGT 5-AATCTGAGAGCCCTAAGAGA-3 5-GGTGGTACAAGCAACAGTTC-3
MYBA 1 5-TAGTCACCACTTCAAAAAGG-3 5-GAATGTGTTTGGGGTTTATC-3
LAR 5-TCTCGACATAAATGATGATGTG-3 5-TGCAGTTTCTTTGATTGAGTTC-3
BAN 5-CAATACCAGTGTTCCTGAGC-3 5-AAACTGAACCCCTCTTTCAC-3
PAL 5-ACATACCTAGTGGCACTCTG-3 5-TCGCAGAATCTCGATGGATG-3
F3Hb 5-TCCATCACCAAGTCTTCTAC-3 5-GCGGAGAAGCTGAACATGGA-3
F35Hi 5-CAGACTGCATACGCACTCTG-3 5-ATGCCGGATGGAGTTGAGAT-3
F35Hk 5-CCAGGCCTAGCTACTATATG-3 5-GCATATGGCATGGTGGTAGA-3
FLS 5-CTGCACTATCCAGAGATGAG-3 5-TTGCCGCTTCAACAACAACA-3
POD 1 5-TCTGAGTAAGAGCCCACACACTCT-3 5-GAGACCTGAGCAGATAAATACAAAAATAAA-3
POD 2 5-AAAGTTGTTTGGCTGTGG-3 5-AATCCCTCCAAACAATCA-3
POD 3 5-TGCTCTAAATGCCTGAAAAATG-3 5-ATCATATAGAAAAGTGACAGCAACCT-3
POD 4 5-CAACTTCACACCAACGGGAAA-3 5-GCAGCTGAGCAAGAAATGCTT-3
POD 5 5-TCGGTGAGGAACTCCGATA-3 5-AGCTTCCTTGTCCTCTTCCA-3
POD 6 5-AACTTGAGACACAACAGCATAAATAAATC-3 5-AGGACCAAATCACAGGATGATAAAG-3
ACT 5-ATTCCTCACCATCATCAGCA-3 5-GACGAGCCCCTCCTACTAAAACT-3
30
27 Enzyme assay
27 1 PAL activity assay
The extraction was performed according to the method of Mori et al (2005) with some
modifications The following procedures for protein extraction were conducted at 4deg C For each
replication 02 g of berry skin was ground with a mortar and pestle in liquid nitrogen until a fine
powder was obtained
The skin powder was homogenized with 15 mL of a 100 mM Sodium borate buffer (pH 9)
containing 0075 g of PolyVinyl-PolyPyrrolidone (PVPP) and 100 microL of a 200 mM Dithiothreitol
After incubation in ice for 20 minutes centrifugation was done at (4deg C 15 min 10000 x g)
Then 1mL of the supernatant was desalted by passing through a NAP-10 column (Sephadex G-25
Amersham Biotech) equilibrated with 15 mL of the same buffer
For the analysis of PAL activity the reaction mixture consisted of 05 mL of Phenylalanine and 05
mL of the enzyme solution The assay mixture was incubated in 37deg C for 60 minutes The reaction
was terminated by adding 05 mL of HCl acid (18) The quantity of the product namely Trans-
cinnamic acid was calculated using its extinction coefficient of 9630 M-1
cm-1
at 290 nm One unit
of PAL was expressed as synthesis of 1 mol of Trans-cinnamic acid per minute and PAL activity
was expressed as microkat g-1 protein
27 2 UFGT activity assay
The extraction was performed according to the method of Mori et al (2007) with some
modifications The following procedures for protein extraction were conducted at 4 oC For each
replication (02 g) of berry skin was ground with a mortar and pestle in liquid nitrogen until a fine
powder was obtained The skin powder was homogenized with 13 mL of a 250 mM TRISndashHCl
buffer (pH 75) containing 10 mM Polyethylene glycol 3400 150 microL of 10 mM Na-
diethyldithiocarbamate 15 microL of 200 mM Dithiothreitol and 2 microL of 2-mercaptoethanol and was
incubated for 20 min on ice After centrifugation of the homogenate at 10000 x g for 20 min The
supernatant was passed through a NAP-10 column (Sephadex G-25 Amersham Biotech)
equilibrated with a 15 mM TRISndashHCl buffer (pH 75)
The desalted crude extract was used as the enzyme solution in the following enzyme assay using
delphinidin and cyanidin as substrates The method of Mori et al (2007) was employed with some
modifications for the analysis of UFGT activity For the first assay the reaction mixture consisted of
02 mL of the previous extraction solution (containing TRISndashHCl buffer (pH 75) Polyethylene
glycol 3400 Na-diethyldithiocarbamate Dithiothreitol and 2-mercaptoethanol) 50 microL of 1mM
31
Cyanidin 50 microL of 100mM UDP-glucose and 02 mL of the enzyme solution The assay mixture
was incubated for 5 min at 37deg C The reaction was terminated by adding 150 microL of 5 HCl The
quantity of the product namely Cyanidin-3-glucoside was measured using its extinction coefficient
of 26900 M-1
cm-1
(at 520 nm pH 1)
Therefore one unit of UFGT was defined as the production of 1 mol of Cyanidin-3-glucoside per
second and UFGT activity was expressed as pkat g-1 protein
For the second assay the reaction mixture consisted of 02 mL of the same extraction solution
(containing TRISndashHCl buffer (pH 75) Polyethylene glycol 3400 Na-diethyldithiocarbamate
Dithiothreitol and 2-mercaptoethanol) 50 microL of 1mM Delphinidin 50 microL of 100mM UDP-glucose
and 02 mL of the enzyme solution The assay mixture was incubated for 5 min at 37deg C The
reaction was terminated by adding 150 microL of 5 HCl The quantity of the product namely
Delphinidin-3-glucoside was measured using its extinction coefficient of 26000 M-1 cm-1 (at 520
nm pH 1)
Therefore one unit of UFGT was defined as the production of 1 mol of Delphinidin-3-glucoside per
second and UFGT activity was expressed as pkat g-1 protein
27 3 Guaiacol PODs activity assay
Guaiacol PODs were assayed as described by Ushimaru et al (1997) using pyrogallol as the
electron donor for the reaction The plant material (skin) was extracted in cold buffer (200 mM
sodium phosphate 5 mM sodium EDTA 1 PVPP pH 70) and incubated on ice for 30 min After
centrifugation at (10000 times g 30 min 4 degC) the desalted supernatant was used for the assay The
reaction mixture (25 mL) included 22 mL of the 10 mM sodium phosphate buffer pH 70 100 microL
of the 25 mM H2O2 50 mM pyrogallol and 100 μl extract H2O2 and pyrogallol were prepared
fresh just before use Absorbance (λ=430 nm) was taken after 5 min incubation at room temperature
and referred to a blank with no extract added One unit of Guaiacol peroxidases is defined as the
amount of enzyme that catalyzes the oxidation of 1 μmol of pyrogallol per minute under the
conditions described by Chen and Asada (1989) and PODs activity was expressed as kat g-1 skin
fresh weight An absorbance coefficient of 247 mM-1 cm-1 was assumed for calculations
27 4 PPOs activity assay
PPOs were assayed as described by Ushimaru et al (1997) using pyrogallol as the electron donor
for the reaction The plant material (skin) was extracted in cold buffer (200 mM sodium phosphate
5 mM sodium EDTA 1 PVPP pH 70) and incubated on ice for 30 min After centrifugation at
32
(10000 times g 30 min 4 degC) the desalted supernatant was used for the assay The reaction mixture
included 28 mL of the 100 mM sodium phosphate buffer pH 70 1 mM pyrogallol and 100 μl
extract the pyrogallol was prepared fresh just before use Absorbance (λ=430 nm) was taken after 5
min incubation at room temperature and referred to a blank with no extract added One unit of
Polyphenol oxidases is defined as the amount of enzyme that catalyzes the oxidation of 1 μmol of
pyrogallol per minute under the conditions described by Chen and Asada (1989) and PPOs activity
was expressed as kat g-1 skin fresh weight An absorbance coefficient of 247 mM-1 cm-1 was
assumed for calculations
28 Vegetative and Yield measurements
In both years immediately after harvest all the leaves of each vine of the both tunnels were
removed and their areas were measured using a leaf area meter (LI3000 LiCor Inc Lincoln Neb
USA) along with the number of nodes of each single shoots
The grape bunches were harvested when the total soluble solids of berries had reached to
approximately 22 o
brix All bunches were removed counted and weighed in both treatments to
determine the yield of each vine
29 Statistical analyses
Data were submitted to analysis of variance and means were separated by the Student-Newman-
Keuls test by SAS statistical software (SAS Institute Cary North Carolina USA) The experiments
were conducted with four replications from each treatment and the values were the means of four
replications
3 RESULTS AND DISCUSSION
31 Berry Temperature
The berry temperature in both tunnels was influenced by the two air temperature regimes (HT and
LT) The average berry temperature in the LT tunnel during the ripening period of 2010 was
recorded to be about 20 oC while it was about 24deg C in HT In 2012 the average berry temperature in
both treatments were recorded to be about 2deg higher than in 2010
The maximum berry temperature in both years showed the highest differences between the two
treatments as it was maintained below 35 degC in LT and it might exceed to 42 degC in correspondence
of several heat weaves during the ripening in HT (Fig10)
33
The analyses of the number of hours exceeding the 30 and 35degC showed significant higher values in
both years in HT than in LT (Table 2 ) In particular the number of hours over 35deg C was null in LT
berries while it was about 70 and 157 hours in HT berries in 2010 and 2012 respectively Moreover
despite between the two years only few differences were found in mean and maximum berry
temperatures 2012 berries spent more hours at high temperature than in 2010 regardless from the
different treatments and the temperature fluctuations were higher during the ripening period of 2010
(Table 2) In addition in 2010 the percentage of the average berry temperature more than 30 degC
was about four folds more in the HT tunnels as compared to LT one while in 2012 this percentage
was six folds higher
Fig 10 The average and maximum daily berry temperature (oC) grown under high and low temperature conditions
during ripening in 2010 and 2012
34
Table 2 The percentage and the number of hours that the average of berry temperature was higher than 30deg and 35degC
in both treatments during the experimental period in the years 2010 and 2012
Total
experimental
time
(Ndeg hours)
Average berry
temperaturegt
35 degC
(Ndeg hours)
Average berry
temperature gt
30 degC
(Ndeg hours)
Average berry
temperature gt
35 degC
()
Average berry
temperature gt
30degC
()
Treatment Year
1176 hr 70hr 192 hr 6 163 HT 2010
0 55 hr 0 47 LT
1257 hr 157 hr 392 hr 1250 31 HT 2012
0 91 hr 0 7 LT
32 Leaf area and Yield
The plant materials used in this trial were not the same in the two years In 2010 and 2012
respectively five years old and three years old uniform potted vines were used for the treatments
Therefore the comparison could be done only between the treatments in each year and the year
effect would not be considered
In both years before the experiment the vines were uniformed for the number of shoots and clusters
in both treatments But the main lateral and total leaf areas per vine were significantly higher in LT
vines respect to HT (Table 3)
In 2010 the yield and its components were not significantly different between the LT and the HT
vines (Table 4) while in 2012 the yield was 36 more in LT as compared to HT ones Since the
cluster number per vine and the berry weight were similar in this year this result is mainly due to a
higher number of berries per cluster which imply that the cluster weight was higher in LT vines
(Table 4)
It seems that the higher temperature in HT may be responsible for drying out the basal leaves in HT
at the end of ripening and these conditions which have been assessed also by visual observation
caused a lower average leaf area compared to LT as the leaf area estimation was assessed after
harvest Besides the warmer condition of 2012 has been contributed to drop of some berries due to
the dehydration and drought in the very last period of ripening in HT Based on these
considerations it is likely that HT thermal condition did not show negative physiological effect on
vegetative growth and yield as the treatment was imposed at veraison and we registered a
ldquosecondaryrdquo effect due to the leaves and berry drop in the very last part of ripening
35
Table 3 Leaf area of grapes grown under high (HT) and low (LT) temperature conditions during ripening of the years
2010 and 2012
Year Treatments
Main Leaf area
(cm2vine)
Lateral Leaf area
(cm2vine)
Total leaf area
(cm2vine)
2010 LT 117425 105785 22321
HT 71682 80629 152311
2012 LT 13460 5690 19150
HT 6715 3742 10457
Table 4 Yield and yield components of grapes grown under high (HT) and low (LT) temperature conditions during
ripening of the years 2010 and 2012
Year Treatments No Cluster
Vine
Yield
Vine
(gr)
Cluster
weight
(gr)
Berry weight
(gr)
Berries per
cluster
(n)
LA Yield
per vine
(cm2 gr)
2010 LT 11 16666
1515
24 63 134
HT 12 18245
1520 21 72 835
ns ns ns ns ns
2012 LT 6 8616
1436
22 65 222
HT 5 5355 1071 21 51 196
ns ns ns
36
33 oBrix pH Titratable acidity
The results indicated that in 2010 a similar trend in the percentage of Total Soluble Solids in berries
grown under low and high temperature was measured and no significant differences was observed
among the two treatments in titratable acidity (TA) and pH However in 2012 the advanced ripening
in HT grapes was associated with higher level of oBrix during ripening nevertheless they reached
the same level at harvest Moreover it seems that the elevated temperature contributed to
degradation of titratable acids and increase in pH (Fig 11) There are contradictory reports on the
effects of high temperature on sugar accumulation in grape during different stages of berry
development Several papers (Matsui et al 1986 Sepuacutelveda and Kliewer 1986 Kliewer et al
1977) reported a general delay in ripening which is attributed to the impact of heat on the
photosynthetic supply of sugar Photosynthesis of grapevines is reduced at temperatures above 35 oC
(Kriedemann 1968 Ferrini et al 1995 Schultz 2003 Yu et al 2009 Zsoacutefi et al 2009) and
generally the restrictions to photosynthesis are caused by stomatal limitation As to Sepuacutelveda et al
(1986) prevention of the soluble sugar accumulation in berries by high temperature cannot be
accounted for an inhibition of the phloem transport between the leaves and the bunchs In contrary
Soar et al (2009) reported an increase in photosynthesis and stomatal conductance when Shiraz
vines were heated for short periods Moreover in some other researches sugar accumulation was not
influenced by temperature increase (Yamane et al 2006 Greer and Weston 2010)
In general tartaric acid concentration decrease after veacuteraison is mainly due to a dilution effect since
berry volume increase and amount of tartrate remains constant So far no enzymes degrading
tartaric acid have been ever found in grape In contrast the decrease in malic acid amount at the
beginning of ripening is associated with respiration and enzyme degradation as well as dilution
effect Malic acid may be therefore transformed to hexoses or used as energy source Metabolic
changes occurring during grape berry development (Taureilles-Saurel et al 1995) together with
light and temperature are the main parameters controlling the malate synthesisdegradation rate
Grape berries malic acid concentration at harvest is negatively correlated with temperature during
the ripening period It has been demonstrated that the optimum temperature range for acids synthesis
is between 20degC and 25degC and that with increasing temperature synthesis of malic acid decrease
and catabolic rate accelerate (Kliever et al 1967) These results are in accordance with the results of
this study and what was observed on the effects of elevated temperature in Cabernet Franc and
Chardonnay grapes where the pH increased and TA decreased Also the effects of higher
temperature induced by veraison defoliation had similar effects on pH and titratable acidity due to
the malic acid degradation (Guidoni et al 2004 Pastore 2011)
37
Fig 11 The trend of oBrix titratable acidity and pH of grapes grown under high (HT) and low (LT) temperature
conditions during ripening of the years 2010 and 2012
34 Biosynthesis of flavonoids
34 1 Anthocyanins accumulation during ripening
In both years the anthocyanin level in the skin of Sangiovese (Fig 12) started to increase after
veraison until harvest in both treatments Nonetheless in HT berries was significantly reduced
respect to LT ones As an illustration in 2010 the level of total anthocyanin at harvest was decreased
about 65 in the skin of the grapes grown under high temperature conditions as compared to LT
and at the harvest time of the year 2012 this reduction was 50 In agreement with the results on
other grape varieties (Darkridge grape Cabernet Sauvignon Tokay Japanese table grape Kyoho
Mori et al 2005 amp 2007 Kliewer amp Torres 1972 Tomana et al 1979) we found that in
38
Sangiovese high berry temperature (over 35degC) after veraison prevented anthocyanin formation in
grapes and greatly reduced the coloration as compared to fruits ripened at lower temperatures
According to HPLC analysis of the both years as expected the major individual anthocyanin in the
berry skin of both LT and HT treatments was malvidin-3-glucoside (Fig 12)
Anyway no differences in anthocyanin profiles were recorded at harvest between HT and LT grapes
in 2010 (Table 5) In 2012 at harvest the percentage of malvidin -3-G was higher in LT compared to
HT (Table 5)
Previous studies on Cabernet Sauvignon reported the higher thermal stability of malvidin-
derivatives anthocyanins due to the high level of methoxylation and acylation (Mori et al 2007
Romero and Bakker 2000 Morais et al 2002) but it is in contrast to our findings in this respect on
Sangiovese It has to be noticed that in Sangiovese the anthocyanin composition is quite different
from Cabernet Sauvignon and it is characterized by the high level of cyanidin-3G and by the
absence of p-coumarated and acetated malvidin derivatives anthocyanins
From the data of our two-year trials it is not possible to confirm the differences in thermal stability
of the five monoglucoside anthocyanins of Sangiovese based on their chemical structure And by
assessing solely the anthocyanins quantity and profile it was not possible to understand if the
reduction of anthocyanins under high temperature is due to biosynthetic activity reduction or to a
mechanism of anthocyanins degradation Therefore additional analyses were required in order to
obtain more comprehensive information about this issue
39
Fig 12 The trends of total and individual anthocyanins concentrations in the skin of Sangiovese berries grown under high (HT)
and low(LT) temperature conditions during ripening in the years 2010 and 2012
40
Table 5 The anthocyanin profiles at harvest in the skin of Sangiovese berries grown under high (HT) and low (LT)
temperature conditions during ripening in the years 2010 and 2012
Anthocyanin profile at harvest
Malvidin-3-G Petunidin-3-G Delphinidin-3-G Peonidin-3-G Cyanidin-3-G
2010 LT 36 13 11 18 22
HT 41 13 11 18 17
ns ns ns ns ns
2012 LT 43 14 11 16 16
HT 33 16 14 16 21
ns ns ns ns
34 2 Flavonols accumulation during ripening
In the both years the levels of flavonols in HT and LT berries increased gradually after veraison
and significant decrease was observed in the level of total and individual flavonols in HT berries as
compared to LT ones in 2012 (Fig 13)
In general the highest level of flavonols in grapes was found at flowering followed by a decrease as
the grapes increased in size Subsequently a significant level of flavonol biosynthesis is in general
observed during berry development and the greatest increase in flavonols per berry can be detected
3-4 weeks post-veraison (Downey et al 2003)
Flavonols accumulation in wine grape tissues has been studied extensively While several authors
reported a solid correlation between fruit light exposure and flavonol glucosides content (Price et al
1995 Haselgrove et al 2000 Spayd et al 2002) the effect of temperature on flavonol synthesis is
not understood completely Spayd et al (2002) and Mori et al (2005) did not observe any effect of
temperature treatment on flavonol synthesis To the contrary the inhibitory effect of high
temperatures on flavonol was also reported by Goto-Yamamoto et al (2009) Since in our research
we excluded the effect of different light exposure between the two treatments the lower
accumulation of flavonols in HT berries is probably due to a regulatory mechanism which rules the
anthocyanins response to high temperature condition
41
Moreover the analyses of each flavonol compound at harvest (quercetin kaempferol and myricetin
showed as expected that quercetin has the highest percentage The flavonols profiles at harvest in
the skin of Sangiovese berries grown under high and low temperature conditions during ripening
were similar in the year 2010 but it was significantly different among the treatments in 2012 (Table
6)
Fig 13 The trends of total and individual flavonols concentrations in the skin of Sangiovese berries grown under high
(HT) and low (LT) temperature conditions during ripening in the years 2010 and 2012
42
Table 6 The flavonols profiles at harvest in the skin of Sangiovese berries grown under high (HT) and low (LT)
temperature conditions during ripening in the years 2010 and 2012
Flavonols profile at harvest
Quercetin Kaempferol Myricetin
2010 LT 746 68 186
HT 735 75 189
ns ns ns
2012 LT 668 36 296
HT 642 26 332
34 3 Tannins accumulation during ripening
Tannins assessment was done in 2010 In this trial regardless from the treatments the amount of
total and individual tannins of seed and skin decreased generally from veraison to harvest This
result is in accordance with the previous works conducted by Harbertson et al (2002) Adams
(2006) and Kennedy et al (2001) From this research emerges that the two temperature regimes did
not affect the tannins branch of flavonoid biosynthesis This is comprehensible considering that
tannins are accumulated very early in berry development and the decline in their concentration from
veraison to harvest only reflects the quantitative changes that take place during berry ripening
(decrease of the tannins concentration in proportion to berry growth)
43
Fig 14 The trends of total and individual tannins concentrations in the berry seed and the skin of Sangiovese berries
grown under high (HT) and low (LT) temperature conditions during ripening in 2010
44
35 Gene expression assessment
In the present study the expression of some genes involved in the general flavonoid biosynthetic
pathway (PAL F3rsquoHb F3rsquo5rsquoHk F3rsquo5rsquoHi DFR LDOX) and the specific genes for anthocyanins
(UFGT and VvMYBA1) flavonols (FLS) and tannins biosynthesis (LAR BAN) were studied in
berries grown under two different temperature regimes (Fig 15)
In HT berries a strong reduction of anthocyanins and flavonols concentration and no effect on tannin
biosynthesis was observed and this seems to be directly related to the general inhibition of the
expression of flavonoids biosynthetic genes detected in this research (Fig 15) Furthermore it was
interesting to observe that even if the response in terms of total flavonoid accumulation was
comparable in 2010 and 2012 the flavonoid composition and the expression profile of some of the
analyzed genes was quite different between the two years of the experiment (Fig 15 Fig 16 Table
5 and 6)
The profile of PAL gene expression was mainly similar in the both years starting to increase in the
both treatments about 15 days after veraison PAL gene seemed to be repressed by high temperature
as a considerable higher level of expression in LT berries in respect to the HT ones was recorded in
both years about 37 days after veraison even if in 2010 it was not significantly different between the
two treatments This result is in agreement with many papers in which a direct correlation between
enhanced flavonoid accumulation (in particular anthocyanins) and increase in PAL gene expression
is reported (Pastore et al 2011 Ageorges et al 2006 Ban et al 2003 Roubelakis-Angelakis and
Kliewer 1986)
F3rsquo5rsquoHs and F3rsquoHs are versatile enzymes that are able to accept several phenylpropanoid substrates
and competitively control the synthesis of cyanidin- and delphinidin-flavonoid derivatives Two
isoforms of F3rsquoHs have been detected in grapevine genome until now (Castellarin et al 2006) In
this research the transcription of F3rsquoHb showed different profile of expression between the two
years of the trial In fact the transcription level of F3Hb was not affected or even induced by high
temperature 20 days after veraison in 2010 but we found exactly an opposite result in 2012 where
in LT berries a significant increase in F3rsquoHb expression was recorded 33 days after veraison in
comparison to HT
Studying the expression of F35Hi and F3rsquo5rsquoHk genes we observed that they were affected by high
temperature during ripening in both years showing similar transcription profiles Starting from full
veraison when all berries have turned red F3rsquo5rsquoHi expression increased in LT berries reaching a
maximum from one to two weeks after veraison in both 2010 and 2012 Also F3rsquo5rsquoHk expression
showed an increase in LT berries about 7 days after veraison in 2010 in comparison to HT and a
strong enhancement on F3rsquo5rsquoHk expression was observed in LT berries in 2012 (Fig 15) Sixteen
45
copies of F3rsquo5rsquoHs are present in the grapevine genome (Falginella et al 2010) suggesting a possible
role for each of them in different developmental and environmental conditions
The different patterns of expression observed for F3rsquoHb and F3rsquo5rsquoHs could suggest that the former
may be less sensitive in comparison to the latter to critical temperature conditions Considering that
the berry temperature in HT tunnel was higher in 2012 than 2010 (Table 2) it seems that F3rsquoHb is
able to tolerate thermal stress when temperature higher than 35degC are imposed for short periods as
in 2010 whereas in 2012 when HT berries spent more than two-fold hours at temperature higher
than 35degC in comparison to 2010 the F3rsquoHb expression is repressed From this study emerges that
at transcriptomic level the intensity and the extent of thermal stress could not affect in equal manner
the transcription of the gene that preside over the 3rsquo4rsquo- and 3rsquo4rsquo5rsquo-OH flavonoid biosynthetic
pathway in Sangiovese grape berry
In this research DFR and LDOX genes exhibited different patterns of expression in 2010 and in
2012 reaching maximum values in LT compared to HT 5 days after veraison in 2010 and 28 days
later in 2012 thus showed an expression pattern independent from the trend of anthocyanins
flavonols and tannins accumulation and from the timing of the temperature increase application
Our results are in agreement with previous findings reported that the expression of neither DFR nor
LDOX was as strongly correlated as UFGT and VvMYBA1 with anthocyanin content (Castellarin et
al 2007) and it is comprehensible if we consider that they can produce substrates for other branches
of flavonoid biosynthesis
Instead of that a strong correlation was found as expected in the expression of UFGT and of its
main transcription factor VvMYBA1 with the higher anthocyanins accumulation in LT vines
comparing to HT
Flavonol synthesis involves several genes encoding flavonol synthases (FLS) which are biosynthetic
enzymes converting dihydroflavonols to flavonol (Downey et al 2003) In both years the
expressions of FLS gene were similar between LT and HT berries in the early stages suggesting a
small effect of high temperatures on the transcription of this gene during veraison However FLS
started to be significantly higher in LT berries from mid of ripening and in 2012 a similar trend was
registered excepted at harvest when a significantly higher expression of FLS was registered in HT
(Fig 16)
Among the enzyme involved in tannins synthesis leucoanthocyanidin reductase (LAR) produces
catechin while anthocyanin reductase (BAN) converts cyanidin and delphinidin into epicatechin
and epigallocatechin respectively (Xie et al 2003 and Adams 2006 Fig 17) Bogs et al (2005)
found that in grape LAR is encoded by two closely related genes (LAR) whereas BAN enzyme is
46
encoded by a single gene (Fig17) As LAR1 appeared to be seed specific (Bogs et al 2005) only
LAR2 and BAN were analyzed in this study in 2010 In general timing and expression of BAN and
LAR2 genes is consistent with the accumulation of proanthocyanidins in the berry (Adams 2006)
This was further confirmed in this research where tannins analyses conducted on berry skin in 2010
showed no differences in terms of concentration and composition and as expected no differences
were found in the transcription of LAR2 and BAN during ripening
To better understand how the differences in gene expression could have or not influenced the
anthocyanins and flavonols composition also the timing and the coordination of flavonoid
biosynthetic genes has to be considered separately for the two years
In 2010 we detected a lack of variation in anthocyanins flavonols and tannins composition
following LT and HT treatment Following the treatment a coordinated transcription of F3rsquoHb
F3rsquo5rsquoHi F3rsquo5rsquoHk DFR LDOX UFGT and MybA1 was detected in LT berries which all reached a
maximum of expression 7 days after veraison (DAV) In HT the situation was quite different as for
F3rsquoHb and LDOX we found the highest expression 20 DAV when the transcription of DFR and
UFGT was already strongly reduced This shift and lack of synchronization could have hampered in
2010 the increase in the accumulation of 3rsquo4rsquo-OH flavonoids derivatives in comparison to LT
nevertheless the stability of F3rsquoHb transcripts detected in HT berries
In 2012 we found a statistically significant increase in malvidin and quercetin percentages in LT
berries in comparison to HT The concomitant stronger upregulation of F3rsquo5rsquoHi and F3rsquo5rsquoHk
starting from veacuteraison in LT compared to HT berries has to contribute to the increase in malvidin
concentration in LT berries in the second year of the trial Moreover in the same stage of berry
ripening also an increased expression of F3rsquoHb was recorded in LT berries and therefore the
biosynthesis of 3rsquo4rsquo-OH flavonoids should have been enhanced too Differently from what was
previously discussed for 2010 DFR and LDOX maximum expression was delayed in comparison to
the recorded peak of transcription for UGFT and VvMybA1 in both treatments It has to be
considered that FLS directly competes for its substrates with the enzyme DFR because they share
dihydroflavonols as the common substrates On this base probably there was a competition between
the biosynthesis of flavonols and anthocyanins in the both treatments but that contemporary
increase in the expression of F3rsquoHb DFR and FLS led to the rise of quercetin accumulation in LT
berries as compared to HT
47
Fig 15 Mean normalized expression of the genes involved in flavonoid biosynthetic pathway in berries grown under
high(HT) and low(LT) temperature conditions during ripening in 2010 and 2012
48
Fig 16 Mean Normalized expression of the FLS genes involved in flavonol biosynthesis in berries grown under
high(HT) and low(LT) temperature conditions during ripening in 2010 and 2012
Fig17 The mean normalized expressiom of the LAR and BAN genes in berries grown under high (HT) and low (LT)
temperature conditions during ripening in 2010
36 Activity of biosynthetic enzymes PAL and UFGT
In general the activity of PAL enzyme in both LT and HT berries increased gradually during
ripening but was considerably lower in HT plants in all sampling data from the end of full veraison
to harvest (Fig 18) This result is in agreement with the higher expression of PAL genes assessed in
LT berries
Using delphinidin and cyanidin as substrates in both years the activity of UFGT enzyme showed an
increasing trend from the end of full veraison to harvest in both LT and HT berries (Fig 19)
nonetheless a strong reduction was observed in HT plants compared to the LT ones during ripening
Also irrespective from thermal conditions UFGT activity at veraison was higher for cyanidin
compared to delphinidin as substrate (Fig 19) and this could be related to earlier expression of the
F3rsquoH genes (starting after full bloom) compared to the expression of the F3rsquo5rsquoH genes which begin
after veraison Basically these results confirmed the negative effects of high temperature on
anthocyanin biosynthesis at least for PAL and UFGT enzyme activities which showed a strong
correlation with anthocyanin concentration and confirmed to be the key enzymes of anthocyanin
biosynthesis pathway (Hrazdina et al 1984 Mori et al 2005 Boss et al 1996)
49
Fig 18 The trends of PAL activity (in one minute) in the skin of Sangiovese berries grown under high (HT) and low(LT)
temperature conditions during ripening in the years 2010 and 2012
Fig19 The trends of UFGT activity (Using cyanidin and delphinidin as substrate) in the skin of Sangiovese berries
grown under high (HT) and low(LT) temperature conditions during ripening in the years 2010 and 2012
50
37 Hypothesis for anthocyanin degradation
371 POD candidate genes
From the research conducted by Fasoli et al (2012) it can be realized that there are many different
isoforms of Peroxidases gene in different organs of grape As to recent researchers five POD
isoforms (labeled POD1 POD2 POD3 POD4 and POD5) are showed to be more expressed in
berry skin from veraison to harvest in Sangiovese (Pastore 2010) In addition to these 5 isoforms
another one (POD6) which was reported by Mori et al (2007) was assessed in this thesis
In 2010 Real Time experiment revealed that among these 6 genes that were studied in the berry skin
of Sangiovese only the expression of the genes POD1 and POD3 seem to be linked to the
temperature (Fig 20) The expression of POD1 and POD3 in HT detected to occur in different
patterns during the ripening but POD 1 was expressed with a similar trend in both years
Fig 20 Mean Normalized expression of the selected POD genes involved in anthocyanin biosynthetic pathway in the in
berries grown under high (HT) and low(LT) temperature conditions during ripening in 2010 and 2012
51
372 Activity of enzymes involved in anthocyanin degradation PODs and PPOs
In the both years the PODs activity during ripening showed a significant increase in HT berries
compared to LT (Fig 21) supporting the hypothesis of anthocyanin degradation in response to high
temperature (Vaknin et al 2005 amp Mori et al 2007)
It has been reported that peroxidase is involved in the active anthocyanin degradation of Brunfelsia
calycina flowers (Vaknin et al 2005) and in presence of H2O2 in the vacuoles of grape cells
(Calderon et al 1992) Our findings are coherent with other papers since heat stress can contribute
to H2O2 accumulation in plant tissue (Date et al 1998) and so PODs-anthocyanins reaction may act
as a scavenging mechanism for H2O2 and plant cell detoxification in high temperature conditions
(Yamasaki et al 1997 Pourcel at al 2007)
It is interesting to note that in this experiment we could not find any PPOs activity likely due to the
plastidial localization of this enzyme (Dry amp Robinson 1994) and so we demonstred the lack of
direct involvement in active anthocyanin degradation under high temperature conditions in Vitis
vinifera
Fig 21 The trends of PODs activity in the skin of Sangiovese berries grown under high (HT) and low (LT) temperature
conditions during ripening in the years 2010 and 2012
52
4 CONCLUSION
In the present study we examined the contents of anthocyanins flavonols and tannins the
expression of some biosynthetic genes involved in their synthesis and the activities of some related
enzymes in grape berries of Sangiovese cv grown under different thermal conditions in two
different years
Anthocyanins and flavonols accumulation in Sangiovese cv revealed to be very sensitive to high
temperature (showing a reduction over 50 in total anthocyanin concentration at harvest) Several
mechanisms such as a general inhibition of the expression of flavonoids biosynthetic genes and of
the activities of some flavonoids biosynthetic enzymes (PAL and UFGT) associated with a
stimulation of some putative anthocyanin degradation enzymes (PODs) showed to be involved in the
inhibitory effect of high temperatures on anthocyanin accumulation A similar mechanism may be
supposed for flavonols degradation
This study showed that the temperature regimes after veacuteraison have different effects on each
flavonoid group in grape berry because in conterary to anthocyanins and flavonols that were
reduced in the skin of grapes ripened under high temperature environments after veraison seed and
skin tannins were not affected by the same conditions
Furthermore the warmer condition verified in 2012 compared to 2010 and the different flavonoid
composition and expression profile of some of the analyzed genes in the two years may suggest a
different sensitivity to high temperature of some genes involved in anthocyanins biosynthesis
53
Chapter one Second Part
Recognition of putative POD genes involved in anthocyanins degradation
under high temperature condition
54
1 INTRODUCTION
Petunia has played a central role in transformation research since the earliest reports of plant
transformation It was a key model system when the first definitive accounts of Agrobacterium-
mediated transformation and direct DNA transfer established the transfer and expression of foreign
genes in plants Petunia subsequently played an important role in elucidating many of the
characteristics of plant transformation One of the key reasons for the importance of Petunia in plant
transformation research has been the selection for andor identification of genotypes well suited to
growth and regeneration in culture Ease of transformation coupled with other favorable biological
characteristics ensures that Petunia will remain a valuable model system for studies of gene
function in plants (Conner et al 2009) Moreover Petunia hybrida is one of the classical subjects of
investigation of plants pigmentation in which the pathway of anthocyanin biosynthesis has been
analyzed genetically and biochemically (Meyer et al 1987 Quattrocchio et al 2006) Although the
information about Petunia sequenced genome is somehow limited it can be still used as model
species in this important field of study for the obvious ease of detecting mutants for this pathway It
can also be actively employed in complementation studies with genes from other species such as
grape (Venturini 2009)
Therefore in the second phase of this trial regarding to the results obtained from the assessment of
the expression of the genes involved in anthocyanin degradation at elevated temperature gene
transformation was conducted with different isoforms of peroxidases genes from Vitis vinifera (cv
Sangiovese) to Petunia hybrida with the aim of recognizing the most effective candidate genes for
anthocyanins degradation under high temperature
2 MATERIALS
21 Gene selection
In the first phase of this trial the expressions of 6 different isoforms of Peroxidases genes that were
showed to be more expressed in berry skin from veraison to harvest (Fasoli et al 2012 Mori et al
2007) were assessed via Real Time-PCR subsequently according to that results 3 different
isoformes were selected to transform Petunia hybrida
22 Escherichia coli strain and culture media
The DH10B strain was provided by Invitrogenreg and features the mutations recA1 endA1 presence
of the gene lacZM15 and high transformation efficiency Moreover it didnrsquot carry any antibiotic
resistance genes
55
221 Luria-Bertani (LB) medium
Component Concentration (gl)
Yeast extract 5
Tryptone 10
NaCl 10
Agar 15
Final pH 75
The medium was sterilized in an autoclave (121degC for 20 minutes 2 atm) After sterilization
antibiotic (kanamycin) was added to the solution for a final concentration of 50 mgl
222 SOC medium
Component Concentration (gl)
Yeast extract 5
Tryptone 20
After sterilization in an autoclave (121degC for 20 minutes 2 atm) glucose and salts sterilized by
filtration (filters with ores of 02 m diameter) were added to the solution at the following
concentrations
Component Concentration
NaCl 10 mM
KCl 25 mM
Glucose 20 mM
MgCl2 10 mM
MgSO4 10 mM
Final pH 68-70
56
23 Agrobacterium tumefaciens strain and culture media
For Petunia hybrida transformation the super virulent EHA105 Agrobacterium tumefaciens strain
was chosen (Hellens et al 2000) The bacteria possess a disarmed helper Ti plasmid (pTIBo542ΔT-
DNA) encoding the necessary sequences for the transfer of the T-DNA region which is carried by a
second shuttle plasmid the pK7WG20 The two plasmids are defined as binary vectors The cells
containing both plasmids can be selected for with the use of the following antibiotics
Antibiotic Concentration Resistance
Rifampicin 50 mgl Genomic
Streptomycin 300 mgl pK7WG20
Spectinomycin 100 mgl pK7WG20
231 YEB Medium
Component Concentration
Yeast extract 1 gl
Tryptone 5 gl
Beef extract 5 gl
Sucrose 5 gl
MgSO4 5 Mm
Agar 15 gl
Final pH 75
The medium was sterilized in an autoclave (121degC for 20 minutes 2 atm) After sterilization
antibiotics (streptomycin 300 mgl spectinomycin 100 mgl and rifampicin 50 mgl) were added to
the solution for selective mediums
57
24 Vectors
241 pENTRtradeD-TOPOreg (2580 bp)
Feature Benefit
rrnB T1 and T2 transcription terminators Protects the cloned gene from expression by vector- encoded
promoters thereby reducing possible toxicity in E coli
attL1 and attL2 sites
Allows sequencing in the sense orientation Bacteriophage λ-derived
DNA recombination sequences that allow recombination cloning of the
gene of interest from a Gatewayreg expression clone or attB PCR
product (Landy 1989)
TOPOreg Cloning site directional Allows a fast and directional cloning
M13 forward and reverse primer sequences Allow sequencing of the insert
Kanamycin resistance gene Allows selection of the plasmid in E coli
pUC origin Allows high-copy replication and maintenance in E coli
Fig 22 a scheme of the pENTRtradeD-TOPOreg vector
242 pK7WG20
A scheme for vector pk7WG20 is presented in Fig 23 It is a binary vector used as destination
vector in the Gatewayreg technology The T-DNA comprises the marker gene nptII which confers
58
resistance to kanamycin The cloning of an exogenous genes in this position implies an LR
recombination between the 35S CaMV constitutive promoter and the terminator 35S
Fig 23 Schematic representation of the pK7WG20 vector
25 Primers
The Primers pairs for POD1 to POD5 were newly designed on the original DNA sequences to
amplify 150ndash250 bp gene fragments and the Primers pairs for the POD6 was referred to Mori et al
(2007) (Table 7)
Subsequently according to the results of those expressions 3 different isoformes (POD 1 POD 3
and POD 5) were selected to transform Petunia hybrida
59
(Table 7) (POD 1-6) The primers of the selected isoforms of the Peroxidases genes for RT-PCR and (POD 1-3
cloning) The primers of the selected isoforms of the Peroxidases genes for cloning
primer Forward primer Reverse
POD 1 5-TCTGAGTAAGAGCCCACACACTCT-3 5-GAGACCTGAGCAGATAAATACAAAAATAAA-3
POD 2 5-AAAGTTGTTTGGCTGTGG-3 5-AATCCCTCCAAACAATCA-3
POD 3 5-TGCTCTAAATGCCTGAAAAATG-3 5-ATCATATAGAAAAGTGACAGCAACCT-3
POD 4 5-CAACTTCACACCAACGGGAAA-3 5-GCAGCTGAGCAAGAAATGCTT-3
POD 5 5-TCGGTGAGGAACTCCGATA-3 5-AGCTTCCTTGTCCTCTTCCA-3
POD 6 5-AACTTGAGACACAACAGCATAAATAAATC-3 5-AGGACCAAATCACAGGATGATAAAG-3
POD 1 cloning 5-cacc atg gca ttg atc ctc ttt tc-3 5-cta gtt taa ggc atc aca cc-3
POD 3 cloning 5-cacc atg tct ctt ctc gtt ctt ctc-3 5-tta aga ttc cag gag tgt gtc-3
POD 5 cloning 5-cacc atg aga aaa ctt atg gag gc-3 5-tta aag ttc agc aga agc ttc-3
26 Plant materials
Petunia hyrida line W84xV30 (P axillaris X P inflata) has become an attractive system for
genetic molecular and complementation studies as it possesses many desirable characteristics
colored flowers whose dimensions (5-6 cms) allow for relative ease of dissection and separation of
floral organs rapid growth cycle (2-3 months from seeds to full bloom) ease and rapidity of genetic
transformation via infection with disarmed Agrobacterium tumefaciens
This species has a limited number of chromosomes (n=7) and a small genome (12 times 106 kb) In
particular the line W84 is not capable of expressing a Glutathione S-transferase PhAN9 (Alfenito et
al 1998) and hence to accumulate anthocyanins in the vacuole leading to a fading color phenotype
However the W84 line had proved difficult to transform in previous experiments with the GST4
gene To overcome this problem a new Petunia hybrida line was generated by crossing W84 with
the V30 cultivar and recovering the mutated offspring after self-crossing This W84xV30 line was
used in all subsequent experiments
The peroxidases genes were isolated from Vitis vinifera (cv Sangiovese) (the plant materials used in
the first part of this chapter)
60
Fig 24 Petunia hyrida ndash line W84xV30
3 METHODS
After the PCR amplification of our selected genes with proof-editing PFU enzyme DNA
purification was done directly from the PCR product and used for the TOPOregCloning reaction
following the protocol provided by Invitrogen kit
31 Transformation of Escherichia coli by heat shock
After the TOPOregCloning reaction the DNA was added to the E coli DH10B competent cells and
the mixture left in ice for other 30 minutes Cells were incubated at 42degC without agitation for 30
seconds and then rapidly transferred into ice 250 microL of SOC medium provided by Invitrogen kit
kept at room temperature was added to the culture and the re-suspended cells were incubated at
37degC with agitation (200 rpm) for 1 hour 100- 200 l of the solution was placed on to a solid LB
medium and left at 37degC overnight
32 Preparation of competent cells of A tumefaciens
To obtain Agrobacterium tumefaciens strain EHA105 cells competent for the transformation by
electroporation a single colony was inoculated into 3 mL YEB medium containing Rifampicin (50
mgl) and incubated at 28degC overnight with vigorous shaking When the culture reaches the
exponential growth phase (usually after 12 hours characterized by an OD600 equal to 09-10) 15
mL of solution was sampled and centrifuged at 14000 rpm for 1 minute at room temperature The
pellet thus obtained was washed to eliminate antibiotic and re-suspended three times in 500 l cold
and sterile glycerol 10 (vv) at each step the solution was centrifuged at 14000 rpm for 1 minute
at room temperature Finally the pellet was re-suspended in 40 l of cold and sterile glycerol 10
(vv) The cells were ready to be electroporated
61
33 Transformation of A Tumefaciens by electroporation
A Bio-Rad device for electroporation was used for this experiment calibrated at 25 F 200 and
25 kV 1 or 2 microL of DNA plasmid (20 ng) was re-suspended in 40 l of competent cells The
operation was performed in ice The mix was transferred into a pre-cooled electroporation cuvette
the cuvette was then inserted into the Bio-Rad device and subjected to a pulse of 25 kVcm at 200
Ohm immediately after the pulse 1 mL LB without antibiotics was added in sterile conditions The
suspension was recovered and grown in a propylene tube with agitation for one hour at 28degC so that
the cells can express the resistance gene The cells were placed in 100 ndash 200 l aliquots on to YEB
solid medium containing Spectinomycin (final concentration 100 mgl) Rifampicin (final
concentration 50 mgl) and Streptomycin (final concentration 300 mgl) The Petri dishes were
incubated at 28degC for two days The transformation efficiency of this method is 8x10⁵ cfug DNA
34 Colony PCR
To detect bacterial recombinant clones which carry a fragment of interest it is possible to perform
the colony PCR consists of a single bacterial colony for a final volume of 20 μl A sterile tip is used
to sample the colony from the solid culture medium and dissolved in the reaction mix
35 Plasmid DNA extraction
To purify the plasmid DNA of colony which resulted positive by PCR bacteria were put in 5 mL of
liquid LB with the correct antibiotic to grow overnight at 37degC with agitation The extraction of
DNA plasmid was carried out on the base of ldquoQIAprepreg Spin Miniprep Kitrdquo (Qiagen) following the
manufacturersquos instruction
36 Purification of PCR products
To purify the PCR products the protocol of the kit provided by Promega Wizardreg SV Gel and PCR
clean-up system was performed
37 GATEWAYreg cloning system
The Gatewayreg Technology (Invitrogen) is based on the bacteriophage lambda site-specific
recombination system which facilitates the integration of lambda into the E coli chromosome and
the switch between the lytic and lysogenic pathways This recombination method facilitates transfer
62
of heterologous DNA sequences (flanked by modified att sites) between vectors Two recombination
reactions constitute the basis of the Gatewayreg Technology
Site Length Function
attL 100bp Entry clone Entry vector
attR 125bp Destination vector
38 LR Recombination reaction
LR Recombination reaction was performed following the protocol provided by Invitrogen
This reaction facilitates recombination of an attL substrate (entry clone) with an attR substrate
(destination vector) to create an attR-containing expression clone (see diagram below)
Fig 25 a scheme of the Gatewayreg cloning system
Componente Volume
Entry clone (100 ηg) 1 microL
Destination Vector (150 ηg) 1 microL
5X LR Clonase buffer 2microL
Sterile water 6 microL
63
The Entry-clone vectors had been generated with independent ligation reactions in the pENTRTM
D-
TOPOreg vector containing the attL1 and attL2 sites It was therefore possible to perform directly the
recombination reaction with the destination vector pK7WG20
The solution is incubated for 1 hour at 25degC then 1 μl of the Proteinase K enzyme (Invitrogen) is
added to the mix which is placed for an additional 10 minutes at 37degC At this point it is possible to
perform the transformation of the competent E coli DH10B cells
39 TOPO cloning reaction
TOPOreg cloning reaction was performed following the Invitrogen protocol for electro-competent E
coli cells
Reagents Chemically Competent E coli Electrocompetent E coli
Fresh PCR product 5 to 4 μl 05 to 4 μl
Dilute Salt Solution (14) -- 1 μl
Salt Solution 1 μl --
Sterile Water add to a final volume of 5 μl add to a final volume of 5 μl
TOPOreg vector 1 μl 1 μl
Final volume 6 μl 6 μl
The mix reaction was incubated in ice for 20 minutes then the cells were incubated at 42degC without
agitation for 30 seconds and then rapidly transferred into ice followed by the procedure of
Transforming One Shotreg TOP10 Competent Cells provided by Invitrogen kit
310 RNA extraction and Real time PCR
Real-time PCR was performed to evaluate the expression of six different isoforms of peroxidases
genes for five selected stages of grape berry ripening from beginning of veraison to the end of
harvest For each sampling 3 biological replicates were analyzed Total RNA was isolated from 200
mg of the powdered berry skin tissue using SpectrumTM
Plant Total RNA kit (Sigma-Aldrich St
Louis MO USA) following the manufacturers protocol One microL of each RNA sample was
measured spectrophotometrically to determine RNA quantity and 260280 and 260230 ratio using a
64
NanoDrop1000 Spectrophotometer (Thermo Fisher Scientific Wilmington DE USA) Total RNA
was treated with 1 U microg-1 RQ1 DNase (Promega Milan Italy) First-strand cDNA was synthesized
using 1 microg of RNA 1microL (dT)15 primer (500 microgmL) and 1 U of GoScripttrade reverse transcriptase
(Promega) Quantitative RT-PCR was carried out on a Step One Plustrade (Applied Biosystems Foster
City California USA) Each reaction (10 microL) contained 188 nM of each primer 2microL of diluted
cDNA (125) 5microL U of Power SYBRreg Green PCR Master Mix (Applied Biosystems Foster City
California USA) Thermal cycling conditions were 95 degC for 10 min followed by 95 degC for 15 s 55
degC for 1 min for 40 cycles followed by a melting cycle which contains 95 degC for 15 sec 60 degC for 1
min and 95 degC for 15 sec Each cDNA sample was analyzed in triplicate Gene transcripts were
quantified as reported by (Pastore 2010) The Primers pairs for POD1 to POD5 were newly
designed on the original DNA sequences to amplify 150ndash250 bp gene fragments and the Primers
pairs for the POD6 was referred to Mori et al (2007) (Table 7)
311 Stable transformation of Petunia hybrida
The protocol is applied under a laminar flow cabinet to ensure sterility Young apical leaves are
harvested and kept in water to avoid dehydration They are subsequently sterilized with a solution of
05 sodium hydrochloride in which they are dipped for 10 minutes followed by 5 washings of 10
minutes each in bi-distilled water The tips borders and petioles are removed with a sterilized
scalpel while the rest of the leaf is cut in three sections The leaf pieces are immersed in a solution
110 of overnight grown Agrobacterium tumefaciens transformed with a selected gene for 20
minutes so that the bacteria could attach to the explants after which they are transferred to a Petri
dish containing solidified Medium I (supplemented with Folic acid (1 mgmL) NAA (01 mgmL)
6-BAP (2 mgmL) without antibiotics) Each Petri dish can hold up to 10 discs The Petri dishes are
sealed and stored in a growth chamber at 25degC under day-night regime (with a long day light period
of 16 hours of light) After 2-3 days the explants are transferred into a new Petri dish filled with
medium II which contains two antibiotics 500 mgl carbenicillin to stop Agrobacterium growth and
300 mgl kanamycin to select the transformed explants The explants were transferred to fresh
selective plates each 2-3 weeks and the explants were constantly checked against contamination
with molds or other pathogens After about 8 weeks the shoots regenerated from the calluses were
removed and transferred onto the rooting medium (medium III supplemented with 500 mgl
carbenicillin and 50 mgl kanamycin) After the roots were sufficiently developed the medium was
washed away from the roots were put in jiffy pots and were grown in greenhouse Petunia hybrida
plants grow and flower in about 2 to 3 months
65
3111 Medium I
Component Concentration
Sucrose 20 gl
Glucose 10 gl
MS-macro amp micro elements with Gamborg B5 vitamins (Duchefa M0231) 44 gl
Plant Agar 8 gl
The pH is adjusted to 57-59 with HCl and KOH The medium is sterilized in an autoclave for 20
minutes and after it has reached 60deg C the following hormones are added
Component Concentration
Folic acid 1 mgl
6-BAP 2 mgl
NAA 01 mgl
3112 Medium II
Medium II is obtained from Medium I with the addition of the antibiotics needed for the eradication
of Agrobacterium tumefaciens and the selection of transformed calluses They are as thermolabile as
the phytohormones and must therefore be injected in the medium only after it has reached a
temperature lower than 60deg C
Component Concentration
Carbenicillin 500 mgl
Kanamycin 300 mgl
66
3113 Medium III
The composition of Medium III is identical to that of Medium I but without the addition of
phytohormones Also the following antibiotics are added to the medium
Component Concentration
Carbenicillin 500 mgl
Kanamycin 50 mgl
312 Agro-infiltration of petunia petals
Agro-infiltration represents recent advancements in Petunia transformation This is a technique for
transient gene expression and the development of intragenic vectors to affect gene transfer without
the integration of ldquoforeignrdquo DNA
One mL of the Agrobacterium culture grown overnight for inoculation of 25 mL of LB liquid
medium was added to 300 μgmL Streptomycin 100 μgmL Spectinomycin 20 μM Acetosyringon
and 10 mM MES and was incubated to grow overnight at 28 o
C at 180 rpm After centrifugation for
20 minutes at 12000 rpm the pellet was re-suspended with 15 mL of the buffer below After adding
100 μl of the inoculums to 900 μl of the re-suspending buffer the OD (Optical Density) was
measured spectrophotometrically and the following formula was used for dilution of the inoculums
up to the final volume of 50 mL
3121 Resuspending buffer
Component Concentration
MgCl2 10mM
MES 10mM
Acetosyringone 100 μM
The volume of the inoculums = [05 (The optimal OD) times 50 (The final volume)] divide [(The read OD
via spectrophotometer) times 10]
67
Afterward 100 μM of Acetosyringone was added to the inoculums and the mixture was incubated in
room temperature for 2-3 hours
The bacterial suspension was infiltrated into the upper layer of petals using a 1mL syringe without a
needle Infiltrated flowers were kept at 25 oC for 36 to 48 hours after infiltration
313 DNA extraction from Petunia
The DNA was extracted from a Petunia hybrida leaf disc ground thoroughly in 400 l of extraction
buffer Then the extract was centrifuged and 300 microL of the supernatant was mixed with 300 microL of
isopropyl alcohol After the incubation at room temperature for 15 minutes and centrifugation the
pellet was dried at room temperature under a fuming hood and subsequently re-suspended in 100 microL
of sterile bi-distillated water and incubate overnight in the refrigerator To discard any remaining
impurities the tube was centrifuged again and the supernatant transferred to a new sterile tube
3131 Extraction buffer
Component Concentration
Tris HCl pH 80 200 mM
NaCl 250 mM
SDS 1
EDTA 25 mM
-mercaptoethanol 10 mM
314 PCR of transformed Petunia genomic DNA
PCR amplification was performed on Petunia genomic DNA in a final volume of 20 μl As the
primer forward Promoter 35 S and as the primer reverse the specific primer for ldquoPOD 1cloningrdquo
was used As the negative control the genomic DNA of the Wild type line was used as the template
68
3141 Reaction Mix
Component Stock Volume
Template DNA 1 l
Buffer (containing MgCl2) 10x5x 4 l
Nucleotides 10 mM 04 l
Primers 20 M 04 l
Taq 5000 umL 01 l
3142 Standard thermal cycle
Initial denaturation 94 degC 5rsquo
Denaturation 94 degC 40rdquo
Primers annealing 55degC 40rdquo X 35 cycles
Extension 72 degC 90rsquorsquo
Final extension 72 degC 7rsquo
315 RNA extraction from Petunia hybrida petal
Petunia petals from the young expanded flowers were immediately frozen in liquid nitrogen and
then were kept in the freezer (-80 o
C) until analyses were carried out Total RNA was isolated from
200 mg of the powdered petal using spectrum TM
Plant Total RNA kit (Sigma-Aldrich St Louis
MO USA) following the manufacturerrsquos protocol One microL of each RNA sample was measured
spectrophotometrically to determine RNA quantity and 260280 and 260230 ratio using a
NanoDrop1000 Spectrophotometer (Thermo Fisher Scientific Wilmington DE USA)
316 cDNA synthesis RT PCR reaction
After controlling the RNA via the electrophoresis gel total RNA was treated with 1 U microg-1 RQ1
DNase (Promega Milan Italy) First-strand cDNA was synthesized using 1 microg of RNA 1microL (dT)15
primer (500 microgmL) and 1 U of GoScripttrade reverse transcriptase (Promega) PCR amplification was
69
performed on the derived cDNA for a final volume of 20 μl As the primers once the Primers pair
of actin was used and subsequently for the RT- PCR amplification the specific primers of ldquoPOD
1cloningrdquo (Table 7) were used
3161 Reaction Mix
Component Stock Volume
Template DNA 1 l
Buffer (containing MgCl2) 10x5x 4 l
Nucleotides 10 mM 04 l
Primers 20 M 04 l
Taq 5000 umL 01 l
3162 Standard thermal cycle
Initial denaturation 95 degC 5rsquo
Denaturation 95 degC 30rdquo
Primers annealing 55degC 30rdquo X 35 cycles
Extension 72 degC 20rsquorsquo
Final extension 72 degC 7rsquo
317 Total anthocyanin measurement
Petunia petals from the young expanded flowers were selected in 5 biological replicates for the
transformed plants and wild type line They were immediately frozen in liquid nitrogen ground and
the fine powder was weighted before the extraction of anthocyanins The powder was homogenized
with the solvent mixture of methanol 99 with HCl 1 at the volumes of eightfold of the powder
Then the mixture was sondicated for 20 minutes
This is the act of applying ultrasound energy to agitate particles in a sample It is applied using an
ultrasonic bath All the procedures were conducted at 4 oC After the centrifugation at 12000 rpm
70
for 10 minutes at 4 oC an aliquot of the supernatant was diluted 140 and the total anthocyanin was
quantified spectrophotometrically at 540 nm
318 Heat shock performance
Young petunia flowers in 5 biological replicates for the transgenic plants and wild type line were
selected for the heat shock To carry out this experiment the flowers were cut with a long pedicle
and some small leaves and were placed in a falcon of water They were kept for one hour in the
incubator at 45 oC and transferred subsequently to the room temperature After 30 hours the petals
were frozen in liquid nitrogen ground and the fine powder was weighted to evaluate the activity of
Guaiacol Peroxidases enzyme and the total anthocyanin
319 Guaiacol Peroxidases activity assay
Guaiacol peroxidases was assayed as described by Ushimaru et al (1997) using pyrogallol as the
electron donor for the reaction The plant material was extracted in cold buffer (200 mM sodium
phosphate 5 mM sodium EDTA 1 PVPP pH 70) and incubated on ice for 30 min After
centrifugation at (10000 times g 30 min 4 degC) the desalted supernatant was used for the assay The
reaction mixture (15 mL) included 1140 μl of the 100 mM sodium phosphate buffer pH 70 60 microL
of the 25 mM H2O2 60 mM pyrogallol and 240 μl extract H2O2 and pyrogallol were prepared
fresh just before use Absorbance (λ=430 nm) was taken after 25 min incubation at room
temperature and referred to a blank with no extract added One unit of Guaiacol peroxidases is
defined as the amount of enzyme that catalyzes the oxidation of 1 μmol of pyrogallol per minute
under the conditions described by Chen and Asada (1989) and PODs activity was expressed as kat
g-1
petal fresh weight An absorbance coefficient of 247 mM
-1 cm
-1 was assumed for calculations
4 RESULTS
The aim of this trial is recognizing the most effective candidate genes responsible for anthocyanins
degradation under high temperature conditions during the ripening time Among the candidates for
anthocyanin degradation peroxidases are involved in active anthocyanin degradation in living
tissues (Vaknin et al 2005 Welinder et al 2002) In addition the results obtained from the
enzymatic activity of peroxidases at elevated temperature and the expression of this gene during
ripening supports the hypothesis of its role in anthocyanin degradation On these bases the
technique of gene transformation was conducted with different isoforms of peroxidases genes from
Vitis vinifera (cv Sangiovese) to Petunia hybrida
71
41 Gene selection
From the research conducted by Fasoli et al (2012) it can be realized that there are different
isoforms of Peroxidases gene in different organs of grape that among them only 5 isoforms are
showed to be more expressed in berry skin from veraison to harvest In addition to these isoforms
there was another one which was reported by Mori et al (2007) to be expressed in grape berry
skin
Fig 26 The expression value of the different isoforms of Peroxidases in berry skin from veraison to harvest (V
Veacuteraison MR Mid-ripening R Ripening) Fasoli et al (2012)
As to the expression of these different isoforms by Real time pcr 3 of them were selected for the
transformation to Petunia hybrida
Fig 27 Mean Normalized expression
of the selected POD genes isolated from
berry skin for the transformation to
Petunia hybrida
72
Among all the three isoforms only the POD 1 could be successfully isolated from grape berry skin
and transformed to Petunia
42 The sequence of the POD1 gene
Vv14s0066g01850 (POD1)
ATG GCA TTG ATC CTC TTT TC
TCTACTATTCTTTCTGGGATTAGTGAACCCTTCGGAGTCCAGGTTGAGTGTCAACTACTACCAAAAATCATGCCCAAGA
TTCAGTCAGATCATGCAGGATACCATCACCAACAAGCAAATCACCAGCCCCACCACGGCTGCGGCCACTCTCCGCCTC
TTCTTCCACGACTGCTTCATTGAGGGCTGCGATGCTTCCGTTCTTGTCTCCTCGACCCCCTTCAACGAGGCCGAGCGCGA
TGCCGACATGAACCTCTCCCTCCCCGGCGACGGCTTCGACGTCGTTGTCCGCGCCAAGACCGCCCTCGAGCTCGCTTGC
CCCGGTGTGGTCTCCTGTGCCGACATTCTCGCCGTCGCTACCCGCGATCTCGTCACCATGGTGGGAGGTCCCTTCTACA
AGGTCCCGCTGGGGAGAAGAGATGGGCTGGTCTCCCGGGCGAACAGGGTTGAAGGTAACCTTCCAAGACCCACGATG
TCCATTTCTCAGATAATTTCGATTTTCGCTGTGAGAGGGTTCTCGGTTCAAGAAATGGTGGCGCTGAGTGGTGCCCACA
CGATTGGGTTCTCGCATTGTAAAGAATTCAGCAGCGGGATCTACAATTACAGCCGCAGTTCCCAGTCCAATCCGAGCTA
CAACCCTAGATTCGCAGAGGGGTTGAGAAAAGCTTGCAGCGATTACCAGAAGAATCCTACATTGTCGGTGTTCAACGA
TATAATGACTCCCAACAAGTTCGATAACATGTATTTCCAGAATCTGCCCAAGGGTTTGGGGCTATTGGCGACGGACCAT
ACCATGGCTACCGATCCGAGGACGAGGCAGTTTACGGATTTGTATGCCAAGAATCAAAGCGCCTTCTTTGAGGCATTT
GGTCGAGCTATGGAGAAGCTTGGCCTTTATGGGATCAAGACCGGGCGAAGAGGAGAGATTCGACGCA GG TGT GAT
GCC TTA AAC TAG
Vv14s0066g01850 (POD1) genomic
AAGGCTTCTGAGTAAGAGCCCACACACTCTCCATTGCTGCCACTACCACTGGCTTTTTTTTTTATTTTTGTATTTATCTGC
TCAGGTCTCTGAGCTTTGAGCTCTGAGAAACAATGGCATTGATCCTCTTTTCTCTACTATTCTTTCTGGGATTAGTGAAC
CCTTCGGAGTCCAGGTTGAGTGTCAACTACTACCAAAAATCATGCCCAAGATTCAGTCAGATCATGCAGGATACCATC
ACCAACAAGCAAATCACCAGCCCCACCACGGCTGCGGCCACTCTCCGCCTCTTCTTCCACGACTGCTTCATTGAGGGCT
GCGATGCTTCCGTTCTTGTCTCCTCGACCCCCTTCAACGAGGCCGAGCGCGATGCCGACATGAACCTCTCCCTCCCCGG
CGACGGCTTCGACGTCGTTGTCCGCGCCAAGACCGCCCTCGAGCTCGCTTGCCCCGGTGTGGTCTCCTGTGCCGACATT
CTCGCCGTCGCTACCCGCGATCTCGTCACCATGGTGGGAGGTCCCTTCTACAAGGTCCCGCTGGGGAGAAGAGATGGG
CTGGTCTCCCGGGCGAACAGGGTTGAAGGTAACCTTCCAAGACCCACGATGTCCATTTCTCAGATAATTTCGATTTTCG
CTGTGAGAGGGTTCTCGGTTCAAGAAATGGTGGCGCTGAGTGGTGCCCACACGATTGGGTTCTCGCATTGTAAAGAAT
TCAGCAGCGGGATCTACAATTACAGCCGCAGTTCCCAGTCCAATCCGAGCTACAACCCTAGATTCGCAGAGGGGTTGA
GAAAAGCTTGCAGCGATTACCAGAAGAATCCTACATTGTCGGTGTTCAACGATATAATGACTCCCAACAAGTTCGATA
ACATGTATTTCCAGAATCTGCCCAAGGGTTTGGGGCTATTGGCGACGGACCATACCATGGCTACCGATCCGAGGACGA
GGCAGTTTACGGATTTGTATGCCAAGAATCAAAGCGCCTTCTTTGAGGCATTTGGTCGAGCTATGGAGAAGCTTGGCCT
TTATGGGATCAAGACCGGGCGAAGAGGAGAGATTCGACGCAGGTGTGATGCCTTAAACTAGGTTTTTAAGGTTTTTTTT
TTTTTTTTTGCATTACAAACTCCCACCGTAGTGATGATCAATCAAGGTGAATTGATGGTGAGGGGGTGGTTTCATTTGA
ATTCTTTTTTTTTTTGTTGT
73
43 Gene transformation
After amplification of POD1 gene with PFU enzyme and specific POD1 primers (Table 7 Fig 28)
the E coli transformation was performed via pTOPO cloning system The day after a single colony
of DH10B cells that was grown on solid LB was transferred into 10 mL of liquid LB containing the
appropriate kanamycin antibiotic (for a final concentration of 50 mgl) and incubated overnight at
37deg and 250 rpm Afterward the pcr amplification of the colony was done to detect bacterial
recombinant colonies which carried the fragment of interest
Therefore 2 plates were designed to amplify each colony two times (Fig 29)
In the first plate the combination of the primer forward of M13 was used with the specific primer of
POD 1 reverse and simultaneously in the second plate the same colony was amplified with the
primer forward of POD1 with the M13 reverse The primers pair M13 gives the possibility to
amplify the fragment 50 bp longer than our inserted gene Consequently only the colonies which
were amplified in the correct position in the both plates had successfully carried the fragment of
interest (Fig 29)
Fig 28 Amplification of POD 1 gene by PFU
74
Fig 29 Colony PCR of POD 1 gene (The colonies marked with a star sign in the both gels are the ones with our
fragment of interest)
After the sequencing of the insert in the plasmid the LR recombination reaction was performed
The colony PCR was done using the ldquoPROMOTER 35 Srdquo as the primer forward and the primer
ldquoSONDA TERrdquo as the reverse The fragment 1575 bp was amplified The colony marked with a star
sign is the one with our fragment of interest (Fig 30) and the plasmid DNA was extracted and the
insert fragment of 1375 bp was amplified with the primer forward ldquoPROMOTER 35 Srdquo and the
specific primer reverse of ldquoPOD 1cloningrdquo (Table 7) (Fig 31)
75
Fig 31 The plasmid DNA (PK7WG2) control
After the transformation of A Tumefaciens the positive colonies were checked by pcr amplification
of the Agro-plasmid with the primer forward ldquoPROMOTER 35 Srdquo and the specific primer reverse of
ldquoPOD 1cloningrdquo (Fig 32) The plasmid DNA PK7WG2 was used as the positive control
Fig 30 The PK7WG2 Colony PCR of POD 1 gene
76
Fig 32 The pcr amplification of the Agro-plasmid (PC) Positive control (NC) Negative control (P1 - P5) Agro-
plasmids
Afterward the stable transformation of Petunia hybrida was done In addition at the same time the
Agro-infiltration of petunia petals was performed and the bacterial suspension was infiltrate into the
upper layer of petals Infiltrate flowers were then kept at 25 oC for two days but the flowers were
wilted without any change observed After 4 to 5 months two plants derived from the two
independent stable transformations grew in selective medium containing kanamycin and flowered
and were propagated asexually by cutting
To control the transformation efficiency the DNA was extracted from a Petunia hybrida leaf disc of
the two transgenic lines a wild type line and also as a positive control the plasmid DNA PK7WG2
was used The pcr amplification was done with the primer forward ldquoPROMOTER 35 Srdquo and the
specific primer reverse of ldquoPOD 1cloningrdquo (Fig 33)
77
As to the obtained results (Fig 33) both plants were transformed successfully To investigate the
expression of the transgene in the two lines RNA was extracted from the petal of the transgenic
plants and from the wild type line used as negative control and retro transcript to cDNA By pcr
amplification performed with the primers pairs of Actin the correct retro transcription of the RNA
was evaluated Then to analyze the expression of the transgene VvPOD1 in the petunia petal the
RT-PCR was performed with the specific primers pairs of ldquoPOD 1cloningrdquo
According to the (Fig 34) the fragment of 1kb was amplified and observed only in the second lane
confirming that the POD1 gene was expressed successfully in the Petunia hybrida line 2
Fig 33 The PCR amplification to control the transformation efficiency (TP1) Transgenic petunia 1st pot (TP2)
Transgenic petunia 2nd pot (WTL) Wild type line (PC) Positive control (NC) Negative control
78
0
5
10
15
20
25
30
35
40
45
50
Wild type line
control
POD plants
control
Wild type line
Heat shocked
POD plants
Heat shocked
To
tal
an
tho
cyan
in
A
BB
C
Fig 34 The RT-PCR of POD1 gene in the transformed plant (TP1) Transgenic petunia 1st pot (TP2) Transgenic
petunia 2nd pot (WTL) Wild type line
44 Heat shock and the plant response
Subsequently flowers from the transgenic line 2 (which expressed the POD1 gene) and from the
wild type were selected in 5 replicates and treated with the heat shock in order to highlight the
possible role of POD1 in anthocyanin degradation under stress condition
The same number of flower replicates of wild type and the transgenic line 2 were selected as the
control ie not subjected to the heat shock The petals of the treated flowers together with the
control ones were grounded by liquid nitrogen and the fine powder was weighted and divided in to
two in order to evaluate the activity of Guaiacol Peroxidases enzyme and the total anthocyanin
(Fig 35 36)
Fig 35 Total anthocyanin content of wild type line and POD plants
79
0
5
10
15
20
25
30
Wild type
line control
POD plants
control
Wild type
line Heat
shocked
POD plants
Heat shocked
(Kat
gr
-1 F
W)
C
B
C
A
By comparing the total anthocyanin content of the wild type and the transgenic lines before and after
heat treatment we found that the total anthocyanin content of the wild type line was significantly
similar in the both control and shocked treatment (Fig 35) After the heat shock the level of the
total anthocyanin in the transgenic petunia was reduced significantly However the total
anthocyanin content of the POD flowers in control was surprisingly highest among the others
Fig 36 The Peroxidase activity of wild type line and POD plants in the control and heat shock treatment
The enzymatic activity of peroxidase in both wild type and transgenic line 2 was evaluated before
and after the treatment
The wild type flowers showed the same level of enzymatic activity before and after the treatment
(Fig 36) The peroxidase activity was higher in the transgenic line in both control and the shocked
flowers However heat shock treatment contributed to significantly increase the peroxidase activity
in transformed flowers (Fig 36)
80
5 CONCLUSION
Most of the works studied the effects of temperature on anthocyanin accumulation has dealt with
the effects on the biosynthesis of anthocyanins (Mori et al 2007)
Yamane et al (2006) discussed the possibility of the contribution of another mechanism (eg
anthocyanin degradation) to the inhibitory effect of high temperature on anthocyanin accumulation
To date no report has demonstrated the enhancement of anthocyanin degradation due to high
temperature in plant tissue Hence the present study is the pioneer to show that the mechanism of
anthocyanin loss in grape skins due to high temperature involves not only the inhibition of
anthocyanin biosynthesis but also its enzymatic degradation
As to the results of this research and the literatures (Vaknin et al 2005 Mori et al 2007) among
the different candidates peroxidases (PODs) are reputed to be the main responsible for degrading
the anthocyanin pigment in vivid tissues
There are many isoforms of Peroxidases gene in different organs of grape that among them only 6
isoforms are reported to be more expressed in berry skin from veraison to harvest (Fasoli et al 2012
and Mori et al 2007)
Therefore in order to recognize the most important gene that encodes the peroxidase enzyme in
Sangiovese grape under stress condition selected isoforms of POD were isolated from Vitis vinifera
(cv Sangiovese) berries and transformed to Petunia hybrida Afterward the expression of the POD1
gene and the activity of the peroxidase enzyme were assessed in the transgenic petunia and were
compared to the wild type line under the stress condition
The obtained results could confirm that the level of total anthocyanin was decreased in the living
Petunia suffered from the heat stress this was under the circumstance that the level of the
peroxidase enzyme was significantly higher in those plants
On these bases it can be figured out that peroxidases can be considered as the responsible for
anthocyanin degradation in living tissues and the decrease of total anthocyanin content in the plants
faced to an abiotic stress such as the excessive high temperature What is more among the different
isoforms of the tested peroxidases genes the POD 1 isoform (with the sequence mentioned before)
can be identified as one of the propellant in this respect
81
Chapter two
Effects of late-season source limitations induced by trimming on grape
composition during ripening in Vitis vinifera cv Sangiovese
82
1 INTRODUCTION
Grape wine production showed a higher sensitivity to climate variability and the ongoing climatic
changes have already caused phenological alterations in some viticultural areas and are expected to
continue in the future (Jones et al 2005 Schultz 2000 Duchene and Schneider 2005) Besides
over the last fifty years an overall upgrading of vineyard management techniques which lead to a
general wine quality improvement has been verified As consequence in wine regions where heat
summations largely exceed technological requirements for the grown grape varieties a too high
level of sugar and subsequent wine alcohol excess low acidity alteration of aroma composition
and in black varieties unbalanced phenolic ripening with insufficient berry skin colour has been
shown at harvest
Accumulation of sugars is probably more responsive to temperature variations than accumulation of
anthocyanins because the optimal temperature for sugars biosynthesis and transport ranges from 8
to 33 degC while for anthocyanin pathway range from 17 to 26 degC Moreover high temperatures
(above 30-35 degC) have been the inhibitor of anthocyanin accumulation (Kliewer 1970- 1977 Mori
et al 2007 Movahed 2011) The relationship between tannins and high temperature is not clear but
some authors reported that seed tannin concentration was less susceptible to changes in temperature
conditions respect to anthocyanins (Cortell et al 2007a Ristic et al 2007) Moreover while soluble
solids and anthocyanins sysnthesis starts at veraison tannins were produced several weeks before
veraison and then their concentration in the berry starts to decrease following by a plateau at later
berry ripening stages (Kennedy et al 2000 2002) In other word it seems that there are differential
effects of temperature increase on the evolution of different berry traits in particular when they
occure after veraison On these bases the hypothesis is that the slowing down of sugars
accumulation rate may allow to achieve full ripeness of phenolic compounds mainly anthocyanins
and tannins As well known fruit sugar accumulation can be decreased by grape-growers for
example via bud load and yield increases but for the production of high quality wine it is not
allowed to exceed foreseen thresholds by the Appellation rules
A different approach to slow down sugar accumulation is represented by source limitation as the rate
of soluble solids increase in berries is well related to the ratio between leaf area to yield (Kliewer
and Dokoozlian 2005) In particular several researches showed that the removal around veraison of
the more young and efficient part of the canopy may be effective in reducing sugar accumulation
(Reynolds and Wardle 1989 Intrieri et al 1983 Intrieri 1994)
Although the relationship between sugar accumulation and leaf area to yield ratio is well
documented the evolution of some phenolic compounds in relation to leaf area efficiency and sugar
83
content in berries remain unclear Sugar has been shown to stimulate anthocyanin accumulation in
grape (Pirie and Mullins 1976 Larronde et al 1998 Hiratsuka et al 2001 Gollop et al 2002) but
it has been also reported that anthocyanins exhibit an initial phase of rapid increase strongly
correlated to sugar accumulation and a second phase where anthocyanins and sugars are uncoupled
(Guidoni et al 2008)
Moreover several studies with red wine cultivars in which crop was adjusted by means of cluster
thinning increasing the leaf area to yield ratio resulted in improved soluble solids anthocyanins
total phenols and colour intensity (Filippetti et al 2007 Pastore et al 2011Guidoni et al 2002
Reynolds et al 1994)
As well known the prediction of wine colour and quality based on berry composition is a difficult
task but the aim of this trial is to understand (i) if post veraison trimming is effective to slow down
the rate of sugar accumulation and (ii) to verify the possible derived alterations after treatment in
anthocyanins and tannins accumulation and in their compositional changes during ripening
compared to control in Vitis vinifera L cultivar Sangiovese
2 MATERIAL AND METHODS
This trial was conducted in 2009 2010 and 2011 on Sangiovese vines (V vinifera L clone 12T
grafted on 3309C) planted in 1994 in Ozzano Emilia Bologna Italy (44deg25N 11deg28E) Vines were
spaced 15 m on the row and 3 m between the rows and they were trained to Free Cordon (16 buds
per vine)
Twenty-four vines in four blocks (6 vines per block) were randomLy assigned within each block to
the following treatments
a) Non-trimmed control (C)
b) Shoot trimming 1 week after full veraison which left 8 nodes on every main shoot (TRIMM)
Trimming was performed when berry sugar concentration reached around 15deg -18deg Brix and
precisely 6th August 2009 (17 days after veraison) 10th August 2010 (17 days after veraison) and
4th August 2011 (6 days after veraison)
21 Vegetative and yield data
In each year before trimming and at harvest two regressions between shoot length (main and
lateral) and their actual leaf area were calculated and used to estimate leaf area of all tested vines At
84
trimming the main and lateral leaves were removed and leaf area was measured with a leaf area
meter (LI-3000A Li-Cor Bioscences Lincoln Nebraska USA) At harvest time the crops of each
individual plant were gathered separately and the number of clusters and their weights were
recorded
Weather data (mean daily air temperature and rainfall) were recorded from April to September in the
both years at a meteorological station located close to the experimental site
22 Berry sampling
In each year every ten days from veraison to harvest samples of 20 berries per plant were
collected pooled per each block (120 berries) and divided in three subsamples (40 each) for
determinations of the following parameters
a) Berry weight and must biochemical parameters (soluble solids pH and titratable acidity) on 20
berries performed immediately after sampling
b) Skin anthocyanins on 10 berries immediately stored in -20deg C and kept there until the analyses
c) Skin and seed tannins on 10 berries immediately stored in -20deg C and kept there until the
analyses
23 Analyses of main must biochemical parameters
The 20 sample berries were crushed and the must were sieved and used for degBrix analysis by a
temperature-compensating CR50 refractometer (Maselli Misure Spa PR Italy) Five mL of the
same must were then diluted 7 times with bi-distilled water and used to perform a titration reaction
by a Crison Compact Tritator (Crison Barcelona Spain) with 1N 05 N or 025 N NaOH (Sigma-
Aldrich St Louis MO USA) according to the stage of berry ripening to obtain pH and Titratable
Acidity (TA) data (expressed as gl of tartaric acid equivalents)
24 Analyses of skin anthocyanins
The berries sampled were weighted before the extraction of anthocyanins Then the skin was
carefully removed from the pulp and immerged in 50 mL of HPLC-grade methanol (Carlo Erba
Reagents Milano Italy) and were kept in dark for 24 hours The day after the extract was
separated from the skin residues and conserved at (-20degC) until the analysis
85
HPLC separation and quantification of anthocyanins were performed on a Waters 1525 instrument
equipped with a diode array detector (DAD) using a reversed-phase column Phenomenex (Castel
Maggiore BO Italy) RP18 250 mmx4mm (5microM) with precolumn The eluents used were the
following A= HClO4 03 in milliQ water B = methanol
The methanol extract was filtered through 022 microm 13mm PTFE syringe-tip filters (Teknokroma
Barcelona Spain) and an aliquot of 270microL was diluted to final volume of 1mL with the A eluent
The binary gradient was the same as reported in Mattivi et al (2006) with suitable modifications
The time for column equilibration was 5 minutes and the injection volume was 60 microL Separation of
the main free anthocyanins was obtained at 43 degC and they were quantified at 520 nm with a
calibration curve with malvidin-3-glucoside (Sigma-Aldrich ST Louis MO USA)
25 Tannins analysis
To extract proanthocyanidins the sampled berries (skins and seeds) were ground separately to a fine
powder under liquid N2 01 gr aliquots were separated and extracted in darkness in 2 mL screw-top
Eppendorf tubes for 24 hours with 70 acetone (10 mL) containing 01 ascorbate to prevent
oxidation of polyphenols Samples were then centrifuged (15 min 13000 g) and two 400 μL
aliquots of the supernatant were transferred to fresh tubes and dried down under vacuum at 35ordmC for
120 minutes
One of them was re-suspended in 100 μL methanol acidified with 1 HCl then neutralised with 100
μL sodium acetate (200 mM pH 75) for the analysis of free monomers The other aliquot
underwent acid-catalysed cleavage of the proanthocyanidins in the presence of excess
phloroglucinol following the method of Kennedy and Jones (2001) Briefly the dried sample was
resuspended in 100 μL of phloroglucinol buffer (025 g ascorbate 125 g phloroglucinol 215 μL
conc HCl 25 mL methanol) and incubated at 50ordmC for 20 minutes then neutralised with 100 μL of
sodium acetate (200 mM pH 75) and centrifuged (15 min 13000 g)
A 200 μL aliquot each of the acetone extract the acetone extract after acid catalysed cleavage and
the residue after cleavage was then transferred to Sunbroker 250 μL reduced volume HPLC
autosampler vials Samples were run on a Waters 1525 instrument equipped with a diode array
detector (DAD) using a reversed-phase column Phenomenex (Castel Maggiore BO Italy) RP18
250 mmx4mm (5microM) with precolumn A separate reversed-phase HPLC method was developed for
the cleaved and uncleaved proanthocyanidin samples reading absorbance at 280 nm Uncleaved
samples solvent A 02 phosphoric acid solvent B 41 acetonitrile02 phosphoric acid
86
(gradient of solvent B zero min 0 5 min 10 40 min 10 55 min 17 65 min 19 75
min 19 80 min 100 85 min 100 86 min 0) Cleaved samples solvent A 02 acetic
acid solvent B methanol (gradient of solvent B zero min 1 40 min 1 120 min 30 1201
min 100 125 min 100 126 min 1) For both methods 25 μL of sample was injected and run
at 30ordmC with a flow rate of 1 mLmin Concentrations of free monomers and hydrolysed terminal
subunits were determined from standard curves prepared from commercial standards of catechin
epicatechin epigallocatechin and epicatechin-gallate obtained from Extrasynthese (France) The
concentration of extension subunit-phloroglucinol adducts was calculated from published molar
extinction coefficients (Kennedy amp Jones 2001)
3 RESULTS AND DISCUSSION
31 Climatic data
The Growing Degree Days (GDD 10 degC baseline) from April 1st to September 30th (Table 8 Fig
37) were highest in 2011 (2054) and lowest in 2010 (1718) Moreover the average daily temperature
recorded from veraison to harvest in 2011 was mostly (70 of the period) above 25deg C In addition
in 2011 the level of the rainfall from April to September was only 136 mm whereas in 2010 the
rainfall in the same period was found to be three times more (Table 8 Fig 37)
Table 8 The climatic conditions in 2009 2010 and 2011
Year Rain from April to
September (mm)
DD from April to
September (degC)
Number of days with average daily
temp gt 25deg C from veraison to
harvest
2009 269 1963 24
2010 390 1718 7
2011 136 2054 29
87
Fig 37 The yearly recorded rainfall and daily average temperature from April 1 to September of 2009 2010 and 2011
32 Vegetative and productive traits
All vines were quite uniform in terms of leaf area before trimming in all years (data not shown) The
TRIMM treatment induced a leaf area reduction around 60 in 2009 and 2010 and around 40 in
2011 compared to control The trimming of the upper part of the canopy affected mostly the laterals
compared to the main leaves especially in 2010 (Table 9) It is interesting to note that in 2010 a
significant higher leaf area was recorded compared to 2009 probably due to the more favourable
seasonal climatic conditions during the first phase of shoots growth No laterals re-growth was
measured after treatments in all years
88
Starting from a uniform bunch number per meter of cordon yield cluster weight and berry weight
were unaffected by treatments in 2009 (Table 9) In 2010 and 2011 yield and cluster weight were
significantly lower in TRIMM vines compared to control while berry weight didnrsquot show any
difference A year-by-year variability in terms of yield was verified In 2010 yield was significantly
higher than in 2009 and 2011 for both treatments and due to the setting of uniform buds and
clusters number per vine it might be almost entirely a result of cluster weight increase (Table 9)
Berry weight did not differ between treatments during ripening (Fig38) in all the tested years
Moreover the number of berries per cluster was significantly lower in TRIMM vines compared to C
in 2010 and 2011 (Table 9)
At harvest the leaf areayield ratio was reduced in TRIMM vines to very low values corresponding
to 038 and 039 m2kg in 2009 and 2010 respectively compared to 101 and 082 m
2kg in the
control vines which are considered optimal for ripening in Free Cordon (Table 9) In 2011 probably
due to the low yield level registered in TRIMM vines the leaf area yield ratio reached a value of
093 m2kg which was not significantly different from C and that may allow an optimal ripening
(Table 9)
Despite we did not evaluate the starch content in the different parts of the tested vines it would be
expected that the TRIMM vines subjected to leaf area reduction ranging from 40 to 60 after
veraison induced further remobilization of reserves (Candolfi-Vasconcelos et al 1994) The
possible carbohydrate reserve depletion in 2009 and 2010 induced by defoliation could be
responsible for yield constraint mainly due to reduction of flower numbers per inflorescence
(Scholefield et al 1977 Bennett et al 2005)
89
Table 9 Vegetative growth and yield components recorded over 2009ndash2011 in C and TRIMM vines
Parameters 2009 2010 2011 Year
effect
Year x
Treatment
Interaction
C TRIMM C TRIMM C TRIMM
Main LA after
trimming
(m2m of cordon)
144 a 056 b 177 a 096 b 121 a 071 b ns ns
Laterals LA after
trimming
(m2m of cordon)
079 a 025 b 112 a 018 b 059 a 030 b ns ns
Total LA after
trimming
(m2m of cordon)
223 a 081 b 289 a 114 b 180 a 101 b ns
Cluster
(nm of cordon)
105 a 106 a 111 a 102 a 101 a 102 a ns ns
Yield
(kgm of cordon)
22 a 21 a 35 a 29 b 143 a 108 b ns
Cluster weight (g) 2108
a 1966 a
3121
a 2868 b 1473 a 1045 b ns
Berry weight (g) 155 a 153 a 170 a 169 a 128 a 123 a ns
Berries per cluster (n) 136a 1285a 1835a 1697b 1150a 850b ns
Leaf area yield
(m2kg)
101a 038b 082a 039b 125a 093a ns
Different letters indicate mean separation between treatments C and TRIMM within rows and years by t -test P = 005
P = 001 year x treatment interaction indicate mean separation within rows and years by t-test
90
Fig 38 Berry weight in the control and trimmed vines from veraison to harvest of the years 2009
2010 and 2011
33 Ripening analyses Soluble solids pH and Total Acidity
In 2009 and in 2010 TRIMM vines had significant lower soluble solids concentration (degBrix) at
harvest compared to C but no significant effect was recorded in 2011(Fig 39) TA and pH did not
show any difference between treatments in all years (Table 10) Daily soluble solids accumulation
rate has been reduced after trimming in 2009 and 2010 of 8 and 16 and not at all in 2011
compared to control vines
In 2011 the extremely hot and dry climatic conditions led to an acceleration in the accumulation of
soluble solids so that 23 days after veraison the degBrix level of C reached the 24 degBrix (Fig 39)
while in 2009 and 2010 this value was reached respectively 42 and 58 days after veraison Under
91
such circumstances associated with a general lower level of yield in 2011 compared to the previous
years the grapes of TRIMM vines did not show differential accumulation rate and no significant
difference was recorded in berry composition compared to Control in this year This result is in
agreement with the high value of leaf area to yield ratio (Table 9) measured in TRIMM vines in
2011 which is considered adequate to allow an optimal ripening
Fig 39 degBrix in the control and trimmed vines from veraison to harvest of the years 2009 2010 and 2011
92
34 Anthocyanins accumulation during ripenning
Total anthocyanin concentration (mgkg) did not differ among treatments during ripening in all the
experimental years (Fig40) and no variation was registered at harvest (Table 10) Although no
difference was recorded among the treatments the anthocyanins concentrations were different
among the years (Fig40) The lowest anthocyanin value at harvest was registered to be in 2009 and
the maximum was observed in 2011 (Fig40) These results do not seem correlated with the different
temperature trend in the experimental years because in the both 2009 and 2011 the temperature
exceeded to the critical value for anthocyanin accumulation for periods with similar length Having
the lowest berry weight in 2011 is probably the reason of the highest anthocyanin value registered at
harvest in the grapes of both treatments as compared to the previous years (Table 9 10)
Notably no relation has been verified between the reduction in soluble solids accumulation
occurred in 2009 and in 2010 and variation in anthocyanins accumulation
In particular in 2009 when the trimming was effective in slowing down the rate of sugar
accumulation the correlation between total anthocyanin content (mg per berry) and berry juice
soluble solids concentration showed similar curves for TRIMM and C (Fig 41) Both treatments
showed an increasing positive trend between 10deg Brix to 22deg Brix where there is a peak
concentration and a decline in anthocyanins during the latter stage of ripening (Fig 41) Our results
are in acordance with Guidoni et al (2008) who demonstrated that anthocyanins may accumulate in
a two-phase process with an initial phase of rapid increase and a second phase where anthocyanins
and sugars are uncoupled
As other authors pointed out sugar accumulation was shown to be more strictly associated to
thermal time whereas anthocyanin accumulation was also affected by other sources of variations
(water yield and climatic conditions) (Sadras et al 2007) and in general displays a much wider
range of variation than that of sugars
93
Fig 40 The anthocyanin concentration in the control and trimmed vines from veraison to harvest of the years 2009
2010 and 2011
Fig 41 The correlation between the total anthocyanin content and berry soluble solids concentration in the control and
trimmed vines from veraison to harvest of the year 2009
94
Besides the analysis of the anthocyanin composition at harvest did not show significant difference
between the treatments in all the three years The percentage of delfinidid 3-G cyanidin 3-G
peonidin 3-G petunidin -3-G and malvidin 3-G in berries of TRIMM and C vines showed the
typical Sangiovese grape profile with high level of cyanidin 3-G and malvidin 3-G (Fig 42) It
seems that the biosynthesis of each individual anthocyanin is not influenced by the variation of
sugar concentration in the berries at harvest as occurred in 2009 and 2010
Moreover the trimming treatment did not modify cluster microclimatic conditions which are found
to be responsible for anthocyanin profile changes as reported after cluster shading (Downey et al
2004) and temperature variation (Mori et al 2005)
Fig 42 The anthocyanin profile in the berry skin of control and trimmed vines at harvest of the years 2009 2010 and
2011
95
35 Tannins accumulation during ripenning
In all experimental years trimming did not affect the evolution of seed and skin tannins
concentration expressed as mg per kg of berries during ripening and at harvest (Table 10 Fig 43 45
and 47) The tannins were expressed as mg per kg of berries as no differences were recorded
between treatments in berry weight during ripening (Fig 38)
Similar to what was previously reported on different varieties (Harbertson et al 2002 Kennedy et
al 2002 Downey et al 2003) the levels of seed tannins were higher compared to skin tannins at
veraison but declined during ripening The levels of berry skin and seed tannins reached to nearly
equal levels at harvest (Table 10 Fig 43 45 and 47) By evaluating the seed monomers and
polymers tannins the similar trends were observed in all treatments during ripening and their
concentration (mgkg of berries) in seed polymers was considerably higher than in its monomers as
expected
As well as that the berry tannins composition was assessed from veraison to harvest in each year
and the evolution of all four flavan-3-ols (catechin epicatechin epigallocatechin and epicatechin-
gallate) followed the same tendency between treatments (Fig 44 46 and 48) And among them
epicatechin is the major and catechin is the minor constituent of berry tannins (Fig 44 46 and 48)
Our results assessed that the concentration and composition of each group of tannins compounds at
harvest were not affected by trimming treatment after veraison also when this technique was able to
reduce sugar accumulation rate Moreover it appeared that the concentration of each flavan 3 ols
(catechin epicatechin epigallocatechin and epicatechin-gallate) remains almost constant in the last
thirty days before harvest revealing that both tannins composition and content may be not
responsable of different level of astringency in wine obtained from grapes at different degree of
ripening In other words our results seem to assess a very low effectiveness of the determinations of
each compound in prediction of wine astringency traits As previously pointed out by several
authors the extractability and solubility of each group of flavonoid compounds during ripening may
play an important rule to understand the relationships between berry composition wine composition
and sensory properties of wine
96
Fig 43 The tannins concentration of berry seed and skin in the control and trimmed vines from veraison to harvest of
the year 2009
Fig 44 The tannins composition in the control and trimmed vines from veraison to harvest of the year 2009
97
Fig 45 The tannins concentration of berry seed and skin in the control and trimmed vines from veraison to harvest of
the year 2010
Fig 46 The tannins composition in the control and trimmed vines from veraison to harvest of the year 2010
98
Fig 47 The tannins concentration of berry seed and skin in the control and trimmed vines from veraison to harvest of
the year 2011
Fig 48 The tannins composition in the control and trimmed vines from veraison to harvest of the year 2011
99
Table 10 Berry composition in the control and trimmed vines at harvest of the years 2009 2010 and 2011
Parameters 2009 2010 2011 Year x
Treatment
Interaction C TRIMM C TRIMM C TRIMM
Soluble solids (degBrix) 252 a 246 b 237 a 23 b 264 a 272 a ns
Total acidity (gl) 738 a 723 a 779 a 796 a 844 a 891 a ns
pH 353 a 347 a 339 a 336 a 339 a 336 a ns
Total anthocyanins
(mgkg berries)
7961 a 8381 a 11177 a 11200 a 17080 a 18100 a
Total tannins 3506 a 3547 a 3330 a 3107 a 3699 a 3522 a ns
Total tannins in skin 1006 a 1196 a 1466 a 1243 a 1697 a 1722 a ns
Total tannins in seed 2600 a 2352 a 1864 a 1864 a 2002 a 1800 a ns
4 CONCLUSION
The source limitation by trimming after veraison showed some perspectives to achieve lower sugar
accumulation in grape and lower alcohol potential in wines without inducing modification in the
evolution of the main assessed flavonoids compounds (skin anthocyanins total seeds and skin
tannins concentration and profile) in Sangiovese berries
The efficiency of this technique seems to be strongly depending from the vines starch supply as the
possible carbohydrate reserve depletion induced year over year by trimming may be responsible for
self regulation mechanism of yield constraint verified in the second and third year of the trial In this
condition the leaf area cutback after veraison is counterbalanced by the yield lowering and no effects
is obtained in lowering sugar accumulation as the leaf area yield ratio is maintained to high level
Probably the low fertility condition of the vineyard site and the lack of irrigation system may have
promoted this mechanism
Further researches on photosynthetic limitation after veraison to reduce sugar accumulation will be
focused on vines in different soil fertility condition and on the evaluation of the extractability of
tannins from seeds and skins in wines or wine-like solutions derived from this treatment
100
5 GENERAL CONCLUSION
Wine grape must deal with serious problems which occur due to the unfavorable climatic conditions
resulted from global warming
The excessive elevated temperatures are critical for grapevine and contribute to degradation of grape
and wine quality As an illustration elevated temperature is an important factor that can negatively
affect anthocyanin accumulation in grape Particularly cv Sangiovese was identified to be very
sensitive to such condition The expressions of the genes involved in flavonoid biosynthesis were
observed to be affected by temperature The quantitative real-time PCR analysis showed that
flavonoid biosynthetic genes were slightly repressed by high temperature As well as that the heat
stress showed to repress the expression of the transcription factors VvMYBA1 that activates the
expression of UFGT
Moreover high temperatures showed to had repressing effects on the activity of the flavonoids
biosynthetic enzymes PAL and UFGT
Anthocyanin accumulation in berry skin is due to the balance between its synthesis and oxidation
In grape cv Sangiovese the gene transcription and activity of peroxidases enzyme was found to be
elevated by heat stress as a defensive mechanism of ROS-scavenging
Even if different antioxidant enzymes have been recognized to be involved in flavonoids
degradation under various abiotic stresses this research identifies peroxidases as one of the best
candidate to oxidize anthocyanins actively
Between many isoforms of peroxidases genes which are expressed in grape berry skin from
veraison to harvest one peroxidase gene (POD 1) induced in Sangiovese grape under thermal stress
condition was isolated and evaluated via the technique of genes transformation from grape to
Petunia flower Reduction in anthocyanins concentration in POD 1 transformed Petunia flowers was
assessed after thermal stress conditioning compared to untrasformed control
Biochemical and molecular studies confirmed the role of peroxidases enzyme in active anthocyanins
degradation in Sangiovese cv grape skin under temperature stress conditions Based on our results
a similar mechanism that will be object of further investigation may be supposed for flavonols
degradation In conclusion this study showed that the temperature regimes after veacuteraison have
different effects on each flavonoid group Although the anthocyanin proanthocyanidin and flavonol
share the main part of their biosynthetic pathway no effects were obtained regarding any changes in
the biosynthesis of the proanthocyanidins under these different thermal ripening conditions
101
Moreover the present study is the pioneer to approve that the mechanism of anthocyanin loss in
grape skins due to high temperature involves not only the inhibition of anthocyanin biosynthesis but
also its enzymatic degradation
What is more in wine producing regions it is inevitable for the grape growers to adopt some
adaptive strategies to alleviate grape damages to abiotic stress conditions It is necessary to
ameliorate the vintage through improvement of management techniques to face the impacts of
undesirable climatic conditions Therefore in this thesis the technique of post veraison trimming
was done to improve the coupling of the phenolic and sugar ripening in Vitis vinifera L cultivar
Sangiovese
Trimming after veraison allowed to limit the photosynthetic source and showed to be executable to
slow down the rate of sugar accumulation in grape (to decrease the alcohol potential in wines)
without inducing modification in the evolution of the main berry flavonoids compounds
Moreover the present research showed that the efficiency of this technique applied year after year is
related to the ability of the vines to recover charboidrate reserve to prevent self regulation
mechanism of yield constraint
Further researches need to be performed on the evaluation of the extractability of tannins from seeds
and skins in wines or wine-like solutions derived from grape on vines subjected to post veraison
photosynthetic limitation
102
REFERENCES
Adams D 2006 Phenolics and ripening in grape berries J Am J Enol Vitic Vol 57 (3) 249-
256
Alfenito MR Souer E Goodman CD 1998 Functional complementation of anthocyanin
sequestration in the vacuole by widely divergent Glutathione Stransferases J The Plant Cell Vol
101135-1149
Aron PM Kennedy JA 2008 Flavan-3-ols Nature occurrence and biological activity J Mol
NutrFood Res Vol 52 79-104
Bavaresco L Fregoni C 2001 Physiological role and molecular aspects of grapevine stilbenic
compounds In K A Roubelakis-Angelakis (Ed) Molecular biology and biotechnology of the
grapevine pp 153-182
Bennett J Jarvis PCreasy G Trought M 2005 Influence of defoliation on overwintering
carbohydrate reserves return bloom and yield of mature Chardonnay grapevines J Am J Enol
Vitic Vol 56(4) 386-393
Bergqvist J Dokoozlian N Ebisuda N 2001 Sunlight exposure and temperature effects on berry
growth and composition of Cabernet Sauvignon and Grenache in the central San Joaquin Valley of
California J Amer J Enol Vitic Vol 52 (1) 1-7
Bindi M Fibbi L Gozzini B Orlandini S Miglietta F 1996 Modelling the impact of future
climate scenarios on yield and yield variability of grapevine J Clim Res Vol 7 213ndash224
Bogs J Downey MO Harvey JS Ashton AR Tanner GJ Robinson SP 2005
Proanthocyanidin Synthesis and Expression of Genes Encoding Leucoanthocyanidin Reductase and
Anthocyanidin Reductase in Developing Grape Berries and Grapevine Leaves J Plant Physiol Vol
139 652ndash663
Bogs J Ebadi A McDavid D Robinson SP 2006 Identification of the flavonoid hydroxylases
from grapevine and their regulation during fruit development J Plant Physiol Vol 140(1) 279-
291
Boss PK Davies C Robinson S P 1996 Analysis of the expression of anthocyanin pathway
genes in developing Vitis Vinifera L cv Shiraz grape berries and the implications of pathway
regulation J Plant Physiol Vol 111 1059-1066
Boulton R 2001 The copigmentation of anthocyanins and its role in the color of red wine A
critical review J Am J Enol Vitic Vol 52 (2) 67-87
103
Braidot E Zancani M Petrussa E Peresson C Bertolini A Patui S Macrigrave F Vianello A
2008 Transport and accumulation of flavonoids in grapevine (Vitis vinifera L) J Plant signaling
and behavior Vol 3(9) 626 - 632
Broun P 2005 Transcriptional control of flavonoid biosynthesis a complex network of conserved
regulators involved in multiple aspects of differentiation in Arabidopsis J Current Opinion in Plant
Biology Vol 8(3) 272-279
Bucchetti B 2004 Effetti biochimici e molecolari della luce sulla maturazione dellrsquouva nella cv
Sangiovese Tesi di Dottorato di ricerca in Colture Arboree ed Agrosistemi Forestali e Paesaggistici
XVII ciclo Universita di Bologna
Bucchetti B Pastore C Filippetti I Intrieri C 2007 Effetti di diverse tecniche colturali sulla
sintesi di antociani in Sangiovese Poster VIII GIORNATE SCIENTIFICHE SOI 8-11052007
(SS)
Buchanan-Wollaston V Morris K 2000 Senescence and cell death in Brassica napus and
Arabidopsis In Programmed Cell Death in Animals and Plants (Garland JM ed) BIOS Scientific
Publishers pp 163ndash174
Butterfield RE Gawith MJ Harrison PA Lonsdale KJ Orr J 2000 Modelling climate
change impacts onwheat potato and grapevine in Great Britain in Downing T E Harrison P A
Butterfield R E and Lonsdale KG (eds) Climate Change Climatic Variability and Agriculture
in Europe An Integrated Assessment Final Report Environmental Change Institute University of
Oxford 411 p
Buttrose MS Hale CR Kliewer WM 1971 Effect of temperature on composition of
lsquoCabernet Sauvignonrsquo berries J Amer J Enol Vitic Vol 22 (2) 71ndash75
Calderon AA Garciaflorenciano E Munoz R Barcelo A R 1992 Gamay grapevine
peroxidase its role in vacuolar anthocyani( di)n degradation J VITIS Vol 31(3) 139ndash147
Candolfi-Vasconcelos M Candolfi M Kohlet W 1994Retranslocation of carbon reserves from
the woody storage tissues into the fruit as a response to defoliation stress during the ripening period
in Vitis vinifera L
Castellarin SD Pfeiffer A Sivilotti P Degan M Peterlunger E Di Gaspero G 2007
Transcriptional regulation of anthocyanin biosynthesis in ripening fruits of grapevine under seasonal
water deficit J Plant Cell and Environment Vol 30 1381ndash1399
Castellarin SD Di Gaspero G Marconi R Nonis A Peterlunger E Paillard S Adam-
Blondon AF Testolin R 2006 Colour variation in red grapevines (Vitis vinifera L) genomic
104
organisation expression of flavonoid 3-hydroxylase flavonoid 35-hydroxylase genes and related
metabolite profiling of red cyanidin-blue delphinidin-based anthocyanins in berry skin J BMC
Genomics Vol 7(12) 1471-2164
Chen G Asada K 1989 Ascorbate Peroxidase in tea leaves occurrence of two isozymes and the
differences in their enzymatic and molecular properties J plant cell physiol Vol 30 (7) 987-998
Chen J Wen P Kong W Pan Q Wan S Huang W 2006 Changes and subcellular
localizations of the enzymes involved in phenylpropanoid metabolism during grape berry
development J Plant phisiol Vol 163 (2) 115-127
Cheynier V Rigaud J 1986 HPLC separation and characterization of flavonols in the skin of
Vitis Vinifera var Cinsault J Am J Enol Vitic Vol 37 248-252
Christie P Alfenito M R Walbot V 1994 Impact of low temperature stress on general phenyl
propanoid and anthocyanin pathways enhancement of transcript abundance and anthocyanin
pigmentation in maize seedlings J Planta Vol 194 541ndash549
Chua CS Biermann D Goo K S Sim T 2008 Elucidation of active site residues
of Arabidopsis thaliana flavonol synthase provides a molecular platform for engineering flavonols
J Phytochem Vol 69 (1) 66ndash75
Cohen S Tarara J Kennedy J 2012 Diurnal temperature range compression hastens berry
development and modifies flavonoid partitioning in grapes J Am J Enol Vitic vol 63(1) 112-
120
Conde C Silva P Fontes N Dias A Tavares R M Sousa M Agasse A Delrot S Geroacutes
H 2007 Biochemical changes throughout grape berry development and fruit and wine quality
httphdlhandlenet18226820
Conner AJ Albert NW Deroles SC 2009 Transformation and regeneration of petunia C
Springer Springer Science+Business Media LLC Chapter 19 pp 395-409
Coombe B G 1992 Research on Development and Ripening of the Grape Berry J Am J Enol
Vitic Vol 43(1) 101-110
Cortell JM M Halbleib AV Gallagher T Righetti and JA Kennedy 2007a Influence of vine
vigor on grape Vitis vinifera L cv Pinot noir) anthocyanins 1 anthocyanin concentration and
composition in fruit J Agrie Food Chem 556575-6584
Darneacute G 1993 New hypothesis on anthocyanin biosynthesis in berries and leaves of grapevine J
Vitis Vol 32 77-85
105
Dat JF Foyer CH Scott IM 1998 Changes in salicylic acid and antioxidants during induced
thermotolerance in mustard seedlings J Plant Physiol Vol 118 1455ndash1461
Davies KM Schwinn KE 2003 Transcriptional regulation of secondary metabolism J
Functional Plant Biology Vol 30(9) 913 ndash 925
Dela G Or E Ovadia R Nissim-Levi A Weiss D Oren- Shamir M 2003 Changes in
anthocyanin concentration and composition in lsquoJaguarrsquo rose flowers due to transient
hightemperature conditions J Plant Sci Vol 164 333ndash340
Deluc L Bogs J Walker AR Ferrier T Decendit A Merillon JM Robinson SP Barrieu
F 2008 The transcription factor VvMYB5b contributes to the regulation of anthocyanin and
proanthocyanidin biosynthesis in developing grape berries J Plant Physiol Vol (147) 2041ndash2053
Dokoozlian NK 2000 Grape berry growth and development Raisin Production Manual Chapter
5 pp 30- 37
Downey MO Dokoozlian NK Krstic MP 2006 Cultural Practice and environmental Impacts
on the flavonoid composition of grapes and wine A review of recent research J Amer J Enol
Vitic Vol 57 (3) 257-268
Downey MO Harvey JS Robinson SP 2003 Analysis of tannins in seeds and skins of Shiraz
grapes throughout berry development J Aust J Grape Wine Res Vol 9 15-27
Downey MO Harvey JS Robinson SP 2003 Synthesis of flavonols and expression of
flavonol synthase genes in the developing grape berries of Shiraz and Chardonnay (Vitis Vinifera
L) J Aust J Grape Wine Res Vol 9 110-121
Downey MO Harvey JS Robinson SP 2004 The effect of bunch shading on berry
development and flavonoid accumulation in Shiraz grapes J Aus J Grape Wine Res Vol 10 55-
73
Dry I B Robinson S P 1994 Molecular cloning and characterization of grape berry polyphenol
oxidase J Plant Molecular Biology Vol 26 495-502
Duchene E Schneider C 2005 Grapevine and climatic changes a glance at the situation in
Alsace Agron J Sustain Dev Vol 25 93ndash99
Fasoli M Dal Santo S Zenoni S Tornielli GB Farina L Zamboni A Porceddu A
Venturini L Bicego M Murino V Ferrarini A Delledonne M Pezzotti M 2012 The
grapevine expression atlas reveals a deep transcriptome shift driving the entire plant into a
Maturation Program J The Plant Cell Vol 24 3489ndash3505
Ferrini F Mattii GB Nicese FP 1995 Effect of Temperature on Key Physiological Responses
of Grapevine Leaf J Am J Enol Vitic Vol 46(3) 375-379
106
Filippetti I 2009 Technological and Phenolic ripening synchronization in winegrape Data has not
been published
Filippetti I Ramazzotti S Centinari M Bucchetti B Intrieri C 2007 Effects of cluster
thinning on grape composition experience ldquoSangioveserdquo grapevines Proc Int Workshop on
Advance in Grapevine and Wine Research
Fournand D Vicens A Sidhoum L Souquet JM Moutounet M Cheynier V 2006
Accumulation and extractability of grape skin tannins and anthocyanins at different advanced
physiological stages J Agric Food Chem Vol 54 7331-7338
Fraser E 2008 ldquoCrop yield and climate changerdquo Retrieved on 2009-09-14
Fujita A Soma N Goto-Yamamoto N Mizuno A Kiso K Hashizume K 2007 Effect of
shading on proanthocyanidin biosynthesis in the grape berry J Japan Soc Hort Sci Vol 76 112-
119
Fujita A Goto-Yamamoto N Aramaki I Hashizume K 2006 Organ-Specific Transcription
of Putative Flavonol Synthase Genes of Grapevine and Effects of Plant Hormones and Shading on
Flavonol Biosynthesis in Grape Berry Skins J Biosci Biotech and Biochem Vol 70 (3) 632-
638
Gagneacute S Lacampagne S Claisse O Geacuteny L 2009 Leucoanthocyanidin reductase and
anthocyanidin reductase gene expression and activity in flowers young berries and skins of Vitis
vinifera L cv Cabernet-Sauvignon during development J Plant Physiol amp Biochem Vol 47 (4)
282ndash290
Gatto P Vrhovsek U Muth J Segala C Romualdi C Fontana P Pruefer D Stefanini M
Moser C Mattivi F Riccardo Velasco R 2008 Ripening and genotype control stilbene
accumulation in healthy grapes J Agric Food Chem Vol 56 (24) 11773ndash11785
Gollop R Even S Colova-Tsolova V Peri A 2002 Expression of the grape dihydroflavonol
reductase gene and analysis of its promoter region J Exp Bot Vol 53 1397ndash1409
Gollop R Farhi S Perl A 2001 Regulation of the leucoanthocyanidin dioxygenase gene
expression in Vitis vinifera J Plant Sci Vol 161 (3) 579ndash588
Goto-Yamamoto N Mori K Numata M Koyama K Kitayama M 2009 Effects of
temperature and water regimes on flavonoid contents and composition in the skin of red-wine
grapes J Int Sci Vigne Vin Vol 43 (1) 75-80
Goto-Yamamoto N Wan GH Masaki K Kobayashi S 2002 Structure and transcription of
three chalcone synthase genes of grapevine (Vitis vinifera) J Plant Sci Vol 162 867-872
107
Greer D H Weston C 2010 Heat stress affects flowering berry growth sugar accumulation and
photosynthesis of Vitis vinifera cv Semillon grapevines grown in a controlled environment J
Functional Plant Biol Vol 37(3) 206ndash214
Guidoni S Ferrandino A Novello V 2008 Effects of seasonal and agronomical practices on
skin anthocyanin profile of Nebbiolo grapes JAm J Enol Vitic Vol 59(1) 22-29
Guidoni S Ferrandino A Novello V 2004 Ruolo del clima e degli interventi colturali sulla
sintesi degli antociani nellrsquouva (Vitis Vinifera L cv Nebbiolo) J Quad Vitic Enol Univ Torino
27
Guidoni S P Allara and A Schubert 2002 Effect of cluster thinning on berry skin anthocyanin
composition of Vitis vinifera cv Nebbiolo Am J Enol Vitic V 53224-226
Harbertson JF Kennedy JA Adams DO 2002 Tannin in skins and seeds of Cabernet
Sauvignon Syrah and Pinot noir berries during ripening J Am J Enol Vitic Vol 53 (1) 54-59
Hardie WJ OrsquoBrien TP Jaudzems VG 1996 Morphology anatomy and development of the
pericarp after anthesis in grape Vitis vinifera L J Aust J Grape Wine Res Vol 2 97ndash142
Haselgrove L Botting D Van Heeswijck R Hoslashj PB Dry PR Ford C Iland PG 2000
Canopy microclimate and berry composition The effect of bunch exposure on the phenolic
composition of Vitis vinifera L cv Shiraz grape berries J Aust J Grape Wine Res Vol 6 141-
149
Hawker JS 1969a Changes in the activities of enzymes concerned with sugar metabolism during
the development of grape berries J Phytochem Vol 8 9-17
Hawker JS 1969b Insoluble invertase from grapes an artefact of extraction J Phytochem Vol
8 337-344
Hellens RP Edwards EA Leyland NR Bean S Mullineaux PM 2000 pGreen a versatile
and flexible binary Ti vector for Agrobacterium-mediated plant transformation J Plant Mol Biol
Vol 42 819-832
Hiratsuka S Onodera H Kawai Y Kubo T Itoh H Wada R 2001 ABA and sugar effects on
anthocyanin formation in grape berry cultured in vitro J Scientia Horticulturae Vol 90 (1-2) 121-
130Hrazdina G Parsons GF Mattick LR 1984 Physiological and biochemical events during
development and maturation of grape berries J Amer J Enol Vitic Vol 35 (4) 220ndash227
Huglin P 1978 Nouveau Mode drsquoEacutevaluation des Possibiliteacutes Heacuteliothermiques drsquoun Milieu
Viticole CR Acad Agr France Vol 64 1117-1126
Hugueney P Provenzano S Verriegraves C Ferrandino A Meudec E Batelli G Merdinoglu D
Cheynier V Schubert A Ageorges A 2009 A novel cation-dependent o-methyltransferase
involved in anthocyanin methylation in grapevine J Plant Physiol Vol 150 (4) 2057- 2070
108
Intrieri C 1994 Vini frizzanti interventi agronomici per il controllo della maturazione J
Lrsquoenotecnico Vol 9 65-72
Intrieri C Magnanini E Silvestroni O 1983 Effetti della potatura verde sul comportamento
vegetativo e produttivo di Albana e Sangiovese J Vignevini Vol 5 57-62
Intrieri C Silvestroni O Poni S 1994 ndash Pluker nuova defogliatrice polivalente per vigneti
Vignevini Vol 1-2 25 ndash 31
involvement of leucoanthocyanidin dioxygenase J Planta Vol 229( 2) 427-445
J Planta Vol 192(4) 567-573
Jackman RL Smith JL 1996 Anthocyanins and betalains In Hendry GAF Houghton JD eds
Natural food colorants 2nd
edn London Chapman amp Hall pp 244ndash309
Jeong ST Goto-Yamamoto N Kobayashi S Esaka M 2004 Effects of plant hormones and
shading on the accumulation of anthocyanins and the expression of anthocyanin biosynthetic genes
in grape berry skins J Plant Sci Vol 167 247-252
Jeong ST Goto-Yamamoto N Hashizume K Esaka M 2006 Expression of the flavonoid 3prime-
hydroxylase and flavonoid 3prime5prime-hydroxylase genes and flavonoid composition in grape (Vitis
vinifera) Plant Sci Vol 170 (1) 61ndash69
Jiang YM Duan X Joyce D Zhang Z Li J 2004 Advances in understanding of enzymatic
browning in harvested litchi fruit J Food Chem Vol 88 443ndash446
Jones GV White MA Cooper OR Storchmann K 2005 Climate change and global wine
quality J Climatic Change Vol 73 319ndash343
Kader F Haluk JP Nicolas JP Metche M 1998 Degradation of cyanidin 3-glucoside by
blueberry polyphenol oxidase kinetic studies and mechanisms J Agric Food Chem Vol 46
3060ndash 3065
Kader F Nicolas JP Metche M 1999 Degradation of pelargonidin 3-glucoside in the presence
of chlorogenic acid and blueberry polyphenol oxidase J Sci Food Agric Vol 79 517ndash522
Kader F Rovel B Girardin M Metche M 1997 Mechanism of browning in fresh highbush
blueberry fruit (Vaccinium corymbosum L) Role of blueberry polyphenol oxidase chlorogenic acid
and anthocyanins J Sci Food Agric Vol 74(1) 31ndash34
Karimi M Inzeacute D Depicker A 2002 GATEWAYtrade vectors for Agrobacterium-mediated plant
transformation J Trends in Plant Sci Vol 7(5) 193ndash195
Kemp BS Harrison R Creasy GL 2011 Effect of mechanical leaf removal and its timing on
flavan-3-ol composition and concentrations in Vitis vinifera L cv Pinot Noir wine J Aust J Grape
Wine Res Vol 17(2) 270ndash279
109
Kennedy JA Jones GV 2001 Analysis of Proanthocyanidin Cleavage Products Following
Acid-Catalysis in the Presence of Excess Phloroglucinol Amer J Enol Vitic Vol 49(4) 1740-
1746
Kennedy JA Matthews MA Waterhouse AL 2000 Changes in grape seed polyphenols during
fruit ripening J Phytochem Vol 55 77-85
Kennedy JA Matthews MA Waterhouse AL 2002 Effect of maturity and vine water status
on grape skin and wine flavonoids J Am J Enol Vitic Vol 53 268-274
Kennedy JA Saucier C Glories Y 2006 Grape and Wine Phenolics History and Perspective
J Am J Enol Vitic Vol 57 (3) 239-248
Kenny GJ Harrison PA 1992 The effects of climate variability and change on grape suitability
in Europe J Wine Res Vol 3 163ndash183
King P McClellan D Smart R 2012 Effect of severity of leaf and crop removal on grape and
wine composition of Merlot vines in Hawkersquos bay vineyards J Am J Enol Vitic ajev201212020
Kliewer W M 1970 Effect of day temperature and light intensity on coloration of Vitis vinifera
grapes J Amer Soci Hort Sci Vol 95 693ndash697
Kliewer W M Torres R E 1972 Effect of controlled day and night temperatures on grape
coloration J Amer J Enol Vitic Vol 23 71ndash77
Kliewer W Dokoozlian N 2005 Leaf areacrop weight ratios of grapevines influence on fruit
composition and wine quality J Am J Enol Vitic Vol 56(2) 170-181
Kliewer WM 1966 Sugars and organic acids of Vitis Vinifera J Plant PhysiolVol 41 923-931
Kliewer WM 1977 Influence of temperature solar radiation and nitrogen on coloration and
composition of Emperor Grapes J AmJ Enol Vitic Vol 28 (2) 96-103
Kobayashi S Goto-Yamamoto N Hirochika H 2004 Retrotransposon-induced mutations in
grape skin color J Sci Vol 304 (5673) 982 p
Kobayashi S Ishimaru M Ding CK Yakushiji H Goto N 2001 Comparison of UDP-
glucose flavonoid 3-O-glucosyltransferase (UFGT) gene sequences between white grapes (Vitis
vinifera) and their spots with red skin J Plant Sci Vol 160 543-550
Kobayashi S Ishimaru M Hiraoka K Honda C 2002 Myb-related genes of the Kyoho grape
(Vitis labruscana) regulate anthocyanin biosynthesis J Planta Vol 215 924-933
Kriedemann P E 1968 Photosynthesis in vine leaves as a function of light intensity temperature
and leaf age J Vitis Vol 7 213-220
Kuznetsov V V Shevyakova N I 2007 Polyamines and stress tolerance of plants Global science
books Plant stress Vol 1(1) 50-71
110
Laget F Tondut J L Deloire A Kelly M T 2008 Climate trends in a specific Mediterranean
viticultureal area between 1950 and 2006 J Int Sci Vigne Vin Vol 42 (3) 113-123
Lakso A N Kliewer W M 1975 The Influence of Temperature on Malic Acid Metabolism in
Grape Berries J Plant Physiol Vol 56 (3) 370-372
Landy A 1989 Dynamic structural and regulatory aspects of site-specific recombination J Ann
Rev Biochem Vol 58 913ndash949
Larronde F Krisa S Decendit A Chegraveze C Deffieux G Meacuterillon J M 1998 Regulation of
polyphenol production in Vitis vinifera cell suspension cultures by sugars JPlant Cell Reports Vol
17(12) 946-950
Leyva A Jarillo J Salinas J Martinez-Zapater M 1995 Low temperature induces the
accumulation of phenylalanine ammonia-lyase and chalcone synthase mRNAs of Arabidopsis
thaliana in a light-dependent manner J Plant Physiol Vol 108 39ndash46
Lin-Wang K Micheletti D Palmer J Volz R Lozano L 2011 High temperature reduces apple
fruit colour via modulation of the anthocyanin regulatory complex J Plant Cell amp Environment
Vol 34(7) 1176ndash1190
Lo Piero A R Puglisi I Rapisarda P Petrone G 2005 Anthocyanins accumulation and related
gene expression in red orange fruit induced by low temperature storage J Agric Food Chem Vol
53 9083ndash9088
Lough J M Wigley T M L Palutikof J P 1983 Climate and climate impact scenarios for
Europe in a warmer world J Clim Appl Meteorol Vol 22 1673ndash1684
Loslashvdal T Olsen K M Slimestad R Verheul M Lillo C 2010 Synergetic effects of nitrogen
depletion temperature and light on the content of phenolic compounds and gene expression in
leaves of tomato J Phytochemistry Vol 71(5ndash6) 605ndash613
Makra L Vitaacutenyi B Gaacutel A Mika J Matyasovszky I Hirsch T 2009 Wine Quantity and
Quality Variations in Relation to Climatic Factors in the Tokaj (Hungary) Winegrowing Region
Amer J Enol Vitic Vol 60 (3) 312-321
Mann M E Bradley R S Hughes M K 1998 Global-scale temperature patterns and climate
forcing over the past six centuries J Nature Vol 392 779-787
Matsui S Ryugo K Kliewer W M 1986 Growth inhibition of Thompson Seedless and Napa
Gamay berries by heat stress and its partial reversibility by applications of growth regulators J Am
J Enol Vitic Vol 37 (1) 67-71
Mattivi F Guzzon R Vrhovsek U Stefanini M Velasco R 2006 Metabolite profiling of
grape Flavonols and anthocyanins J Agric Food Chem Vol 54 (20) 7692-7702
111
Mazza G Fukumoto L Delaquis P Girard B Ewert B1999 Anthocyanins Phenolics and
Color 426 of Cabernet Franc Merlot and Pinot Noir wines from British Columbia J Agric Food
Chem 474009-427 4017 Menting J G T Scopes R K Stevenson T W 1994
Characterization of Flavonoid 3rsquo5rsquo-Hydroxylase in Microsomal Membrane Fraction of Petunia
hybrida Flowers J Plany Physiol Vol 106 (2) 633- 642
Mazza G Miniati E 1993 Color stabilization and intensification In Mazza G Miniati E (eds)
Anthocyanins in Fruits Vegetables and Grains CRC Press Boca Raton pp 1ndash20
Meyer P Heidmann I Forkmann G Saedler H 1987 A new petunia flower colour generated
by transformation of a mutant with a maize gene J Nature Vol 330 677-678
Mol J 1998 How genes paint flowers and seeds J Trends in Plant Sci Vol 3 212-217
Morais H Ramos C Forgacs E Cserhati T Matos N Almeida V Oliveira J 2002
Stability of anthocyanins extracted from grape skins J Chromatographia Vol 56 173ndash175
Mori K Goto-Yamamoto N Kitayama M Hashizume K 2007a Loss of anthocyanins in red-
wine grape under high temperature J Experimental Botany Vol 58 (8) 1935-1945
Mori K Goto-Yamamoto N Kitayama M Hashizume K 2007a Effect of high temperature on
anthocyanin composition and transcription of flavonoid hydroxylase genes in ldquoPinot noirrdquo grapes
(Vitis vionifera) J Hortic Sci Biotechnol Vol 82 (2) 199-206
Mori K Saito H Goto-Yamamoto N Kitayama M Kobayashi S Sugaya S Gemma H
Hashizume K 2005a Effects of abscisic acid treatment and night temperatures on anthocyanin
composition in lsquoPinot noirrsquo grapes J Vitis Vol 44 161ndash165
Mori K Sugaya S Gemma H 2005b Decreased anthocyanin biosynthesis in grape berries
grown under elevated night temperature condition J Sci Hortic Vol 105 319ndash330
Movahed N Maeiyat MM 2009 Phytoremediation and sustainable urban design methods (Low
Carbon Cities through Phytoremediation) 45th ISOCARP Congress Disponible en
httpwwwisocarpnet Fecha de consulta 04 Septiembre del 2009
Movahed N Masia A Cellini A Pastore C Valentini G Allegro G Filippetti I 2011
Biochemical approaches to study the effects of temperature on grape composition in cv Sangiovese
The 17th
International GIESCO Symposium Asti Italy The proceeding PP 393- 397
Munneacute-Bosch S Alegre L 2004 Die and let live leaf senescence contributes to plant survival
under drought stress J Funct Plant Biol Vol 31 203-216
Nissim-Levi A Kagan S Ovadia R Oren-Shamir M 2003 Effects of temperature UV-light
and magnesium on anthocyanin pigmentation in cocoplum leaves J Hortic Sci Biotechnol Vol
78 61-64
112
Oren-Shamir M Levi-Nissim A 1997a Temperature effects on the leaf pigmentation of Cotinus
coggygria lsquoRoyal Purplersquo J Hortic Sci Vol 72 425ndash432
Oren-Shamir M Levi-Nissim A 1997b UV-light effect on the leaf pigmentation of Cotinus
coggygria lsquoRoyal Purplersquo J Sci Hortic Vol 71 59ndash66
Oren-Shamir M Nissim-Levi A 1999 Temperature and gibberellin effects on growth and
anthocyanin pigmentation in Photinia leaves J Hortic Sci Biotechnol Vol 74 355ndash360
Palliotti A Poni S Berrios JG Bernizzoni F 2010 Vine performance and grape composition
as affected by early-season source limitation induced with anti-transpirants in two red Vitis vinifera
L cultivars J Aust J Grape Wine Res Vol 16 426ndash433
Pastore C 2010 Reserches on berry composition in red grape agronomical biochemical and
molecular approaches Tesi di Dottorato di ricerca in Colture Arboree ed Agrosistemi Forestali e
Paesaggistici XXII ciclo Faculta di Agraria Universita di Bologna
Pereira GE Gaudillere JP Pieri P Hilbert G Maucourt M Deborde C Moing A Roil D
2006 Microclimate influence in mineral and metabolic profiles of grape berries J Agric Food
Chem Vol 54 6765-6775
Pirie A Mullins M1976 Changes in anthocyanin and phenolics content of grapevine leaf and
fruit tissues treated with sucrose nitrate and abscisic acid J Plant Physiol Vol 58(4) 468-472
Pourcel L Routaboul J M Cheynier V Lepiniec L Debeaujon I 2006 Flavonoid oxidation
in plants from biochemical properties to physiological functions JTrends in Plant Sci Vol 12 (1)
29-36
Price SF Breen PJ Valladao M Watson BT 1995 Cluster sun exposure and quercetin in
Pinot noir grapes and wine AmJ Enol Vitic Vol 46 187-194
Quattrocchio F Baudry A Lepiniec L Grotewold E 2006 The regulation of flavonoid
biosynthesis J The science of flavonoids C Springer Chapter 4 pp 97ndash122
Rebucci B Poni S Intrieri C Magnanini E Lakso A N 1997 Effects of manipulated grape
berry transpiration on post-veraison sugar accumulation J Aust J Grape Wine Res Vol 3 57-65
Reynolds A Price S Wardle D Watson B 1994 Fruit environment and crop level effects on
Pinot noir I vine performance and fruit composition in British Columbia J Am J Enol Vitic Vol
45(4) 452-459
Reynolds A Wardle D 1989 Influence of fruit microclimate on monoterpene levels of
Gewuumlrztraminer J Am J Enol Vitic Vol 40(3) 149-154
113
Ristic R Bindon K Francis LI Herderich M J Iland PG 2010 Flavonoids and C13-
norisoprenoids in Vitis vinifera L cv Shiraz relationships between grape and wine composition
wine colour and wine sensory properties J Aust J Grape Wine Res Vol 16 369ndash388
Ristic R Downey M Iland P Bindon K Francis I Herderich M Robinson S 2007
Exclusion of sunlight from Shiraz grapes alters wine colour tannin and sensory properties J Aust
J Grape Wine Res Vol 13(2)53-65
Robinson S P Davies C 2000 Molecular biology of grape berry ripening J Aust J Grape Wine
Res Vol 6 175-188
Robinson S 2006 Colour and tannin during berry development and ripening In ldquoFinishing the
jobrdquo ASVO proceedings held 21 July 2006 Mildura Vic Australia pp 11-14
Roby G Harbertson J F Adams D A Matthews M A 2004 Berry size and vine water
deficits as factors in winegrape composition anthocyanins and tannins J Aust J Grape Wine Res
Vol 10 100- 107
Rolland F Baena-Gonzalez E Sheen J 2006 Sugar sensing and signaling in plants Conserved
and novel mechanisms J Ann Rev Plant Biol Vol 57 675-709
Romero C Bakker J 2000 Effect of storage temperature and pyruvate on kinetics of anthocyanin
degradation Vitisin A derivative formation and color characteristics of model solutions J Agric
Food Chem Vol 48 2135ndash2141
Sadras V 2007 Evolutionary aspects of the trade-off between seed size and number in crops J
Field crop research Vol 100(2-3) 125-138
Sadras VO Petrie P R Moran M A 2013 Effects of elevated temperature in grapevine II juice
pH titratable acidity and wine sensory attributes Australian Journal of Grape and Wine Research
Vol 19 (1) 107ndash115
Sarni P Fulcrand H Souillol V Souquet J M Cheynier V 1995 Mechanisms of anthocyanin
degradation in grape must-like model solutions J Sci Food Agr Vol 69(3) 385ndash391
Scholefield PB May P Neales TF 1977 Harvest-pruning and trellising of lsquoSultanarsquo vines II
Effects on early spring development Sci Hortic Vol 7123-132
Schultz H R 1995 Grape canopy structure light microclimate and photosynthesis I A two
dimensional model of the spatial distribution of surface area densities and leaf ages in two canopy
systems J Vitis Vol 34 211-215
Schultz H R 2000 Climate change and viticulture a European perspective on climatology carbon
dioxide and UV-B effects Aust J Grape Wine Res Vol 6 2ndash12
114
Schultz H R 2003 Extension of a Farquhar model for limitations of leaf photosynthesis induced
by light environment phenology and leaf age in grapevines (Vitis vinifera L cvv White Riesling
and Zinfandel)J Functional Plant Biol Vol 30(6) 673 ndash 687
Sepuacutelveda G Kliewer W M Ryugo K 1986 Effect of high temperature on grapevines (Vitis
vinifera L) I translocation of 14
C-photosynthates J Am J Enol Vitic Vol 37 (1) 13-19
Shaked-Sachray L Weiss D Moshe R Nissim-Levi A Oren- Shamir M 2002 Increased
anthocyanin accumulation in aster flowers at elevated temperatures due to magnesium treatment J
Physiol Plant Vol 114 559ndash565
Shvarts M Borochov A Weiss D 1997 Low temperature enhances petunia flower pigmentation
and induces chalcone synthase gene expression J Physiol Plant Vol 99 67ndash72
Sipiora M J Gutieacuterrez-Granda M J 1998 Effects of pre-veraison irrigation cutoff and skin
contact time on the composition color and phenolic content of young Cabernet Sauvignon wines in
Spain J Amer J Enol Vitic Vol 49 152ndash162
Smart R E 1985 Principles of grapevine canopy microclimate manipulation with implication for
yield and quality J Amer J Enol Vitic Vol 36 230-239
Smith G J Markham K R 1998 Tautomerism of flavonol glucosides - relevance to plant UV
protection and flower colour J Photochem Photobiol A ndash Chem Vol 118 99-105
Soar C J Collins M J Sadras V O 2009 Irrigated Shiraz vines (Vitis vinifera) up regulate gas
exchange and maintain berry growth in response to short spells of high maximum temperature in the
field J Functional Plant Biology Vol 36(9) 801ndash814
Sparvoli F Martin C Scienza A Gavazzi G Tonelli C 1994 Cloning and molecular analysis
of structural genes involved in flavonoid and stilbene biosynthesis in grape (Vitis Vinifera L) J
Plant Molecular Biology Vol 24 743-755
Spayd S E Tarara J M Mee D L Ferguson J C 2002 Separation of sunlight and
temperature effects on the composition of Vitis vinifera cv Merlot berries J Amer J Enol Vitic
Vol 53171-182
Spelt C 2002 Anthocyanin1 of petunia controls pigment synthesis vacuolar pH and seed coat
development by genetically distinct mechanisms The plant cell online Vol 14 2121-2135
Stafford H A 1990 Flavonoid Metabolism CRC Press Boca Raton FL 298 pp
Stracke R De Vos R C H Bartelniewoehner L Ishihara H Sagasser M Martens
S Weisshaar B 2009 Metabolomic and genetic analyses of flavonol synthesis in Arabidopsis
thalianasupport the in vivo
115
Taureilles-Saurel C Romieu C G Robin J P Flanzy C 1995 Grape (Vitis vinifera L) malate
dehydrogenase II Characterization of the major mitochondrial and cytosolic isoforms and their role
in ripening J Am J Enol Vitic Vol 46 (1) 29-36
Tomana T Utsunomiya N Kataoka I 1979 The effect of environmental temperatures on fruit
ripening on the tree II The effect of temperatures around whole vines and clusters on the coloration
of lsquoKyohorsquo Grapes Japan Soc Hort Sci Vol 48 261-266
Treutter D 2006 Significance of flavonoids in plant resistance a review J Environ Chem Lett
Vol 4 147ndash157
Ubi BW Honda C Bessho H Kondo S Wada M Kobayashi S Moriguchi T 2006
Expression analysis of anthocyanin biosynthetic genes in apple skin effect of UV-B and
temperature J Plant Sci Vol 170 571ndash578
Ushimaru T Maki Y Sano S Koshiba K Asada K Tsuji H 1997 Induction of enzymes
involved in the ascorbate-dependent antioxidative system namely ascorbate peroxidase
monodehydroascorbate reductase and dehydroascorbate reductase after exposure to air of rice
(Oryza sativa) seedlings germinated under water J Plant Cell Physiol Vol 38 541-549
Vaknin H Bar-Akiva A Ovadia R Nissim-Levi A Forer I Weiss D Oren-Shamir M
2005 Active anthocyanin degradation in Brunfelsia calycina (yesterday-today-tomorrow) flowers J
Planta Vol 222 19ndash26
Venturini L 2009 Study of some gene families involved in anthocyanin accumulation during Vitis
vinifera berry ripening Tesi di laurea specialistica in biotechnologie agro-industriali faculta di
scienze matematiche fisichie e naturali Universita degli studi di Verona pp7-12 30-51
Wahid A Perveen M Gelani S Basra SMA 2007 Pretreatment of seed with H2O2 improves
salt tolerance of wheat seedlings by alleviation of oxidative damage and expression of stress
proteins J Plant Physiol Vol 164 (3) 283ndash294
Walker AR Lee E Bogs J McDavid D A J Thomas M R Robinson S P 2007 White
grapes arose through the mutation of two similar and adjacent regulatory genes The Plant journal
for cell and molecular biology Vol 49 772-85
Walker J R Ferrar P H 1998 Diphenol oxidases enzymecatalysed browning and plant disease
resistance J Biotechnol Genet Eng Rev Vol 15 457ndash498
Waterhouse A L 2002 Wine Phenolics Ann NY Acad Sci Vol 957 21-36
Watson RT Rodhe H Oeschger H Siegenthaler U 1990 Greenhouse gases and aerosols
httprivernetncsuedu
116
Welinder K G Justesen A F Kjaeligrsga I V H Jensen R B Rasmussen S K Jespersen H M
Duroux L 2002 Structural diversity and transcription of class III peroxidases from Arabidopsis
thaliana J Eur J Biochem Vol 269 6063ndash6081
Wen Y Zhang Y Pan Q 2009 Progress of organic acids in grape berries Natural science
journal of Hainan University S6631
Williams R J Spencer J P Rice-Evans C 2004 Flavonoids antioxidants or signaling
molecules J Free Radic Biol Med Vol 36 838ndash849
Winkel-Shirley B 2002 Biosynthesis of flavonoids and effects of stress J Current opinion in
plant biology Vol 5 218-23
Winkler A J Cook J A Kliewer W M Lider L A 1962 Development and composition of
grapes General viticulture Berkeley CA University of California Press pp 141ndash196
Xie DY Sharma S B Paiva N L Ferreira D Dixon R A 2003 Role of anthocyanidin
reductase encoded by BANYULS in plant flavonoid biosynthesis J Science Vol 299 396ndash399
Yamane T Jeong S T Goto-Yamamoto N Koshita Y Kobayashi S 2006 Effects of
temperature on anthocyanin biosynthesis in grape berry skins J Amer J Enol Vitic Vol 57 54ndash
59
Yamasaki H Sakihama Y Ikehara N 1997 Flavonoid-peroxidase reaction as a detoxification
mechanism of plant cells against H2O2 J Plant Physiol Vol 115 1405-1412
Yokotsuka K Singleton V L 1997 Disappearance of anthocyanins as grape juice is prepared and
oxidized with PPO and PPO substrates J Am J Enol Vitic Vol 48 (1) 13-25
Yoruk R Marshal R M 2003 Physiocochemical properties and function of plant polyphenol
axidase A review J Food Biochem Vol 27 361-422
Yu D J Kim S J Lee H J 2009 Stomatal and non-stomatal limitations to photosynthesis in
field-grown grapevine cultivars J Biologia Plantarum Vol 53 (1) 133-137
Zsoacutefi Z Vaacuteradi G Baacutelo B Marschall M Nagy Z Dulai S 2009 Heat acclimation of
grapevine leaf photosynthesis mezo- and macroclimatic aspects J Functional Plant Biology
Vol 36(4) 310ndash322
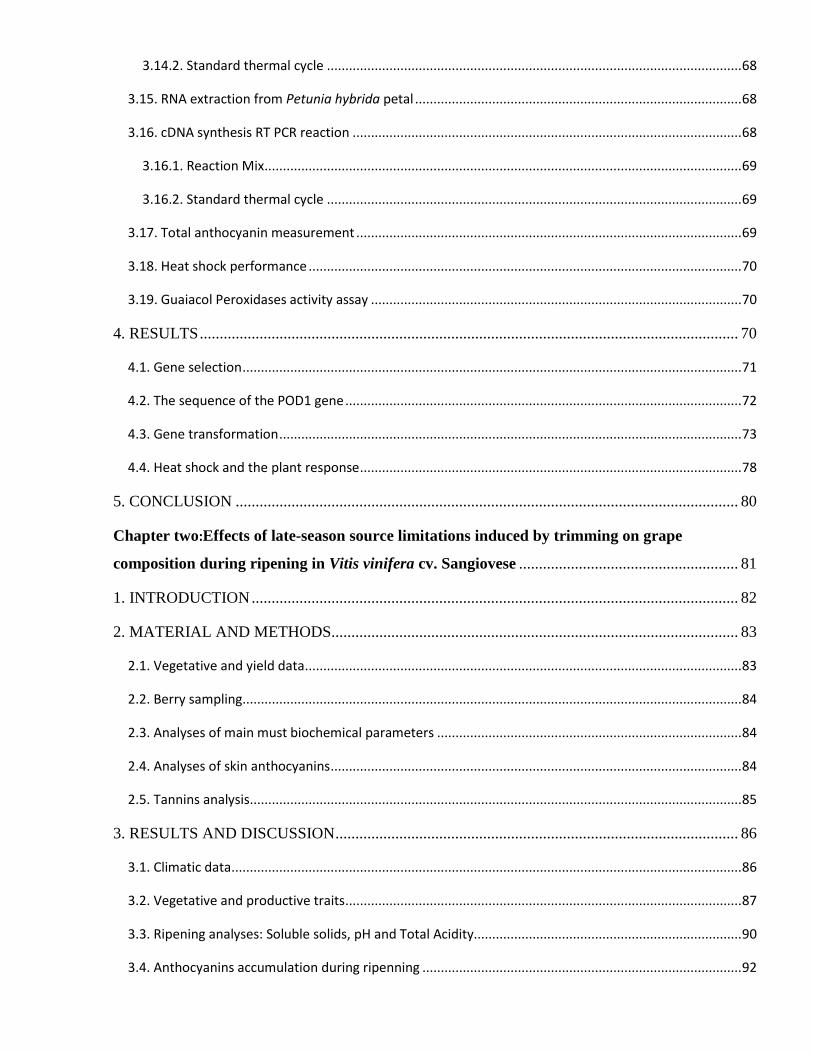
5
3142 Standard thermal cycle 68
315 RNA extraction from Petunia hybrida petal 68
316 cDNA synthesis RT PCR reaction 68
3161 Reaction Mix 69
3162 Standard thermal cycle 69
317 Total anthocyanin measurement 69
318 Heat shock performance 70
319 Guaiacol Peroxidases activity assay 70
4 RESULTS 70
41 Gene selection 71
42 The sequence of the POD1 gene 72
43 Gene transformation 73
44 Heat shock and the plant response 78
5 CONCLUSION 80
Chapter twoEffects of late-season source limitations induced by trimming on grape
composition during ripening in Vitis vinifera cv Sangiovese 81
1 INTRODUCTION 82
2 MATERIAL AND METHODS 83
21 Vegetative and yield data 83
22 Berry sampling 84
23 Analyses of main must biochemical parameters 84
24 Analyses of skin anthocyanins 84
25 Tannins analysis 85
3 RESULTS AND DISCUSSION 86
31 Climatic data 86
32 Vegetative and productive traits 87
33 Ripening analyses Soluble solids pH and Total Acidity 90
34 Anthocyanins accumulation during ripenning 92
6
35 Tannins accumulation during ripenning 95
4 CONCLUSION 99
5 GENERAL CONCLUSION
1
1 GENERAL INTRODUCTION
11 Grape ripening
Grape is a non-climacteric fruit and in non-climacteric fruits ethylene does not appear to have a
major role in ripening Little is known about the factors that regulate the ripening process of grapes
However it seems likely that plant growth substances are involved (Coombe 1992) Grapes exhibit
a double sigmoid pattern of development (Fig 1) with the two distinct phases of growth separated
by a lag phase (Coombe 1992) The ripening phase of grape berry development occurs during the
second period of berry growth and results from expansion of existing pericarp cells (Hardie et al
1996) During the ripening phase a number of major physiological and biochemical changes occur
simultaneously in the grape berry and these determine the quality of the fruit at harvest The onset
of ripening (Veraison) signals the beginning of significant changes in metabolism which include
accumulation of sugar softening of berries synthesis of anthocyanins metabolism of organic acids
accumulation of flavour compounds and changes in the level of growth substances (Fig 1) These
changes are coordinated within each berry but individual berries even those on the same bunch do
not ripen synchronously (Coombe 1992) this results in significant variation between berries even
at harvest This variability represents the significant effect of berry environmental conditions on
berry composition
Fig 1 Schematic representation of grape berry development (Robinson amp Davies 2000)
2
12 Grape berry composition
The dynamic of berry ripening is fundamental to determine final berry composition and as a
consequence grape quality Sugars organic acids and phenolic compounds are the main biochemical
components of grape berry
121 Sugars
Sugar accumulation in grape berries is an important phenomenon degBrix is directly related to the
sugar content (gL) and potential titratable alcohol (vol ) and about 55 of grape berry degbrix
converses to alcohol (Fournand et al 2006) At the beginning of berry development sugars are
produced by the green berries while subsequently berry becomes a typical ldquosinkrdquo organ and uses
carbohydrates produced by photosynthesis of leaves Sucrose produced by leaves is then transported
for long distance to berries into the phloem From veacuteraison xylem flow is almost impeded hence
water may reach berries via phloem with sugars Sucrose the predominant sugar transported in the
phloem accumulates in grape berry in form of glucose and fructose Since at the end of berry
ripening the glucosefructose ratio is approximately equal to 1 the cleavage of sucrose may be
catalysed mainly by invertase (Pastore 2010) The main role of sugars in grape berry is to provide
the carbon skeleton of many compounds (such as organic acids or amino acids) and to be energy
sources for cells By now it is scientifically accepted that sugars play also an important role as
signalling molecules in control of growth and development (Rolland et al 2006)
122 Organic acids
Organic acids are some important flavor compounds in both grapes and wines and the composition
and content of organic acids are closely related to the organoleptic quality of grapes and wine (Wen
et al 2009) Tartaric and malic acids generally represent from 69 to 92 of all organic acids in
grape berries (Kliewer 1966) Small amounts of citric succinic lactic and acetic acids are also
present in the berry While tartaric acid is synthesized until veacuteraison malic acids levels vary highly
during berry ripening As to Dokoozlian 2000 green berries together with leaves are the main
grape organs able to produce organic acids
123 Phenolic compounds
Phenolic compounds of grape are divided into non-flavonoids and flavonoids groups (Robinson
2006)
3
1231 Non-flavonoids
Hydroxycinnamic acids benzoic acids and stilbenes belong to the non-flavonoids group
(Waterhouse 2002)
1231a Hydroxycinnamates
Hydroxycinnamates present in grape berries are derivatives of caffeic p-coumaric and ferulic acids
which are present both in the skin hypodermal cells and in the flesh (Adams 2006) and Caftaric
acid is the predominant hydroxycinnamates in grape (Kennedy et al 2006)
1231b Benzoic acids
Benzoic acids are the minor components in grape berry composition Six derivatives of benzoic
acids (gallic acid protocatechuic acid gentisic acid p-hydroxybenzoic acid vanillic acid and
syringic acid) have been found in grape berry Gallic acid is the major benzoic acid present in grape
berry and it is present in both skin and seeds (Pastore 2010)
1231c Stilbenes
Stilbenes are found in the skin of the grape berry and in vegetative tissues Although stilbenes are
present in low quantity both in berries and wine they have aroused a lot of interest because of their
effects on human health in particular for what concern resveratrol (Bavaresco amp Fregoni 2001)
Resveratrol could exist in different forms in monomeric unit (as dimethylated derivatives trans-
pterostilbene and as in form of 3-O-β-D-glucoside trans- and cis-piceid) or in dimer units
(viniferins) (Gatto et al 2008)
1232 Flavonoids
Flavonoids are a class of plant secondary metabolites which are synthesized from Phenylalanine or
Tyrosine condensed with a malonyl-CoA via the phenylpropanoid pathway This class comprises
more than 6500 known compounds many of which are of great biological and commercial
importance In nature they play important roles in resistance to stresses both abiotic (such as excess
light and high temperature) and biotic (such as resistance to microbes) (Mol 1998 Winkel-Shirley
2002) moreover they are of central importance in the ecological relationships with pollinator
insects and in nodule formation (Downey et al 2006) They comprise both transparent compounds
4
such as the flavanols and brightly coloured ones such as phoblaphenes anthocyanins and
polymeric proanthocyanidins (Robinson 2006) All flavonoids share a common chemical structure
represented by a C15 skeleton (C6-C3-C6) (Fig 2)
Fig 2 Chemical structure of flavonoid molecule (Aron amp Kennedy 2008)
Depending on the position of the linkage of the aromatic ring (B ring) to the benzopyrano moiety (C
ring) we can distinguish the flavonoids (2-phenylbenzopyrans) the isoflavonoids (3-benzopyrans)
and the neoflavonoids (4-benzopyrans) The B ring can further be hydroxylated ortho-
dihydroxylated or vicinal-trihydroxylated (Pastore 2010) Other flavonoids modifications include
methoxylation O-glycosilation of hydroxyl groups or C-glycosilation of flavonoid skeleton carbon
atom Moreover flavonoid glycosides are frequently acylated with aliphatic or aromatic acid
molecules (Aron amp Kennedy 2008) Different classes of flavonoids are commonly detected in grape
such as anthocyanins flavonols and flavan-3-ols (tannins or proanthocyanidins) (Fig 3) Flavonoids
are localized both in berry skin and seeds In particular in hypodermal cells of the skin we can
found tannins flavonol monomeric flavan-3-ols and in red grape anthocyanins
1232a Anthocyanins
Anthocyanins are pigments and represent the major class of flavonoids of the skin of red grape
varieties The anthocyanins commonly found in grape include delphinidin cyanidin petunidin
peonidin and malvidin-3-O-glucosides 3-(6-acetyl) glucosides and 3-(6-p-coumaroyl)-glucosides
In certain grape varieties have been found even traces of peonidin and malvidin 3-(6-caffeoil)-
glucoside Malvidin-3-O-glucoside is the most abundant anthocyanin present in grape
5
Fig 3 Chemical structure of the three main classes of flavonoids present in red grape berry (Adams 2006)
1232b Flavan-3-ols and tannins
Monomeric flavan-3-ols (catechin epicatechin epigallocatechin) are present in the skin at lower
concentrations while they are present at high concentrations in form of polymers within tannins
(proanthocyanidins) Tannins are polymers of different condensed monomers like epicatechin and
epigallocatechin which constitute the chain of the polymers (ldquoextensionrdquo subunits) and catechin
which is present as ldquoterminalrdquo units (Braidot et al 2008) The mean degree of polymerisation
(mDP) which represents the mean length of the tannin chain is of about 28 in berry skin (Bogs et
al 2005)
Flavonoids in the seeds accumulate not only in the external part but even in the inner layers Grape
seeds are the primery source of flavan-3-ols and tannins in grape berries Total tannin content is in
fact higher in seeds than in skin even if seed tannins have a lower mDP The composition of seed
tannins is different comparing to the skin one in so far that in seed tannins generally
6
epigallocatechin is not present and epicatechin gallate is the major constituent of ldquoextensionrdquo
subunits (Adams 2006)
Fig 4This hypothetical condensed tannin is made up of four sub-units catechin epicatechin epigallocatechin
epicatechin gallate The first subunit (catechin) is bound to the second (epicatechin) by an interflavan bond between
carbon 4 of catechin and carbon 8 of epicatechin The first three subunits are referred to as extention subunits and
only the epicatechin gallate has free 4 positions and is thus re-ferred to as a terminal unit (Adams 2006)
1232c Flavonols
Grape and wine contain different classes of polyphenols Flavonols are flavonoids that are found in
higher plants usually in glycosidic forms They are products of the flavonoid biosynthetic pathway
which also give rise to anthocyanins and to condensed tannins in grapevines (Stafford 1990 and
Darne 1993) The main flavonols reported in grape berries are quercetin-3-O-glucoside and
quercetin-3-O-glucuronide (Price et al 1995 Cheynier et al 1986 and Downey et al 2003)
Flavonols are also involved in the stabilization of the flavilium form of anthocyanins in young red
wines through co-pigmentation (Boulton 2001) The highest flavonol concentrations in grapes were
found at flowering followed by a decrease as the grapes increased in size Subsequently a
significant level of flavonol biosynthesis was observed during berry development and the greatest
increase in flavonols per berry can be observed 3-4 weeks post-veraison (Downey et al 2003)
In red grapes the main flavonol is quercetin (mean) 4399) followed by myricetin (3681)
kaempferol (643) laricitrin (565) isorhamnetin (389) and syringetin (322) In white
grapes the main flavonol was quercetin (mean) 8135) followed by kaempferol (1691) and
7
isorhamnetin (174) The delphinidin-like flavonols myricetin laricitrin and syringetin were
missing in all white varieties indicating that the enzyme flavonoid 3hydroxylase is not
expressed in white grape varieties (Mattivi et al 2006)
It is interesting to observe the analogies between the hydroxylation of position 5 which leads to the
formation of the anthocyanidin delphinidin from cyanidin and the flavonol myricetin from quercetin
In addition to this O-methylation of position 3of anthocyanidin cyanidin which leads to the
formation of peonidin corresponds to the O-methylation which converts flavonol quercetin into
isorhamnetin Finally O-methylation of positions 3and 5of anthocyanidin delphinidin which
leads to the formation of petunidin and malvidin corresponds to O-methylation which converts
flavonol myricetin into laricitrin and syringetin (Fig 3)
13 Biosynthesis of flavonoids in red grape berry
Flavonoids are synthesized within the general phenylpropanoid pathway From the same precursors
and towards specific branches these pathways bring to the synthesis of anthocyanins flavonols and
proanthocyanidins (Boss et al 1996) (Fig 5 6) The enzymes involved in flavonoid biosynthesis
are associated at the cytoplasmic surface of the endoplasmic reticulum and represent a multi-enzyme
complex
131 Synthesis of the early products of the phenylpropanoid pathway
1311 PAL
PAL is a key enzyme ubiquitous in plants which catalyzes one of the first steps in
phenylpropanoids biosynthesis (Fig 5) the hydrolysis of ammonia from phenylalanine to produce
cinnamic acid Cinnamic acid is the precursor of all phenolic compounds Recently the subcellular
localization of PAL was found in grape PAL is present in the cell walls secondarily thickened
walls and parenchyma cells of the berry tissues (Chen et al 2006) This enzyme that is a member
of a large gene family has been cloned in many plant species In grape there are probably present
15-20 PAL isoforms (Sparvoli et al 1994)
1312 C4H
The cinnamic acid produced by PAL is converted to p-coumaric acid towards the action of
cinnamate 4-hydrolase (C4H) (Fig 5) C4H belongs to the cytochrome P450 monoxygenases
8
family The enzymes of this family are able to catalyse exothermic reactions that are irreversible In
grape C4H have not yet been cloned but itrsquos known that it is present in the chloroplasts and in the
nucleus of berry tissues (Chen et al 2006)
1313 4CL
One molecule of p-coumaric acid produced by C4H is condensed with an acetil-CoA molecule to
form p-coumaroil-CoA that is the precursor of all the flavonoids (Fig 5) The enzyme which
catalyses this reaction is the 4-coumarate coenzyme A ligase (4CL) 4CL is localized in grape in the
secondarily thickened walls and in the parenchyma cells of the berry pulp vascular tissue (Chen et
al 2006) 4CL belongs to a multi-gene family Itrsquos very interesting to note that the activities of
PAL C4H and 4CL are really correlated and change concomitantly (Chen et al 2006)
Fig 5 The anthocyanin synthesis pathway in plants (Deluc et al 2008)
132 Specific Steps towards flavonoid biosynthesis structural genes involved in flavonols flavan-3-ols
and anthocyanin biosynthesis
1321 CHS
The first enzyme involved specifically in flavonoids biosynthesis is calchone synthase (CHS) (Fig
5 6) CHS catalyzes the condensation of one molecule of p-coumaroil-CoA with three molecules of
malonyl-CoA to produce naringenin chalcone CHS as other enzymes involved in the
9
phenylpropanoid metabolism belongs to a large super-family of proteins the family of type III
Polykethide Synthase
1322 CHI
Naringenin calchone is converted to flavanones (naringenin) to form the flavanoid core towards a
stereo-specific ring closure catalysed by chalchone isomerase (CHI) (Jeong et al 2004) On the
basis of the CHI sequence that doesnrsquot display any detectable homology with other proteins seems
that this enzyme is unique to the plant kingdom (Fig 6)
1323 F3H FLS F3rsquoH F3rsquo5rsquoH
Naringenin is then hydroxylated at position 3 by flavanone 3-hydroxylase (F3H) to form
dihydrokaempferol the flavonols precursor Dihydrokaempferol can be substrate of three different
enzymes which directly bring to the production of the flavonol kaempferol towards the action of
flavonol synthase (FLS) or to the biosynthesis of dihydroquercetin and dihydromyricetin towards
the action respectively of flavonoid-3rsquo-hydroxylase (F3rsquoH) and flavonoid-3rsquo5rsquo-hydroxylase
(F3rsquo5rsquoH) These enzymes catalyse the hydroxylation of the B ring of dihydrokaempferol in 3rsquo or
3rsquo5rsquo positions F3rsquoH activity results in the production of cyanidin-like anthocyanins while F3rsquo5rsquoH
action brings to the production of delphinidin anthocyanins species The cloning of both F3rsquoH and
F3rsquo5rsquoH genes from grape has shown that in grape two copies of F3rsquoH and several copies of F3rsquo5rsquoH
are present in a single chromosome (Bogs et al 2006 Castellarin et al 2006) In flowers of
Petunia Hybrida has been shown that F3rsquoH and F3rsquo5rsquoH can act both on the substrates and products
of F3H (Menting et al 1994) As previously described FLS is the key enzyme in the biosynthesis
of flavonols This enzyme employs dihydrokaempferol dihydroquercetin and dihydromyricetin as
substrates to synthesize the flavonol aglicones (Chua et al 2008)
1324 DFR
FLS directly competes for its substrates with the enzyme dihydroflavonol 4-reductase (DFR) which
catalyses the first step in the conversion of dihydroflavonols to proanthocyanidins or anthocyanins
This point of the biosynthetic pathway is a key regulatory point because it determines the direction
towards flavonols or proanthocyanidins and anthocyanins synthesis DFR is in fact responsible for
the NADPH-dependent reduction at the 4 position of the C ring of dihydroquercetin and
dihydromyricetin to give respectively leucocyanidin or leucodelphinidin (Pastore 2010)
10
1325 ANR LAR LDOX and UFGT
Leucocyanidin and leucodelphinidin are respectively the substrates to the next step of the
proanthocyanidin and anthocyanin biosyntheses which involve either anthocyanidin reductase
(ANR or BAN) and leucocyanidin reductase (LAR) or leucoanthocyanidin dioxygenase (LDOX)
and UDP-glucose flavonoid 3-O-glucosyltransferase (UFGT)
In grape LAR converts leucocyanidin in the flavan-3-ol (+)-catechin with a NADPH-dependent
reduction ANR acts instead on the products of the enzyme LDOX which catalyzes the cyanidin and
delphinidin production from leucoanthocyanidins Then ANR uses these substrates to synthesize
respectively (-)-epicatechin and (-)-epicatechin-3-O-gallate (Gagneacute et al 2009)
As FLS also LDOX belongs to a family of 2-oxoglutarate-dependent oxygenase (Pastore 2010) In
a recent work has been demonstrated that in Arabidopsis Thaliana LDOX could have also a FLS
activity in vivo (Stracke et al 2009) Southern blot experiments conducted on Vitis Vinifera cv Red
Globe have shown that only a single copy of LDOX gene is present in grapevine (Gollop et al
2001) The anthocyanidins cyanidin and delphinidin produced towards the action of LDOX are
then stabilized through the addition of a glucose residue at the 3 position of the C ring This reaction
is catalysed by the enzyme UFGT and allows the anthocyanins transport into the vacuole
UFGT is the key enzyme in anthocyanin biosynthesis because it is expressed only in red skin
cultivars UFGT seems to be present in grape genome as a single copy and it is interesting to note
that its promoter and coding regions have been found also in white cultivar and are similar to the
sequences present in their red-skin sports (Kobayashi et al 2001) The 3-O-glycosilation of
anthocyanin is almost always a prerequisite for further modification as methylation and acylation
1326 OMTs
Methoxyl groups are found in three of the main anthocyanins (peonidin petunidin and malvidin-3-
O-glucoside) This reaction brings to more stable compounds for the methylation of the reactive
hydroxyl groups and the enzymes responsible are O-methyltransferases (OMTs) The first partial
purification and characterization of a methyltransferase catalyzing the methylation of cyanidin-3-
glucoside to peonidin-3-glucoside was performed on a cell suspension of Vitis vinifera cv Gamay
Freaux This enzyme is S-adenosyl-L-methionine (SAM)-dependent and it was shown that it has a
high substrate specificity reacting only with cyanidin and not with delphinidin (Pastore 2010)
11
Fig 6 Diagrammatic representation of the flavonoids biosynthesis pathway Enzymes abbreviation are as given in the
text (Jeong et al 2006)
14 Flavonoid gene expression during berry development
The pattern of flavonoid gene expression (Fig 7) is very different among different organs and
among the different phases of berry ripening Data about the trend in gene expression of some
structural genes of flavonoid biosynthesis in berry skin compared to flesh have been published by
Boss et al in 1996 for red cultivar Shiraz Northern blot analysis of berry skin RNA have shown
that the majority of genes involved in flavonoid biosynthesis are just expressed from flowering to 2-
4 weeks after full bloom and then after veacuteraison Only the expression of the gene UDP Glc-
Flavonoid 3-O-glucosyl Transferase (UFGT) is strictly linked with veacuteraison phase In berry flesh all
the genes analyzed are expressed at lower levels compared to skin except for Phenylalanine
Ammonia Lyase (PAL) and UFGT whose expression was not detectable in the flesh at any stage of
the analysis (Boss et al 1996) The early expression of the genes from CHS to LDOX and FLS
LAR and ANR could be explained by the accumulation of flavonols and tannins in the young berry
12
Regards to the genes encoding anthocyanin modifying enzymes it was demonstrated that the gene
VvF3rsquoH-1 (the only functional isoform identified) is expressed in berry skin of cultivar Merlot
throughout ripening even if its expression decreases 8ndash10 weeks after blooming VvF3H-1
transcripts increase soon after at the onset of veacuteraison and shows a secondary peak of expression
one week before harvest concurrently at the peak of anthocyanin content VvF35rsquoH-1 is instead
weakly expressed during the first stages of berry ripening and the peak of expression is reached
when all berries have turned red Transcripts of the isoforms VvF35H-2-long and VvF35H-2-
medium appear at the onset of veacuteraison and lasted till full ripening while the isogene VvF35H-2-
short was constitutively expressed throughout the ripening (Castellarin et al 2006) In cv Shiraz
both F3rsquoH and F3rsquo5rsquoH transcripts were detected at flowering and in the early stages of berry
ripening but their expression reaches a maximum one week before and a week after veacuteraison
respectively (Bogs et al 2006) Transcriptomic analyses on Shiraz and Nebbiolo grape berries
harvested at different ripening stages have shown that in these varieties the expression of AOMT
follows the same profile AOMT is not expressed before the onset of ripening but after veacuteraison
there is a strong increase in the amount of transcripts during the first weeks and then the expression
decreases and remains constant until harvest (Hugueney et al 2009)
Fig 7 Anthocyanin biosynthetic pathway (Boss et al 1996)
13
141 Regulatory genes of anthocyanin biosynthesis pathway
Among the three classes of flavonoids present in grapevine the regulation of anthocyanins
biosynthesis has been the most studied thanks to the numerous available colour bud sports which
involve alterations in the red or purple berry anthocyanin content Bud sports are usually infrequent
changes in phenotype affecting shoots of woody perennials but colour bud sports are common and
examples in horticultural plants are widespread Alterations in the anthocyanins of a plant can be in
fact very distinct and easily observed and generally have no detrimental effect on the viability of the
plant The molecular basis underlying the appearance of bud sports are not yet well understood
The study of the genes regulating structural genes expression in anthocyanin biosynthesis was at
first done in maize petunia and snapdragon (Davies amp Schwinn 2003) and then full characterized in
Arabidopsis (Broun 2005) From these researches emerged that three different types of transcription
factors play a key roles in regulation of anthocyanin biosynthesis MYB bHLH (basic Helix-Loop-
Helix) and WDR (WD40 repeats) even if the WD40 proteins function seem to be only to assist
MYB and bHLH proteins MYB genes are present in plant genomes as different families The first
experience on MYB genes in grapevine was done on the cultivar Kyoho which belongs to Vitis
labruscana (V Labrusca x V Vinifera) A cDNA library has been constructed with cDNA of ripe
berries and then using random primers designed on maize MYB conserved sequences eight
different grape MYB homologue sequences were identified Among these only four species of
MYB gene can be really identified MYBA MYBB MYBC and MYBD The whole cDNA
sequences of MYBA and MYBB showed the existence of three different species for MYBA
(VlMYBA1-1 VlMYBA1-2 and VlMYBA2) and two for MYBB (VlMYBB1-1 and VlMYBB1-2)
which are different in the nucleotide sequence Transcription analyses revealed that VlMYBA is
only weakly expressed before veacuteraison but immediately after the beginning of anthocyanin
accumulation and berry softening VlMYBA expression rapidly increases VlMYBB expression was
instead detected in all the berry ripening stages analyzed even if also VlMYBB expression increases
after veacuteraison Regards to VlMYBC and VlMYBD these genes seems to be few linked to berry
veacuteraison because the first one is expressed at high levels just at the beginning of ripening and at
veacuteraison the transcription decreases in the case of VlMYBD the expression was detected only in
the early stages of berry ripening The tight relationship between VlMYBA and berry veacuteraison and
anthocyanin accumulation was further confirmed by expression analyses which revealed that
VlMYBA transcripts differentially from the others VlMYB genes identified were detected only in
berry tissues The introduction of VlMYBA1-1 VlMYBA1-2 and VlMYBA2 in embryos causes the
appearance of reddish-purple spots and so the authors concluded that VlMYBA was the
14
transcription factor regulating UFGT expression (Kobayashi et al 2002) The molecular basis of the
regulation of UFGT expression were then confirmed also for Vitis Vinifera and it was shown that
VvMYBA was probably responsible of the ancestral differentiation between red and white cultivar
The white-skinned varieties Italia and Muscat of Alexandria have in fact a GRET1 retrotransposon
inserted in both the alleles of the promoter region of VvMYBA1 gene and this causes the
inactivation of its expression In the grape varieties that have pigmented berry skin at least one
functional VvMYBA1 allele redVvMYBA1 (rVvMYBA1) and one functional VvMYBA2 allele
redVvMYBA2 (rVvMYBA2) have to exist (Walker et al 2007)
In nature the color of grape berry ranges from the lightest pink to the darkest purple tones according
to the amount and quality of anthocyanin accumulated in the berry skin This suggests a polygenic
control of anthocyanin accumulation in Vitis Vinifera despite evidence that the primery
determination of anthocyanin production in berries appeared to be controlled by a single dominant
locus (Barrit amp Einset 1969) Among the 68 unigenes identified a cluster of four VvMYBA genes
(VvMYBA1 VvMYBA2 VvMYBA3 and VvMYBA4) was considered essential to determine the
genetic bases of the quantitative variation of anthocyanin content in berry skin After the
identification of VvMYBA1 the first expression analyses of this gene in grapevine were done by
Jeong et al (2004) on conditioned berry with the aim to alter anthocyanin accumulation The
change in expression levels of VvMYBA1 coincided with the changes in the expression levels of
other tested anthocyanin biosynthetic enzyme genes (CHS1 CHS2 CHS3 CHI1 CHI2 F3H1
F3H2 DFR LDOX and UFGT) and also with the accumulation of anthocyanins in the berry skins
This suggests that the product of VvMYBA1 gene may control the transcription of not only UFGT
but also of other structural genes whose expression increase after veacuteraison
2 Global Warming
Since the beginning of the pre-industrial era around 1750 the atmospheric concentration of
greenhouse gases has increased by about 30 because of the combustion of fossil fuels and changes
in land-use practices Increased atmospheric concentrations of greenhouse gases tend to warm the
atmosphere (Watson et al 1990) The earths climate which has been relatively stable during the
past 10000 years is now changing (Fig 8) The earths surface temperature in this century is
warmer than any other centuries during the 600 years and the last few decades have been the hottest
in this century (Mann et al 1998)
It is clear that global warming will adversely affect human health ecological systems and socio-
economic sectors including human settlements and agriculture (Movahed amp Maeiyat 2009) and
15
particularly viticulture Climate is a pervasive factor in the viability of all forms of agriculture and is
never more important than with the cultivation of grapes for the production of wine (Jones et al
2005) Global warming and viticulture are interrelated processes both of which take place on a
global scale
3 Global warming and viticulture
In the last decades the majority of the worlds highest quality wine-producing regions have
experienced growing season warming trends In these regions future global warming would exceed
a threshold as a result of which the balanced fruit ripening required for existing varieties and wine
styles would become progressively more difficult While improved winemaking knowledge and
husbandry practices contributed to the better vintages it was shown that climate had and will likely
always have a significant role in quality variations (Jones et al 2005)
In northern Europe climate change may produce positive effects on viticulture through introduction
of new varieties (Fig9) higher production and expansion of suitable areas for cultivation
Nonetheless the disadvantages may be an increase in the need for plant protection the risk of
nutrient leaching and the turnover of soil organic matters (Lough et al 1983 Jones et al 2005)
However in southern areas the disadvantages will predominate The possible increase in water
shortage and extreme weather events may cause lower harvestable yields higher yield variability
and a reduction in suitable areas These effects may reinforce the current trends of intensification of
viticulture in Northern and Western Europe and extensification in the Mediterranean and
Southeastern parts of Europe (Lough et al 1983 Jones et al 2005) In general global warming is
projected to have significant impacts on conditions affecting viticulture including temperature
carbon dioxide precipitation increasing demand for irrigation to meet higher evaporation
increasing the incidence of pests and through direct temperature effects on production quality and
quantity and the interaction of these elements (Fraser 2008)
31 The effects of global warming on berry ripening
The maturation of grapevine berries is strongly influenced by the microclimate around the fruit
Global atmospheric warming trend can affect physiological functions involved in fruit maturation
(Jones et al 2005 Mori et al 2007) Acidity anthocyanins and flavonols concentrations in berries
are clearly linked to berry temperature (Haselgrove et al 2000 Bergqvist et al 2001 Spayd et al
2002 Downey et al 2004) while sugar content is strongly influenced by berry transpiration
(Rebucci et al 1997) Daily average temperature at the time of ripening is used to estimate potential
16
temperature impacts on quality Regards to the temperature the specific number of heat units
(degree days DD) that determines rate of berry ripening is typical of each variety In general the
optimum temperature for berry growth and ripening is among 20deg-25degC (Dokoozlian 2000)
The Huglin index enables different viticulture regions of the world to be classified in terms of the
sum of temperatures required for vine development and grape ripening (Huglin 1978) Specifically
it is the sum of mean and maximum temperatures above +10degC (the thermal threshold for vine
development) Different grape varieties are thus classified according to their minimal thermal
requirement for grape ripening For example the HI is 1600 for Riesling and 1900 for Cabernet
Sauvignon (Shultz 2000) (Fig9) As a result of global warming the Huglin index is increasing
(Shultz 2000) (Fig8) so that the average ripening occurs about 1ndash2 months earlier that leads to
degraded fruit and wine quality (Lough et al 1983 Kenny amp Harrison 1992 Butterfield et al
2000 Bindi et al 1996 Jones et al 2005)
Fig 8 Huglin index from 1972 to 2005 (Shultz
2000)
Fig 9 Huglin index for some grape varieties (Shultz 2000)
In general increasing vine temperature may accelerate the rate of some metabolic process even if in
grape it has been demonstrated that above 30degC many metabolic pathways stop or are significantly
reduced (Shaked-Sachray et al 2002 Vaknin et al 2005) Biosynthesis of flavonoids (Fig 7) is
affected by many endogenous and exogenous factors (Jones et al 2005) Among these factors
sitersquos microclimate seems to have the greatest influences on flavonoid content (Downey et al
2006) For instance changes in solar radiation or temperature rise will have a direct impact on grape
composition and thus flavor via alteration of secondary metabolites such as flavonoids amino acids
and carotenoids (Roby et al 2004) Acidity sugar content anthocyanins and flavonols
concentrations in berries are clearly linked to berry temperature (Haselgrove et al 2000 Bergqvist
17
et al 2001 Spayd et al 2002 Downey et al 2004 Rebucci et al 1997) It has been suggested
that light exposure which contribute to higher temperature could control phenols biosynthesis It
could also shift or modify flavonoids composition (Pereira et al 2006 Downey et al 2004
Bucchetti 2004 Guidoni et al 2004 Bucchetti et al 2007 Filippetti 2009 Spayd et al 2002
Haselgrove et al 2000) As to Pastore (2010) late defoliation in grape (that contributes to the
higher light exposure and consequently higher temperature) could decrease titratable acidity In
addition a tendency to decrease in total anthocyanins and modifications in flavonoids composition
such as decrease of cyanidin quercetin and kaempferol and increase of malvidin level was
observed
Among the factors that determine grape wine quality and market value berry skin coloration is one
of the most important factors Grape coloration is attributable to anthocyanin accumulation in the
skin and temperature is an important factor that affects anthocyanin accumulation in grape (Mori et
al 2005b Mori et al 2007 Winkler et al 1962 Jones et al 2005 Kliewer 1970 Buttrose et al
1971 Kliewer and Torres 1972 Yamen et al 2006 Spayd et al 2002) It is reported that high
diurnal temperature generally decrease total anthocyanin amount (Yamane et al 2006 Mori et al
2007a) This effect seems to be particularly significant after veacuteraison and it can be affirmed that high
diurnal temperature generally decreases anthocyanin amount (Winkler et al 1962 Yamane et al
2006 Mori et al 2007a) The results of the stable isotope-labelled tracer experiments to examine
the effect of temperature on the turnover of anthocyanin in the skin indicated that the total
anthocyanin contents were highest in berries cultured at 25degC and lowest at 35degC and confirmed the
loss of anthocyanins in response to high temperature In the berries cultured at 35degC the total
content of 13
C- labeled anthocyanin was markedly reduced while there was no decrease in labelled
anthocyanin content in the skin of berries at 15degC and 25degC (Mori et al 2005)
The results of the study on the effect of temperature on anthocyanin composition has indicated that
the amount of all anthocyanins except malvidin 3-O glucoside was reduced by high temperature
(Romero and Bakkar 2000 Morais et al 2002 Mori et al 2007) In general methoxylation
glycosylation and acylation lead to an increase in the thermal stability of anthocyanin (Jackman and
Smith 1996) High temperature increases the degradation rate of anthocyanins but it has been
assumed that this degradation rate depends on the anthocyanin structure (Jackman and Smith 1996
Sipiora and Gutierrez-Granda 1998 Mori et al 2007) It is reasonable that only malvidin
derivatives which are highly methylated anthocyanins were accumulated and were more stable than
other anthocyanins (Mori et al 2007) The decrease in anthocyanin accumulation under high
temperature may result from factors such as anthocyanin degradation as well as the inhibition of
mRNA transcription of the anthocyanin biosynthetic genes (Mori et al 2007) Temperature might
18
affect not only the synthesis but also the stability therefore the decrease in anthocyanin
concentration at elevated temperatures might result from both decrease in synthesis and increase in
degradation (Shaked-Sachray et al 2002 Vaknin et al 2005)
In Vitis vinifera berries the most important pigments are derived from delphinidin cyanidin
petunidin peonidin and malvidin (Castellarin et al 2006) Although the corresponding
anthocyanins can be formed by the formation of acetic caffeic or p-coumaric acid esters they are
usually formed by the addition of a 3-O glucose It is therefore unsurprising that one of the genes
most up-regulated during the anthocyanin accumulation in grape berries is UFGT (Walker et al
2007) In the flavonoids biosynthesis pathway anthocyanins are the last products of
phenylpropanoid pathway It has been determined that anthocyanins are synthesized from
phenylalanine through an anthocyanin biosynthesis pathway (Fig 7) regulated by enzyme activities
(Hrazdina et al 1984) and gene expressions (Boss et al 1996) Some anthocyanin biosynthetic
pathway genes including a large number of isogenes phenylalanine ammonia lyase (PAL) chalcone
synthase (CHS) chalcone isomerase (CHI) flavanone 3-hydroxylase (F3H) dihydroflavonol 4-
reductase (DFR) leucoantho-cyanidine dioxygenase (LDOX) and UDP-glucose flavonoid 3-O-
glucosyltransferase (UFGT) etc- have been cloned (Sparvoli et al 1994) It has already been
established that in many plants the gene expression of the enzymes involved in anthocyanin
biosynthesis is affected by temperature In general the expression of the anthocyanin biosynthetic
genes was induced by low temperature in different specious (Mori et al 2005b 2007 Yamane et
al 2006 Christie et al 1994 Shvarts et al 1997 Lo Piero et al 2005 Leyva et al 1995 Shaked-
Sachray et al 2002 and Dela et al 2003) Very interesting is also the effect of different night
temperature on anthocyanin biosynthesis Warm night contributes to decrease of anthocyanin
content of grape berry skin The enzymatic activities of PAL and UFGT in the skin of Darkridge
berries grown under high (3030 degC) night temperature conditions were decreased significantly after
veraison (Mori et al 2005 Mazza and Miniati 1993 Kliewer and Torres 1972)
Flavonoids protect plants against various biotic and abiotic stresses Their oxidation reactions only
occur after senescence or an environmental stress This oxidation plays a role in defending the plant
against various biotic and abiotic stresses (Treutter 2006 Buchanan-Wollaston and Morris 2000
Munneacute-Bosch and Alegre 2004) Since grape berries grown under high temperature would receive
oxidative stress (Mori et al 2007) Flavonoids oxidation (eg Anthocyanin degradation) occurs in
order to defend the plant This reaction in plants is mainly catalyzed by polyphenol oxidases
(catechol oxidases and laccases) and peroxidases (Pourcel et al 2006) It was also reported that
among the candidates for anthocyanin degradation enzyme such as polyphenol oxidases (PPOs) and
peroxidases (PODs) peroxidases are involved in active anthocyanin degradation of Brunfelsia
19
calycina flowers (Vaknin et al 2005 Welinder et al 2002) While polyphenol oxidases increased
the rate of anthocyanin degradation in fruit extracts and juices (Kader et al 1997- 1998- 1999 Sarni
et al 1995) PPOs are not likely candidates for degrading anthocyanins in living tissues because of
their location in plastids (Vaknin et al 2005) Peroxidases in vacuoles have also been found in
grape cells and would be involved in anthocyanin degradation in the presence of H2O2 (Calderon et
al 1992) H2O2 levels in plant tissues have been shown to increase in response to heat stress (Dat
et al 1998) Flavonoid-PODs reaction might function as a mechanism for H2O2-scavenging and
therefore plant cell detoxification (Pourcel et al 2006) Gene chips micro ray analysis showed that
grape berries grown under high temperature would receive oxidative stress (since genes encoding
peroxidases and some oxidoreduction enzymes were induced (Mori et al 2007) The indication that
oxidative enzymes are involved in this process is the fact that treatment with reducing agents (such
as glutathione and DTT) and protein synthesis inhibitors (like cycloheximide and anisomycin) both
caused inhibition of anthocyanin degradation (Vaknin et al 2005) In addition the effect of
temperature on fruit foliage and flower pigmentation has shown that fading of Aster flowers color
due to high temperature could be prevented by stabilizing the pigments (Shaked-Sachray et al
2002 Nissim-levi et al 2003 Oren-Shamir and Nissim-levi 1997a 1997b 1999 Vaknin et al
2005) These findings suggest that anthocyanin degradation plays a crucial role in pigment
concentration under low rate of bisynthesis Peroxidase activity is specific and involved in the
pigment degradation (Vaknin et al 2005) Mechanisms of flavonoid oxidation lead to brown
polymers (Pourcel et al 2006 Walker and Ferrar 1998 Yoruk R and Marshall 2003 Jiang et al
2004) The browning of peel of litchi fruits has been correlated with the rapid degradation of red
anthocyanin pigments this process is associated with enzymatic oxidation of phenolics by
polyphenol oxidases (PPO) andor peroxidases (POD) (Jiang et al 2004) Although the effects of
temperature on grape berry composition and particularly on the content of anthocyanins in skins
have been studied intensively (Kliewer 1970 Buttrose et al 1971 Kliewer and Torres 1972
Spayd et al 2002 Mori et al 2005b Yamane et al 2006) the mechanisms responsible for the
poor coloration of berry skin at high temperatures have not been completely understood and no
report has demonstrate the enhancement of anthocyanin degradation due to high temperature in
grape tissues Plant responses to high temperature involve morpho-anatomical physiological
biochemical and molecular changes which sometimes have to occur very rapidly The molecular
response to heat stress involve both the induction of enzymes involved in oxidative stress (as
Peroxidase Superoxide Dismutase Ascorbate Peroxidase Catalase) and Heat Shock Proteins (HSP)
(Wahid et al 2007) As previously reported anthocyanin biosynthesis is inhibited by higher
temperature and this is confirmed by molecular studies High temperature decreased mRNA
20
accumulation of structural anthocyanin biosynthesis genes and MYBA1 in cv Aki Queen (Yamane
et al 2006) In Pinot Noir vines instead the decrease in anthocyanin content due to high
temperature treatment cannot be linked to a decrease in anthocyanin biosynthesis as no significant
differences in gene expression were found These results may contribute to suggest that the
reduction in anthocyanin biosynthesis may be also due to enzyme inhibition or anthocyanin
degradation rather than a transcriptional effect (Mori et al 2007)
4 GENERAL AIMS OF THE THESIS
The present study is mainly focused on wine grape quality with the general aim of evaluating the
impacts of high temperature condition on grape quality From 1950 the majority of the worlds
highest quality wine-producing regions have experienced warming trends in growing season and this
condition is projected to have significant impacts on grape wine production quality and yield In
particular high temperatures after veraison can negatively affect grape composition expecially skin
anthocyanin accumulation in black berry varieties On these bases the present thesis aims to analyse
two trials both on cv Sangiovese which is the most cultivated variety in Italy characterized by
peculiar anthocyanins profile
The first trial is to appraise the effects of high temperature condition on flavonoids (anthocyanins
flavonols and condensed tannins) accumulation and particularly the mechanisms responsible for
lower anthocyanin content in berries ripened under elevated temperature via assessment of the main
berry biochemical compounds during ripening and of the activities of the putative key enzymes
which are involved in anthocyanins biosynthesis (such as UFGT and PAL) and their degradation
like peroxidases and polyphenol oxidases (PODs and PPOs) In addition the expression of some
genes responsible for flavonoids biosynthesis and degradation was assessed via Real time PCR A
further step was developed to recognize the best candidate genes responsible for anthocyanin
degradation under such stress condition throught a biotechnological approach of genes
transformation from grape to Petunia flower via Agrobacterium tumefaciens
Due to global warming in the last decades and in several warm wine regions a too high level of
sugar and subsequent wine alcohol excess low acidity and in black varieties unbalanced phenolic
ripening with insufficient berry skin colour has been shown at harvest The aim of the second trial is
to evaluate the effects of management techniques applied in the field on the canopy in post-
veraison (ie trimming ) on limiting the carbohydrate availability for cluster ripening to slow down
the accumulation rate of soluble solids in berries and to avoid the ldquouncouplingrdquo of sugar
accumulation versus phenolic synthesis during ripening
21
The present work started from the data obtained in a preliminary evaluation in 2009 and both in
2010 and 2011 the quantity and quality of different flavonoids as anthocyanins flavonols and
tannins were measured during ripening in berries of treated and control vines One of the main aims
of the second trial is to evaluate if the evolution of anthocyanins and skin and seed tannins is
conditioned by the rate of sugar accumulation
22
Chapter one First part
Biochemical and molecular approaches to study the effects of temperature
on grape composition in cv Sangiovese (Vitis vinifera L )
23
1 INTRODUCTION
In the last decades the majority of the worlds highest quality wine-producing regions have
experienced warming trends in growing season and this condition is projected to have significant
impacts on grape production quality (Jones at al 2005) The optimum temperature for berry growth
is among 20deg-25degC (Dookozlian 2000) Generally higher temperatures during grape ripening lead
to an increase in the rates of sugar accumulation and organic acid degradation Flavonol content is
reported to be more influenced by UV exposure rather than temperature (Spayd et al 2002) and
little is known about the effects of temperature increase on skin and seed proanthocyanidin
especially when applied after veraison
In black berry varieties grape coloration is due to anthocyanin accumulation in the skin which could
be negatively affected by temperature (Mori et al 2005 amp 2007 Kliewer amp Torres 1972 Tomana
et al 1979) But the mechanism responsible for colour reduction in berry skin at high temperature is
not completely clear While some researches in red table grape have determined that high
temperatures suppressed the expression of anthocyanin biosynthetic genes (Yamane et al 2006)
some other studies (in Cabernet Sauvignon) did not confirm this effect as mRNA accumulation of
anthocyanin biosynthetic genes and enzyme activity of UDP-Glucose Flavonoid Transferase
(UFGT) were not inhibited under high temperature (Mori et al 2007) Therefore it can be
hypothesized that temperature would affect not only the synthesis but also the stability of
anthocyanins (Shacked-Sachray et el 2002 Vaknin et al 2005 Mori et al 2005) and chemical or
enzymatic degradation of anthocyanins can be an answer to high temperature conditions involving
in the second option polyphenol oxidase and peroxidase (Mori et al 2007 Vaknin et al 2005)
Moreover temperature has been shown to have an effect on anthocyanins composition and some
authors suggested a highest thermal stability for the tri-substituted anthocyanins (particularly
malvidin derivatives) due to their chemical structure (Mori et al 2007 Cohen et al 2012)
So it is possible to hypothize different responses to high temperature between distinct grape
cultivars according their peculiar anthocyanin composition
To date no evidence has demonstrated the effects of elevated temperature on anthocyanin
accumulation and composition of cv Sangiovese characterized by monoglucoside anthocyanins
with high percentages of hydroxylated anthocyanins (mainly cyanidine-3-glucoside)
On these bases the aim of the present research is to evaluate the effects of high temperatures on
flavonoids (anthocyanins flavonols and condensed tannins) accumulation during ripening of
Sangiovese berries And in particular the mechanisms responsible for modification of the
anthocyanins content in berries ripened under elevated temperature conditions would be studied via
24
assessment of the activities of the putative key enzymes which are involved in anthocyanins
biosynthesis (such as Phenylalanine ammonium lyase (PAL) and UDP-glucose flavonoid 3-O-
glucosyltransferase (UFGT) and their degradation (like polyphenol oxidases (PPOs) and peroxidases
(PODs) In addition the expression of some genes involved in flavonoids biosynthesis and
degradation would be appraised via Real time PCR
2 MATERIALS AND METHODS
The study was conducted in 2010 and 2012 on respectively five and three years old uniform potted
plants of Vitis vinifera cv Sangiovese The vines grafted on SO4 rootstocks were grown in pots of
30 liter containing a mixture of sand and soil (1 1) In both years before the experiment the
number of shoots was standardized (around 9 shoots in 2010 and 6 in 2012) In addition in order to
have a uniform leaf area in all the vines the tip of each shoot was removed when 20 main leaves
were produced Before veraison (27th of July 2010 and 19th of July 2012) 8 and 12 uniform vines
were selected in 2010 and 2012 respectively on the bases of size of shoots and the bunch number
The selected vines were assigned to the two treatments LT (Low Temperature) and HT (High
Temperature)
In the LT treatment the vines were placed from pre-veraison to harvest in a plastic tunnel where the
minimum temperature was about 17 degC and the mean and maximum air temperatures were
maintained with a cooler below 26deg and 35degC
In the HT treatment the air temperature was similar to the ambient as the vines were distribuited in a
plastic tunnel which was open in the basal part and covered only the canopies to maintain the light
conditions similar to the LT vines In HT tunnel during the experimental period of 2010 the
minimum temperature was about 18deg and the mean air temperature was 26 degC while in 2012 they
were measured to be about 19deg and 28 degC respectively The maximum air temperaure could instead
exceed to 43degC and 44degC in 2010 and 2012 sequentially
Both tunnels were made of polyethylene film (MOP Bologna Italy) that did not alter the spectral
composition of light while the percentage of transmission was decreased by a maximum of 12
within the visible range
All the vines were daily watered automatically and well supplied with nutrients
21 Temperature monitoring
Berry skin temperature was monitored in 10 selected clusters of the plants in low temperature tunnel
(LT) and 10 clusters of the vines in high temperature tunnel (HT) in both years In each of these two
25
treatments temperature data were recorded from one week before veraison of both years until
harvest towards 10 T- type thermocouples (RS component MI Italy) positioned in the sub-cuticle
tissues of berry skin Each probe was then connected to a CR10X data logger (Campbell Scientific
Ltd Leicestershire United Kingdom) registering temperature data every 20 minutes and each one
hour in 2010 and 2012 sequentially The air temperature inside the tunnels were also monitored and
recorded each hour during the same period by air temperature sensors (TL20 3M Milan Italy)
22 Berry sampling
Berry sampling was conducted from 1 week before the veraison to the harvest in both years of the
trial In total 45 berries per each 8 vines and 30 berries per each 12 vines were sampled every 8 and
10 days in 2010 and 2012 respectively The 180 sampled berries for each of the two treatments were
pooled separately and divided into 4 biological replicates of 45 berries each to perform biochemical
and molecular analyses The berries of the first group (15) were weighed and immediately used for
degBrix titratable acidity and pH measurment All the other sampled berries were immediately frozen
in liquid nitrogen and kept in the freezer (-80 degC) until the analyses to evaluate the quality and the
quantity of the anthocyanins and flavonols (10 berries) skin and seed tannins (10 berries) and to
assess the gene expression and the enzymatic activity (10 berries)
23 degBrix titratable acidity and pH
The sampled berries were crushed and the must were sieved and used for degBrix analysis by a
temperature-compensating CR50 refractometer (Maselli Misure Spa PR Italy) Five mL of the
same must were then diluted 7 times with bi-distilled water and used to perform a titration reaction
by a Crison Compact Tritator (Crison Barcelona Spain) with 1N 05 N or 025 N NaOH (Sigma-
Aldrich St Louis MO USA) according to the stage of berry ripening to obtain pH and TA data
(expressed as gl of tartaric acid equivalents)
24 Analyses of anthocyanins and flavonols
The berries of each replication were sampled and weighted before the extraction of anthocyanins
and flavonols Then the skin was carefully removed from the pulp and immerged in 50 mL of
HPLC-grade methanol (Carlo Erba Reagents Milano Italy) and were kept in dark for 24 hours
The day after the extract was separated from the skin residues and conserved at (-20oC) until the
anthocyanins analysis
26
To analyze the total content of each flavonol aglycon an aliquot of 5 mL of the same methanol
extract was completely dried under vacuum To achieve the acid hydrolyzation of flavonols
glucosides the pellet was re-suspended in 25 mL of methanol and 25 mL of 2M Trifluoroacetic
acid (Sigma-Aldrich St Louis MO USA) in milliQ water The reaction was conducted at 100 oC in
a boiling hot water bath with a condenser for 2 hours The reaction product was then completely
dried under vacuum and the pellet obtained re-suspended in 1mL of methanol and was kept at (-
20oC) until HPLC analysis
HPLC separation and quantification of anthocyanins and flavonols were performed on a Waters
1525 instrument equipped with a diode array detector (DAD) using a reversed-phase column
Phenomenex (Castel Maggiore BO Italy) RP18 250 mmx4mm (5microM) with precolumn Either for
anthocyanins and flavonols the eluents used were the following A= HClO4 03 in milliQ water B
= methanol
For anthocyanin analysis the methanol extract was filtered through 022 microm 13mm PTFE syringe-
tip filters (Teknokroma Barcelona Spain) and an aliquot of 270 microL was diluted to final volume of
1mL with the A eluent The binary gradient was the same as reported in Mattivi et al (2006) with
suitable modifications The time for column equilibration was 5 minutes and the injection volume
was 60 microL Separation of the main free anthocyanins was obtained at 43 oC and they were quantified
at 520 nm with a calibration curve with malvidin-3-glucoside (Sigma-Aldrich ST Louis MO
USA)
Hydrolyzed flavonols samples were filtered through 045 microm 13 mm PTFE syringe- tip filters
(Teknokroma Barcelona Spain) directly into liquid chromatography vials Flavonols aglicones
were separated at 40deg C through the linear gradient as reported in Mattivi et al (2006)
The time for equilibration column and the injection volume were the same used for the HPLC-DAD
analyses of anthocyanins Quercetin myricetin and kaempferol were quantified at 370 nm with the
corresponding external standard purchased from Extrasynthese (Genay France)
25 Tannins analysis
To extract proanthocyanidins frozen berries samples (skins and seeds) were ground separately to a
fine powder under liquid N2 01 g aliquots were separated and extracted in darkness in 2 mL screw-
top Eppendorf tubes for 24 hours with 70 acetone containing 01 ascorbate (10 mL) to prevent
oxidation of polyphenols (Kallithraka et al 1995) Samples were then centrifuged (15 min 13000 x
g) and two 400 μL aliquots of the supernatant were transferred to fresh tubes and dried down under
vacuum at 35ordmC for 120 minutes
27
One of them was re-suspended in 100 μL methanol acidified with 1 HCl then neutralized with 100
μL sodium acetate (200 mM pH 75) for the analysis of free monomers The other aliquot
underwent acid-catalyzed cleavage of the proanthocyanidins in the presence of excess
phloroglucinol following the method of Kennedy and Jones (2001) Briefly the dried sample was
re-suspended in 100 μL of phloroglucinol buffer (025 g ascorbate 125 g phloroglucinol 215 μL
conc HCl 25 mL methanol) and incubated at 50ordmC for 20 minutes then neutralized with 100 μL of
sodium acetate (200 mM pH 75) and centrifuged (15 min 13000 x g) A 200 μL aliquot each of
the acetone extract the acetone extract after acid catalyzed cleavage and the residue after cleavage
was then transferred to Sun-broker 250 μL reduced volume HPLC auto-sampler vials Samples were
run on a Waters 1525 instrument equipped with a diode array detector (DAD) using a reversed-
phase column Phenomenextrade (Castel Maggiore BO Italy) RP18 250 mmx4mm (5microM) with
precolumn A separate reversed-phase HPLC method was developed for the cleaved and uncleaved
proanthocyanidin samples reading absorbance at 280 nm Uncleaved samples solvent A 02
phosphoric acid solvent B 41 acetonitrile02 phosphoric acid (gradient of solvent B zero min
0 5 min 10 40 min 10 55 min 17 65 min 19 75 min 19 80 min 100 85 min
100 86 min 0) Cleaved samples solvent A 02 acetic acid solvent B methanol (gradient of
solvent B zero min 1 40 min 1 120 min 30 1201 min 100 125 min 100 126 min
1) For both methods 25 μL of sample was injected and run at 30ordmC with a flow rate of 1 mLmin
Concentrations of free monomers and hydrolysed terminal subunits were determined from standard
curves prepared from commercial standards of catechin epicatechin epigallocatechin and
epicatechin-gallate obtained from Extrasynthese (France) The concentration of extension subunit-
phloroglucinol adducts was calculated from published molar extinction coefficients (Kennedy amp
Jones 2001) The evaluation of skin and seeds tannins was performed only on the samples of the
year 2010
26 Real-time PCR analyses RNA extraction and RNA evaluation
Real-time PCR analyses were performed for four and five selected stages of berry ripening in 2010
and 2012 respectively from beginning of veraison to the end of harvest Total RNA was isolated
from 200 mg and 500 mg in 2010 and 2012 respectively of the powdered berry skin tissue using
spectrumTM
Plant Total RNA kit (Sigma-Aldrich St Louis MO USA) following the manufacturers
protocol One microL of each RNA sample was measured spectrophotometrically to determine RNA
quantity and 260280 and 260230 ratio using a NanoDrop1000 Spectrophotometer (Thermo Fisher
Scientific Wilmington DE USA) Total RNA was treated with 1 U microg-1 RQ1 DNase (Promega
28
Milan Italy) First-strand cDNA was synthesized using 1 microg of RNA 1microL (dT)15 primer (500
microgmL) and 1 U of GoScripttrade reverse transcriptase (Promega) Quantitative RT-PCR was carried
out on a Step One Plustrade (Applied Biosystems Foster City California USA) Each reaction (10
microL) contained 188 nM of each primer 2microL of diluted cDNA (150) 5microL U of Power SYBRreg Green
PCR Master Mix (Applied Biosystems Foster City California USA) Thermal cycling conditions
were 95 degC for 10 min followed by 95 degC for 15 s 55 degC for 1 min for 40 cycles followed by a
melting cycle which contains 95 degC for 15 sec 60 degC for 1 min and 95 degC for 15 sec Each cDNA
sample was analyzed in triplicate Primers pairs for Dihydroflavonol 4-reductase (DFR)
Leucoanthocyanidin dioxygenase (LDOX) and UDP-glucose flavonoid 3-O-glucosyltransferase
(UFGT) were retrieved from literature (Goto-Yamamoto et al 2002) primers for VvMYBA1 were
from Jeong et al (2004) for Leucocyanidin reductase (LAR) and Anthocyanidin reductase (ANR
or BAN) from Bogs et al (2005) and for Peroxidase (POD6 ) from Mori et al (2007) Primers for
Flavanone 3-hydroxylase (F3rsquoHb) Flavonoid-3rsquo5rsquo-hydroxylase (F3rsquo5rsquoHk and F3rsquo5rsquoHi)
Phenylalanine ammonium lyase (PAL) Flavonol synthase (FLS) and Peroxidases (POD1 to POD5)
were newly designed on the original DNA sequences to amplify 150ndash250 bp gene fragments (Table
1)
29
Table 1 Sequence of primers used for Real time PCR amplification
Primer Forward Primer Reverse
DFR 5-GAAACCTGTAGATGGCAGGA-3 5-GGCCAAATCAAACTACCAGA-3
LDOX 5-AGGCTCTACTCTCCAAATGA-3 5-GAAGCTTGAAACACAGACCA-3
UFGT 5-AATCTGAGAGCCCTAAGAGA-3 5-GGTGGTACAAGCAACAGTTC-3
MYBA 1 5-TAGTCACCACTTCAAAAAGG-3 5-GAATGTGTTTGGGGTTTATC-3
LAR 5-TCTCGACATAAATGATGATGTG-3 5-TGCAGTTTCTTTGATTGAGTTC-3
BAN 5-CAATACCAGTGTTCCTGAGC-3 5-AAACTGAACCCCTCTTTCAC-3
PAL 5-ACATACCTAGTGGCACTCTG-3 5-TCGCAGAATCTCGATGGATG-3
F3Hb 5-TCCATCACCAAGTCTTCTAC-3 5-GCGGAGAAGCTGAACATGGA-3
F35Hi 5-CAGACTGCATACGCACTCTG-3 5-ATGCCGGATGGAGTTGAGAT-3
F35Hk 5-CCAGGCCTAGCTACTATATG-3 5-GCATATGGCATGGTGGTAGA-3
FLS 5-CTGCACTATCCAGAGATGAG-3 5-TTGCCGCTTCAACAACAACA-3
POD 1 5-TCTGAGTAAGAGCCCACACACTCT-3 5-GAGACCTGAGCAGATAAATACAAAAATAAA-3
POD 2 5-AAAGTTGTTTGGCTGTGG-3 5-AATCCCTCCAAACAATCA-3
POD 3 5-TGCTCTAAATGCCTGAAAAATG-3 5-ATCATATAGAAAAGTGACAGCAACCT-3
POD 4 5-CAACTTCACACCAACGGGAAA-3 5-GCAGCTGAGCAAGAAATGCTT-3
POD 5 5-TCGGTGAGGAACTCCGATA-3 5-AGCTTCCTTGTCCTCTTCCA-3
POD 6 5-AACTTGAGACACAACAGCATAAATAAATC-3 5-AGGACCAAATCACAGGATGATAAAG-3
ACT 5-ATTCCTCACCATCATCAGCA-3 5-GACGAGCCCCTCCTACTAAAACT-3
30
27 Enzyme assay
27 1 PAL activity assay
The extraction was performed according to the method of Mori et al (2005) with some
modifications The following procedures for protein extraction were conducted at 4deg C For each
replication 02 g of berry skin was ground with a mortar and pestle in liquid nitrogen until a fine
powder was obtained
The skin powder was homogenized with 15 mL of a 100 mM Sodium borate buffer (pH 9)
containing 0075 g of PolyVinyl-PolyPyrrolidone (PVPP) and 100 microL of a 200 mM Dithiothreitol
After incubation in ice for 20 minutes centrifugation was done at (4deg C 15 min 10000 x g)
Then 1mL of the supernatant was desalted by passing through a NAP-10 column (Sephadex G-25
Amersham Biotech) equilibrated with 15 mL of the same buffer
For the analysis of PAL activity the reaction mixture consisted of 05 mL of Phenylalanine and 05
mL of the enzyme solution The assay mixture was incubated in 37deg C for 60 minutes The reaction
was terminated by adding 05 mL of HCl acid (18) The quantity of the product namely Trans-
cinnamic acid was calculated using its extinction coefficient of 9630 M-1
cm-1
at 290 nm One unit
of PAL was expressed as synthesis of 1 mol of Trans-cinnamic acid per minute and PAL activity
was expressed as microkat g-1 protein
27 2 UFGT activity assay
The extraction was performed according to the method of Mori et al (2007) with some
modifications The following procedures for protein extraction were conducted at 4 oC For each
replication (02 g) of berry skin was ground with a mortar and pestle in liquid nitrogen until a fine
powder was obtained The skin powder was homogenized with 13 mL of a 250 mM TRISndashHCl
buffer (pH 75) containing 10 mM Polyethylene glycol 3400 150 microL of 10 mM Na-
diethyldithiocarbamate 15 microL of 200 mM Dithiothreitol and 2 microL of 2-mercaptoethanol and was
incubated for 20 min on ice After centrifugation of the homogenate at 10000 x g for 20 min The
supernatant was passed through a NAP-10 column (Sephadex G-25 Amersham Biotech)
equilibrated with a 15 mM TRISndashHCl buffer (pH 75)
The desalted crude extract was used as the enzyme solution in the following enzyme assay using
delphinidin and cyanidin as substrates The method of Mori et al (2007) was employed with some
modifications for the analysis of UFGT activity For the first assay the reaction mixture consisted of
02 mL of the previous extraction solution (containing TRISndashHCl buffer (pH 75) Polyethylene
glycol 3400 Na-diethyldithiocarbamate Dithiothreitol and 2-mercaptoethanol) 50 microL of 1mM
31
Cyanidin 50 microL of 100mM UDP-glucose and 02 mL of the enzyme solution The assay mixture
was incubated for 5 min at 37deg C The reaction was terminated by adding 150 microL of 5 HCl The
quantity of the product namely Cyanidin-3-glucoside was measured using its extinction coefficient
of 26900 M-1
cm-1
(at 520 nm pH 1)
Therefore one unit of UFGT was defined as the production of 1 mol of Cyanidin-3-glucoside per
second and UFGT activity was expressed as pkat g-1 protein
For the second assay the reaction mixture consisted of 02 mL of the same extraction solution
(containing TRISndashHCl buffer (pH 75) Polyethylene glycol 3400 Na-diethyldithiocarbamate
Dithiothreitol and 2-mercaptoethanol) 50 microL of 1mM Delphinidin 50 microL of 100mM UDP-glucose
and 02 mL of the enzyme solution The assay mixture was incubated for 5 min at 37deg C The
reaction was terminated by adding 150 microL of 5 HCl The quantity of the product namely
Delphinidin-3-glucoside was measured using its extinction coefficient of 26000 M-1 cm-1 (at 520
nm pH 1)
Therefore one unit of UFGT was defined as the production of 1 mol of Delphinidin-3-glucoside per
second and UFGT activity was expressed as pkat g-1 protein
27 3 Guaiacol PODs activity assay
Guaiacol PODs were assayed as described by Ushimaru et al (1997) using pyrogallol as the
electron donor for the reaction The plant material (skin) was extracted in cold buffer (200 mM
sodium phosphate 5 mM sodium EDTA 1 PVPP pH 70) and incubated on ice for 30 min After
centrifugation at (10000 times g 30 min 4 degC) the desalted supernatant was used for the assay The
reaction mixture (25 mL) included 22 mL of the 10 mM sodium phosphate buffer pH 70 100 microL
of the 25 mM H2O2 50 mM pyrogallol and 100 μl extract H2O2 and pyrogallol were prepared
fresh just before use Absorbance (λ=430 nm) was taken after 5 min incubation at room temperature
and referred to a blank with no extract added One unit of Guaiacol peroxidases is defined as the
amount of enzyme that catalyzes the oxidation of 1 μmol of pyrogallol per minute under the
conditions described by Chen and Asada (1989) and PODs activity was expressed as kat g-1 skin
fresh weight An absorbance coefficient of 247 mM-1 cm-1 was assumed for calculations
27 4 PPOs activity assay
PPOs were assayed as described by Ushimaru et al (1997) using pyrogallol as the electron donor
for the reaction The plant material (skin) was extracted in cold buffer (200 mM sodium phosphate
5 mM sodium EDTA 1 PVPP pH 70) and incubated on ice for 30 min After centrifugation at
32
(10000 times g 30 min 4 degC) the desalted supernatant was used for the assay The reaction mixture
included 28 mL of the 100 mM sodium phosphate buffer pH 70 1 mM pyrogallol and 100 μl
extract the pyrogallol was prepared fresh just before use Absorbance (λ=430 nm) was taken after 5
min incubation at room temperature and referred to a blank with no extract added One unit of
Polyphenol oxidases is defined as the amount of enzyme that catalyzes the oxidation of 1 μmol of
pyrogallol per minute under the conditions described by Chen and Asada (1989) and PPOs activity
was expressed as kat g-1 skin fresh weight An absorbance coefficient of 247 mM-1 cm-1 was
assumed for calculations
28 Vegetative and Yield measurements
In both years immediately after harvest all the leaves of each vine of the both tunnels were
removed and their areas were measured using a leaf area meter (LI3000 LiCor Inc Lincoln Neb
USA) along with the number of nodes of each single shoots
The grape bunches were harvested when the total soluble solids of berries had reached to
approximately 22 o
brix All bunches were removed counted and weighed in both treatments to
determine the yield of each vine
29 Statistical analyses
Data were submitted to analysis of variance and means were separated by the Student-Newman-
Keuls test by SAS statistical software (SAS Institute Cary North Carolina USA) The experiments
were conducted with four replications from each treatment and the values were the means of four
replications
3 RESULTS AND DISCUSSION
31 Berry Temperature
The berry temperature in both tunnels was influenced by the two air temperature regimes (HT and
LT) The average berry temperature in the LT tunnel during the ripening period of 2010 was
recorded to be about 20 oC while it was about 24deg C in HT In 2012 the average berry temperature in
both treatments were recorded to be about 2deg higher than in 2010
The maximum berry temperature in both years showed the highest differences between the two
treatments as it was maintained below 35 degC in LT and it might exceed to 42 degC in correspondence
of several heat weaves during the ripening in HT (Fig10)
33
The analyses of the number of hours exceeding the 30 and 35degC showed significant higher values in
both years in HT than in LT (Table 2 ) In particular the number of hours over 35deg C was null in LT
berries while it was about 70 and 157 hours in HT berries in 2010 and 2012 respectively Moreover
despite between the two years only few differences were found in mean and maximum berry
temperatures 2012 berries spent more hours at high temperature than in 2010 regardless from the
different treatments and the temperature fluctuations were higher during the ripening period of 2010
(Table 2) In addition in 2010 the percentage of the average berry temperature more than 30 degC
was about four folds more in the HT tunnels as compared to LT one while in 2012 this percentage
was six folds higher
Fig 10 The average and maximum daily berry temperature (oC) grown under high and low temperature conditions
during ripening in 2010 and 2012
34
Table 2 The percentage and the number of hours that the average of berry temperature was higher than 30deg and 35degC
in both treatments during the experimental period in the years 2010 and 2012
Total
experimental
time
(Ndeg hours)
Average berry
temperaturegt
35 degC
(Ndeg hours)
Average berry
temperature gt
30 degC
(Ndeg hours)
Average berry
temperature gt
35 degC
()
Average berry
temperature gt
30degC
()
Treatment Year
1176 hr 70hr 192 hr 6 163 HT 2010
0 55 hr 0 47 LT
1257 hr 157 hr 392 hr 1250 31 HT 2012
0 91 hr 0 7 LT
32 Leaf area and Yield
The plant materials used in this trial were not the same in the two years In 2010 and 2012
respectively five years old and three years old uniform potted vines were used for the treatments
Therefore the comparison could be done only between the treatments in each year and the year
effect would not be considered
In both years before the experiment the vines were uniformed for the number of shoots and clusters
in both treatments But the main lateral and total leaf areas per vine were significantly higher in LT
vines respect to HT (Table 3)
In 2010 the yield and its components were not significantly different between the LT and the HT
vines (Table 4) while in 2012 the yield was 36 more in LT as compared to HT ones Since the
cluster number per vine and the berry weight were similar in this year this result is mainly due to a
higher number of berries per cluster which imply that the cluster weight was higher in LT vines
(Table 4)
It seems that the higher temperature in HT may be responsible for drying out the basal leaves in HT
at the end of ripening and these conditions which have been assessed also by visual observation
caused a lower average leaf area compared to LT as the leaf area estimation was assessed after
harvest Besides the warmer condition of 2012 has been contributed to drop of some berries due to
the dehydration and drought in the very last period of ripening in HT Based on these
considerations it is likely that HT thermal condition did not show negative physiological effect on
vegetative growth and yield as the treatment was imposed at veraison and we registered a
ldquosecondaryrdquo effect due to the leaves and berry drop in the very last part of ripening
35
Table 3 Leaf area of grapes grown under high (HT) and low (LT) temperature conditions during ripening of the years
2010 and 2012
Year Treatments
Main Leaf area
(cm2vine)
Lateral Leaf area
(cm2vine)
Total leaf area
(cm2vine)
2010 LT 117425 105785 22321
HT 71682 80629 152311
2012 LT 13460 5690 19150
HT 6715 3742 10457
Table 4 Yield and yield components of grapes grown under high (HT) and low (LT) temperature conditions during
ripening of the years 2010 and 2012
Year Treatments No Cluster
Vine
Yield
Vine
(gr)
Cluster
weight
(gr)
Berry weight
(gr)
Berries per
cluster
(n)
LA Yield
per vine
(cm2 gr)
2010 LT 11 16666
1515
24 63 134
HT 12 18245
1520 21 72 835
ns ns ns ns ns
2012 LT 6 8616
1436
22 65 222
HT 5 5355 1071 21 51 196
ns ns ns
36
33 oBrix pH Titratable acidity
The results indicated that in 2010 a similar trend in the percentage of Total Soluble Solids in berries
grown under low and high temperature was measured and no significant differences was observed
among the two treatments in titratable acidity (TA) and pH However in 2012 the advanced ripening
in HT grapes was associated with higher level of oBrix during ripening nevertheless they reached
the same level at harvest Moreover it seems that the elevated temperature contributed to
degradation of titratable acids and increase in pH (Fig 11) There are contradictory reports on the
effects of high temperature on sugar accumulation in grape during different stages of berry
development Several papers (Matsui et al 1986 Sepuacutelveda and Kliewer 1986 Kliewer et al
1977) reported a general delay in ripening which is attributed to the impact of heat on the
photosynthetic supply of sugar Photosynthesis of grapevines is reduced at temperatures above 35 oC
(Kriedemann 1968 Ferrini et al 1995 Schultz 2003 Yu et al 2009 Zsoacutefi et al 2009) and
generally the restrictions to photosynthesis are caused by stomatal limitation As to Sepuacutelveda et al
(1986) prevention of the soluble sugar accumulation in berries by high temperature cannot be
accounted for an inhibition of the phloem transport between the leaves and the bunchs In contrary
Soar et al (2009) reported an increase in photosynthesis and stomatal conductance when Shiraz
vines were heated for short periods Moreover in some other researches sugar accumulation was not
influenced by temperature increase (Yamane et al 2006 Greer and Weston 2010)
In general tartaric acid concentration decrease after veacuteraison is mainly due to a dilution effect since
berry volume increase and amount of tartrate remains constant So far no enzymes degrading
tartaric acid have been ever found in grape In contrast the decrease in malic acid amount at the
beginning of ripening is associated with respiration and enzyme degradation as well as dilution
effect Malic acid may be therefore transformed to hexoses or used as energy source Metabolic
changes occurring during grape berry development (Taureilles-Saurel et al 1995) together with
light and temperature are the main parameters controlling the malate synthesisdegradation rate
Grape berries malic acid concentration at harvest is negatively correlated with temperature during
the ripening period It has been demonstrated that the optimum temperature range for acids synthesis
is between 20degC and 25degC and that with increasing temperature synthesis of malic acid decrease
and catabolic rate accelerate (Kliever et al 1967) These results are in accordance with the results of
this study and what was observed on the effects of elevated temperature in Cabernet Franc and
Chardonnay grapes where the pH increased and TA decreased Also the effects of higher
temperature induced by veraison defoliation had similar effects on pH and titratable acidity due to
the malic acid degradation (Guidoni et al 2004 Pastore 2011)
37
Fig 11 The trend of oBrix titratable acidity and pH of grapes grown under high (HT) and low (LT) temperature
conditions during ripening of the years 2010 and 2012
34 Biosynthesis of flavonoids
34 1 Anthocyanins accumulation during ripening
In both years the anthocyanin level in the skin of Sangiovese (Fig 12) started to increase after
veraison until harvest in both treatments Nonetheless in HT berries was significantly reduced
respect to LT ones As an illustration in 2010 the level of total anthocyanin at harvest was decreased
about 65 in the skin of the grapes grown under high temperature conditions as compared to LT
and at the harvest time of the year 2012 this reduction was 50 In agreement with the results on
other grape varieties (Darkridge grape Cabernet Sauvignon Tokay Japanese table grape Kyoho
Mori et al 2005 amp 2007 Kliewer amp Torres 1972 Tomana et al 1979) we found that in
38
Sangiovese high berry temperature (over 35degC) after veraison prevented anthocyanin formation in
grapes and greatly reduced the coloration as compared to fruits ripened at lower temperatures
According to HPLC analysis of the both years as expected the major individual anthocyanin in the
berry skin of both LT and HT treatments was malvidin-3-glucoside (Fig 12)
Anyway no differences in anthocyanin profiles were recorded at harvest between HT and LT grapes
in 2010 (Table 5) In 2012 at harvest the percentage of malvidin -3-G was higher in LT compared to
HT (Table 5)
Previous studies on Cabernet Sauvignon reported the higher thermal stability of malvidin-
derivatives anthocyanins due to the high level of methoxylation and acylation (Mori et al 2007
Romero and Bakker 2000 Morais et al 2002) but it is in contrast to our findings in this respect on
Sangiovese It has to be noticed that in Sangiovese the anthocyanin composition is quite different
from Cabernet Sauvignon and it is characterized by the high level of cyanidin-3G and by the
absence of p-coumarated and acetated malvidin derivatives anthocyanins
From the data of our two-year trials it is not possible to confirm the differences in thermal stability
of the five monoglucoside anthocyanins of Sangiovese based on their chemical structure And by
assessing solely the anthocyanins quantity and profile it was not possible to understand if the
reduction of anthocyanins under high temperature is due to biosynthetic activity reduction or to a
mechanism of anthocyanins degradation Therefore additional analyses were required in order to
obtain more comprehensive information about this issue
39
Fig 12 The trends of total and individual anthocyanins concentrations in the skin of Sangiovese berries grown under high (HT)
and low(LT) temperature conditions during ripening in the years 2010 and 2012
40
Table 5 The anthocyanin profiles at harvest in the skin of Sangiovese berries grown under high (HT) and low (LT)
temperature conditions during ripening in the years 2010 and 2012
Anthocyanin profile at harvest
Malvidin-3-G Petunidin-3-G Delphinidin-3-G Peonidin-3-G Cyanidin-3-G
2010 LT 36 13 11 18 22
HT 41 13 11 18 17
ns ns ns ns ns
2012 LT 43 14 11 16 16
HT 33 16 14 16 21
ns ns ns ns
34 2 Flavonols accumulation during ripening
In the both years the levels of flavonols in HT and LT berries increased gradually after veraison
and significant decrease was observed in the level of total and individual flavonols in HT berries as
compared to LT ones in 2012 (Fig 13)
In general the highest level of flavonols in grapes was found at flowering followed by a decrease as
the grapes increased in size Subsequently a significant level of flavonol biosynthesis is in general
observed during berry development and the greatest increase in flavonols per berry can be detected
3-4 weeks post-veraison (Downey et al 2003)
Flavonols accumulation in wine grape tissues has been studied extensively While several authors
reported a solid correlation between fruit light exposure and flavonol glucosides content (Price et al
1995 Haselgrove et al 2000 Spayd et al 2002) the effect of temperature on flavonol synthesis is
not understood completely Spayd et al (2002) and Mori et al (2005) did not observe any effect of
temperature treatment on flavonol synthesis To the contrary the inhibitory effect of high
temperatures on flavonol was also reported by Goto-Yamamoto et al (2009) Since in our research
we excluded the effect of different light exposure between the two treatments the lower
accumulation of flavonols in HT berries is probably due to a regulatory mechanism which rules the
anthocyanins response to high temperature condition
41
Moreover the analyses of each flavonol compound at harvest (quercetin kaempferol and myricetin
showed as expected that quercetin has the highest percentage The flavonols profiles at harvest in
the skin of Sangiovese berries grown under high and low temperature conditions during ripening
were similar in the year 2010 but it was significantly different among the treatments in 2012 (Table
6)
Fig 13 The trends of total and individual flavonols concentrations in the skin of Sangiovese berries grown under high
(HT) and low (LT) temperature conditions during ripening in the years 2010 and 2012
42
Table 6 The flavonols profiles at harvest in the skin of Sangiovese berries grown under high (HT) and low (LT)
temperature conditions during ripening in the years 2010 and 2012
Flavonols profile at harvest
Quercetin Kaempferol Myricetin
2010 LT 746 68 186
HT 735 75 189
ns ns ns
2012 LT 668 36 296
HT 642 26 332
34 3 Tannins accumulation during ripening
Tannins assessment was done in 2010 In this trial regardless from the treatments the amount of
total and individual tannins of seed and skin decreased generally from veraison to harvest This
result is in accordance with the previous works conducted by Harbertson et al (2002) Adams
(2006) and Kennedy et al (2001) From this research emerges that the two temperature regimes did
not affect the tannins branch of flavonoid biosynthesis This is comprehensible considering that
tannins are accumulated very early in berry development and the decline in their concentration from
veraison to harvest only reflects the quantitative changes that take place during berry ripening
(decrease of the tannins concentration in proportion to berry growth)
43
Fig 14 The trends of total and individual tannins concentrations in the berry seed and the skin of Sangiovese berries
grown under high (HT) and low (LT) temperature conditions during ripening in 2010
44
35 Gene expression assessment
In the present study the expression of some genes involved in the general flavonoid biosynthetic
pathway (PAL F3rsquoHb F3rsquo5rsquoHk F3rsquo5rsquoHi DFR LDOX) and the specific genes for anthocyanins
(UFGT and VvMYBA1) flavonols (FLS) and tannins biosynthesis (LAR BAN) were studied in
berries grown under two different temperature regimes (Fig 15)
In HT berries a strong reduction of anthocyanins and flavonols concentration and no effect on tannin
biosynthesis was observed and this seems to be directly related to the general inhibition of the
expression of flavonoids biosynthetic genes detected in this research (Fig 15) Furthermore it was
interesting to observe that even if the response in terms of total flavonoid accumulation was
comparable in 2010 and 2012 the flavonoid composition and the expression profile of some of the
analyzed genes was quite different between the two years of the experiment (Fig 15 Fig 16 Table
5 and 6)
The profile of PAL gene expression was mainly similar in the both years starting to increase in the
both treatments about 15 days after veraison PAL gene seemed to be repressed by high temperature
as a considerable higher level of expression in LT berries in respect to the HT ones was recorded in
both years about 37 days after veraison even if in 2010 it was not significantly different between the
two treatments This result is in agreement with many papers in which a direct correlation between
enhanced flavonoid accumulation (in particular anthocyanins) and increase in PAL gene expression
is reported (Pastore et al 2011 Ageorges et al 2006 Ban et al 2003 Roubelakis-Angelakis and
Kliewer 1986)
F3rsquo5rsquoHs and F3rsquoHs are versatile enzymes that are able to accept several phenylpropanoid substrates
and competitively control the synthesis of cyanidin- and delphinidin-flavonoid derivatives Two
isoforms of F3rsquoHs have been detected in grapevine genome until now (Castellarin et al 2006) In
this research the transcription of F3rsquoHb showed different profile of expression between the two
years of the trial In fact the transcription level of F3Hb was not affected or even induced by high
temperature 20 days after veraison in 2010 but we found exactly an opposite result in 2012 where
in LT berries a significant increase in F3rsquoHb expression was recorded 33 days after veraison in
comparison to HT
Studying the expression of F35Hi and F3rsquo5rsquoHk genes we observed that they were affected by high
temperature during ripening in both years showing similar transcription profiles Starting from full
veraison when all berries have turned red F3rsquo5rsquoHi expression increased in LT berries reaching a
maximum from one to two weeks after veraison in both 2010 and 2012 Also F3rsquo5rsquoHk expression
showed an increase in LT berries about 7 days after veraison in 2010 in comparison to HT and a
strong enhancement on F3rsquo5rsquoHk expression was observed in LT berries in 2012 (Fig 15) Sixteen
45
copies of F3rsquo5rsquoHs are present in the grapevine genome (Falginella et al 2010) suggesting a possible
role for each of them in different developmental and environmental conditions
The different patterns of expression observed for F3rsquoHb and F3rsquo5rsquoHs could suggest that the former
may be less sensitive in comparison to the latter to critical temperature conditions Considering that
the berry temperature in HT tunnel was higher in 2012 than 2010 (Table 2) it seems that F3rsquoHb is
able to tolerate thermal stress when temperature higher than 35degC are imposed for short periods as
in 2010 whereas in 2012 when HT berries spent more than two-fold hours at temperature higher
than 35degC in comparison to 2010 the F3rsquoHb expression is repressed From this study emerges that
at transcriptomic level the intensity and the extent of thermal stress could not affect in equal manner
the transcription of the gene that preside over the 3rsquo4rsquo- and 3rsquo4rsquo5rsquo-OH flavonoid biosynthetic
pathway in Sangiovese grape berry
In this research DFR and LDOX genes exhibited different patterns of expression in 2010 and in
2012 reaching maximum values in LT compared to HT 5 days after veraison in 2010 and 28 days
later in 2012 thus showed an expression pattern independent from the trend of anthocyanins
flavonols and tannins accumulation and from the timing of the temperature increase application
Our results are in agreement with previous findings reported that the expression of neither DFR nor
LDOX was as strongly correlated as UFGT and VvMYBA1 with anthocyanin content (Castellarin et
al 2007) and it is comprehensible if we consider that they can produce substrates for other branches
of flavonoid biosynthesis
Instead of that a strong correlation was found as expected in the expression of UFGT and of its
main transcription factor VvMYBA1 with the higher anthocyanins accumulation in LT vines
comparing to HT
Flavonol synthesis involves several genes encoding flavonol synthases (FLS) which are biosynthetic
enzymes converting dihydroflavonols to flavonol (Downey et al 2003) In both years the
expressions of FLS gene were similar between LT and HT berries in the early stages suggesting a
small effect of high temperatures on the transcription of this gene during veraison However FLS
started to be significantly higher in LT berries from mid of ripening and in 2012 a similar trend was
registered excepted at harvest when a significantly higher expression of FLS was registered in HT
(Fig 16)
Among the enzyme involved in tannins synthesis leucoanthocyanidin reductase (LAR) produces
catechin while anthocyanin reductase (BAN) converts cyanidin and delphinidin into epicatechin
and epigallocatechin respectively (Xie et al 2003 and Adams 2006 Fig 17) Bogs et al (2005)
found that in grape LAR is encoded by two closely related genes (LAR) whereas BAN enzyme is
46
encoded by a single gene (Fig17) As LAR1 appeared to be seed specific (Bogs et al 2005) only
LAR2 and BAN were analyzed in this study in 2010 In general timing and expression of BAN and
LAR2 genes is consistent with the accumulation of proanthocyanidins in the berry (Adams 2006)
This was further confirmed in this research where tannins analyses conducted on berry skin in 2010
showed no differences in terms of concentration and composition and as expected no differences
were found in the transcription of LAR2 and BAN during ripening
To better understand how the differences in gene expression could have or not influenced the
anthocyanins and flavonols composition also the timing and the coordination of flavonoid
biosynthetic genes has to be considered separately for the two years
In 2010 we detected a lack of variation in anthocyanins flavonols and tannins composition
following LT and HT treatment Following the treatment a coordinated transcription of F3rsquoHb
F3rsquo5rsquoHi F3rsquo5rsquoHk DFR LDOX UFGT and MybA1 was detected in LT berries which all reached a
maximum of expression 7 days after veraison (DAV) In HT the situation was quite different as for
F3rsquoHb and LDOX we found the highest expression 20 DAV when the transcription of DFR and
UFGT was already strongly reduced This shift and lack of synchronization could have hampered in
2010 the increase in the accumulation of 3rsquo4rsquo-OH flavonoids derivatives in comparison to LT
nevertheless the stability of F3rsquoHb transcripts detected in HT berries
In 2012 we found a statistically significant increase in malvidin and quercetin percentages in LT
berries in comparison to HT The concomitant stronger upregulation of F3rsquo5rsquoHi and F3rsquo5rsquoHk
starting from veacuteraison in LT compared to HT berries has to contribute to the increase in malvidin
concentration in LT berries in the second year of the trial Moreover in the same stage of berry
ripening also an increased expression of F3rsquoHb was recorded in LT berries and therefore the
biosynthesis of 3rsquo4rsquo-OH flavonoids should have been enhanced too Differently from what was
previously discussed for 2010 DFR and LDOX maximum expression was delayed in comparison to
the recorded peak of transcription for UGFT and VvMybA1 in both treatments It has to be
considered that FLS directly competes for its substrates with the enzyme DFR because they share
dihydroflavonols as the common substrates On this base probably there was a competition between
the biosynthesis of flavonols and anthocyanins in the both treatments but that contemporary
increase in the expression of F3rsquoHb DFR and FLS led to the rise of quercetin accumulation in LT
berries as compared to HT
47
Fig 15 Mean normalized expression of the genes involved in flavonoid biosynthetic pathway in berries grown under
high(HT) and low(LT) temperature conditions during ripening in 2010 and 2012
48
Fig 16 Mean Normalized expression of the FLS genes involved in flavonol biosynthesis in berries grown under
high(HT) and low(LT) temperature conditions during ripening in 2010 and 2012
Fig17 The mean normalized expressiom of the LAR and BAN genes in berries grown under high (HT) and low (LT)
temperature conditions during ripening in 2010
36 Activity of biosynthetic enzymes PAL and UFGT
In general the activity of PAL enzyme in both LT and HT berries increased gradually during
ripening but was considerably lower in HT plants in all sampling data from the end of full veraison
to harvest (Fig 18) This result is in agreement with the higher expression of PAL genes assessed in
LT berries
Using delphinidin and cyanidin as substrates in both years the activity of UFGT enzyme showed an
increasing trend from the end of full veraison to harvest in both LT and HT berries (Fig 19)
nonetheless a strong reduction was observed in HT plants compared to the LT ones during ripening
Also irrespective from thermal conditions UFGT activity at veraison was higher for cyanidin
compared to delphinidin as substrate (Fig 19) and this could be related to earlier expression of the
F3rsquoH genes (starting after full bloom) compared to the expression of the F3rsquo5rsquoH genes which begin
after veraison Basically these results confirmed the negative effects of high temperature on
anthocyanin biosynthesis at least for PAL and UFGT enzyme activities which showed a strong
correlation with anthocyanin concentration and confirmed to be the key enzymes of anthocyanin
biosynthesis pathway (Hrazdina et al 1984 Mori et al 2005 Boss et al 1996)
49
Fig 18 The trends of PAL activity (in one minute) in the skin of Sangiovese berries grown under high (HT) and low(LT)
temperature conditions during ripening in the years 2010 and 2012
Fig19 The trends of UFGT activity (Using cyanidin and delphinidin as substrate) in the skin of Sangiovese berries
grown under high (HT) and low(LT) temperature conditions during ripening in the years 2010 and 2012
50
37 Hypothesis for anthocyanin degradation
371 POD candidate genes
From the research conducted by Fasoli et al (2012) it can be realized that there are many different
isoforms of Peroxidases gene in different organs of grape As to recent researchers five POD
isoforms (labeled POD1 POD2 POD3 POD4 and POD5) are showed to be more expressed in
berry skin from veraison to harvest in Sangiovese (Pastore 2010) In addition to these 5 isoforms
another one (POD6) which was reported by Mori et al (2007) was assessed in this thesis
In 2010 Real Time experiment revealed that among these 6 genes that were studied in the berry skin
of Sangiovese only the expression of the genes POD1 and POD3 seem to be linked to the
temperature (Fig 20) The expression of POD1 and POD3 in HT detected to occur in different
patterns during the ripening but POD 1 was expressed with a similar trend in both years
Fig 20 Mean Normalized expression of the selected POD genes involved in anthocyanin biosynthetic pathway in the in
berries grown under high (HT) and low(LT) temperature conditions during ripening in 2010 and 2012
51
372 Activity of enzymes involved in anthocyanin degradation PODs and PPOs
In the both years the PODs activity during ripening showed a significant increase in HT berries
compared to LT (Fig 21) supporting the hypothesis of anthocyanin degradation in response to high
temperature (Vaknin et al 2005 amp Mori et al 2007)
It has been reported that peroxidase is involved in the active anthocyanin degradation of Brunfelsia
calycina flowers (Vaknin et al 2005) and in presence of H2O2 in the vacuoles of grape cells
(Calderon et al 1992) Our findings are coherent with other papers since heat stress can contribute
to H2O2 accumulation in plant tissue (Date et al 1998) and so PODs-anthocyanins reaction may act
as a scavenging mechanism for H2O2 and plant cell detoxification in high temperature conditions
(Yamasaki et al 1997 Pourcel at al 2007)
It is interesting to note that in this experiment we could not find any PPOs activity likely due to the
plastidial localization of this enzyme (Dry amp Robinson 1994) and so we demonstred the lack of
direct involvement in active anthocyanin degradation under high temperature conditions in Vitis
vinifera
Fig 21 The trends of PODs activity in the skin of Sangiovese berries grown under high (HT) and low (LT) temperature
conditions during ripening in the years 2010 and 2012
52
4 CONCLUSION
In the present study we examined the contents of anthocyanins flavonols and tannins the
expression of some biosynthetic genes involved in their synthesis and the activities of some related
enzymes in grape berries of Sangiovese cv grown under different thermal conditions in two
different years
Anthocyanins and flavonols accumulation in Sangiovese cv revealed to be very sensitive to high
temperature (showing a reduction over 50 in total anthocyanin concentration at harvest) Several
mechanisms such as a general inhibition of the expression of flavonoids biosynthetic genes and of
the activities of some flavonoids biosynthetic enzymes (PAL and UFGT) associated with a
stimulation of some putative anthocyanin degradation enzymes (PODs) showed to be involved in the
inhibitory effect of high temperatures on anthocyanin accumulation A similar mechanism may be
supposed for flavonols degradation
This study showed that the temperature regimes after veacuteraison have different effects on each
flavonoid group in grape berry because in conterary to anthocyanins and flavonols that were
reduced in the skin of grapes ripened under high temperature environments after veraison seed and
skin tannins were not affected by the same conditions
Furthermore the warmer condition verified in 2012 compared to 2010 and the different flavonoid
composition and expression profile of some of the analyzed genes in the two years may suggest a
different sensitivity to high temperature of some genes involved in anthocyanins biosynthesis
53
Chapter one Second Part
Recognition of putative POD genes involved in anthocyanins degradation
under high temperature condition
54
1 INTRODUCTION
Petunia has played a central role in transformation research since the earliest reports of plant
transformation It was a key model system when the first definitive accounts of Agrobacterium-
mediated transformation and direct DNA transfer established the transfer and expression of foreign
genes in plants Petunia subsequently played an important role in elucidating many of the
characteristics of plant transformation One of the key reasons for the importance of Petunia in plant
transformation research has been the selection for andor identification of genotypes well suited to
growth and regeneration in culture Ease of transformation coupled with other favorable biological
characteristics ensures that Petunia will remain a valuable model system for studies of gene
function in plants (Conner et al 2009) Moreover Petunia hybrida is one of the classical subjects of
investigation of plants pigmentation in which the pathway of anthocyanin biosynthesis has been
analyzed genetically and biochemically (Meyer et al 1987 Quattrocchio et al 2006) Although the
information about Petunia sequenced genome is somehow limited it can be still used as model
species in this important field of study for the obvious ease of detecting mutants for this pathway It
can also be actively employed in complementation studies with genes from other species such as
grape (Venturini 2009)
Therefore in the second phase of this trial regarding to the results obtained from the assessment of
the expression of the genes involved in anthocyanin degradation at elevated temperature gene
transformation was conducted with different isoforms of peroxidases genes from Vitis vinifera (cv
Sangiovese) to Petunia hybrida with the aim of recognizing the most effective candidate genes for
anthocyanins degradation under high temperature
2 MATERIALS
21 Gene selection
In the first phase of this trial the expressions of 6 different isoforms of Peroxidases genes that were
showed to be more expressed in berry skin from veraison to harvest (Fasoli et al 2012 Mori et al
2007) were assessed via Real Time-PCR subsequently according to that results 3 different
isoformes were selected to transform Petunia hybrida
22 Escherichia coli strain and culture media
The DH10B strain was provided by Invitrogenreg and features the mutations recA1 endA1 presence
of the gene lacZM15 and high transformation efficiency Moreover it didnrsquot carry any antibiotic
resistance genes
55
221 Luria-Bertani (LB) medium
Component Concentration (gl)
Yeast extract 5
Tryptone 10
NaCl 10
Agar 15
Final pH 75
The medium was sterilized in an autoclave (121degC for 20 minutes 2 atm) After sterilization
antibiotic (kanamycin) was added to the solution for a final concentration of 50 mgl
222 SOC medium
Component Concentration (gl)
Yeast extract 5
Tryptone 20
After sterilization in an autoclave (121degC for 20 minutes 2 atm) glucose and salts sterilized by
filtration (filters with ores of 02 m diameter) were added to the solution at the following
concentrations
Component Concentration
NaCl 10 mM
KCl 25 mM
Glucose 20 mM
MgCl2 10 mM
MgSO4 10 mM
Final pH 68-70
56
23 Agrobacterium tumefaciens strain and culture media
For Petunia hybrida transformation the super virulent EHA105 Agrobacterium tumefaciens strain
was chosen (Hellens et al 2000) The bacteria possess a disarmed helper Ti plasmid (pTIBo542ΔT-
DNA) encoding the necessary sequences for the transfer of the T-DNA region which is carried by a
second shuttle plasmid the pK7WG20 The two plasmids are defined as binary vectors The cells
containing both plasmids can be selected for with the use of the following antibiotics
Antibiotic Concentration Resistance
Rifampicin 50 mgl Genomic
Streptomycin 300 mgl pK7WG20
Spectinomycin 100 mgl pK7WG20
231 YEB Medium
Component Concentration
Yeast extract 1 gl
Tryptone 5 gl
Beef extract 5 gl
Sucrose 5 gl
MgSO4 5 Mm
Agar 15 gl
Final pH 75
The medium was sterilized in an autoclave (121degC for 20 minutes 2 atm) After sterilization
antibiotics (streptomycin 300 mgl spectinomycin 100 mgl and rifampicin 50 mgl) were added to
the solution for selective mediums
57
24 Vectors
241 pENTRtradeD-TOPOreg (2580 bp)
Feature Benefit
rrnB T1 and T2 transcription terminators Protects the cloned gene from expression by vector- encoded
promoters thereby reducing possible toxicity in E coli
attL1 and attL2 sites
Allows sequencing in the sense orientation Bacteriophage λ-derived
DNA recombination sequences that allow recombination cloning of the
gene of interest from a Gatewayreg expression clone or attB PCR
product (Landy 1989)
TOPOreg Cloning site directional Allows a fast and directional cloning
M13 forward and reverse primer sequences Allow sequencing of the insert
Kanamycin resistance gene Allows selection of the plasmid in E coli
pUC origin Allows high-copy replication and maintenance in E coli
Fig 22 a scheme of the pENTRtradeD-TOPOreg vector
242 pK7WG20
A scheme for vector pk7WG20 is presented in Fig 23 It is a binary vector used as destination
vector in the Gatewayreg technology The T-DNA comprises the marker gene nptII which confers
58
resistance to kanamycin The cloning of an exogenous genes in this position implies an LR
recombination between the 35S CaMV constitutive promoter and the terminator 35S
Fig 23 Schematic representation of the pK7WG20 vector
25 Primers
The Primers pairs for POD1 to POD5 were newly designed on the original DNA sequences to
amplify 150ndash250 bp gene fragments and the Primers pairs for the POD6 was referred to Mori et al
(2007) (Table 7)
Subsequently according to the results of those expressions 3 different isoformes (POD 1 POD 3
and POD 5) were selected to transform Petunia hybrida
59
(Table 7) (POD 1-6) The primers of the selected isoforms of the Peroxidases genes for RT-PCR and (POD 1-3
cloning) The primers of the selected isoforms of the Peroxidases genes for cloning
primer Forward primer Reverse
POD 1 5-TCTGAGTAAGAGCCCACACACTCT-3 5-GAGACCTGAGCAGATAAATACAAAAATAAA-3
POD 2 5-AAAGTTGTTTGGCTGTGG-3 5-AATCCCTCCAAACAATCA-3
POD 3 5-TGCTCTAAATGCCTGAAAAATG-3 5-ATCATATAGAAAAGTGACAGCAACCT-3
POD 4 5-CAACTTCACACCAACGGGAAA-3 5-GCAGCTGAGCAAGAAATGCTT-3
POD 5 5-TCGGTGAGGAACTCCGATA-3 5-AGCTTCCTTGTCCTCTTCCA-3
POD 6 5-AACTTGAGACACAACAGCATAAATAAATC-3 5-AGGACCAAATCACAGGATGATAAAG-3
POD 1 cloning 5-cacc atg gca ttg atc ctc ttt tc-3 5-cta gtt taa ggc atc aca cc-3
POD 3 cloning 5-cacc atg tct ctt ctc gtt ctt ctc-3 5-tta aga ttc cag gag tgt gtc-3
POD 5 cloning 5-cacc atg aga aaa ctt atg gag gc-3 5-tta aag ttc agc aga agc ttc-3
26 Plant materials
Petunia hyrida line W84xV30 (P axillaris X P inflata) has become an attractive system for
genetic molecular and complementation studies as it possesses many desirable characteristics
colored flowers whose dimensions (5-6 cms) allow for relative ease of dissection and separation of
floral organs rapid growth cycle (2-3 months from seeds to full bloom) ease and rapidity of genetic
transformation via infection with disarmed Agrobacterium tumefaciens
This species has a limited number of chromosomes (n=7) and a small genome (12 times 106 kb) In
particular the line W84 is not capable of expressing a Glutathione S-transferase PhAN9 (Alfenito et
al 1998) and hence to accumulate anthocyanins in the vacuole leading to a fading color phenotype
However the W84 line had proved difficult to transform in previous experiments with the GST4
gene To overcome this problem a new Petunia hybrida line was generated by crossing W84 with
the V30 cultivar and recovering the mutated offspring after self-crossing This W84xV30 line was
used in all subsequent experiments
The peroxidases genes were isolated from Vitis vinifera (cv Sangiovese) (the plant materials used in
the first part of this chapter)
60
Fig 24 Petunia hyrida ndash line W84xV30
3 METHODS
After the PCR amplification of our selected genes with proof-editing PFU enzyme DNA
purification was done directly from the PCR product and used for the TOPOregCloning reaction
following the protocol provided by Invitrogen kit
31 Transformation of Escherichia coli by heat shock
After the TOPOregCloning reaction the DNA was added to the E coli DH10B competent cells and
the mixture left in ice for other 30 minutes Cells were incubated at 42degC without agitation for 30
seconds and then rapidly transferred into ice 250 microL of SOC medium provided by Invitrogen kit
kept at room temperature was added to the culture and the re-suspended cells were incubated at
37degC with agitation (200 rpm) for 1 hour 100- 200 l of the solution was placed on to a solid LB
medium and left at 37degC overnight
32 Preparation of competent cells of A tumefaciens
To obtain Agrobacterium tumefaciens strain EHA105 cells competent for the transformation by
electroporation a single colony was inoculated into 3 mL YEB medium containing Rifampicin (50
mgl) and incubated at 28degC overnight with vigorous shaking When the culture reaches the
exponential growth phase (usually after 12 hours characterized by an OD600 equal to 09-10) 15
mL of solution was sampled and centrifuged at 14000 rpm for 1 minute at room temperature The
pellet thus obtained was washed to eliminate antibiotic and re-suspended three times in 500 l cold
and sterile glycerol 10 (vv) at each step the solution was centrifuged at 14000 rpm for 1 minute
at room temperature Finally the pellet was re-suspended in 40 l of cold and sterile glycerol 10
(vv) The cells were ready to be electroporated
61
33 Transformation of A Tumefaciens by electroporation
A Bio-Rad device for electroporation was used for this experiment calibrated at 25 F 200 and
25 kV 1 or 2 microL of DNA plasmid (20 ng) was re-suspended in 40 l of competent cells The
operation was performed in ice The mix was transferred into a pre-cooled electroporation cuvette
the cuvette was then inserted into the Bio-Rad device and subjected to a pulse of 25 kVcm at 200
Ohm immediately after the pulse 1 mL LB without antibiotics was added in sterile conditions The
suspension was recovered and grown in a propylene tube with agitation for one hour at 28degC so that
the cells can express the resistance gene The cells were placed in 100 ndash 200 l aliquots on to YEB
solid medium containing Spectinomycin (final concentration 100 mgl) Rifampicin (final
concentration 50 mgl) and Streptomycin (final concentration 300 mgl) The Petri dishes were
incubated at 28degC for two days The transformation efficiency of this method is 8x10⁵ cfug DNA
34 Colony PCR
To detect bacterial recombinant clones which carry a fragment of interest it is possible to perform
the colony PCR consists of a single bacterial colony for a final volume of 20 μl A sterile tip is used
to sample the colony from the solid culture medium and dissolved in the reaction mix
35 Plasmid DNA extraction
To purify the plasmid DNA of colony which resulted positive by PCR bacteria were put in 5 mL of
liquid LB with the correct antibiotic to grow overnight at 37degC with agitation The extraction of
DNA plasmid was carried out on the base of ldquoQIAprepreg Spin Miniprep Kitrdquo (Qiagen) following the
manufacturersquos instruction
36 Purification of PCR products
To purify the PCR products the protocol of the kit provided by Promega Wizardreg SV Gel and PCR
clean-up system was performed
37 GATEWAYreg cloning system
The Gatewayreg Technology (Invitrogen) is based on the bacteriophage lambda site-specific
recombination system which facilitates the integration of lambda into the E coli chromosome and
the switch between the lytic and lysogenic pathways This recombination method facilitates transfer
62
of heterologous DNA sequences (flanked by modified att sites) between vectors Two recombination
reactions constitute the basis of the Gatewayreg Technology
Site Length Function
attL 100bp Entry clone Entry vector
attR 125bp Destination vector
38 LR Recombination reaction
LR Recombination reaction was performed following the protocol provided by Invitrogen
This reaction facilitates recombination of an attL substrate (entry clone) with an attR substrate
(destination vector) to create an attR-containing expression clone (see diagram below)
Fig 25 a scheme of the Gatewayreg cloning system
Componente Volume
Entry clone (100 ηg) 1 microL
Destination Vector (150 ηg) 1 microL
5X LR Clonase buffer 2microL
Sterile water 6 microL
63
The Entry-clone vectors had been generated with independent ligation reactions in the pENTRTM
D-
TOPOreg vector containing the attL1 and attL2 sites It was therefore possible to perform directly the
recombination reaction with the destination vector pK7WG20
The solution is incubated for 1 hour at 25degC then 1 μl of the Proteinase K enzyme (Invitrogen) is
added to the mix which is placed for an additional 10 minutes at 37degC At this point it is possible to
perform the transformation of the competent E coli DH10B cells
39 TOPO cloning reaction
TOPOreg cloning reaction was performed following the Invitrogen protocol for electro-competent E
coli cells
Reagents Chemically Competent E coli Electrocompetent E coli
Fresh PCR product 5 to 4 μl 05 to 4 μl
Dilute Salt Solution (14) -- 1 μl
Salt Solution 1 μl --
Sterile Water add to a final volume of 5 μl add to a final volume of 5 μl
TOPOreg vector 1 μl 1 μl
Final volume 6 μl 6 μl
The mix reaction was incubated in ice for 20 minutes then the cells were incubated at 42degC without
agitation for 30 seconds and then rapidly transferred into ice followed by the procedure of
Transforming One Shotreg TOP10 Competent Cells provided by Invitrogen kit
310 RNA extraction and Real time PCR
Real-time PCR was performed to evaluate the expression of six different isoforms of peroxidases
genes for five selected stages of grape berry ripening from beginning of veraison to the end of
harvest For each sampling 3 biological replicates were analyzed Total RNA was isolated from 200
mg of the powdered berry skin tissue using SpectrumTM
Plant Total RNA kit (Sigma-Aldrich St
Louis MO USA) following the manufacturers protocol One microL of each RNA sample was
measured spectrophotometrically to determine RNA quantity and 260280 and 260230 ratio using a
64
NanoDrop1000 Spectrophotometer (Thermo Fisher Scientific Wilmington DE USA) Total RNA
was treated with 1 U microg-1 RQ1 DNase (Promega Milan Italy) First-strand cDNA was synthesized
using 1 microg of RNA 1microL (dT)15 primer (500 microgmL) and 1 U of GoScripttrade reverse transcriptase
(Promega) Quantitative RT-PCR was carried out on a Step One Plustrade (Applied Biosystems Foster
City California USA) Each reaction (10 microL) contained 188 nM of each primer 2microL of diluted
cDNA (125) 5microL U of Power SYBRreg Green PCR Master Mix (Applied Biosystems Foster City
California USA) Thermal cycling conditions were 95 degC for 10 min followed by 95 degC for 15 s 55
degC for 1 min for 40 cycles followed by a melting cycle which contains 95 degC for 15 sec 60 degC for 1
min and 95 degC for 15 sec Each cDNA sample was analyzed in triplicate Gene transcripts were
quantified as reported by (Pastore 2010) The Primers pairs for POD1 to POD5 were newly
designed on the original DNA sequences to amplify 150ndash250 bp gene fragments and the Primers
pairs for the POD6 was referred to Mori et al (2007) (Table 7)
311 Stable transformation of Petunia hybrida
The protocol is applied under a laminar flow cabinet to ensure sterility Young apical leaves are
harvested and kept in water to avoid dehydration They are subsequently sterilized with a solution of
05 sodium hydrochloride in which they are dipped for 10 minutes followed by 5 washings of 10
minutes each in bi-distilled water The tips borders and petioles are removed with a sterilized
scalpel while the rest of the leaf is cut in three sections The leaf pieces are immersed in a solution
110 of overnight grown Agrobacterium tumefaciens transformed with a selected gene for 20
minutes so that the bacteria could attach to the explants after which they are transferred to a Petri
dish containing solidified Medium I (supplemented with Folic acid (1 mgmL) NAA (01 mgmL)
6-BAP (2 mgmL) without antibiotics) Each Petri dish can hold up to 10 discs The Petri dishes are
sealed and stored in a growth chamber at 25degC under day-night regime (with a long day light period
of 16 hours of light) After 2-3 days the explants are transferred into a new Petri dish filled with
medium II which contains two antibiotics 500 mgl carbenicillin to stop Agrobacterium growth and
300 mgl kanamycin to select the transformed explants The explants were transferred to fresh
selective plates each 2-3 weeks and the explants were constantly checked against contamination
with molds or other pathogens After about 8 weeks the shoots regenerated from the calluses were
removed and transferred onto the rooting medium (medium III supplemented with 500 mgl
carbenicillin and 50 mgl kanamycin) After the roots were sufficiently developed the medium was
washed away from the roots were put in jiffy pots and were grown in greenhouse Petunia hybrida
plants grow and flower in about 2 to 3 months
65
3111 Medium I
Component Concentration
Sucrose 20 gl
Glucose 10 gl
MS-macro amp micro elements with Gamborg B5 vitamins (Duchefa M0231) 44 gl
Plant Agar 8 gl
The pH is adjusted to 57-59 with HCl and KOH The medium is sterilized in an autoclave for 20
minutes and after it has reached 60deg C the following hormones are added
Component Concentration
Folic acid 1 mgl
6-BAP 2 mgl
NAA 01 mgl
3112 Medium II
Medium II is obtained from Medium I with the addition of the antibiotics needed for the eradication
of Agrobacterium tumefaciens and the selection of transformed calluses They are as thermolabile as
the phytohormones and must therefore be injected in the medium only after it has reached a
temperature lower than 60deg C
Component Concentration
Carbenicillin 500 mgl
Kanamycin 300 mgl
66
3113 Medium III
The composition of Medium III is identical to that of Medium I but without the addition of
phytohormones Also the following antibiotics are added to the medium
Component Concentration
Carbenicillin 500 mgl
Kanamycin 50 mgl
312 Agro-infiltration of petunia petals
Agro-infiltration represents recent advancements in Petunia transformation This is a technique for
transient gene expression and the development of intragenic vectors to affect gene transfer without
the integration of ldquoforeignrdquo DNA
One mL of the Agrobacterium culture grown overnight for inoculation of 25 mL of LB liquid
medium was added to 300 μgmL Streptomycin 100 μgmL Spectinomycin 20 μM Acetosyringon
and 10 mM MES and was incubated to grow overnight at 28 o
C at 180 rpm After centrifugation for
20 minutes at 12000 rpm the pellet was re-suspended with 15 mL of the buffer below After adding
100 μl of the inoculums to 900 μl of the re-suspending buffer the OD (Optical Density) was
measured spectrophotometrically and the following formula was used for dilution of the inoculums
up to the final volume of 50 mL
3121 Resuspending buffer
Component Concentration
MgCl2 10mM
MES 10mM
Acetosyringone 100 μM
The volume of the inoculums = [05 (The optimal OD) times 50 (The final volume)] divide [(The read OD
via spectrophotometer) times 10]
67
Afterward 100 μM of Acetosyringone was added to the inoculums and the mixture was incubated in
room temperature for 2-3 hours
The bacterial suspension was infiltrated into the upper layer of petals using a 1mL syringe without a
needle Infiltrated flowers were kept at 25 oC for 36 to 48 hours after infiltration
313 DNA extraction from Petunia
The DNA was extracted from a Petunia hybrida leaf disc ground thoroughly in 400 l of extraction
buffer Then the extract was centrifuged and 300 microL of the supernatant was mixed with 300 microL of
isopropyl alcohol After the incubation at room temperature for 15 minutes and centrifugation the
pellet was dried at room temperature under a fuming hood and subsequently re-suspended in 100 microL
of sterile bi-distillated water and incubate overnight in the refrigerator To discard any remaining
impurities the tube was centrifuged again and the supernatant transferred to a new sterile tube
3131 Extraction buffer
Component Concentration
Tris HCl pH 80 200 mM
NaCl 250 mM
SDS 1
EDTA 25 mM
-mercaptoethanol 10 mM
314 PCR of transformed Petunia genomic DNA
PCR amplification was performed on Petunia genomic DNA in a final volume of 20 μl As the
primer forward Promoter 35 S and as the primer reverse the specific primer for ldquoPOD 1cloningrdquo
was used As the negative control the genomic DNA of the Wild type line was used as the template
68
3141 Reaction Mix
Component Stock Volume
Template DNA 1 l
Buffer (containing MgCl2) 10x5x 4 l
Nucleotides 10 mM 04 l
Primers 20 M 04 l
Taq 5000 umL 01 l
3142 Standard thermal cycle
Initial denaturation 94 degC 5rsquo
Denaturation 94 degC 40rdquo
Primers annealing 55degC 40rdquo X 35 cycles
Extension 72 degC 90rsquorsquo
Final extension 72 degC 7rsquo
315 RNA extraction from Petunia hybrida petal
Petunia petals from the young expanded flowers were immediately frozen in liquid nitrogen and
then were kept in the freezer (-80 o
C) until analyses were carried out Total RNA was isolated from
200 mg of the powdered petal using spectrum TM
Plant Total RNA kit (Sigma-Aldrich St Louis
MO USA) following the manufacturerrsquos protocol One microL of each RNA sample was measured
spectrophotometrically to determine RNA quantity and 260280 and 260230 ratio using a
NanoDrop1000 Spectrophotometer (Thermo Fisher Scientific Wilmington DE USA)
316 cDNA synthesis RT PCR reaction
After controlling the RNA via the electrophoresis gel total RNA was treated with 1 U microg-1 RQ1
DNase (Promega Milan Italy) First-strand cDNA was synthesized using 1 microg of RNA 1microL (dT)15
primer (500 microgmL) and 1 U of GoScripttrade reverse transcriptase (Promega) PCR amplification was
69
performed on the derived cDNA for a final volume of 20 μl As the primers once the Primers pair
of actin was used and subsequently for the RT- PCR amplification the specific primers of ldquoPOD
1cloningrdquo (Table 7) were used
3161 Reaction Mix
Component Stock Volume
Template DNA 1 l
Buffer (containing MgCl2) 10x5x 4 l
Nucleotides 10 mM 04 l
Primers 20 M 04 l
Taq 5000 umL 01 l
3162 Standard thermal cycle
Initial denaturation 95 degC 5rsquo
Denaturation 95 degC 30rdquo
Primers annealing 55degC 30rdquo X 35 cycles
Extension 72 degC 20rsquorsquo
Final extension 72 degC 7rsquo
317 Total anthocyanin measurement
Petunia petals from the young expanded flowers were selected in 5 biological replicates for the
transformed plants and wild type line They were immediately frozen in liquid nitrogen ground and
the fine powder was weighted before the extraction of anthocyanins The powder was homogenized
with the solvent mixture of methanol 99 with HCl 1 at the volumes of eightfold of the powder
Then the mixture was sondicated for 20 minutes
This is the act of applying ultrasound energy to agitate particles in a sample It is applied using an
ultrasonic bath All the procedures were conducted at 4 oC After the centrifugation at 12000 rpm
70
for 10 minutes at 4 oC an aliquot of the supernatant was diluted 140 and the total anthocyanin was
quantified spectrophotometrically at 540 nm
318 Heat shock performance
Young petunia flowers in 5 biological replicates for the transgenic plants and wild type line were
selected for the heat shock To carry out this experiment the flowers were cut with a long pedicle
and some small leaves and were placed in a falcon of water They were kept for one hour in the
incubator at 45 oC and transferred subsequently to the room temperature After 30 hours the petals
were frozen in liquid nitrogen ground and the fine powder was weighted to evaluate the activity of
Guaiacol Peroxidases enzyme and the total anthocyanin
319 Guaiacol Peroxidases activity assay
Guaiacol peroxidases was assayed as described by Ushimaru et al (1997) using pyrogallol as the
electron donor for the reaction The plant material was extracted in cold buffer (200 mM sodium
phosphate 5 mM sodium EDTA 1 PVPP pH 70) and incubated on ice for 30 min After
centrifugation at (10000 times g 30 min 4 degC) the desalted supernatant was used for the assay The
reaction mixture (15 mL) included 1140 μl of the 100 mM sodium phosphate buffer pH 70 60 microL
of the 25 mM H2O2 60 mM pyrogallol and 240 μl extract H2O2 and pyrogallol were prepared
fresh just before use Absorbance (λ=430 nm) was taken after 25 min incubation at room
temperature and referred to a blank with no extract added One unit of Guaiacol peroxidases is
defined as the amount of enzyme that catalyzes the oxidation of 1 μmol of pyrogallol per minute
under the conditions described by Chen and Asada (1989) and PODs activity was expressed as kat
g-1
petal fresh weight An absorbance coefficient of 247 mM
-1 cm
-1 was assumed for calculations
4 RESULTS
The aim of this trial is recognizing the most effective candidate genes responsible for anthocyanins
degradation under high temperature conditions during the ripening time Among the candidates for
anthocyanin degradation peroxidases are involved in active anthocyanin degradation in living
tissues (Vaknin et al 2005 Welinder et al 2002) In addition the results obtained from the
enzymatic activity of peroxidases at elevated temperature and the expression of this gene during
ripening supports the hypothesis of its role in anthocyanin degradation On these bases the
technique of gene transformation was conducted with different isoforms of peroxidases genes from
Vitis vinifera (cv Sangiovese) to Petunia hybrida
71
41 Gene selection
From the research conducted by Fasoli et al (2012) it can be realized that there are different
isoforms of Peroxidases gene in different organs of grape that among them only 5 isoforms are
showed to be more expressed in berry skin from veraison to harvest In addition to these isoforms
there was another one which was reported by Mori et al (2007) to be expressed in grape berry
skin
Fig 26 The expression value of the different isoforms of Peroxidases in berry skin from veraison to harvest (V
Veacuteraison MR Mid-ripening R Ripening) Fasoli et al (2012)
As to the expression of these different isoforms by Real time pcr 3 of them were selected for the
transformation to Petunia hybrida
Fig 27 Mean Normalized expression
of the selected POD genes isolated from
berry skin for the transformation to
Petunia hybrida
72
Among all the three isoforms only the POD 1 could be successfully isolated from grape berry skin
and transformed to Petunia
42 The sequence of the POD1 gene
Vv14s0066g01850 (POD1)
ATG GCA TTG ATC CTC TTT TC
TCTACTATTCTTTCTGGGATTAGTGAACCCTTCGGAGTCCAGGTTGAGTGTCAACTACTACCAAAAATCATGCCCAAGA
TTCAGTCAGATCATGCAGGATACCATCACCAACAAGCAAATCACCAGCCCCACCACGGCTGCGGCCACTCTCCGCCTC
TTCTTCCACGACTGCTTCATTGAGGGCTGCGATGCTTCCGTTCTTGTCTCCTCGACCCCCTTCAACGAGGCCGAGCGCGA
TGCCGACATGAACCTCTCCCTCCCCGGCGACGGCTTCGACGTCGTTGTCCGCGCCAAGACCGCCCTCGAGCTCGCTTGC
CCCGGTGTGGTCTCCTGTGCCGACATTCTCGCCGTCGCTACCCGCGATCTCGTCACCATGGTGGGAGGTCCCTTCTACA
AGGTCCCGCTGGGGAGAAGAGATGGGCTGGTCTCCCGGGCGAACAGGGTTGAAGGTAACCTTCCAAGACCCACGATG
TCCATTTCTCAGATAATTTCGATTTTCGCTGTGAGAGGGTTCTCGGTTCAAGAAATGGTGGCGCTGAGTGGTGCCCACA
CGATTGGGTTCTCGCATTGTAAAGAATTCAGCAGCGGGATCTACAATTACAGCCGCAGTTCCCAGTCCAATCCGAGCTA
CAACCCTAGATTCGCAGAGGGGTTGAGAAAAGCTTGCAGCGATTACCAGAAGAATCCTACATTGTCGGTGTTCAACGA
TATAATGACTCCCAACAAGTTCGATAACATGTATTTCCAGAATCTGCCCAAGGGTTTGGGGCTATTGGCGACGGACCAT
ACCATGGCTACCGATCCGAGGACGAGGCAGTTTACGGATTTGTATGCCAAGAATCAAAGCGCCTTCTTTGAGGCATTT
GGTCGAGCTATGGAGAAGCTTGGCCTTTATGGGATCAAGACCGGGCGAAGAGGAGAGATTCGACGCA GG TGT GAT
GCC TTA AAC TAG
Vv14s0066g01850 (POD1) genomic
AAGGCTTCTGAGTAAGAGCCCACACACTCTCCATTGCTGCCACTACCACTGGCTTTTTTTTTTATTTTTGTATTTATCTGC
TCAGGTCTCTGAGCTTTGAGCTCTGAGAAACAATGGCATTGATCCTCTTTTCTCTACTATTCTTTCTGGGATTAGTGAAC
CCTTCGGAGTCCAGGTTGAGTGTCAACTACTACCAAAAATCATGCCCAAGATTCAGTCAGATCATGCAGGATACCATC
ACCAACAAGCAAATCACCAGCCCCACCACGGCTGCGGCCACTCTCCGCCTCTTCTTCCACGACTGCTTCATTGAGGGCT
GCGATGCTTCCGTTCTTGTCTCCTCGACCCCCTTCAACGAGGCCGAGCGCGATGCCGACATGAACCTCTCCCTCCCCGG
CGACGGCTTCGACGTCGTTGTCCGCGCCAAGACCGCCCTCGAGCTCGCTTGCCCCGGTGTGGTCTCCTGTGCCGACATT
CTCGCCGTCGCTACCCGCGATCTCGTCACCATGGTGGGAGGTCCCTTCTACAAGGTCCCGCTGGGGAGAAGAGATGGG
CTGGTCTCCCGGGCGAACAGGGTTGAAGGTAACCTTCCAAGACCCACGATGTCCATTTCTCAGATAATTTCGATTTTCG
CTGTGAGAGGGTTCTCGGTTCAAGAAATGGTGGCGCTGAGTGGTGCCCACACGATTGGGTTCTCGCATTGTAAAGAAT
TCAGCAGCGGGATCTACAATTACAGCCGCAGTTCCCAGTCCAATCCGAGCTACAACCCTAGATTCGCAGAGGGGTTGA
GAAAAGCTTGCAGCGATTACCAGAAGAATCCTACATTGTCGGTGTTCAACGATATAATGACTCCCAACAAGTTCGATA
ACATGTATTTCCAGAATCTGCCCAAGGGTTTGGGGCTATTGGCGACGGACCATACCATGGCTACCGATCCGAGGACGA
GGCAGTTTACGGATTTGTATGCCAAGAATCAAAGCGCCTTCTTTGAGGCATTTGGTCGAGCTATGGAGAAGCTTGGCCT
TTATGGGATCAAGACCGGGCGAAGAGGAGAGATTCGACGCAGGTGTGATGCCTTAAACTAGGTTTTTAAGGTTTTTTTT
TTTTTTTTTGCATTACAAACTCCCACCGTAGTGATGATCAATCAAGGTGAATTGATGGTGAGGGGGTGGTTTCATTTGA
ATTCTTTTTTTTTTTGTTGT
73
43 Gene transformation
After amplification of POD1 gene with PFU enzyme and specific POD1 primers (Table 7 Fig 28)
the E coli transformation was performed via pTOPO cloning system The day after a single colony
of DH10B cells that was grown on solid LB was transferred into 10 mL of liquid LB containing the
appropriate kanamycin antibiotic (for a final concentration of 50 mgl) and incubated overnight at
37deg and 250 rpm Afterward the pcr amplification of the colony was done to detect bacterial
recombinant colonies which carried the fragment of interest
Therefore 2 plates were designed to amplify each colony two times (Fig 29)
In the first plate the combination of the primer forward of M13 was used with the specific primer of
POD 1 reverse and simultaneously in the second plate the same colony was amplified with the
primer forward of POD1 with the M13 reverse The primers pair M13 gives the possibility to
amplify the fragment 50 bp longer than our inserted gene Consequently only the colonies which
were amplified in the correct position in the both plates had successfully carried the fragment of
interest (Fig 29)
Fig 28 Amplification of POD 1 gene by PFU
74
Fig 29 Colony PCR of POD 1 gene (The colonies marked with a star sign in the both gels are the ones with our
fragment of interest)
After the sequencing of the insert in the plasmid the LR recombination reaction was performed
The colony PCR was done using the ldquoPROMOTER 35 Srdquo as the primer forward and the primer
ldquoSONDA TERrdquo as the reverse The fragment 1575 bp was amplified The colony marked with a star
sign is the one with our fragment of interest (Fig 30) and the plasmid DNA was extracted and the
insert fragment of 1375 bp was amplified with the primer forward ldquoPROMOTER 35 Srdquo and the
specific primer reverse of ldquoPOD 1cloningrdquo (Table 7) (Fig 31)
75
Fig 31 The plasmid DNA (PK7WG2) control
After the transformation of A Tumefaciens the positive colonies were checked by pcr amplification
of the Agro-plasmid with the primer forward ldquoPROMOTER 35 Srdquo and the specific primer reverse of
ldquoPOD 1cloningrdquo (Fig 32) The plasmid DNA PK7WG2 was used as the positive control
Fig 30 The PK7WG2 Colony PCR of POD 1 gene
76
Fig 32 The pcr amplification of the Agro-plasmid (PC) Positive control (NC) Negative control (P1 - P5) Agro-
plasmids
Afterward the stable transformation of Petunia hybrida was done In addition at the same time the
Agro-infiltration of petunia petals was performed and the bacterial suspension was infiltrate into the
upper layer of petals Infiltrate flowers were then kept at 25 oC for two days but the flowers were
wilted without any change observed After 4 to 5 months two plants derived from the two
independent stable transformations grew in selective medium containing kanamycin and flowered
and were propagated asexually by cutting
To control the transformation efficiency the DNA was extracted from a Petunia hybrida leaf disc of
the two transgenic lines a wild type line and also as a positive control the plasmid DNA PK7WG2
was used The pcr amplification was done with the primer forward ldquoPROMOTER 35 Srdquo and the
specific primer reverse of ldquoPOD 1cloningrdquo (Fig 33)
77
As to the obtained results (Fig 33) both plants were transformed successfully To investigate the
expression of the transgene in the two lines RNA was extracted from the petal of the transgenic
plants and from the wild type line used as negative control and retro transcript to cDNA By pcr
amplification performed with the primers pairs of Actin the correct retro transcription of the RNA
was evaluated Then to analyze the expression of the transgene VvPOD1 in the petunia petal the
RT-PCR was performed with the specific primers pairs of ldquoPOD 1cloningrdquo
According to the (Fig 34) the fragment of 1kb was amplified and observed only in the second lane
confirming that the POD1 gene was expressed successfully in the Petunia hybrida line 2
Fig 33 The PCR amplification to control the transformation efficiency (TP1) Transgenic petunia 1st pot (TP2)
Transgenic petunia 2nd pot (WTL) Wild type line (PC) Positive control (NC) Negative control
78
0
5
10
15
20
25
30
35
40
45
50
Wild type line
control
POD plants
control
Wild type line
Heat shocked
POD plants
Heat shocked
To
tal
an
tho
cyan
in
A
BB
C
Fig 34 The RT-PCR of POD1 gene in the transformed plant (TP1) Transgenic petunia 1st pot (TP2) Transgenic
petunia 2nd pot (WTL) Wild type line
44 Heat shock and the plant response
Subsequently flowers from the transgenic line 2 (which expressed the POD1 gene) and from the
wild type were selected in 5 replicates and treated with the heat shock in order to highlight the
possible role of POD1 in anthocyanin degradation under stress condition
The same number of flower replicates of wild type and the transgenic line 2 were selected as the
control ie not subjected to the heat shock The petals of the treated flowers together with the
control ones were grounded by liquid nitrogen and the fine powder was weighted and divided in to
two in order to evaluate the activity of Guaiacol Peroxidases enzyme and the total anthocyanin
(Fig 35 36)
Fig 35 Total anthocyanin content of wild type line and POD plants
79
0
5
10
15
20
25
30
Wild type
line control
POD plants
control
Wild type
line Heat
shocked
POD plants
Heat shocked
(Kat
gr
-1 F
W)
C
B
C
A
By comparing the total anthocyanin content of the wild type and the transgenic lines before and after
heat treatment we found that the total anthocyanin content of the wild type line was significantly
similar in the both control and shocked treatment (Fig 35) After the heat shock the level of the
total anthocyanin in the transgenic petunia was reduced significantly However the total
anthocyanin content of the POD flowers in control was surprisingly highest among the others
Fig 36 The Peroxidase activity of wild type line and POD plants in the control and heat shock treatment
The enzymatic activity of peroxidase in both wild type and transgenic line 2 was evaluated before
and after the treatment
The wild type flowers showed the same level of enzymatic activity before and after the treatment
(Fig 36) The peroxidase activity was higher in the transgenic line in both control and the shocked
flowers However heat shock treatment contributed to significantly increase the peroxidase activity
in transformed flowers (Fig 36)
80
5 CONCLUSION
Most of the works studied the effects of temperature on anthocyanin accumulation has dealt with
the effects on the biosynthesis of anthocyanins (Mori et al 2007)
Yamane et al (2006) discussed the possibility of the contribution of another mechanism (eg
anthocyanin degradation) to the inhibitory effect of high temperature on anthocyanin accumulation
To date no report has demonstrated the enhancement of anthocyanin degradation due to high
temperature in plant tissue Hence the present study is the pioneer to show that the mechanism of
anthocyanin loss in grape skins due to high temperature involves not only the inhibition of
anthocyanin biosynthesis but also its enzymatic degradation
As to the results of this research and the literatures (Vaknin et al 2005 Mori et al 2007) among
the different candidates peroxidases (PODs) are reputed to be the main responsible for degrading
the anthocyanin pigment in vivid tissues
There are many isoforms of Peroxidases gene in different organs of grape that among them only 6
isoforms are reported to be more expressed in berry skin from veraison to harvest (Fasoli et al 2012
and Mori et al 2007)
Therefore in order to recognize the most important gene that encodes the peroxidase enzyme in
Sangiovese grape under stress condition selected isoforms of POD were isolated from Vitis vinifera
(cv Sangiovese) berries and transformed to Petunia hybrida Afterward the expression of the POD1
gene and the activity of the peroxidase enzyme were assessed in the transgenic petunia and were
compared to the wild type line under the stress condition
The obtained results could confirm that the level of total anthocyanin was decreased in the living
Petunia suffered from the heat stress this was under the circumstance that the level of the
peroxidase enzyme was significantly higher in those plants
On these bases it can be figured out that peroxidases can be considered as the responsible for
anthocyanin degradation in living tissues and the decrease of total anthocyanin content in the plants
faced to an abiotic stress such as the excessive high temperature What is more among the different
isoforms of the tested peroxidases genes the POD 1 isoform (with the sequence mentioned before)
can be identified as one of the propellant in this respect
81
Chapter two
Effects of late-season source limitations induced by trimming on grape
composition during ripening in Vitis vinifera cv Sangiovese
82
1 INTRODUCTION
Grape wine production showed a higher sensitivity to climate variability and the ongoing climatic
changes have already caused phenological alterations in some viticultural areas and are expected to
continue in the future (Jones et al 2005 Schultz 2000 Duchene and Schneider 2005) Besides
over the last fifty years an overall upgrading of vineyard management techniques which lead to a
general wine quality improvement has been verified As consequence in wine regions where heat
summations largely exceed technological requirements for the grown grape varieties a too high
level of sugar and subsequent wine alcohol excess low acidity alteration of aroma composition
and in black varieties unbalanced phenolic ripening with insufficient berry skin colour has been
shown at harvest
Accumulation of sugars is probably more responsive to temperature variations than accumulation of
anthocyanins because the optimal temperature for sugars biosynthesis and transport ranges from 8
to 33 degC while for anthocyanin pathway range from 17 to 26 degC Moreover high temperatures
(above 30-35 degC) have been the inhibitor of anthocyanin accumulation (Kliewer 1970- 1977 Mori
et al 2007 Movahed 2011) The relationship between tannins and high temperature is not clear but
some authors reported that seed tannin concentration was less susceptible to changes in temperature
conditions respect to anthocyanins (Cortell et al 2007a Ristic et al 2007) Moreover while soluble
solids and anthocyanins sysnthesis starts at veraison tannins were produced several weeks before
veraison and then their concentration in the berry starts to decrease following by a plateau at later
berry ripening stages (Kennedy et al 2000 2002) In other word it seems that there are differential
effects of temperature increase on the evolution of different berry traits in particular when they
occure after veraison On these bases the hypothesis is that the slowing down of sugars
accumulation rate may allow to achieve full ripeness of phenolic compounds mainly anthocyanins
and tannins As well known fruit sugar accumulation can be decreased by grape-growers for
example via bud load and yield increases but for the production of high quality wine it is not
allowed to exceed foreseen thresholds by the Appellation rules
A different approach to slow down sugar accumulation is represented by source limitation as the rate
of soluble solids increase in berries is well related to the ratio between leaf area to yield (Kliewer
and Dokoozlian 2005) In particular several researches showed that the removal around veraison of
the more young and efficient part of the canopy may be effective in reducing sugar accumulation
(Reynolds and Wardle 1989 Intrieri et al 1983 Intrieri 1994)
Although the relationship between sugar accumulation and leaf area to yield ratio is well
documented the evolution of some phenolic compounds in relation to leaf area efficiency and sugar
83
content in berries remain unclear Sugar has been shown to stimulate anthocyanin accumulation in
grape (Pirie and Mullins 1976 Larronde et al 1998 Hiratsuka et al 2001 Gollop et al 2002) but
it has been also reported that anthocyanins exhibit an initial phase of rapid increase strongly
correlated to sugar accumulation and a second phase where anthocyanins and sugars are uncoupled
(Guidoni et al 2008)
Moreover several studies with red wine cultivars in which crop was adjusted by means of cluster
thinning increasing the leaf area to yield ratio resulted in improved soluble solids anthocyanins
total phenols and colour intensity (Filippetti et al 2007 Pastore et al 2011Guidoni et al 2002
Reynolds et al 1994)
As well known the prediction of wine colour and quality based on berry composition is a difficult
task but the aim of this trial is to understand (i) if post veraison trimming is effective to slow down
the rate of sugar accumulation and (ii) to verify the possible derived alterations after treatment in
anthocyanins and tannins accumulation and in their compositional changes during ripening
compared to control in Vitis vinifera L cultivar Sangiovese
2 MATERIAL AND METHODS
This trial was conducted in 2009 2010 and 2011 on Sangiovese vines (V vinifera L clone 12T
grafted on 3309C) planted in 1994 in Ozzano Emilia Bologna Italy (44deg25N 11deg28E) Vines were
spaced 15 m on the row and 3 m between the rows and they were trained to Free Cordon (16 buds
per vine)
Twenty-four vines in four blocks (6 vines per block) were randomLy assigned within each block to
the following treatments
a) Non-trimmed control (C)
b) Shoot trimming 1 week after full veraison which left 8 nodes on every main shoot (TRIMM)
Trimming was performed when berry sugar concentration reached around 15deg -18deg Brix and
precisely 6th August 2009 (17 days after veraison) 10th August 2010 (17 days after veraison) and
4th August 2011 (6 days after veraison)
21 Vegetative and yield data
In each year before trimming and at harvest two regressions between shoot length (main and
lateral) and their actual leaf area were calculated and used to estimate leaf area of all tested vines At
84
trimming the main and lateral leaves were removed and leaf area was measured with a leaf area
meter (LI-3000A Li-Cor Bioscences Lincoln Nebraska USA) At harvest time the crops of each
individual plant were gathered separately and the number of clusters and their weights were
recorded
Weather data (mean daily air temperature and rainfall) were recorded from April to September in the
both years at a meteorological station located close to the experimental site
22 Berry sampling
In each year every ten days from veraison to harvest samples of 20 berries per plant were
collected pooled per each block (120 berries) and divided in three subsamples (40 each) for
determinations of the following parameters
a) Berry weight and must biochemical parameters (soluble solids pH and titratable acidity) on 20
berries performed immediately after sampling
b) Skin anthocyanins on 10 berries immediately stored in -20deg C and kept there until the analyses
c) Skin and seed tannins on 10 berries immediately stored in -20deg C and kept there until the
analyses
23 Analyses of main must biochemical parameters
The 20 sample berries were crushed and the must were sieved and used for degBrix analysis by a
temperature-compensating CR50 refractometer (Maselli Misure Spa PR Italy) Five mL of the
same must were then diluted 7 times with bi-distilled water and used to perform a titration reaction
by a Crison Compact Tritator (Crison Barcelona Spain) with 1N 05 N or 025 N NaOH (Sigma-
Aldrich St Louis MO USA) according to the stage of berry ripening to obtain pH and Titratable
Acidity (TA) data (expressed as gl of tartaric acid equivalents)
24 Analyses of skin anthocyanins
The berries sampled were weighted before the extraction of anthocyanins Then the skin was
carefully removed from the pulp and immerged in 50 mL of HPLC-grade methanol (Carlo Erba
Reagents Milano Italy) and were kept in dark for 24 hours The day after the extract was
separated from the skin residues and conserved at (-20degC) until the analysis
85
HPLC separation and quantification of anthocyanins were performed on a Waters 1525 instrument
equipped with a diode array detector (DAD) using a reversed-phase column Phenomenex (Castel
Maggiore BO Italy) RP18 250 mmx4mm (5microM) with precolumn The eluents used were the
following A= HClO4 03 in milliQ water B = methanol
The methanol extract was filtered through 022 microm 13mm PTFE syringe-tip filters (Teknokroma
Barcelona Spain) and an aliquot of 270microL was diluted to final volume of 1mL with the A eluent
The binary gradient was the same as reported in Mattivi et al (2006) with suitable modifications
The time for column equilibration was 5 minutes and the injection volume was 60 microL Separation of
the main free anthocyanins was obtained at 43 degC and they were quantified at 520 nm with a
calibration curve with malvidin-3-glucoside (Sigma-Aldrich ST Louis MO USA)
25 Tannins analysis
To extract proanthocyanidins the sampled berries (skins and seeds) were ground separately to a fine
powder under liquid N2 01 gr aliquots were separated and extracted in darkness in 2 mL screw-top
Eppendorf tubes for 24 hours with 70 acetone (10 mL) containing 01 ascorbate to prevent
oxidation of polyphenols Samples were then centrifuged (15 min 13000 g) and two 400 μL
aliquots of the supernatant were transferred to fresh tubes and dried down under vacuum at 35ordmC for
120 minutes
One of them was re-suspended in 100 μL methanol acidified with 1 HCl then neutralised with 100
μL sodium acetate (200 mM pH 75) for the analysis of free monomers The other aliquot
underwent acid-catalysed cleavage of the proanthocyanidins in the presence of excess
phloroglucinol following the method of Kennedy and Jones (2001) Briefly the dried sample was
resuspended in 100 μL of phloroglucinol buffer (025 g ascorbate 125 g phloroglucinol 215 μL
conc HCl 25 mL methanol) and incubated at 50ordmC for 20 minutes then neutralised with 100 μL of
sodium acetate (200 mM pH 75) and centrifuged (15 min 13000 g)
A 200 μL aliquot each of the acetone extract the acetone extract after acid catalysed cleavage and
the residue after cleavage was then transferred to Sunbroker 250 μL reduced volume HPLC
autosampler vials Samples were run on a Waters 1525 instrument equipped with a diode array
detector (DAD) using a reversed-phase column Phenomenex (Castel Maggiore BO Italy) RP18
250 mmx4mm (5microM) with precolumn A separate reversed-phase HPLC method was developed for
the cleaved and uncleaved proanthocyanidin samples reading absorbance at 280 nm Uncleaved
samples solvent A 02 phosphoric acid solvent B 41 acetonitrile02 phosphoric acid
86
(gradient of solvent B zero min 0 5 min 10 40 min 10 55 min 17 65 min 19 75
min 19 80 min 100 85 min 100 86 min 0) Cleaved samples solvent A 02 acetic
acid solvent B methanol (gradient of solvent B zero min 1 40 min 1 120 min 30 1201
min 100 125 min 100 126 min 1) For both methods 25 μL of sample was injected and run
at 30ordmC with a flow rate of 1 mLmin Concentrations of free monomers and hydrolysed terminal
subunits were determined from standard curves prepared from commercial standards of catechin
epicatechin epigallocatechin and epicatechin-gallate obtained from Extrasynthese (France) The
concentration of extension subunit-phloroglucinol adducts was calculated from published molar
extinction coefficients (Kennedy amp Jones 2001)
3 RESULTS AND DISCUSSION
31 Climatic data
The Growing Degree Days (GDD 10 degC baseline) from April 1st to September 30th (Table 8 Fig
37) were highest in 2011 (2054) and lowest in 2010 (1718) Moreover the average daily temperature
recorded from veraison to harvest in 2011 was mostly (70 of the period) above 25deg C In addition
in 2011 the level of the rainfall from April to September was only 136 mm whereas in 2010 the
rainfall in the same period was found to be three times more (Table 8 Fig 37)
Table 8 The climatic conditions in 2009 2010 and 2011
Year Rain from April to
September (mm)
DD from April to
September (degC)
Number of days with average daily
temp gt 25deg C from veraison to
harvest
2009 269 1963 24
2010 390 1718 7
2011 136 2054 29
87
Fig 37 The yearly recorded rainfall and daily average temperature from April 1 to September of 2009 2010 and 2011
32 Vegetative and productive traits
All vines were quite uniform in terms of leaf area before trimming in all years (data not shown) The
TRIMM treatment induced a leaf area reduction around 60 in 2009 and 2010 and around 40 in
2011 compared to control The trimming of the upper part of the canopy affected mostly the laterals
compared to the main leaves especially in 2010 (Table 9) It is interesting to note that in 2010 a
significant higher leaf area was recorded compared to 2009 probably due to the more favourable
seasonal climatic conditions during the first phase of shoots growth No laterals re-growth was
measured after treatments in all years
88
Starting from a uniform bunch number per meter of cordon yield cluster weight and berry weight
were unaffected by treatments in 2009 (Table 9) In 2010 and 2011 yield and cluster weight were
significantly lower in TRIMM vines compared to control while berry weight didnrsquot show any
difference A year-by-year variability in terms of yield was verified In 2010 yield was significantly
higher than in 2009 and 2011 for both treatments and due to the setting of uniform buds and
clusters number per vine it might be almost entirely a result of cluster weight increase (Table 9)
Berry weight did not differ between treatments during ripening (Fig38) in all the tested years
Moreover the number of berries per cluster was significantly lower in TRIMM vines compared to C
in 2010 and 2011 (Table 9)
At harvest the leaf areayield ratio was reduced in TRIMM vines to very low values corresponding
to 038 and 039 m2kg in 2009 and 2010 respectively compared to 101 and 082 m
2kg in the
control vines which are considered optimal for ripening in Free Cordon (Table 9) In 2011 probably
due to the low yield level registered in TRIMM vines the leaf area yield ratio reached a value of
093 m2kg which was not significantly different from C and that may allow an optimal ripening
(Table 9)
Despite we did not evaluate the starch content in the different parts of the tested vines it would be
expected that the TRIMM vines subjected to leaf area reduction ranging from 40 to 60 after
veraison induced further remobilization of reserves (Candolfi-Vasconcelos et al 1994) The
possible carbohydrate reserve depletion in 2009 and 2010 induced by defoliation could be
responsible for yield constraint mainly due to reduction of flower numbers per inflorescence
(Scholefield et al 1977 Bennett et al 2005)
89
Table 9 Vegetative growth and yield components recorded over 2009ndash2011 in C and TRIMM vines
Parameters 2009 2010 2011 Year
effect
Year x
Treatment
Interaction
C TRIMM C TRIMM C TRIMM
Main LA after
trimming
(m2m of cordon)
144 a 056 b 177 a 096 b 121 a 071 b ns ns
Laterals LA after
trimming
(m2m of cordon)
079 a 025 b 112 a 018 b 059 a 030 b ns ns
Total LA after
trimming
(m2m of cordon)
223 a 081 b 289 a 114 b 180 a 101 b ns
Cluster
(nm of cordon)
105 a 106 a 111 a 102 a 101 a 102 a ns ns
Yield
(kgm of cordon)
22 a 21 a 35 a 29 b 143 a 108 b ns
Cluster weight (g) 2108
a 1966 a
3121
a 2868 b 1473 a 1045 b ns
Berry weight (g) 155 a 153 a 170 a 169 a 128 a 123 a ns
Berries per cluster (n) 136a 1285a 1835a 1697b 1150a 850b ns
Leaf area yield
(m2kg)
101a 038b 082a 039b 125a 093a ns
Different letters indicate mean separation between treatments C and TRIMM within rows and years by t -test P = 005
P = 001 year x treatment interaction indicate mean separation within rows and years by t-test
90
Fig 38 Berry weight in the control and trimmed vines from veraison to harvest of the years 2009
2010 and 2011
33 Ripening analyses Soluble solids pH and Total Acidity
In 2009 and in 2010 TRIMM vines had significant lower soluble solids concentration (degBrix) at
harvest compared to C but no significant effect was recorded in 2011(Fig 39) TA and pH did not
show any difference between treatments in all years (Table 10) Daily soluble solids accumulation
rate has been reduced after trimming in 2009 and 2010 of 8 and 16 and not at all in 2011
compared to control vines
In 2011 the extremely hot and dry climatic conditions led to an acceleration in the accumulation of
soluble solids so that 23 days after veraison the degBrix level of C reached the 24 degBrix (Fig 39)
while in 2009 and 2010 this value was reached respectively 42 and 58 days after veraison Under
91
such circumstances associated with a general lower level of yield in 2011 compared to the previous
years the grapes of TRIMM vines did not show differential accumulation rate and no significant
difference was recorded in berry composition compared to Control in this year This result is in
agreement with the high value of leaf area to yield ratio (Table 9) measured in TRIMM vines in
2011 which is considered adequate to allow an optimal ripening
Fig 39 degBrix in the control and trimmed vines from veraison to harvest of the years 2009 2010 and 2011
92
34 Anthocyanins accumulation during ripenning
Total anthocyanin concentration (mgkg) did not differ among treatments during ripening in all the
experimental years (Fig40) and no variation was registered at harvest (Table 10) Although no
difference was recorded among the treatments the anthocyanins concentrations were different
among the years (Fig40) The lowest anthocyanin value at harvest was registered to be in 2009 and
the maximum was observed in 2011 (Fig40) These results do not seem correlated with the different
temperature trend in the experimental years because in the both 2009 and 2011 the temperature
exceeded to the critical value for anthocyanin accumulation for periods with similar length Having
the lowest berry weight in 2011 is probably the reason of the highest anthocyanin value registered at
harvest in the grapes of both treatments as compared to the previous years (Table 9 10)
Notably no relation has been verified between the reduction in soluble solids accumulation
occurred in 2009 and in 2010 and variation in anthocyanins accumulation
In particular in 2009 when the trimming was effective in slowing down the rate of sugar
accumulation the correlation between total anthocyanin content (mg per berry) and berry juice
soluble solids concentration showed similar curves for TRIMM and C (Fig 41) Both treatments
showed an increasing positive trend between 10deg Brix to 22deg Brix where there is a peak
concentration and a decline in anthocyanins during the latter stage of ripening (Fig 41) Our results
are in acordance with Guidoni et al (2008) who demonstrated that anthocyanins may accumulate in
a two-phase process with an initial phase of rapid increase and a second phase where anthocyanins
and sugars are uncoupled
As other authors pointed out sugar accumulation was shown to be more strictly associated to
thermal time whereas anthocyanin accumulation was also affected by other sources of variations
(water yield and climatic conditions) (Sadras et al 2007) and in general displays a much wider
range of variation than that of sugars
93
Fig 40 The anthocyanin concentration in the control and trimmed vines from veraison to harvest of the years 2009
2010 and 2011
Fig 41 The correlation between the total anthocyanin content and berry soluble solids concentration in the control and
trimmed vines from veraison to harvest of the year 2009
94
Besides the analysis of the anthocyanin composition at harvest did not show significant difference
between the treatments in all the three years The percentage of delfinidid 3-G cyanidin 3-G
peonidin 3-G petunidin -3-G and malvidin 3-G in berries of TRIMM and C vines showed the
typical Sangiovese grape profile with high level of cyanidin 3-G and malvidin 3-G (Fig 42) It
seems that the biosynthesis of each individual anthocyanin is not influenced by the variation of
sugar concentration in the berries at harvest as occurred in 2009 and 2010
Moreover the trimming treatment did not modify cluster microclimatic conditions which are found
to be responsible for anthocyanin profile changes as reported after cluster shading (Downey et al
2004) and temperature variation (Mori et al 2005)
Fig 42 The anthocyanin profile in the berry skin of control and trimmed vines at harvest of the years 2009 2010 and
2011
95
35 Tannins accumulation during ripenning
In all experimental years trimming did not affect the evolution of seed and skin tannins
concentration expressed as mg per kg of berries during ripening and at harvest (Table 10 Fig 43 45
and 47) The tannins were expressed as mg per kg of berries as no differences were recorded
between treatments in berry weight during ripening (Fig 38)
Similar to what was previously reported on different varieties (Harbertson et al 2002 Kennedy et
al 2002 Downey et al 2003) the levels of seed tannins were higher compared to skin tannins at
veraison but declined during ripening The levels of berry skin and seed tannins reached to nearly
equal levels at harvest (Table 10 Fig 43 45 and 47) By evaluating the seed monomers and
polymers tannins the similar trends were observed in all treatments during ripening and their
concentration (mgkg of berries) in seed polymers was considerably higher than in its monomers as
expected
As well as that the berry tannins composition was assessed from veraison to harvest in each year
and the evolution of all four flavan-3-ols (catechin epicatechin epigallocatechin and epicatechin-
gallate) followed the same tendency between treatments (Fig 44 46 and 48) And among them
epicatechin is the major and catechin is the minor constituent of berry tannins (Fig 44 46 and 48)
Our results assessed that the concentration and composition of each group of tannins compounds at
harvest were not affected by trimming treatment after veraison also when this technique was able to
reduce sugar accumulation rate Moreover it appeared that the concentration of each flavan 3 ols
(catechin epicatechin epigallocatechin and epicatechin-gallate) remains almost constant in the last
thirty days before harvest revealing that both tannins composition and content may be not
responsable of different level of astringency in wine obtained from grapes at different degree of
ripening In other words our results seem to assess a very low effectiveness of the determinations of
each compound in prediction of wine astringency traits As previously pointed out by several
authors the extractability and solubility of each group of flavonoid compounds during ripening may
play an important rule to understand the relationships between berry composition wine composition
and sensory properties of wine
96
Fig 43 The tannins concentration of berry seed and skin in the control and trimmed vines from veraison to harvest of
the year 2009
Fig 44 The tannins composition in the control and trimmed vines from veraison to harvest of the year 2009
97
Fig 45 The tannins concentration of berry seed and skin in the control and trimmed vines from veraison to harvest of
the year 2010
Fig 46 The tannins composition in the control and trimmed vines from veraison to harvest of the year 2010
98
Fig 47 The tannins concentration of berry seed and skin in the control and trimmed vines from veraison to harvest of
the year 2011
Fig 48 The tannins composition in the control and trimmed vines from veraison to harvest of the year 2011
99
Table 10 Berry composition in the control and trimmed vines at harvest of the years 2009 2010 and 2011
Parameters 2009 2010 2011 Year x
Treatment
Interaction C TRIMM C TRIMM C TRIMM
Soluble solids (degBrix) 252 a 246 b 237 a 23 b 264 a 272 a ns
Total acidity (gl) 738 a 723 a 779 a 796 a 844 a 891 a ns
pH 353 a 347 a 339 a 336 a 339 a 336 a ns
Total anthocyanins
(mgkg berries)
7961 a 8381 a 11177 a 11200 a 17080 a 18100 a
Total tannins 3506 a 3547 a 3330 a 3107 a 3699 a 3522 a ns
Total tannins in skin 1006 a 1196 a 1466 a 1243 a 1697 a 1722 a ns
Total tannins in seed 2600 a 2352 a 1864 a 1864 a 2002 a 1800 a ns
4 CONCLUSION
The source limitation by trimming after veraison showed some perspectives to achieve lower sugar
accumulation in grape and lower alcohol potential in wines without inducing modification in the
evolution of the main assessed flavonoids compounds (skin anthocyanins total seeds and skin
tannins concentration and profile) in Sangiovese berries
The efficiency of this technique seems to be strongly depending from the vines starch supply as the
possible carbohydrate reserve depletion induced year over year by trimming may be responsible for
self regulation mechanism of yield constraint verified in the second and third year of the trial In this
condition the leaf area cutback after veraison is counterbalanced by the yield lowering and no effects
is obtained in lowering sugar accumulation as the leaf area yield ratio is maintained to high level
Probably the low fertility condition of the vineyard site and the lack of irrigation system may have
promoted this mechanism
Further researches on photosynthetic limitation after veraison to reduce sugar accumulation will be
focused on vines in different soil fertility condition and on the evaluation of the extractability of
tannins from seeds and skins in wines or wine-like solutions derived from this treatment
100
5 GENERAL CONCLUSION
Wine grape must deal with serious problems which occur due to the unfavorable climatic conditions
resulted from global warming
The excessive elevated temperatures are critical for grapevine and contribute to degradation of grape
and wine quality As an illustration elevated temperature is an important factor that can negatively
affect anthocyanin accumulation in grape Particularly cv Sangiovese was identified to be very
sensitive to such condition The expressions of the genes involved in flavonoid biosynthesis were
observed to be affected by temperature The quantitative real-time PCR analysis showed that
flavonoid biosynthetic genes were slightly repressed by high temperature As well as that the heat
stress showed to repress the expression of the transcription factors VvMYBA1 that activates the
expression of UFGT
Moreover high temperatures showed to had repressing effects on the activity of the flavonoids
biosynthetic enzymes PAL and UFGT
Anthocyanin accumulation in berry skin is due to the balance between its synthesis and oxidation
In grape cv Sangiovese the gene transcription and activity of peroxidases enzyme was found to be
elevated by heat stress as a defensive mechanism of ROS-scavenging
Even if different antioxidant enzymes have been recognized to be involved in flavonoids
degradation under various abiotic stresses this research identifies peroxidases as one of the best
candidate to oxidize anthocyanins actively
Between many isoforms of peroxidases genes which are expressed in grape berry skin from
veraison to harvest one peroxidase gene (POD 1) induced in Sangiovese grape under thermal stress
condition was isolated and evaluated via the technique of genes transformation from grape to
Petunia flower Reduction in anthocyanins concentration in POD 1 transformed Petunia flowers was
assessed after thermal stress conditioning compared to untrasformed control
Biochemical and molecular studies confirmed the role of peroxidases enzyme in active anthocyanins
degradation in Sangiovese cv grape skin under temperature stress conditions Based on our results
a similar mechanism that will be object of further investigation may be supposed for flavonols
degradation In conclusion this study showed that the temperature regimes after veacuteraison have
different effects on each flavonoid group Although the anthocyanin proanthocyanidin and flavonol
share the main part of their biosynthetic pathway no effects were obtained regarding any changes in
the biosynthesis of the proanthocyanidins under these different thermal ripening conditions
101
Moreover the present study is the pioneer to approve that the mechanism of anthocyanin loss in
grape skins due to high temperature involves not only the inhibition of anthocyanin biosynthesis but
also its enzymatic degradation
What is more in wine producing regions it is inevitable for the grape growers to adopt some
adaptive strategies to alleviate grape damages to abiotic stress conditions It is necessary to
ameliorate the vintage through improvement of management techniques to face the impacts of
undesirable climatic conditions Therefore in this thesis the technique of post veraison trimming
was done to improve the coupling of the phenolic and sugar ripening in Vitis vinifera L cultivar
Sangiovese
Trimming after veraison allowed to limit the photosynthetic source and showed to be executable to
slow down the rate of sugar accumulation in grape (to decrease the alcohol potential in wines)
without inducing modification in the evolution of the main berry flavonoids compounds
Moreover the present research showed that the efficiency of this technique applied year after year is
related to the ability of the vines to recover charboidrate reserve to prevent self regulation
mechanism of yield constraint
Further researches need to be performed on the evaluation of the extractability of tannins from seeds
and skins in wines or wine-like solutions derived from grape on vines subjected to post veraison
photosynthetic limitation
102
REFERENCES
Adams D 2006 Phenolics and ripening in grape berries J Am J Enol Vitic Vol 57 (3) 249-
256
Alfenito MR Souer E Goodman CD 1998 Functional complementation of anthocyanin
sequestration in the vacuole by widely divergent Glutathione Stransferases J The Plant Cell Vol
101135-1149
Aron PM Kennedy JA 2008 Flavan-3-ols Nature occurrence and biological activity J Mol
NutrFood Res Vol 52 79-104
Bavaresco L Fregoni C 2001 Physiological role and molecular aspects of grapevine stilbenic
compounds In K A Roubelakis-Angelakis (Ed) Molecular biology and biotechnology of the
grapevine pp 153-182
Bennett J Jarvis PCreasy G Trought M 2005 Influence of defoliation on overwintering
carbohydrate reserves return bloom and yield of mature Chardonnay grapevines J Am J Enol
Vitic Vol 56(4) 386-393
Bergqvist J Dokoozlian N Ebisuda N 2001 Sunlight exposure and temperature effects on berry
growth and composition of Cabernet Sauvignon and Grenache in the central San Joaquin Valley of
California J Amer J Enol Vitic Vol 52 (1) 1-7
Bindi M Fibbi L Gozzini B Orlandini S Miglietta F 1996 Modelling the impact of future
climate scenarios on yield and yield variability of grapevine J Clim Res Vol 7 213ndash224
Bogs J Downey MO Harvey JS Ashton AR Tanner GJ Robinson SP 2005
Proanthocyanidin Synthesis and Expression of Genes Encoding Leucoanthocyanidin Reductase and
Anthocyanidin Reductase in Developing Grape Berries and Grapevine Leaves J Plant Physiol Vol
139 652ndash663
Bogs J Ebadi A McDavid D Robinson SP 2006 Identification of the flavonoid hydroxylases
from grapevine and their regulation during fruit development J Plant Physiol Vol 140(1) 279-
291
Boss PK Davies C Robinson S P 1996 Analysis of the expression of anthocyanin pathway
genes in developing Vitis Vinifera L cv Shiraz grape berries and the implications of pathway
regulation J Plant Physiol Vol 111 1059-1066
Boulton R 2001 The copigmentation of anthocyanins and its role in the color of red wine A
critical review J Am J Enol Vitic Vol 52 (2) 67-87
103
Braidot E Zancani M Petrussa E Peresson C Bertolini A Patui S Macrigrave F Vianello A
2008 Transport and accumulation of flavonoids in grapevine (Vitis vinifera L) J Plant signaling
and behavior Vol 3(9) 626 - 632
Broun P 2005 Transcriptional control of flavonoid biosynthesis a complex network of conserved
regulators involved in multiple aspects of differentiation in Arabidopsis J Current Opinion in Plant
Biology Vol 8(3) 272-279
Bucchetti B 2004 Effetti biochimici e molecolari della luce sulla maturazione dellrsquouva nella cv
Sangiovese Tesi di Dottorato di ricerca in Colture Arboree ed Agrosistemi Forestali e Paesaggistici
XVII ciclo Universita di Bologna
Bucchetti B Pastore C Filippetti I Intrieri C 2007 Effetti di diverse tecniche colturali sulla
sintesi di antociani in Sangiovese Poster VIII GIORNATE SCIENTIFICHE SOI 8-11052007
(SS)
Buchanan-Wollaston V Morris K 2000 Senescence and cell death in Brassica napus and
Arabidopsis In Programmed Cell Death in Animals and Plants (Garland JM ed) BIOS Scientific
Publishers pp 163ndash174
Butterfield RE Gawith MJ Harrison PA Lonsdale KJ Orr J 2000 Modelling climate
change impacts onwheat potato and grapevine in Great Britain in Downing T E Harrison P A
Butterfield R E and Lonsdale KG (eds) Climate Change Climatic Variability and Agriculture
in Europe An Integrated Assessment Final Report Environmental Change Institute University of
Oxford 411 p
Buttrose MS Hale CR Kliewer WM 1971 Effect of temperature on composition of
lsquoCabernet Sauvignonrsquo berries J Amer J Enol Vitic Vol 22 (2) 71ndash75
Calderon AA Garciaflorenciano E Munoz R Barcelo A R 1992 Gamay grapevine
peroxidase its role in vacuolar anthocyani( di)n degradation J VITIS Vol 31(3) 139ndash147
Candolfi-Vasconcelos M Candolfi M Kohlet W 1994Retranslocation of carbon reserves from
the woody storage tissues into the fruit as a response to defoliation stress during the ripening period
in Vitis vinifera L
Castellarin SD Pfeiffer A Sivilotti P Degan M Peterlunger E Di Gaspero G 2007
Transcriptional regulation of anthocyanin biosynthesis in ripening fruits of grapevine under seasonal
water deficit J Plant Cell and Environment Vol 30 1381ndash1399
Castellarin SD Di Gaspero G Marconi R Nonis A Peterlunger E Paillard S Adam-
Blondon AF Testolin R 2006 Colour variation in red grapevines (Vitis vinifera L) genomic
104
organisation expression of flavonoid 3-hydroxylase flavonoid 35-hydroxylase genes and related
metabolite profiling of red cyanidin-blue delphinidin-based anthocyanins in berry skin J BMC
Genomics Vol 7(12) 1471-2164
Chen G Asada K 1989 Ascorbate Peroxidase in tea leaves occurrence of two isozymes and the
differences in their enzymatic and molecular properties J plant cell physiol Vol 30 (7) 987-998
Chen J Wen P Kong W Pan Q Wan S Huang W 2006 Changes and subcellular
localizations of the enzymes involved in phenylpropanoid metabolism during grape berry
development J Plant phisiol Vol 163 (2) 115-127
Cheynier V Rigaud J 1986 HPLC separation and characterization of flavonols in the skin of
Vitis Vinifera var Cinsault J Am J Enol Vitic Vol 37 248-252
Christie P Alfenito M R Walbot V 1994 Impact of low temperature stress on general phenyl
propanoid and anthocyanin pathways enhancement of transcript abundance and anthocyanin
pigmentation in maize seedlings J Planta Vol 194 541ndash549
Chua CS Biermann D Goo K S Sim T 2008 Elucidation of active site residues
of Arabidopsis thaliana flavonol synthase provides a molecular platform for engineering flavonols
J Phytochem Vol 69 (1) 66ndash75
Cohen S Tarara J Kennedy J 2012 Diurnal temperature range compression hastens berry
development and modifies flavonoid partitioning in grapes J Am J Enol Vitic vol 63(1) 112-
120
Conde C Silva P Fontes N Dias A Tavares R M Sousa M Agasse A Delrot S Geroacutes
H 2007 Biochemical changes throughout grape berry development and fruit and wine quality
httphdlhandlenet18226820
Conner AJ Albert NW Deroles SC 2009 Transformation and regeneration of petunia C
Springer Springer Science+Business Media LLC Chapter 19 pp 395-409
Coombe B G 1992 Research on Development and Ripening of the Grape Berry J Am J Enol
Vitic Vol 43(1) 101-110
Cortell JM M Halbleib AV Gallagher T Righetti and JA Kennedy 2007a Influence of vine
vigor on grape Vitis vinifera L cv Pinot noir) anthocyanins 1 anthocyanin concentration and
composition in fruit J Agrie Food Chem 556575-6584
Darneacute G 1993 New hypothesis on anthocyanin biosynthesis in berries and leaves of grapevine J
Vitis Vol 32 77-85
105
Dat JF Foyer CH Scott IM 1998 Changes in salicylic acid and antioxidants during induced
thermotolerance in mustard seedlings J Plant Physiol Vol 118 1455ndash1461
Davies KM Schwinn KE 2003 Transcriptional regulation of secondary metabolism J
Functional Plant Biology Vol 30(9) 913 ndash 925
Dela G Or E Ovadia R Nissim-Levi A Weiss D Oren- Shamir M 2003 Changes in
anthocyanin concentration and composition in lsquoJaguarrsquo rose flowers due to transient
hightemperature conditions J Plant Sci Vol 164 333ndash340
Deluc L Bogs J Walker AR Ferrier T Decendit A Merillon JM Robinson SP Barrieu
F 2008 The transcription factor VvMYB5b contributes to the regulation of anthocyanin and
proanthocyanidin biosynthesis in developing grape berries J Plant Physiol Vol (147) 2041ndash2053
Dokoozlian NK 2000 Grape berry growth and development Raisin Production Manual Chapter
5 pp 30- 37
Downey MO Dokoozlian NK Krstic MP 2006 Cultural Practice and environmental Impacts
on the flavonoid composition of grapes and wine A review of recent research J Amer J Enol
Vitic Vol 57 (3) 257-268
Downey MO Harvey JS Robinson SP 2003 Analysis of tannins in seeds and skins of Shiraz
grapes throughout berry development J Aust J Grape Wine Res Vol 9 15-27
Downey MO Harvey JS Robinson SP 2003 Synthesis of flavonols and expression of
flavonol synthase genes in the developing grape berries of Shiraz and Chardonnay (Vitis Vinifera
L) J Aust J Grape Wine Res Vol 9 110-121
Downey MO Harvey JS Robinson SP 2004 The effect of bunch shading on berry
development and flavonoid accumulation in Shiraz grapes J Aus J Grape Wine Res Vol 10 55-
73
Dry I B Robinson S P 1994 Molecular cloning and characterization of grape berry polyphenol
oxidase J Plant Molecular Biology Vol 26 495-502
Duchene E Schneider C 2005 Grapevine and climatic changes a glance at the situation in
Alsace Agron J Sustain Dev Vol 25 93ndash99
Fasoli M Dal Santo S Zenoni S Tornielli GB Farina L Zamboni A Porceddu A
Venturini L Bicego M Murino V Ferrarini A Delledonne M Pezzotti M 2012 The
grapevine expression atlas reveals a deep transcriptome shift driving the entire plant into a
Maturation Program J The Plant Cell Vol 24 3489ndash3505
Ferrini F Mattii GB Nicese FP 1995 Effect of Temperature on Key Physiological Responses
of Grapevine Leaf J Am J Enol Vitic Vol 46(3) 375-379
106
Filippetti I 2009 Technological and Phenolic ripening synchronization in winegrape Data has not
been published
Filippetti I Ramazzotti S Centinari M Bucchetti B Intrieri C 2007 Effects of cluster
thinning on grape composition experience ldquoSangioveserdquo grapevines Proc Int Workshop on
Advance in Grapevine and Wine Research
Fournand D Vicens A Sidhoum L Souquet JM Moutounet M Cheynier V 2006
Accumulation and extractability of grape skin tannins and anthocyanins at different advanced
physiological stages J Agric Food Chem Vol 54 7331-7338
Fraser E 2008 ldquoCrop yield and climate changerdquo Retrieved on 2009-09-14
Fujita A Soma N Goto-Yamamoto N Mizuno A Kiso K Hashizume K 2007 Effect of
shading on proanthocyanidin biosynthesis in the grape berry J Japan Soc Hort Sci Vol 76 112-
119
Fujita A Goto-Yamamoto N Aramaki I Hashizume K 2006 Organ-Specific Transcription
of Putative Flavonol Synthase Genes of Grapevine and Effects of Plant Hormones and Shading on
Flavonol Biosynthesis in Grape Berry Skins J Biosci Biotech and Biochem Vol 70 (3) 632-
638
Gagneacute S Lacampagne S Claisse O Geacuteny L 2009 Leucoanthocyanidin reductase and
anthocyanidin reductase gene expression and activity in flowers young berries and skins of Vitis
vinifera L cv Cabernet-Sauvignon during development J Plant Physiol amp Biochem Vol 47 (4)
282ndash290
Gatto P Vrhovsek U Muth J Segala C Romualdi C Fontana P Pruefer D Stefanini M
Moser C Mattivi F Riccardo Velasco R 2008 Ripening and genotype control stilbene
accumulation in healthy grapes J Agric Food Chem Vol 56 (24) 11773ndash11785
Gollop R Even S Colova-Tsolova V Peri A 2002 Expression of the grape dihydroflavonol
reductase gene and analysis of its promoter region J Exp Bot Vol 53 1397ndash1409
Gollop R Farhi S Perl A 2001 Regulation of the leucoanthocyanidin dioxygenase gene
expression in Vitis vinifera J Plant Sci Vol 161 (3) 579ndash588
Goto-Yamamoto N Mori K Numata M Koyama K Kitayama M 2009 Effects of
temperature and water regimes on flavonoid contents and composition in the skin of red-wine
grapes J Int Sci Vigne Vin Vol 43 (1) 75-80
Goto-Yamamoto N Wan GH Masaki K Kobayashi S 2002 Structure and transcription of
three chalcone synthase genes of grapevine (Vitis vinifera) J Plant Sci Vol 162 867-872
107
Greer D H Weston C 2010 Heat stress affects flowering berry growth sugar accumulation and
photosynthesis of Vitis vinifera cv Semillon grapevines grown in a controlled environment J
Functional Plant Biol Vol 37(3) 206ndash214
Guidoni S Ferrandino A Novello V 2008 Effects of seasonal and agronomical practices on
skin anthocyanin profile of Nebbiolo grapes JAm J Enol Vitic Vol 59(1) 22-29
Guidoni S Ferrandino A Novello V 2004 Ruolo del clima e degli interventi colturali sulla
sintesi degli antociani nellrsquouva (Vitis Vinifera L cv Nebbiolo) J Quad Vitic Enol Univ Torino
27
Guidoni S P Allara and A Schubert 2002 Effect of cluster thinning on berry skin anthocyanin
composition of Vitis vinifera cv Nebbiolo Am J Enol Vitic V 53224-226
Harbertson JF Kennedy JA Adams DO 2002 Tannin in skins and seeds of Cabernet
Sauvignon Syrah and Pinot noir berries during ripening J Am J Enol Vitic Vol 53 (1) 54-59
Hardie WJ OrsquoBrien TP Jaudzems VG 1996 Morphology anatomy and development of the
pericarp after anthesis in grape Vitis vinifera L J Aust J Grape Wine Res Vol 2 97ndash142
Haselgrove L Botting D Van Heeswijck R Hoslashj PB Dry PR Ford C Iland PG 2000
Canopy microclimate and berry composition The effect of bunch exposure on the phenolic
composition of Vitis vinifera L cv Shiraz grape berries J Aust J Grape Wine Res Vol 6 141-
149
Hawker JS 1969a Changes in the activities of enzymes concerned with sugar metabolism during
the development of grape berries J Phytochem Vol 8 9-17
Hawker JS 1969b Insoluble invertase from grapes an artefact of extraction J Phytochem Vol
8 337-344
Hellens RP Edwards EA Leyland NR Bean S Mullineaux PM 2000 pGreen a versatile
and flexible binary Ti vector for Agrobacterium-mediated plant transformation J Plant Mol Biol
Vol 42 819-832
Hiratsuka S Onodera H Kawai Y Kubo T Itoh H Wada R 2001 ABA and sugar effects on
anthocyanin formation in grape berry cultured in vitro J Scientia Horticulturae Vol 90 (1-2) 121-
130Hrazdina G Parsons GF Mattick LR 1984 Physiological and biochemical events during
development and maturation of grape berries J Amer J Enol Vitic Vol 35 (4) 220ndash227
Huglin P 1978 Nouveau Mode drsquoEacutevaluation des Possibiliteacutes Heacuteliothermiques drsquoun Milieu
Viticole CR Acad Agr France Vol 64 1117-1126
Hugueney P Provenzano S Verriegraves C Ferrandino A Meudec E Batelli G Merdinoglu D
Cheynier V Schubert A Ageorges A 2009 A novel cation-dependent o-methyltransferase
involved in anthocyanin methylation in grapevine J Plant Physiol Vol 150 (4) 2057- 2070
108
Intrieri C 1994 Vini frizzanti interventi agronomici per il controllo della maturazione J
Lrsquoenotecnico Vol 9 65-72
Intrieri C Magnanini E Silvestroni O 1983 Effetti della potatura verde sul comportamento
vegetativo e produttivo di Albana e Sangiovese J Vignevini Vol 5 57-62
Intrieri C Silvestroni O Poni S 1994 ndash Pluker nuova defogliatrice polivalente per vigneti
Vignevini Vol 1-2 25 ndash 31
involvement of leucoanthocyanidin dioxygenase J Planta Vol 229( 2) 427-445
J Planta Vol 192(4) 567-573
Jackman RL Smith JL 1996 Anthocyanins and betalains In Hendry GAF Houghton JD eds
Natural food colorants 2nd
edn London Chapman amp Hall pp 244ndash309
Jeong ST Goto-Yamamoto N Kobayashi S Esaka M 2004 Effects of plant hormones and
shading on the accumulation of anthocyanins and the expression of anthocyanin biosynthetic genes
in grape berry skins J Plant Sci Vol 167 247-252
Jeong ST Goto-Yamamoto N Hashizume K Esaka M 2006 Expression of the flavonoid 3prime-
hydroxylase and flavonoid 3prime5prime-hydroxylase genes and flavonoid composition in grape (Vitis
vinifera) Plant Sci Vol 170 (1) 61ndash69
Jiang YM Duan X Joyce D Zhang Z Li J 2004 Advances in understanding of enzymatic
browning in harvested litchi fruit J Food Chem Vol 88 443ndash446
Jones GV White MA Cooper OR Storchmann K 2005 Climate change and global wine
quality J Climatic Change Vol 73 319ndash343
Kader F Haluk JP Nicolas JP Metche M 1998 Degradation of cyanidin 3-glucoside by
blueberry polyphenol oxidase kinetic studies and mechanisms J Agric Food Chem Vol 46
3060ndash 3065
Kader F Nicolas JP Metche M 1999 Degradation of pelargonidin 3-glucoside in the presence
of chlorogenic acid and blueberry polyphenol oxidase J Sci Food Agric Vol 79 517ndash522
Kader F Rovel B Girardin M Metche M 1997 Mechanism of browning in fresh highbush
blueberry fruit (Vaccinium corymbosum L) Role of blueberry polyphenol oxidase chlorogenic acid
and anthocyanins J Sci Food Agric Vol 74(1) 31ndash34
Karimi M Inzeacute D Depicker A 2002 GATEWAYtrade vectors for Agrobacterium-mediated plant
transformation J Trends in Plant Sci Vol 7(5) 193ndash195
Kemp BS Harrison R Creasy GL 2011 Effect of mechanical leaf removal and its timing on
flavan-3-ol composition and concentrations in Vitis vinifera L cv Pinot Noir wine J Aust J Grape
Wine Res Vol 17(2) 270ndash279
109
Kennedy JA Jones GV 2001 Analysis of Proanthocyanidin Cleavage Products Following
Acid-Catalysis in the Presence of Excess Phloroglucinol Amer J Enol Vitic Vol 49(4) 1740-
1746
Kennedy JA Matthews MA Waterhouse AL 2000 Changes in grape seed polyphenols during
fruit ripening J Phytochem Vol 55 77-85
Kennedy JA Matthews MA Waterhouse AL 2002 Effect of maturity and vine water status
on grape skin and wine flavonoids J Am J Enol Vitic Vol 53 268-274
Kennedy JA Saucier C Glories Y 2006 Grape and Wine Phenolics History and Perspective
J Am J Enol Vitic Vol 57 (3) 239-248
Kenny GJ Harrison PA 1992 The effects of climate variability and change on grape suitability
in Europe J Wine Res Vol 3 163ndash183
King P McClellan D Smart R 2012 Effect of severity of leaf and crop removal on grape and
wine composition of Merlot vines in Hawkersquos bay vineyards J Am J Enol Vitic ajev201212020
Kliewer W M 1970 Effect of day temperature and light intensity on coloration of Vitis vinifera
grapes J Amer Soci Hort Sci Vol 95 693ndash697
Kliewer W M Torres R E 1972 Effect of controlled day and night temperatures on grape
coloration J Amer J Enol Vitic Vol 23 71ndash77
Kliewer W Dokoozlian N 2005 Leaf areacrop weight ratios of grapevines influence on fruit
composition and wine quality J Am J Enol Vitic Vol 56(2) 170-181
Kliewer WM 1966 Sugars and organic acids of Vitis Vinifera J Plant PhysiolVol 41 923-931
Kliewer WM 1977 Influence of temperature solar radiation and nitrogen on coloration and
composition of Emperor Grapes J AmJ Enol Vitic Vol 28 (2) 96-103
Kobayashi S Goto-Yamamoto N Hirochika H 2004 Retrotransposon-induced mutations in
grape skin color J Sci Vol 304 (5673) 982 p
Kobayashi S Ishimaru M Ding CK Yakushiji H Goto N 2001 Comparison of UDP-
glucose flavonoid 3-O-glucosyltransferase (UFGT) gene sequences between white grapes (Vitis
vinifera) and their spots with red skin J Plant Sci Vol 160 543-550
Kobayashi S Ishimaru M Hiraoka K Honda C 2002 Myb-related genes of the Kyoho grape
(Vitis labruscana) regulate anthocyanin biosynthesis J Planta Vol 215 924-933
Kriedemann P E 1968 Photosynthesis in vine leaves as a function of light intensity temperature
and leaf age J Vitis Vol 7 213-220
Kuznetsov V V Shevyakova N I 2007 Polyamines and stress tolerance of plants Global science
books Plant stress Vol 1(1) 50-71
110
Laget F Tondut J L Deloire A Kelly M T 2008 Climate trends in a specific Mediterranean
viticultureal area between 1950 and 2006 J Int Sci Vigne Vin Vol 42 (3) 113-123
Lakso A N Kliewer W M 1975 The Influence of Temperature on Malic Acid Metabolism in
Grape Berries J Plant Physiol Vol 56 (3) 370-372
Landy A 1989 Dynamic structural and regulatory aspects of site-specific recombination J Ann
Rev Biochem Vol 58 913ndash949
Larronde F Krisa S Decendit A Chegraveze C Deffieux G Meacuterillon J M 1998 Regulation of
polyphenol production in Vitis vinifera cell suspension cultures by sugars JPlant Cell Reports Vol
17(12) 946-950
Leyva A Jarillo J Salinas J Martinez-Zapater M 1995 Low temperature induces the
accumulation of phenylalanine ammonia-lyase and chalcone synthase mRNAs of Arabidopsis
thaliana in a light-dependent manner J Plant Physiol Vol 108 39ndash46
Lin-Wang K Micheletti D Palmer J Volz R Lozano L 2011 High temperature reduces apple
fruit colour via modulation of the anthocyanin regulatory complex J Plant Cell amp Environment
Vol 34(7) 1176ndash1190
Lo Piero A R Puglisi I Rapisarda P Petrone G 2005 Anthocyanins accumulation and related
gene expression in red orange fruit induced by low temperature storage J Agric Food Chem Vol
53 9083ndash9088
Lough J M Wigley T M L Palutikof J P 1983 Climate and climate impact scenarios for
Europe in a warmer world J Clim Appl Meteorol Vol 22 1673ndash1684
Loslashvdal T Olsen K M Slimestad R Verheul M Lillo C 2010 Synergetic effects of nitrogen
depletion temperature and light on the content of phenolic compounds and gene expression in
leaves of tomato J Phytochemistry Vol 71(5ndash6) 605ndash613
Makra L Vitaacutenyi B Gaacutel A Mika J Matyasovszky I Hirsch T 2009 Wine Quantity and
Quality Variations in Relation to Climatic Factors in the Tokaj (Hungary) Winegrowing Region
Amer J Enol Vitic Vol 60 (3) 312-321
Mann M E Bradley R S Hughes M K 1998 Global-scale temperature patterns and climate
forcing over the past six centuries J Nature Vol 392 779-787
Matsui S Ryugo K Kliewer W M 1986 Growth inhibition of Thompson Seedless and Napa
Gamay berries by heat stress and its partial reversibility by applications of growth regulators J Am
J Enol Vitic Vol 37 (1) 67-71
Mattivi F Guzzon R Vrhovsek U Stefanini M Velasco R 2006 Metabolite profiling of
grape Flavonols and anthocyanins J Agric Food Chem Vol 54 (20) 7692-7702
111
Mazza G Fukumoto L Delaquis P Girard B Ewert B1999 Anthocyanins Phenolics and
Color 426 of Cabernet Franc Merlot and Pinot Noir wines from British Columbia J Agric Food
Chem 474009-427 4017 Menting J G T Scopes R K Stevenson T W 1994
Characterization of Flavonoid 3rsquo5rsquo-Hydroxylase in Microsomal Membrane Fraction of Petunia
hybrida Flowers J Plany Physiol Vol 106 (2) 633- 642
Mazza G Miniati E 1993 Color stabilization and intensification In Mazza G Miniati E (eds)
Anthocyanins in Fruits Vegetables and Grains CRC Press Boca Raton pp 1ndash20
Meyer P Heidmann I Forkmann G Saedler H 1987 A new petunia flower colour generated
by transformation of a mutant with a maize gene J Nature Vol 330 677-678
Mol J 1998 How genes paint flowers and seeds J Trends in Plant Sci Vol 3 212-217
Morais H Ramos C Forgacs E Cserhati T Matos N Almeida V Oliveira J 2002
Stability of anthocyanins extracted from grape skins J Chromatographia Vol 56 173ndash175
Mori K Goto-Yamamoto N Kitayama M Hashizume K 2007a Loss of anthocyanins in red-
wine grape under high temperature J Experimental Botany Vol 58 (8) 1935-1945
Mori K Goto-Yamamoto N Kitayama M Hashizume K 2007a Effect of high temperature on
anthocyanin composition and transcription of flavonoid hydroxylase genes in ldquoPinot noirrdquo grapes
(Vitis vionifera) J Hortic Sci Biotechnol Vol 82 (2) 199-206
Mori K Saito H Goto-Yamamoto N Kitayama M Kobayashi S Sugaya S Gemma H
Hashizume K 2005a Effects of abscisic acid treatment and night temperatures on anthocyanin
composition in lsquoPinot noirrsquo grapes J Vitis Vol 44 161ndash165
Mori K Sugaya S Gemma H 2005b Decreased anthocyanin biosynthesis in grape berries
grown under elevated night temperature condition J Sci Hortic Vol 105 319ndash330
Movahed N Maeiyat MM 2009 Phytoremediation and sustainable urban design methods (Low
Carbon Cities through Phytoremediation) 45th ISOCARP Congress Disponible en
httpwwwisocarpnet Fecha de consulta 04 Septiembre del 2009
Movahed N Masia A Cellini A Pastore C Valentini G Allegro G Filippetti I 2011
Biochemical approaches to study the effects of temperature on grape composition in cv Sangiovese
The 17th
International GIESCO Symposium Asti Italy The proceeding PP 393- 397
Munneacute-Bosch S Alegre L 2004 Die and let live leaf senescence contributes to plant survival
under drought stress J Funct Plant Biol Vol 31 203-216
Nissim-Levi A Kagan S Ovadia R Oren-Shamir M 2003 Effects of temperature UV-light
and magnesium on anthocyanin pigmentation in cocoplum leaves J Hortic Sci Biotechnol Vol
78 61-64
112
Oren-Shamir M Levi-Nissim A 1997a Temperature effects on the leaf pigmentation of Cotinus
coggygria lsquoRoyal Purplersquo J Hortic Sci Vol 72 425ndash432
Oren-Shamir M Levi-Nissim A 1997b UV-light effect on the leaf pigmentation of Cotinus
coggygria lsquoRoyal Purplersquo J Sci Hortic Vol 71 59ndash66
Oren-Shamir M Nissim-Levi A 1999 Temperature and gibberellin effects on growth and
anthocyanin pigmentation in Photinia leaves J Hortic Sci Biotechnol Vol 74 355ndash360
Palliotti A Poni S Berrios JG Bernizzoni F 2010 Vine performance and grape composition
as affected by early-season source limitation induced with anti-transpirants in two red Vitis vinifera
L cultivars J Aust J Grape Wine Res Vol 16 426ndash433
Pastore C 2010 Reserches on berry composition in red grape agronomical biochemical and
molecular approaches Tesi di Dottorato di ricerca in Colture Arboree ed Agrosistemi Forestali e
Paesaggistici XXII ciclo Faculta di Agraria Universita di Bologna
Pereira GE Gaudillere JP Pieri P Hilbert G Maucourt M Deborde C Moing A Roil D
2006 Microclimate influence in mineral and metabolic profiles of grape berries J Agric Food
Chem Vol 54 6765-6775
Pirie A Mullins M1976 Changes in anthocyanin and phenolics content of grapevine leaf and
fruit tissues treated with sucrose nitrate and abscisic acid J Plant Physiol Vol 58(4) 468-472
Pourcel L Routaboul J M Cheynier V Lepiniec L Debeaujon I 2006 Flavonoid oxidation
in plants from biochemical properties to physiological functions JTrends in Plant Sci Vol 12 (1)
29-36
Price SF Breen PJ Valladao M Watson BT 1995 Cluster sun exposure and quercetin in
Pinot noir grapes and wine AmJ Enol Vitic Vol 46 187-194
Quattrocchio F Baudry A Lepiniec L Grotewold E 2006 The regulation of flavonoid
biosynthesis J The science of flavonoids C Springer Chapter 4 pp 97ndash122
Rebucci B Poni S Intrieri C Magnanini E Lakso A N 1997 Effects of manipulated grape
berry transpiration on post-veraison sugar accumulation J Aust J Grape Wine Res Vol 3 57-65
Reynolds A Price S Wardle D Watson B 1994 Fruit environment and crop level effects on
Pinot noir I vine performance and fruit composition in British Columbia J Am J Enol Vitic Vol
45(4) 452-459
Reynolds A Wardle D 1989 Influence of fruit microclimate on monoterpene levels of
Gewuumlrztraminer J Am J Enol Vitic Vol 40(3) 149-154
113
Ristic R Bindon K Francis LI Herderich M J Iland PG 2010 Flavonoids and C13-
norisoprenoids in Vitis vinifera L cv Shiraz relationships between grape and wine composition
wine colour and wine sensory properties J Aust J Grape Wine Res Vol 16 369ndash388
Ristic R Downey M Iland P Bindon K Francis I Herderich M Robinson S 2007
Exclusion of sunlight from Shiraz grapes alters wine colour tannin and sensory properties J Aust
J Grape Wine Res Vol 13(2)53-65
Robinson S P Davies C 2000 Molecular biology of grape berry ripening J Aust J Grape Wine
Res Vol 6 175-188
Robinson S 2006 Colour and tannin during berry development and ripening In ldquoFinishing the
jobrdquo ASVO proceedings held 21 July 2006 Mildura Vic Australia pp 11-14
Roby G Harbertson J F Adams D A Matthews M A 2004 Berry size and vine water
deficits as factors in winegrape composition anthocyanins and tannins J Aust J Grape Wine Res
Vol 10 100- 107
Rolland F Baena-Gonzalez E Sheen J 2006 Sugar sensing and signaling in plants Conserved
and novel mechanisms J Ann Rev Plant Biol Vol 57 675-709
Romero C Bakker J 2000 Effect of storage temperature and pyruvate on kinetics of anthocyanin
degradation Vitisin A derivative formation and color characteristics of model solutions J Agric
Food Chem Vol 48 2135ndash2141
Sadras V 2007 Evolutionary aspects of the trade-off between seed size and number in crops J
Field crop research Vol 100(2-3) 125-138
Sadras VO Petrie P R Moran M A 2013 Effects of elevated temperature in grapevine II juice
pH titratable acidity and wine sensory attributes Australian Journal of Grape and Wine Research
Vol 19 (1) 107ndash115
Sarni P Fulcrand H Souillol V Souquet J M Cheynier V 1995 Mechanisms of anthocyanin
degradation in grape must-like model solutions J Sci Food Agr Vol 69(3) 385ndash391
Scholefield PB May P Neales TF 1977 Harvest-pruning and trellising of lsquoSultanarsquo vines II
Effects on early spring development Sci Hortic Vol 7123-132
Schultz H R 1995 Grape canopy structure light microclimate and photosynthesis I A two
dimensional model of the spatial distribution of surface area densities and leaf ages in two canopy
systems J Vitis Vol 34 211-215
Schultz H R 2000 Climate change and viticulture a European perspective on climatology carbon
dioxide and UV-B effects Aust J Grape Wine Res Vol 6 2ndash12
114
Schultz H R 2003 Extension of a Farquhar model for limitations of leaf photosynthesis induced
by light environment phenology and leaf age in grapevines (Vitis vinifera L cvv White Riesling
and Zinfandel)J Functional Plant Biol Vol 30(6) 673 ndash 687
Sepuacutelveda G Kliewer W M Ryugo K 1986 Effect of high temperature on grapevines (Vitis
vinifera L) I translocation of 14
C-photosynthates J Am J Enol Vitic Vol 37 (1) 13-19
Shaked-Sachray L Weiss D Moshe R Nissim-Levi A Oren- Shamir M 2002 Increased
anthocyanin accumulation in aster flowers at elevated temperatures due to magnesium treatment J
Physiol Plant Vol 114 559ndash565
Shvarts M Borochov A Weiss D 1997 Low temperature enhances petunia flower pigmentation
and induces chalcone synthase gene expression J Physiol Plant Vol 99 67ndash72
Sipiora M J Gutieacuterrez-Granda M J 1998 Effects of pre-veraison irrigation cutoff and skin
contact time on the composition color and phenolic content of young Cabernet Sauvignon wines in
Spain J Amer J Enol Vitic Vol 49 152ndash162
Smart R E 1985 Principles of grapevine canopy microclimate manipulation with implication for
yield and quality J Amer J Enol Vitic Vol 36 230-239
Smith G J Markham K R 1998 Tautomerism of flavonol glucosides - relevance to plant UV
protection and flower colour J Photochem Photobiol A ndash Chem Vol 118 99-105
Soar C J Collins M J Sadras V O 2009 Irrigated Shiraz vines (Vitis vinifera) up regulate gas
exchange and maintain berry growth in response to short spells of high maximum temperature in the
field J Functional Plant Biology Vol 36(9) 801ndash814
Sparvoli F Martin C Scienza A Gavazzi G Tonelli C 1994 Cloning and molecular analysis
of structural genes involved in flavonoid and stilbene biosynthesis in grape (Vitis Vinifera L) J
Plant Molecular Biology Vol 24 743-755
Spayd S E Tarara J M Mee D L Ferguson J C 2002 Separation of sunlight and
temperature effects on the composition of Vitis vinifera cv Merlot berries J Amer J Enol Vitic
Vol 53171-182
Spelt C 2002 Anthocyanin1 of petunia controls pigment synthesis vacuolar pH and seed coat
development by genetically distinct mechanisms The plant cell online Vol 14 2121-2135
Stafford H A 1990 Flavonoid Metabolism CRC Press Boca Raton FL 298 pp
Stracke R De Vos R C H Bartelniewoehner L Ishihara H Sagasser M Martens
S Weisshaar B 2009 Metabolomic and genetic analyses of flavonol synthesis in Arabidopsis
thalianasupport the in vivo
115
Taureilles-Saurel C Romieu C G Robin J P Flanzy C 1995 Grape (Vitis vinifera L) malate
dehydrogenase II Characterization of the major mitochondrial and cytosolic isoforms and their role
in ripening J Am J Enol Vitic Vol 46 (1) 29-36
Tomana T Utsunomiya N Kataoka I 1979 The effect of environmental temperatures on fruit
ripening on the tree II The effect of temperatures around whole vines and clusters on the coloration
of lsquoKyohorsquo Grapes Japan Soc Hort Sci Vol 48 261-266
Treutter D 2006 Significance of flavonoids in plant resistance a review J Environ Chem Lett
Vol 4 147ndash157
Ubi BW Honda C Bessho H Kondo S Wada M Kobayashi S Moriguchi T 2006
Expression analysis of anthocyanin biosynthetic genes in apple skin effect of UV-B and
temperature J Plant Sci Vol 170 571ndash578
Ushimaru T Maki Y Sano S Koshiba K Asada K Tsuji H 1997 Induction of enzymes
involved in the ascorbate-dependent antioxidative system namely ascorbate peroxidase
monodehydroascorbate reductase and dehydroascorbate reductase after exposure to air of rice
(Oryza sativa) seedlings germinated under water J Plant Cell Physiol Vol 38 541-549
Vaknin H Bar-Akiva A Ovadia R Nissim-Levi A Forer I Weiss D Oren-Shamir M
2005 Active anthocyanin degradation in Brunfelsia calycina (yesterday-today-tomorrow) flowers J
Planta Vol 222 19ndash26
Venturini L 2009 Study of some gene families involved in anthocyanin accumulation during Vitis
vinifera berry ripening Tesi di laurea specialistica in biotechnologie agro-industriali faculta di
scienze matematiche fisichie e naturali Universita degli studi di Verona pp7-12 30-51
Wahid A Perveen M Gelani S Basra SMA 2007 Pretreatment of seed with H2O2 improves
salt tolerance of wheat seedlings by alleviation of oxidative damage and expression of stress
proteins J Plant Physiol Vol 164 (3) 283ndash294
Walker AR Lee E Bogs J McDavid D A J Thomas M R Robinson S P 2007 White
grapes arose through the mutation of two similar and adjacent regulatory genes The Plant journal
for cell and molecular biology Vol 49 772-85
Walker J R Ferrar P H 1998 Diphenol oxidases enzymecatalysed browning and plant disease
resistance J Biotechnol Genet Eng Rev Vol 15 457ndash498
Waterhouse A L 2002 Wine Phenolics Ann NY Acad Sci Vol 957 21-36
Watson RT Rodhe H Oeschger H Siegenthaler U 1990 Greenhouse gases and aerosols
httprivernetncsuedu
116
Welinder K G Justesen A F Kjaeligrsga I V H Jensen R B Rasmussen S K Jespersen H M
Duroux L 2002 Structural diversity and transcription of class III peroxidases from Arabidopsis
thaliana J Eur J Biochem Vol 269 6063ndash6081
Wen Y Zhang Y Pan Q 2009 Progress of organic acids in grape berries Natural science
journal of Hainan University S6631
Williams R J Spencer J P Rice-Evans C 2004 Flavonoids antioxidants or signaling
molecules J Free Radic Biol Med Vol 36 838ndash849
Winkel-Shirley B 2002 Biosynthesis of flavonoids and effects of stress J Current opinion in
plant biology Vol 5 218-23
Winkler A J Cook J A Kliewer W M Lider L A 1962 Development and composition of
grapes General viticulture Berkeley CA University of California Press pp 141ndash196
Xie DY Sharma S B Paiva N L Ferreira D Dixon R A 2003 Role of anthocyanidin
reductase encoded by BANYULS in plant flavonoid biosynthesis J Science Vol 299 396ndash399
Yamane T Jeong S T Goto-Yamamoto N Koshita Y Kobayashi S 2006 Effects of
temperature on anthocyanin biosynthesis in grape berry skins J Amer J Enol Vitic Vol 57 54ndash
59
Yamasaki H Sakihama Y Ikehara N 1997 Flavonoid-peroxidase reaction as a detoxification
mechanism of plant cells against H2O2 J Plant Physiol Vol 115 1405-1412
Yokotsuka K Singleton V L 1997 Disappearance of anthocyanins as grape juice is prepared and
oxidized with PPO and PPO substrates J Am J Enol Vitic Vol 48 (1) 13-25
Yoruk R Marshal R M 2003 Physiocochemical properties and function of plant polyphenol
axidase A review J Food Biochem Vol 27 361-422
Yu D J Kim S J Lee H J 2009 Stomatal and non-stomatal limitations to photosynthesis in
field-grown grapevine cultivars J Biologia Plantarum Vol 53 (1) 133-137
Zsoacutefi Z Vaacuteradi G Baacutelo B Marschall M Nagy Z Dulai S 2009 Heat acclimation of
grapevine leaf photosynthesis mezo- and macroclimatic aspects J Functional Plant Biology
Vol 36(4) 310ndash322

6
35 Tannins accumulation during ripenning 95
4 CONCLUSION 99
5 GENERAL CONCLUSION
1
1 GENERAL INTRODUCTION
11 Grape ripening
Grape is a non-climacteric fruit and in non-climacteric fruits ethylene does not appear to have a
major role in ripening Little is known about the factors that regulate the ripening process of grapes
However it seems likely that plant growth substances are involved (Coombe 1992) Grapes exhibit
a double sigmoid pattern of development (Fig 1) with the two distinct phases of growth separated
by a lag phase (Coombe 1992) The ripening phase of grape berry development occurs during the
second period of berry growth and results from expansion of existing pericarp cells (Hardie et al
1996) During the ripening phase a number of major physiological and biochemical changes occur
simultaneously in the grape berry and these determine the quality of the fruit at harvest The onset
of ripening (Veraison) signals the beginning of significant changes in metabolism which include
accumulation of sugar softening of berries synthesis of anthocyanins metabolism of organic acids
accumulation of flavour compounds and changes in the level of growth substances (Fig 1) These
changes are coordinated within each berry but individual berries even those on the same bunch do
not ripen synchronously (Coombe 1992) this results in significant variation between berries even
at harvest This variability represents the significant effect of berry environmental conditions on
berry composition
Fig 1 Schematic representation of grape berry development (Robinson amp Davies 2000)
2
12 Grape berry composition
The dynamic of berry ripening is fundamental to determine final berry composition and as a
consequence grape quality Sugars organic acids and phenolic compounds are the main biochemical
components of grape berry
121 Sugars
Sugar accumulation in grape berries is an important phenomenon degBrix is directly related to the
sugar content (gL) and potential titratable alcohol (vol ) and about 55 of grape berry degbrix
converses to alcohol (Fournand et al 2006) At the beginning of berry development sugars are
produced by the green berries while subsequently berry becomes a typical ldquosinkrdquo organ and uses
carbohydrates produced by photosynthesis of leaves Sucrose produced by leaves is then transported
for long distance to berries into the phloem From veacuteraison xylem flow is almost impeded hence
water may reach berries via phloem with sugars Sucrose the predominant sugar transported in the
phloem accumulates in grape berry in form of glucose and fructose Since at the end of berry
ripening the glucosefructose ratio is approximately equal to 1 the cleavage of sucrose may be
catalysed mainly by invertase (Pastore 2010) The main role of sugars in grape berry is to provide
the carbon skeleton of many compounds (such as organic acids or amino acids) and to be energy
sources for cells By now it is scientifically accepted that sugars play also an important role as
signalling molecules in control of growth and development (Rolland et al 2006)
122 Organic acids
Organic acids are some important flavor compounds in both grapes and wines and the composition
and content of organic acids are closely related to the organoleptic quality of grapes and wine (Wen
et al 2009) Tartaric and malic acids generally represent from 69 to 92 of all organic acids in
grape berries (Kliewer 1966) Small amounts of citric succinic lactic and acetic acids are also
present in the berry While tartaric acid is synthesized until veacuteraison malic acids levels vary highly
during berry ripening As to Dokoozlian 2000 green berries together with leaves are the main
grape organs able to produce organic acids
123 Phenolic compounds
Phenolic compounds of grape are divided into non-flavonoids and flavonoids groups (Robinson
2006)
3
1231 Non-flavonoids
Hydroxycinnamic acids benzoic acids and stilbenes belong to the non-flavonoids group
(Waterhouse 2002)
1231a Hydroxycinnamates
Hydroxycinnamates present in grape berries are derivatives of caffeic p-coumaric and ferulic acids
which are present both in the skin hypodermal cells and in the flesh (Adams 2006) and Caftaric
acid is the predominant hydroxycinnamates in grape (Kennedy et al 2006)
1231b Benzoic acids
Benzoic acids are the minor components in grape berry composition Six derivatives of benzoic
acids (gallic acid protocatechuic acid gentisic acid p-hydroxybenzoic acid vanillic acid and
syringic acid) have been found in grape berry Gallic acid is the major benzoic acid present in grape
berry and it is present in both skin and seeds (Pastore 2010)
1231c Stilbenes
Stilbenes are found in the skin of the grape berry and in vegetative tissues Although stilbenes are
present in low quantity both in berries and wine they have aroused a lot of interest because of their
effects on human health in particular for what concern resveratrol (Bavaresco amp Fregoni 2001)
Resveratrol could exist in different forms in monomeric unit (as dimethylated derivatives trans-
pterostilbene and as in form of 3-O-β-D-glucoside trans- and cis-piceid) or in dimer units
(viniferins) (Gatto et al 2008)
1232 Flavonoids
Flavonoids are a class of plant secondary metabolites which are synthesized from Phenylalanine or
Tyrosine condensed with a malonyl-CoA via the phenylpropanoid pathway This class comprises
more than 6500 known compounds many of which are of great biological and commercial
importance In nature they play important roles in resistance to stresses both abiotic (such as excess
light and high temperature) and biotic (such as resistance to microbes) (Mol 1998 Winkel-Shirley
2002) moreover they are of central importance in the ecological relationships with pollinator
insects and in nodule formation (Downey et al 2006) They comprise both transparent compounds
4
such as the flavanols and brightly coloured ones such as phoblaphenes anthocyanins and
polymeric proanthocyanidins (Robinson 2006) All flavonoids share a common chemical structure
represented by a C15 skeleton (C6-C3-C6) (Fig 2)
Fig 2 Chemical structure of flavonoid molecule (Aron amp Kennedy 2008)
Depending on the position of the linkage of the aromatic ring (B ring) to the benzopyrano moiety (C
ring) we can distinguish the flavonoids (2-phenylbenzopyrans) the isoflavonoids (3-benzopyrans)
and the neoflavonoids (4-benzopyrans) The B ring can further be hydroxylated ortho-
dihydroxylated or vicinal-trihydroxylated (Pastore 2010) Other flavonoids modifications include
methoxylation O-glycosilation of hydroxyl groups or C-glycosilation of flavonoid skeleton carbon
atom Moreover flavonoid glycosides are frequently acylated with aliphatic or aromatic acid
molecules (Aron amp Kennedy 2008) Different classes of flavonoids are commonly detected in grape
such as anthocyanins flavonols and flavan-3-ols (tannins or proanthocyanidins) (Fig 3) Flavonoids
are localized both in berry skin and seeds In particular in hypodermal cells of the skin we can
found tannins flavonol monomeric flavan-3-ols and in red grape anthocyanins
1232a Anthocyanins
Anthocyanins are pigments and represent the major class of flavonoids of the skin of red grape
varieties The anthocyanins commonly found in grape include delphinidin cyanidin petunidin
peonidin and malvidin-3-O-glucosides 3-(6-acetyl) glucosides and 3-(6-p-coumaroyl)-glucosides
In certain grape varieties have been found even traces of peonidin and malvidin 3-(6-caffeoil)-
glucoside Malvidin-3-O-glucoside is the most abundant anthocyanin present in grape
5
Fig 3 Chemical structure of the three main classes of flavonoids present in red grape berry (Adams 2006)
1232b Flavan-3-ols and tannins
Monomeric flavan-3-ols (catechin epicatechin epigallocatechin) are present in the skin at lower
concentrations while they are present at high concentrations in form of polymers within tannins
(proanthocyanidins) Tannins are polymers of different condensed monomers like epicatechin and
epigallocatechin which constitute the chain of the polymers (ldquoextensionrdquo subunits) and catechin
which is present as ldquoterminalrdquo units (Braidot et al 2008) The mean degree of polymerisation
(mDP) which represents the mean length of the tannin chain is of about 28 in berry skin (Bogs et
al 2005)
Flavonoids in the seeds accumulate not only in the external part but even in the inner layers Grape
seeds are the primery source of flavan-3-ols and tannins in grape berries Total tannin content is in
fact higher in seeds than in skin even if seed tannins have a lower mDP The composition of seed
tannins is different comparing to the skin one in so far that in seed tannins generally
6
epigallocatechin is not present and epicatechin gallate is the major constituent of ldquoextensionrdquo
subunits (Adams 2006)
Fig 4This hypothetical condensed tannin is made up of four sub-units catechin epicatechin epigallocatechin
epicatechin gallate The first subunit (catechin) is bound to the second (epicatechin) by an interflavan bond between
carbon 4 of catechin and carbon 8 of epicatechin The first three subunits are referred to as extention subunits and
only the epicatechin gallate has free 4 positions and is thus re-ferred to as a terminal unit (Adams 2006)
1232c Flavonols
Grape and wine contain different classes of polyphenols Flavonols are flavonoids that are found in
higher plants usually in glycosidic forms They are products of the flavonoid biosynthetic pathway
which also give rise to anthocyanins and to condensed tannins in grapevines (Stafford 1990 and
Darne 1993) The main flavonols reported in grape berries are quercetin-3-O-glucoside and
quercetin-3-O-glucuronide (Price et al 1995 Cheynier et al 1986 and Downey et al 2003)
Flavonols are also involved in the stabilization of the flavilium form of anthocyanins in young red
wines through co-pigmentation (Boulton 2001) The highest flavonol concentrations in grapes were
found at flowering followed by a decrease as the grapes increased in size Subsequently a
significant level of flavonol biosynthesis was observed during berry development and the greatest
increase in flavonols per berry can be observed 3-4 weeks post-veraison (Downey et al 2003)
In red grapes the main flavonol is quercetin (mean) 4399) followed by myricetin (3681)
kaempferol (643) laricitrin (565) isorhamnetin (389) and syringetin (322) In white
grapes the main flavonol was quercetin (mean) 8135) followed by kaempferol (1691) and
7
isorhamnetin (174) The delphinidin-like flavonols myricetin laricitrin and syringetin were
missing in all white varieties indicating that the enzyme flavonoid 3hydroxylase is not
expressed in white grape varieties (Mattivi et al 2006)
It is interesting to observe the analogies between the hydroxylation of position 5 which leads to the
formation of the anthocyanidin delphinidin from cyanidin and the flavonol myricetin from quercetin
In addition to this O-methylation of position 3of anthocyanidin cyanidin which leads to the
formation of peonidin corresponds to the O-methylation which converts flavonol quercetin into
isorhamnetin Finally O-methylation of positions 3and 5of anthocyanidin delphinidin which
leads to the formation of petunidin and malvidin corresponds to O-methylation which converts
flavonol myricetin into laricitrin and syringetin (Fig 3)
13 Biosynthesis of flavonoids in red grape berry
Flavonoids are synthesized within the general phenylpropanoid pathway From the same precursors
and towards specific branches these pathways bring to the synthesis of anthocyanins flavonols and
proanthocyanidins (Boss et al 1996) (Fig 5 6) The enzymes involved in flavonoid biosynthesis
are associated at the cytoplasmic surface of the endoplasmic reticulum and represent a multi-enzyme
complex
131 Synthesis of the early products of the phenylpropanoid pathway
1311 PAL
PAL is a key enzyme ubiquitous in plants which catalyzes one of the first steps in
phenylpropanoids biosynthesis (Fig 5) the hydrolysis of ammonia from phenylalanine to produce
cinnamic acid Cinnamic acid is the precursor of all phenolic compounds Recently the subcellular
localization of PAL was found in grape PAL is present in the cell walls secondarily thickened
walls and parenchyma cells of the berry tissues (Chen et al 2006) This enzyme that is a member
of a large gene family has been cloned in many plant species In grape there are probably present
15-20 PAL isoforms (Sparvoli et al 1994)
1312 C4H
The cinnamic acid produced by PAL is converted to p-coumaric acid towards the action of
cinnamate 4-hydrolase (C4H) (Fig 5) C4H belongs to the cytochrome P450 monoxygenases
8
family The enzymes of this family are able to catalyse exothermic reactions that are irreversible In
grape C4H have not yet been cloned but itrsquos known that it is present in the chloroplasts and in the
nucleus of berry tissues (Chen et al 2006)
1313 4CL
One molecule of p-coumaric acid produced by C4H is condensed with an acetil-CoA molecule to
form p-coumaroil-CoA that is the precursor of all the flavonoids (Fig 5) The enzyme which
catalyses this reaction is the 4-coumarate coenzyme A ligase (4CL) 4CL is localized in grape in the
secondarily thickened walls and in the parenchyma cells of the berry pulp vascular tissue (Chen et
al 2006) 4CL belongs to a multi-gene family Itrsquos very interesting to note that the activities of
PAL C4H and 4CL are really correlated and change concomitantly (Chen et al 2006)
Fig 5 The anthocyanin synthesis pathway in plants (Deluc et al 2008)
132 Specific Steps towards flavonoid biosynthesis structural genes involved in flavonols flavan-3-ols
and anthocyanin biosynthesis
1321 CHS
The first enzyme involved specifically in flavonoids biosynthesis is calchone synthase (CHS) (Fig
5 6) CHS catalyzes the condensation of one molecule of p-coumaroil-CoA with three molecules of
malonyl-CoA to produce naringenin chalcone CHS as other enzymes involved in the
9
phenylpropanoid metabolism belongs to a large super-family of proteins the family of type III
Polykethide Synthase
1322 CHI
Naringenin calchone is converted to flavanones (naringenin) to form the flavanoid core towards a
stereo-specific ring closure catalysed by chalchone isomerase (CHI) (Jeong et al 2004) On the
basis of the CHI sequence that doesnrsquot display any detectable homology with other proteins seems
that this enzyme is unique to the plant kingdom (Fig 6)
1323 F3H FLS F3rsquoH F3rsquo5rsquoH
Naringenin is then hydroxylated at position 3 by flavanone 3-hydroxylase (F3H) to form
dihydrokaempferol the flavonols precursor Dihydrokaempferol can be substrate of three different
enzymes which directly bring to the production of the flavonol kaempferol towards the action of
flavonol synthase (FLS) or to the biosynthesis of dihydroquercetin and dihydromyricetin towards
the action respectively of flavonoid-3rsquo-hydroxylase (F3rsquoH) and flavonoid-3rsquo5rsquo-hydroxylase
(F3rsquo5rsquoH) These enzymes catalyse the hydroxylation of the B ring of dihydrokaempferol in 3rsquo or
3rsquo5rsquo positions F3rsquoH activity results in the production of cyanidin-like anthocyanins while F3rsquo5rsquoH
action brings to the production of delphinidin anthocyanins species The cloning of both F3rsquoH and
F3rsquo5rsquoH genes from grape has shown that in grape two copies of F3rsquoH and several copies of F3rsquo5rsquoH
are present in a single chromosome (Bogs et al 2006 Castellarin et al 2006) In flowers of
Petunia Hybrida has been shown that F3rsquoH and F3rsquo5rsquoH can act both on the substrates and products
of F3H (Menting et al 1994) As previously described FLS is the key enzyme in the biosynthesis
of flavonols This enzyme employs dihydrokaempferol dihydroquercetin and dihydromyricetin as
substrates to synthesize the flavonol aglicones (Chua et al 2008)
1324 DFR
FLS directly competes for its substrates with the enzyme dihydroflavonol 4-reductase (DFR) which
catalyses the first step in the conversion of dihydroflavonols to proanthocyanidins or anthocyanins
This point of the biosynthetic pathway is a key regulatory point because it determines the direction
towards flavonols or proanthocyanidins and anthocyanins synthesis DFR is in fact responsible for
the NADPH-dependent reduction at the 4 position of the C ring of dihydroquercetin and
dihydromyricetin to give respectively leucocyanidin or leucodelphinidin (Pastore 2010)
10
1325 ANR LAR LDOX and UFGT
Leucocyanidin and leucodelphinidin are respectively the substrates to the next step of the
proanthocyanidin and anthocyanin biosyntheses which involve either anthocyanidin reductase
(ANR or BAN) and leucocyanidin reductase (LAR) or leucoanthocyanidin dioxygenase (LDOX)
and UDP-glucose flavonoid 3-O-glucosyltransferase (UFGT)
In grape LAR converts leucocyanidin in the flavan-3-ol (+)-catechin with a NADPH-dependent
reduction ANR acts instead on the products of the enzyme LDOX which catalyzes the cyanidin and
delphinidin production from leucoanthocyanidins Then ANR uses these substrates to synthesize
respectively (-)-epicatechin and (-)-epicatechin-3-O-gallate (Gagneacute et al 2009)
As FLS also LDOX belongs to a family of 2-oxoglutarate-dependent oxygenase (Pastore 2010) In
a recent work has been demonstrated that in Arabidopsis Thaliana LDOX could have also a FLS
activity in vivo (Stracke et al 2009) Southern blot experiments conducted on Vitis Vinifera cv Red
Globe have shown that only a single copy of LDOX gene is present in grapevine (Gollop et al
2001) The anthocyanidins cyanidin and delphinidin produced towards the action of LDOX are
then stabilized through the addition of a glucose residue at the 3 position of the C ring This reaction
is catalysed by the enzyme UFGT and allows the anthocyanins transport into the vacuole
UFGT is the key enzyme in anthocyanin biosynthesis because it is expressed only in red skin
cultivars UFGT seems to be present in grape genome as a single copy and it is interesting to note
that its promoter and coding regions have been found also in white cultivar and are similar to the
sequences present in their red-skin sports (Kobayashi et al 2001) The 3-O-glycosilation of
anthocyanin is almost always a prerequisite for further modification as methylation and acylation
1326 OMTs
Methoxyl groups are found in three of the main anthocyanins (peonidin petunidin and malvidin-3-
O-glucoside) This reaction brings to more stable compounds for the methylation of the reactive
hydroxyl groups and the enzymes responsible are O-methyltransferases (OMTs) The first partial
purification and characterization of a methyltransferase catalyzing the methylation of cyanidin-3-
glucoside to peonidin-3-glucoside was performed on a cell suspension of Vitis vinifera cv Gamay
Freaux This enzyme is S-adenosyl-L-methionine (SAM)-dependent and it was shown that it has a
high substrate specificity reacting only with cyanidin and not with delphinidin (Pastore 2010)
11
Fig 6 Diagrammatic representation of the flavonoids biosynthesis pathway Enzymes abbreviation are as given in the
text (Jeong et al 2006)
14 Flavonoid gene expression during berry development
The pattern of flavonoid gene expression (Fig 7) is very different among different organs and
among the different phases of berry ripening Data about the trend in gene expression of some
structural genes of flavonoid biosynthesis in berry skin compared to flesh have been published by
Boss et al in 1996 for red cultivar Shiraz Northern blot analysis of berry skin RNA have shown
that the majority of genes involved in flavonoid biosynthesis are just expressed from flowering to 2-
4 weeks after full bloom and then after veacuteraison Only the expression of the gene UDP Glc-
Flavonoid 3-O-glucosyl Transferase (UFGT) is strictly linked with veacuteraison phase In berry flesh all
the genes analyzed are expressed at lower levels compared to skin except for Phenylalanine
Ammonia Lyase (PAL) and UFGT whose expression was not detectable in the flesh at any stage of
the analysis (Boss et al 1996) The early expression of the genes from CHS to LDOX and FLS
LAR and ANR could be explained by the accumulation of flavonols and tannins in the young berry
12
Regards to the genes encoding anthocyanin modifying enzymes it was demonstrated that the gene
VvF3rsquoH-1 (the only functional isoform identified) is expressed in berry skin of cultivar Merlot
throughout ripening even if its expression decreases 8ndash10 weeks after blooming VvF3H-1
transcripts increase soon after at the onset of veacuteraison and shows a secondary peak of expression
one week before harvest concurrently at the peak of anthocyanin content VvF35rsquoH-1 is instead
weakly expressed during the first stages of berry ripening and the peak of expression is reached
when all berries have turned red Transcripts of the isoforms VvF35H-2-long and VvF35H-2-
medium appear at the onset of veacuteraison and lasted till full ripening while the isogene VvF35H-2-
short was constitutively expressed throughout the ripening (Castellarin et al 2006) In cv Shiraz
both F3rsquoH and F3rsquo5rsquoH transcripts were detected at flowering and in the early stages of berry
ripening but their expression reaches a maximum one week before and a week after veacuteraison
respectively (Bogs et al 2006) Transcriptomic analyses on Shiraz and Nebbiolo grape berries
harvested at different ripening stages have shown that in these varieties the expression of AOMT
follows the same profile AOMT is not expressed before the onset of ripening but after veacuteraison
there is a strong increase in the amount of transcripts during the first weeks and then the expression
decreases and remains constant until harvest (Hugueney et al 2009)
Fig 7 Anthocyanin biosynthetic pathway (Boss et al 1996)
13
141 Regulatory genes of anthocyanin biosynthesis pathway
Among the three classes of flavonoids present in grapevine the regulation of anthocyanins
biosynthesis has been the most studied thanks to the numerous available colour bud sports which
involve alterations in the red or purple berry anthocyanin content Bud sports are usually infrequent
changes in phenotype affecting shoots of woody perennials but colour bud sports are common and
examples in horticultural plants are widespread Alterations in the anthocyanins of a plant can be in
fact very distinct and easily observed and generally have no detrimental effect on the viability of the
plant The molecular basis underlying the appearance of bud sports are not yet well understood
The study of the genes regulating structural genes expression in anthocyanin biosynthesis was at
first done in maize petunia and snapdragon (Davies amp Schwinn 2003) and then full characterized in
Arabidopsis (Broun 2005) From these researches emerged that three different types of transcription
factors play a key roles in regulation of anthocyanin biosynthesis MYB bHLH (basic Helix-Loop-
Helix) and WDR (WD40 repeats) even if the WD40 proteins function seem to be only to assist
MYB and bHLH proteins MYB genes are present in plant genomes as different families The first
experience on MYB genes in grapevine was done on the cultivar Kyoho which belongs to Vitis
labruscana (V Labrusca x V Vinifera) A cDNA library has been constructed with cDNA of ripe
berries and then using random primers designed on maize MYB conserved sequences eight
different grape MYB homologue sequences were identified Among these only four species of
MYB gene can be really identified MYBA MYBB MYBC and MYBD The whole cDNA
sequences of MYBA and MYBB showed the existence of three different species for MYBA
(VlMYBA1-1 VlMYBA1-2 and VlMYBA2) and two for MYBB (VlMYBB1-1 and VlMYBB1-2)
which are different in the nucleotide sequence Transcription analyses revealed that VlMYBA is
only weakly expressed before veacuteraison but immediately after the beginning of anthocyanin
accumulation and berry softening VlMYBA expression rapidly increases VlMYBB expression was
instead detected in all the berry ripening stages analyzed even if also VlMYBB expression increases
after veacuteraison Regards to VlMYBC and VlMYBD these genes seems to be few linked to berry
veacuteraison because the first one is expressed at high levels just at the beginning of ripening and at
veacuteraison the transcription decreases in the case of VlMYBD the expression was detected only in
the early stages of berry ripening The tight relationship between VlMYBA and berry veacuteraison and
anthocyanin accumulation was further confirmed by expression analyses which revealed that
VlMYBA transcripts differentially from the others VlMYB genes identified were detected only in
berry tissues The introduction of VlMYBA1-1 VlMYBA1-2 and VlMYBA2 in embryos causes the
appearance of reddish-purple spots and so the authors concluded that VlMYBA was the
14
transcription factor regulating UFGT expression (Kobayashi et al 2002) The molecular basis of the
regulation of UFGT expression were then confirmed also for Vitis Vinifera and it was shown that
VvMYBA was probably responsible of the ancestral differentiation between red and white cultivar
The white-skinned varieties Italia and Muscat of Alexandria have in fact a GRET1 retrotransposon
inserted in both the alleles of the promoter region of VvMYBA1 gene and this causes the
inactivation of its expression In the grape varieties that have pigmented berry skin at least one
functional VvMYBA1 allele redVvMYBA1 (rVvMYBA1) and one functional VvMYBA2 allele
redVvMYBA2 (rVvMYBA2) have to exist (Walker et al 2007)
In nature the color of grape berry ranges from the lightest pink to the darkest purple tones according
to the amount and quality of anthocyanin accumulated in the berry skin This suggests a polygenic
control of anthocyanin accumulation in Vitis Vinifera despite evidence that the primery
determination of anthocyanin production in berries appeared to be controlled by a single dominant
locus (Barrit amp Einset 1969) Among the 68 unigenes identified a cluster of four VvMYBA genes
(VvMYBA1 VvMYBA2 VvMYBA3 and VvMYBA4) was considered essential to determine the
genetic bases of the quantitative variation of anthocyanin content in berry skin After the
identification of VvMYBA1 the first expression analyses of this gene in grapevine were done by
Jeong et al (2004) on conditioned berry with the aim to alter anthocyanin accumulation The
change in expression levels of VvMYBA1 coincided with the changes in the expression levels of
other tested anthocyanin biosynthetic enzyme genes (CHS1 CHS2 CHS3 CHI1 CHI2 F3H1
F3H2 DFR LDOX and UFGT) and also with the accumulation of anthocyanins in the berry skins
This suggests that the product of VvMYBA1 gene may control the transcription of not only UFGT
but also of other structural genes whose expression increase after veacuteraison
2 Global Warming
Since the beginning of the pre-industrial era around 1750 the atmospheric concentration of
greenhouse gases has increased by about 30 because of the combustion of fossil fuels and changes
in land-use practices Increased atmospheric concentrations of greenhouse gases tend to warm the
atmosphere (Watson et al 1990) The earths climate which has been relatively stable during the
past 10000 years is now changing (Fig 8) The earths surface temperature in this century is
warmer than any other centuries during the 600 years and the last few decades have been the hottest
in this century (Mann et al 1998)
It is clear that global warming will adversely affect human health ecological systems and socio-
economic sectors including human settlements and agriculture (Movahed amp Maeiyat 2009) and
15
particularly viticulture Climate is a pervasive factor in the viability of all forms of agriculture and is
never more important than with the cultivation of grapes for the production of wine (Jones et al
2005) Global warming and viticulture are interrelated processes both of which take place on a
global scale
3 Global warming and viticulture
In the last decades the majority of the worlds highest quality wine-producing regions have
experienced growing season warming trends In these regions future global warming would exceed
a threshold as a result of which the balanced fruit ripening required for existing varieties and wine
styles would become progressively more difficult While improved winemaking knowledge and
husbandry practices contributed to the better vintages it was shown that climate had and will likely
always have a significant role in quality variations (Jones et al 2005)
In northern Europe climate change may produce positive effects on viticulture through introduction
of new varieties (Fig9) higher production and expansion of suitable areas for cultivation
Nonetheless the disadvantages may be an increase in the need for plant protection the risk of
nutrient leaching and the turnover of soil organic matters (Lough et al 1983 Jones et al 2005)
However in southern areas the disadvantages will predominate The possible increase in water
shortage and extreme weather events may cause lower harvestable yields higher yield variability
and a reduction in suitable areas These effects may reinforce the current trends of intensification of
viticulture in Northern and Western Europe and extensification in the Mediterranean and
Southeastern parts of Europe (Lough et al 1983 Jones et al 2005) In general global warming is
projected to have significant impacts on conditions affecting viticulture including temperature
carbon dioxide precipitation increasing demand for irrigation to meet higher evaporation
increasing the incidence of pests and through direct temperature effects on production quality and
quantity and the interaction of these elements (Fraser 2008)
31 The effects of global warming on berry ripening
The maturation of grapevine berries is strongly influenced by the microclimate around the fruit
Global atmospheric warming trend can affect physiological functions involved in fruit maturation
(Jones et al 2005 Mori et al 2007) Acidity anthocyanins and flavonols concentrations in berries
are clearly linked to berry temperature (Haselgrove et al 2000 Bergqvist et al 2001 Spayd et al
2002 Downey et al 2004) while sugar content is strongly influenced by berry transpiration
(Rebucci et al 1997) Daily average temperature at the time of ripening is used to estimate potential
16
temperature impacts on quality Regards to the temperature the specific number of heat units
(degree days DD) that determines rate of berry ripening is typical of each variety In general the
optimum temperature for berry growth and ripening is among 20deg-25degC (Dokoozlian 2000)
The Huglin index enables different viticulture regions of the world to be classified in terms of the
sum of temperatures required for vine development and grape ripening (Huglin 1978) Specifically
it is the sum of mean and maximum temperatures above +10degC (the thermal threshold for vine
development) Different grape varieties are thus classified according to their minimal thermal
requirement for grape ripening For example the HI is 1600 for Riesling and 1900 for Cabernet
Sauvignon (Shultz 2000) (Fig9) As a result of global warming the Huglin index is increasing
(Shultz 2000) (Fig8) so that the average ripening occurs about 1ndash2 months earlier that leads to
degraded fruit and wine quality (Lough et al 1983 Kenny amp Harrison 1992 Butterfield et al
2000 Bindi et al 1996 Jones et al 2005)
Fig 8 Huglin index from 1972 to 2005 (Shultz
2000)
Fig 9 Huglin index for some grape varieties (Shultz 2000)
In general increasing vine temperature may accelerate the rate of some metabolic process even if in
grape it has been demonstrated that above 30degC many metabolic pathways stop or are significantly
reduced (Shaked-Sachray et al 2002 Vaknin et al 2005) Biosynthesis of flavonoids (Fig 7) is
affected by many endogenous and exogenous factors (Jones et al 2005) Among these factors
sitersquos microclimate seems to have the greatest influences on flavonoid content (Downey et al
2006) For instance changes in solar radiation or temperature rise will have a direct impact on grape
composition and thus flavor via alteration of secondary metabolites such as flavonoids amino acids
and carotenoids (Roby et al 2004) Acidity sugar content anthocyanins and flavonols
concentrations in berries are clearly linked to berry temperature (Haselgrove et al 2000 Bergqvist
17
et al 2001 Spayd et al 2002 Downey et al 2004 Rebucci et al 1997) It has been suggested
that light exposure which contribute to higher temperature could control phenols biosynthesis It
could also shift or modify flavonoids composition (Pereira et al 2006 Downey et al 2004
Bucchetti 2004 Guidoni et al 2004 Bucchetti et al 2007 Filippetti 2009 Spayd et al 2002
Haselgrove et al 2000) As to Pastore (2010) late defoliation in grape (that contributes to the
higher light exposure and consequently higher temperature) could decrease titratable acidity In
addition a tendency to decrease in total anthocyanins and modifications in flavonoids composition
such as decrease of cyanidin quercetin and kaempferol and increase of malvidin level was
observed
Among the factors that determine grape wine quality and market value berry skin coloration is one
of the most important factors Grape coloration is attributable to anthocyanin accumulation in the
skin and temperature is an important factor that affects anthocyanin accumulation in grape (Mori et
al 2005b Mori et al 2007 Winkler et al 1962 Jones et al 2005 Kliewer 1970 Buttrose et al
1971 Kliewer and Torres 1972 Yamen et al 2006 Spayd et al 2002) It is reported that high
diurnal temperature generally decrease total anthocyanin amount (Yamane et al 2006 Mori et al
2007a) This effect seems to be particularly significant after veacuteraison and it can be affirmed that high
diurnal temperature generally decreases anthocyanin amount (Winkler et al 1962 Yamane et al
2006 Mori et al 2007a) The results of the stable isotope-labelled tracer experiments to examine
the effect of temperature on the turnover of anthocyanin in the skin indicated that the total
anthocyanin contents were highest in berries cultured at 25degC and lowest at 35degC and confirmed the
loss of anthocyanins in response to high temperature In the berries cultured at 35degC the total
content of 13
C- labeled anthocyanin was markedly reduced while there was no decrease in labelled
anthocyanin content in the skin of berries at 15degC and 25degC (Mori et al 2005)
The results of the study on the effect of temperature on anthocyanin composition has indicated that
the amount of all anthocyanins except malvidin 3-O glucoside was reduced by high temperature
(Romero and Bakkar 2000 Morais et al 2002 Mori et al 2007) In general methoxylation
glycosylation and acylation lead to an increase in the thermal stability of anthocyanin (Jackman and
Smith 1996) High temperature increases the degradation rate of anthocyanins but it has been
assumed that this degradation rate depends on the anthocyanin structure (Jackman and Smith 1996
Sipiora and Gutierrez-Granda 1998 Mori et al 2007) It is reasonable that only malvidin
derivatives which are highly methylated anthocyanins were accumulated and were more stable than
other anthocyanins (Mori et al 2007) The decrease in anthocyanin accumulation under high
temperature may result from factors such as anthocyanin degradation as well as the inhibition of
mRNA transcription of the anthocyanin biosynthetic genes (Mori et al 2007) Temperature might
18
affect not only the synthesis but also the stability therefore the decrease in anthocyanin
concentration at elevated temperatures might result from both decrease in synthesis and increase in
degradation (Shaked-Sachray et al 2002 Vaknin et al 2005)
In Vitis vinifera berries the most important pigments are derived from delphinidin cyanidin
petunidin peonidin and malvidin (Castellarin et al 2006) Although the corresponding
anthocyanins can be formed by the formation of acetic caffeic or p-coumaric acid esters they are
usually formed by the addition of a 3-O glucose It is therefore unsurprising that one of the genes
most up-regulated during the anthocyanin accumulation in grape berries is UFGT (Walker et al
2007) In the flavonoids biosynthesis pathway anthocyanins are the last products of
phenylpropanoid pathway It has been determined that anthocyanins are synthesized from
phenylalanine through an anthocyanin biosynthesis pathway (Fig 7) regulated by enzyme activities
(Hrazdina et al 1984) and gene expressions (Boss et al 1996) Some anthocyanin biosynthetic
pathway genes including a large number of isogenes phenylalanine ammonia lyase (PAL) chalcone
synthase (CHS) chalcone isomerase (CHI) flavanone 3-hydroxylase (F3H) dihydroflavonol 4-
reductase (DFR) leucoantho-cyanidine dioxygenase (LDOX) and UDP-glucose flavonoid 3-O-
glucosyltransferase (UFGT) etc- have been cloned (Sparvoli et al 1994) It has already been
established that in many plants the gene expression of the enzymes involved in anthocyanin
biosynthesis is affected by temperature In general the expression of the anthocyanin biosynthetic
genes was induced by low temperature in different specious (Mori et al 2005b 2007 Yamane et
al 2006 Christie et al 1994 Shvarts et al 1997 Lo Piero et al 2005 Leyva et al 1995 Shaked-
Sachray et al 2002 and Dela et al 2003) Very interesting is also the effect of different night
temperature on anthocyanin biosynthesis Warm night contributes to decrease of anthocyanin
content of grape berry skin The enzymatic activities of PAL and UFGT in the skin of Darkridge
berries grown under high (3030 degC) night temperature conditions were decreased significantly after
veraison (Mori et al 2005 Mazza and Miniati 1993 Kliewer and Torres 1972)
Flavonoids protect plants against various biotic and abiotic stresses Their oxidation reactions only
occur after senescence or an environmental stress This oxidation plays a role in defending the plant
against various biotic and abiotic stresses (Treutter 2006 Buchanan-Wollaston and Morris 2000
Munneacute-Bosch and Alegre 2004) Since grape berries grown under high temperature would receive
oxidative stress (Mori et al 2007) Flavonoids oxidation (eg Anthocyanin degradation) occurs in
order to defend the plant This reaction in plants is mainly catalyzed by polyphenol oxidases
(catechol oxidases and laccases) and peroxidases (Pourcel et al 2006) It was also reported that
among the candidates for anthocyanin degradation enzyme such as polyphenol oxidases (PPOs) and
peroxidases (PODs) peroxidases are involved in active anthocyanin degradation of Brunfelsia
19
calycina flowers (Vaknin et al 2005 Welinder et al 2002) While polyphenol oxidases increased
the rate of anthocyanin degradation in fruit extracts and juices (Kader et al 1997- 1998- 1999 Sarni
et al 1995) PPOs are not likely candidates for degrading anthocyanins in living tissues because of
their location in plastids (Vaknin et al 2005) Peroxidases in vacuoles have also been found in
grape cells and would be involved in anthocyanin degradation in the presence of H2O2 (Calderon et
al 1992) H2O2 levels in plant tissues have been shown to increase in response to heat stress (Dat
et al 1998) Flavonoid-PODs reaction might function as a mechanism for H2O2-scavenging and
therefore plant cell detoxification (Pourcel et al 2006) Gene chips micro ray analysis showed that
grape berries grown under high temperature would receive oxidative stress (since genes encoding
peroxidases and some oxidoreduction enzymes were induced (Mori et al 2007) The indication that
oxidative enzymes are involved in this process is the fact that treatment with reducing agents (such
as glutathione and DTT) and protein synthesis inhibitors (like cycloheximide and anisomycin) both
caused inhibition of anthocyanin degradation (Vaknin et al 2005) In addition the effect of
temperature on fruit foliage and flower pigmentation has shown that fading of Aster flowers color
due to high temperature could be prevented by stabilizing the pigments (Shaked-Sachray et al
2002 Nissim-levi et al 2003 Oren-Shamir and Nissim-levi 1997a 1997b 1999 Vaknin et al
2005) These findings suggest that anthocyanin degradation plays a crucial role in pigment
concentration under low rate of bisynthesis Peroxidase activity is specific and involved in the
pigment degradation (Vaknin et al 2005) Mechanisms of flavonoid oxidation lead to brown
polymers (Pourcel et al 2006 Walker and Ferrar 1998 Yoruk R and Marshall 2003 Jiang et al
2004) The browning of peel of litchi fruits has been correlated with the rapid degradation of red
anthocyanin pigments this process is associated with enzymatic oxidation of phenolics by
polyphenol oxidases (PPO) andor peroxidases (POD) (Jiang et al 2004) Although the effects of
temperature on grape berry composition and particularly on the content of anthocyanins in skins
have been studied intensively (Kliewer 1970 Buttrose et al 1971 Kliewer and Torres 1972
Spayd et al 2002 Mori et al 2005b Yamane et al 2006) the mechanisms responsible for the
poor coloration of berry skin at high temperatures have not been completely understood and no
report has demonstrate the enhancement of anthocyanin degradation due to high temperature in
grape tissues Plant responses to high temperature involve morpho-anatomical physiological
biochemical and molecular changes which sometimes have to occur very rapidly The molecular
response to heat stress involve both the induction of enzymes involved in oxidative stress (as
Peroxidase Superoxide Dismutase Ascorbate Peroxidase Catalase) and Heat Shock Proteins (HSP)
(Wahid et al 2007) As previously reported anthocyanin biosynthesis is inhibited by higher
temperature and this is confirmed by molecular studies High temperature decreased mRNA
20
accumulation of structural anthocyanin biosynthesis genes and MYBA1 in cv Aki Queen (Yamane
et al 2006) In Pinot Noir vines instead the decrease in anthocyanin content due to high
temperature treatment cannot be linked to a decrease in anthocyanin biosynthesis as no significant
differences in gene expression were found These results may contribute to suggest that the
reduction in anthocyanin biosynthesis may be also due to enzyme inhibition or anthocyanin
degradation rather than a transcriptional effect (Mori et al 2007)
4 GENERAL AIMS OF THE THESIS
The present study is mainly focused on wine grape quality with the general aim of evaluating the
impacts of high temperature condition on grape quality From 1950 the majority of the worlds
highest quality wine-producing regions have experienced warming trends in growing season and this
condition is projected to have significant impacts on grape wine production quality and yield In
particular high temperatures after veraison can negatively affect grape composition expecially skin
anthocyanin accumulation in black berry varieties On these bases the present thesis aims to analyse
two trials both on cv Sangiovese which is the most cultivated variety in Italy characterized by
peculiar anthocyanins profile
The first trial is to appraise the effects of high temperature condition on flavonoids (anthocyanins
flavonols and condensed tannins) accumulation and particularly the mechanisms responsible for
lower anthocyanin content in berries ripened under elevated temperature via assessment of the main
berry biochemical compounds during ripening and of the activities of the putative key enzymes
which are involved in anthocyanins biosynthesis (such as UFGT and PAL) and their degradation
like peroxidases and polyphenol oxidases (PODs and PPOs) In addition the expression of some
genes responsible for flavonoids biosynthesis and degradation was assessed via Real time PCR A
further step was developed to recognize the best candidate genes responsible for anthocyanin
degradation under such stress condition throught a biotechnological approach of genes
transformation from grape to Petunia flower via Agrobacterium tumefaciens
Due to global warming in the last decades and in several warm wine regions a too high level of
sugar and subsequent wine alcohol excess low acidity and in black varieties unbalanced phenolic
ripening with insufficient berry skin colour has been shown at harvest The aim of the second trial is
to evaluate the effects of management techniques applied in the field on the canopy in post-
veraison (ie trimming ) on limiting the carbohydrate availability for cluster ripening to slow down
the accumulation rate of soluble solids in berries and to avoid the ldquouncouplingrdquo of sugar
accumulation versus phenolic synthesis during ripening
21
The present work started from the data obtained in a preliminary evaluation in 2009 and both in
2010 and 2011 the quantity and quality of different flavonoids as anthocyanins flavonols and
tannins were measured during ripening in berries of treated and control vines One of the main aims
of the second trial is to evaluate if the evolution of anthocyanins and skin and seed tannins is
conditioned by the rate of sugar accumulation
22
Chapter one First part
Biochemical and molecular approaches to study the effects of temperature
on grape composition in cv Sangiovese (Vitis vinifera L )
23
1 INTRODUCTION
In the last decades the majority of the worlds highest quality wine-producing regions have
experienced warming trends in growing season and this condition is projected to have significant
impacts on grape production quality (Jones at al 2005) The optimum temperature for berry growth
is among 20deg-25degC (Dookozlian 2000) Generally higher temperatures during grape ripening lead
to an increase in the rates of sugar accumulation and organic acid degradation Flavonol content is
reported to be more influenced by UV exposure rather than temperature (Spayd et al 2002) and
little is known about the effects of temperature increase on skin and seed proanthocyanidin
especially when applied after veraison
In black berry varieties grape coloration is due to anthocyanin accumulation in the skin which could
be negatively affected by temperature (Mori et al 2005 amp 2007 Kliewer amp Torres 1972 Tomana
et al 1979) But the mechanism responsible for colour reduction in berry skin at high temperature is
not completely clear While some researches in red table grape have determined that high
temperatures suppressed the expression of anthocyanin biosynthetic genes (Yamane et al 2006)
some other studies (in Cabernet Sauvignon) did not confirm this effect as mRNA accumulation of
anthocyanin biosynthetic genes and enzyme activity of UDP-Glucose Flavonoid Transferase
(UFGT) were not inhibited under high temperature (Mori et al 2007) Therefore it can be
hypothesized that temperature would affect not only the synthesis but also the stability of
anthocyanins (Shacked-Sachray et el 2002 Vaknin et al 2005 Mori et al 2005) and chemical or
enzymatic degradation of anthocyanins can be an answer to high temperature conditions involving
in the second option polyphenol oxidase and peroxidase (Mori et al 2007 Vaknin et al 2005)
Moreover temperature has been shown to have an effect on anthocyanins composition and some
authors suggested a highest thermal stability for the tri-substituted anthocyanins (particularly
malvidin derivatives) due to their chemical structure (Mori et al 2007 Cohen et al 2012)
So it is possible to hypothize different responses to high temperature between distinct grape
cultivars according their peculiar anthocyanin composition
To date no evidence has demonstrated the effects of elevated temperature on anthocyanin
accumulation and composition of cv Sangiovese characterized by monoglucoside anthocyanins
with high percentages of hydroxylated anthocyanins (mainly cyanidine-3-glucoside)
On these bases the aim of the present research is to evaluate the effects of high temperatures on
flavonoids (anthocyanins flavonols and condensed tannins) accumulation during ripening of
Sangiovese berries And in particular the mechanisms responsible for modification of the
anthocyanins content in berries ripened under elevated temperature conditions would be studied via
24
assessment of the activities of the putative key enzymes which are involved in anthocyanins
biosynthesis (such as Phenylalanine ammonium lyase (PAL) and UDP-glucose flavonoid 3-O-
glucosyltransferase (UFGT) and their degradation (like polyphenol oxidases (PPOs) and peroxidases
(PODs) In addition the expression of some genes involved in flavonoids biosynthesis and
degradation would be appraised via Real time PCR
2 MATERIALS AND METHODS
The study was conducted in 2010 and 2012 on respectively five and three years old uniform potted
plants of Vitis vinifera cv Sangiovese The vines grafted on SO4 rootstocks were grown in pots of
30 liter containing a mixture of sand and soil (1 1) In both years before the experiment the
number of shoots was standardized (around 9 shoots in 2010 and 6 in 2012) In addition in order to
have a uniform leaf area in all the vines the tip of each shoot was removed when 20 main leaves
were produced Before veraison (27th of July 2010 and 19th of July 2012) 8 and 12 uniform vines
were selected in 2010 and 2012 respectively on the bases of size of shoots and the bunch number
The selected vines were assigned to the two treatments LT (Low Temperature) and HT (High
Temperature)
In the LT treatment the vines were placed from pre-veraison to harvest in a plastic tunnel where the
minimum temperature was about 17 degC and the mean and maximum air temperatures were
maintained with a cooler below 26deg and 35degC
In the HT treatment the air temperature was similar to the ambient as the vines were distribuited in a
plastic tunnel which was open in the basal part and covered only the canopies to maintain the light
conditions similar to the LT vines In HT tunnel during the experimental period of 2010 the
minimum temperature was about 18deg and the mean air temperature was 26 degC while in 2012 they
were measured to be about 19deg and 28 degC respectively The maximum air temperaure could instead
exceed to 43degC and 44degC in 2010 and 2012 sequentially
Both tunnels were made of polyethylene film (MOP Bologna Italy) that did not alter the spectral
composition of light while the percentage of transmission was decreased by a maximum of 12
within the visible range
All the vines were daily watered automatically and well supplied with nutrients
21 Temperature monitoring
Berry skin temperature was monitored in 10 selected clusters of the plants in low temperature tunnel
(LT) and 10 clusters of the vines in high temperature tunnel (HT) in both years In each of these two
25
treatments temperature data were recorded from one week before veraison of both years until
harvest towards 10 T- type thermocouples (RS component MI Italy) positioned in the sub-cuticle
tissues of berry skin Each probe was then connected to a CR10X data logger (Campbell Scientific
Ltd Leicestershire United Kingdom) registering temperature data every 20 minutes and each one
hour in 2010 and 2012 sequentially The air temperature inside the tunnels were also monitored and
recorded each hour during the same period by air temperature sensors (TL20 3M Milan Italy)
22 Berry sampling
Berry sampling was conducted from 1 week before the veraison to the harvest in both years of the
trial In total 45 berries per each 8 vines and 30 berries per each 12 vines were sampled every 8 and
10 days in 2010 and 2012 respectively The 180 sampled berries for each of the two treatments were
pooled separately and divided into 4 biological replicates of 45 berries each to perform biochemical
and molecular analyses The berries of the first group (15) were weighed and immediately used for
degBrix titratable acidity and pH measurment All the other sampled berries were immediately frozen
in liquid nitrogen and kept in the freezer (-80 degC) until the analyses to evaluate the quality and the
quantity of the anthocyanins and flavonols (10 berries) skin and seed tannins (10 berries) and to
assess the gene expression and the enzymatic activity (10 berries)
23 degBrix titratable acidity and pH
The sampled berries were crushed and the must were sieved and used for degBrix analysis by a
temperature-compensating CR50 refractometer (Maselli Misure Spa PR Italy) Five mL of the
same must were then diluted 7 times with bi-distilled water and used to perform a titration reaction
by a Crison Compact Tritator (Crison Barcelona Spain) with 1N 05 N or 025 N NaOH (Sigma-
Aldrich St Louis MO USA) according to the stage of berry ripening to obtain pH and TA data
(expressed as gl of tartaric acid equivalents)
24 Analyses of anthocyanins and flavonols
The berries of each replication were sampled and weighted before the extraction of anthocyanins
and flavonols Then the skin was carefully removed from the pulp and immerged in 50 mL of
HPLC-grade methanol (Carlo Erba Reagents Milano Italy) and were kept in dark for 24 hours
The day after the extract was separated from the skin residues and conserved at (-20oC) until the
anthocyanins analysis
26
To analyze the total content of each flavonol aglycon an aliquot of 5 mL of the same methanol
extract was completely dried under vacuum To achieve the acid hydrolyzation of flavonols
glucosides the pellet was re-suspended in 25 mL of methanol and 25 mL of 2M Trifluoroacetic
acid (Sigma-Aldrich St Louis MO USA) in milliQ water The reaction was conducted at 100 oC in
a boiling hot water bath with a condenser for 2 hours The reaction product was then completely
dried under vacuum and the pellet obtained re-suspended in 1mL of methanol and was kept at (-
20oC) until HPLC analysis
HPLC separation and quantification of anthocyanins and flavonols were performed on a Waters
1525 instrument equipped with a diode array detector (DAD) using a reversed-phase column
Phenomenex (Castel Maggiore BO Italy) RP18 250 mmx4mm (5microM) with precolumn Either for
anthocyanins and flavonols the eluents used were the following A= HClO4 03 in milliQ water B
= methanol
For anthocyanin analysis the methanol extract was filtered through 022 microm 13mm PTFE syringe-
tip filters (Teknokroma Barcelona Spain) and an aliquot of 270 microL was diluted to final volume of
1mL with the A eluent The binary gradient was the same as reported in Mattivi et al (2006) with
suitable modifications The time for column equilibration was 5 minutes and the injection volume
was 60 microL Separation of the main free anthocyanins was obtained at 43 oC and they were quantified
at 520 nm with a calibration curve with malvidin-3-glucoside (Sigma-Aldrich ST Louis MO
USA)
Hydrolyzed flavonols samples were filtered through 045 microm 13 mm PTFE syringe- tip filters
(Teknokroma Barcelona Spain) directly into liquid chromatography vials Flavonols aglicones
were separated at 40deg C through the linear gradient as reported in Mattivi et al (2006)
The time for equilibration column and the injection volume were the same used for the HPLC-DAD
analyses of anthocyanins Quercetin myricetin and kaempferol were quantified at 370 nm with the
corresponding external standard purchased from Extrasynthese (Genay France)
25 Tannins analysis
To extract proanthocyanidins frozen berries samples (skins and seeds) were ground separately to a
fine powder under liquid N2 01 g aliquots were separated and extracted in darkness in 2 mL screw-
top Eppendorf tubes for 24 hours with 70 acetone containing 01 ascorbate (10 mL) to prevent
oxidation of polyphenols (Kallithraka et al 1995) Samples were then centrifuged (15 min 13000 x
g) and two 400 μL aliquots of the supernatant were transferred to fresh tubes and dried down under
vacuum at 35ordmC for 120 minutes
27
One of them was re-suspended in 100 μL methanol acidified with 1 HCl then neutralized with 100
μL sodium acetate (200 mM pH 75) for the analysis of free monomers The other aliquot
underwent acid-catalyzed cleavage of the proanthocyanidins in the presence of excess
phloroglucinol following the method of Kennedy and Jones (2001) Briefly the dried sample was
re-suspended in 100 μL of phloroglucinol buffer (025 g ascorbate 125 g phloroglucinol 215 μL
conc HCl 25 mL methanol) and incubated at 50ordmC for 20 minutes then neutralized with 100 μL of
sodium acetate (200 mM pH 75) and centrifuged (15 min 13000 x g) A 200 μL aliquot each of
the acetone extract the acetone extract after acid catalyzed cleavage and the residue after cleavage
was then transferred to Sun-broker 250 μL reduced volume HPLC auto-sampler vials Samples were
run on a Waters 1525 instrument equipped with a diode array detector (DAD) using a reversed-
phase column Phenomenextrade (Castel Maggiore BO Italy) RP18 250 mmx4mm (5microM) with
precolumn A separate reversed-phase HPLC method was developed for the cleaved and uncleaved
proanthocyanidin samples reading absorbance at 280 nm Uncleaved samples solvent A 02
phosphoric acid solvent B 41 acetonitrile02 phosphoric acid (gradient of solvent B zero min
0 5 min 10 40 min 10 55 min 17 65 min 19 75 min 19 80 min 100 85 min
100 86 min 0) Cleaved samples solvent A 02 acetic acid solvent B methanol (gradient of
solvent B zero min 1 40 min 1 120 min 30 1201 min 100 125 min 100 126 min
1) For both methods 25 μL of sample was injected and run at 30ordmC with a flow rate of 1 mLmin
Concentrations of free monomers and hydrolysed terminal subunits were determined from standard
curves prepared from commercial standards of catechin epicatechin epigallocatechin and
epicatechin-gallate obtained from Extrasynthese (France) The concentration of extension subunit-
phloroglucinol adducts was calculated from published molar extinction coefficients (Kennedy amp
Jones 2001) The evaluation of skin and seeds tannins was performed only on the samples of the
year 2010
26 Real-time PCR analyses RNA extraction and RNA evaluation
Real-time PCR analyses were performed for four and five selected stages of berry ripening in 2010
and 2012 respectively from beginning of veraison to the end of harvest Total RNA was isolated
from 200 mg and 500 mg in 2010 and 2012 respectively of the powdered berry skin tissue using
spectrumTM
Plant Total RNA kit (Sigma-Aldrich St Louis MO USA) following the manufacturers
protocol One microL of each RNA sample was measured spectrophotometrically to determine RNA
quantity and 260280 and 260230 ratio using a NanoDrop1000 Spectrophotometer (Thermo Fisher
Scientific Wilmington DE USA) Total RNA was treated with 1 U microg-1 RQ1 DNase (Promega
28
Milan Italy) First-strand cDNA was synthesized using 1 microg of RNA 1microL (dT)15 primer (500
microgmL) and 1 U of GoScripttrade reverse transcriptase (Promega) Quantitative RT-PCR was carried
out on a Step One Plustrade (Applied Biosystems Foster City California USA) Each reaction (10
microL) contained 188 nM of each primer 2microL of diluted cDNA (150) 5microL U of Power SYBRreg Green
PCR Master Mix (Applied Biosystems Foster City California USA) Thermal cycling conditions
were 95 degC for 10 min followed by 95 degC for 15 s 55 degC for 1 min for 40 cycles followed by a
melting cycle which contains 95 degC for 15 sec 60 degC for 1 min and 95 degC for 15 sec Each cDNA
sample was analyzed in triplicate Primers pairs for Dihydroflavonol 4-reductase (DFR)
Leucoanthocyanidin dioxygenase (LDOX) and UDP-glucose flavonoid 3-O-glucosyltransferase
(UFGT) were retrieved from literature (Goto-Yamamoto et al 2002) primers for VvMYBA1 were
from Jeong et al (2004) for Leucocyanidin reductase (LAR) and Anthocyanidin reductase (ANR
or BAN) from Bogs et al (2005) and for Peroxidase (POD6 ) from Mori et al (2007) Primers for
Flavanone 3-hydroxylase (F3rsquoHb) Flavonoid-3rsquo5rsquo-hydroxylase (F3rsquo5rsquoHk and F3rsquo5rsquoHi)
Phenylalanine ammonium lyase (PAL) Flavonol synthase (FLS) and Peroxidases (POD1 to POD5)
were newly designed on the original DNA sequences to amplify 150ndash250 bp gene fragments (Table
1)
29
Table 1 Sequence of primers used for Real time PCR amplification
Primer Forward Primer Reverse
DFR 5-GAAACCTGTAGATGGCAGGA-3 5-GGCCAAATCAAACTACCAGA-3
LDOX 5-AGGCTCTACTCTCCAAATGA-3 5-GAAGCTTGAAACACAGACCA-3
UFGT 5-AATCTGAGAGCCCTAAGAGA-3 5-GGTGGTACAAGCAACAGTTC-3
MYBA 1 5-TAGTCACCACTTCAAAAAGG-3 5-GAATGTGTTTGGGGTTTATC-3
LAR 5-TCTCGACATAAATGATGATGTG-3 5-TGCAGTTTCTTTGATTGAGTTC-3
BAN 5-CAATACCAGTGTTCCTGAGC-3 5-AAACTGAACCCCTCTTTCAC-3
PAL 5-ACATACCTAGTGGCACTCTG-3 5-TCGCAGAATCTCGATGGATG-3
F3Hb 5-TCCATCACCAAGTCTTCTAC-3 5-GCGGAGAAGCTGAACATGGA-3
F35Hi 5-CAGACTGCATACGCACTCTG-3 5-ATGCCGGATGGAGTTGAGAT-3
F35Hk 5-CCAGGCCTAGCTACTATATG-3 5-GCATATGGCATGGTGGTAGA-3
FLS 5-CTGCACTATCCAGAGATGAG-3 5-TTGCCGCTTCAACAACAACA-3
POD 1 5-TCTGAGTAAGAGCCCACACACTCT-3 5-GAGACCTGAGCAGATAAATACAAAAATAAA-3
POD 2 5-AAAGTTGTTTGGCTGTGG-3 5-AATCCCTCCAAACAATCA-3
POD 3 5-TGCTCTAAATGCCTGAAAAATG-3 5-ATCATATAGAAAAGTGACAGCAACCT-3
POD 4 5-CAACTTCACACCAACGGGAAA-3 5-GCAGCTGAGCAAGAAATGCTT-3
POD 5 5-TCGGTGAGGAACTCCGATA-3 5-AGCTTCCTTGTCCTCTTCCA-3
POD 6 5-AACTTGAGACACAACAGCATAAATAAATC-3 5-AGGACCAAATCACAGGATGATAAAG-3
ACT 5-ATTCCTCACCATCATCAGCA-3 5-GACGAGCCCCTCCTACTAAAACT-3
30
27 Enzyme assay
27 1 PAL activity assay
The extraction was performed according to the method of Mori et al (2005) with some
modifications The following procedures for protein extraction were conducted at 4deg C For each
replication 02 g of berry skin was ground with a mortar and pestle in liquid nitrogen until a fine
powder was obtained
The skin powder was homogenized with 15 mL of a 100 mM Sodium borate buffer (pH 9)
containing 0075 g of PolyVinyl-PolyPyrrolidone (PVPP) and 100 microL of a 200 mM Dithiothreitol
After incubation in ice for 20 minutes centrifugation was done at (4deg C 15 min 10000 x g)
Then 1mL of the supernatant was desalted by passing through a NAP-10 column (Sephadex G-25
Amersham Biotech) equilibrated with 15 mL of the same buffer
For the analysis of PAL activity the reaction mixture consisted of 05 mL of Phenylalanine and 05
mL of the enzyme solution The assay mixture was incubated in 37deg C for 60 minutes The reaction
was terminated by adding 05 mL of HCl acid (18) The quantity of the product namely Trans-
cinnamic acid was calculated using its extinction coefficient of 9630 M-1
cm-1
at 290 nm One unit
of PAL was expressed as synthesis of 1 mol of Trans-cinnamic acid per minute and PAL activity
was expressed as microkat g-1 protein
27 2 UFGT activity assay
The extraction was performed according to the method of Mori et al (2007) with some
modifications The following procedures for protein extraction were conducted at 4 oC For each
replication (02 g) of berry skin was ground with a mortar and pestle in liquid nitrogen until a fine
powder was obtained The skin powder was homogenized with 13 mL of a 250 mM TRISndashHCl
buffer (pH 75) containing 10 mM Polyethylene glycol 3400 150 microL of 10 mM Na-
diethyldithiocarbamate 15 microL of 200 mM Dithiothreitol and 2 microL of 2-mercaptoethanol and was
incubated for 20 min on ice After centrifugation of the homogenate at 10000 x g for 20 min The
supernatant was passed through a NAP-10 column (Sephadex G-25 Amersham Biotech)
equilibrated with a 15 mM TRISndashHCl buffer (pH 75)
The desalted crude extract was used as the enzyme solution in the following enzyme assay using
delphinidin and cyanidin as substrates The method of Mori et al (2007) was employed with some
modifications for the analysis of UFGT activity For the first assay the reaction mixture consisted of
02 mL of the previous extraction solution (containing TRISndashHCl buffer (pH 75) Polyethylene
glycol 3400 Na-diethyldithiocarbamate Dithiothreitol and 2-mercaptoethanol) 50 microL of 1mM
31
Cyanidin 50 microL of 100mM UDP-glucose and 02 mL of the enzyme solution The assay mixture
was incubated for 5 min at 37deg C The reaction was terminated by adding 150 microL of 5 HCl The
quantity of the product namely Cyanidin-3-glucoside was measured using its extinction coefficient
of 26900 M-1
cm-1
(at 520 nm pH 1)
Therefore one unit of UFGT was defined as the production of 1 mol of Cyanidin-3-glucoside per
second and UFGT activity was expressed as pkat g-1 protein
For the second assay the reaction mixture consisted of 02 mL of the same extraction solution
(containing TRISndashHCl buffer (pH 75) Polyethylene glycol 3400 Na-diethyldithiocarbamate
Dithiothreitol and 2-mercaptoethanol) 50 microL of 1mM Delphinidin 50 microL of 100mM UDP-glucose
and 02 mL of the enzyme solution The assay mixture was incubated for 5 min at 37deg C The
reaction was terminated by adding 150 microL of 5 HCl The quantity of the product namely
Delphinidin-3-glucoside was measured using its extinction coefficient of 26000 M-1 cm-1 (at 520
nm pH 1)
Therefore one unit of UFGT was defined as the production of 1 mol of Delphinidin-3-glucoside per
second and UFGT activity was expressed as pkat g-1 protein
27 3 Guaiacol PODs activity assay
Guaiacol PODs were assayed as described by Ushimaru et al (1997) using pyrogallol as the
electron donor for the reaction The plant material (skin) was extracted in cold buffer (200 mM
sodium phosphate 5 mM sodium EDTA 1 PVPP pH 70) and incubated on ice for 30 min After
centrifugation at (10000 times g 30 min 4 degC) the desalted supernatant was used for the assay The
reaction mixture (25 mL) included 22 mL of the 10 mM sodium phosphate buffer pH 70 100 microL
of the 25 mM H2O2 50 mM pyrogallol and 100 μl extract H2O2 and pyrogallol were prepared
fresh just before use Absorbance (λ=430 nm) was taken after 5 min incubation at room temperature
and referred to a blank with no extract added One unit of Guaiacol peroxidases is defined as the
amount of enzyme that catalyzes the oxidation of 1 μmol of pyrogallol per minute under the
conditions described by Chen and Asada (1989) and PODs activity was expressed as kat g-1 skin
fresh weight An absorbance coefficient of 247 mM-1 cm-1 was assumed for calculations
27 4 PPOs activity assay
PPOs were assayed as described by Ushimaru et al (1997) using pyrogallol as the electron donor
for the reaction The plant material (skin) was extracted in cold buffer (200 mM sodium phosphate
5 mM sodium EDTA 1 PVPP pH 70) and incubated on ice for 30 min After centrifugation at
32
(10000 times g 30 min 4 degC) the desalted supernatant was used for the assay The reaction mixture
included 28 mL of the 100 mM sodium phosphate buffer pH 70 1 mM pyrogallol and 100 μl
extract the pyrogallol was prepared fresh just before use Absorbance (λ=430 nm) was taken after 5
min incubation at room temperature and referred to a blank with no extract added One unit of
Polyphenol oxidases is defined as the amount of enzyme that catalyzes the oxidation of 1 μmol of
pyrogallol per minute under the conditions described by Chen and Asada (1989) and PPOs activity
was expressed as kat g-1 skin fresh weight An absorbance coefficient of 247 mM-1 cm-1 was
assumed for calculations
28 Vegetative and Yield measurements
In both years immediately after harvest all the leaves of each vine of the both tunnels were
removed and their areas were measured using a leaf area meter (LI3000 LiCor Inc Lincoln Neb
USA) along with the number of nodes of each single shoots
The grape bunches were harvested when the total soluble solids of berries had reached to
approximately 22 o
brix All bunches were removed counted and weighed in both treatments to
determine the yield of each vine
29 Statistical analyses
Data were submitted to analysis of variance and means were separated by the Student-Newman-
Keuls test by SAS statistical software (SAS Institute Cary North Carolina USA) The experiments
were conducted with four replications from each treatment and the values were the means of four
replications
3 RESULTS AND DISCUSSION
31 Berry Temperature
The berry temperature in both tunnels was influenced by the two air temperature regimes (HT and
LT) The average berry temperature in the LT tunnel during the ripening period of 2010 was
recorded to be about 20 oC while it was about 24deg C in HT In 2012 the average berry temperature in
both treatments were recorded to be about 2deg higher than in 2010
The maximum berry temperature in both years showed the highest differences between the two
treatments as it was maintained below 35 degC in LT and it might exceed to 42 degC in correspondence
of several heat weaves during the ripening in HT (Fig10)
33
The analyses of the number of hours exceeding the 30 and 35degC showed significant higher values in
both years in HT than in LT (Table 2 ) In particular the number of hours over 35deg C was null in LT
berries while it was about 70 and 157 hours in HT berries in 2010 and 2012 respectively Moreover
despite between the two years only few differences were found in mean and maximum berry
temperatures 2012 berries spent more hours at high temperature than in 2010 regardless from the
different treatments and the temperature fluctuations were higher during the ripening period of 2010
(Table 2) In addition in 2010 the percentage of the average berry temperature more than 30 degC
was about four folds more in the HT tunnels as compared to LT one while in 2012 this percentage
was six folds higher
Fig 10 The average and maximum daily berry temperature (oC) grown under high and low temperature conditions
during ripening in 2010 and 2012
34
Table 2 The percentage and the number of hours that the average of berry temperature was higher than 30deg and 35degC
in both treatments during the experimental period in the years 2010 and 2012
Total
experimental
time
(Ndeg hours)
Average berry
temperaturegt
35 degC
(Ndeg hours)
Average berry
temperature gt
30 degC
(Ndeg hours)
Average berry
temperature gt
35 degC
()
Average berry
temperature gt
30degC
()
Treatment Year
1176 hr 70hr 192 hr 6 163 HT 2010
0 55 hr 0 47 LT
1257 hr 157 hr 392 hr 1250 31 HT 2012
0 91 hr 0 7 LT
32 Leaf area and Yield
The plant materials used in this trial were not the same in the two years In 2010 and 2012
respectively five years old and three years old uniform potted vines were used for the treatments
Therefore the comparison could be done only between the treatments in each year and the year
effect would not be considered
In both years before the experiment the vines were uniformed for the number of shoots and clusters
in both treatments But the main lateral and total leaf areas per vine were significantly higher in LT
vines respect to HT (Table 3)
In 2010 the yield and its components were not significantly different between the LT and the HT
vines (Table 4) while in 2012 the yield was 36 more in LT as compared to HT ones Since the
cluster number per vine and the berry weight were similar in this year this result is mainly due to a
higher number of berries per cluster which imply that the cluster weight was higher in LT vines
(Table 4)
It seems that the higher temperature in HT may be responsible for drying out the basal leaves in HT
at the end of ripening and these conditions which have been assessed also by visual observation
caused a lower average leaf area compared to LT as the leaf area estimation was assessed after
harvest Besides the warmer condition of 2012 has been contributed to drop of some berries due to
the dehydration and drought in the very last period of ripening in HT Based on these
considerations it is likely that HT thermal condition did not show negative physiological effect on
vegetative growth and yield as the treatment was imposed at veraison and we registered a
ldquosecondaryrdquo effect due to the leaves and berry drop in the very last part of ripening
35
Table 3 Leaf area of grapes grown under high (HT) and low (LT) temperature conditions during ripening of the years
2010 and 2012
Year Treatments
Main Leaf area
(cm2vine)
Lateral Leaf area
(cm2vine)
Total leaf area
(cm2vine)
2010 LT 117425 105785 22321
HT 71682 80629 152311
2012 LT 13460 5690 19150
HT 6715 3742 10457
Table 4 Yield and yield components of grapes grown under high (HT) and low (LT) temperature conditions during
ripening of the years 2010 and 2012
Year Treatments No Cluster
Vine
Yield
Vine
(gr)
Cluster
weight
(gr)
Berry weight
(gr)
Berries per
cluster
(n)
LA Yield
per vine
(cm2 gr)
2010 LT 11 16666
1515
24 63 134
HT 12 18245
1520 21 72 835
ns ns ns ns ns
2012 LT 6 8616
1436
22 65 222
HT 5 5355 1071 21 51 196
ns ns ns
36
33 oBrix pH Titratable acidity
The results indicated that in 2010 a similar trend in the percentage of Total Soluble Solids in berries
grown under low and high temperature was measured and no significant differences was observed
among the two treatments in titratable acidity (TA) and pH However in 2012 the advanced ripening
in HT grapes was associated with higher level of oBrix during ripening nevertheless they reached
the same level at harvest Moreover it seems that the elevated temperature contributed to
degradation of titratable acids and increase in pH (Fig 11) There are contradictory reports on the
effects of high temperature on sugar accumulation in grape during different stages of berry
development Several papers (Matsui et al 1986 Sepuacutelveda and Kliewer 1986 Kliewer et al
1977) reported a general delay in ripening which is attributed to the impact of heat on the
photosynthetic supply of sugar Photosynthesis of grapevines is reduced at temperatures above 35 oC
(Kriedemann 1968 Ferrini et al 1995 Schultz 2003 Yu et al 2009 Zsoacutefi et al 2009) and
generally the restrictions to photosynthesis are caused by stomatal limitation As to Sepuacutelveda et al
(1986) prevention of the soluble sugar accumulation in berries by high temperature cannot be
accounted for an inhibition of the phloem transport between the leaves and the bunchs In contrary
Soar et al (2009) reported an increase in photosynthesis and stomatal conductance when Shiraz
vines were heated for short periods Moreover in some other researches sugar accumulation was not
influenced by temperature increase (Yamane et al 2006 Greer and Weston 2010)
In general tartaric acid concentration decrease after veacuteraison is mainly due to a dilution effect since
berry volume increase and amount of tartrate remains constant So far no enzymes degrading
tartaric acid have been ever found in grape In contrast the decrease in malic acid amount at the
beginning of ripening is associated with respiration and enzyme degradation as well as dilution
effect Malic acid may be therefore transformed to hexoses or used as energy source Metabolic
changes occurring during grape berry development (Taureilles-Saurel et al 1995) together with
light and temperature are the main parameters controlling the malate synthesisdegradation rate
Grape berries malic acid concentration at harvest is negatively correlated with temperature during
the ripening period It has been demonstrated that the optimum temperature range for acids synthesis
is between 20degC and 25degC and that with increasing temperature synthesis of malic acid decrease
and catabolic rate accelerate (Kliever et al 1967) These results are in accordance with the results of
this study and what was observed on the effects of elevated temperature in Cabernet Franc and
Chardonnay grapes where the pH increased and TA decreased Also the effects of higher
temperature induced by veraison defoliation had similar effects on pH and titratable acidity due to
the malic acid degradation (Guidoni et al 2004 Pastore 2011)
37
Fig 11 The trend of oBrix titratable acidity and pH of grapes grown under high (HT) and low (LT) temperature
conditions during ripening of the years 2010 and 2012
34 Biosynthesis of flavonoids
34 1 Anthocyanins accumulation during ripening
In both years the anthocyanin level in the skin of Sangiovese (Fig 12) started to increase after
veraison until harvest in both treatments Nonetheless in HT berries was significantly reduced
respect to LT ones As an illustration in 2010 the level of total anthocyanin at harvest was decreased
about 65 in the skin of the grapes grown under high temperature conditions as compared to LT
and at the harvest time of the year 2012 this reduction was 50 In agreement with the results on
other grape varieties (Darkridge grape Cabernet Sauvignon Tokay Japanese table grape Kyoho
Mori et al 2005 amp 2007 Kliewer amp Torres 1972 Tomana et al 1979) we found that in
38
Sangiovese high berry temperature (over 35degC) after veraison prevented anthocyanin formation in
grapes and greatly reduced the coloration as compared to fruits ripened at lower temperatures
According to HPLC analysis of the both years as expected the major individual anthocyanin in the
berry skin of both LT and HT treatments was malvidin-3-glucoside (Fig 12)
Anyway no differences in anthocyanin profiles were recorded at harvest between HT and LT grapes
in 2010 (Table 5) In 2012 at harvest the percentage of malvidin -3-G was higher in LT compared to
HT (Table 5)
Previous studies on Cabernet Sauvignon reported the higher thermal stability of malvidin-
derivatives anthocyanins due to the high level of methoxylation and acylation (Mori et al 2007
Romero and Bakker 2000 Morais et al 2002) but it is in contrast to our findings in this respect on
Sangiovese It has to be noticed that in Sangiovese the anthocyanin composition is quite different
from Cabernet Sauvignon and it is characterized by the high level of cyanidin-3G and by the
absence of p-coumarated and acetated malvidin derivatives anthocyanins
From the data of our two-year trials it is not possible to confirm the differences in thermal stability
of the five monoglucoside anthocyanins of Sangiovese based on their chemical structure And by
assessing solely the anthocyanins quantity and profile it was not possible to understand if the
reduction of anthocyanins under high temperature is due to biosynthetic activity reduction or to a
mechanism of anthocyanins degradation Therefore additional analyses were required in order to
obtain more comprehensive information about this issue
39
Fig 12 The trends of total and individual anthocyanins concentrations in the skin of Sangiovese berries grown under high (HT)
and low(LT) temperature conditions during ripening in the years 2010 and 2012
40
Table 5 The anthocyanin profiles at harvest in the skin of Sangiovese berries grown under high (HT) and low (LT)
temperature conditions during ripening in the years 2010 and 2012
Anthocyanin profile at harvest
Malvidin-3-G Petunidin-3-G Delphinidin-3-G Peonidin-3-G Cyanidin-3-G
2010 LT 36 13 11 18 22
HT 41 13 11 18 17
ns ns ns ns ns
2012 LT 43 14 11 16 16
HT 33 16 14 16 21
ns ns ns ns
34 2 Flavonols accumulation during ripening
In the both years the levels of flavonols in HT and LT berries increased gradually after veraison
and significant decrease was observed in the level of total and individual flavonols in HT berries as
compared to LT ones in 2012 (Fig 13)
In general the highest level of flavonols in grapes was found at flowering followed by a decrease as
the grapes increased in size Subsequently a significant level of flavonol biosynthesis is in general
observed during berry development and the greatest increase in flavonols per berry can be detected
3-4 weeks post-veraison (Downey et al 2003)
Flavonols accumulation in wine grape tissues has been studied extensively While several authors
reported a solid correlation between fruit light exposure and flavonol glucosides content (Price et al
1995 Haselgrove et al 2000 Spayd et al 2002) the effect of temperature on flavonol synthesis is
not understood completely Spayd et al (2002) and Mori et al (2005) did not observe any effect of
temperature treatment on flavonol synthesis To the contrary the inhibitory effect of high
temperatures on flavonol was also reported by Goto-Yamamoto et al (2009) Since in our research
we excluded the effect of different light exposure between the two treatments the lower
accumulation of flavonols in HT berries is probably due to a regulatory mechanism which rules the
anthocyanins response to high temperature condition
41
Moreover the analyses of each flavonol compound at harvest (quercetin kaempferol and myricetin
showed as expected that quercetin has the highest percentage The flavonols profiles at harvest in
the skin of Sangiovese berries grown under high and low temperature conditions during ripening
were similar in the year 2010 but it was significantly different among the treatments in 2012 (Table
6)
Fig 13 The trends of total and individual flavonols concentrations in the skin of Sangiovese berries grown under high
(HT) and low (LT) temperature conditions during ripening in the years 2010 and 2012
42
Table 6 The flavonols profiles at harvest in the skin of Sangiovese berries grown under high (HT) and low (LT)
temperature conditions during ripening in the years 2010 and 2012
Flavonols profile at harvest
Quercetin Kaempferol Myricetin
2010 LT 746 68 186
HT 735 75 189
ns ns ns
2012 LT 668 36 296
HT 642 26 332
34 3 Tannins accumulation during ripening
Tannins assessment was done in 2010 In this trial regardless from the treatments the amount of
total and individual tannins of seed and skin decreased generally from veraison to harvest This
result is in accordance with the previous works conducted by Harbertson et al (2002) Adams
(2006) and Kennedy et al (2001) From this research emerges that the two temperature regimes did
not affect the tannins branch of flavonoid biosynthesis This is comprehensible considering that
tannins are accumulated very early in berry development and the decline in their concentration from
veraison to harvest only reflects the quantitative changes that take place during berry ripening
(decrease of the tannins concentration in proportion to berry growth)
43
Fig 14 The trends of total and individual tannins concentrations in the berry seed and the skin of Sangiovese berries
grown under high (HT) and low (LT) temperature conditions during ripening in 2010
44
35 Gene expression assessment
In the present study the expression of some genes involved in the general flavonoid biosynthetic
pathway (PAL F3rsquoHb F3rsquo5rsquoHk F3rsquo5rsquoHi DFR LDOX) and the specific genes for anthocyanins
(UFGT and VvMYBA1) flavonols (FLS) and tannins biosynthesis (LAR BAN) were studied in
berries grown under two different temperature regimes (Fig 15)
In HT berries a strong reduction of anthocyanins and flavonols concentration and no effect on tannin
biosynthesis was observed and this seems to be directly related to the general inhibition of the
expression of flavonoids biosynthetic genes detected in this research (Fig 15) Furthermore it was
interesting to observe that even if the response in terms of total flavonoid accumulation was
comparable in 2010 and 2012 the flavonoid composition and the expression profile of some of the
analyzed genes was quite different between the two years of the experiment (Fig 15 Fig 16 Table
5 and 6)
The profile of PAL gene expression was mainly similar in the both years starting to increase in the
both treatments about 15 days after veraison PAL gene seemed to be repressed by high temperature
as a considerable higher level of expression in LT berries in respect to the HT ones was recorded in
both years about 37 days after veraison even if in 2010 it was not significantly different between the
two treatments This result is in agreement with many papers in which a direct correlation between
enhanced flavonoid accumulation (in particular anthocyanins) and increase in PAL gene expression
is reported (Pastore et al 2011 Ageorges et al 2006 Ban et al 2003 Roubelakis-Angelakis and
Kliewer 1986)
F3rsquo5rsquoHs and F3rsquoHs are versatile enzymes that are able to accept several phenylpropanoid substrates
and competitively control the synthesis of cyanidin- and delphinidin-flavonoid derivatives Two
isoforms of F3rsquoHs have been detected in grapevine genome until now (Castellarin et al 2006) In
this research the transcription of F3rsquoHb showed different profile of expression between the two
years of the trial In fact the transcription level of F3Hb was not affected or even induced by high
temperature 20 days after veraison in 2010 but we found exactly an opposite result in 2012 where
in LT berries a significant increase in F3rsquoHb expression was recorded 33 days after veraison in
comparison to HT
Studying the expression of F35Hi and F3rsquo5rsquoHk genes we observed that they were affected by high
temperature during ripening in both years showing similar transcription profiles Starting from full
veraison when all berries have turned red F3rsquo5rsquoHi expression increased in LT berries reaching a
maximum from one to two weeks after veraison in both 2010 and 2012 Also F3rsquo5rsquoHk expression
showed an increase in LT berries about 7 days after veraison in 2010 in comparison to HT and a
strong enhancement on F3rsquo5rsquoHk expression was observed in LT berries in 2012 (Fig 15) Sixteen
45
copies of F3rsquo5rsquoHs are present in the grapevine genome (Falginella et al 2010) suggesting a possible
role for each of them in different developmental and environmental conditions
The different patterns of expression observed for F3rsquoHb and F3rsquo5rsquoHs could suggest that the former
may be less sensitive in comparison to the latter to critical temperature conditions Considering that
the berry temperature in HT tunnel was higher in 2012 than 2010 (Table 2) it seems that F3rsquoHb is
able to tolerate thermal stress when temperature higher than 35degC are imposed for short periods as
in 2010 whereas in 2012 when HT berries spent more than two-fold hours at temperature higher
than 35degC in comparison to 2010 the F3rsquoHb expression is repressed From this study emerges that
at transcriptomic level the intensity and the extent of thermal stress could not affect in equal manner
the transcription of the gene that preside over the 3rsquo4rsquo- and 3rsquo4rsquo5rsquo-OH flavonoid biosynthetic
pathway in Sangiovese grape berry
In this research DFR and LDOX genes exhibited different patterns of expression in 2010 and in
2012 reaching maximum values in LT compared to HT 5 days after veraison in 2010 and 28 days
later in 2012 thus showed an expression pattern independent from the trend of anthocyanins
flavonols and tannins accumulation and from the timing of the temperature increase application
Our results are in agreement with previous findings reported that the expression of neither DFR nor
LDOX was as strongly correlated as UFGT and VvMYBA1 with anthocyanin content (Castellarin et
al 2007) and it is comprehensible if we consider that they can produce substrates for other branches
of flavonoid biosynthesis
Instead of that a strong correlation was found as expected in the expression of UFGT and of its
main transcription factor VvMYBA1 with the higher anthocyanins accumulation in LT vines
comparing to HT
Flavonol synthesis involves several genes encoding flavonol synthases (FLS) which are biosynthetic
enzymes converting dihydroflavonols to flavonol (Downey et al 2003) In both years the
expressions of FLS gene were similar between LT and HT berries in the early stages suggesting a
small effect of high temperatures on the transcription of this gene during veraison However FLS
started to be significantly higher in LT berries from mid of ripening and in 2012 a similar trend was
registered excepted at harvest when a significantly higher expression of FLS was registered in HT
(Fig 16)
Among the enzyme involved in tannins synthesis leucoanthocyanidin reductase (LAR) produces
catechin while anthocyanin reductase (BAN) converts cyanidin and delphinidin into epicatechin
and epigallocatechin respectively (Xie et al 2003 and Adams 2006 Fig 17) Bogs et al (2005)
found that in grape LAR is encoded by two closely related genes (LAR) whereas BAN enzyme is
46
encoded by a single gene (Fig17) As LAR1 appeared to be seed specific (Bogs et al 2005) only
LAR2 and BAN were analyzed in this study in 2010 In general timing and expression of BAN and
LAR2 genes is consistent with the accumulation of proanthocyanidins in the berry (Adams 2006)
This was further confirmed in this research where tannins analyses conducted on berry skin in 2010
showed no differences in terms of concentration and composition and as expected no differences
were found in the transcription of LAR2 and BAN during ripening
To better understand how the differences in gene expression could have or not influenced the
anthocyanins and flavonols composition also the timing and the coordination of flavonoid
biosynthetic genes has to be considered separately for the two years
In 2010 we detected a lack of variation in anthocyanins flavonols and tannins composition
following LT and HT treatment Following the treatment a coordinated transcription of F3rsquoHb
F3rsquo5rsquoHi F3rsquo5rsquoHk DFR LDOX UFGT and MybA1 was detected in LT berries which all reached a
maximum of expression 7 days after veraison (DAV) In HT the situation was quite different as for
F3rsquoHb and LDOX we found the highest expression 20 DAV when the transcription of DFR and
UFGT was already strongly reduced This shift and lack of synchronization could have hampered in
2010 the increase in the accumulation of 3rsquo4rsquo-OH flavonoids derivatives in comparison to LT
nevertheless the stability of F3rsquoHb transcripts detected in HT berries
In 2012 we found a statistically significant increase in malvidin and quercetin percentages in LT
berries in comparison to HT The concomitant stronger upregulation of F3rsquo5rsquoHi and F3rsquo5rsquoHk
starting from veacuteraison in LT compared to HT berries has to contribute to the increase in malvidin
concentration in LT berries in the second year of the trial Moreover in the same stage of berry
ripening also an increased expression of F3rsquoHb was recorded in LT berries and therefore the
biosynthesis of 3rsquo4rsquo-OH flavonoids should have been enhanced too Differently from what was
previously discussed for 2010 DFR and LDOX maximum expression was delayed in comparison to
the recorded peak of transcription for UGFT and VvMybA1 in both treatments It has to be
considered that FLS directly competes for its substrates with the enzyme DFR because they share
dihydroflavonols as the common substrates On this base probably there was a competition between
the biosynthesis of flavonols and anthocyanins in the both treatments but that contemporary
increase in the expression of F3rsquoHb DFR and FLS led to the rise of quercetin accumulation in LT
berries as compared to HT
47
Fig 15 Mean normalized expression of the genes involved in flavonoid biosynthetic pathway in berries grown under
high(HT) and low(LT) temperature conditions during ripening in 2010 and 2012
48
Fig 16 Mean Normalized expression of the FLS genes involved in flavonol biosynthesis in berries grown under
high(HT) and low(LT) temperature conditions during ripening in 2010 and 2012
Fig17 The mean normalized expressiom of the LAR and BAN genes in berries grown under high (HT) and low (LT)
temperature conditions during ripening in 2010
36 Activity of biosynthetic enzymes PAL and UFGT
In general the activity of PAL enzyme in both LT and HT berries increased gradually during
ripening but was considerably lower in HT plants in all sampling data from the end of full veraison
to harvest (Fig 18) This result is in agreement with the higher expression of PAL genes assessed in
LT berries
Using delphinidin and cyanidin as substrates in both years the activity of UFGT enzyme showed an
increasing trend from the end of full veraison to harvest in both LT and HT berries (Fig 19)
nonetheless a strong reduction was observed in HT plants compared to the LT ones during ripening
Also irrespective from thermal conditions UFGT activity at veraison was higher for cyanidin
compared to delphinidin as substrate (Fig 19) and this could be related to earlier expression of the
F3rsquoH genes (starting after full bloom) compared to the expression of the F3rsquo5rsquoH genes which begin
after veraison Basically these results confirmed the negative effects of high temperature on
anthocyanin biosynthesis at least for PAL and UFGT enzyme activities which showed a strong
correlation with anthocyanin concentration and confirmed to be the key enzymes of anthocyanin
biosynthesis pathway (Hrazdina et al 1984 Mori et al 2005 Boss et al 1996)
49
Fig 18 The trends of PAL activity (in one minute) in the skin of Sangiovese berries grown under high (HT) and low(LT)
temperature conditions during ripening in the years 2010 and 2012
Fig19 The trends of UFGT activity (Using cyanidin and delphinidin as substrate) in the skin of Sangiovese berries
grown under high (HT) and low(LT) temperature conditions during ripening in the years 2010 and 2012
50
37 Hypothesis for anthocyanin degradation
371 POD candidate genes
From the research conducted by Fasoli et al (2012) it can be realized that there are many different
isoforms of Peroxidases gene in different organs of grape As to recent researchers five POD
isoforms (labeled POD1 POD2 POD3 POD4 and POD5) are showed to be more expressed in
berry skin from veraison to harvest in Sangiovese (Pastore 2010) In addition to these 5 isoforms
another one (POD6) which was reported by Mori et al (2007) was assessed in this thesis
In 2010 Real Time experiment revealed that among these 6 genes that were studied in the berry skin
of Sangiovese only the expression of the genes POD1 and POD3 seem to be linked to the
temperature (Fig 20) The expression of POD1 and POD3 in HT detected to occur in different
patterns during the ripening but POD 1 was expressed with a similar trend in both years
Fig 20 Mean Normalized expression of the selected POD genes involved in anthocyanin biosynthetic pathway in the in
berries grown under high (HT) and low(LT) temperature conditions during ripening in 2010 and 2012
51
372 Activity of enzymes involved in anthocyanin degradation PODs and PPOs
In the both years the PODs activity during ripening showed a significant increase in HT berries
compared to LT (Fig 21) supporting the hypothesis of anthocyanin degradation in response to high
temperature (Vaknin et al 2005 amp Mori et al 2007)
It has been reported that peroxidase is involved in the active anthocyanin degradation of Brunfelsia
calycina flowers (Vaknin et al 2005) and in presence of H2O2 in the vacuoles of grape cells
(Calderon et al 1992) Our findings are coherent with other papers since heat stress can contribute
to H2O2 accumulation in plant tissue (Date et al 1998) and so PODs-anthocyanins reaction may act
as a scavenging mechanism for H2O2 and plant cell detoxification in high temperature conditions
(Yamasaki et al 1997 Pourcel at al 2007)
It is interesting to note that in this experiment we could not find any PPOs activity likely due to the
plastidial localization of this enzyme (Dry amp Robinson 1994) and so we demonstred the lack of
direct involvement in active anthocyanin degradation under high temperature conditions in Vitis
vinifera
Fig 21 The trends of PODs activity in the skin of Sangiovese berries grown under high (HT) and low (LT) temperature
conditions during ripening in the years 2010 and 2012
52
4 CONCLUSION
In the present study we examined the contents of anthocyanins flavonols and tannins the
expression of some biosynthetic genes involved in their synthesis and the activities of some related
enzymes in grape berries of Sangiovese cv grown under different thermal conditions in two
different years
Anthocyanins and flavonols accumulation in Sangiovese cv revealed to be very sensitive to high
temperature (showing a reduction over 50 in total anthocyanin concentration at harvest) Several
mechanisms such as a general inhibition of the expression of flavonoids biosynthetic genes and of
the activities of some flavonoids biosynthetic enzymes (PAL and UFGT) associated with a
stimulation of some putative anthocyanin degradation enzymes (PODs) showed to be involved in the
inhibitory effect of high temperatures on anthocyanin accumulation A similar mechanism may be
supposed for flavonols degradation
This study showed that the temperature regimes after veacuteraison have different effects on each
flavonoid group in grape berry because in conterary to anthocyanins and flavonols that were
reduced in the skin of grapes ripened under high temperature environments after veraison seed and
skin tannins were not affected by the same conditions
Furthermore the warmer condition verified in 2012 compared to 2010 and the different flavonoid
composition and expression profile of some of the analyzed genes in the two years may suggest a
different sensitivity to high temperature of some genes involved in anthocyanins biosynthesis
53
Chapter one Second Part
Recognition of putative POD genes involved in anthocyanins degradation
under high temperature condition
54
1 INTRODUCTION
Petunia has played a central role in transformation research since the earliest reports of plant
transformation It was a key model system when the first definitive accounts of Agrobacterium-
mediated transformation and direct DNA transfer established the transfer and expression of foreign
genes in plants Petunia subsequently played an important role in elucidating many of the
characteristics of plant transformation One of the key reasons for the importance of Petunia in plant
transformation research has been the selection for andor identification of genotypes well suited to
growth and regeneration in culture Ease of transformation coupled with other favorable biological
characteristics ensures that Petunia will remain a valuable model system for studies of gene
function in plants (Conner et al 2009) Moreover Petunia hybrida is one of the classical subjects of
investigation of plants pigmentation in which the pathway of anthocyanin biosynthesis has been
analyzed genetically and biochemically (Meyer et al 1987 Quattrocchio et al 2006) Although the
information about Petunia sequenced genome is somehow limited it can be still used as model
species in this important field of study for the obvious ease of detecting mutants for this pathway It
can also be actively employed in complementation studies with genes from other species such as
grape (Venturini 2009)
Therefore in the second phase of this trial regarding to the results obtained from the assessment of
the expression of the genes involved in anthocyanin degradation at elevated temperature gene
transformation was conducted with different isoforms of peroxidases genes from Vitis vinifera (cv
Sangiovese) to Petunia hybrida with the aim of recognizing the most effective candidate genes for
anthocyanins degradation under high temperature
2 MATERIALS
21 Gene selection
In the first phase of this trial the expressions of 6 different isoforms of Peroxidases genes that were
showed to be more expressed in berry skin from veraison to harvest (Fasoli et al 2012 Mori et al
2007) were assessed via Real Time-PCR subsequently according to that results 3 different
isoformes were selected to transform Petunia hybrida
22 Escherichia coli strain and culture media
The DH10B strain was provided by Invitrogenreg and features the mutations recA1 endA1 presence
of the gene lacZM15 and high transformation efficiency Moreover it didnrsquot carry any antibiotic
resistance genes
55
221 Luria-Bertani (LB) medium
Component Concentration (gl)
Yeast extract 5
Tryptone 10
NaCl 10
Agar 15
Final pH 75
The medium was sterilized in an autoclave (121degC for 20 minutes 2 atm) After sterilization
antibiotic (kanamycin) was added to the solution for a final concentration of 50 mgl
222 SOC medium
Component Concentration (gl)
Yeast extract 5
Tryptone 20
After sterilization in an autoclave (121degC for 20 minutes 2 atm) glucose and salts sterilized by
filtration (filters with ores of 02 m diameter) were added to the solution at the following
concentrations
Component Concentration
NaCl 10 mM
KCl 25 mM
Glucose 20 mM
MgCl2 10 mM
MgSO4 10 mM
Final pH 68-70
56
23 Agrobacterium tumefaciens strain and culture media
For Petunia hybrida transformation the super virulent EHA105 Agrobacterium tumefaciens strain
was chosen (Hellens et al 2000) The bacteria possess a disarmed helper Ti plasmid (pTIBo542ΔT-
DNA) encoding the necessary sequences for the transfer of the T-DNA region which is carried by a
second shuttle plasmid the pK7WG20 The two plasmids are defined as binary vectors The cells
containing both plasmids can be selected for with the use of the following antibiotics
Antibiotic Concentration Resistance
Rifampicin 50 mgl Genomic
Streptomycin 300 mgl pK7WG20
Spectinomycin 100 mgl pK7WG20
231 YEB Medium
Component Concentration
Yeast extract 1 gl
Tryptone 5 gl
Beef extract 5 gl
Sucrose 5 gl
MgSO4 5 Mm
Agar 15 gl
Final pH 75
The medium was sterilized in an autoclave (121degC for 20 minutes 2 atm) After sterilization
antibiotics (streptomycin 300 mgl spectinomycin 100 mgl and rifampicin 50 mgl) were added to
the solution for selective mediums
57
24 Vectors
241 pENTRtradeD-TOPOreg (2580 bp)
Feature Benefit
rrnB T1 and T2 transcription terminators Protects the cloned gene from expression by vector- encoded
promoters thereby reducing possible toxicity in E coli
attL1 and attL2 sites
Allows sequencing in the sense orientation Bacteriophage λ-derived
DNA recombination sequences that allow recombination cloning of the
gene of interest from a Gatewayreg expression clone or attB PCR
product (Landy 1989)
TOPOreg Cloning site directional Allows a fast and directional cloning
M13 forward and reverse primer sequences Allow sequencing of the insert
Kanamycin resistance gene Allows selection of the plasmid in E coli
pUC origin Allows high-copy replication and maintenance in E coli
Fig 22 a scheme of the pENTRtradeD-TOPOreg vector
242 pK7WG20
A scheme for vector pk7WG20 is presented in Fig 23 It is a binary vector used as destination
vector in the Gatewayreg technology The T-DNA comprises the marker gene nptII which confers
58
resistance to kanamycin The cloning of an exogenous genes in this position implies an LR
recombination between the 35S CaMV constitutive promoter and the terminator 35S
Fig 23 Schematic representation of the pK7WG20 vector
25 Primers
The Primers pairs for POD1 to POD5 were newly designed on the original DNA sequences to
amplify 150ndash250 bp gene fragments and the Primers pairs for the POD6 was referred to Mori et al
(2007) (Table 7)
Subsequently according to the results of those expressions 3 different isoformes (POD 1 POD 3
and POD 5) were selected to transform Petunia hybrida
59
(Table 7) (POD 1-6) The primers of the selected isoforms of the Peroxidases genes for RT-PCR and (POD 1-3
cloning) The primers of the selected isoforms of the Peroxidases genes for cloning
primer Forward primer Reverse
POD 1 5-TCTGAGTAAGAGCCCACACACTCT-3 5-GAGACCTGAGCAGATAAATACAAAAATAAA-3
POD 2 5-AAAGTTGTTTGGCTGTGG-3 5-AATCCCTCCAAACAATCA-3
POD 3 5-TGCTCTAAATGCCTGAAAAATG-3 5-ATCATATAGAAAAGTGACAGCAACCT-3
POD 4 5-CAACTTCACACCAACGGGAAA-3 5-GCAGCTGAGCAAGAAATGCTT-3
POD 5 5-TCGGTGAGGAACTCCGATA-3 5-AGCTTCCTTGTCCTCTTCCA-3
POD 6 5-AACTTGAGACACAACAGCATAAATAAATC-3 5-AGGACCAAATCACAGGATGATAAAG-3
POD 1 cloning 5-cacc atg gca ttg atc ctc ttt tc-3 5-cta gtt taa ggc atc aca cc-3
POD 3 cloning 5-cacc atg tct ctt ctc gtt ctt ctc-3 5-tta aga ttc cag gag tgt gtc-3
POD 5 cloning 5-cacc atg aga aaa ctt atg gag gc-3 5-tta aag ttc agc aga agc ttc-3
26 Plant materials
Petunia hyrida line W84xV30 (P axillaris X P inflata) has become an attractive system for
genetic molecular and complementation studies as it possesses many desirable characteristics
colored flowers whose dimensions (5-6 cms) allow for relative ease of dissection and separation of
floral organs rapid growth cycle (2-3 months from seeds to full bloom) ease and rapidity of genetic
transformation via infection with disarmed Agrobacterium tumefaciens
This species has a limited number of chromosomes (n=7) and a small genome (12 times 106 kb) In
particular the line W84 is not capable of expressing a Glutathione S-transferase PhAN9 (Alfenito et
al 1998) and hence to accumulate anthocyanins in the vacuole leading to a fading color phenotype
However the W84 line had proved difficult to transform in previous experiments with the GST4
gene To overcome this problem a new Petunia hybrida line was generated by crossing W84 with
the V30 cultivar and recovering the mutated offspring after self-crossing This W84xV30 line was
used in all subsequent experiments
The peroxidases genes were isolated from Vitis vinifera (cv Sangiovese) (the plant materials used in
the first part of this chapter)
60
Fig 24 Petunia hyrida ndash line W84xV30
3 METHODS
After the PCR amplification of our selected genes with proof-editing PFU enzyme DNA
purification was done directly from the PCR product and used for the TOPOregCloning reaction
following the protocol provided by Invitrogen kit
31 Transformation of Escherichia coli by heat shock
After the TOPOregCloning reaction the DNA was added to the E coli DH10B competent cells and
the mixture left in ice for other 30 minutes Cells were incubated at 42degC without agitation for 30
seconds and then rapidly transferred into ice 250 microL of SOC medium provided by Invitrogen kit
kept at room temperature was added to the culture and the re-suspended cells were incubated at
37degC with agitation (200 rpm) for 1 hour 100- 200 l of the solution was placed on to a solid LB
medium and left at 37degC overnight
32 Preparation of competent cells of A tumefaciens
To obtain Agrobacterium tumefaciens strain EHA105 cells competent for the transformation by
electroporation a single colony was inoculated into 3 mL YEB medium containing Rifampicin (50
mgl) and incubated at 28degC overnight with vigorous shaking When the culture reaches the
exponential growth phase (usually after 12 hours characterized by an OD600 equal to 09-10) 15
mL of solution was sampled and centrifuged at 14000 rpm for 1 minute at room temperature The
pellet thus obtained was washed to eliminate antibiotic and re-suspended three times in 500 l cold
and sterile glycerol 10 (vv) at each step the solution was centrifuged at 14000 rpm for 1 minute
at room temperature Finally the pellet was re-suspended in 40 l of cold and sterile glycerol 10
(vv) The cells were ready to be electroporated
61
33 Transformation of A Tumefaciens by electroporation
A Bio-Rad device for electroporation was used for this experiment calibrated at 25 F 200 and
25 kV 1 or 2 microL of DNA plasmid (20 ng) was re-suspended in 40 l of competent cells The
operation was performed in ice The mix was transferred into a pre-cooled electroporation cuvette
the cuvette was then inserted into the Bio-Rad device and subjected to a pulse of 25 kVcm at 200
Ohm immediately after the pulse 1 mL LB without antibiotics was added in sterile conditions The
suspension was recovered and grown in a propylene tube with agitation for one hour at 28degC so that
the cells can express the resistance gene The cells were placed in 100 ndash 200 l aliquots on to YEB
solid medium containing Spectinomycin (final concentration 100 mgl) Rifampicin (final
concentration 50 mgl) and Streptomycin (final concentration 300 mgl) The Petri dishes were
incubated at 28degC for two days The transformation efficiency of this method is 8x10⁵ cfug DNA
34 Colony PCR
To detect bacterial recombinant clones which carry a fragment of interest it is possible to perform
the colony PCR consists of a single bacterial colony for a final volume of 20 μl A sterile tip is used
to sample the colony from the solid culture medium and dissolved in the reaction mix
35 Plasmid DNA extraction
To purify the plasmid DNA of colony which resulted positive by PCR bacteria were put in 5 mL of
liquid LB with the correct antibiotic to grow overnight at 37degC with agitation The extraction of
DNA plasmid was carried out on the base of ldquoQIAprepreg Spin Miniprep Kitrdquo (Qiagen) following the
manufacturersquos instruction
36 Purification of PCR products
To purify the PCR products the protocol of the kit provided by Promega Wizardreg SV Gel and PCR
clean-up system was performed
37 GATEWAYreg cloning system
The Gatewayreg Technology (Invitrogen) is based on the bacteriophage lambda site-specific
recombination system which facilitates the integration of lambda into the E coli chromosome and
the switch between the lytic and lysogenic pathways This recombination method facilitates transfer
62
of heterologous DNA sequences (flanked by modified att sites) between vectors Two recombination
reactions constitute the basis of the Gatewayreg Technology
Site Length Function
attL 100bp Entry clone Entry vector
attR 125bp Destination vector
38 LR Recombination reaction
LR Recombination reaction was performed following the protocol provided by Invitrogen
This reaction facilitates recombination of an attL substrate (entry clone) with an attR substrate
(destination vector) to create an attR-containing expression clone (see diagram below)
Fig 25 a scheme of the Gatewayreg cloning system
Componente Volume
Entry clone (100 ηg) 1 microL
Destination Vector (150 ηg) 1 microL
5X LR Clonase buffer 2microL
Sterile water 6 microL
63
The Entry-clone vectors had been generated with independent ligation reactions in the pENTRTM
D-
TOPOreg vector containing the attL1 and attL2 sites It was therefore possible to perform directly the
recombination reaction with the destination vector pK7WG20
The solution is incubated for 1 hour at 25degC then 1 μl of the Proteinase K enzyme (Invitrogen) is
added to the mix which is placed for an additional 10 minutes at 37degC At this point it is possible to
perform the transformation of the competent E coli DH10B cells
39 TOPO cloning reaction
TOPOreg cloning reaction was performed following the Invitrogen protocol for electro-competent E
coli cells
Reagents Chemically Competent E coli Electrocompetent E coli
Fresh PCR product 5 to 4 μl 05 to 4 μl
Dilute Salt Solution (14) -- 1 μl
Salt Solution 1 μl --
Sterile Water add to a final volume of 5 μl add to a final volume of 5 μl
TOPOreg vector 1 μl 1 μl
Final volume 6 μl 6 μl
The mix reaction was incubated in ice for 20 minutes then the cells were incubated at 42degC without
agitation for 30 seconds and then rapidly transferred into ice followed by the procedure of
Transforming One Shotreg TOP10 Competent Cells provided by Invitrogen kit
310 RNA extraction and Real time PCR
Real-time PCR was performed to evaluate the expression of six different isoforms of peroxidases
genes for five selected stages of grape berry ripening from beginning of veraison to the end of
harvest For each sampling 3 biological replicates were analyzed Total RNA was isolated from 200
mg of the powdered berry skin tissue using SpectrumTM
Plant Total RNA kit (Sigma-Aldrich St
Louis MO USA) following the manufacturers protocol One microL of each RNA sample was
measured spectrophotometrically to determine RNA quantity and 260280 and 260230 ratio using a
64
NanoDrop1000 Spectrophotometer (Thermo Fisher Scientific Wilmington DE USA) Total RNA
was treated with 1 U microg-1 RQ1 DNase (Promega Milan Italy) First-strand cDNA was synthesized
using 1 microg of RNA 1microL (dT)15 primer (500 microgmL) and 1 U of GoScripttrade reverse transcriptase
(Promega) Quantitative RT-PCR was carried out on a Step One Plustrade (Applied Biosystems Foster
City California USA) Each reaction (10 microL) contained 188 nM of each primer 2microL of diluted
cDNA (125) 5microL U of Power SYBRreg Green PCR Master Mix (Applied Biosystems Foster City
California USA) Thermal cycling conditions were 95 degC for 10 min followed by 95 degC for 15 s 55
degC for 1 min for 40 cycles followed by a melting cycle which contains 95 degC for 15 sec 60 degC for 1
min and 95 degC for 15 sec Each cDNA sample was analyzed in triplicate Gene transcripts were
quantified as reported by (Pastore 2010) The Primers pairs for POD1 to POD5 were newly
designed on the original DNA sequences to amplify 150ndash250 bp gene fragments and the Primers
pairs for the POD6 was referred to Mori et al (2007) (Table 7)
311 Stable transformation of Petunia hybrida
The protocol is applied under a laminar flow cabinet to ensure sterility Young apical leaves are
harvested and kept in water to avoid dehydration They are subsequently sterilized with a solution of
05 sodium hydrochloride in which they are dipped for 10 minutes followed by 5 washings of 10
minutes each in bi-distilled water The tips borders and petioles are removed with a sterilized
scalpel while the rest of the leaf is cut in three sections The leaf pieces are immersed in a solution
110 of overnight grown Agrobacterium tumefaciens transformed with a selected gene for 20
minutes so that the bacteria could attach to the explants after which they are transferred to a Petri
dish containing solidified Medium I (supplemented with Folic acid (1 mgmL) NAA (01 mgmL)
6-BAP (2 mgmL) without antibiotics) Each Petri dish can hold up to 10 discs The Petri dishes are
sealed and stored in a growth chamber at 25degC under day-night regime (with a long day light period
of 16 hours of light) After 2-3 days the explants are transferred into a new Petri dish filled with
medium II which contains two antibiotics 500 mgl carbenicillin to stop Agrobacterium growth and
300 mgl kanamycin to select the transformed explants The explants were transferred to fresh
selective plates each 2-3 weeks and the explants were constantly checked against contamination
with molds or other pathogens After about 8 weeks the shoots regenerated from the calluses were
removed and transferred onto the rooting medium (medium III supplemented with 500 mgl
carbenicillin and 50 mgl kanamycin) After the roots were sufficiently developed the medium was
washed away from the roots were put in jiffy pots and were grown in greenhouse Petunia hybrida
plants grow and flower in about 2 to 3 months
65
3111 Medium I
Component Concentration
Sucrose 20 gl
Glucose 10 gl
MS-macro amp micro elements with Gamborg B5 vitamins (Duchefa M0231) 44 gl
Plant Agar 8 gl
The pH is adjusted to 57-59 with HCl and KOH The medium is sterilized in an autoclave for 20
minutes and after it has reached 60deg C the following hormones are added
Component Concentration
Folic acid 1 mgl
6-BAP 2 mgl
NAA 01 mgl
3112 Medium II
Medium II is obtained from Medium I with the addition of the antibiotics needed for the eradication
of Agrobacterium tumefaciens and the selection of transformed calluses They are as thermolabile as
the phytohormones and must therefore be injected in the medium only after it has reached a
temperature lower than 60deg C
Component Concentration
Carbenicillin 500 mgl
Kanamycin 300 mgl
66
3113 Medium III
The composition of Medium III is identical to that of Medium I but without the addition of
phytohormones Also the following antibiotics are added to the medium
Component Concentration
Carbenicillin 500 mgl
Kanamycin 50 mgl
312 Agro-infiltration of petunia petals
Agro-infiltration represents recent advancements in Petunia transformation This is a technique for
transient gene expression and the development of intragenic vectors to affect gene transfer without
the integration of ldquoforeignrdquo DNA
One mL of the Agrobacterium culture grown overnight for inoculation of 25 mL of LB liquid
medium was added to 300 μgmL Streptomycin 100 μgmL Spectinomycin 20 μM Acetosyringon
and 10 mM MES and was incubated to grow overnight at 28 o
C at 180 rpm After centrifugation for
20 minutes at 12000 rpm the pellet was re-suspended with 15 mL of the buffer below After adding
100 μl of the inoculums to 900 μl of the re-suspending buffer the OD (Optical Density) was
measured spectrophotometrically and the following formula was used for dilution of the inoculums
up to the final volume of 50 mL
3121 Resuspending buffer
Component Concentration
MgCl2 10mM
MES 10mM
Acetosyringone 100 μM
The volume of the inoculums = [05 (The optimal OD) times 50 (The final volume)] divide [(The read OD
via spectrophotometer) times 10]
67
Afterward 100 μM of Acetosyringone was added to the inoculums and the mixture was incubated in
room temperature for 2-3 hours
The bacterial suspension was infiltrated into the upper layer of petals using a 1mL syringe without a
needle Infiltrated flowers were kept at 25 oC for 36 to 48 hours after infiltration
313 DNA extraction from Petunia
The DNA was extracted from a Petunia hybrida leaf disc ground thoroughly in 400 l of extraction
buffer Then the extract was centrifuged and 300 microL of the supernatant was mixed with 300 microL of
isopropyl alcohol After the incubation at room temperature for 15 minutes and centrifugation the
pellet was dried at room temperature under a fuming hood and subsequently re-suspended in 100 microL
of sterile bi-distillated water and incubate overnight in the refrigerator To discard any remaining
impurities the tube was centrifuged again and the supernatant transferred to a new sterile tube
3131 Extraction buffer
Component Concentration
Tris HCl pH 80 200 mM
NaCl 250 mM
SDS 1
EDTA 25 mM
-mercaptoethanol 10 mM
314 PCR of transformed Petunia genomic DNA
PCR amplification was performed on Petunia genomic DNA in a final volume of 20 μl As the
primer forward Promoter 35 S and as the primer reverse the specific primer for ldquoPOD 1cloningrdquo
was used As the negative control the genomic DNA of the Wild type line was used as the template
68
3141 Reaction Mix
Component Stock Volume
Template DNA 1 l
Buffer (containing MgCl2) 10x5x 4 l
Nucleotides 10 mM 04 l
Primers 20 M 04 l
Taq 5000 umL 01 l
3142 Standard thermal cycle
Initial denaturation 94 degC 5rsquo
Denaturation 94 degC 40rdquo
Primers annealing 55degC 40rdquo X 35 cycles
Extension 72 degC 90rsquorsquo
Final extension 72 degC 7rsquo
315 RNA extraction from Petunia hybrida petal
Petunia petals from the young expanded flowers were immediately frozen in liquid nitrogen and
then were kept in the freezer (-80 o
C) until analyses were carried out Total RNA was isolated from
200 mg of the powdered petal using spectrum TM
Plant Total RNA kit (Sigma-Aldrich St Louis
MO USA) following the manufacturerrsquos protocol One microL of each RNA sample was measured
spectrophotometrically to determine RNA quantity and 260280 and 260230 ratio using a
NanoDrop1000 Spectrophotometer (Thermo Fisher Scientific Wilmington DE USA)
316 cDNA synthesis RT PCR reaction
After controlling the RNA via the electrophoresis gel total RNA was treated with 1 U microg-1 RQ1
DNase (Promega Milan Italy) First-strand cDNA was synthesized using 1 microg of RNA 1microL (dT)15
primer (500 microgmL) and 1 U of GoScripttrade reverse transcriptase (Promega) PCR amplification was
69
performed on the derived cDNA for a final volume of 20 μl As the primers once the Primers pair
of actin was used and subsequently for the RT- PCR amplification the specific primers of ldquoPOD
1cloningrdquo (Table 7) were used
3161 Reaction Mix
Component Stock Volume
Template DNA 1 l
Buffer (containing MgCl2) 10x5x 4 l
Nucleotides 10 mM 04 l
Primers 20 M 04 l
Taq 5000 umL 01 l
3162 Standard thermal cycle
Initial denaturation 95 degC 5rsquo
Denaturation 95 degC 30rdquo
Primers annealing 55degC 30rdquo X 35 cycles
Extension 72 degC 20rsquorsquo
Final extension 72 degC 7rsquo
317 Total anthocyanin measurement
Petunia petals from the young expanded flowers were selected in 5 biological replicates for the
transformed plants and wild type line They were immediately frozen in liquid nitrogen ground and
the fine powder was weighted before the extraction of anthocyanins The powder was homogenized
with the solvent mixture of methanol 99 with HCl 1 at the volumes of eightfold of the powder
Then the mixture was sondicated for 20 minutes
This is the act of applying ultrasound energy to agitate particles in a sample It is applied using an
ultrasonic bath All the procedures were conducted at 4 oC After the centrifugation at 12000 rpm
70
for 10 minutes at 4 oC an aliquot of the supernatant was diluted 140 and the total anthocyanin was
quantified spectrophotometrically at 540 nm
318 Heat shock performance
Young petunia flowers in 5 biological replicates for the transgenic plants and wild type line were
selected for the heat shock To carry out this experiment the flowers were cut with a long pedicle
and some small leaves and were placed in a falcon of water They were kept for one hour in the
incubator at 45 oC and transferred subsequently to the room temperature After 30 hours the petals
were frozen in liquid nitrogen ground and the fine powder was weighted to evaluate the activity of
Guaiacol Peroxidases enzyme and the total anthocyanin
319 Guaiacol Peroxidases activity assay
Guaiacol peroxidases was assayed as described by Ushimaru et al (1997) using pyrogallol as the
electron donor for the reaction The plant material was extracted in cold buffer (200 mM sodium
phosphate 5 mM sodium EDTA 1 PVPP pH 70) and incubated on ice for 30 min After
centrifugation at (10000 times g 30 min 4 degC) the desalted supernatant was used for the assay The
reaction mixture (15 mL) included 1140 μl of the 100 mM sodium phosphate buffer pH 70 60 microL
of the 25 mM H2O2 60 mM pyrogallol and 240 μl extract H2O2 and pyrogallol were prepared
fresh just before use Absorbance (λ=430 nm) was taken after 25 min incubation at room
temperature and referred to a blank with no extract added One unit of Guaiacol peroxidases is
defined as the amount of enzyme that catalyzes the oxidation of 1 μmol of pyrogallol per minute
under the conditions described by Chen and Asada (1989) and PODs activity was expressed as kat
g-1
petal fresh weight An absorbance coefficient of 247 mM
-1 cm
-1 was assumed for calculations
4 RESULTS
The aim of this trial is recognizing the most effective candidate genes responsible for anthocyanins
degradation under high temperature conditions during the ripening time Among the candidates for
anthocyanin degradation peroxidases are involved in active anthocyanin degradation in living
tissues (Vaknin et al 2005 Welinder et al 2002) In addition the results obtained from the
enzymatic activity of peroxidases at elevated temperature and the expression of this gene during
ripening supports the hypothesis of its role in anthocyanin degradation On these bases the
technique of gene transformation was conducted with different isoforms of peroxidases genes from
Vitis vinifera (cv Sangiovese) to Petunia hybrida
71
41 Gene selection
From the research conducted by Fasoli et al (2012) it can be realized that there are different
isoforms of Peroxidases gene in different organs of grape that among them only 5 isoforms are
showed to be more expressed in berry skin from veraison to harvest In addition to these isoforms
there was another one which was reported by Mori et al (2007) to be expressed in grape berry
skin
Fig 26 The expression value of the different isoforms of Peroxidases in berry skin from veraison to harvest (V
Veacuteraison MR Mid-ripening R Ripening) Fasoli et al (2012)
As to the expression of these different isoforms by Real time pcr 3 of them were selected for the
transformation to Petunia hybrida
Fig 27 Mean Normalized expression
of the selected POD genes isolated from
berry skin for the transformation to
Petunia hybrida
72
Among all the three isoforms only the POD 1 could be successfully isolated from grape berry skin
and transformed to Petunia
42 The sequence of the POD1 gene
Vv14s0066g01850 (POD1)
ATG GCA TTG ATC CTC TTT TC
TCTACTATTCTTTCTGGGATTAGTGAACCCTTCGGAGTCCAGGTTGAGTGTCAACTACTACCAAAAATCATGCCCAAGA
TTCAGTCAGATCATGCAGGATACCATCACCAACAAGCAAATCACCAGCCCCACCACGGCTGCGGCCACTCTCCGCCTC
TTCTTCCACGACTGCTTCATTGAGGGCTGCGATGCTTCCGTTCTTGTCTCCTCGACCCCCTTCAACGAGGCCGAGCGCGA
TGCCGACATGAACCTCTCCCTCCCCGGCGACGGCTTCGACGTCGTTGTCCGCGCCAAGACCGCCCTCGAGCTCGCTTGC
CCCGGTGTGGTCTCCTGTGCCGACATTCTCGCCGTCGCTACCCGCGATCTCGTCACCATGGTGGGAGGTCCCTTCTACA
AGGTCCCGCTGGGGAGAAGAGATGGGCTGGTCTCCCGGGCGAACAGGGTTGAAGGTAACCTTCCAAGACCCACGATG
TCCATTTCTCAGATAATTTCGATTTTCGCTGTGAGAGGGTTCTCGGTTCAAGAAATGGTGGCGCTGAGTGGTGCCCACA
CGATTGGGTTCTCGCATTGTAAAGAATTCAGCAGCGGGATCTACAATTACAGCCGCAGTTCCCAGTCCAATCCGAGCTA
CAACCCTAGATTCGCAGAGGGGTTGAGAAAAGCTTGCAGCGATTACCAGAAGAATCCTACATTGTCGGTGTTCAACGA
TATAATGACTCCCAACAAGTTCGATAACATGTATTTCCAGAATCTGCCCAAGGGTTTGGGGCTATTGGCGACGGACCAT
ACCATGGCTACCGATCCGAGGACGAGGCAGTTTACGGATTTGTATGCCAAGAATCAAAGCGCCTTCTTTGAGGCATTT
GGTCGAGCTATGGAGAAGCTTGGCCTTTATGGGATCAAGACCGGGCGAAGAGGAGAGATTCGACGCA GG TGT GAT
GCC TTA AAC TAG
Vv14s0066g01850 (POD1) genomic
AAGGCTTCTGAGTAAGAGCCCACACACTCTCCATTGCTGCCACTACCACTGGCTTTTTTTTTTATTTTTGTATTTATCTGC
TCAGGTCTCTGAGCTTTGAGCTCTGAGAAACAATGGCATTGATCCTCTTTTCTCTACTATTCTTTCTGGGATTAGTGAAC
CCTTCGGAGTCCAGGTTGAGTGTCAACTACTACCAAAAATCATGCCCAAGATTCAGTCAGATCATGCAGGATACCATC
ACCAACAAGCAAATCACCAGCCCCACCACGGCTGCGGCCACTCTCCGCCTCTTCTTCCACGACTGCTTCATTGAGGGCT
GCGATGCTTCCGTTCTTGTCTCCTCGACCCCCTTCAACGAGGCCGAGCGCGATGCCGACATGAACCTCTCCCTCCCCGG
CGACGGCTTCGACGTCGTTGTCCGCGCCAAGACCGCCCTCGAGCTCGCTTGCCCCGGTGTGGTCTCCTGTGCCGACATT
CTCGCCGTCGCTACCCGCGATCTCGTCACCATGGTGGGAGGTCCCTTCTACAAGGTCCCGCTGGGGAGAAGAGATGGG
CTGGTCTCCCGGGCGAACAGGGTTGAAGGTAACCTTCCAAGACCCACGATGTCCATTTCTCAGATAATTTCGATTTTCG
CTGTGAGAGGGTTCTCGGTTCAAGAAATGGTGGCGCTGAGTGGTGCCCACACGATTGGGTTCTCGCATTGTAAAGAAT
TCAGCAGCGGGATCTACAATTACAGCCGCAGTTCCCAGTCCAATCCGAGCTACAACCCTAGATTCGCAGAGGGGTTGA
GAAAAGCTTGCAGCGATTACCAGAAGAATCCTACATTGTCGGTGTTCAACGATATAATGACTCCCAACAAGTTCGATA
ACATGTATTTCCAGAATCTGCCCAAGGGTTTGGGGCTATTGGCGACGGACCATACCATGGCTACCGATCCGAGGACGA
GGCAGTTTACGGATTTGTATGCCAAGAATCAAAGCGCCTTCTTTGAGGCATTTGGTCGAGCTATGGAGAAGCTTGGCCT
TTATGGGATCAAGACCGGGCGAAGAGGAGAGATTCGACGCAGGTGTGATGCCTTAAACTAGGTTTTTAAGGTTTTTTTT
TTTTTTTTTGCATTACAAACTCCCACCGTAGTGATGATCAATCAAGGTGAATTGATGGTGAGGGGGTGGTTTCATTTGA
ATTCTTTTTTTTTTTGTTGT
73
43 Gene transformation
After amplification of POD1 gene with PFU enzyme and specific POD1 primers (Table 7 Fig 28)
the E coli transformation was performed via pTOPO cloning system The day after a single colony
of DH10B cells that was grown on solid LB was transferred into 10 mL of liquid LB containing the
appropriate kanamycin antibiotic (for a final concentration of 50 mgl) and incubated overnight at
37deg and 250 rpm Afterward the pcr amplification of the colony was done to detect bacterial
recombinant colonies which carried the fragment of interest
Therefore 2 plates were designed to amplify each colony two times (Fig 29)
In the first plate the combination of the primer forward of M13 was used with the specific primer of
POD 1 reverse and simultaneously in the second plate the same colony was amplified with the
primer forward of POD1 with the M13 reverse The primers pair M13 gives the possibility to
amplify the fragment 50 bp longer than our inserted gene Consequently only the colonies which
were amplified in the correct position in the both plates had successfully carried the fragment of
interest (Fig 29)
Fig 28 Amplification of POD 1 gene by PFU
74
Fig 29 Colony PCR of POD 1 gene (The colonies marked with a star sign in the both gels are the ones with our
fragment of interest)
After the sequencing of the insert in the plasmid the LR recombination reaction was performed
The colony PCR was done using the ldquoPROMOTER 35 Srdquo as the primer forward and the primer
ldquoSONDA TERrdquo as the reverse The fragment 1575 bp was amplified The colony marked with a star
sign is the one with our fragment of interest (Fig 30) and the plasmid DNA was extracted and the
insert fragment of 1375 bp was amplified with the primer forward ldquoPROMOTER 35 Srdquo and the
specific primer reverse of ldquoPOD 1cloningrdquo (Table 7) (Fig 31)
75
Fig 31 The plasmid DNA (PK7WG2) control
After the transformation of A Tumefaciens the positive colonies were checked by pcr amplification
of the Agro-plasmid with the primer forward ldquoPROMOTER 35 Srdquo and the specific primer reverse of
ldquoPOD 1cloningrdquo (Fig 32) The plasmid DNA PK7WG2 was used as the positive control
Fig 30 The PK7WG2 Colony PCR of POD 1 gene
76
Fig 32 The pcr amplification of the Agro-plasmid (PC) Positive control (NC) Negative control (P1 - P5) Agro-
plasmids
Afterward the stable transformation of Petunia hybrida was done In addition at the same time the
Agro-infiltration of petunia petals was performed and the bacterial suspension was infiltrate into the
upper layer of petals Infiltrate flowers were then kept at 25 oC for two days but the flowers were
wilted without any change observed After 4 to 5 months two plants derived from the two
independent stable transformations grew in selective medium containing kanamycin and flowered
and were propagated asexually by cutting
To control the transformation efficiency the DNA was extracted from a Petunia hybrida leaf disc of
the two transgenic lines a wild type line and also as a positive control the plasmid DNA PK7WG2
was used The pcr amplification was done with the primer forward ldquoPROMOTER 35 Srdquo and the
specific primer reverse of ldquoPOD 1cloningrdquo (Fig 33)
77
As to the obtained results (Fig 33) both plants were transformed successfully To investigate the
expression of the transgene in the two lines RNA was extracted from the petal of the transgenic
plants and from the wild type line used as negative control and retro transcript to cDNA By pcr
amplification performed with the primers pairs of Actin the correct retro transcription of the RNA
was evaluated Then to analyze the expression of the transgene VvPOD1 in the petunia petal the
RT-PCR was performed with the specific primers pairs of ldquoPOD 1cloningrdquo
According to the (Fig 34) the fragment of 1kb was amplified and observed only in the second lane
confirming that the POD1 gene was expressed successfully in the Petunia hybrida line 2
Fig 33 The PCR amplification to control the transformation efficiency (TP1) Transgenic petunia 1st pot (TP2)
Transgenic petunia 2nd pot (WTL) Wild type line (PC) Positive control (NC) Negative control
78
0
5
10
15
20
25
30
35
40
45
50
Wild type line
control
POD plants
control
Wild type line
Heat shocked
POD plants
Heat shocked
To
tal
an
tho
cyan
in
A
BB
C
Fig 34 The RT-PCR of POD1 gene in the transformed plant (TP1) Transgenic petunia 1st pot (TP2) Transgenic
petunia 2nd pot (WTL) Wild type line
44 Heat shock and the plant response
Subsequently flowers from the transgenic line 2 (which expressed the POD1 gene) and from the
wild type were selected in 5 replicates and treated with the heat shock in order to highlight the
possible role of POD1 in anthocyanin degradation under stress condition
The same number of flower replicates of wild type and the transgenic line 2 were selected as the
control ie not subjected to the heat shock The petals of the treated flowers together with the
control ones were grounded by liquid nitrogen and the fine powder was weighted and divided in to
two in order to evaluate the activity of Guaiacol Peroxidases enzyme and the total anthocyanin
(Fig 35 36)
Fig 35 Total anthocyanin content of wild type line and POD plants
79
0
5
10
15
20
25
30
Wild type
line control
POD plants
control
Wild type
line Heat
shocked
POD plants
Heat shocked
(Kat
gr
-1 F
W)
C
B
C
A
By comparing the total anthocyanin content of the wild type and the transgenic lines before and after
heat treatment we found that the total anthocyanin content of the wild type line was significantly
similar in the both control and shocked treatment (Fig 35) After the heat shock the level of the
total anthocyanin in the transgenic petunia was reduced significantly However the total
anthocyanin content of the POD flowers in control was surprisingly highest among the others
Fig 36 The Peroxidase activity of wild type line and POD plants in the control and heat shock treatment
The enzymatic activity of peroxidase in both wild type and transgenic line 2 was evaluated before
and after the treatment
The wild type flowers showed the same level of enzymatic activity before and after the treatment
(Fig 36) The peroxidase activity was higher in the transgenic line in both control and the shocked
flowers However heat shock treatment contributed to significantly increase the peroxidase activity
in transformed flowers (Fig 36)
80
5 CONCLUSION
Most of the works studied the effects of temperature on anthocyanin accumulation has dealt with
the effects on the biosynthesis of anthocyanins (Mori et al 2007)
Yamane et al (2006) discussed the possibility of the contribution of another mechanism (eg
anthocyanin degradation) to the inhibitory effect of high temperature on anthocyanin accumulation
To date no report has demonstrated the enhancement of anthocyanin degradation due to high
temperature in plant tissue Hence the present study is the pioneer to show that the mechanism of
anthocyanin loss in grape skins due to high temperature involves not only the inhibition of
anthocyanin biosynthesis but also its enzymatic degradation
As to the results of this research and the literatures (Vaknin et al 2005 Mori et al 2007) among
the different candidates peroxidases (PODs) are reputed to be the main responsible for degrading
the anthocyanin pigment in vivid tissues
There are many isoforms of Peroxidases gene in different organs of grape that among them only 6
isoforms are reported to be more expressed in berry skin from veraison to harvest (Fasoli et al 2012
and Mori et al 2007)
Therefore in order to recognize the most important gene that encodes the peroxidase enzyme in
Sangiovese grape under stress condition selected isoforms of POD were isolated from Vitis vinifera
(cv Sangiovese) berries and transformed to Petunia hybrida Afterward the expression of the POD1
gene and the activity of the peroxidase enzyme were assessed in the transgenic petunia and were
compared to the wild type line under the stress condition
The obtained results could confirm that the level of total anthocyanin was decreased in the living
Petunia suffered from the heat stress this was under the circumstance that the level of the
peroxidase enzyme was significantly higher in those plants
On these bases it can be figured out that peroxidases can be considered as the responsible for
anthocyanin degradation in living tissues and the decrease of total anthocyanin content in the plants
faced to an abiotic stress such as the excessive high temperature What is more among the different
isoforms of the tested peroxidases genes the POD 1 isoform (with the sequence mentioned before)
can be identified as one of the propellant in this respect
81
Chapter two
Effects of late-season source limitations induced by trimming on grape
composition during ripening in Vitis vinifera cv Sangiovese
82
1 INTRODUCTION
Grape wine production showed a higher sensitivity to climate variability and the ongoing climatic
changes have already caused phenological alterations in some viticultural areas and are expected to
continue in the future (Jones et al 2005 Schultz 2000 Duchene and Schneider 2005) Besides
over the last fifty years an overall upgrading of vineyard management techniques which lead to a
general wine quality improvement has been verified As consequence in wine regions where heat
summations largely exceed technological requirements for the grown grape varieties a too high
level of sugar and subsequent wine alcohol excess low acidity alteration of aroma composition
and in black varieties unbalanced phenolic ripening with insufficient berry skin colour has been
shown at harvest
Accumulation of sugars is probably more responsive to temperature variations than accumulation of
anthocyanins because the optimal temperature for sugars biosynthesis and transport ranges from 8
to 33 degC while for anthocyanin pathway range from 17 to 26 degC Moreover high temperatures
(above 30-35 degC) have been the inhibitor of anthocyanin accumulation (Kliewer 1970- 1977 Mori
et al 2007 Movahed 2011) The relationship between tannins and high temperature is not clear but
some authors reported that seed tannin concentration was less susceptible to changes in temperature
conditions respect to anthocyanins (Cortell et al 2007a Ristic et al 2007) Moreover while soluble
solids and anthocyanins sysnthesis starts at veraison tannins were produced several weeks before
veraison and then their concentration in the berry starts to decrease following by a plateau at later
berry ripening stages (Kennedy et al 2000 2002) In other word it seems that there are differential
effects of temperature increase on the evolution of different berry traits in particular when they
occure after veraison On these bases the hypothesis is that the slowing down of sugars
accumulation rate may allow to achieve full ripeness of phenolic compounds mainly anthocyanins
and tannins As well known fruit sugar accumulation can be decreased by grape-growers for
example via bud load and yield increases but for the production of high quality wine it is not
allowed to exceed foreseen thresholds by the Appellation rules
A different approach to slow down sugar accumulation is represented by source limitation as the rate
of soluble solids increase in berries is well related to the ratio between leaf area to yield (Kliewer
and Dokoozlian 2005) In particular several researches showed that the removal around veraison of
the more young and efficient part of the canopy may be effective in reducing sugar accumulation
(Reynolds and Wardle 1989 Intrieri et al 1983 Intrieri 1994)
Although the relationship between sugar accumulation and leaf area to yield ratio is well
documented the evolution of some phenolic compounds in relation to leaf area efficiency and sugar
83
content in berries remain unclear Sugar has been shown to stimulate anthocyanin accumulation in
grape (Pirie and Mullins 1976 Larronde et al 1998 Hiratsuka et al 2001 Gollop et al 2002) but
it has been also reported that anthocyanins exhibit an initial phase of rapid increase strongly
correlated to sugar accumulation and a second phase where anthocyanins and sugars are uncoupled
(Guidoni et al 2008)
Moreover several studies with red wine cultivars in which crop was adjusted by means of cluster
thinning increasing the leaf area to yield ratio resulted in improved soluble solids anthocyanins
total phenols and colour intensity (Filippetti et al 2007 Pastore et al 2011Guidoni et al 2002
Reynolds et al 1994)
As well known the prediction of wine colour and quality based on berry composition is a difficult
task but the aim of this trial is to understand (i) if post veraison trimming is effective to slow down
the rate of sugar accumulation and (ii) to verify the possible derived alterations after treatment in
anthocyanins and tannins accumulation and in their compositional changes during ripening
compared to control in Vitis vinifera L cultivar Sangiovese
2 MATERIAL AND METHODS
This trial was conducted in 2009 2010 and 2011 on Sangiovese vines (V vinifera L clone 12T
grafted on 3309C) planted in 1994 in Ozzano Emilia Bologna Italy (44deg25N 11deg28E) Vines were
spaced 15 m on the row and 3 m between the rows and they were trained to Free Cordon (16 buds
per vine)
Twenty-four vines in four blocks (6 vines per block) were randomLy assigned within each block to
the following treatments
a) Non-trimmed control (C)
b) Shoot trimming 1 week after full veraison which left 8 nodes on every main shoot (TRIMM)
Trimming was performed when berry sugar concentration reached around 15deg -18deg Brix and
precisely 6th August 2009 (17 days after veraison) 10th August 2010 (17 days after veraison) and
4th August 2011 (6 days after veraison)
21 Vegetative and yield data
In each year before trimming and at harvest two regressions between shoot length (main and
lateral) and their actual leaf area were calculated and used to estimate leaf area of all tested vines At
84
trimming the main and lateral leaves were removed and leaf area was measured with a leaf area
meter (LI-3000A Li-Cor Bioscences Lincoln Nebraska USA) At harvest time the crops of each
individual plant were gathered separately and the number of clusters and their weights were
recorded
Weather data (mean daily air temperature and rainfall) were recorded from April to September in the
both years at a meteorological station located close to the experimental site
22 Berry sampling
In each year every ten days from veraison to harvest samples of 20 berries per plant were
collected pooled per each block (120 berries) and divided in three subsamples (40 each) for
determinations of the following parameters
a) Berry weight and must biochemical parameters (soluble solids pH and titratable acidity) on 20
berries performed immediately after sampling
b) Skin anthocyanins on 10 berries immediately stored in -20deg C and kept there until the analyses
c) Skin and seed tannins on 10 berries immediately stored in -20deg C and kept there until the
analyses
23 Analyses of main must biochemical parameters
The 20 sample berries were crushed and the must were sieved and used for degBrix analysis by a
temperature-compensating CR50 refractometer (Maselli Misure Spa PR Italy) Five mL of the
same must were then diluted 7 times with bi-distilled water and used to perform a titration reaction
by a Crison Compact Tritator (Crison Barcelona Spain) with 1N 05 N or 025 N NaOH (Sigma-
Aldrich St Louis MO USA) according to the stage of berry ripening to obtain pH and Titratable
Acidity (TA) data (expressed as gl of tartaric acid equivalents)
24 Analyses of skin anthocyanins
The berries sampled were weighted before the extraction of anthocyanins Then the skin was
carefully removed from the pulp and immerged in 50 mL of HPLC-grade methanol (Carlo Erba
Reagents Milano Italy) and were kept in dark for 24 hours The day after the extract was
separated from the skin residues and conserved at (-20degC) until the analysis
85
HPLC separation and quantification of anthocyanins were performed on a Waters 1525 instrument
equipped with a diode array detector (DAD) using a reversed-phase column Phenomenex (Castel
Maggiore BO Italy) RP18 250 mmx4mm (5microM) with precolumn The eluents used were the
following A= HClO4 03 in milliQ water B = methanol
The methanol extract was filtered through 022 microm 13mm PTFE syringe-tip filters (Teknokroma
Barcelona Spain) and an aliquot of 270microL was diluted to final volume of 1mL with the A eluent
The binary gradient was the same as reported in Mattivi et al (2006) with suitable modifications
The time for column equilibration was 5 minutes and the injection volume was 60 microL Separation of
the main free anthocyanins was obtained at 43 degC and they were quantified at 520 nm with a
calibration curve with malvidin-3-glucoside (Sigma-Aldrich ST Louis MO USA)
25 Tannins analysis
To extract proanthocyanidins the sampled berries (skins and seeds) were ground separately to a fine
powder under liquid N2 01 gr aliquots were separated and extracted in darkness in 2 mL screw-top
Eppendorf tubes for 24 hours with 70 acetone (10 mL) containing 01 ascorbate to prevent
oxidation of polyphenols Samples were then centrifuged (15 min 13000 g) and two 400 μL
aliquots of the supernatant were transferred to fresh tubes and dried down under vacuum at 35ordmC for
120 minutes
One of them was re-suspended in 100 μL methanol acidified with 1 HCl then neutralised with 100
μL sodium acetate (200 mM pH 75) for the analysis of free monomers The other aliquot
underwent acid-catalysed cleavage of the proanthocyanidins in the presence of excess
phloroglucinol following the method of Kennedy and Jones (2001) Briefly the dried sample was
resuspended in 100 μL of phloroglucinol buffer (025 g ascorbate 125 g phloroglucinol 215 μL
conc HCl 25 mL methanol) and incubated at 50ordmC for 20 minutes then neutralised with 100 μL of
sodium acetate (200 mM pH 75) and centrifuged (15 min 13000 g)
A 200 μL aliquot each of the acetone extract the acetone extract after acid catalysed cleavage and
the residue after cleavage was then transferred to Sunbroker 250 μL reduced volume HPLC
autosampler vials Samples were run on a Waters 1525 instrument equipped with a diode array
detector (DAD) using a reversed-phase column Phenomenex (Castel Maggiore BO Italy) RP18
250 mmx4mm (5microM) with precolumn A separate reversed-phase HPLC method was developed for
the cleaved and uncleaved proanthocyanidin samples reading absorbance at 280 nm Uncleaved
samples solvent A 02 phosphoric acid solvent B 41 acetonitrile02 phosphoric acid
86
(gradient of solvent B zero min 0 5 min 10 40 min 10 55 min 17 65 min 19 75
min 19 80 min 100 85 min 100 86 min 0) Cleaved samples solvent A 02 acetic
acid solvent B methanol (gradient of solvent B zero min 1 40 min 1 120 min 30 1201
min 100 125 min 100 126 min 1) For both methods 25 μL of sample was injected and run
at 30ordmC with a flow rate of 1 mLmin Concentrations of free monomers and hydrolysed terminal
subunits were determined from standard curves prepared from commercial standards of catechin
epicatechin epigallocatechin and epicatechin-gallate obtained from Extrasynthese (France) The
concentration of extension subunit-phloroglucinol adducts was calculated from published molar
extinction coefficients (Kennedy amp Jones 2001)
3 RESULTS AND DISCUSSION
31 Climatic data
The Growing Degree Days (GDD 10 degC baseline) from April 1st to September 30th (Table 8 Fig
37) were highest in 2011 (2054) and lowest in 2010 (1718) Moreover the average daily temperature
recorded from veraison to harvest in 2011 was mostly (70 of the period) above 25deg C In addition
in 2011 the level of the rainfall from April to September was only 136 mm whereas in 2010 the
rainfall in the same period was found to be three times more (Table 8 Fig 37)
Table 8 The climatic conditions in 2009 2010 and 2011
Year Rain from April to
September (mm)
DD from April to
September (degC)
Number of days with average daily
temp gt 25deg C from veraison to
harvest
2009 269 1963 24
2010 390 1718 7
2011 136 2054 29
87
Fig 37 The yearly recorded rainfall and daily average temperature from April 1 to September of 2009 2010 and 2011
32 Vegetative and productive traits
All vines were quite uniform in terms of leaf area before trimming in all years (data not shown) The
TRIMM treatment induced a leaf area reduction around 60 in 2009 and 2010 and around 40 in
2011 compared to control The trimming of the upper part of the canopy affected mostly the laterals
compared to the main leaves especially in 2010 (Table 9) It is interesting to note that in 2010 a
significant higher leaf area was recorded compared to 2009 probably due to the more favourable
seasonal climatic conditions during the first phase of shoots growth No laterals re-growth was
measured after treatments in all years
88
Starting from a uniform bunch number per meter of cordon yield cluster weight and berry weight
were unaffected by treatments in 2009 (Table 9) In 2010 and 2011 yield and cluster weight were
significantly lower in TRIMM vines compared to control while berry weight didnrsquot show any
difference A year-by-year variability in terms of yield was verified In 2010 yield was significantly
higher than in 2009 and 2011 for both treatments and due to the setting of uniform buds and
clusters number per vine it might be almost entirely a result of cluster weight increase (Table 9)
Berry weight did not differ between treatments during ripening (Fig38) in all the tested years
Moreover the number of berries per cluster was significantly lower in TRIMM vines compared to C
in 2010 and 2011 (Table 9)
At harvest the leaf areayield ratio was reduced in TRIMM vines to very low values corresponding
to 038 and 039 m2kg in 2009 and 2010 respectively compared to 101 and 082 m
2kg in the
control vines which are considered optimal for ripening in Free Cordon (Table 9) In 2011 probably
due to the low yield level registered in TRIMM vines the leaf area yield ratio reached a value of
093 m2kg which was not significantly different from C and that may allow an optimal ripening
(Table 9)
Despite we did not evaluate the starch content in the different parts of the tested vines it would be
expected that the TRIMM vines subjected to leaf area reduction ranging from 40 to 60 after
veraison induced further remobilization of reserves (Candolfi-Vasconcelos et al 1994) The
possible carbohydrate reserve depletion in 2009 and 2010 induced by defoliation could be
responsible for yield constraint mainly due to reduction of flower numbers per inflorescence
(Scholefield et al 1977 Bennett et al 2005)
89
Table 9 Vegetative growth and yield components recorded over 2009ndash2011 in C and TRIMM vines
Parameters 2009 2010 2011 Year
effect
Year x
Treatment
Interaction
C TRIMM C TRIMM C TRIMM
Main LA after
trimming
(m2m of cordon)
144 a 056 b 177 a 096 b 121 a 071 b ns ns
Laterals LA after
trimming
(m2m of cordon)
079 a 025 b 112 a 018 b 059 a 030 b ns ns
Total LA after
trimming
(m2m of cordon)
223 a 081 b 289 a 114 b 180 a 101 b ns
Cluster
(nm of cordon)
105 a 106 a 111 a 102 a 101 a 102 a ns ns
Yield
(kgm of cordon)
22 a 21 a 35 a 29 b 143 a 108 b ns
Cluster weight (g) 2108
a 1966 a
3121
a 2868 b 1473 a 1045 b ns
Berry weight (g) 155 a 153 a 170 a 169 a 128 a 123 a ns
Berries per cluster (n) 136a 1285a 1835a 1697b 1150a 850b ns
Leaf area yield
(m2kg)
101a 038b 082a 039b 125a 093a ns
Different letters indicate mean separation between treatments C and TRIMM within rows and years by t -test P = 005
P = 001 year x treatment interaction indicate mean separation within rows and years by t-test
90
Fig 38 Berry weight in the control and trimmed vines from veraison to harvest of the years 2009
2010 and 2011
33 Ripening analyses Soluble solids pH and Total Acidity
In 2009 and in 2010 TRIMM vines had significant lower soluble solids concentration (degBrix) at
harvest compared to C but no significant effect was recorded in 2011(Fig 39) TA and pH did not
show any difference between treatments in all years (Table 10) Daily soluble solids accumulation
rate has been reduced after trimming in 2009 and 2010 of 8 and 16 and not at all in 2011
compared to control vines
In 2011 the extremely hot and dry climatic conditions led to an acceleration in the accumulation of
soluble solids so that 23 days after veraison the degBrix level of C reached the 24 degBrix (Fig 39)
while in 2009 and 2010 this value was reached respectively 42 and 58 days after veraison Under
91
such circumstances associated with a general lower level of yield in 2011 compared to the previous
years the grapes of TRIMM vines did not show differential accumulation rate and no significant
difference was recorded in berry composition compared to Control in this year This result is in
agreement with the high value of leaf area to yield ratio (Table 9) measured in TRIMM vines in
2011 which is considered adequate to allow an optimal ripening
Fig 39 degBrix in the control and trimmed vines from veraison to harvest of the years 2009 2010 and 2011
92
34 Anthocyanins accumulation during ripenning
Total anthocyanin concentration (mgkg) did not differ among treatments during ripening in all the
experimental years (Fig40) and no variation was registered at harvest (Table 10) Although no
difference was recorded among the treatments the anthocyanins concentrations were different
among the years (Fig40) The lowest anthocyanin value at harvest was registered to be in 2009 and
the maximum was observed in 2011 (Fig40) These results do not seem correlated with the different
temperature trend in the experimental years because in the both 2009 and 2011 the temperature
exceeded to the critical value for anthocyanin accumulation for periods with similar length Having
the lowest berry weight in 2011 is probably the reason of the highest anthocyanin value registered at
harvest in the grapes of both treatments as compared to the previous years (Table 9 10)
Notably no relation has been verified between the reduction in soluble solids accumulation
occurred in 2009 and in 2010 and variation in anthocyanins accumulation
In particular in 2009 when the trimming was effective in slowing down the rate of sugar
accumulation the correlation between total anthocyanin content (mg per berry) and berry juice
soluble solids concentration showed similar curves for TRIMM and C (Fig 41) Both treatments
showed an increasing positive trend between 10deg Brix to 22deg Brix where there is a peak
concentration and a decline in anthocyanins during the latter stage of ripening (Fig 41) Our results
are in acordance with Guidoni et al (2008) who demonstrated that anthocyanins may accumulate in
a two-phase process with an initial phase of rapid increase and a second phase where anthocyanins
and sugars are uncoupled
As other authors pointed out sugar accumulation was shown to be more strictly associated to
thermal time whereas anthocyanin accumulation was also affected by other sources of variations
(water yield and climatic conditions) (Sadras et al 2007) and in general displays a much wider
range of variation than that of sugars
93
Fig 40 The anthocyanin concentration in the control and trimmed vines from veraison to harvest of the years 2009
2010 and 2011
Fig 41 The correlation between the total anthocyanin content and berry soluble solids concentration in the control and
trimmed vines from veraison to harvest of the year 2009
94
Besides the analysis of the anthocyanin composition at harvest did not show significant difference
between the treatments in all the three years The percentage of delfinidid 3-G cyanidin 3-G
peonidin 3-G petunidin -3-G and malvidin 3-G in berries of TRIMM and C vines showed the
typical Sangiovese grape profile with high level of cyanidin 3-G and malvidin 3-G (Fig 42) It
seems that the biosynthesis of each individual anthocyanin is not influenced by the variation of
sugar concentration in the berries at harvest as occurred in 2009 and 2010
Moreover the trimming treatment did not modify cluster microclimatic conditions which are found
to be responsible for anthocyanin profile changes as reported after cluster shading (Downey et al
2004) and temperature variation (Mori et al 2005)
Fig 42 The anthocyanin profile in the berry skin of control and trimmed vines at harvest of the years 2009 2010 and
2011
95
35 Tannins accumulation during ripenning
In all experimental years trimming did not affect the evolution of seed and skin tannins
concentration expressed as mg per kg of berries during ripening and at harvest (Table 10 Fig 43 45
and 47) The tannins were expressed as mg per kg of berries as no differences were recorded
between treatments in berry weight during ripening (Fig 38)
Similar to what was previously reported on different varieties (Harbertson et al 2002 Kennedy et
al 2002 Downey et al 2003) the levels of seed tannins were higher compared to skin tannins at
veraison but declined during ripening The levels of berry skin and seed tannins reached to nearly
equal levels at harvest (Table 10 Fig 43 45 and 47) By evaluating the seed monomers and
polymers tannins the similar trends were observed in all treatments during ripening and their
concentration (mgkg of berries) in seed polymers was considerably higher than in its monomers as
expected
As well as that the berry tannins composition was assessed from veraison to harvest in each year
and the evolution of all four flavan-3-ols (catechin epicatechin epigallocatechin and epicatechin-
gallate) followed the same tendency between treatments (Fig 44 46 and 48) And among them
epicatechin is the major and catechin is the minor constituent of berry tannins (Fig 44 46 and 48)
Our results assessed that the concentration and composition of each group of tannins compounds at
harvest were not affected by trimming treatment after veraison also when this technique was able to
reduce sugar accumulation rate Moreover it appeared that the concentration of each flavan 3 ols
(catechin epicatechin epigallocatechin and epicatechin-gallate) remains almost constant in the last
thirty days before harvest revealing that both tannins composition and content may be not
responsable of different level of astringency in wine obtained from grapes at different degree of
ripening In other words our results seem to assess a very low effectiveness of the determinations of
each compound in prediction of wine astringency traits As previously pointed out by several
authors the extractability and solubility of each group of flavonoid compounds during ripening may
play an important rule to understand the relationships between berry composition wine composition
and sensory properties of wine
96
Fig 43 The tannins concentration of berry seed and skin in the control and trimmed vines from veraison to harvest of
the year 2009
Fig 44 The tannins composition in the control and trimmed vines from veraison to harvest of the year 2009
97
Fig 45 The tannins concentration of berry seed and skin in the control and trimmed vines from veraison to harvest of
the year 2010
Fig 46 The tannins composition in the control and trimmed vines from veraison to harvest of the year 2010
98
Fig 47 The tannins concentration of berry seed and skin in the control and trimmed vines from veraison to harvest of
the year 2011
Fig 48 The tannins composition in the control and trimmed vines from veraison to harvest of the year 2011
99
Table 10 Berry composition in the control and trimmed vines at harvest of the years 2009 2010 and 2011
Parameters 2009 2010 2011 Year x
Treatment
Interaction C TRIMM C TRIMM C TRIMM
Soluble solids (degBrix) 252 a 246 b 237 a 23 b 264 a 272 a ns
Total acidity (gl) 738 a 723 a 779 a 796 a 844 a 891 a ns
pH 353 a 347 a 339 a 336 a 339 a 336 a ns
Total anthocyanins
(mgkg berries)
7961 a 8381 a 11177 a 11200 a 17080 a 18100 a
Total tannins 3506 a 3547 a 3330 a 3107 a 3699 a 3522 a ns
Total tannins in skin 1006 a 1196 a 1466 a 1243 a 1697 a 1722 a ns
Total tannins in seed 2600 a 2352 a 1864 a 1864 a 2002 a 1800 a ns
4 CONCLUSION
The source limitation by trimming after veraison showed some perspectives to achieve lower sugar
accumulation in grape and lower alcohol potential in wines without inducing modification in the
evolution of the main assessed flavonoids compounds (skin anthocyanins total seeds and skin
tannins concentration and profile) in Sangiovese berries
The efficiency of this technique seems to be strongly depending from the vines starch supply as the
possible carbohydrate reserve depletion induced year over year by trimming may be responsible for
self regulation mechanism of yield constraint verified in the second and third year of the trial In this
condition the leaf area cutback after veraison is counterbalanced by the yield lowering and no effects
is obtained in lowering sugar accumulation as the leaf area yield ratio is maintained to high level
Probably the low fertility condition of the vineyard site and the lack of irrigation system may have
promoted this mechanism
Further researches on photosynthetic limitation after veraison to reduce sugar accumulation will be
focused on vines in different soil fertility condition and on the evaluation of the extractability of
tannins from seeds and skins in wines or wine-like solutions derived from this treatment
100
5 GENERAL CONCLUSION
Wine grape must deal with serious problems which occur due to the unfavorable climatic conditions
resulted from global warming
The excessive elevated temperatures are critical for grapevine and contribute to degradation of grape
and wine quality As an illustration elevated temperature is an important factor that can negatively
affect anthocyanin accumulation in grape Particularly cv Sangiovese was identified to be very
sensitive to such condition The expressions of the genes involved in flavonoid biosynthesis were
observed to be affected by temperature The quantitative real-time PCR analysis showed that
flavonoid biosynthetic genes were slightly repressed by high temperature As well as that the heat
stress showed to repress the expression of the transcription factors VvMYBA1 that activates the
expression of UFGT
Moreover high temperatures showed to had repressing effects on the activity of the flavonoids
biosynthetic enzymes PAL and UFGT
Anthocyanin accumulation in berry skin is due to the balance between its synthesis and oxidation
In grape cv Sangiovese the gene transcription and activity of peroxidases enzyme was found to be
elevated by heat stress as a defensive mechanism of ROS-scavenging
Even if different antioxidant enzymes have been recognized to be involved in flavonoids
degradation under various abiotic stresses this research identifies peroxidases as one of the best
candidate to oxidize anthocyanins actively
Between many isoforms of peroxidases genes which are expressed in grape berry skin from
veraison to harvest one peroxidase gene (POD 1) induced in Sangiovese grape under thermal stress
condition was isolated and evaluated via the technique of genes transformation from grape to
Petunia flower Reduction in anthocyanins concentration in POD 1 transformed Petunia flowers was
assessed after thermal stress conditioning compared to untrasformed control
Biochemical and molecular studies confirmed the role of peroxidases enzyme in active anthocyanins
degradation in Sangiovese cv grape skin under temperature stress conditions Based on our results
a similar mechanism that will be object of further investigation may be supposed for flavonols
degradation In conclusion this study showed that the temperature regimes after veacuteraison have
different effects on each flavonoid group Although the anthocyanin proanthocyanidin and flavonol
share the main part of their biosynthetic pathway no effects were obtained regarding any changes in
the biosynthesis of the proanthocyanidins under these different thermal ripening conditions
101
Moreover the present study is the pioneer to approve that the mechanism of anthocyanin loss in
grape skins due to high temperature involves not only the inhibition of anthocyanin biosynthesis but
also its enzymatic degradation
What is more in wine producing regions it is inevitable for the grape growers to adopt some
adaptive strategies to alleviate grape damages to abiotic stress conditions It is necessary to
ameliorate the vintage through improvement of management techniques to face the impacts of
undesirable climatic conditions Therefore in this thesis the technique of post veraison trimming
was done to improve the coupling of the phenolic and sugar ripening in Vitis vinifera L cultivar
Sangiovese
Trimming after veraison allowed to limit the photosynthetic source and showed to be executable to
slow down the rate of sugar accumulation in grape (to decrease the alcohol potential in wines)
without inducing modification in the evolution of the main berry flavonoids compounds
Moreover the present research showed that the efficiency of this technique applied year after year is
related to the ability of the vines to recover charboidrate reserve to prevent self regulation
mechanism of yield constraint
Further researches need to be performed on the evaluation of the extractability of tannins from seeds
and skins in wines or wine-like solutions derived from grape on vines subjected to post veraison
photosynthetic limitation
102
REFERENCES
Adams D 2006 Phenolics and ripening in grape berries J Am J Enol Vitic Vol 57 (3) 249-
256
Alfenito MR Souer E Goodman CD 1998 Functional complementation of anthocyanin
sequestration in the vacuole by widely divergent Glutathione Stransferases J The Plant Cell Vol
101135-1149
Aron PM Kennedy JA 2008 Flavan-3-ols Nature occurrence and biological activity J Mol
NutrFood Res Vol 52 79-104
Bavaresco L Fregoni C 2001 Physiological role and molecular aspects of grapevine stilbenic
compounds In K A Roubelakis-Angelakis (Ed) Molecular biology and biotechnology of the
grapevine pp 153-182
Bennett J Jarvis PCreasy G Trought M 2005 Influence of defoliation on overwintering
carbohydrate reserves return bloom and yield of mature Chardonnay grapevines J Am J Enol
Vitic Vol 56(4) 386-393
Bergqvist J Dokoozlian N Ebisuda N 2001 Sunlight exposure and temperature effects on berry
growth and composition of Cabernet Sauvignon and Grenache in the central San Joaquin Valley of
California J Amer J Enol Vitic Vol 52 (1) 1-7
Bindi M Fibbi L Gozzini B Orlandini S Miglietta F 1996 Modelling the impact of future
climate scenarios on yield and yield variability of grapevine J Clim Res Vol 7 213ndash224
Bogs J Downey MO Harvey JS Ashton AR Tanner GJ Robinson SP 2005
Proanthocyanidin Synthesis and Expression of Genes Encoding Leucoanthocyanidin Reductase and
Anthocyanidin Reductase in Developing Grape Berries and Grapevine Leaves J Plant Physiol Vol
139 652ndash663
Bogs J Ebadi A McDavid D Robinson SP 2006 Identification of the flavonoid hydroxylases
from grapevine and their regulation during fruit development J Plant Physiol Vol 140(1) 279-
291
Boss PK Davies C Robinson S P 1996 Analysis of the expression of anthocyanin pathway
genes in developing Vitis Vinifera L cv Shiraz grape berries and the implications of pathway
regulation J Plant Physiol Vol 111 1059-1066
Boulton R 2001 The copigmentation of anthocyanins and its role in the color of red wine A
critical review J Am J Enol Vitic Vol 52 (2) 67-87
103
Braidot E Zancani M Petrussa E Peresson C Bertolini A Patui S Macrigrave F Vianello A
2008 Transport and accumulation of flavonoids in grapevine (Vitis vinifera L) J Plant signaling
and behavior Vol 3(9) 626 - 632
Broun P 2005 Transcriptional control of flavonoid biosynthesis a complex network of conserved
regulators involved in multiple aspects of differentiation in Arabidopsis J Current Opinion in Plant
Biology Vol 8(3) 272-279
Bucchetti B 2004 Effetti biochimici e molecolari della luce sulla maturazione dellrsquouva nella cv
Sangiovese Tesi di Dottorato di ricerca in Colture Arboree ed Agrosistemi Forestali e Paesaggistici
XVII ciclo Universita di Bologna
Bucchetti B Pastore C Filippetti I Intrieri C 2007 Effetti di diverse tecniche colturali sulla
sintesi di antociani in Sangiovese Poster VIII GIORNATE SCIENTIFICHE SOI 8-11052007
(SS)
Buchanan-Wollaston V Morris K 2000 Senescence and cell death in Brassica napus and
Arabidopsis In Programmed Cell Death in Animals and Plants (Garland JM ed) BIOS Scientific
Publishers pp 163ndash174
Butterfield RE Gawith MJ Harrison PA Lonsdale KJ Orr J 2000 Modelling climate
change impacts onwheat potato and grapevine in Great Britain in Downing T E Harrison P A
Butterfield R E and Lonsdale KG (eds) Climate Change Climatic Variability and Agriculture
in Europe An Integrated Assessment Final Report Environmental Change Institute University of
Oxford 411 p
Buttrose MS Hale CR Kliewer WM 1971 Effect of temperature on composition of
lsquoCabernet Sauvignonrsquo berries J Amer J Enol Vitic Vol 22 (2) 71ndash75
Calderon AA Garciaflorenciano E Munoz R Barcelo A R 1992 Gamay grapevine
peroxidase its role in vacuolar anthocyani( di)n degradation J VITIS Vol 31(3) 139ndash147
Candolfi-Vasconcelos M Candolfi M Kohlet W 1994Retranslocation of carbon reserves from
the woody storage tissues into the fruit as a response to defoliation stress during the ripening period
in Vitis vinifera L
Castellarin SD Pfeiffer A Sivilotti P Degan M Peterlunger E Di Gaspero G 2007
Transcriptional regulation of anthocyanin biosynthesis in ripening fruits of grapevine under seasonal
water deficit J Plant Cell and Environment Vol 30 1381ndash1399
Castellarin SD Di Gaspero G Marconi R Nonis A Peterlunger E Paillard S Adam-
Blondon AF Testolin R 2006 Colour variation in red grapevines (Vitis vinifera L) genomic
104
organisation expression of flavonoid 3-hydroxylase flavonoid 35-hydroxylase genes and related
metabolite profiling of red cyanidin-blue delphinidin-based anthocyanins in berry skin J BMC
Genomics Vol 7(12) 1471-2164
Chen G Asada K 1989 Ascorbate Peroxidase in tea leaves occurrence of two isozymes and the
differences in their enzymatic and molecular properties J plant cell physiol Vol 30 (7) 987-998
Chen J Wen P Kong W Pan Q Wan S Huang W 2006 Changes and subcellular
localizations of the enzymes involved in phenylpropanoid metabolism during grape berry
development J Plant phisiol Vol 163 (2) 115-127
Cheynier V Rigaud J 1986 HPLC separation and characterization of flavonols in the skin of
Vitis Vinifera var Cinsault J Am J Enol Vitic Vol 37 248-252
Christie P Alfenito M R Walbot V 1994 Impact of low temperature stress on general phenyl
propanoid and anthocyanin pathways enhancement of transcript abundance and anthocyanin
pigmentation in maize seedlings J Planta Vol 194 541ndash549
Chua CS Biermann D Goo K S Sim T 2008 Elucidation of active site residues
of Arabidopsis thaliana flavonol synthase provides a molecular platform for engineering flavonols
J Phytochem Vol 69 (1) 66ndash75
Cohen S Tarara J Kennedy J 2012 Diurnal temperature range compression hastens berry
development and modifies flavonoid partitioning in grapes J Am J Enol Vitic vol 63(1) 112-
120
Conde C Silva P Fontes N Dias A Tavares R M Sousa M Agasse A Delrot S Geroacutes
H 2007 Biochemical changes throughout grape berry development and fruit and wine quality
httphdlhandlenet18226820
Conner AJ Albert NW Deroles SC 2009 Transformation and regeneration of petunia C
Springer Springer Science+Business Media LLC Chapter 19 pp 395-409
Coombe B G 1992 Research on Development and Ripening of the Grape Berry J Am J Enol
Vitic Vol 43(1) 101-110
Cortell JM M Halbleib AV Gallagher T Righetti and JA Kennedy 2007a Influence of vine
vigor on grape Vitis vinifera L cv Pinot noir) anthocyanins 1 anthocyanin concentration and
composition in fruit J Agrie Food Chem 556575-6584
Darneacute G 1993 New hypothesis on anthocyanin biosynthesis in berries and leaves of grapevine J
Vitis Vol 32 77-85
105
Dat JF Foyer CH Scott IM 1998 Changes in salicylic acid and antioxidants during induced
thermotolerance in mustard seedlings J Plant Physiol Vol 118 1455ndash1461
Davies KM Schwinn KE 2003 Transcriptional regulation of secondary metabolism J
Functional Plant Biology Vol 30(9) 913 ndash 925
Dela G Or E Ovadia R Nissim-Levi A Weiss D Oren- Shamir M 2003 Changes in
anthocyanin concentration and composition in lsquoJaguarrsquo rose flowers due to transient
hightemperature conditions J Plant Sci Vol 164 333ndash340
Deluc L Bogs J Walker AR Ferrier T Decendit A Merillon JM Robinson SP Barrieu
F 2008 The transcription factor VvMYB5b contributes to the regulation of anthocyanin and
proanthocyanidin biosynthesis in developing grape berries J Plant Physiol Vol (147) 2041ndash2053
Dokoozlian NK 2000 Grape berry growth and development Raisin Production Manual Chapter
5 pp 30- 37
Downey MO Dokoozlian NK Krstic MP 2006 Cultural Practice and environmental Impacts
on the flavonoid composition of grapes and wine A review of recent research J Amer J Enol
Vitic Vol 57 (3) 257-268
Downey MO Harvey JS Robinson SP 2003 Analysis of tannins in seeds and skins of Shiraz
grapes throughout berry development J Aust J Grape Wine Res Vol 9 15-27
Downey MO Harvey JS Robinson SP 2003 Synthesis of flavonols and expression of
flavonol synthase genes in the developing grape berries of Shiraz and Chardonnay (Vitis Vinifera
L) J Aust J Grape Wine Res Vol 9 110-121
Downey MO Harvey JS Robinson SP 2004 The effect of bunch shading on berry
development and flavonoid accumulation in Shiraz grapes J Aus J Grape Wine Res Vol 10 55-
73
Dry I B Robinson S P 1994 Molecular cloning and characterization of grape berry polyphenol
oxidase J Plant Molecular Biology Vol 26 495-502
Duchene E Schneider C 2005 Grapevine and climatic changes a glance at the situation in
Alsace Agron J Sustain Dev Vol 25 93ndash99
Fasoli M Dal Santo S Zenoni S Tornielli GB Farina L Zamboni A Porceddu A
Venturini L Bicego M Murino V Ferrarini A Delledonne M Pezzotti M 2012 The
grapevine expression atlas reveals a deep transcriptome shift driving the entire plant into a
Maturation Program J The Plant Cell Vol 24 3489ndash3505
Ferrini F Mattii GB Nicese FP 1995 Effect of Temperature on Key Physiological Responses
of Grapevine Leaf J Am J Enol Vitic Vol 46(3) 375-379
106
Filippetti I 2009 Technological and Phenolic ripening synchronization in winegrape Data has not
been published
Filippetti I Ramazzotti S Centinari M Bucchetti B Intrieri C 2007 Effects of cluster
thinning on grape composition experience ldquoSangioveserdquo grapevines Proc Int Workshop on
Advance in Grapevine and Wine Research
Fournand D Vicens A Sidhoum L Souquet JM Moutounet M Cheynier V 2006
Accumulation and extractability of grape skin tannins and anthocyanins at different advanced
physiological stages J Agric Food Chem Vol 54 7331-7338
Fraser E 2008 ldquoCrop yield and climate changerdquo Retrieved on 2009-09-14
Fujita A Soma N Goto-Yamamoto N Mizuno A Kiso K Hashizume K 2007 Effect of
shading on proanthocyanidin biosynthesis in the grape berry J Japan Soc Hort Sci Vol 76 112-
119
Fujita A Goto-Yamamoto N Aramaki I Hashizume K 2006 Organ-Specific Transcription
of Putative Flavonol Synthase Genes of Grapevine and Effects of Plant Hormones and Shading on
Flavonol Biosynthesis in Grape Berry Skins J Biosci Biotech and Biochem Vol 70 (3) 632-
638
Gagneacute S Lacampagne S Claisse O Geacuteny L 2009 Leucoanthocyanidin reductase and
anthocyanidin reductase gene expression and activity in flowers young berries and skins of Vitis
vinifera L cv Cabernet-Sauvignon during development J Plant Physiol amp Biochem Vol 47 (4)
282ndash290
Gatto P Vrhovsek U Muth J Segala C Romualdi C Fontana P Pruefer D Stefanini M
Moser C Mattivi F Riccardo Velasco R 2008 Ripening and genotype control stilbene
accumulation in healthy grapes J Agric Food Chem Vol 56 (24) 11773ndash11785
Gollop R Even S Colova-Tsolova V Peri A 2002 Expression of the grape dihydroflavonol
reductase gene and analysis of its promoter region J Exp Bot Vol 53 1397ndash1409
Gollop R Farhi S Perl A 2001 Regulation of the leucoanthocyanidin dioxygenase gene
expression in Vitis vinifera J Plant Sci Vol 161 (3) 579ndash588
Goto-Yamamoto N Mori K Numata M Koyama K Kitayama M 2009 Effects of
temperature and water regimes on flavonoid contents and composition in the skin of red-wine
grapes J Int Sci Vigne Vin Vol 43 (1) 75-80
Goto-Yamamoto N Wan GH Masaki K Kobayashi S 2002 Structure and transcription of
three chalcone synthase genes of grapevine (Vitis vinifera) J Plant Sci Vol 162 867-872
107
Greer D H Weston C 2010 Heat stress affects flowering berry growth sugar accumulation and
photosynthesis of Vitis vinifera cv Semillon grapevines grown in a controlled environment J
Functional Plant Biol Vol 37(3) 206ndash214
Guidoni S Ferrandino A Novello V 2008 Effects of seasonal and agronomical practices on
skin anthocyanin profile of Nebbiolo grapes JAm J Enol Vitic Vol 59(1) 22-29
Guidoni S Ferrandino A Novello V 2004 Ruolo del clima e degli interventi colturali sulla
sintesi degli antociani nellrsquouva (Vitis Vinifera L cv Nebbiolo) J Quad Vitic Enol Univ Torino
27
Guidoni S P Allara and A Schubert 2002 Effect of cluster thinning on berry skin anthocyanin
composition of Vitis vinifera cv Nebbiolo Am J Enol Vitic V 53224-226
Harbertson JF Kennedy JA Adams DO 2002 Tannin in skins and seeds of Cabernet
Sauvignon Syrah and Pinot noir berries during ripening J Am J Enol Vitic Vol 53 (1) 54-59
Hardie WJ OrsquoBrien TP Jaudzems VG 1996 Morphology anatomy and development of the
pericarp after anthesis in grape Vitis vinifera L J Aust J Grape Wine Res Vol 2 97ndash142
Haselgrove L Botting D Van Heeswijck R Hoslashj PB Dry PR Ford C Iland PG 2000
Canopy microclimate and berry composition The effect of bunch exposure on the phenolic
composition of Vitis vinifera L cv Shiraz grape berries J Aust J Grape Wine Res Vol 6 141-
149
Hawker JS 1969a Changes in the activities of enzymes concerned with sugar metabolism during
the development of grape berries J Phytochem Vol 8 9-17
Hawker JS 1969b Insoluble invertase from grapes an artefact of extraction J Phytochem Vol
8 337-344
Hellens RP Edwards EA Leyland NR Bean S Mullineaux PM 2000 pGreen a versatile
and flexible binary Ti vector for Agrobacterium-mediated plant transformation J Plant Mol Biol
Vol 42 819-832
Hiratsuka S Onodera H Kawai Y Kubo T Itoh H Wada R 2001 ABA and sugar effects on
anthocyanin formation in grape berry cultured in vitro J Scientia Horticulturae Vol 90 (1-2) 121-
130Hrazdina G Parsons GF Mattick LR 1984 Physiological and biochemical events during
development and maturation of grape berries J Amer J Enol Vitic Vol 35 (4) 220ndash227
Huglin P 1978 Nouveau Mode drsquoEacutevaluation des Possibiliteacutes Heacuteliothermiques drsquoun Milieu
Viticole CR Acad Agr France Vol 64 1117-1126
Hugueney P Provenzano S Verriegraves C Ferrandino A Meudec E Batelli G Merdinoglu D
Cheynier V Schubert A Ageorges A 2009 A novel cation-dependent o-methyltransferase
involved in anthocyanin methylation in grapevine J Plant Physiol Vol 150 (4) 2057- 2070
108
Intrieri C 1994 Vini frizzanti interventi agronomici per il controllo della maturazione J
Lrsquoenotecnico Vol 9 65-72
Intrieri C Magnanini E Silvestroni O 1983 Effetti della potatura verde sul comportamento
vegetativo e produttivo di Albana e Sangiovese J Vignevini Vol 5 57-62
Intrieri C Silvestroni O Poni S 1994 ndash Pluker nuova defogliatrice polivalente per vigneti
Vignevini Vol 1-2 25 ndash 31
involvement of leucoanthocyanidin dioxygenase J Planta Vol 229( 2) 427-445
J Planta Vol 192(4) 567-573
Jackman RL Smith JL 1996 Anthocyanins and betalains In Hendry GAF Houghton JD eds
Natural food colorants 2nd
edn London Chapman amp Hall pp 244ndash309
Jeong ST Goto-Yamamoto N Kobayashi S Esaka M 2004 Effects of plant hormones and
shading on the accumulation of anthocyanins and the expression of anthocyanin biosynthetic genes
in grape berry skins J Plant Sci Vol 167 247-252
Jeong ST Goto-Yamamoto N Hashizume K Esaka M 2006 Expression of the flavonoid 3prime-
hydroxylase and flavonoid 3prime5prime-hydroxylase genes and flavonoid composition in grape (Vitis
vinifera) Plant Sci Vol 170 (1) 61ndash69
Jiang YM Duan X Joyce D Zhang Z Li J 2004 Advances in understanding of enzymatic
browning in harvested litchi fruit J Food Chem Vol 88 443ndash446
Jones GV White MA Cooper OR Storchmann K 2005 Climate change and global wine
quality J Climatic Change Vol 73 319ndash343
Kader F Haluk JP Nicolas JP Metche M 1998 Degradation of cyanidin 3-glucoside by
blueberry polyphenol oxidase kinetic studies and mechanisms J Agric Food Chem Vol 46
3060ndash 3065
Kader F Nicolas JP Metche M 1999 Degradation of pelargonidin 3-glucoside in the presence
of chlorogenic acid and blueberry polyphenol oxidase J Sci Food Agric Vol 79 517ndash522
Kader F Rovel B Girardin M Metche M 1997 Mechanism of browning in fresh highbush
blueberry fruit (Vaccinium corymbosum L) Role of blueberry polyphenol oxidase chlorogenic acid
and anthocyanins J Sci Food Agric Vol 74(1) 31ndash34
Karimi M Inzeacute D Depicker A 2002 GATEWAYtrade vectors for Agrobacterium-mediated plant
transformation J Trends in Plant Sci Vol 7(5) 193ndash195
Kemp BS Harrison R Creasy GL 2011 Effect of mechanical leaf removal and its timing on
flavan-3-ol composition and concentrations in Vitis vinifera L cv Pinot Noir wine J Aust J Grape
Wine Res Vol 17(2) 270ndash279
109
Kennedy JA Jones GV 2001 Analysis of Proanthocyanidin Cleavage Products Following
Acid-Catalysis in the Presence of Excess Phloroglucinol Amer J Enol Vitic Vol 49(4) 1740-
1746
Kennedy JA Matthews MA Waterhouse AL 2000 Changes in grape seed polyphenols during
fruit ripening J Phytochem Vol 55 77-85
Kennedy JA Matthews MA Waterhouse AL 2002 Effect of maturity and vine water status
on grape skin and wine flavonoids J Am J Enol Vitic Vol 53 268-274
Kennedy JA Saucier C Glories Y 2006 Grape and Wine Phenolics History and Perspective
J Am J Enol Vitic Vol 57 (3) 239-248
Kenny GJ Harrison PA 1992 The effects of climate variability and change on grape suitability
in Europe J Wine Res Vol 3 163ndash183
King P McClellan D Smart R 2012 Effect of severity of leaf and crop removal on grape and
wine composition of Merlot vines in Hawkersquos bay vineyards J Am J Enol Vitic ajev201212020
Kliewer W M 1970 Effect of day temperature and light intensity on coloration of Vitis vinifera
grapes J Amer Soci Hort Sci Vol 95 693ndash697
Kliewer W M Torres R E 1972 Effect of controlled day and night temperatures on grape
coloration J Amer J Enol Vitic Vol 23 71ndash77
Kliewer W Dokoozlian N 2005 Leaf areacrop weight ratios of grapevines influence on fruit
composition and wine quality J Am J Enol Vitic Vol 56(2) 170-181
Kliewer WM 1966 Sugars and organic acids of Vitis Vinifera J Plant PhysiolVol 41 923-931
Kliewer WM 1977 Influence of temperature solar radiation and nitrogen on coloration and
composition of Emperor Grapes J AmJ Enol Vitic Vol 28 (2) 96-103
Kobayashi S Goto-Yamamoto N Hirochika H 2004 Retrotransposon-induced mutations in
grape skin color J Sci Vol 304 (5673) 982 p
Kobayashi S Ishimaru M Ding CK Yakushiji H Goto N 2001 Comparison of UDP-
glucose flavonoid 3-O-glucosyltransferase (UFGT) gene sequences between white grapes (Vitis
vinifera) and their spots with red skin J Plant Sci Vol 160 543-550
Kobayashi S Ishimaru M Hiraoka K Honda C 2002 Myb-related genes of the Kyoho grape
(Vitis labruscana) regulate anthocyanin biosynthesis J Planta Vol 215 924-933
Kriedemann P E 1968 Photosynthesis in vine leaves as a function of light intensity temperature
and leaf age J Vitis Vol 7 213-220
Kuznetsov V V Shevyakova N I 2007 Polyamines and stress tolerance of plants Global science
books Plant stress Vol 1(1) 50-71
110
Laget F Tondut J L Deloire A Kelly M T 2008 Climate trends in a specific Mediterranean
viticultureal area between 1950 and 2006 J Int Sci Vigne Vin Vol 42 (3) 113-123
Lakso A N Kliewer W M 1975 The Influence of Temperature on Malic Acid Metabolism in
Grape Berries J Plant Physiol Vol 56 (3) 370-372
Landy A 1989 Dynamic structural and regulatory aspects of site-specific recombination J Ann
Rev Biochem Vol 58 913ndash949
Larronde F Krisa S Decendit A Chegraveze C Deffieux G Meacuterillon J M 1998 Regulation of
polyphenol production in Vitis vinifera cell suspension cultures by sugars JPlant Cell Reports Vol
17(12) 946-950
Leyva A Jarillo J Salinas J Martinez-Zapater M 1995 Low temperature induces the
accumulation of phenylalanine ammonia-lyase and chalcone synthase mRNAs of Arabidopsis
thaliana in a light-dependent manner J Plant Physiol Vol 108 39ndash46
Lin-Wang K Micheletti D Palmer J Volz R Lozano L 2011 High temperature reduces apple
fruit colour via modulation of the anthocyanin regulatory complex J Plant Cell amp Environment
Vol 34(7) 1176ndash1190
Lo Piero A R Puglisi I Rapisarda P Petrone G 2005 Anthocyanins accumulation and related
gene expression in red orange fruit induced by low temperature storage J Agric Food Chem Vol
53 9083ndash9088
Lough J M Wigley T M L Palutikof J P 1983 Climate and climate impact scenarios for
Europe in a warmer world J Clim Appl Meteorol Vol 22 1673ndash1684
Loslashvdal T Olsen K M Slimestad R Verheul M Lillo C 2010 Synergetic effects of nitrogen
depletion temperature and light on the content of phenolic compounds and gene expression in
leaves of tomato J Phytochemistry Vol 71(5ndash6) 605ndash613
Makra L Vitaacutenyi B Gaacutel A Mika J Matyasovszky I Hirsch T 2009 Wine Quantity and
Quality Variations in Relation to Climatic Factors in the Tokaj (Hungary) Winegrowing Region
Amer J Enol Vitic Vol 60 (3) 312-321
Mann M E Bradley R S Hughes M K 1998 Global-scale temperature patterns and climate
forcing over the past six centuries J Nature Vol 392 779-787
Matsui S Ryugo K Kliewer W M 1986 Growth inhibition of Thompson Seedless and Napa
Gamay berries by heat stress and its partial reversibility by applications of growth regulators J Am
J Enol Vitic Vol 37 (1) 67-71
Mattivi F Guzzon R Vrhovsek U Stefanini M Velasco R 2006 Metabolite profiling of
grape Flavonols and anthocyanins J Agric Food Chem Vol 54 (20) 7692-7702
111
Mazza G Fukumoto L Delaquis P Girard B Ewert B1999 Anthocyanins Phenolics and
Color 426 of Cabernet Franc Merlot and Pinot Noir wines from British Columbia J Agric Food
Chem 474009-427 4017 Menting J G T Scopes R K Stevenson T W 1994
Characterization of Flavonoid 3rsquo5rsquo-Hydroxylase in Microsomal Membrane Fraction of Petunia
hybrida Flowers J Plany Physiol Vol 106 (2) 633- 642
Mazza G Miniati E 1993 Color stabilization and intensification In Mazza G Miniati E (eds)
Anthocyanins in Fruits Vegetables and Grains CRC Press Boca Raton pp 1ndash20
Meyer P Heidmann I Forkmann G Saedler H 1987 A new petunia flower colour generated
by transformation of a mutant with a maize gene J Nature Vol 330 677-678
Mol J 1998 How genes paint flowers and seeds J Trends in Plant Sci Vol 3 212-217
Morais H Ramos C Forgacs E Cserhati T Matos N Almeida V Oliveira J 2002
Stability of anthocyanins extracted from grape skins J Chromatographia Vol 56 173ndash175
Mori K Goto-Yamamoto N Kitayama M Hashizume K 2007a Loss of anthocyanins in red-
wine grape under high temperature J Experimental Botany Vol 58 (8) 1935-1945
Mori K Goto-Yamamoto N Kitayama M Hashizume K 2007a Effect of high temperature on
anthocyanin composition and transcription of flavonoid hydroxylase genes in ldquoPinot noirrdquo grapes
(Vitis vionifera) J Hortic Sci Biotechnol Vol 82 (2) 199-206
Mori K Saito H Goto-Yamamoto N Kitayama M Kobayashi S Sugaya S Gemma H
Hashizume K 2005a Effects of abscisic acid treatment and night temperatures on anthocyanin
composition in lsquoPinot noirrsquo grapes J Vitis Vol 44 161ndash165
Mori K Sugaya S Gemma H 2005b Decreased anthocyanin biosynthesis in grape berries
grown under elevated night temperature condition J Sci Hortic Vol 105 319ndash330
Movahed N Maeiyat MM 2009 Phytoremediation and sustainable urban design methods (Low
Carbon Cities through Phytoremediation) 45th ISOCARP Congress Disponible en
httpwwwisocarpnet Fecha de consulta 04 Septiembre del 2009
Movahed N Masia A Cellini A Pastore C Valentini G Allegro G Filippetti I 2011
Biochemical approaches to study the effects of temperature on grape composition in cv Sangiovese
The 17th
International GIESCO Symposium Asti Italy The proceeding PP 393- 397
Munneacute-Bosch S Alegre L 2004 Die and let live leaf senescence contributes to plant survival
under drought stress J Funct Plant Biol Vol 31 203-216
Nissim-Levi A Kagan S Ovadia R Oren-Shamir M 2003 Effects of temperature UV-light
and magnesium on anthocyanin pigmentation in cocoplum leaves J Hortic Sci Biotechnol Vol
78 61-64
112
Oren-Shamir M Levi-Nissim A 1997a Temperature effects on the leaf pigmentation of Cotinus
coggygria lsquoRoyal Purplersquo J Hortic Sci Vol 72 425ndash432
Oren-Shamir M Levi-Nissim A 1997b UV-light effect on the leaf pigmentation of Cotinus
coggygria lsquoRoyal Purplersquo J Sci Hortic Vol 71 59ndash66
Oren-Shamir M Nissim-Levi A 1999 Temperature and gibberellin effects on growth and
anthocyanin pigmentation in Photinia leaves J Hortic Sci Biotechnol Vol 74 355ndash360
Palliotti A Poni S Berrios JG Bernizzoni F 2010 Vine performance and grape composition
as affected by early-season source limitation induced with anti-transpirants in two red Vitis vinifera
L cultivars J Aust J Grape Wine Res Vol 16 426ndash433
Pastore C 2010 Reserches on berry composition in red grape agronomical biochemical and
molecular approaches Tesi di Dottorato di ricerca in Colture Arboree ed Agrosistemi Forestali e
Paesaggistici XXII ciclo Faculta di Agraria Universita di Bologna
Pereira GE Gaudillere JP Pieri P Hilbert G Maucourt M Deborde C Moing A Roil D
2006 Microclimate influence in mineral and metabolic profiles of grape berries J Agric Food
Chem Vol 54 6765-6775
Pirie A Mullins M1976 Changes in anthocyanin and phenolics content of grapevine leaf and
fruit tissues treated with sucrose nitrate and abscisic acid J Plant Physiol Vol 58(4) 468-472
Pourcel L Routaboul J M Cheynier V Lepiniec L Debeaujon I 2006 Flavonoid oxidation
in plants from biochemical properties to physiological functions JTrends in Plant Sci Vol 12 (1)
29-36
Price SF Breen PJ Valladao M Watson BT 1995 Cluster sun exposure and quercetin in
Pinot noir grapes and wine AmJ Enol Vitic Vol 46 187-194
Quattrocchio F Baudry A Lepiniec L Grotewold E 2006 The regulation of flavonoid
biosynthesis J The science of flavonoids C Springer Chapter 4 pp 97ndash122
Rebucci B Poni S Intrieri C Magnanini E Lakso A N 1997 Effects of manipulated grape
berry transpiration on post-veraison sugar accumulation J Aust J Grape Wine Res Vol 3 57-65
Reynolds A Price S Wardle D Watson B 1994 Fruit environment and crop level effects on
Pinot noir I vine performance and fruit composition in British Columbia J Am J Enol Vitic Vol
45(4) 452-459
Reynolds A Wardle D 1989 Influence of fruit microclimate on monoterpene levels of
Gewuumlrztraminer J Am J Enol Vitic Vol 40(3) 149-154
113
Ristic R Bindon K Francis LI Herderich M J Iland PG 2010 Flavonoids and C13-
norisoprenoids in Vitis vinifera L cv Shiraz relationships between grape and wine composition
wine colour and wine sensory properties J Aust J Grape Wine Res Vol 16 369ndash388
Ristic R Downey M Iland P Bindon K Francis I Herderich M Robinson S 2007
Exclusion of sunlight from Shiraz grapes alters wine colour tannin and sensory properties J Aust
J Grape Wine Res Vol 13(2)53-65
Robinson S P Davies C 2000 Molecular biology of grape berry ripening J Aust J Grape Wine
Res Vol 6 175-188
Robinson S 2006 Colour and tannin during berry development and ripening In ldquoFinishing the
jobrdquo ASVO proceedings held 21 July 2006 Mildura Vic Australia pp 11-14
Roby G Harbertson J F Adams D A Matthews M A 2004 Berry size and vine water
deficits as factors in winegrape composition anthocyanins and tannins J Aust J Grape Wine Res
Vol 10 100- 107
Rolland F Baena-Gonzalez E Sheen J 2006 Sugar sensing and signaling in plants Conserved
and novel mechanisms J Ann Rev Plant Biol Vol 57 675-709
Romero C Bakker J 2000 Effect of storage temperature and pyruvate on kinetics of anthocyanin
degradation Vitisin A derivative formation and color characteristics of model solutions J Agric
Food Chem Vol 48 2135ndash2141
Sadras V 2007 Evolutionary aspects of the trade-off between seed size and number in crops J
Field crop research Vol 100(2-3) 125-138
Sadras VO Petrie P R Moran M A 2013 Effects of elevated temperature in grapevine II juice
pH titratable acidity and wine sensory attributes Australian Journal of Grape and Wine Research
Vol 19 (1) 107ndash115
Sarni P Fulcrand H Souillol V Souquet J M Cheynier V 1995 Mechanisms of anthocyanin
degradation in grape must-like model solutions J Sci Food Agr Vol 69(3) 385ndash391
Scholefield PB May P Neales TF 1977 Harvest-pruning and trellising of lsquoSultanarsquo vines II
Effects on early spring development Sci Hortic Vol 7123-132
Schultz H R 1995 Grape canopy structure light microclimate and photosynthesis I A two
dimensional model of the spatial distribution of surface area densities and leaf ages in two canopy
systems J Vitis Vol 34 211-215
Schultz H R 2000 Climate change and viticulture a European perspective on climatology carbon
dioxide and UV-B effects Aust J Grape Wine Res Vol 6 2ndash12
114
Schultz H R 2003 Extension of a Farquhar model for limitations of leaf photosynthesis induced
by light environment phenology and leaf age in grapevines (Vitis vinifera L cvv White Riesling
and Zinfandel)J Functional Plant Biol Vol 30(6) 673 ndash 687
Sepuacutelveda G Kliewer W M Ryugo K 1986 Effect of high temperature on grapevines (Vitis
vinifera L) I translocation of 14
C-photosynthates J Am J Enol Vitic Vol 37 (1) 13-19
Shaked-Sachray L Weiss D Moshe R Nissim-Levi A Oren- Shamir M 2002 Increased
anthocyanin accumulation in aster flowers at elevated temperatures due to magnesium treatment J
Physiol Plant Vol 114 559ndash565
Shvarts M Borochov A Weiss D 1997 Low temperature enhances petunia flower pigmentation
and induces chalcone synthase gene expression J Physiol Plant Vol 99 67ndash72
Sipiora M J Gutieacuterrez-Granda M J 1998 Effects of pre-veraison irrigation cutoff and skin
contact time on the composition color and phenolic content of young Cabernet Sauvignon wines in
Spain J Amer J Enol Vitic Vol 49 152ndash162
Smart R E 1985 Principles of grapevine canopy microclimate manipulation with implication for
yield and quality J Amer J Enol Vitic Vol 36 230-239
Smith G J Markham K R 1998 Tautomerism of flavonol glucosides - relevance to plant UV
protection and flower colour J Photochem Photobiol A ndash Chem Vol 118 99-105
Soar C J Collins M J Sadras V O 2009 Irrigated Shiraz vines (Vitis vinifera) up regulate gas
exchange and maintain berry growth in response to short spells of high maximum temperature in the
field J Functional Plant Biology Vol 36(9) 801ndash814
Sparvoli F Martin C Scienza A Gavazzi G Tonelli C 1994 Cloning and molecular analysis
of structural genes involved in flavonoid and stilbene biosynthesis in grape (Vitis Vinifera L) J
Plant Molecular Biology Vol 24 743-755
Spayd S E Tarara J M Mee D L Ferguson J C 2002 Separation of sunlight and
temperature effects on the composition of Vitis vinifera cv Merlot berries J Amer J Enol Vitic
Vol 53171-182
Spelt C 2002 Anthocyanin1 of petunia controls pigment synthesis vacuolar pH and seed coat
development by genetically distinct mechanisms The plant cell online Vol 14 2121-2135
Stafford H A 1990 Flavonoid Metabolism CRC Press Boca Raton FL 298 pp
Stracke R De Vos R C H Bartelniewoehner L Ishihara H Sagasser M Martens
S Weisshaar B 2009 Metabolomic and genetic analyses of flavonol synthesis in Arabidopsis
thalianasupport the in vivo
115
Taureilles-Saurel C Romieu C G Robin J P Flanzy C 1995 Grape (Vitis vinifera L) malate
dehydrogenase II Characterization of the major mitochondrial and cytosolic isoforms and their role
in ripening J Am J Enol Vitic Vol 46 (1) 29-36
Tomana T Utsunomiya N Kataoka I 1979 The effect of environmental temperatures on fruit
ripening on the tree II The effect of temperatures around whole vines and clusters on the coloration
of lsquoKyohorsquo Grapes Japan Soc Hort Sci Vol 48 261-266
Treutter D 2006 Significance of flavonoids in plant resistance a review J Environ Chem Lett
Vol 4 147ndash157
Ubi BW Honda C Bessho H Kondo S Wada M Kobayashi S Moriguchi T 2006
Expression analysis of anthocyanin biosynthetic genes in apple skin effect of UV-B and
temperature J Plant Sci Vol 170 571ndash578
Ushimaru T Maki Y Sano S Koshiba K Asada K Tsuji H 1997 Induction of enzymes
involved in the ascorbate-dependent antioxidative system namely ascorbate peroxidase
monodehydroascorbate reductase and dehydroascorbate reductase after exposure to air of rice
(Oryza sativa) seedlings germinated under water J Plant Cell Physiol Vol 38 541-549
Vaknin H Bar-Akiva A Ovadia R Nissim-Levi A Forer I Weiss D Oren-Shamir M
2005 Active anthocyanin degradation in Brunfelsia calycina (yesterday-today-tomorrow) flowers J
Planta Vol 222 19ndash26
Venturini L 2009 Study of some gene families involved in anthocyanin accumulation during Vitis
vinifera berry ripening Tesi di laurea specialistica in biotechnologie agro-industriali faculta di
scienze matematiche fisichie e naturali Universita degli studi di Verona pp7-12 30-51
Wahid A Perveen M Gelani S Basra SMA 2007 Pretreatment of seed with H2O2 improves
salt tolerance of wheat seedlings by alleviation of oxidative damage and expression of stress
proteins J Plant Physiol Vol 164 (3) 283ndash294
Walker AR Lee E Bogs J McDavid D A J Thomas M R Robinson S P 2007 White
grapes arose through the mutation of two similar and adjacent regulatory genes The Plant journal
for cell and molecular biology Vol 49 772-85
Walker J R Ferrar P H 1998 Diphenol oxidases enzymecatalysed browning and plant disease
resistance J Biotechnol Genet Eng Rev Vol 15 457ndash498
Waterhouse A L 2002 Wine Phenolics Ann NY Acad Sci Vol 957 21-36
Watson RT Rodhe H Oeschger H Siegenthaler U 1990 Greenhouse gases and aerosols
httprivernetncsuedu
116
Welinder K G Justesen A F Kjaeligrsga I V H Jensen R B Rasmussen S K Jespersen H M
Duroux L 2002 Structural diversity and transcription of class III peroxidases from Arabidopsis
thaliana J Eur J Biochem Vol 269 6063ndash6081
Wen Y Zhang Y Pan Q 2009 Progress of organic acids in grape berries Natural science
journal of Hainan University S6631
Williams R J Spencer J P Rice-Evans C 2004 Flavonoids antioxidants or signaling
molecules J Free Radic Biol Med Vol 36 838ndash849
Winkel-Shirley B 2002 Biosynthesis of flavonoids and effects of stress J Current opinion in
plant biology Vol 5 218-23
Winkler A J Cook J A Kliewer W M Lider L A 1962 Development and composition of
grapes General viticulture Berkeley CA University of California Press pp 141ndash196
Xie DY Sharma S B Paiva N L Ferreira D Dixon R A 2003 Role of anthocyanidin
reductase encoded by BANYULS in plant flavonoid biosynthesis J Science Vol 299 396ndash399
Yamane T Jeong S T Goto-Yamamoto N Koshita Y Kobayashi S 2006 Effects of
temperature on anthocyanin biosynthesis in grape berry skins J Amer J Enol Vitic Vol 57 54ndash
59
Yamasaki H Sakihama Y Ikehara N 1997 Flavonoid-peroxidase reaction as a detoxification
mechanism of plant cells against H2O2 J Plant Physiol Vol 115 1405-1412
Yokotsuka K Singleton V L 1997 Disappearance of anthocyanins as grape juice is prepared and
oxidized with PPO and PPO substrates J Am J Enol Vitic Vol 48 (1) 13-25
Yoruk R Marshal R M 2003 Physiocochemical properties and function of plant polyphenol
axidase A review J Food Biochem Vol 27 361-422
Yu D J Kim S J Lee H J 2009 Stomatal and non-stomatal limitations to photosynthesis in
field-grown grapevine cultivars J Biologia Plantarum Vol 53 (1) 133-137
Zsoacutefi Z Vaacuteradi G Baacutelo B Marschall M Nagy Z Dulai S 2009 Heat acclimation of
grapevine leaf photosynthesis mezo- and macroclimatic aspects J Functional Plant Biology
Vol 36(4) 310ndash322