Embed Size (px)
Citation preview

Scientific Investigations Report 2018–5040
Prepared in cooperation with the Washington County Water Conservancy District and the Bureau of Reclamation Colorado River Basin Salinity Control Program
Effects of Groundwater Withdrawals From the Hurricane Fault Zone on Discharge of Saline Water From Pah Tempe Springs, Washington County, Utah
U.S. Department of the InteriorU.S. Geological Survey

Cover photograph: Partial overview of the Pah Tempe Springs study reach along the Virgin River showing the excavated sump structure (bottom center) where test pumping occurred in November 2013, the Quail Creek Diversion pipeline upstream of all spring discharge (right of center), and the grotto spring pools downstream (left center) in the distance. Photograph by Philip Gardner, U.S. Geological Survey, taken November 2013. View looking downstream toward the west.

Effects of Groundwater Withdrawals From the Hurricane Fault Zone on Discharge of Saline Water From Pah Tempe Springs, Washington County, Utah
By Philip M. Gardner
Prepared in cooperation with the Washington County Water Conservancy District and the Bureau of Reclamation Colorado River Basin Salinity Control Program
Scientific Investigations Report 2018–5040
U.S. Department of the InteriorU.S. Geological Survey

U.S. Department of the InteriorRYAN K. ZINKE, Secretary
U.S. Geological SurveyWilliam H. Werkheiser, Deputy Director
exercising the authority of the Director
U.S. Geological Survey, Reston, Virginia: 2018
For more information on the USGS—the Federal source for science about the Earth, its natural and living resources, natural hazards, and the environment—visit https://www.usgs.gov or call 1–888–ASK–USGS.
For an overview of USGS information products, including maps, imagery, and publications, visit https://store.usgs.gov.
Any use of trade, firm, or product names is for descriptive purposes only and does not imply endorsement by the U.S. Government.
Although this information product, for the most part, is in the public domain, it also may contain copyrighted materials as noted in the text. Permission to reproduce copyrighted items must be secured from the copyright owner.
Suggested citation:Gardner, P.M., 2018, Effects of groundwater withdrawals from the Hurricane Fault zone on discharge of saline water from Pah Tempe Springs, Washington County, Utah: U.S. Geological Survey Scientific Investigations Report 2018–5040, 41 p., https://doi.org/10.3133/sir2018-5040. ISSN 2328-0328 (online)

iii
ContentsAbstract ..........................................................................................................................................................1Introduction ....................................................................................................................................................1
Purpose and Scope .............................................................................................................................3Hydrogeologic Setting ........................................................................................................................3
Approach and Methods ...............................................................................................................................6November 2013 Test ............................................................................................................................8February 2014 Test ...............................................................................................................................8November 2014 Test ............................................................................................................................9Data Collection .....................................................................................................................................9
Discharge and Water-Level Measurements ........................................................................10Sample Collection and Analysis .............................................................................................12
Results ..........................................................................................................................................................12Water Levels and Drawdown ..........................................................................................................12River and Spring Discharge .............................................................................................................16Water Chemistry .................................................................................................................................19Water Temperature ............................................................................................................................26Non-Pumping Spring Discharge ......................................................................................................27Pumping Effects on Spring Capture and Dissolved-Solids Load ................................................27
Discussion ....................................................................................................................................................31Summary and Conclusions ........................................................................................................................35Acknowledgments ......................................................................................................................................36References Cited .........................................................................................................................................36Appendix 1. Data Tables ............................................................................................................................38Appendix 2. Estimate of Aquifer Transmissivity Using a Distance-Drawdown Analysis on
Data From the February 2014 Test ..............................................................................................39Appendix 3. Pumping Effects on Spring Capture and Dissolved-Solids Load During the
November 2013 Test ......................................................................................................................40
Figures
1. Map showing location of the Pah Tempe Springs study area at the mouth of Timpoweap Canyon along the Hurricane Fault, Washington County, Utah ...........................2
2. Conceptual block diagram showing hydrogeology of the Pah Tempe Springs study area in relation to the Hurricane Fault, the Virgin River, and the zone of hot springs, Washington County, Utah ...............................................................................................................4
3. Schematic diagram showing design of interference tests conducted to monitor pumping-induced capture of Pah Tempe Springs along a reach of the Virgin River, Washington County, Utah ...............................................................................................................6
4. Photographs showing original sump structure and improved sump structure used for pumping thermal water from the fractured carbonate-rock aquifer during Pah Tempe Springs interference testing .........................................................................7
5. Photograph showing pipelines used to transport pumping discharge to the Virgin River below the study reach during each of the interference tests at Pah Tempe Springs, Washington County, Utah ...............................................................................................8

iv
6. Aerial photograph showing field sites monitored during the pumping interference tests at Pah Tempe Springs, Washington County, Utah ............................................................9
7. Photographs showing Virgin River discharge measurement sites during the Pah Tempe Springs interference tests upstream of the Pah Tempe Springs reach at PTVRU during the low-flow tests of November 2013 and February 2014, downstream of the springs reach at PTVR, upstream of the springs reach at PTVRU during the high-flow test of November 2014, and downstream of the springs reach at PTVRL .........11
8. Diagram showing pre-pumping water-level altitudes representing the hydraulic head in the thermal spring groundwater system during February 2014, compared to streambed altitudes shown in cross section along the Pah Tempe Springs reach of the Virgin River, Washington County, Utah ...........................................................................13
9. Graphs showing drawdown compared to pumping rate for the three observation wells during each of the three interference tests at Pah Tempe Springs, Washington County, Utah .............................................................................................................14
10. Graph showing change in stage at two U.S. Geological Survey gaging stations on the Virgin River, above and below the Pah Tempe Springs study reach during the November 2013 interference test ........................................................................................15
11. Photographs showing core samples from observation wells drilled into cemented alluvium adjacent to the Virgin River in the Pah Tempe Springs study reach, showing large connected pore spaces .....................................................................................16
12. Graphs showing discharge measured in the Virgin River above and below the study reach compared to pumping rate during each of the three interference tests at Pah Tempe Springs, Washington County, Utah ..........................................................17
13. Photographs showing man-made pools below the grotto spring and the weir used to monitor discharge during the three interference tests at Pah Tempe Springs, Washington County, Utah .............................................................................................................18
14. Graphs showing discharge from the grotto spring compared to pumping rate during each of the three interference tests at Pah Tempe Springs, Washington County, Utah ...19
15. Photograph showing sediment in discharge from a spring outlet along the Virgin River, occurring part way through the second interference test in February 2014, at Pah Tempe Springs, Washington County, Utah ...................................................................20
16. Graphs showing specific conductance and temperature of water measured in the pumping vaults compared to the pumping rate during the low-flow interference test of February 2014, and the high-flow interference test of November 2014, at Pah Tempe Springs, Washington County, Utah ................................................................................22
17. Graphs showing stable-isotope ratios of thermal spring and river waters in relation to the global and arid-zone meteoric water lines during the November 2013, February 2014, and November 2014 interference tests at Pah Tempe Springs, Washington County, Utah .............................................................................................................25
18. Aerial photograph showing water temperatures at individual spring discharge points measured prior to pumping during the second interference test in February 2014, at Pah Tempe Springs, Washington County, Utah ........................................26
19. Graph showing temperature compared to dissolved-solids concentration for samples collected during the February 2014 interference test from selected spring discharge points along the Pah Tempe Springs study reach, Washington County, Utah ...................................................................................................................................27
20. Graphs showing change in temperature for selected spring discharge points compared to pumping rate during the February 2014 interference test, and aerial photograph showing the location of these sites along the Pah Tempe Springs study reach, Washington County, Utah .......................................................................28

v
21. Photographs showing discrete springs discharging directly from gravel in the bed of the Virgin River, and through carbonate-cemented alluvium covered by a thin travertine deposit at Pah Tempe Springs, Washington County, Utah ...........................32
22. Conceptual block diagram showing thermal flow system discharging to Pah Tempe Springs and the Virgin River, Washington County, Utah .........................................................33
23. Diagrams showing water-level altitudes prior to and at the end of pumping that represent the hydraulic head in the thermal spring groundwater system during February 2014, compared to streambed altitudes, and a thermal spring hydraulic- head profile based on pumping from a single well at an alternate location along the Pah Tempe Springs reach of the Virgin River, Washington County, Utah .....................34
2-1. Screenshot of the “OUTPUT” worksheet from an EXCEL workbook used to perform the distance-drawdown analysis on data collected during the February 2014 interference test at Pah Tempe Springs, Washington County, Utah ....................................39
Tables
1. Field sites monitored during three interference tests at Pah Tempe Springs, Washington County, Utah .............................................................................................................10
2. Selected pre-pumping water-level altitudes for the thermal system compared to the altitude of the Virgin River streambed adjacent to each site for each of the three interference tests at Pah Tempe Springs, Washington County, Utah ..................................13
3. Selected discharge measurements at PTVRU and PTVRL, and total spring discharge at pre-pumping and steady-state conditions at the end of each pumping period during each of the three interference tests at Pah Tempe Springs, Washington County, Utah ...................................................................................................................................16
4. General chemical characteristics of selected surface- and groundwater sampling sites prior to the first pumping test at Pah Tempe Springs, Washington County, Utah .....21
5. Field parameters, dissolved-solids concentration, and stable-isotope values from surface- and groundwater sampling sites at Pah Tempe Springs, Washington County, Utah ...................................................................................................................................23
6. Discharge, dissolved-solids concentration, and dissolved-solids load from surface- and groundwater sampling sites at pre-pumping and approximate steady-state conditions at the end of each pumping period during the February 2014 interference test at Pah Tempe Springs, Washington County, Utah ............................................................29
7. Discharge, dissolved-solids concentration, and dissolved-solids load from surface- and groundwater sampling sites at pre-pumping, pumping, and approximate steady-state conditions at the end of each pumping period during the November 2014 interference test at Pah Tempe Springs, Washington County, Utah ....................................30
1–1. Selected information for field sites monitored during interference tests at Pah Tempe Springs, Washington County, Utah ................................................................................38
3–1. Discharge, dissolved-solids concentration, and dissolved-solids load from surface- and groundwater sampling sites at pre-pumping and approximate steady-state conditions at the end of each pumping period during the November 2013 interference test at Pah Tempe Springs, Washington County, Utah ....................................40

vi
Conversion Factors, Datums, and Water-Quality Units
Inch/Pound to International System of Units
Multiply By To obtain
Length
foot (ft) 0.3048 meter (m)mile (mi) 1.609 kilometer (km)
Volume
acre-foot (acre-ft) 1,233 cubic meter (m3)Flow rate
cubic foot per second (ft3/s) 0.02832 cubic meter per second (m3/s)gallon per minute (gal/min) 5.451 cubic meter per day (m3/d)
Transmissivity 1
foot squared per day (ft2/d) 0.09290 meter squared per day (m2/d)
Temperature in degrees Celsius (°C) can be converted to degrees Fahrenheit (°F) as follows: °F = (1.8 × °C) + 32.
Vertical coordinate information is referenced to the North American Vertical Datum of 1988 (NAVD 88).
Horizontal coordinate information is referenced to the North American Datum of 1983 (NAD 83).
Altitude, as used in this report, refers to distance above the vertical datum. 1 Transmissivity: The standard unit for transmissivity is cubic foot per day per square foot times foot of aquifer thickness [(ft3/d)/ft2]ft. In this report, the mathematically reduced form, foot squared per day (ft2/d), is used for convenience.
Concentration of chemical constituents in water is reported in milligrams per liter (mg/L) or micrograms per liter (µg/L). Milligrams per liter and micrograms per liter are units expressing the concentration of chemical constituents in solution as weight (grams) of solute per unit volume (liter) of water. A liter of water is assumed to weigh 1 kilogram, except for brines or water at high temperatures because of changes in the density of the water. For concentrations less than 7,000 mg/L or 7,000,000 µg/L, the numerical value is the same as for concentrations in parts per million or parts per billion, respectively. Specific conductance is given in microsiemens per centimeter at 25 degrees Celsius (µS/cm at 25 °C).
Stable-isotope ratios are reported as delta (δ) values, which are parts per thousand or permil (‰) differences from a standard.

Effects of Groundwater Withdrawals From the Hurricane Fault Zone on Discharge of Saline Water From Pah Tempe Springs, Washington County, Utah
By Philip M. Gardner
Abstract Pah Tempe Springs, located in Washington County, Utah,
contribute about 95,000 tons of dissolved solids annually along a 1,500-foot gaining reach of the Virgin River. The river gains more than 10 cubic feet per second along the reach as thermal, saline springwater discharges from dozens of orifices located along the riverbed and above the river on both banks. The spring complex discharges from fractured Permian Toroweap Limestone where the river crosses the north-south trending Hurricane Fault. The Bureau of Reclamation Colo-rado River Basin Salinity Control Program is evaluating the feasibility of capturing and desalinizing the discharge of Pah Tempe Springs to improve downstream water quality in the Virgin River. The most viable plan, identified by the Bureau of Reclamation in early studies, is to capture spring discharge by pumping thermal groundwater from within the Hurricane Fault footwall damage zone and to treat this water prior to returning it to the river.
Three multiple-day interference tests were conducted between November 2013 and November 2014, wherein thermal groundwater was pumped from fractured carbonate rock in the fault damage zone at rates of up to 7 cubic feet per second. Pumping periods for these tests lasted approximately 66, 74, and 67 hours, respectively, and the tests occurred with controlled streamflows of approximately 2.0, 3.5, and 24.5 cubic feet per second, respectively, in the Virgin River upstream from the springs reach. Specific conductance, water temperature, and discharge were monitored continuously in the river (upstream and downstream of the springs reach) at selected individual springs, and in the pumping discharge during each of the tests. Water levels were monitored in three observation wells screened in the thermal system. Periodic stream and groundwater samples were analyzed for dissolved-solids concentration and the stable isotopes of oxygen and hydrogen. Additional discrete measurements of field param-eters (specific conductance, water temperature, pH, and discharge) were made at up to 26 sites along the springs reach. These data demonstrate the interaction between the saline, thermal groundwater system and the Virgin River, and provide estimates of reductions in dissolved-solids loads to the river.
The interference tests show that pumping thermal ground-water from the shallow carbonate aquifer adjacent to the springs is effective at capturing high dissolved-solids loads discharging from Pah Tempe Springs before they enter the Virgin River. Discharge measurements made in the Virgin River downstream of the springs reach show that streamflow is reduced by approximately the amount pumped, indicating that complete capture of thermal discharge is possible. During the February 2014 test, the dissolved-solids load removed by pumping (190 tons per day) was approximately equal to the dissolved-solids load reduction observed in the river below the springs reach, indicating near 100-percent efficient capture of spring-sourced dissolved solids. However, an observed decrease in temperature and specific conductance of the pump-ing discharge during the high-flow test in November 2014 showed that capture of the cool, fresh river water can occur and is more likely at a higher stage in the Virgin River.
Introduction Pah Tempe Springs, also known as Dixie Hot Springs or La
Verkin Springs, are located along the Virgin River at the mouth of Timpoweap Canyon in Washington County, Utah (fig. 1). The springs are recognized as a substantial localized source of dissolved solids (salt) discharging to the Virgin River, which is a tributary to the Colorado River at Lake Mead. Estimates of the total dissolved-solids load from Pah Tempe Springs, associated with measurements made during 1960–82 and 1995–2010, ranged from 87,400 to 113,500 tons per year (ton/yr) and averaged 98,900 ton/yr (Gerner and Thiros, 2014). The Colorado River and its tributaries provide municipal and industrial water to about 40 million people and irrigation water to nearly 4 million acres of land in the United States. The river also serves about 2.3 million people and 500,000 acres in the Republic of Mexico. Salinity is a major concern in both the United States and Mexico for agricultural, municipal, and industrial water users. The Colorado River Basin Salinity Control Act, enacted in 1974 and amended in 1984, directs the Secretary of the Interior to enhance and protect the quality

2 Effects of Groundwater Withdrawals From the Hurricane Fault Zone on Discharge of Saline Water From Pah Tempe Springs
Figure 1. Location of the Pah Tempe Springs study area at the mouth of Timpoweap Canyon along the Hurricane Fault, Washington County, Utah.
Virgin River
Virgin River
17
113°16'113°17'
37°12'
37°11'
La Verkin
Hurricane,0.5 mile
Timpoweap Canyon
Hurricane Fault
Pah Tempe Zone of Hot Springs
0 1,000 1,500 2,000 Feet500
0 200 300 400 Meters100
Shaded relief base from Environmental Systems Research Institute World HillshadeHydrology from National Hydrography DatasetFault locations and geology modified from Biek and others, 2010Universal Transverse Mercator Projection, Zone 12, NAD 83
EXPLANATIONQuaternary alluviumPleistocene basaltic lava flowJurassic-Cretaceous sedimentary rocks
Triassic sedimentary rocksPaleozoic carbonate rocks
Hurricane Fault segments—Bar and ball on downthrown side
Focused area of study shown in cross section on figure 2
U T A H
80
15
40Salt Lake
City
15
70
Study area

Introduction 3
of water available in the Colorado River for use in the United States and the Republic of Mexico, and acting through the Bureau of Reclamation (Reclamation), to implement a basin-wide salinity control program.
Besides contributing to the dissolved-solids load of the Colorado River entering Lake Mead, discharge from Pah Tempe Springs affects downstream habitat and locally limits the range of use of Virgin River water. Pah Tempe Springs were studied by the Reclamation Colorado River Basin Salinity Control Program (CRBSCP) in the early 1970s and again in 1984 (Bureau of Reclamation, 1973, 1981, 1984a, b) for evaluating the feasibility of desalinization of the spring discharge to improve downstream water quality. These studies indicated significant uncertainty in the estimated potential reduction in dissolved solids discharged to the Colorado River and Lake Mead, due mainly to limited data regarding the quantity and fate of salinity loads and on streamflow seepage losses from the Virgin River downstream of the springs.
In 2007, the CRBSCP and Reclamation requested that the U.S. Geological Survey (USGS) re-assess the source, trans-port, and fate of dissolved solids from Pah Tempe Springs to the Virgin River. The goal of this effort was to determine if new data (collected since the 1984 Reclamation studies) and assessment techniques could improve the confidence in esti-mates of the reduction in dissolved solids discharged to Lake Mead that would result from a spring discharge desalinization project. The resulting USGS studies (Gerner, 2008; Gerner and Thiros, 2014) determined the average annual salt-load distri-bution in the river downstream of Virgin, Utah, for the period 1992–2010. These studies indicated that mitigating Pah Tempe Springs salt discharge would result in a dissolved-solids load reduction (assuming that all discharge from the springs were captured) of approximately 67,700 to 92,500 ton/yr, a substan-tially larger reduction than previously estimated. On the basis of these results, the Colorado River Basin Salinity Control Forum recommended that Reclamation and the USGS take further steps in assessing the feasibility of Pah Tempe Springs salinity load mitigation.
The most likely approach for removal of the Pah Tempe Springs salinity load from the Virgin River includes the pump-ing of thermal water from within the Hurricane Fault footwall damage zone to lower the hydraulic head (or the water table) at spring discharge locations and reduce or eliminate discharge from the springs to the river. The pumped groundwater would then be treated to reduce the amount of dissolved solids and returned to the river. This report summarizes the results of an investigation to evaluate (1) the groundwater withdrawal rate needed to capture a large percentage of saline spring discharge before it enters the river, (2) the water quality of the pumped discharge, and (3) the resulting change in water quality of the Virgin River below the springs. Results of this study will aid in understanding the hydraulic characteristics of the study area and will allow for assessment of the feasibility and effective-ness of a range of possible pumping scenarios to reduce salin-ity load to the river.
Purpose and Scope
Despite previous studies and reports, existing data are sparse regarding the hydraulic connection between the Virgin River and Pah Tempe Springs, and a rigorous evaluation of the hydraulic connection is needed to evaluate the feasibility of a salinity treatment system for reducing dissolved-solids loads in the Virgin River from Pah Tempe Springs. To estimate rates of river discharge capture for decision-making, interference tests were designed and conducted to determine the response of spring and river discharge to different rates of groundwater withdrawal from the shallow aquifer adjacent to the springs during different river conditions. The experiments included (1) monitoring changes in spring discharge and pumpage, water chemistry, and water temperature over time and under different pumping and streamflow conditions; and (2) monitor-ing changes in streamflow and stream-water chemistry within the reach of the river where the springs discharge.
Conceptual models of groundwater flow to the Pah Tempe Springs system indicate a possible mixture of thermal and Virgin River water. The interference tests were designed to observe the potential capture of fresh Virgin River water at dif-ferent streamflow and river stage conditions during pumping of shallow groundwater. The results of the tests were intended to provide data necessary to assess the fractions of thermal (saline) and freshwater captured by pumping and to aid in optimizing withdrawal scenarios that minimize freshwater capture. Test results were interpreted and synthesized into a conceptual model of hydraulic connectivity between shallow groundwater, the springs, and the Virgin River.
Hydrogeologic Setting
Pah Tempe Springs issue through fractured Permian-age Toroweap Limestone at multiple points in the riverbed of the Virgin River and along either bank on the east side (footwall) of the Hurricane Fault. Spring discharge occurs along a 1,500-foot (ft) gaining reach of the Virgin River channel beginning at the base of a man-made falls at the head of the final bend in the channel in Timpoweap Canyon and ending just upstream of the easternmost segment of the Hurricane Fault (fig. 2). Pah Tempe Springs discharge from as much as 12 ft above river stage at base flow, and total spring discharge along the reach has been reported to average about 11.5 cubic feet per second (ft3/s). Discharge from the spring has an aver-age dissolved-solids concentration of 9,650 milligrams per liter (mg/L) (Bureau of Reclamation, 1981) and an average water temperature of 40 degrees Celsius (°C) (Everitt and Ein-ert, 1994). Natural discharge in the Virgin River is controlled by the Quail Creek Diversion approximately 2 miles (mi) upstream from Pah Tempe Springs. This structure is used to divert water from the Virgin River through a 66-inch pipeline to an off-line reservoir at Quail Creek State Park approxi-mately 9 mi to the east. The pipeline is capable of diverting approximately 160 ft3/s and typically diverts all of the flow in

4 Effects of Groundwater Withdrawals From the Hurricane Fault Zone on Discharge of Saline Water From Pah Tempe Springs
Figure 2. Hydrogeology of the Pah Tempe Springs study area in relation to the Hurricane Fault, the Virgin River, and the zone of hot springs, Washington County, Utah.
Vertical exaggeration x 15
East
Geology adapted from Biek, 2003
Queantoweap Sandstone
Queantoweap Sandstone
Toroweap Formation
Moenkopi
FormationMoenkopi
Formation
KaibabFormation
KaibabFormation
AlluviumAlluvium
Zone of hot springs
Zone of hot springsHu
rric
ane
Faul
t
2,4002,400
WestWest
3,2003,200
3,1003,100
2,5002,500
2,3002,300
2,6002,600
3,0003,000
2,7002,700
2,8002,800
2,9002,900
3,5003,500
3,3003,300
3,4003,400
Alti
tude
, in
feet
Alti
tude
, in
feet
EXPLANATION
Timpoweap Canyon
Rising hot water heated by deep circulation
Direction of streamflow
Fault—Bar and ball on downthrown side, arrows show direction of movement along fault
Water table
Bedrockfractures
Man-made falls,head of springs reach
Timpoweap Canyon
Introduction 5
the river in excess of several cubic feet per second. Flows in the Virgin River that exceed the pipeline capacity spill over the Quail Creek Diversion and down the channel of the Virgin River.
Previous work (Bureau of Reclamation, 1966, 1973, 1981, 1984a, b; Everitt and Einert, 1994; Dutson, 2005; Nelson and others, 2009; Inkenbrandt and others, 2013) provides details of a hydrologic conceptual model that attributes the discharge of Pah Tempe Springs to the Hurricane Fault. The Hurricane Fault is a major normal fault marking the transition zone between the Colorado Plateau physiographic province on the east and the Basin and Range province on the west (Dutson, 2005). The Virgin River crosses this multiple-splayed fault at the mouth of Timpoweap Canyon where it has deeply incised the Permian Kaibab and Toroweap Formations, both frac-tured and highly permeable carbonate units. Together with the underlying Queantoweap Sandstone (equivalent to the Coconino Formation in Arizona), these geologic units com-pose a Paleozoic aquifer of regional extent (Inkenbrandt and others, 2013). Along the Hurricane Fault, low-permeability siltstones and sandstones of the Triassic Moenkopi Formation have been down-dropped and juxtaposed against the perme-able Toroweap Formation, forming a hydrologic barrier that impounds groundwater upgradient of the fault. Pah Tempe Springs emerge in the mouth of the canyon just upstream of the fault, discharging from the carbonate aquifer at the lowest altitude of its exposure.
Everitt and Einert (1994) showed that discharge from the springs is a mixture of cold freshwater, presumably upstream seepage from the Virgin River, and thermal water upwelling along the Hurricane Fault (fig. 2). Several other lines of evidence support this general idea. For example, exploratory drilling for the Virgin City dam site in the early 1960s, about 3 mi upstream of Pah Tempe Springs along the Virgin River, indicated that the river is perched hundreds of feet above the regional water table in an area where the stream channel is partially sealed by silt deposition. Here, fractured and cavernous Paleozoic carbonate rocks and water with salinity as high as 20,000 mg/L were encountered beneath several hundred feet of unsaturated carbonate rocks (Bureau of Reclamation, 1966; Everitt and Einert, 1994). Further drilling by Reclamation in 1972 revealed a highly permeable carbonate aquifer adjacent to the springs, with cooler
freshwater overlying thermal saline water just upstream from the springs reach (Bureau of Reclamation, 1973). In the spring of 1985, a sinkhole opened in the bed of the Virgin River approximately 2 mi upstream and northeast of Pah Tempe Springs, capturing nearly the entire river for several months and causing a surge in the discharge and a drop in temperature of the hot springs (Everitt and Einert, 1994). All of this indicates that a hydraulic connection exists between surface water, shallow fresh groundwater, and deep saline (presumably thermal) groundwater over a large area.
Nelson and others (2009) and Dutson (2005) noted that spring discharge is correlated with fracture density along the reach, indicating that the more than 1,500-ft-wide damage zone of the fault provides a focused pathway for deeply circulating thermal waters to reach the surface. During aquifer test pumping adjacent to the Virgin River along this reach, dis-charge from springs south of the river (higher in altitude and farther from pumping) was reduced more than from springs north of the river (closer to the pumping) in all cases (Bureau of Reclamation, 1973, appendix C). Also, twice during the construction of the 5-ft-diameter Quail Creek Diversion pipe-line between 1983 and 1985, dewatering of trenches located above and below the grotto spring was reported to have temporarily reduced its flow. This provides good evidence that the fractured rocks immediately underlying the springs act as a single unconfined aquifer with high permeability in both the horizontal and vertical directions.
The source of recharge to Pah Tempe Springs is not precisely known. Nelson and others (2009) suggested that the springwater may originate from the high-altitude plateaus 20 to 30 mi to the north and travel to the springs along fracture zones associated with the Hurricane Fault. Potentiometric contours in the regional Paleozoic aquifer, although based on sparse water-level data, indicate the potential exists for groundwater to move toward Pah Tempe Springs from the north, east, and south and from as far as 40 mi away (Inken-brandt and others, 2013, fig. 14). The springs are the only point of significant discharge from the regional carbonate aquifer on the east side of the Hurricane Fault, and their thermal nature is likely due to deep circulation of a significant fraction of the discharge before being directed upward by the reduced permeability associated with the fault (Biek, 2003).

6 Effects of Groundwater Withdrawals From the Hurricane Fault Zone on Discharge of Saline Water From Pah Tempe Springs
Approach and Methods Interference tests were conducted during November 2013,
February 2014, and November 2014. A schematic diagram representing the general test design is shown on figure 3. The Quail Creek Diversion, located approximately 2 mi upstream, was used to control discharge in the Virgin River upstream of Pah Tempe Springs during each test. The river gains approxi-mately 10 to 15 ft3/s along a 1,500-ft reach as thermal water discharges from dozens of springs located along and within the riverbed and above the river on both banks. Groundwater was pumped from a sump structure excavated in fractured carbonate rock near the springs. This sump had been previ-ously installed by the Washington County Water Conservancy District (WCWCD) for dewatering a trench during construc-tion of a buried pipeline. The sump, located on the north side of the river near the beginning of the springs reach, was re-occupied and improved by WCWCD for the purposes of this study (fig. 4). Groundwater pumped from the sump was transported downstream in temporary pipelines and discharged back into the Virgin River at a point below the study reach (fig. 5). During each test, spring and river conditions as well as pumping discharge were monitored over multiple days (up to 7) to observe responses to pumping and recovery (after pumping ceased). Observations were made at a variety of sites (fig. 6, table 1) that included
(1) the pumping discharge site (PTPS), (2) two Virgin River monitoring sites (PTVRU and
PTVRL),(3) three observation wells (PTO1, PTO2, and PTO3),(4) the grotto spring (PTGS),(5) a large spring above (upriver of) the grotto spring
(PTAG), and (6) 19 springs (all with the prefix “PTST”) located in the
riverbed and on both banks of the river.
Monitoring at these sites included (1) continuous mea-surements of a combination of specific conductance (SpC), water temperature, and water level or stage; (2) discrete check measurements of field parameters and discharge (Q); and (3) the collection of water-quality samples for analysis of total dissolved-solids concentration (TDS) and the stable isotopes of oxygen and hydrogen (18O and 2H). These parameters were monitored and samples analyzed in order to (1) better under-stand the interaction between the saline, thermal groundwater system and the fresh river water system; and (2) calculate changes in dissolved-solids loads reaching the Virgin River. Descriptions of the observation sites and parameters measured at each site are listed in table 1.
Discharge and dissolved-solids load (Load) of the cumulative springs input were calculated as the difference between the upstream and downstream river sites: Loadsprings = LoadPTVRL − LoadPTVRU. For the pre-pumping periods associated with each test, the dissolved-solids load of the springs also was calculated as the difference between the upstream and downstream streamflow (discharge) values multiplied by a TDS value from the grotto spring, selected to represent non-diluted thermal discharge: Loadsprings = (QPTVRL − QPTVRU) * TDSPTGS. The grotto spring was chosen to represent thermal spring discharge for this exercise because the TDS at the spring was generally higher and less variable than at other sites. The second method for calculating cumulative dissolved-solids load from the springs is used as a comparison to the first method in order to evaluate whether the difference in discharge, assumed to be from the springs, contains pure thermal water or a mixture of thermal and shallow freshwater, sourced from the river or shallow subsurface. Values of Q, TDS, and Load in the pumping discharge are based on measurements that represent approximate steady-state conditions at the end of each pumping period.
Stable isotope ratios of oxygen (18O and 16O) and hydrogen (2H, or deuterium, and 1H) in water were analyzed in order to
Figure 3. Design of interference tests conducted to monitor pumping-induced capture of Pah Tempe Springs along a reach of the Virgin River, Washington County, Utah.
Monitor discharge, temperature, and specific conductance of pumped water
Pipeline from sump to carry pumping discharge past study reach
Pumping location, sump excavated to fractured limestone
Monitor temperature and water levels in observation wells
Virgin River
Monitor discharge, temperature, and specific conductance of grotto spring outlet
Monitor temperature of other dispersed springs
Monitor discharge, temperature, and specific conductance in river upstream of the spring reach
Monitor discharge, temperature, and specific conductance in the river downstream of the spring reach

Approach and Methods 7
Figure 4. Original sump structure (A and C, November 2013) and improved sump structure (B and D, February and November 2014) used for pumping thermal water from the fractured carbonate-rock aquifer during Pah Tempe Springs interference testing. Upper right image B, shows concrete vaults on the north bank of the Virgin River placed on top of rip rap in the excavated sump with discharge lines from multiple submersible pumps tying into two main discharge lines (lower right in figure). Lower right image D, shows a close up of one of the manifolds where discharge lines from multiple submersible pumps join one of the main discharge lines.
Phot
ogra
phs
by P
hilip
Gar
dner
A B
C D

8 Effects of Groundwater Withdrawals From the Hurricane Fault Zone on Discharge of Saline Water From Pah Tempe Springs
provide independent estimates of mixing ratios between river and thermal spring components prior to and during each of the interference tests. Stable isotopes are analyzed by measur-ing the ratio of the heavier, less abundant isotope (18O or 2H) to the lighter, more abundant (common) isotope (16O or 1H) and are reported as differences relative to a known standard. The isotope ratios are reported as delta (δ) values expressed as parts per thousand (permil). The δ value for an isotope ratio, R, is determined by
δR = (Rsample/Rstandard – 1) × 1,000 (1)where δR is the δ value for a specific isotope in the sample
(2H or 18O), Rsample is the ratio of the less abundant isotope to the
common isotope for a specific element in the sample, and
Rstandard is the ratio of the less abundant isotope to the common isotope for the same element in the reference standard. The reference standard used in this report is Vienna Standard Mean Ocean Water (VSMOW) (Craig, 1961b; Coplen, 1994).
The proportional variation in 2H and 18O results in isoto-pic compositions of precipitation (and groundwater sourced
from precipitation) that plot along a linear trend referred to as a meteoric water line when δ2H is plotted against δ18O. The trend line for worldwide precipitation defines the global mete-oric water line and is described by the equation
δ2H = 8(δ18O) + d (2)where d is defined as the 2H (deuterium) excess
(Dansgaard, 1964). The mean global value for d in freshwater is 10 (Craig, 1961a).
Depending on atmospheric conditions and sources of pre-cipitation, isotopic data from specific areas may plot along a trend line that is above or below the global meteoric water line (Dansgaard, 1964), generally referred to as a local meteoric water line that better represents water in a drier climatic set-ting like that of the study area (Welch and Preissler, 1986).
November 2013 Test
The first interference test was designed to evaluate the feasibility of pumping to capture spring discharge during typical low-flow conditions in the Virgin River. The Quail Creek Diversion was used to provide a controlled discharge of approximately 2 ft3/s in the Virgin River above the springs reach. Monitoring of pre-pumping conditions during the November 2013 test at selected sites began on November 17. Pumping began on November 19 at 17:20 and ended on November 22 at 12:15. This included two periods of nearly continuous pumping (two steps): the first at 650 gallons per minute (gal/min) (1.4 ft3/s) for 20.7 hours, and the second at 1,800 gal/min (4.0 ft3/s) for 45.3 hours, cumulatively remov-ing approximately 5.8 million gallons (18 acre-feet [acre-ft]) of thermal saline water. The test ended prematurely due to a precipitation event that caused river flows to spike and wash out monitoring equipment on November 21 at approximately 16:00 (after about 49 hours of pumping). This flow event pro-hibited monitoring of the post-pumping recovery period. As a result, the majority of the results discussed in this report are from the two subsequent tests.
February 2014 Test
The second interference test was designed as a repeat of the first test to observe pumping effects during low-flow conditions in the Virgin River without the interference of the unexpected high flows that terminated the test early in Novem-ber 2013. The Quail Creek Diversion was used to provide a controlled discharge of approximately 3.5 ft3/s in the Virgin River above the springs reach. Monitoring of pre-pumping conditions during the February 2014 test at selected sites began on February 8. Pumping began on February 10 at 10:00 and ended on February 13 at 14:05. This included two periods of nearly continuous pumping: 2,300 gal/min (5.2 ft3/s) for 24.5 hours and 3,300 gal/min (7.3 ft3/s) for 49.7 hours, with a brief (105-minute) and unsustainable period of pumping of up
Figure 5. Pipelines used to transport pumping discharge to the Virgin River below the study reach during each of the interference tests at Pah Tempe Springs, Washington County, Utah.
Phot
ogra
ph b
y Ph
ilip
Gard
ner

Approach and Methods 9
to 4,300 gal/min (9.5 ft3/s) between them. Pumping during this test cumulatively removed approximately 5.8 million gallons (18 acre-ft) of thermal saline water. Higher withdrawal rates were achieved during this test due to improvements in the sump structure that included the installation of (1) large perfo-rated concrete vaults underlain by basalt rip-rap to stabilize the unconsolidated pit walls, (2) multiple submersible pumps, and (3) the addition of a secondary discharge line (fig. 4).
November 2014 Test
This test was designed to evaluate the effects of pumping-induced capture of freshwater from the Virgin River dur-ing higher stream stage and stream discharge. The Quail Creek Diversion was used to provide a controlled discharge of approximately 24.5 ft3/s in the Virgin River above the springs reach. Monitoring of pre-pumping conditions during the November 2014 test began on November 16. Pumping began on November 17 at 15:00 and ended on November 20 at 09:45. Although the objective was to provide a constant stress with only one period of uninterrupted pumping, the rate varied and pumping temporarily ceased for 4 hours 15 minutes
due to equipment failure on November 18. The test ended with a steady pumping rate of 3,200 gal/min (7.2 ft3/s) for 43.25 hours, providing a duration of stress sufficient for condi-tions at the monitoring sites to approach steady state. Pumping during this final test removed approximately 12 million gal-lons (37 acre-ft) of thermal saline water mixed with a detect-able amount of fresh Virgin River water.
Data Collection
Continuous data (T, SpC, and (or) water level at less than or equal to 15-min intervals) were recorded using a variety of data loggers at selected sites during each of the three tests. Table 1 lists the type of continuous data that were recorded at each site during each of the three tests, and table 1-1 in appendix 1 lists the data logger make and model used at each site as well as the operational accuracy of each instrument. Temperature was measured at all sites. Continuous tempera-ture was recorded during the interference tests to indicate (1) mixing between cold river water and thermal springwater, and (2) whether discharge of thermal water had either slowed or ceased at individual spring discharge points (PTSTs) in
Figure 6. Field sites monitored during the pumping interference tests at Pah Tempe Springs, Washington County, Utah.
113°16'10"
PTST4
PTST5 PTO2
PTST7PTST8
PTST6
PTGSPTST10
PTST13
PTST12PTPS
PTST17
PTO1
PTST11
PTST16
PTST9
PTST15PTST10.1
PTAG
PTST14
PTVRU
113°16'20"
37°11'25"
37°11'20"
PTVRL
PTST1
PTST1.1PTO3
PTST2
PTST3
EXPLANATIONStream site (discharge, temperature, specific conductance)Pumping site (discharge, temperature, specific conductance)Spring site (temperature)Enhanced spring site (stage, temperature, specific conductance)Observation well (water level, temperature)Fault—Bar and ball on downthrown side
0 100 200 300 400
7525 50
500 Feet
100 Meters0
Aerial photography by Alpha Engineering, St. George, Utah

10 Effects of Groundwater Withdrawals From the Hurricane Fault Zone on Discharge of Saline Water From Pah Tempe Springs
the riverbed and on the riverbanks. Specific conductance was monitored at selected sites (PTVRU, PTPS, PTGS, PTAG, and PTVRL) to determine natural and stress-induced changes in water quality. Stage was monitored at PTAG as a proxy to dis-charge to observe natural and stress-induced changes in flow. Water levels were monitored in the three observation wells (PTO1, PTO2, and PTO3) to observe the timing and magni-tude of pumping-induced water-level changes.
Discharge and Water-Level Measurements Discharge was measured at PTVRU using a 1-ft Parshall
flume during the first two tests (November 2013 and February 2014) when the controlled flow in the river upstream of the springs reach was less than about 3.5 ft3/s (fig. 7A). Continuous stage measured in the pool upstream combined with the use of this flume provided a continuous record of discharge at PTVRU during the first two tests. Controlled flow in the river upstream of the springs reach during the third test (November 2014) was approximately 24.5 ft3/s, exceeding the capability of the Parshall flume. During this high-flow test, discharge at PTVRU was measured repeatedly using a
Table 1. Field sites monitored during three interference tests at Pah Tempe Springs, Washington County, Utah. [Sites are generally listed in the order they are encountered in a downstream direction beginning at the top of the study reach. Abbreviations: Cont., continuous; H, water level in wells, stage in springs or streams; T, temperature; Dis., discrete; SpC, specific conductance; Q, discharge; TDS, total dissolved-solids concentration; general chemistry, dissolved major-ion and selected trace-element concentrations (shown in table 5); δ18O, delta oxygen-18; δD, delta deuterium; —, not applicable]
Site name Site description November 2013 February 2014 November 2014
PTVRU Virgin River above springs reach Cont. H, T; Dis. SpC, T, Q, TDS, general chemistry, δ18O, δD
Cont. H, T; Dis. SpC, T, Q, TDS, δ18O, δD
Cont. SpC, T; Dis. SpC, T, Q, TDS, δ18O, δD
PTPS Pumping discharge Dis. SpC, T, Q, TDS, general chemistry, δ18O, δD
Cont. T; Dis. SpC, T, Q, TDS, δ18O, δD
Cont. SpC, T; Dis. SpC, T, Q, TDS, δ18O, δD
PTST17 Riverbed discrete spring — Cont. T Dis. SpC, T, TDS, δ18O, δD
PTST16 Riverbed discrete spring — Cont. T —
PTST15 Riverbed discrete spring — Cont. T —
PTST14 Riverbed discrete spring — Cont. T —
PTST13 Riverside discrete spring Cont. T Cont. T —
PTST12 Riverside discrete spring Cont. T Cont. T —
PTST11 Riverbed discrete spring Cont. T — —
PTST10.1 Riverside discrete spring — Cont. T —
PTST10 Riverside discrete spring Cont. T Cont. T —
PTAG Large spring above grotto spring Cont. T, H; Dis. SpC, T, TDS, δ18O, δD
Cont. T; Dis. SpC, T, TDS, δ18O, δD
—
PTST9 Riverside discrete spring Cont. T Cont. T —
PTGS Grotto spring Cont. SpC, T, H; Dis. SpC, T, TDS, general chemistry, δ18O, δD
Cont. SpC, T, H; Dis. SpC, T, TDS, δ18O, δD
Cont. H; Dis. SpC, T, TDS, δ18O, δD
PTST8 Riverside discrete spring Cont. T Cont. T —
PTST7 Riverside discrete spring Cont. T Cont. T —
PTST6 Riverside discrete spring Cont. T Cont. T —
PTST5 Riverside discrete spring Cont. T Cont. T —
PTST4 Riverside discrete spring Cont. T Cont. T Dis. SpC, T, TDS, δ18O, δD
PTST3 Riverside discrete spring Cont. T Cont. T —
PTST2 Riverside discrete spring Cont. T Cont. T Dis. SpC, T, TDS, δ18O, δD
PTST1.1 Riverside discrete spring — Cont. T —
PTST1 Riverside discrete spring Cont. T Cont. T Dis. SpC, T, TDS, δ18O, δD
PTVRL Virgin River below springs reach Cont. H, SpC, T; Dis. SpC, T, Q, TDS, general chemistry, δ18O, δD
Cont. H, SpC, T; Dis. SpC, T, Q, TDS, δ18O, δD
Dis. SpC, T, Q, TDS, δ18O, δD
PTO1 Observation well Cont. H, T; Dis. H Cont. H, T; Dis. H Cont. H, T; Dis. SpC, T, TDS, δ18O, δD, H
PTO2 Observation well Cont. H, T; Dis. H Cont. H, T; Dis. H Cont. H, T; Dis. H
PTO3 Observation well Cont. H, T; Dis. H Cont. H, T; Dis. H Cont. H, T; Dis. SpC, T, TDS, δ18O, δD, H

Approach and Methods 11
Figure 7. Virgin River discharge measurement sites during the Pah Tempe Springs interference tests. A, upstream of the Pah Tempe Springs reach at PTVRU during the low-flow tests of November 2013 and February 2014, using a Parshall flume, B, downstream of the springs reach at PTVRL using a SonTek FlowTracker Handheld Acoustic Doppler Velocimeter® (ADV), C, upstream of the springs reach at PTVRU during the high-flow test of November 2014 using a Teledyne RD Instruments StreamPro acoustic Doppler current profiler (ADCP), and D, downstream of the springs reach at PTVRL. Shifting sand channel with collapsing banks prevented development of a reliable stage-discharge relation.
Phot
ogra
phs
by P
hilip
Gar
dner
A B
C D

12 Effects of Groundwater Withdrawals From the Hurricane Fault Zone on Discharge of Saline Water From Pah Tempe Springs
Teledyne RD Instruments StreamPro acoustic Doppler current profiler (ADCP) (fig. 7B). During all three tests, discharge was repeatedly measured at PTVRL using a SonTek FlowTracker Handheld Acoustic Doppler Velocimeter® (ADV) (fig. 7C). Continuous stage measurements also were made at PTVRL with the intent of developing a stage-discharge relation and obtaining a continuous record of discharge. However, an adequate stage-discharge relation could not be established due to sand channel migration and collapsing stream banks during the period of pumping-induced flow reduction during each test (fig. 7D), and the stage data were omitted.
Continuous discharge was monitored at PTGS by direct-ing all of the spring discharge through a sharp-crested weir installed in the lowest-altitude pool and using a pressure transducer to measure changes in hydraulic head behind the weir to calculate discharge. Pumping discharge was monitored by differential discharge measurements made in the river above and below the pumped return flow, and during February and November 2014, using magnetic flow meters that were installed and operated by WCWCD technicians. Continuous and discrete water levels were monitored in three observa-tion wells (PTO1, PTO2, and PTO3) screened in the shallow aquifer and located approximately 230, 475, and 1,380 ft, respectively, from the pumping location (PTPS) on the north side of the river. Continuous water-level measurements were made using non-vented pressure transducers (In-Situ Level TROLLs) and corrected for barometric pressure. Discrete water-level measurements were made using a graduated steel tape.
Sample Collection and Analysis Water samples for analysis of dissolved-solids concen-
tration and the stable isotopes of 18O and 2H were collected from two river sites (PTVRU and PTVRL), the pumping site (PTPS), and two major spring outlets (PTAG and PTGS) several times during each test to characterize end-member waters and evaluate changing mixtures of fresh river water and saline thermal water in pumping and river discharge at the downstream end of the study reach. Field parameters were measured and water samples were collected for analysis of dissolved-solids concentration, 18O, and 2H from two observa-tion wells (PTO1 and PTO3) and four additional spring outlets (PTST1, PTST2, PTST4, and PTST17) prior to pumping during the third test to evaluate relative mixtures of fresh river water and saline thermal water under non-stressed conditions at these sites. Water samples also were collected at four sites (PTVRU, PTVRL, PTPS, and PTGS) for analysis of dissolved major-ion and selected trace-element concentrations under non-stressed conditions during the first test to characterize general geochemistry of the different source waters. Samples were collected from wells and the pumping vaults using a portable submersible pump and from springs under natural free-flowing conditions by filling bottles directly at the orifice. Wells sampled with a pump were purged a minimum of three casing volumes prior to sample collection.
Field parameters were measured using a calibrated mul-timeter probe following USGS protocols (Wilde and Radtke, 1998). Samples for dissolved major ions were filtered with a 0.45-micron filter and the cation subsample was preserved with nitric acid. Dissolved major-ion analyses were done by the USGS National Water Quality Laboratory in Denver, Colo-rado. Unfiltered samples for the stable isotopes of 18O and 2H were collected in 60-mL high-density polyethylene (HDPE) bottles with polyseal-lined caps leaving no air space, and analyzed by the University of Utah Spatio-Temporal Isotope Analytics Laboratory in Salt Lake City.
Results The following subsections summarize the observations,
measurements, and sample analyses made or done during the three interference tests that are relevant to evaluating the feasibility of pumping to capture discharge from Pah Tempe Springs along the gaining reach of the Virgin River. In many cases, the data presented are abridged versions of larger time-series data sets. Complete original data are available for download at https://doi.org/10.5066/F73F4NXH.
Water Levels and Drawdown
Pre-pumping water-level altitudes representing the hydrau-lic head in the thermal system at the pumping site (PTPS), the grotto spring (PTGS), and the three observation wells (PTO1, PTO2, and PTO3), ranged from approximately 3,063 to greater than 3,076 ft above mean sea level for all three tests (table 2). These levels are above the Virgin River streambed and above the freshwater hydraulic head provided by the river stage everywhere between the man-made falls upstream of PTPS and approximately 100 ft downstream of PTO3 (fig. 8). The highest measured thermal-system head in all three cases occurred in the vicinity of PTGS. Because the head at PTGS is estimated using the highest altitude of the springwater where it is free flowing, the reported value (greater than 3,076 ft) is a minimum. While the actual value of the thermal-system head near PTGS is unknown, it is at least 9 ft above the riverbed at this location. The thermal-system hydraulic heads in PTO1, PTO2, PTO3, and at PTPS are all lower than at PTGS, indicat-ing that the upwelling of thermal water is focused near PTGS, and that thermal water moves laterally from PTGS in both upstream and downstream directions. The lowest pre-pumping thermal-system head was measured at PTO3 and ranged from 3062.9 ft to 3063.3 ft for all three tests, less than about 1 ft above the streambed at this location. When these thermal-sys-tem hydraulic heads are compared to the approximate stream-bed altitude at typical low flows, they illustrate the varying magnitude of the upward hydraulic gradient that is driving thermal discharge along the study reach (fig. 8).
The water-level change in response to pumping (draw-down) was monitored in each of the observation wells (PTO1,

Results 13
Table 2. Selected pre-pumping water-level altitudes for the thermal system compared to the altitude of the Virgin River streambed adjacent to each site for each of the three interference tests at Pah Tempe Springs, Washington County, Utah. [Sites are listed in the order they are encountered in a downstream direction beginning at the top of the study reach. Each thermal system water level is paired with a nearby Virgin River streambed altitude. Altitude is relative to the North American Vertical Datum of 1988. Abbreviations: MP, measuring point; AMSL, above mean sea level; —, not applicable; >, greater than]
Site name Date and TimeWater level, in feet below or above (-) MP
MP altitude (feet AMSL 1)
Thermal system water-level alti-tude (feet AMSL)
Adjacent stream-bed altitude (feet AMSL 2)
Streambed alti-tude site
Thermal system water level above streambed (feet)
PTPS — — — — — — —
PTO1 11/19/13 11:59 13.00 3,089.6 3,076.6 3,071.5 PTST16 5.1
PTGS 11/15/13 10:00 -0.97 3 3,075.4 4 > 3,076.4 3,067.8 PTST15 > 8.9
PTO2 11/19/13 12:02 13.74 3,089.0 3,075.2 3,067.5 PTST14 7.7
PTO3 11/19/13 12:10 14.37 3,077.4 3,063.0 3,062.3 PTST3 0.7
PTPS 2/10/14 8:30 9.15 3,084.2 3,075.0 3,071.8 PTST12 3.3
PTO1 2/10/14 8:50 14.03 3,089.6 3,075.5 3,071.5 PTST16 4.0
PTGS 11/15/13 10:00 -0.97 3 3,075.4 4 > 3,076.4 3,067.8 PTST15 > 8.9
PTO2 2/10/14 9:05 14.03 3,089.0 3,074.9 3,067.5 PTST14 7.4
PTO3 2/10/14 9:15 14.03 3,077.4 3,063.3 3,062.3 PTST3 1.0
PTPS 11/17/14 9:25 15.13 3,089.7 3,074.5 3,071.8 PTST12 2.8
PTO1 11/17/14 10:37 14.65 3,089.6 3,074.9 3,071.5 PTST16 3.4
PTGS 11/15/13 10:00 -0.97 3 3,075.4 4 > 3,076.4 3,067.8 PTST15 > 8.9
PTO2 11/17/14 10:43 14.33 3,089.0 3,074.6 3,067.5 PTST14 7.1
PTO3 11/17/14 10:56 14.46 3,077.4 3,062.9 3,062.3 PTST3 0.61 All reference altitudes are based on a differential level survey that had three points in common with a high precision survey completed by Alpha Engineering.2 Streambed altitudes are from points surveyed near the streambank and do not represent the deepest part of the stream at a particular point along the Virgin River. Rather, they more
closely approximate the altitude of the water surface in the stream.3 This is the altitude of an MP used to estimate the altitude of discharge at the grotto spring. It is different than the MP listed in table 1–1, which is the top of a staff plate used to
monitor the height of water in the pool behind a wier.4 This is a “minimum” value of hydraulic head based on the altitude of water flowing out of the grotto spring. The true artesian head at this spring is unknown.
Figure 8. Pre-pumping water-level altitudes representing the hydraulic head in the thermal spring groundwater system during February 2014, compared to streambed altitudes shown in cross section along the Pah Tempe Springs reach of the Virgin River, Washington County, Utah.
EXPLANATIONVirgin River streambed altitudeThermal system water-level altitude, dashed
where uncertainFault—Arrows show direction of movement along fault
Observation site name
3,040
3,050
3,070
3,080
3,060
Alti
tude
, in
feet
Lower river monitoring site (PTVRL)
PTST15
PTST1
Observation well (PTO3)
Observation well(PTO2)
0 250 750500 1,000 Feet
250 Meters0 50 100 150 200
Grotto spring(PTGS)
PTST12 and 13
PTST17PTAG
PTST10.1
Screened interval
Observation well (PTO1)
Pumping vaults(PTPS) Upper river monitoring site
(PTVRU)
PTST17

14 Effects of Groundwater Withdrawals From the Hurricane Fault Zone on Discharge of Saline Water From Pah Tempe Springs
PTO2, and PTO3) during each of the three tests (fig. 9). During the first test (November 2013), drawdown in PTO1 reached a maximum of 1.36 ft after 23.5 hours of pumping at 650 gal/min and 1.89 ft after an additional 36 hours of pump-ing at 1,800 gal/min. The drawdown in this well appeared to be approaching the maximum for the corresponding pumping rate despite being influenced by water-level rises in the river associated with periods of intense precipitation that began on the evening of November 19 and lasted beyond the end of data collection during this test (fig. 10). Additional hydrologic observations related to this precipitation event are discussed later in this report. Drawdown in PTO2 reached 0.47 ft after nearly 58 hours of pumping and did not show the distinct change in slope with the change in pumping rate that was seen in the PTO1 drawdown. Drawdown in PTO3 was barely perceptible, reaching 0.07 ft after nearly 56 hours of pumping before also being interrupted by water-level rises associated with the precipitation event.
During the second test (February 2014), water levels in all observation wells responded to pumping within a few hours (fig. 9). Drawdown in PTO1 reached 1.89 ft after 23.5 hours of pumping at about 2,300 gal/min and 2.76 ft after an additional 48 hours of pumping at about 3,300 gal/min. Drawdown in PTO2 showed a subtle break in slope as the pumping was briefly stepped up to 4,300 gal/min at 24.5 hours and reached 0.66 ft after about 75 hours of pumping. Drawdown in PTO3 reached 0.25 ft after nearly 75 hours of pumping.
The third test (November 2014) was designed to be conducted with constant pumping at the highest rate that the pumping vaults could sustain. However, a maximum rate of constant pumping was not achieved until approximately 27.5 hours after pumping began, after adjusting to compensate for initial over-pumping and suffering an equipment malfunc-tion after 19.4 hours of pumping, requiring that the pumps be shut down for over 4 hours. During this test, drawdown in PTO1 reached 2.42 ft after 65.75 hours of pumping, mostly at 3,200 gal/min. Drawdown in PTO2 showed a distinct change
Figure 9. Drawdown compared to pumping rate for the three observation wells (PTO1, PTO2, and PTO3) during each of the three interference tests at Pah Tempe Springs, Washington County, Utah.
-1.0
-0.5
0
0.5
1.0
1.5
2.0
2.5 0500
1,000
1,500
2,000
2,500
3,000
3,500
4,0004,500
Dra
wdo
wn,
in fe
et
Pum
ping
rate
, in
gallo
ns p
er m
inut
e
0500
1,000
1,500
2,000
2,500
3,000
3,500
4,0004,500
0500
1,000
1,500
2,000
2,500
3,000
3,500
4,0004,500
-0.5
0
0.5
1.0
1.5
2.0
2.5
3.0
-0.5
0
0.5
1.0
1.5
2.0
2.5
3.0
Hours after onset of pumping
February 2014
November 2013
November 2014
PTO3, r=1,380 feetPTO2, r=475 feetPTO1, r=230 feetPumping rate
“r” is the radial distance from the pumping location to the observation well
-20 -15 -10 -5 0 5 10 15 20 25 30 35 40 45 50 55 60 65 70 75 80 85 90 95 100 105 110

Results 15
in slope associated with the temporary cessation of pumping and reached a maximum of 0.45 ft after about 66 hours of pumping. Drawdown in PTO3 reached a maximum of 0.12 ft after 63 hours of pumping.
Even though the February 2014 and November 2014 interference tests pumped at nearly the same rate, maximum drawdown was substantially less in the three observation wells during the November 2014 test. Maximum drawdowns in observation wells PTO1, PTO2, and PTO3 were reduced by 0.34, 0.24, and 0.13 ft, respectively, when comparing maxi-mum drawdowns between the February 2014 and November 2014 tests. Pumping during the second constant-rate test in February 2014 was for about 9 more hours than during the second constant-rate test in November 2014; however, 9 additional hours of pumping cannot explain the drawdown differences. Capture of surface water in the Virgin River likely attributed to reduced drawdowns in the November 2014 test. During groundwater pumping under high-flow conditions, the potentiometric surface of the thermal system was lowered and caused a reversal of the vertical hydraulic gradient from upward to downward, which resulted in the capture of water from the Virgin River. Calcite precipitation also could have reduced the efficient response of water levels in the obser-vation wells to the pumping stress between February and November 2014; the well screens could have become partially clogged with calcite precipitate. In all cases, water levels were monitored for a minimum recovery period of 20 hours after pumping ceased, indicating nearly full recovery within a day.
Pumping during all three interference tests resulted in clear patterns of drawdown in multiple observation wells at varying distances from the point of pumping. Data from the February 2014 test were used to estimate an aquifer transmissivity of about 40,000 feet squared per day (ft2/d) using a distance-drawdown analysis described in appendix 2. The analysis derives transmissivity from the slope of a plot of drawdown versus log of the radial distance from the point of pumping using the Cooper-Jacob (1946) straight-line method. Pumping during the February 2014 test captured predominantly thermal
water and most closely approximates a “non-leaky” aquifer system. Visual observations of all cores recovered from drill-ing to install observation wells showed large connected pore spaces in carbonate-cemented alluvium from near land surface down to 32 feet (ft) (fig. 11). Because the observation wells and pumping vaults are open to thermal water within 32 ft of land surface, the analysis is assumed to represent conditions in a shallow aquifer that spans the contact between fractured carbonate rock and overlying cemented alluvium.
Although it is recognized that the pumping conditions of the interference tests violate fundamental assumptions of analytical solutions to aquifer tests (notably that the pumping well is of infinitesimal diameter, fully penetrates the aquifer, and that the aquifer is non-leaky and confined), the data can be used to provide this first-order approximation of transmis-sivity. Pumping during these tests removed between about 5.8 and 12 million gallons (18 to 37 acre-ft) of water in the aquifer, sufficient to overcome the effects of wellbore storage. However, although the sump does not fully penetrate the aqui-fer, it was pumped long enough (more than about 24 hours) to have a three-dimensional effect and render the partial penetra-tion effects inconsequential. Furthermore, Halford and others (2006) demonstrate that the Cooper-Jacob (1946) solution for aquifer test analysis can be used to estimate transmissivity for confined and unconfined aquifers.
Figure 10. Change in stage at two U.S. Geological Survey gaging stations on the Virgin River, above and below the Pah Tempe Springs study reach during the November 2013 interference test.
Chan
ge in
sta
ge, i
n fe
et
Hours after onset of pumping
-0.2
0.3
0.8
1.3
1.8
2.3
2.8
November 2013
U.S. Geological Survey gage 09406100, Virgin River above La Verkin CreekU.S. Geological Survey gage 09406000, Virgin River at Virgin, UT
-20 -15 -10 -5 0 5 10 15 20 25 30 35 40 45 50 55 60 65 70 75 80 85 90 95 100 105 110

16 Effects of Groundwater Withdrawals From the Hurricane Fault Zone on Discharge of Saline Water From Pah Tempe Springs
River and Spring Discharge
Pre-pumping discharge measured at PTVRU was 2.0, 3.5, and 24.5 ft3/s during November 2013, February 2014, and November 2014, respectively, and was held constant by WCWCD using the upstream Quail Creek Diversion as pumping began (table 3). Pre-pumping discharge measured at PTVRL was 12.7, 18.2, and 37.3 ft3/s during the same three time periods and reflected the sum of the discharge at PTVRU and all of the Pah Tempe Springs inputs. The pre-pumping
discharge from Pah Tempe Springs is calculated as the dif-ference in measured discharge between the upper and lower measuring points (PTVRL − PTVRU) and was 10.7, 14.7, and 12.8 ft3/s during the November 2013, February 2014, and November 2014 tests, respectively.
Discharge from the springs is reduced as the hydraulic head in the thermal system is lowered by pumping. During the first test in November 2013, total spring discharge (PTVRL − PTVRU) decreased from 10.7 to 9.5 ft3/s with pumping at 650 gal/min (1.4 ft3/s). After pumping was increased to 1,800 gal/min (4.0 ft3/s), total spring discharge declined to 8.9 ft3/s prior to the precipitation event that caused streamflow to spike and prematurely end the test (fig. 12). During the second test in February 2014, total spring discharge decreased from 14.7 to 8.2 ft3/s with pumping at 2,300 gal/min (5.2 ft3/s), and total spring discharge further decreased to 6.4 ft3/s when pumping was increased to 3,300 gal/min (7.3 ft3/s). Total spring discharge decreased from 12.8 to 5.3 ft3/s after pumping at 3,200 gal/min (7.2 ft3/s) for the majority of the third test in November 2014. In all cases, the reduction in total spring dis-charge was approximately equal to the pumping rate (within uncertainty), and capture of this discharge by pumping was completed in less than 48 hours. Recovery conditions were monitored until discrete discharge measurements at PTVRL indicated that cumulative spring discharge had returned to pre-test levels. Uncertainty in PTVRU measurements, using both the Parshall flume at low flow and the ADCP at high flow, was plus (or minus) 5 percent on the basis of measurement devia-tions around the average for a discharge that was being strictly controlled by the upstream Quail Creek Diversion. Uncertainty in the PTVRL discrete discharge measurements was closer to 10 percent on the basis of repeat measurements made prior to pumping and measurement conditions in the channel generally being rated as “fair.”
Figure 11. Core samples from observation wells drilled into cemented alluvium adjacent to the Virgin River in the Pah Tempe Springs study reach, showing large connected pore spaces.
Large connected pore spaces
Table 3. Selected discharge measurements at PTVRU and PTVRL, and total spring discharge at pre-pumping and steady-state conditions at the end of each pumping period during each of the three interference tests at Pah Tempe Springs, Washington County, Utah. [All values are in cubic feet per second. Abbreviations: ft3/s, cubic feet per second; gal/min, gallons per minute; —, not applicable]
Approximate steady-state condition
November 2013 Pre-pumping Pumping 1.4 ft3/s (650 gal/min) Pumping 4.0 ft3/s (1,800 gal/min)
PTVRU 2.0 2.1 2.0
PTVRL 12.7 11.6 10.9
Pah Tempe Springs total 10.7 9.5 8.9
February 2014 Pre-pumping Pumping 5.2 ft3/s (2,300 gal/min) Pumping 7.3 ft3/s (3,300 gal/min)
PTVRU 3.5 3.5 3.5
PTVRL 18.2 11.7 9.9
Pah Tempe Springs total 14.7 8.2 6.4
November 2014 Pre-pumping — Pumping 7.2 ft3/s (3,200 gal/min)
PTVRU 24.5 — 24.5
PTVRL 37.3 — 29.8
Pah Tempe Springs total 12.8 — 5.3

Results 17
Discharge from the grotto spring (PTGS) was monitored independently. This spring was selected for monitoring because it is one of the largest individual point discharges in the spring complex and because all of its discharge is captured by man-made pools and can be routed through a weir (fig. 13). This spring also stands out because it emerges from bedrock at a notably higher altitude that any of the other point discharges in the spring complex.
The peak pre-pumping discharge measured at PTGS was approximately 1.1, 1.2, and 1.1 ft3/s during the November 2013, February 2014, and November 2014 tests, respectively (fig. 14). The pre-pumping discharge from PTGS was slightly higher in February 2014, which is consistent with streamflow measurements indicating higher overall discharge for the spring complex at that time (table 3).
Discharge from PTGS began to decline immediately after the onset of pumping. During the first interference test in November 2013, PTGS discharge decreased from about 1.1 to 0.7 ft3/s before rebounding to a little more than 0.8 ft3/s at about 51.25 hours after the onset of pumping. This small rise coincides with the initial rise in Virgin River stage in response to the November 2013 precipitation event. The subsequent rise in PTGS stage in response to Virgin River stage supports pre-vious evidence of a hydraulic connection between the spring complex and the Virgin River as documented by Everitt and Einert (1994). The response to the stepped increase in pump-ing from 650 gal/min (1.4 ft3/s) to 1,800 gal/min (4.0 ft3/s) at approximately 24 hours after pumping began was obscured in the first constant-rate test by local precipitation.
Figure 12. Discharge measured in the Virgin River above (PTVRU) and below (PTVRL) the study reach compared to pumping rate during each of the three interference tests at Pah Tempe Springs, Washington County, Utah.
02468
101214161820
0
1,000
2,000
3,000
4,000
5,000
6,000
7,000
8,000PTVRL—Error bars indicate measurement uncertainty
PTVRUPumping rate
Dis
char
ge, i
n ga
llons
per
min
ute
Dis
char
ge, i
n cu
bic
feet
per
sec
ond
02468
101214161820
Difference = total discharge from Pah Tempe Springs
0
1,000
2,000
3,000
4,000
5,000
6,000
7,000
8,000
February 2014
November 2013
2022
24
26
28
30
32
34
36
38
40
0
1,000
2,000
3,000
4,000
5,000
6,000
7,000
8,000
Hours after onset of pumping
November 2014
Flume washed out with spike in streamflow
Curves through PTVRL measurements are interpretive and included to illustrate general patterns of streamflow decline and recovery based on discrete measurements
-20 -15 -10 -5 0 5 10 15 20 25 30 35 40 45 50 55 60 65 70 75 80 85 90 95 100 105 110
Average of discrete measurements

18 Effects of Groundwater Withdrawals From the Hurricane Fault Zone on Discharge of Saline Water From Pah Tempe Springs
During the February 2014 interference test, PTGS dis-charge decreased from about 1.2 to 0.9 ft3/s when pumping at 2,300 gal/min (5.2 ft3/s) for 24.5 hours (fig. 14). When pump-ing was increased to 3,300 gal/min (7.3 ft3/s), PTGS discharge decreased to a minimum of 0.55 ft3/s at 76 hours after pump-ing began. Discharge from PTGS was reduced from about 1.1 to 0.15 ft3/s after pumping at 3,200 gal/min (7.2 ft3/s) for the majority of the November 2014 test (nearly 67 hours). The response of discharge from PTGS to pumping does not always clearly correspond to changes in pumping as did water levels in the observation wells. Discharge from PTGS began declin-ing immediately after the onset of pumping during the Febru-ary 2014 test, but then stabilized for a short period before
resuming decline with the increase in pumping at 24.5 hours (fig. 14). This unexpected temporary stabilization of discharge preceded an event where discharge from a similar bedrock spring (PTAG) upstream of PTGS became turbid after flowing clear for more than 34 hours into the interference test (fig. 15). Discharge from this spring subsequently cleared and was free of sediment for the remainder of the pumping period until the discharge again became turbid and cleared during the recovery period.
During the November 2014 test, a similar stabilization in spring discharge occurred at about 45 to 50 hours after pumping began (fig. 14). Although shorter in duration, this temporary stabilization did not correspond to any other abrupt
Figure 13. Man-made pools below the grotto spring (PTGS) and the weir used to monitor discharge during the three interference tests at Pah Tempe Springs, Washington County, Utah. Note the massive travertine deposits, formed by precipitation of calcium carbonate from the springwater.
Discharge originates from fractured limestone at the back of the caveDischarge originates from fractured limestone at the back of the cave
WeirWeir
Phot
ogra
phs
by P
hilip
Gar
dner

Results 19
changes in stress such as a change in river stage or pumping rate. Both of these unexplained stabilizations or perturbations in otherwise smooth response curves are similar to patterns of drawdown observed when fracture-filling sediment is released during pump tests in fractured-rock aquifers, causing minor rises in pumping levels and turbidity problems (Davis and DeWiest, 1966). Finally, data from the February 2014 and November 2014 tests showed that spring discharge appeared to stabilize during the recovery period without returning to pre-pumping discharge rates, despite measurements at PTVRL that indicated complete recovery of cumulative spring discharge. Although this observation may be partly explained by measurement uncertainty, it might also be the result of changes to the fracture-flow system that occurred during the test. For example, removal of material from fractures or filling of fractures by siltation, as was observed during the February 2014 test (fig. 15), might result in changes to flow rates from individual discharge points while the cumulative spring dis-charge remains the same.
Water Chemistry
Prior to pumping during the November 2013 low-flow test, the Virgin River upstream of the springs reach (PTVRU) con-tained calcium-bicarbonate-type water with a dissolved-solids concentration of 433 mg/L (table 4). Samples of the thermal springs, collected from the pumping site (PTPS) and the grotto spring (PTGS) contained sodium-chloride-type waters with dissolved-solids concentrations of 9,230 and 9,540 mg/L, respectively. With only 2.0 ft3/s of water in the river upstream of the springs reach and the springs contributing 10.7 ft3/s to the stream channel prior to pumping (table 3), the Virgin River downstream of the springs reach (PTVRL) also contained a high dissolved-solids concentration (7,670 mg/L) sodium-chloride-type water. Samples of the thermal water and river water downstream of the springs reach contained dissolved-solids concentrations of more than 10 times the U.S. Environ-mental Protection Agency recommended limit for drinking water (https://www.epa.gov/dwstandardsregulations) and fluoride concentrations near or slightly above the secondary
Figure 14. Discharge from the grotto spring (PTGS) compared to pumping rate during each of the three interference tests at Pah Tempe Springs, Washington County, Utah.
Dis
char
ge, i
n cu
bic
feet
per
sec
ond
Hours after onset of pumping
Pum
ping
rate
, in
gallo
ns p
er m
inut
e
0
0.2
0.4
0.6
0.8
1.0
1.2
1.4
0
0.2
0.4
0.6
0.8
1.0
1.2
1.40
0.2
0.4
0.6
0.8
1.0
1.2
1.4
0500
1,000
1,500
2,000
2,500
3,000
3,500
4,0004,500
500
1,000
1,500
2,000
2,500
3,000
3,500
4,0004,5000500
1,000
1,500
2,000
2,500
3,000
3,500
4,0004,500
November 2014
February 2014
November 2013
Logged discharge, in cubic feet per second (ft3/s)Pumping rate
1.1 ft3/s
0.15 ft3/s
1.1 ft3/s
0.70 ft3/s
1.2 ft3/s
0.55 ft3/s
-20 -15 -10 -5 0 5 10 15 20 25 30 35 40 45 50 55 60 65 70 75 80 85 90 95 100 105 110

20 Effects of Groundwater Withdrawals From the Hurricane Fault Zone on Discharge of Saline Water From Pah Tempe Springs
standard of 2 mg/L (table 4). Concentrations of iron and manganese were substantially higher in the sample from the pumping site (PTPS) than from the grotto spring (PTGS), indi-cating that these metals may have been sourced either from the steel bucket of the excavator used to create the pits where the pumps were placed, or from corrosion of a buried pipeline on the north side of the river where the pumping took place.
Specific conductance (SpC) of the pumping discharge varied throughout the low- and high-flow tests, but clearly showed that pumping during elevated river stage results in capture of fresh surface water. The SpC of the pumping dis-charge was approximately 13,200 microsiemens per centime-ter (μS/cm) at the onset of pumping during the February 2014 low-flow test and increased to more than 14,000 μS/cm after about 17 hours of pumping (fig. 16A). This appears to be the result of extracting water from bank storage that had become somewhat diluted with Virgin River water emplaced during the high flows that preceded this test. The high flows (up to 120 ft3/s from December 15–31, 2013) occurred during main-tenance operations on the Quail Creek Diversion upstream of the springs reach when the complete flow of the Virgin River was allowed to bypass the diversion. The temperature of the pumping discharge did not increase with increasing SpC, indi-cating that the water in bank storage had been relatively stag-nant prior to pumping, allowing for thermal re-equilibration.
During the November 2014 high-flow test, the SpC of the pumping discharge dropped from about 13,900 μS/cm to about 12,500 μS/cm after about 18 hours of pumping (fig. 16B). Stream stage during this test was higher than during
the February 2014 low-flow test, enough that the maximum drawdown from pumping resulted in a flow reversal from the river to the pumping vaults that was not observed during the February 2014 test. Pumping was briefly increased from 5.8 to 7.3 ft3/s at the end of the first constant-rate test in November 2014. When the pumps were shut down for about 4 hours for equipment repair, the SpC increased to about 13,900 μS/cm. When pumping resumed at 7.2 ft3/s, the SpC of the pumping discharge decreased to about 13,000 μS/cm. After pumping was terminated, the SpC of water in the pumping vaults increased to about 14,000 μS/cm. In contrast to the February 2014 low-flow test, the temperature of the pumping discharge also declined, indicating the capture of cool, fresh river water.
Although SpC was monitored at PTVRU, PTVRL, PTGS, PTAG, and PTPS (fig. 6), poor correlation between SpC and dissolved-solids concentration in high-salinity waters, likely due to variability in chemical composition related to the fraction of monovalent versus divalent ions, resulted in a substantially high uncertainty when calculating mixing ratios dominated by thermal water. Laboratory-measured values of dissolved-solids concentration from discrete samples were used instead for evaluating mixing ratios of thermal and river water. Dissolved-solids concentrations at PTVRU averaged 503 mg/L and ranged from a low of 433 mg/L in November 2013 to 554 mg/L in November 2014 (table 5). Dissolved-solids concentrations in thermal waters (PTPS, PTAG, and PTGS) prior to pumping during all three tests averaged 9,570 mg/L and varied by only about 2 percent
Figure 15. Sediment in discharge from a spring outlet along the Virgin River (PTAG), occurring part way through the second interference test in February 2014, at Pah Tempe Springs, Washington County, Utah.
Spring discharge orifice
Phot
ogra
ph b
y Ph
ilip
Gard
ner

Results 21Ta
ble
4.
Gene
ral c
hem
ical
cha
ract
eris
tics
of s
elec
ted
surfa
ce- a
nd g
roun
dwat
er s
ampl
ing
site
s pr
ior t
o th
e fir
st p
umpi
ng te
st a
t Pah
Tem
pe S
prin
gs, W
ashi
ngto
n Co
unty
, Uta
h.
[USG
S, U
.S. G
eolo
gica
l Sur
vey;
°C, d
egre
es C
elsi
us; m
g/L,
mill
igra
ms p
er li
ter;
μg/L
, mic
rogr
ams p
er li
ter]
Site
, USG
S si
te id
entif
ier
Sam
ple
da
teSa
mpl
e tim
epH
, fie
ld
Dis
solv
ed
solid
s,
resi
due
on
evap
orat
ion
at 1
80 °C
, w
ater
, fil
tere
d
(mg/
L)
Alk
alin
ity,
wat
er,
filte
red,
tit
rate
d (fi
eld)
(mg/
L as
Ca
CO3)
Calc
ium
, w
ater
, fil
tere
d (m
g/L)
Mag
ne-
sium
, wa-
ter,
filte
red
(mg/
L)
Sodi
um,
wat
er,
filte
red
(mg/
L)
Pota
s-si
um,
wat
er,
filte
red
(mg/
L)
Chlo
ride
, w
ater
, fil
tere
d (m
g/L)
Sulfa
te,
wat
er,
filte
red
(mg/
L)
Silic
a,
wat
er,
filte
red
(mg/
L as
Si
O 2)
Fluo
ride
, w
ater
, fil
tere
d (m
g/L)
Iron
, w
ater
, fil
tere
d (µ
g/L)
Man
-ga
nese
, w
ater
, fil
tere
d (µ
g/L)
PTV
RU
, 371
1271
1315
5901
11/1
5/20
1311
:30
7.3
433
169
71.7
27.5
41.4
3.19
45.0
130
8.23
0.21
4.70
1.57
PTPS
, 371
1201
1316
0401
11/1
7/20
1316
:30
6.1
9,23
01,
030
820
146
2,22
017
72,
910
1,68
026
.91.
721 79
71 12
2
PTG
S, 3
7111
8113
1609
0111
/15/
2013
10:3
06.
39,
540
1,03
581
314
42,
210
178
2,89
01,
630
26.6
2.26
3714
PTV
RL,
371
1221
1316
2201
11/1
6/20
139:
306.
87,
670
885
690
125
1,79
014
42,
760
1,66
023
.01.
8422
819
.4
Envi
ronm
enta
l Pro
tect
ion
Age
ncy
seco
ndar
y st
anda
rd50
025
025
02
300
501 Th
e hi
gh m
etal
con
cent
ratio
ns m
easu
red
in th
e su
mp
at th
e pu
mp
site
(PTP
S) m
ay h
ave
been
cau
sed
by d
iggi
ng th
roug
h ro
ck w
ith e
xcav
atio
n eq
uipm
ent o
r fro
m c
orro
sion
of t
he b
urie
d pi
pelin
e lo
cate
d on
the
north
side
of t
he ri
ver
whe
re th
e pu
mpi
ng o
ccur
red.
Not
e th
at th
ese
high
con
cent
ratio
ns w
ere
not p
rese
nt in
the
grot
to sp
ring
(PTG
S) sa
mpl
e.
(standard deviation/mean), ranging from 9,230 mg/L at PTPS on November 17, 2013, to 9,770 mg/L at PTGS on November 17, 2014. Prior to and during all three tests, the dissolved-solids load in the river increased downstream of PTPS12 and PTPS13 as more saline springs discharged into the channel. Mixing ratios during the November 2013 low-flow test are not discussed because they were affected by precipitation and associated rises in river stage.
During the low-flow test in February 2014, a sample col-lected from PTVRL (the site on the Virgin River below the springs) on February 9, prior to pumping, had a dissolved-solids concentration of 7,460 mg/L. A subsequent sample collected at the end of pumping on February 13, when the fraction of spring discharge capture was largest, showed a decrease to 6,530 mg/L. Mass-balance calculations based on the dissolved-solids concentrations at PTVRL and PTGS dur-ing the test indicate that pumping reduced thermal spring dis-charge to the Virgin River from about 80 to about 70 percent of the total flow in the river. The dissolved-solids concentra-tion at PTVRL increased to 7,170 mg/L on February 14 after 20 hours of recovery.
During the high-flow test in November 2014, a sample collected from PTVRL on November 17, prior to pumping, had a dissolved-solids concentration of 3,250 mg/L. Analysis of a sample collected on November 20, at the end of pumping, showed that the concentration had decreased to 2,260 mg/L. This indicates that pumping reduced thermal spring discharge to the Virgin River from about 30 to about 20 percent of the total flow in the river. The dissolved-solids concentration at PTVRL increased to 3,180 mg/L on November 21 after 24 hours of recovery.
Stable-isotope ratios of samples collected during this study from the thermal spring system (PTGS, PTAG, and PTPS), and the Virgin River upstream and downstream of the springs reach (PTVRU and PTVRL) plot between the global mete-oric water line and the local arid-zone meteoric water line, indicating a meteoric source of water for all samples (fig. 17). Samples of Virgin River water collected upstream from any spring influence (PTVRU) are clearly distinguishable from Pah Tempe Springs, with values ranging from -13.3 to -12.5 permil and -97.7 to -93.0 permil for δ18O and δD, respectively (table 5; fig. 17). The variability in isotope values at PTVRU during all three tests exceeds analytical uncertainty and is thought to be the result of diurnal freezing and thawing along the riverbanks upstream of the sample site. Samples from thermal springs (PTGS, PTAG, PTPS), observation wells (PT01, PT03), and selected riverside springs (PTST1, 2, 4, and 17) have stable-isotope values ranging from -13.9 to -13.6 and -109 to -107 permil for δ18O and δD, respectively. These waters are substantially more depleted in the heavy isotopes (plotting lower and to the left on fig. 17), indicating that they are sourced from higher-altitude precipitation than the Virgin River samples. Samples of Virgin River water collected downstream of the springs reach (PTVRL) have intermediate stable-isotope values and clearly represent a two-part mixture of upstream Virgin River water and Pah Tempe Springs ther-mal discharge.

22 Effects of Groundwater Withdrawals From the Hurricane Fault Zone on Discharge of Saline Water From Pah Tempe Springs
A deuterium mass-balance method was used to evaluate the mixing ratios of upstream Virgin River water and thermal springwater that compose the Virgin River below the springs reach. Using the pre-pumping δD values for the Virgin River above the springs (-93 and -97 permil for November 2013 and February 2014, respectively) and for the grotto spring (-108 and -109 permil for November 2013 and February 2014, respectively) as end-members, estimates indicate that the river below the springs reach contained about 80 percent
thermal springwater prior to pumping during the two low-flow tests. Isotopic ratios of samples collected at PTVRL remained tightly clustered during the pumping portion of both low-flow tests (fig. 17), indicating that the reduction in the fraction of thermal water (and thus salt load) due to pumping capture was not resolvable (within the limits of analytical uncertainty) using the isotopic values.
Figure 16. Specific conductance and temperature of water measured in the pumping vaults (PTPS) compared to the pumping rate during A, the low-flow interference test of February 2014, and B, the high-flow interference test of November 2014, at Pah Tempe Springs, Washington County, Utah.
Pum
ping
rate
, in
cubi
c fe
et p
er s
econ
d
Spec
ific
cond
ucta
nce,
inm
icro
siem
ens
per c
entim
eter
at 2
5 de
gree
s Ce
lsiu
s
Spec
ific
cond
ucta
nce,
inm
icro
siem
ens
per c
entim
eter
at 2
5 de
gree
s Ce
lsiu
sTe
mpe
ratu
re, i
n de
gree
s Ce
lsiu
sTe
mpe
ratu
re, i
n de
gree
s Ce
lsiu
s
B
A
3536
37
38
39
40
4142
11,500
12,000
12,500
13,000
13,500
14,000
14,500
3536
37
38
39
40
41
42
11,500
12,000
12,500
13,000
13,500
14,000
14,500
012345678910
012345678910
012345678910
012345678910
Hours after onset of pumping-10 -5 0 5 10 15 20 25 30 35 40 45 50 55 60 65 70 75 80 85 90 95 100
November 2014
November 2014
February 2014
February 2014
Specific conductancePumping rateTemperature

Results 23
Table 5. Field parameters, dissolved-solids concentration, and stable-isotope values from surface- and groundwater sampling sites at Pah Tempe Springs, Washington County, Utah. [Sites are listed in the order they are encountered in a downstream direction beginning at the top of the study reach. Abbreviations: USGS, U.S. Geological Survey; °C, degrees Celsius; μS/cm, microsiemens per centimeter at 25 degrees Celsius; mg/L, milligrams per liter; δ18O, delta oxygen-18; δD, delta deuterium; permil, per thousand; —, no data]
Site name USGS site identifier Sample date Sample timeWater
temperature (°C)
Specific conductance
(µS/cm)
Dissolved-solids concentration
(mg/L)
δ18O (permil)
δD (permil)
PTVRU 371127113155901 11/15/2013 11:30 8.1 693 433 -12.5 -93.0
11/19/2013 11:00 — — — -12.5 -93.2
11/25/2013 15:05 8.2 736 446 -12.8 -94.0
2/9/2014 13:45 11.7 798 508 -13.1 -96.4
2/13/2014 12:40 9.0 756 509 -13.3 -97.7
11/17/2014 13:10 5.7 825 554 -12.8 -94.6
11/20/2014 8:15 4.8 842 536 -12.9 -95.8
11/21/2014 9:15 5.4 836 535 -13.0 -95.7
PTPS 371120113160401 11/17/2013 16:30 33.6 13,800 9,230 -13.6 -107
11/19/2013 10:45 — — — -13.8 -109
11/20/2013 21:25 39.8 13,500 9,380 -13.7 -108
11/22/2013 8:30 39.9 13,300 9,340 -13.7 -108
2/10/2014 10:20 40.7 13,500 9,630 -13.8 -109
2/11/2014 9:15 40.7 13,200 9,580 -13.8 -109
2/12/2014 10:45 40.8 13,500 9,630 -13.8 -109
2/12/2014 17:02 40.8 13,700 9,400 -13.8 -109
2/13/2014 14:07 40.8 13,800 — -13.8 -109
11/17/2014 17:10 36.3 12,600 9,650 -13.7 -109
11/20/2014 9:00 38.2 12,600 8,990 -13.7 -108
11/21/2014 10:40 40.9 13,700 9,720 -13.8 -109
PTAG 371118113160601 11/17/2013 13:20 41.2 13,600 9,590 -13.7 -108
2/9/2014 9:30 41.3 14,000 9,710 -13.8 -109
2/12/2014 10:35 40.9 13,600 9,390 -13.8 -109
2/13/2014 13:35 40.6 13,600 9,160 -13.8 -109
2/14/2014 10:04 40.6 13,600 9,690 -13.8 -109
PTGS 371118113160901 11/15/2013 10:30 41.2 13,500 9,540 -13.7 -108
11/20/2013 21:53 — — 9,040 -13.7 -109
11/22/2013 8:52 41.1 13,500 8,990 -13.7 -108
11/25/2013 14:20 41.2 13,400 8,970 -13.7 -108
2/9/2014 9:15 41.2 14,000 9,470 -13.8 -109
2/12/2014 10:10 41.0 13,600 9,580 -13.8 -109
2/13/2014 13:20 41.1 13,700 9,700 -13.8 -109
2/14/2014 9:50 41.1 14,000 9,760 -13.8 -109
11/17/2014 11:20 41.1 14,200 9,770 -13.6 -109
11/19/2014 9:26 41.1 13,800 9,800 -13.7 -109
11/20/2014 8:00 41.1 13,800 9,760 -13.8 -109
11/21/2014 9:05 41.1 13,800 9,710 -13.9 -109

24 Effects of Groundwater Withdrawals From the Hurricane Fault Zone on Discharge of Saline Water From Pah Tempe Springs
Deuterium mass-balance estimates using pre-pumping δD values for the Virgin River above the springs (PTVRU, -94.6 permil) and for the grotto spring (PTGS, -109 permil) for the November 2014 high-flow test indicate that the river below the springs reach contained about 30 percent thermal springwater prior to pumping. The isotope data show the progressive reduction in the thermal component of the river water below the springs reach (at PTVRL) during the pump-ing phase of this test. The isotopic composition of samples collected at PTVRL evolves toward that of the upstream river water collected at PTVRU (from the point labeled 1 to 2 to 3 in figure 17) as spring discharge is reduced due to pumping capture. Mass-balance estimates show that the thermal water fraction at PTVRL was reduced from about 30 to about 20
percent at the end of the pumping period before the isotope signature returned to its initial ratio upon recovery after pump-ing had ceased (point 4 in figure 17). Though less pronounced, the isotopic composition of the grotto spring discharge (PTGS) and the pumping discharge (PTPS) systematically evolved toward more depleted isotope values during the pumping period of the November 2014 test (illustrated by arrow in the lower left corner of figure 17). This indicates that these points of thermal discharge contained a small fraction of freshwater prior to pumping that was reduced with pumping. This obser-vation is in agreement with the previous conceptual models that indicate thermal spring discharge is diluted to some degree with cooler freshwater sourced from either the Virgin River or a shallow bedrock aquifer.
Table 5. Field parameters, dissolved-solids concentration, and stable-isotope values from surface- and groundwater sampling sites at Pah Tempe Springs, Washington County, Utah.—Continued [Sites are listed in the order they are encountered in a downstream direction beginning at the top of the study reach. Abbreviations: USGS, U.S. Geological Survey; °C, degrees Celsius; μS/cm, microsiemens per centimeter at 25 degrees Celsius; mg/L, milligrams per liter; δ18O, delta oxygen-18; δD, delta deuterium; permil, per thousand; —, no data]
Site name USGS site identifier Sample date Sample timeWater
temperature (°C)
Specific conductance
(µS/cm)
Dissolved-solids concentration
(mg/L)
δ18O (permil)
δD (permil)
PTVRL 371122113162201 11/16/2013 9:30 32.0 11,600 7,670 -13.5 -105
11/19/2013 11:15 — — — -13.5 -106
11/20/2013 22:25 — — 7,800 -13.5 -105
11/21/2013 16:55 32.2 11,300 — — —1 11/25/2013 14:00 22.8 7,600 4,990 -13.2 -101
2/9/2014 9:50 30.7 11,200 7,460 -13.6 -106
2/10/2014 13:50 30.4 10,300 6,900 -13.5 -105
2/11/2014 17:40 30.0 10,700 6,960 -13.6 -105
2/12/2014 9:16 27.4 9,750 6,790 -13.6 -105
2/13/2014 8:30 26.2 9,750 6,530 -13.5 -105
2/14/2014 11:45 30.4 10,300 7,170 -13.6 -106
11/17/2014 12:20 14.4 5,050 3,250 -13.1 -99.4
11/18/2014 8:50 10.7 3,820 2,450 -13.1 -98.1
11/20/2014 8:35 10.9 3,390 2,260 -12.8 -97.5
11/21/2014 9:30 15.2 4,730 3,180 -13.2 -99.3
PTO1 371119113160601 11/17/2014 10:10 38.2 14,300 9,750 -13.9 -109
PTO3 371122113161801 11/17/2014 11:30 33.4 13,600 9,400 -13.8 -108
PTST1 371123113161901 11/18/2014 12:45 36.0 12,900 8,890 -13.7 -107
PTST2 371122113161701 11/18/2014 13:00 39.3 14,000 9,560 -13.7 -108
PTST4 371120113161201 11/18/2014 13:10 39.3 14,400 9,850 -13.7 -109
PTST17 371119113160401 11/18/2014 15:30 36.1 14,300 9,420 -13.8 -1091 This sample represents conditions in the river after it had risen significantly following the precipitation event beginning on November 19th.

Results 25
Figure 17. Stable-isotope ratios of thermal spring and river waters in relation to the global and arid-zone meteoric water lines during the November 2013, February 2014, and November 2014 interference tests at Pah Tempe Springs, Washington County, Utah.
February 2014 test
November 2014 test
November 2013 test
Delta oxygen-18, in permil
Del
ta d
eute
rium
, in
perm
il
-110
-108
-106
-104
-102
-100
-98
-96
-94
-92
-90
-110
-108
-106
-104
-102
-100
-98
-96
-94
-92
-90
-110
-108
-106
-104
-102
-100
-98
-96
-94
-92
-90
-14 -13.5 -13 -12.5 -12
Global meteoric water line (Craig, 1961a)
Arid-zone meteoric water line (Welch and Preissler, 1986)
Global meteoric water line (Craig, 1961a)
Global meteoric water line (Craig, 1961a)
Arid-zone meteoric water line (Welch and Preissler, 1986)
Arid-zone meteoric water line (Welch and Preissler, 1986)1
2 3
4
PTVRUPTPSPTGSPTVRLObservation wellRiverside springArrow shows the direction of the evolution of the isotopic signature during the pumping test
EXPLANATION

26 Effects of Groundwater Withdrawals From the Hurricane Fault Zone on Discharge of Saline Water From Pah Tempe Springs
Water Temperature
Water temperature measurements made prior to and dur-ing all three interference tests provide information that helps advance the understanding of the interaction between the ther-mal, saline groundwater system and the fresh, surface-water system. Baseline (pre-pumping) water temperatures represent-ing the thermal system (all sample sites excluding the river sites) ranged from about 33 to 41 oC in February 2014, with the warmest temperatures located along the upstream one-third of the springs reach and the coolest temperatures generally located in the lower one-third of the springs reach (fig. 18). Water temperatures at or above 40 oC highlight areas where upwelling thermal water reaches the surface. Lower tem-peratures seen elsewhere could be the result of cooling along extended, more tortuous flow paths from the spring’s source to the discharge points or from mixing with cooler freshwater from the river or shallow aquifer. If mixing is responsible for the cooler temperatures, the dissolved-solids concentrations at observation wells and discrete spring discharge sites should be noticeably diluted. The poor correlation between temperature and dissolved-solids values from six sites with temperatures
below 40 oC (fig. 19; PTO1, PTO3, PTST1, PTST2, PTST4, and PTST17) indicates that both mechanisms may be respon-sible for the cooler temperatures. The locations of spring sites with the warmest pre-pumping temperatures (greater than 40 oC) indicate that the focus of upwelling thermal water is between about 550 and 925 ft upstream of the easternmost segment of the Hurricane Fault. This observation is consistent with a detailed fracture density analysis and areas of highest spring discharge and CO2 gas outflow reported by Dutson (2005).
Recorded temperature changes at several sites also indicate that the radius of pumping-induced stress reached individual discharge points up to 400 ft from the pumping vaults. Temperatures at six of the seven affected spring sites (PTST12, PTST13, PTST15, PTST17, PTST10.1, and PTAG) declined at some point during the pumping period in February 2014 (fig. 20), a response attributed to a visibly noted reduc-tion in spring discharge at those locations. Spring PTST14 showed an increase in temperature of approximately 2.7 oC that corresponded to the onset of pumping and decreased to its pre-pumping temperature at the end of the test. This spring discharges from gravels in the riverbed itself and is the
Figure 18. Water temperatures at individual spring discharge points measured prior to pumping during the second interference test in February 2014, at Pah Tempe Springs, Washington County, Utah.
113°16'10"
PTST4
PTST5 PTO2
PTST7PTST8
PTST6
PTGSPTST10
PTST13
PTST12PTPS
PTST17
PTO1
PTST11
PTST16
PTST9
PTST15PTST10.1
PTAG
PTST14
113°16'20"
37°11'25"
PTST1
PTST1.1PTO3
PTST2
PTST3
37°11'20"
0 100 200 300 400
7525 50
500 Feet
100 Meters0
Aerial photography by Alpha Engineering, St. George, Utah
EXPLANATION
Less than 3535 to 3636 to 3737 to 38
38 to 3939 to 4040 to 4141 to 42
Fault—Bar and ball on downthrown side
Water temperature, in degrees Celsius

Results 27
lowest in altitude of the affected spring sites. It seems likely that the reduction in flow in the stream channel caused by the capture of spring discharge upstream of this site (for example, at PTST12 and PTST13) reduced mixing with cooler water, resulting in a higher fraction of thermal spring discharge at PTST14.
Lastly, the temperature of the pumping discharge at PTPS dropped nearly 3 oC during the second phase of pumping in November 2014, coincident with both the change in pump-ing rate and an observed drop in SpC (fig. 16). This provides additional evidence that pumping at more than 30 ft from the riverbank can capture Virgin River water when hydraulic head in the thermal system is lowered beneath the altitude of the river surface.
Non-Pumping Spring Discharge
The pre-pumping cumulative discharge of Pah Tempe Springs was 10.7, 14.7, and 12.8 ft3/s for the November 2013, February 2014, and November 2014 interference tests, respectively. It is unknown whether this variability is driven by upstream river dynamics or variations in distant recharge. An evaluation of pre-test river conditions in the reach above the springs and below the Quail Creek Diversion indicates that cumulative spring discharge may be a function of flow-dependent losses from the Virgin River in this reach. The river discharge below the Quail Creek Diversion had been less than about 5 ft3/s for several months preceding the lowest cumu-lative springs discharge of 10.7 ft3/s. The highest cumula-tive springs discharge (14.7 ft3/s) was measured before the onset of pumping for the February 2014 test. Approximately 1 month before this test, from December 15–31, 2013, the Virgin River had been flowing approximately 120 ft3/s through lower Timpoweap Canyon while the WCWCD was replacing the headgates at the Quail Creek Diversion. The high springs discharge measured in February 2014 could have been the
hydraulic response of draining the additional recharge pro-vided by stream losses during this period of high flow. The cumulative springs discharge preceding the November 2014 test (12.8 ft3/s) followed an active monsoon season where the river above the springs flooded briefly three times at flows between 1,000 and 6,500 ft3/s. Additionally, the discharge in the river above the springs was kept at 24.5 ft3/s, nearly seven and twelve times higher than during the previous two tests. These periods of high flows also may have provided recharge to the shallow aquifer, causing the somewhat higher discharge from the springs. Pre-pumping SpC data provide no clear evi-dence that the hydrologic conditions preceding each test had any effect on the chemistry of the thermal springs.
For both the low-flow and high-flow interference tests, the dissolved-solids load contributed by the springs prior to pumping was less than would be expected if the discrete springs were discharging pure thermal water with a consistent dissolved-solids concentration. These data support the concept that the springs discharge is diluted with freshwater from the river. Furthermore, the largest difference was noted when the river discharge was at its highest, indicating that river stage drives mixing and dilution of thermal discharge input through permeable riverbed and riverbank materials.
Pumping Effects on Spring Capture and Dissolved-Solids Load
Observations of streamflow at PTVRL, spring discharge at PTGS, and drawdown at PTO1, PTO2, and PTO3, during all three interference tests indicate that the river-spring hydro-logic system approaches a new steady-state condition within about 1 day after each change in pumping rate (figs. 9, 12, and 14). Therefore, the detailed effects of pumping on the springs and in the river below the springs reach were evaluated at these quasi steady-state periods. Tables 6 and 7 summarize values of discharge, total dissolved-solids concentration,
Figure 19. Temperature compared to dissolved-solids concentration for samples collected during the February 2014 interference test from selected spring discharge points along the Pah Tempe Springs study reach, Washington County, Utah.
8,800 9,000 9,200 9,400 9,600 9,800 10,00032
34
36
38
40
42
44
46Thermal waters, warmer than 40 degrees Celsius (PTGS, PTAG, PTPS)Thermal waters, cooler than 40 degrees Celsius
Tem
pera
ture
, in
degr
ees
Cels
ius
Dissolved-solids concentration, in milligrams per liter
PTST1 PTST17
PTO3
PTST2PTO1
PTST4

28 Effects of Groundwater Withdrawals From the Hurricane Fault Zone on Discharge of Saline Water From Pah Tempe Springs
Figure 20. A, Change in temperature for selected spring discharge points compared to pumping rate during the February 2014 interference test, and B, the location of these sites along the Pah Tempe Springs study reach, Washington County, Utah.
PTST10.1PTST15PTST14
PTST13
PTPS
PTST12
PTST17
PTAG
EXPLANATIONSpring temperature site showing a pumping-related change in temperature
Pumping vaults
Hours after onset of pumping
Tem
pera
ture
, in
degr
ees
Cels
ius
Pum
ping
rate
, in
gallo
ns p
er m
inut
e
-3.0
-2.0
-1.0
0
1.0
2.0
3.0
4.0
-10 -5 0 5 10 15 20 25 30 35 40 45 50 55 60 65 70 75 80 85 90 95 1000500
1,000
1,500
2,000
2,500
3,000
3,500
4,0004,5000500
1,000
1,500
2,000
2,500
3,000
3,500
4,0004,500
-35
-30
-25
-20
-15
-10
-5
0
5
PTST14PTST17PTST10.1PTAG
PTST12PTST13PTST15Pumping rate
A
B
Aerial photography by Alpha Engineering, St. George, Utah
113°16'10"113°16'20"
37°11'20"
0 100 200 300 400
7525 50
500 Feet
100 Meters0
PTAG
PTPS

Results 29
and dissolved-solids load for each steady-state period of the February 2014 low-flow and November 2014 high-flow tests, respectively. The tables contain subsections that describe con-ditions for the associated pre-pumping, pumping, and recov-ery stress periods. Each subsection lists measurements of the discharge (Q), total dissolved-solids concentration (TDS), and the resulting dissolved-solids load (Load) in the river upstream (PTVRU) and downstream (PTVRL) of the springs reach, and is calculated as follows:
Load = Q * TDS (3)
where Load is in tons of salt per day, Q is discharge, in cubic feet per second, and TDS is total dissolved-solids concentration, in
milligrams per liter
Each subsection also lists Q and Load of the cumula-tive springs input, with Load calculated in two ways for comparison: (1) Springs–1 presents a dissolved-solids load calculated as the difference between the dissolved-solids load in the Virgin River above and below the springs reach (Load at PTVRL − Load at PTVRU), and (2) Springs–2 presents a dissolved-solids load calculated using Q derived as the dif-ference between Q measured in the Virgin River above and below the springs reach (Q at PTVRL − Q at PTVRU), and the TDS in the grotto spring to represent the TDS of the cumula-tive springs input.
Like the pre-pumping subsections, the recovery subsec-tions of tables 6 and 7 list values of Q, TDS, and Load for PTVRU and PTVRL, and Q and TDS only for the cumula-tive springs input (PTVRL − PTVRU). The recovery subsec-tion also contains values for the percent difference in Q and Load at PTVRL when compared to pre-pumping conditions. The November 2013 low-flow test is described separately in appendix 3.
Table 6. Discharge, dissolved-solids concentration, and dissolved-solids load from surface- and groundwater sampling sites at pre-pumping and approximate steady-state conditions at the end of each pumping period during the February 2014 interference test at Pah Tempe Springs, Washington County, Utah. [Q, discharge; ft3/s, cubic feet per second; TDS, total dissolved-solids concentration; mg/L, milligrams per liter; ton/d, tons per day; gal/min, gallons per minute; —, not applicable]
February 2014 interference test using improved concrete-lined vault sumps for pumping withdrawals
Pre-pumping, February 2014 Q 1 (ft3/s) TDS 1 (mg/L) Load (ton/d)
River upstream (PTVRU) 3.5 508 4.8
River downstream (PTVRL) 18.2 7,460 366
Springs-1 (PTVRL-PTVRU) 14.7 — 361
Springs-2 (Load = (QPTVRL -QPTVRU) * TDSPTGS) 14.7 9,470 375
Steady state after pumping 2,330 gal/min (5.19 ft3/s) from 2/10/2014 10:00 to 2/11/2014 10:29 Q 1 (ft3/s) TDS 1 (mg/L) Load (ton/d)
River upstream (PTVRU) 3.5 508 4.8
River downstream (PTVRL) 11.7 6,930 219
Springs (PTVRL-PTVRU) 8.2 — 214
Pumping discharge (PTPS) 5.2 9,580 134
River reduction (PTVRLpre-pumping -PTVRL@2,330 gal/min steady state) 6.5 — 147
Capture efficiency ratio (Pumping discharge/River reduction) 1.25 — 1.10
Steady state after pumping 3,290 gal/min (7.33 ft3/s) from 2/11/2014 12:25 to 2/13/2014 14:04 Q 1 (ft3/s) TDS 1 (mg/L) Load (ton/d)
River upstream (PTVRU) 3.5 508 4.8
River downstream (PTVRL) 9.9 6,530 174
Springs (PTVRL-PTVRU) 6.4 — 170
Pumping discharge (PTPS) 7.3 9,400 186
River reduction (PTVRLpre-pumping-PTVRL@3,290 gal/min steady state) 8.3 — 192
Capture efficiency ratio (Pumping discharge/River reduction) 1.13 — 1.03
Late recovery, post-pumping at 2/14/2014 12:00 Q 1 (ft3/s) TDS 1 (mg/L) Load (ton/d)
River upstream (PTVRU) 3.6 509 4.9
River downstream (PTVRL) 17.4 7,170 336
Springs (PTVRL-PTVRU) 13.8 — 332
River downstream (PTVRL) recovered percent difference compared to pre-pumping -4.4 — -8.11 Q and TDS values that best represent the time period. They may be an average over time as in the case of upstream river flows designed to remain steady throughout a test or a
single measured value for a particular time as in the case of a TDS value at the downstream river site at the end of a stress period.

30 Effects of Groundwater Withdrawals From the Hurricane Fault Zone on Discharge of Saline Water From Pah Tempe Springs
Table 7. Discharge, dissolved-solids concentration, and dissolved-solids load from surface- and groundwater sampling sites at pre- pumping, pumping, and approximate steady-state conditions at the end of each pumping period during the November 2014 interference test at Pah Tempe Springs, Washington County, Utah. [Q, discharge; ft3/s, cubic feet per second; TDS, total dissolved-solids concentration; mg/L, milligrams per liter; ton/d, tons per day; gal/min, gallons per minute; —, not applicable]
November 2014 interference test using improved concrete-lined vault sumps for pumping withdrawals
Pre-pumping, November 2014 Q 1 (ft3/s) TDS 1 (mg/L) Load (ton/d)
River upstream (PTVRU) 24.5 542 35.8
River downstream (PTVRL) 37.3 3,250 327
Springs-1 (PTVRL-PTVRU) 12.8 — 291
Springs-2 (Load = (QPTVRL -QPTVRU) * TDSPTGS) 12.8 9,760 337
Steady state after pumping 3,200 gal/min (7.13 ft3/s) from 11/17/2014 15:00 to 11/20/2014 9:45 Q 1 (ft3/s) TDS 1 (mg/L) Load (ton/d)
River upstream (PTVRU) 24.5 542 35.8
River downstream (PTVRL) 29.8 2,260 182
Springs (PTVRL-PTVRU) 5.3 — 146
Pumping discharge (PTPS) 7.1 9,450 182
River reduction (PTVRLpre-pumping -PTVRL@2,330 gal/min steady state) 7.5 — 145
Capture efficiency ratio (Pumping discharge/River reduction) 1.05 — 0.80
Late recovery, post-pumping at 11/21/2014 9:30 Q 1 (ft3/s) TDS 1 (mg/L) Load (ton/d)
River upstream (PTVRU) 24.5 542 35.8
River downstream (PTVRL) 38.7 3,180 332
Springs (PTVRL-PTVRU) 14.2 — 296
River downstream (PTVRL) recovered percent difference compared to pre-pumping 3.8 — 1.51 Q and TDS values that best represent the time period. They may be an average over time as in the case of upstream river flows designed to remain steady throughout a test or a
single measured value for a particular time as in the case of a TDS value at the downstream river site at the end of a stress period.
During the February 2014 low-flow interference test, the pre-pumping difference in discharge and dissolved-solids load between PTVRU and PTVRL indicated a cumulative spring input of 14.7 ft3/s and 361 tons per day (ton/d), respectively (table 6). The dissolved-solids load, calculated using a TDS value from PTGS for comparison, was 375 ton/d. This is 5 percent higher than the load calculated using the TDS value from the stream. This discrepancy is likely because some of the thermal spring discharge along the study reach is mixed with shallow fresh groundwater, resulting in variable dis-solved-solids concentrations.
By the end of the first pumping period, cumulative dis-charge and dissolved-solids load of the springs were reduced to 8.2 ft3/s and 214 ton/d, respectively, based on the differ-ence in observations at PTVRU and PTVRL (table 6). This equates to a reduction by 6.5 ft3/s and 147 ton/d for discharge and dissolved-solids load, respectively, entering the river. In comparison, discharge and dissolved-solids load derived from direct measurements of the pumping discharge were 5.2 ft3/s and 134 ton/d, respectively.
Apparent capture efficiency is presented for both discharge and dissolved-solids load as a summary metric that describes the effects of pumping on the springs and the river. If the pumping were 100-percent efficient, the reduction in discharge and dissolved-solids load in the river would exactly match the pumping rate and the dissolved-solids load measured in the pumping discharge. Apparent capture efficiency is defined for
discharge as the ratio of the reduction in discharge in the river attributed to pumping capture to the measured pumping dis-charge. Apparent capture efficiency is defined for dissolved-solids load as the ratio of the load reduction in the river to the load in the pumping discharge. For example, at the end of the first pumping period during the February 2014 test, discharge in the Virgin River was reduced by 6.5 ft3/s while the pumping discharge was 5.2 ft3/s, giving an apparent capture efficiency of 6.5/5.2 = 1.25. At the same time, the dissolved-solids load in the river was reduced by 147 ton/d while the dissolved-solids load in the pumping discharge was 134 ton/d, giving an apparent capture efficiency of 147/134 = 1.10. The capture efficiencies are referred to as “apparent” because they are affected by the cumulative uncertainty in both the pumping and river discharge measurements, which is reflected in their difference. The fact that the calculated efficiencies are greater than 1 is also likely related to measurement uncertainty but may indicate that the river discharge (measured at PTVRL) was decreasing slightly prior to pumping and continued throughout the test independent of the effects of pumping. This would result in a larger difference between the discharge measured at PTVRL before and after a given period of pump-ing than would have resulted from pumping capture alone. In any event, the apparent efficiency values indicate that pump-ing shallow groundwater is effective at capturing thermal discharge and the associated dissolved-solids loads prior to flowing into the river.

Discussion 31
By the end of the second pumping period of the February 2014 test, the cumulative discharge and dissolved-solids load of the springs were reduced to 6.4 ft3/s and 170 ton/d, respectively. This indicates a capture of 8.3 ft3/s and 192 ton/d prior to flowing into the river. By comparison, a discharge of 7.3 ft3/s and a dissolved-solids load of 186 ton/d were derived from direct measurements of the pumping discharge. This indicates that the capture efficiency ratios were 1.13 and 1.03 for spring discharge and dissolved-solids load, respectively. River and spring conditions were monitored for approximately 22 hours after pumping was terminated. During this time, the discharge and dissolved-solids load at PTVRL returned to within about 4 percent and 8 percent, respectively, of their pre-pumping values (table 6), indicating that the system approaches complete recovery in less than 1 day.
During the November 2014 high-flow interference test, the pre-pumping difference in discharge and dissolved-solids load between PTVRU and PTVRL indicated a cumulative spring input of 12.8 ft3/s and 291 ton/d, respectively (table 7). For comparison, the dissolved-solids load calculated using a TDS value from PTGS was 337 ton/d. This 15-percent discrepancy was notably higher than for the February 2014 test and may indicate more extensive freshwater dilution of discharge from some of the spring orifices associated with the higher river stage conditions during this test. There was only one pump-ing period (3,200 gal/min for a little less than 3 days) for the high-flow test. At the end of the pumping period, the cumu-lative discharge and dissolved-solids load from the springs to the river were reduced to 5.3 ft3/s and 146 ton/d, respec-tively, based on the difference in observations at PTVRU and PTVRL. These values are lower than at the end of the pump-ing period during the February 2014 test, and likely are attrib-uted to the longer period of pumping at the highest sustainable withdrawal rate (3,290 gal/min). The observed values during the high-flow test indicate the capture of 7.5 ft3/s and 145 ton/d of salt prior to entering the river. Discharge and dissolved-solids load at PTVRL returned to within about 4 percent and 2 percent, respectively, of their pre-pumping values (table 7) approximately 24 hours after pumping was terminated, again indicating that the system approaches complete recovery in about 1 day.
Comparison to the discharge and dissolved-solids load derived from direct measurements of the pumping discharge (7.1 ft3/s and 182 ton/d) indicates a 1.05 apparent capture efficiency ratio for spring discharge, yet only a 0.80 dissolved-solids load capture efficiency ratio (table 7). The discrepancy between the efficiency in capture of discharge and capture of dissolved-solids load indicates that pumping may be capturing thermal water with an average dissolved-solids concentration higher than dissolved-solids concentrations of spring discharge flowing into the river. With similar pumping rates and very low flow in the river upstream of the springs reach (3.5 ft3/s), pumping was effectively 100-percent efficient at capturing spring discharge and dissolved-solids load during the February 2014 low-flow test. It appears that the additional freshwater (and associated higher freshwater hydraulic head) in the river
upstream of the springs reach (25 ft3/s) during the November 2014 high-flow test resulted in more dilution of the thermal springwater in the shallow aquifer. This mixing and dilution of the springwater likely is enhanced when the freshwater hydraulic head in the river is higher (a result of higher flows) and the hydraulic head in the shallow aquifer is lower due to pumping.
Discussion Results of this hydrogeologic investigation and the
interference tests conducted at Pah Tempe Springs provide new information about this complex and dynamic hydrologic system. The springs discharge through numerous orifices in porous carbonate-cemented alluvium that are connected to the underlying fractured bedrock. Along the study reach, thermal discharge occurs directly from fractured limestone such as at monitoring sites PTGS and PTAG (figs. 13 and 15), the riverbed, or along both banks of the river through carbonate-cemented alluvium, often covered by thin travertine depos-its, such as at most of the PTO and PTST monitoring sites (figs. 11 and 21).
Upwelling thermal water flows through the most intensely fractured portion of the fault damage zone between sites PTST6 and PTST16 (fig. 18) where secondary permeability is enhanced by dissolution along bedding planes and fault-induced fractures. The highest thermal-system hydraulic heads (greater than 8.9 ft above the riverbed) and warmest pre-pumping springwater temperatures (40–42 oC) occur in this section of the study reach (figs. 8 and 18). The hydraulic heads and high temperatures indicate that the fracture perme-ability provides pathways for rapid groundwater movement, preventing thermal waters from cooling prior to discharge. The springs in this reach encompass all of the springs that discharge directly from limestone and coincide with the area of highest fracture density in the footwall damage zone of the Hurricane Fault as noted by Dutson (2005). Thermal water that rises in this highly fractured zone, but does not discharge directly from fractured limestone, flows laterally through the cemented alluvium to discharge at the many riverbed and riv-erbank springs (fig. 22). Observed pre-pumping water temper-atures less than 40 oC (fig. 18) are the result of either thermal water cooling along longer and slower pathways through the cemented alluvium to points of discharge or of thermal water mixing with cooler river water prior to discharge.

32 Effects of Groundwater Withdrawals From the Hurricane Fault Zone on Discharge of Saline Water From Pah Tempe Springs
Figure 21. Discrete springs discharging A, directly from gravel in the bed of the Virgin River, and B, through carbonate-cemented alluvium covered by a thin travertine deposit at Pah Tempe Springs, Washington County, Utah.
Discrete spring discharge
Discrete spring discharge
Discrete spring discharge
A
B
Phot
ogra
phs
by P
hilip
Gar
dner
The results of aquifer testing by Reclamation in 1972 and trench dewatering for a pipeline installation in 1984 indicated that the spring outlets on both sides of the Virgin River were hydraulically connected. Reports of these results led Everitt and Einert (1994) to note that the source of water immedi-ately underlying the spring area can be treated as a highly permeable single unconfined aquifer. Monitoring during this study’s three pumping interference tests indicates that this is a dual-porosity groundwater system showing the hydraulic response characteristics of both an unconfined continuous porous medium and a fractured bedrock system. Monitored drawdowns in the observation wells (PTO1, PTO2, and PTO3) confirm the unconfined continuous porous-media response to pumping of the shallow aquifer, likely reflecting conditions in the cemented alluvium and shallow fractured damage zone (fig. 9). The somewhat more step-like response of discharge from the grotto spring (PTGS; fig. 14) and alternating turbidity and clarity of an upstream bedrock spring (PTAG; fig. 15) pre-viously discussed are characteristics typically observed during

Discussion 33
Figure 22. Thermal flow system discharging to Pah Tempe Springs and the Virgin River, Washington County, Utah.
Vertical exaggeration x 15
East
Geology adapted from Biek, 2003
Queantoweap Sandstone
Queantoweap Sandstone
Toroweap Formation
Moenkopi
FormationMoenkopi
Formation
KaibabFormation
KaibabFormation
AlluviumAlluvium
Zone of hot springs
Zone of hot springs
Zone of highest fracture density fro
m Dutson, 2005
Zone of highest fracture density fro
m Dutson, 2005
Hurr
ican
e Fa
ult
2,4002,400
WestWest
3,2003,200
3,1003,100
2,5002,500
2,3002,300
2,6002,600
3,0003,000
2,7002,700
2,8002,800
2,9002,900
3,5003,500
3,3003,300
3,4003,400
Alti
tude
, in
feet
Alti
tude
, in
feet
EXPLANATIONRising hot water heated by deep circulation
Fault—Bar and ball on downthrown side, arrows show direction of movement along fault
Water table
Bedrockfractures
Inset shows near-surface hypothetical flow of thermal water from fractured bedrock through cemented alluvium in and along the river
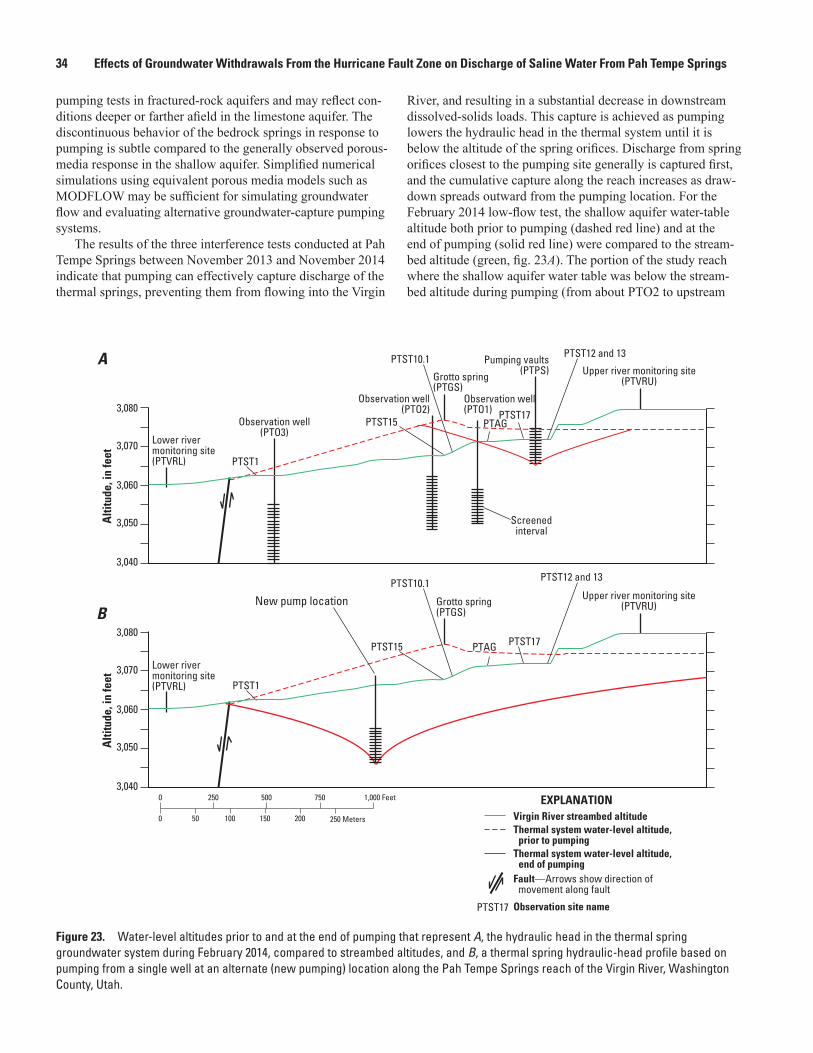
34 Effects of Groundwater Withdrawals From the Hurricane Fault Zone on Discharge of Saline Water From Pah Tempe Springs
pumping tests in fractured-rock aquifers and may reflect con-ditions deeper or farther afield in the limestone aquifer. The discontinuous behavior of the bedrock springs in response to pumping is subtle compared to the generally observed porous-media response in the shallow aquifer. Simplified numerical simulations using equivalent porous media models such as MODFLOW may be sufficient for simulating groundwater flow and evaluating alternative groundwater-capture pumping systems.
The results of the three interference tests conducted at Pah Tempe Springs between November 2013 and November 2014 indicate that pumping can effectively capture discharge of the thermal springs, preventing them from flowing into the Virgin
River, and resulting in a substantial decrease in downstream dissolved-solids loads. This capture is achieved as pumping lowers the hydraulic head in the thermal system until it is below the altitude of the spring orifices. Discharge from spring orifices closest to the pumping site generally is captured first, and the cumulative capture along the reach increases as draw-down spreads outward from the pumping location. For the February 2014 low-flow test, the shallow aquifer water-table altitude both prior to pumping (dashed red line) and at the end of pumping (solid red line) were compared to the stream-bed altitude (green, fig. 23A). The portion of the study reach where the shallow aquifer water table was below the stream-bed altitude during pumping (from about PTO2 to upstream
Figure 23. Water-level altitudes prior to and at the end of pumping that represent A, the hydraulic head in the thermal spring groundwater system during February 2014, compared to streambed altitudes, and B, a thermal spring hydraulic-head profile based on pumping from a single well at an alternate (new pumping) location along the Pah Tempe Springs reach of the Virgin River, Washington County, Utah.
EXPLANATIONVirgin River streambed altitudeThermal system water-level altitude,
prior to pumpingThermal system water-level altitude,
end of pumpingFault—Arrows show direction of
movement along fault
Observation site name
3,040
3,050
3,070
3,080
3,060
Alti
tude
, in
feet
Lower river monitoring site (PTVRL)
PTST15
PTST1
Observation well (PTO3)
Observation well(PTO2)
0 250 750500 1,000 Feet
250 Meters0 50 100 150 200
Grotto spring(PTGS)
PTST12 and 13
PTST17PTAG
PTST10.1
Screened interval
Observation well (PTO1)
Pumping vaults(PTPS) Upper river monitoring site
(PTVRU)
Lower river monitoring site (PTVRL)
PTST15
PTST1
Grotto spring(PTGS)
PTST12 and 13
PTST17PTAG
PTST10.1Upper river monitoring site
(PTVRU)
3,040
3,050
3,070
3,080
3,060
Alti
tude
, in
feet
New pump location
A
B
PTST17

Summary and Conclusions 35
of PTST12 and 13) coincides with the area where individual springs either ceased to flow or decreased in flow substan-tially. The length of the reach where the shallow aquifer water table during pumping dropped below the pre-pumping water table overlaps with the area where spring temperature changes indicated a reduction in flow (fig. 20). In order to capture all of the saline spring discharge, the thermal system hydraulic head must be lowered below the altitude of the lowest-altitude spring discharge point at the downstream end of the reach (for example, PTST1). Lowering the shallow aquifer water table from a single area of pumping in order to capture all of the saline discharge, however, would reverse the hydraulic gradient over a large portion of the streambed, resulting in the shallow aquifer water table being lower than river stage (fig. 23B). This scenario will induce stream loss from the Virgin River and unwanted capture of fresh river water by the pumps, as was briefly observed during the November 2014 test. The effectiveness of pumping to capture thermal spring discharge, therefore, is governed by both pumping location and rate, and the hydraulic-head difference between the Virgin River and the underlying aquifer. The observed drop in tem-perature and SpC of the pumped water during the November 2014 test (fig. 16) illustrates that capture of river water will occur when the hydraulic gradient between the aquifer and the river is reversed. Stream capture was not observed during the February 2014 test after pumping at nearly the same rate for a longer period, indicating that the increased discharge and resulting higher stage (or hydraulic head) in the river during the November 2014 high-flow test was the driver for stream capture.
Lining or grouting the streambed is one mechanism that has been used with varying degrees of success to prevent unwanted stream loss (Ackman and Jones, 1988; Ackman and Dilmore, 2002). It is possible that this could help reduce stream loss induced by pumping and subsequent unwanted capture of freshwater along the study reach. However, unman-aged drawdown in the shallow aquifer within the springs reach might still induce capture of fresh river water from an unknown distance upstream, requiring additional evaluation of groundwater levels and riverbed permeability upstream of the current study reach.
Additionally, even though discharge in the river below the springs reach is easily reduced by an amount equal to the pumping rate as shown in the latter two interference tests, efficient reduction of the dissolved-solids load appears to be dependent on minimizing the upstream discharge or stage in the river. This was illustrated in the November 2014 test, where the measured reduction in river discharge below the springs (at PTVRL) was essentially equal to the pumping rate but the reduction in dissolved-solids load at the same location was only equal to about 80 percent of the dissolved-solids load captured by the pumps (table 6).
A well field or pumping system designed to maximize capture of the thermal, saline springwater will need to pump at a rate equal to the desired capture. In order to minimize the capture of freshwater (either in the river or in shallow
groundwater) and maximize the efficiency of dissolved-solids load reduction, drawdown in the shallow aquifer underlying the Virgin River should approximate the altitude of the streambed in order to minimize the hydraulic gradient between the two without drastically reversing it. Such a system also will benefit by pumping that is managed to maximize capture of thermal water when the flow and (or) stage in the river upstream of the springs is at a minimum.
Summary and ConclusionsThree interference tests were conducted between Novem-
ber 2013 and November 2014, where shallow groundwater was pumped from fractured carbonate rocks in the Hurricane Fault zone at the mouth of Timpoweap Canyon, to test the feasibility of capturing saline discharge of Pah Tempe Springs before it flows into the Virgin River. These tests monitored and evaluated (1) changes in spring and pumping discharge, chemistry, and water temperature over time and under differ-ent pumping and streamflow conditions; and (2) changes in streamflow and streamwater chemistry downstream of where the springs discharge directly to the river. The results of this study provide critical information for assessing dissolved-solids load reduction to the Virgin and Colorado Rivers by capturing and treating discharge of saline water from Pah Tempe Springs. The results were incorporated into a con-ceptual hydrologic model of the thermal saline springs and groundwater system that is broadly consistent with what has been described previously and add local-scale detail relevant to the design of any potential pump-and-capture system. The findings of this study indicate
1. Pumping thermal groundwater from the shallow aquifer adjacent to the springs is an effective means of capturing Pah Tempe Springs discharge before it flows into the Virgin River. Discharge measurements made in the river downstream of the springs reach show that streamflow was reduced by approximately the amount pumped during the February and November 2014 tests. These measurements also demonstrated that ground-water and surface water are hydraulically connected and that 100-percent capture of thermal discharge is possible.
2. The near-surface bedrock aquifer is highly transmis-sive and behaves as an unconfined continuous porous-media aquifer. Water levels in observation wells and discharge from spring sources with the highest hydrau-lic head respond quickly and are substantially affected by pumping, regardless of which side of the river they are located. Core retrieved from drilling observation wells confirms that the near-surface alluvium (mostly cemented with carbonate precipitate) is very porous, and fracture mapping indicates that shallow limestone bedrock is highly fractured in the footwall damage zone of the Hurricane Fault.
36 Effects of Groundwater Withdrawals From the Hurricane Fault Zone on Discharge of Saline Water From Pah Tempe Springs
3. The focus of upwelling thermal water that supplies Pah Tempe Springs is approximately 550 to 925 feet upstream from the easternmost segment of the Hurri-cane Fault where spring temperatures are the warmest. This area coincides with the highest static hydraulic heads in the thermal system as well as the areas of highest bedrock fracture density, observed spring discharge, and CO2 gas outflow. Upon nearing the sur-face, upwelling thermal water discharges from shallow fractured bedrock and through carbonate-cemented alluvium at the surface to discharge at numerous distinct and diffuse points along an approximately 1,500-foot reach of the river.
4. Pumping from the aquifer adjacent to the springs can induce unwanted capture of freshwater originating either from the Virgin River or from the shallow aqui-fer upstream of the springs reach. Under the pumping and streamflow conditions during the February 2014 test, the dissolved-solids load removed by pumping was approximately equal to the dissolved-solids load reduction in the river below the springs reach. How-ever, a decrease in temperature (2.5 oC) and specific conductance (1,000 µS/cm) of the pumped water was observed during the high-flow test in November 2014, indicating the capture of cooler, fresh river water. Freshwater was captured only during the high-flow test, despite similar pumping rates during the February and November 2014 tests, presumably due to elevated river stage. As pumping proceeds and drawdown extends outward from the pumping location, hydraulic head is lowered near points of spring discharge, the gradient driving the spring discharge is reduced, and the rate of discharge is decreased. If the hydraulic head is lowered below the altitude of a particular spring orifice, the hydraulic gradient between the thermal system and the river is reversed, and river water begins to enter the aquifer where it can be captured by the pumping. This occurs sooner for a given pumping rate when the river stage is higher.
5. Pumping to capture Pah Tempe Springs discharge is a three-dimensional process. The observed effects of thermal water withdrawal from the Hurricane Fault damage zone spread in a radial (or quasi-radial) pattern away from the pumping location with time. Tempera-ture changes, monitored to indicate pumping-related reductions in spring discharge, show that spring sources are affected upstream and downstream of pumping as well as on both sides of the river. Further-more, the hydraulic connection between the river and the underlying aquifer has been demonstrated to exist as far as 2 miles upstream of the study reach.
In order to capture thermal saline water and prevent it from flowing into the river, the hydraulic head in the shallow aquifer must be lowered to approximate the altitude of the riverbed at all points of spring discharge. Ideally, the hydraulic
head in the aquifer would not be drawn down below the river stage, and drawdown would not extend far from the targeted area of capture either upstream or downstream of the springs reach or laterally away from the stream channel. Design of a well field or pumping system with these goals in mind will help maximize saline water capture efficiency while avoiding the capture and unnecessary treatment of freshwater from the Virgin River.
Acknowledgments The author thanks Tim McKinney, John Solder, Christine
Rumsey, Chris Shope, and Becky Hollingshaus, Utah Water Science Center, for their assistance in sampling the springs and river and tireless monitoring of streamflow during the three interference tests. Thanks are also due to Pat Lambert and Steve Gerner, Utah Water Science Center, for sharing their knowledge and insight regarding the study area during the planning stages of the tests. This project was funded by the Bureau of Reclamation Colorado River Basin Salinity Pro-gram with significant additional contributions, both technical and financial, by the Washington County Water Conservancy District.
References Cited
Ackman, T., and Dilmore, R., 2002, Identifying and sealing water loss zones in the Anthracite Coal Region: 2002 West Virginia Surface Mine Drainage Task Force Symposium Papers, 15 p., accessed July 13, 2016, at https://wvmdtask-force.files.wordpress.com/2016/01/02-ackman.pdf.
Ackman, T.E., and Jones, J.R., 1988, A method to reduce sur-face water infiltration into underground mines: Proceedings of the National Symposium on Surface Mining, Hydrology, Sedimentology and Reclamation, December 5–9, 1988, Reno, NV, p. 79–84.
Biek, R.F., 2003, Geologic map of the Hurricane 7.5’ quad-rangle, Washington County, Utah: Utah Geological Survey Map 187, scale 1:24,000.
Biek, R.F., Rowley, P.D., Hacker, D.B., Hayden, J.M., Willis, G.C., Hintze, L.F., Anderson, R.E., and Brown, K.D., 2010 (digital release), Geologic map of the St. George and east part of the Clover Mountains 30’ x 60’ quadrangle, Wash-ington and Iron Counties, Utah: Utah Geological Survey Map 242DM, 2 pls., 101 p., GIS data, scale 1:100,000.
Bureau of Reclamation, 1966, Special engineering geology report on the Virgin City damsite and reservoir: Bureau of Reclamation, three maps, drawings, and drill hole logs.

References Cited 37
Bureau of Reclamation, 1973, LaVerkin Springs Unit, Utah—Feasibility report: Colorado River Water Quality Improve-ment Program, Point Source Division, July 1973, appendix A, Water supply, 99 p.; appendix B, Designs and estimates, 54 p.; appendix C, Geology, 54 p.
Bureau of Reclamation, 1981, La Verkin Springs Unit, Utah—Concluding report: Colorado River Water Quality Improve-ment Program, Point Source Division, 28 p.
Bureau of Reclamation, 1984a, La Verkin Springs Unit (Utah)—Composite of reports, 1983–84 La Verkin Springs study: Bureau of Reclamation, Lower Colorado Region, variously paged.
Bureau of Reclamation, 1984b, La Verkin Springs Unit (Utah)—Preliminary findings report: Bureau of Reclama-tion, Lower Colorado Region, 12 p.
Cooper, H.H., and Jacob, C.E., 1946, A generalized graphical method for evaluating formation constants and summarizing well field history: American Geophysical Union Transac-tions, v. 27, p. 526–534.
Coplen, T.B., 1994, Reporting of stable hydrogen, carbon, and oxygen isotopic abundances: Pure and Applied Chemistry, v. 66, p. 273–276.
Craig, Harmon, 1961a, Isotopic variations in meteoric waters: Science, v. 133, p. 1702–1703.
Craig, Harmon, 1961b, Standard for reporting concentrations of deuterium and oxygen-18 in natural waters: Science, v. 133, p. 1833–1834.
Dansgaard, W., 1964, Stable isotopes in precipitation: Tellus, v. 16, p. 436–468.
Dutson, S.J., 2005, Effects of Hurricane Fault architecture on groundwater flow in the Timpoweap Canyon of southwest-ern Utah: M.S. Thesis, Brigham Young University, Utah, 57 p.
Everitt, Ben, and Einert, Martin, 1994, The 1985 slug test of Pah Tempe Springs, Washington County, Utah, in Blackett, R.E., and Moore, J.N., eds., Cenozoic geology and geo-thermal systems of southwestern Utah: Utah Geological Association Publication 23, p. 189–194.
Gerner, S.J., 2008, Dissolved-solids sources and transport in the Virgin River Basin in Utah, Arizona, and Nevada with emphasis on dissolved solids discharged from Pah Tempe Springs: U.S. Geological Survey Administrative Report, 26 p.
Gerner, S.J., and Thiros, S.A., eds., 2014, Hydrosalinity studies of the Virgin River, Dixie Hot Springs, and Little-field Springs, Utah, Arizona, and Nevada: U.S. Geological Survey Scientific Investigations Report 2014–5093, 47 p., http://dx.doi.org/10.3133/sir20145093.
Halford, K.J., and Kuniansky, E.L., 2002, Documentation of spreadsheets for the analysis of aquifer-test and slug-test data: U.S. Geological Survey Open-File Report 02–197, 51 p.
Halford, K.J., Weight, W.D., and Schreiber, R.P., 2006, Interpretation of transmissivity estimates from single-well, pumping aquifer tests: Ground Water, v. 44, no. 3, p. 467–471.
Inkenbrandt, Paul, Thomas, Kevin, and Jordan, J.L., Regional groundwater flow and water quality in the Virgin River basin and surrounding areas, Utah and Arizona: Utah Geo-logical Survey Report of Investigation 272, 52 p.
Nelson, S.T., Mayo, A.L., Gilfillan, S., Dutson, S.J., Harris, R.A., Shipton, Z.K., and Tingey, D.G., 2009, Enhanced fracture permeability and accompanying fluid flow in the footwall of a normal fault—The Hurricane Fault at Pah Tempe Hot Springs, Washington County, Utah: Geological Society of America Bulletin, v. 121, p. 236–246.
Welch, A.H., and Preissler, A.M., 1986, Aqueous geochem-istry of the Bradys Hot Springs geothermal area, Churchill County, Nevada in Subitzky, S. ed., Selected papers in the hydrologic sciences: U.S. Geological Survey Water Supply Paper 2290, p. 17–36.
Wilde, F.D., and Radtke, D.B., 1998, Field measurements: U.S. Geological Survey Techniques of Water-Resources Investigations, book 9, chap. A6 [variously paged].

38 Effects of Groundwater Withdrawals From the Hurricane Fault Zone on Discharge of Saline Water From Pah Tempe Springs
Appendix 1. Data Tables
Table 1–1. Selected information for field sites monitored during interference tests at Pah Tempe Springs, Washington County, Utah. [Sites are listed in the order they are encountered in a downstream direction beginning at the top of the study reach. Latitude and Longitude are relative to the North American Datum of 1983. MP altitude is relative to the North American Vertical Datum of 1988. Abbreviations: USGS, U.S. Geological Survey; MP, measuring point; AMSL, above mean sea level; —, not applicable; ±, plus or minus; %, percent; T, temperature; °C, degrees Celsius; SpC, specific conductance; P, pressure; <, less than; μS/cm, microsiemens per centimeter]
Site name USGS site identifierLatitude (decimal degrees)
Longitude (decimal degrees)
MP altitude (feet AMSL) Data logger make and model Comments
PTVRU 371127113155901 37.189974 -113.267669 3,080.1 In-Situ TROLL 9000 1 and In-Situ Aqua TROLL 200 2
PTPS 371120113160401 37.188854 -113.267849 3,084.2 Onset HOBO U20 3 and Hydrolab MiniSonde 4a 4
PTST17 — 37.188523 -113.267837 3,071.9 Onset TidbiT 5
PTST16 — 37.188473 -113.268247 3,071.5 Onset TidbiT 5
PTST15 — 37.188567 -113.269000 3,067.8 Onset TidbiT 5
PTST14 — 37.188600 -113.269233 3,067.5 Onset TidbiT 5
PTST13 — 37.188902 -113.267660 3,071.9 Onset TidbiT 5
PTST12 — 37.188888 -113.267540 3,071.8 Onset TidbiT 5
PTST11 — 37.188562 -113.268150 3,072.5 Onset TidbiT 5
PTST10.1 — 37.188597 -113.268797 3,072.6 Onset TidbiT 5
PTST10 — 37.188417 -113.268889 3,070.5 Onset TidbiT 5
PTAG 371118113160601 37.188417 -113.268250 3,074.3 In-Situ Level TROLL 500 6 and Onset TidbiT 5
PTST9 — 37.188650 -113.269068 3,070.6 Onset TidbiT5
PTGS 371118113160901 37.188444 -113.269139 3,073.4 In-Situ Aqua TROLL 200 2 and Onset HOBO U20 3
PTST8 — 37.188618 -113.269346 3,067.8 Onset TidbiT 5
PTST7 — 37.188688 -113.269580 3,069.2 Onset TidbiT 5
PTST6 — 37.188784 -113.269445 3,067.2 Onset TidbiT 5
PTST5 — 37.188826 -113.269514 3,070.3 Onset TidbiT 5
PTST4 — 37.188944 -113.269972 3,066.4 Onset TidbiT 5
PTST3 — 37.189333 -113.271417 3,062.3 Onset TidbiT 5
PTST2 — 37.189420 -113.271323 3,062.2 Onset TidbiT 5
PTST1.1 — 37.189622 -113.271826 3,061.7 Onset TidbiT 5
PTST1 — 37.189668 -113.271842 3,062.4 Onset TidbiT 5
PTVRL 371122113162201 37.189928 -113.273159 3,062.8 In-Situ Aqua TROLL 200 2
PTO1 371119113160601 37.188694 -113.268444 3,089.6 In-Situ Level TROLL 500 6 and Onset HOBO U20 3
25-foot-deep well with 10-foot screen at bottom
PTO2 371120113160901 37.188833 -113.269139 3,089.0 In-Situ Level TROLL 500 6 and Onset HOBO U20 3
29.2-foot-deep well with 15-foot screen at bottom
PTO3 371122113161801 37.189556 -113.271528 3,077.4 In-Situ Level TROLL 500 6 and Onset HOBO U20 3
32-foot-deep well with 15-foot screen at bottom
1 In-Situ TROLL 9000® multi-parameter probe data logger accuracy: P, ±0.1 % of full scale; T, ±0.1 °C; SpC, ±0.5 % of reading for < 20,000 µS/cm. 2 In-Situ Aqua TROLL 200® data logger accuracy: P, ±0.05 % of full scale; T, ±0.1 °C; SpC, ±0.5 % of reading for < 80,000 µS/cm.3 Onset HOBO U20® water level data logger accuracy: P, ±0.05 % of full scale; T, ±0.44 °C over 0 °C to 50 °C. 4 Hydrolab MiniSonde 4a probe accuracy: T, ±0.1 °C; SpC, ±1.0 % of reading for < 100,000 μS/cm.5 Onset TidbiT® water temperature data logger accuracy: T, ±0.2 °C over 0 °C to 50 °C. 6 In-Situ Level TROLL 500® data logger accuracy: P, ±0.05 % of full scale; T, ±0.1 °C.

Appendix 2. Estimate of Aquifer Transmissivity Using a Distance-Drawdown Analysis on Data From the February 2014 Test 39
Appendix 2. Estimate of Aquifer Transmissivity Using a Distance-Drawdown Analysis on Data From the February 2014 Test
Drawdown data and pumping rate from the February 2014 test were used along with the radial distance from the pumping location for three observation wells, to calculate an estimate of aquifer transmissivity using a distance-drawdown analysis (Halford and Kuniansky, 2002). The analysis derives transmis-sivity (T) from the slope of a plot of drawdown versus log of the radial distance from a pumping well using the Cooper and Jacob (1946) straight-line method (fig. 2-1). Drawdown approaching stable values of 15 feet (ft), 2.76 ft, 0.66 ft, and
0.25 ft from sites PTPS, PT01, PT02, and PT03, respectively, were used for the analysis. Observed drawdowns were the result of pumping at a rate of 3,300 gal/min. The radial dis-tances from the pumping site to the drawdown sites were 3 ft, 230 ft, 475 ft, and 1,380 ft for PTPS, PT01, PT02, and PT03, respectively. The EXCEL workbook used to perform the analysis is included as “Pumping_DistanceDrawdown.xlsm” with the supplemental data available for download.
Figure 2-1. Screenshot of the “OUTPUT” worksheet from an EXCEL workbook used to perform the distance-drawdown analysis on data collected during the February 2014 interference test at Pah Tempe Springs, Washington County, Utah.
Dra
wdo
wn,
in fe
et
0
2
4
6
8
10
12
14
16
Distance, in feet10 100 1,000 10,0001
y = -2.307ln(x) + 16.775R² = 0.9677

40 Effects of Groundwater Withdrawals From the Hurricane Fault Zone on Discharge of Saline Water From Pah Tempe Springs
Appendix 3. Pumping Effects on Spring Capture and Dissolved-Solids Load During the November 2013 Test
During the November 2013 low-flow interference test, the difference in discharge and dissolved-solids load between PTVRU and PTVRL during the pre-pumping monitoring period indicated that the cumulative discharge of the springs was 10.7 ft3/s and that the springs were contributing a dissolved-solids load of 260 ton/d (table 3-1). When the dissolved-solids load of the springs is calculated using the difference in discharge between PTVRU and PTVRL multiplied by the TDS in the grotto springwater (selected to represent non-diluted thermal discharge), and assuming that all of the gain in the river along the springs reach is derived from a pure thermal source, the value is 274 ton/d. The 5-percent difference in calculated load values could represent uncertainty in the streamflow measurements, but it might also indicate that the cumulative gain in the Virgin River along the springs reach is diluted with a fraction of freshwater.
At the end of the 650 gal/min pumping period of the November 2013 test, the cumulative discharge of the springs and dissolved-solids load were reduced to 9.5 ft3/s and 242 ton/d, respectively, on the basis of the difference
in observations at PTVRU and PTVRL. This equates to a reduction in the river of 1.1 ft3/s and 19 ton/d for discharge and dissolved-solids load, respectively (table 3-1). Comparison to the discharge and dissolved-solids load derived from direct measurements of the pumping discharge (1.45 ft3/s and 36 ton/d) indicates that the capture efficiency ratio during this pumping period of the first interference test was only about 76 percent for spring discharge and 51 percent for dissolved solids (table 3-1). In other words, the reduction in discharge and dissolved-solids load in the river was substantially less than what was actually being removed from the thermal system by the pumping. This poor efficiency was likely the result of pumping from an unimproved sump (fig. 4A) with poor hydraulic connection to the river. Under these circumstances, it is possible that pumping resulted in a non-symmetric drawdown, inducing flow from the thermal system that would not otherwise have discharged to the river while failing to capture flow from the thermal system that was going to the river.
Table 3–1. Discharge, dissolved-solids concentration, and dissolved-solids load from surface- and groundwater sampling sites at pre-pumping and approximate steady-state conditions at the end of each pumping period during the November 2013 interference test at Pah Tempe Springs, Washington County, Utah. [Q, discharge; ft3/s, cubic feet per second; TDS, total dissolved-solids concentration; mg/L, milligrams per liter; ton/d, tons per day; gal/min, gallons per minute; —, not applicable]
November 2013 interference test using improved concrete-lined vault sumps for pumping withdrawals
Pre-pumping, November 2013 Q 1 (ft3/s) TDS 1 (mg/L) Load (ton/d)
River upstream (PTVRU) 2.04 433 2.38
River downstream (PTVRL) 12.7 7,670 263
Springs-1 (PTVRL-PTVRU) 10.7 — 260
Springs-2 (Load = (QPTVRL -QPTVRU) * TDSPTGS) 10.7 9,540 274
Steady state after pumping 650 gal/min (1.45 ft3/s) from 11/19/2013 17:20 to 11/20/2013 14:40 Q 1 (ft3/s) TDS 1 (mg/L) Load (ton/d)
River upstream (PTVRU) 2.07 433 2.42
River downstream (PTVRL) 11.6 7,800 244
Springs (PTVRL-PTVRU) 9.5 — 242
Pumping discharge (PTPS) 1.45 9,320 36
River reduction (PTVRLpre-pumping -PTVRL@2,330 gal/min steady state) 1.1 — 19
Capture efficiency ratio (Pumping discharge/River reduction) 0.76 — 0.51
Steady state after pumping 1,800 gal/min (4.01 ft3/s) from 11/20/2013 14:45 to 11/21/2013 19:00 Q 1 (ft3/s) TDS 1 (mg/L) Load (ton/d)
River upstream (PTVRU) 2.04 433 2.38
River downstream (PTVRL) 10.9 7,470 220
Springs (PTVRL-PTVRU) 8.9 — 217
Pumping discharge (PTPS) 4.01 9,320 101
River reduction (PTVRLpre-pumping -PTVRL@2,330 gal/min steady state) 1.8 — 43
Capture efficiency ratio (Pumping discharge/River reduction) 0.45 — 0.431 Q and TDS values that best represent the time period. They may be an average over time as in the case of upstream river flows designed to remain steady throughout a test or a
single measured value for a particular time as in the case of a TDS value at the downstream river site at the end of a stress period.

Appendix 3. Pumping Effects on Spring Capture and Dissolved-Solids Load During the November 2013 Test 41
By the end of the 1,800 gal/min pumping period of the November 2013 test, the cumulative discharge of the springs and dissolved-solids load were reduced to 8.9 ft3/s and 217 ton/d, respectively, equating to a reduction in discharge and dissolved-solids load in the river of 1.8 ft3/s and 43 ton/d (table 3-1). Comparison to the discharge and dissolved-solids load derived from direct measurements of the pumping (4.01 ft3/s and 101 ton/d) indicates that the capture efficiency during this pumping period was worse than for the previous pumping period at only 45 percent and 43 percent for discharge and dissolved-solids load capture, respectively. This test, the first of three, continually suffered from difficulties related to inefficient pumping capture from the unlined sump and uncontrollable changes in streamflow due to inclement weather. As a result, recovery data are not included for this test.

42 Effects of Groundwater Withdrawals From the Hurricane Fault Zone on Discharge of Saline Water From Pah Tempe Springs
For additional information, contact:
Director, Utah Water Science Center U.S. Geological Survey 2329 West Orton Circle Salt Lake City, UT 84119-2047 801 908-5000
http://ut.water.usgs.gov/


Gardner—Effects of G
roundwater W
ithdrawals From
the Hurricane Fault Zone on D
ischarge of Saline Water From
Pah Tempe Springs, W
ashington County, U
tah—Scientific Investigations Report 2018–5040
ISSN 2328-0328 (online)https://doi.org/10.3133/sir2018-5040