Embed Size (px)
Citation preview
Effects of increased
temperature and bird
migrations on zooplankton
communities in the high
Arctic.
Master thesis by Håvar Skaugrud
Section for Limnology and Marine Biology
Department of Biology
Faculty of Natural Sciences and Mathmatics
University of Oslo
Norway

2
Abstract
Over the past decades the Arctic has experienced an increase in annual mean temperature.
The increase of temperature is higher in the Arctic than it is at lower latitudes and
globally. The increase in temperature affects zooplankton communities of Svalbard in
several ways. The elongated growing period and less duration of ice cover of lakes and
ponds facilitates the colonization of invasive species to Svalbard. As the temperature
increase, as does the population of migrating birds, mainly Barnacle geese and Pink-
footed geese. This increases the likelihood of dispersal of invasive species as well as it
increases the nutrient input to the water bodies and causes euthrophication. Together,
these combinations are able to alter the entire ecosystem, changing water bodies that have
been considered oligothrophic into euthrophic. This together with increased chance of
dispersal of invasive species can alter the zooplankton communities’ considerable,
making species turnover possible. By comparing 66 locations from Cape Linné and Ny-
Ålesund with earlier studies, over the last century, it could be expected to find species
which never have been observed at Svalbard earlier.

3
Table of contents
1. Introduction p. 4
2. Materials and methods p. 10
3. Results p. 23
4. Discussion p. 31
5. Conclusion p. 34
6. Acknowledgements p. 35
7. References p. 36

4
1. Introduction
The Arctic has experienced a recent increase in mean temperature. This in addition
to less extension of sea ice during winter (Hanssen-Bauer 2003), glaciers rapidly
decreasing (figure 1) in net volume mass balance (Dyurgerov and Meier 2000), thawing
of permafrost (Shur & Jørgensen 2006), changes in precipitation patterns (Hanssen-Bauer
2007) are all indicators of a changing climate. Polar areas are more susceptible to
changes in climate than regions of lower latitudes, and while the global annual surface
temperature (figure 2) has increased with 0.6°C ±0.2 (Houghton et al. 2001), the surface
temperature in Svalbard has increased substantially in comparison (Isaksen & Sollied
2002).
Figure 1: Annually changes in glaciers net volume mass balance in glaciers of different
geographical origin. Top, left: changes in net volume mass balance for 4 glaciers of the Canadian
Arctic. Top, right: changes in net volume mass balance for 9 glaciers at the opposite side of the
Arctic, Svalbard and Scandinavia. Bottom, left: calculated estimates on how the net volume mass
balance appears on a global scale. Bottom, right: 8 glaciers from different geographic locations
are compared to their net volume mass of 1890 versus today (Dyurgerov and Meier 2000).

5
Figure 2: Temperature anomalies in the Northern Hemisphere relative to the 1961-1990 average
over the last millennia. The measured values are drawn in red, and reconstruction based on ice
cores, tree rings, corals and historical records is shown in blue. The black line is the 40 year
average and 2 standard errors are presented in the gray area (Houghton et al. 2001).
These areas are also where the largest effect of any changes in climate can be found and
where they usually are possible to observe early, again compared to areas of lower
latitudes. The Arctic is by definition north of 67°N and extends all the way to 90°N.
In the higher parts of the Arctic, there are mainly ocean, with the exceptions of
Greenland, Canada, USA, Russia and Svalbard. The North America and Russian
mainland, as well as Greenland extends north to about 83°N and two Russian islands and
Svalbard extends to 81°N (Figure 3)..
Spitsbergen is for several reasons an important area for biological studies, and
already the pioneering studies on aquatic food webs on Bear Island and Svalbard by

6
Charles Elton. In the late 1920, Elton (1930) made clear that the simple food-webs of the
high Arctic made them particularly suitable for understanding biological processes. Later
on, and especially during the last decades, it has also become highly relevant to use arctic
ecosystems as early warnings on climate change effects.
Figure 3: Left (a): Svalbard archipelago and its surrounding oceans. Right (b): The Arctic with
the North Pole in centre and Svalbard to the South (http://encarta.msn.com/).
Over the last decades there are several trends indicating that changes in climate are
occurring at present and far more quickly than predicted just decades ago (Houghton et
al. 2001). The effects of a changing climate in the Arctic may have greater consequences
than earlier believed (Houghton et al. 2001). One already documented biological
consequence is an increase in the breeding population of migratory birds, primarily
barnacle geese (Branta leucopsis) and pink-footed geese (Anser brachyrhynchus) over
the last decades (Van Geest et al. 2007). Migratory birds are recognized as a major
contributor in dispersing zooplankton species and together with the increasing
populations of birds, the possibility for other than earlier observed species might be found
(Green et al. 2002; Figureola & Green 2002). The increased breeding populations of bird
also contribute to an increased input of nutrients to the water bodies. Due to this, a
number of ponds that was previously oligothrohic have become heavily euthrophied. This
may create a system shift from benthic to pelagic species (Smol et al. 2005). There are
two aspects related to the increased geese population, the fist being that the probability

7
for recolonization of invasive species to Svalbard increases substantially. The other is
that the increased inputs of nutrients will lead to an increase in primary production. It also
makes a contribution to the enrichment of the catchments that release organic matter and
nutrients into the water bodies. Several outcomes are of course possible. Existing species
could experience more stress due to the increased euthrophication, while others may
expand.
A problem which may arise is the fact that the Arctic is exposed to high UV-B radiation
partly because the troposphere is about two thirds of what it is around equator (Botkin &
Keller 2003), thinner ozone layer in the stratosphere (Botkin & Keller 2003) and twenty-
four hours daylight during summer. In addition, at high latitudes the formation of polar
stratospheric clouds occurs when the temperature in the stratosphere drops below
approximately -80°C. These clouds cause extremely fast depletion of the ozone layer due
to heterogeneous chlorine chemistry (Botkin & Keller 2003) Alpine zooplankton species
in lakes of southern latitudes i.e. at Finse, Norway, 60°N, 1220 metres above sea level
does not inhabit the same property of melanin production to cope with UV-B radiation as
arctic species (Hessen 1996). This could make it difficult for alpine species of southern
latitudes to establish populations in Svalbard, even though dispersal limitations not are a
problem.
Over the recent decades there is reason to suspect that the increased temperature,
reduction in permafrost and several other climate related factors has led to a shift in
zooplankton communities in the Arctic, as climate driven warming are able to alternate
zooplankton communities (Wagner & Benndorf 2007). By investigating zooplankton
communities and water chemistry, as well as changes in sediments, it is plausible to find
effect in some of these aspects. In summer 2008, a survey was done at two different
locations of West-Spitsbergen; Cape Linne (Nordenskioldkysten / Isfjord Radio) and Ny-
Ålesund.
Zooplankton is good indicators of changes in the environment due to their sensitivity of
changes in abiotic variables. The change in global mean temperature over the last

8
millennia is shown in figure 2. Due to their lack of complexity, Arctic zooplankton
communities may yield an early warning about larger impacts on a global scale.
First of all the zooplankton community are fairly well known, due to several studies over
nearly a century. The aquatic food webs are simple in arctic ponds and lakes, with
zooplankton as the highest trophic level in ponds, while they will be predated by fish in
lakes. Svalbard is also isolated, making it an island in the ecological sense. This implies
that invasion of other species should be limited and happen over a longer period of time.
The arctic island of Spitsbergen, Svalbard is characterized as arctic tundra with only
few larger lakes which are sufficiently deep to avoid freezing to the bottom during
winter. These lakes generally contain Arctic charr. In addition to the few larger lakes
there are numerous small ponds, characterized as water bodies that freeze entirely to the
bottom every winter. As these ponds freeze entirely, fish are excluded, making these
ponds predator-free systems for zooplankton. Predation on Daphnia pulex by the tadpole
shrimp (Lepidurus arcticus) is discussed by Christoffersen (2001), but do not seem to
have any significant impact on the zooplankton community structure in high Arctic
ponds. Some ponds are situated very close to the ocean and have somewhat elevated
salinity due to sea spray and saltwater intrusion.
In absence of fish, most of these systems are completely dominated by large-bodied
species of asexual Daphnia and a number of recent studies has also focussed on the
taxonomical difficulties and the number of clones of the Dapnia spp. Earlier studies
(Olofsson 1918; Summerhayes & Elton 1923; Thomassen 1958, 1961) refers to Daphnia
spp. observed in Svalbard as D. pulex. Amrén (1964a,b) describe D. tenebrosa (Sars) in
his publications. Halvorsen & Gullestad (1976) describes D. middendorffiana (Fisher).
They also compare the two species D. middendorffiana and D. pulex by Brook (1957)
and conclude that D. middendorffiana is the most likely species, due to the fact that it
extends further North than D. pulex in North America. More recent studies has revealed
that there exist D. middendorffiana and both an Arctic and an European subspecies of D.
pulicaria (Van Geest et al. 2007). This finding gives reason to suspect that the taxonomy
of Arctic Daphnia spp. is far more complex than earlier understandings.
9
The Arctic zooplankton populations at Svalbard have been subject for studies for many
years resulting in reasonable good knowledge about Arctic zooplankton, and thus serving
as a good background data for surveys of recent changes in specific compositions that
could be accredited direct and indirect effects of climate change and increased bird
migration.
This study’s aim is to qualitatively describe zooplankton species of Svalbard. By
sampling several ponds which has been subject to earlier studies of similar kind, it would
be possible to detect changes in the zooplankton communities surveyed. Primarily I was
searching for species new to the area that could have become established due to increased
growth season or higher temperature. Also the increased population of geese could serve
as a vector for immigration of new species (Green et al. 2002).
10
2. Material and methods
Locations for sampling were primarily chosen with background data from the work of
Amrén (1964) and Gullestad & Halvorsen (1976). The decision of Cape Linné as an area
of investigation was done due to good background data and the conveniences of Isfjord
Radio providing lodging and that the amount of ponds subject to sampling is numerous.
The area of Ny-Ålesund was chosen because of the proximity to the sampling site of
Gullestad & Halvorsen (1976) and that several of the water bodies surrounding Ny-
Ålesund has been subject to prior sampling recently. The convenience of Kings Bay
providing lodging was also a considerable factor.
In addition this also makes a gradient, since the two areas are separated by mountains and
glaciers (see figure 9) which act as a barrier for the dispersal of zooplankton (Hessen et
al. 2006).
2.1 Sampling
Zooplankton was sampled during the summer of 2008 at two different areas on West-
Spitsbergen. The Cape Linné area (Figure 4) was sampled for zooplankton at 48 locations
over 4 days (see table 5 for sampling dates, positions and more). The sampling of 18
locations in the Ny-Ålesund area (figure 7) was done by four days of sampling (see table
6 for details). Due to different topography and less accessible water bodies it was not
possible to collect samples from as many locations as in the Cape Linné area. However,
the amount of samples and positions of locations is satisfactory.
2.2 Study sites and locations
Out of the 66 locations examined, 48 were located at the Cape Linné and the remaining
18 in the surrounding area of Ny-Ålesund. The examined locations in the area of Cape
Linné was located just above or below 78°N, while the samples from Ny-Ålesund were
all located just below 79°N. The two areas are separated with mountains and glaciers and
there should be expected to find different composition of the zooplankton communities in
the two areas.

11
2.2.1 Cape Linné
The Cape Linné area consists of a large costal plain that extends for several kilometres
south along the Nordenskiold Coast. This coastal plain is very exposed to harsh weather
due to the proximity of the Arctic Ocean (Figure 4) and the elevation is marginal and
there is no sheltering topography. To the west, across the Linné River, is the Varderborg
plain. On these plains there are numerous ponds, usually not deeper than 2 meters. The
ponds also have great transparency making benthic production important. Another effect
is that due to the lack of planktivore fish the zooplankton species of cladoceran and
copepoda are able to grow large (> 0.5 mm) and because of the shallowness and
transparency of the water they evolve melanin pigmentations to cope with ultra violet
radiation (Hessen 2007). This makes especially Daphnia spp. possible to observe just by
looking at the ponds and at dense populations it looks like many small black particles in
the water. There were collected samples from 48 locations in this area, where one was
from Lake Linné and the reminder from shallow ponds.
Locations 1 to 48 are located in this area and are described below (see table 1 for details).
The samplings in this area were done over four days.
Loc. 1
Lake Linné (Figure 5). Sampling were done littoral from shore at the West-side of the
lake in the Northern part (Figure 4a). As the elevation was measured to 2 m.a.s.l., this
area is sheltered from influence by the sea in both distance and surrounding topography.
This is also the only location in this survey which is influenced by a population of fish,
Arctic Charr (Salvelinus alpinus) [Amrén 1964a], which is recognized as a major
intrinsic factor to control zooplankton communities (Hessen et al. 2006). Arctic lakes
differ substantially from ponds as they do not freeze to the bottom during winter periods
and have an additional trophic level in the food web.

12
Table 1: Locations in the Cape Linné area.
Loc. #: Description:
1 Lake Linné. East side, northern part of the lake.
2 Moraine and polygonal ground, little or no vegetation
3 As loc. 2. Loc. 3 is a ”twin” pond to loc. 2 with a distance of 75 metres.
4 Moraine around pond. Snow at the eastside.
5 Moss cover around pond. Feathers, goose excrement, gas bubbles.
6 Mosses and grass cover at the west side, gravel and snow at the eastside.
7 Gravel around entire pond, about 20m x 60m, some mosses at outlet
8 Flat terrain, gravel/moraine/polygonal ground. Some mosses at the water edge.
9 Flat terrain, gravel/moraine/polygonal ground, some grasses and mosses.
10 Mosses/grasses at the west side, gravel and snow at the east.
11 Same as for loc. 10. 1m higher, much better water transparency than loc. 10.
12 25m x 50m, gravel and mosses, possible 2 drainages.
13 10m x 30m, vegetation, large numbers of macro zooplankton.
14 50m x 25m, mosses at the west side, gravel/moraine at the east side.
15 50m x 15m, mosses at the west side, gravel/moraine at the east side. About one fifth of the area covered with ice
16 Hollow, about 35 metres in diameter.
17 Pond surrounded with mosses. One third of the area covered with ice.
18 45m x 15m, boggy ground, close to the ocean.
19 Large pond, covered with mosses along the west side.
20 Neighbouring pond to loc. 19. Drains to the sea. Extensive moss cover.
21 Very shallow pond, dominated with rocks and gravel.
22 North of Tunsjøen, much gravel, some mosses.
23 Tunsjøen, north/west side, heavy wind and waves
24 Fyrdammen. Shallow, about 20 cm. Lots of loose sediments.
25 Fyrsjøen, lots of algae, smell of hydrogen sulphide.
26 Close to the ocean, large amount of zooplankton.
27 Even closer to the ocean and even larger amount of zooplankton.
28 Further from the ocean than loc. 26 and 27. Bogs and mosses.
29 South side of the drinking water supply to Isfjord Radio. Some bogs.
30 Southeast of Tunsjøen, gravel and rocks, some sediments.
31 Snow to the east, little vegetation and sediments.
32 Uneven ground, sand and gravel, varying.
33 Bog and mosses. Evidence of numerous birds present.
34 Some mosses and bogs, very shallow, rocky bottom.
35 L-shaped pond, substantial drainage to the ocean. Possible short retention time.
36 Very shallow, lots of rocks and grasses. Firm sediments.
37 Relatively large drainage. Short retention time?
38 Small and shallow, drains to loc. 37, possible short retention time.
39 Larger than loc.36-38, some mosses and bird excrement.
40 Surrounded with grasses and rocks, drains to another pond, possible short retention time.
41 Small shallow pond between Tunsjøen and Fyrsjøen, some grasses and mosses.
42 Pond with drain, mosses and birds. At the shoreline.
43 Small pond, 25m x 25m, extremely much bird facieses, very loose sediments
44 45m x 45m, sandy bottom, at shoreline, lots of zooplankton
45 Large pond, just a few metres from loc. 44. Bogs and mosses.
46 Large pond, close to the ocean, mosses, sandy and rocky bottom, south east of Båtodden
47 Rocks/gravel to the north, mosses/bogs to the south, drains to the sea, relatively small pond.
48 Surrounded by mosses, lots of birds, close to the shoreline.

13
Locations 2-17
Situated East of the Linné River in an area called the Varderborg Plain (Figure 4a). This
area is fairly elevated from sea level, all in the range between 15 and 50 metres above sea
level.
Locations 2, 3, 7 and 8 is Borgdammane with an elevation ranging between 30 and 40
metres a.s.l. and are probably more influenced by bird populations inhabiting the
mountain to the east than from the sea.
Figure 4: Right (a): Areas of locations (1 to 39 and 41) examined above 78°N at Cape Linné.
Left (b): Area of locations 42 to 47 is in the middle of the map. Location 48 is encircled in the
North of the map.

14
Locations 18 to 29 and 41
Situated West of Linné River (see figure 4a) where the elevation of the investigated
ponds varied between 0 and 15 m.a.s.l. These ponds will be more exposed to influences
by the sea, due to closer proximity to the sea, as well as lower elevation and less
topographical sheltering. At the day the samples from these locations were taken, there
was significant wind and this might affected the results to some extend. Location 41 was
sampled two days later than the rest of locations, due to logistical reasons.
Figure 5: Lake Linné viewed from the north. The outlet is located to the left in the
photo.
Locations 30 to 40
South of Isfjord Radio, along Strokflya (see Figure 4a and table 1 for details).

15
Locations 42 to 48
These locations are located south of 78°N and were all located at or close to the
shoreline, hence, subject to substantially influences from the sea. In addition this ponds
also had evidence of a large number of birds adjacent, resulting in fertilized soil around
several of the ponds (Figure 4b and table 1)
Figure 6: Left (a): Location 43. Droppings from Geese and other birds dominated the locations
surroundings. Right (b): Location 46 seen from North/East clearly shows the shoreline in front
and vegetation at the opposite side of the pond.
2.2.2 Ny-Ålesund
Sampling in the surrounding areas of Ny-Ålesund (Figure 7) can mainly be divided into
two different areas. The first is in close range to the village, refered to as the Ny-Ålesund
area, while the second is located approximately 10 to 12 kilometres North-West of Ny-
Ålesund, refered to as the Kvadehuken area. The Ny-Ålesund area is partly sheltered by
Kongsfjorden and the surrounding mountains. The second is located at the south-side in
the outer part of Kongsfjorden, which is considerable more exposed to wind and sea
water influence than the Ny-Ålesund area. Each area is described below.

16
Figure 7: The Ny-Ålesund sampling area. Each sample location is denoted with its location
number. In addition “*1” and “*2” is noted in red, and represents Solvatnet (*1) which is a bird
sanctuary, and sampling was prohibited. Strandvatnet (*2) where sampling was planned, were
completely drained, and do not exist anymore, at least not as a permanent water body as
expressed on the map.
Locations investigated in the Ny-Ålesund area are located just around Ny-Ålesund and
10-20 kilometres north of the city. This area does not have as many ponds as for the Cape
Linné area, partly because the coastal plain is smaller and partly because of several
mountains in the surrounding the area. The investigation were carried out only on the
south side of Kongsfjorden, however, some localities across the fjord and in some other
protected areas would be of interest, nevertheless, these were not investigated due to
logistical reasons.
There were collected 18 samples in the area around Ny-Ålesund, which all were from
shallow ponds.
17
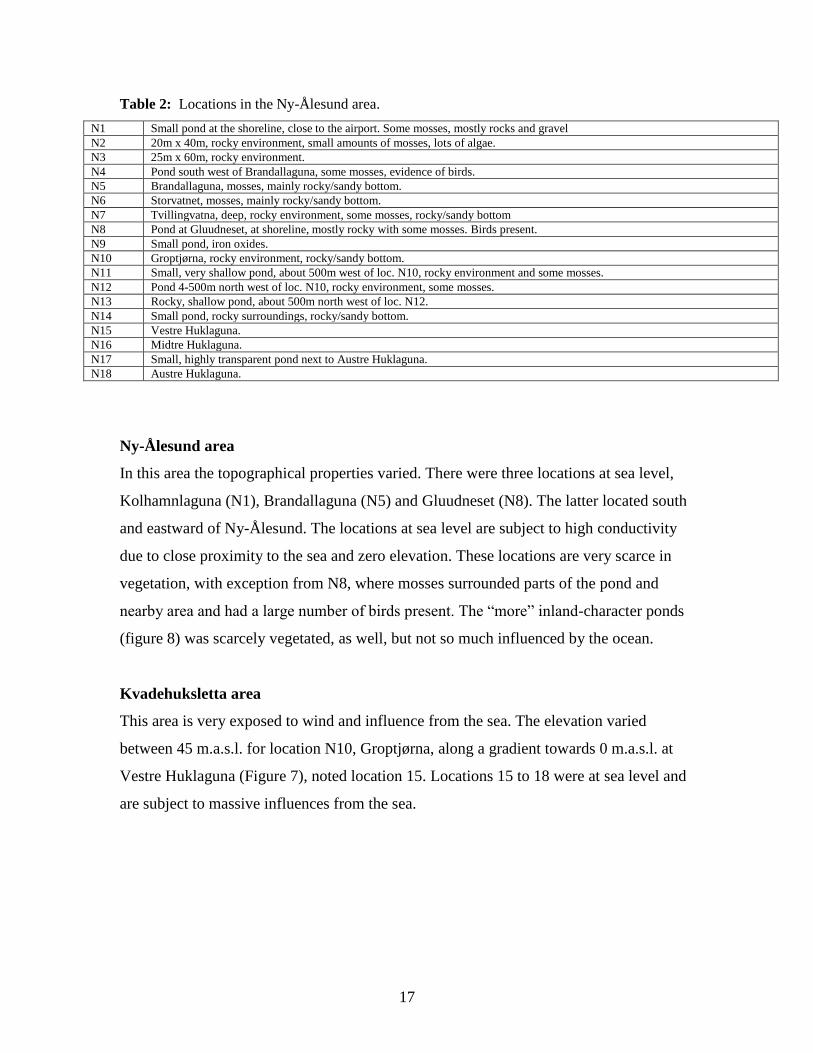
Table 2: Locations in the Ny-Ålesund area.
N1 Small pond at the shoreline, close to the airport. Some mosses, mostly rocks and gravel
N2 20m x 40m, rocky environment, small amounts of mosses, lots of algae.
N3 25m x 60m, rocky environment.
N4 Pond south west of Brandallaguna, some mosses, evidence of birds.
N5 Brandallaguna, mosses, mainly rocky/sandy bottom.
N6 Storvatnet, mosses, mainly rocky/sandy bottom.
N7 Tvillingvatna, deep, rocky environment, some mosses, rocky/sandy bottom
N8 Pond at Gluudneset, at shoreline, mostly rocky with some mosses. Birds present.
N9 Small pond, iron oxides.
N10 Groptjørna, rocky environment, rocky/sandy bottom.
N11 Small, very shallow pond, about 500m west of loc. N10, rocky environment and some mosses.
N12 Pond 4-500m north west of loc. N10, rocky environment, some mosses.
N13 Rocky, shallow pond, about 500m north west of loc. N12.
N14 Small pond, rocky surroundings, rocky/sandy bottom.
N15 Vestre Huklaguna.
N16 Midtre Huklaguna.
N17 Small, highly transparent pond next to Austre Huklaguna.
N18 Austre Huklaguna.
Ny-Ålesund area
In this area the topographical properties varied. There were three locations at sea level,
Kolhamnlaguna (N1), Brandallaguna (N5) and Gluudneset (N8). The latter located south
and eastward of Ny-Ålesund. The locations at sea level are subject to high conductivity
due to close proximity to the sea and zero elevation. These locations are very scarce in
vegetation, with exception from N8, where mosses surrounded parts of the pond and
nearby area and had a large number of birds present. The “more” inland-character ponds
(figure 8) was scarcely vegetated, as well, but not so much influenced by the ocean.
Kvadehuksletta area
This area is very exposed to wind and influence from the sea. The elevation varied
between 45 m.a.s.l. for location N10, Groptjørna, along a gradient towards 0 m.a.s.l. at
Vestre Huklaguna (Figure 7), noted location 15. Locations 15 to 18 were at sea level and
are subject to massive influences from the sea.

18
Figure 8: Sampling data at location N3. Vegetation is scarce.
2.3 Zooplankton
For each location there were done 4 successive hawls, with a few exceptions where the
ponds were too shallow, partly covered with snow or ice or just very small, i.e. >10 m2,
with 90µm mesh. Two were pelagic and two littoral and/or benthic, this to be sure to get
as many different species as possible.

19
Figure 9: Western part of Spitsbergen with the two areas of sampling. The Cape Linné
area is situated at 78°N and the Ny-Ålesund area is situated at 79°N.
2.4 Total phosphorous
Samples were kept in 20 mL scintillation vials, which had been rinsed by 1% (~0.12
mol/L) hydrochloric acid solution for more than 24 hours to avoid contamination.
Unfortunately, due to several more sampled locations at Cape Linné than anticipated,
additional vials had to be brought to Svalbard before departing to Ny-Ålesund. Of
logistical reasons there were not possible to acid wash vials used sampling in Ny-
Ålesund. However, risk of contamination was considered marginal in this scenario and
the sampling in Ny-Ålesund continued in the same manner as for Cape Linné. The water
samples for total phosphorous (as a proxy of impact from geese feces) were collected in
accordance to (Van Geest et al. 2007), approximately 10 centimetres below the water

20
surface. To avoid contamination as well as possible biological alternation of the samples
every sample was filter thru a 90 µm mesh to avoid macro zooplankton. For several
localities at both Cape Linné and Ny-Ålesund it already exist known background data on
nutrient levels from several recent limnological surveys. Samples collected at Cape Linné
were kept at UNIS during the fieldwork in Ny-Ålesund.
2.5 Preservation
For qualitative analysis of zooplankton Lugol-solution (potassium iodide and iodine-
solution) were used (KI (aq) + I2 (aq)). Preservation of Daphnia spp. for DNA analysis was
made with ethanol (C2H5OH). The purpose of DNA analysis of Daphnia spp. is that there
has recently been discovered that there exists both European as well as Arctic subspecies
of D.pulicaria at Svalbard (Van Geest et al. 2007), and analysis of DNA with known
primers may reveal new species, subspecies or hybrids. During transport from UNIS,
Longyearbyen to the University of Oslo, the ethanol used for preserving the samples was
diluted to 70%-solution (ethanol/water), and added as close to 100% ethanol when
arriving at the laboratory in Oslo.
2.6 Laboraratory analysis
All laboratory analysis was done at the University of Oslo after returning from Svalbard.
2.6.1 Determination of species
Species of both cladoceran and copepoda were determined under a dissenting
microscope, according to Enckell (1998) and the NINA database. Bjørn Walseng (NINA)
was also consulted to confirm different findings of species.
2.6.2 Total phosphorous
Samples from 62 locations were analyzed for relative content of total phosphorous. Total
phosphorous (TP) was measured spectrophotometrically by Berit Kaasa at the
Department of Biology, University of Oslo.

21
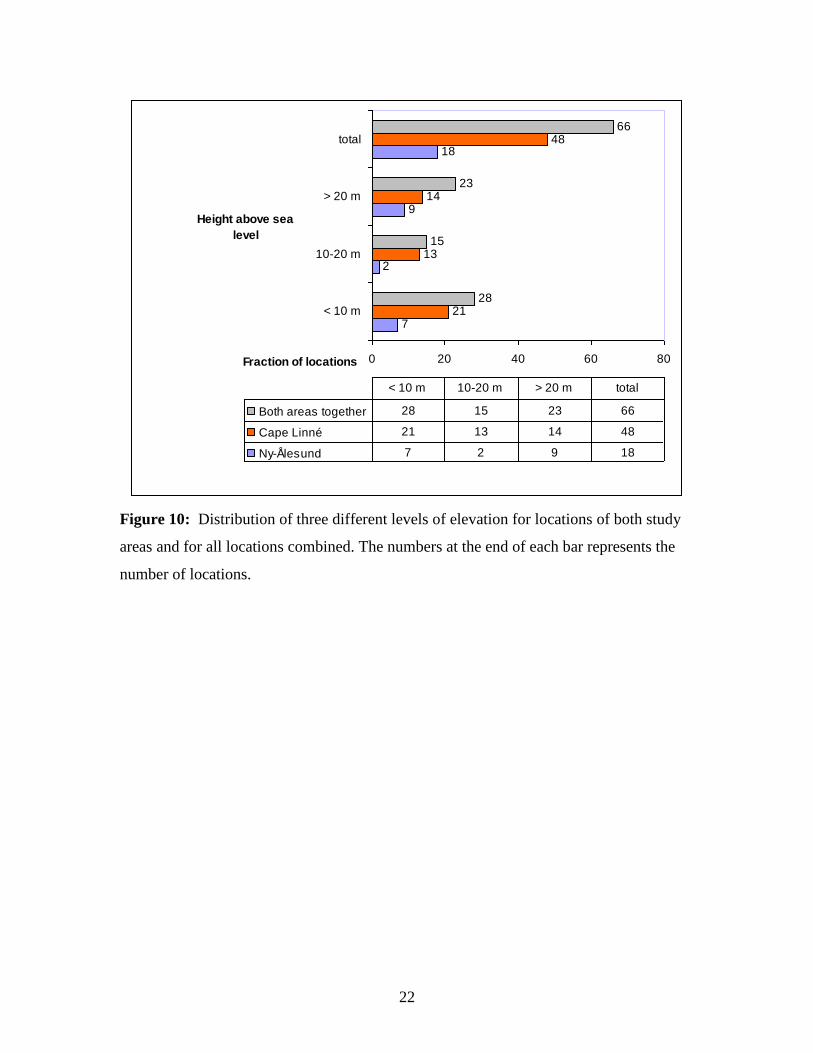
2.7 Elevation
For all 66 locations (Figure 10), 28 were situated less than 10 metres above sea level.
This indicates a strong influence from seawater in these ponds. Except from Lake Linné
(Figure 7), which is shielded from the sea by a distance > 1 kilometre and topographically
barriers. Several of the ponds with an elevation measured less than 10 m.a.s.l., may not
be considered as lagoon-type since they are shielded from the sea by rocky cliffs and
considerable distance from the shore. Altogether 13 ponds, 6 in the Cape Linné area and
7 in the Ny-Ålesund area, measured elevation to be at sea surface level (figure 10). This
is notable because nearly 20 per cent of all water bodies surveyed and almost 40 per cent
of the locations in the Ny-Ålesund area have an elevation equal to 0 metres above sea
level. There were 15 ponds with elevations between 10 and 20 m.a.s.l., where only two
were located in the Ny-Ålesund area and the reminder at the Cape Linné area. These
ponds are probably not affected as much by seawater influence as those with elevation
less than 10 metres above sea surface. 50 percent of the ponds investigated in Ny-
Ålesund were located above 20 metres above the sea surface, as well as 14 ponds in the
Cape Linné area, which constitutes 29.2 per cent relative to the Cape Linné area and 21.2
per cent of all locations. These ponds are even more sheltered from seawater influence
and more influenced by organic material, mainly from bird excrements.
22
7
2
9
18
21
13
14
48
28
15
23
66
0 20 40 60 80
< 10 m
10-20 m
> 20 m
total
Height above sea
level
Fraction of locations
Both areas together 28 15 23 66
Cape Linné 21 13 14 48
Ny-Ålesund 7 2 9 18
< 10 m 10-20 m > 20 m total
Figure 10: Distribution of three different levels of elevation for locations of both study
areas and for all locations combined. The numbers at the end of each bar represents the
number of locations.

23
3 Results
Out of 66 locations, whereas one is considered a lake, there were dense populations of
large zooplankton, with few exceptions, in all ponds. The species composition and
density of zooplankton varied with distance to the sea and the influence of this, as well as
other factors like nutrient input and retention time.
3.1 Zooplankton
Cladocera and copepods seem to be present in almost every water body, with a few
exceptions. For most ponds, however, large cladoceran i.e. Daphnia spp. seemed to
dominate. Smaller cladoceran i.e. Macrotroix hirsuticornis, Chydorus spaericus and A.
harpae are not that numerous, especially in ponds with dense populations, but may be
substantial in ponds with lesser dense populations. For the Eutythemora raboti in the Ny-
Ålesund area, it seemingly occurs in water bodies with close proximity to the sea. At the
Cape Linné area they seem to appear almost everywhere. Due to sub sampling of several
locations of the Cape Linné area, some species might be missing.
3.1.1 Cape Linné
Five species of cladocerans were detected in the Cape Linné area. Out of the 48 locations,
two of the locations are missing data, making the real number of locations 46. Daphnia
pulicaria was found in 36 of these, while D. tenebrosa was detected at 26. Macrotrix
hirsuticornis was found at 12 locations, Chydorus spaericus at 9 locations and Acroperus
harpae was detected at 3 locations (see table 3). Three species of copepods were detected
at the same locations. Eurythonema raboti was found at 19, while Diacyclops
crassicaudis or Cyclops abyssorum was found at 7 of the 46 locations (see table 3). In
addition different development stages of undetermined species of copepods were detected
in 5 locations.

24
Table 3: The occurrence of zooplankton for each location at Cape Linné. Cyclops abyssorum is
not differenced from Diacyclops crassicaudis and both species may be described as Diacyclops
crasscaudis. *) Copepodite or nauplii, not determined to species.
Location Daphina
tenebrosa
Daphnia
pulicaria
Macrothrix
hirsuticornis
Chydorus
sphaericus
Acroperus
harpae
Eutythemora
raboti
Diacyclops
crassicaudis
1 *
2 - - - - - - -
3 - - - - - - -
4 X X X
5 X X X
6 X X X X
7 X
8 X X *
9 X X
10 X *
11
12 X X X
13** X X *
14 X X X
15 X *
16 X *
17 X
18 X X X
19 X X
20 X X X
21 X X X X
22 X X X X X X
23 X X X X
24 X X X
25** *
26 X X X
27 X X X
28 X X X X
29 X X *
30
31 X X X X
32 X X X X X X
33 X X *
34 X X X X *
35 X
36 - - - - - - -
37 - - - - - - -
38 X
39 X X X X
40
41 X X *
42 X X X
43 X X X X
44 X X X
45 X X X
46 X X X
47 X X X
48 X X X X

25
3.1.2 Ny-Ålesund
There were also detected 5 different species of cladocerans in the Ny-Ålesund area. Of
the 18 locations D. tenebrosa and D. pulicaria was found at 11. M. hirsuticornis was
detected at 4 locations, C. spaericus was found at 5 and A. harpae at 2 (table 4).
Three species of copepods was also detected. E. raboti was found at 7 locations, while D.
crassicaudis or C. abyssorum appeared at 3 locations (table 4). In addition development
stages of undetermined species of copepods were detected in one additional location.
Table 4: The occurrence of zooplankton for each location in Ny-Ålesund. Cyclops
abyssorum is not differenced from Diacyclops crassicaudis and both species may be
described as Diacyclops crasscaudis. *) Copepodite or nauplii, not determined to species.
Location Daphina
tenebrosa.
Daphnia
pulicaria.
Macrothrix
hirsuticornis
Chydorus
sphaericus
Acroperus
harpae
Eutythemora
raboti
Diacyclops
crassicaudis
N1 X X X
N2 X X
N3 X X X X*
N4 X X X
N5 X X X
N6 X X * *
N7 X X
N8 X* X*
N9
N10 X X X X X*
N11 X X
N12 X X X X
N13 X
N14 X X X
N15 X X X
N16 X X
N17 X
N18 X
3.1.3 Species in both areas
The same species were found in both areas, although the composition may differ in
several ways. D. tenebrosa (also described as D. middendorfiana and D. pulex) and D.
pulicaria are the largest of the cladocerans in the two areas investigated. M. hirsuticornis,
C. spaericus and A. harpae is the three smaller species. Hence, 5 different species of
cladocerans were detected during the survey. E. raboti was the copepod detected at most
locations, in addition to D. crassicaudis and C. abyssorum.

26
Altogether, there were detected 5 species of cladocerans and 3 species of copepods
during the entire survey.
3.1.4 Unexpected findings
The finding of A. harpae was not expected. Whether or not this species is new to
Svalbard is not absolute certain. Summerhayes & Elton (1923) described the species,
however, neither Amrén (1964b) nor Gullestad & Halvorsen (1976) detected the species,
and Gullestad & Halvorsen (1976) concluded that the species probably did not exist at
Svalbard. Another observation made at Cape Linné was that Daphnia spp. seems to be
patchy distributed even in small ponds. This observation was made at location 41, where
dense amounts of zooplankton occurred during sampling, while two days later only a few
individuals were collected per hawl.
It may be considered unexpected to find M. hirsuticornis and C. spaericus, as well. These
species are described by Gulllestad & Halvorsen (1976) and Jørgensen & Eie (1993), but
not mentioned by Amrén (1964a;b).
3.1.5 Cape Linné versus Ny-Ålesund
The correlation between the number of species found at a location and the measured
content of phosphorous is higher for the Ny-Ålesund area than for Cape Linné (figure 11
and 12). There seem to be no correlation between the number of species and elevation
(figure 11 and 12) for either areas.

27
Elevation - Ny-Ålesund
R2 = 0,0568
0
10
20
30
40
50
60
0 1 2 3 4 5
Number of species
Ele
vati
on
Figure 11: The number of species found at each location related to elevation in the Ny-Ålesund
area.
Elevation - Cape Linné
0
10
20
30
40
50
60
0 1 2 3 4 5 6
Number of species
Ele
vati
on
Figure 12: The number of species found at each location related to elevation in the Cape Linné
area.
3.2 Total phosphorous
The relative content of total phosphorous (TP) was measured for 18 locations in Ny-
Ålesund area (table 6) and 44 locations in the Cape Linné area (table 5).
28
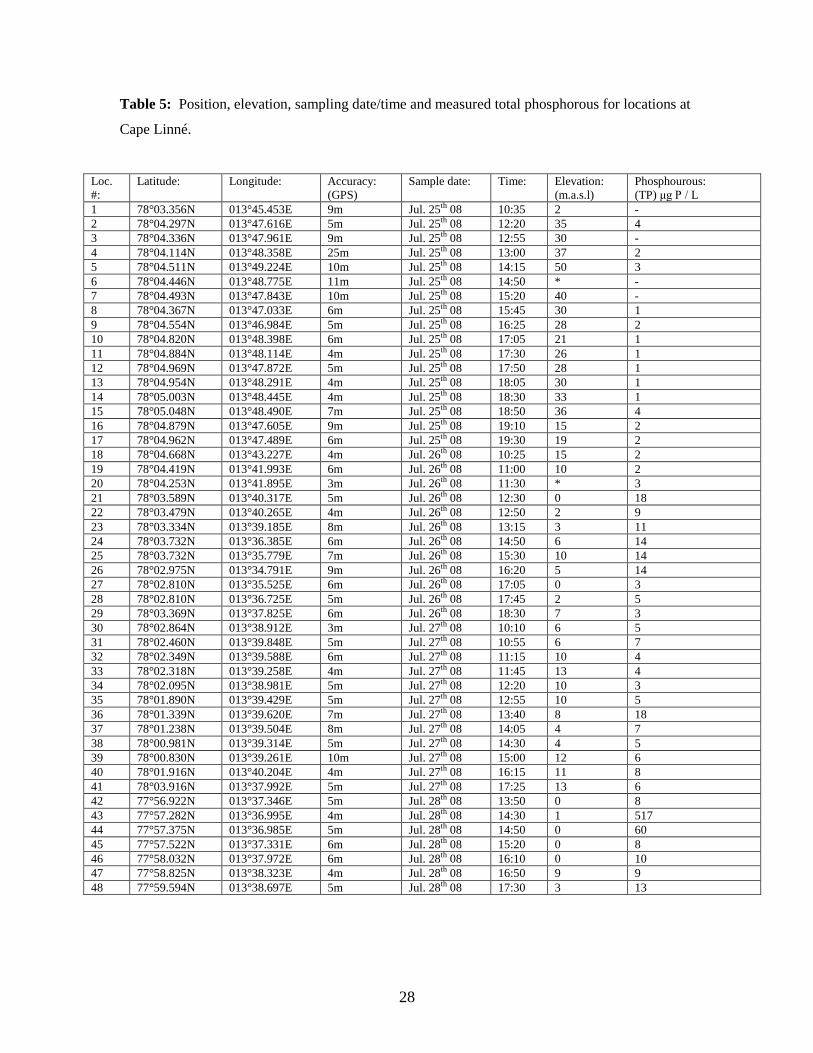
Table 5: Position, elevation, sampling date/time and measured total phosphorous for locations at
Cape Linné.
Loc.
#:
Latitude: Longitude: Accuracy:
(GPS)
Sample date: Time: Elevation:
(m.a.s.l)
Phosphourous:
(TP) μg P / L
1 78°03.356N 013°45.453E 9m Jul. 25th 08 10:35 2 -
2 78°04.297N 013°47.616E 5m Jul. 25th 08 12:20 35 4
3 78°04.336N 013°47.961E 9m Jul. 25th 08 12:55 30 -
4 78°04.114N 013°48.358E 25m Jul. 25th 08 13:00 37 2
5 78°04.511N 013°49.224E 10m Jul. 25th 08 14:15 50 3
6 78°04.446N 013°48.775E 11m Jul. 25th 08 14:50 * -
7 78°04.493N 013°47.843E 10m Jul. 25th 08 15:20 40 -
8 78°04.367N 013°47.033E 6m Jul. 25th 08 15:45 30 1
9 78°04.554N 013°46.984E 5m Jul. 25th 08 16:25 28 2
10 78°04.820N 013°48.398E 6m Jul. 25th 08 17:05 21 1
11 78°04.884N 013°48.114E 4m Jul. 25th 08 17:30 26 1
12 78°04.969N 013°47.872E 5m Jul. 25th 08 17:50 28 1
13 78°04.954N 013°48.291E 4m Jul. 25th 08 18:05 30 1
14 78°05.003N 013°48.445E 4m Jul. 25th 08 18:30 33 1
15 78°05.048N 013°48.490E 7m Jul. 25th 08 18:50 36 4
16 78°04.879N 013°47.605E 9m Jul. 25th 08 19:10 15 2
17 78°04.962N 013°47.489E 6m Jul. 25th 08 19:30 19 2
18 78°04.668N 013°43.227E 4m Jul. 26th 08 10:25 15 2
19 78°04.419N 013°41.993E 6m Jul. 26th 08 11:00 10 2
20 78°04.253N 013°41.895E 3m Jul. 26th 08 11:30 * 3
21 78°03.589N 013°40.317E 5m Jul. 26th 08 12:30 0 18
22 78°03.479N 013°40.265E 4m Jul. 26th 08 12:50 2 9
23 78°03.334N 013°39.185E 8m Jul. 26th 08 13:15 3 11
24 78°03.732N 013°36.385E 6m Jul. 26th 08 14:50 6 14
25 78°03.732N 013°35.779E 7m Jul. 26th 08 15:30 10 14
26 78°02.975N 013°34.791E 9m Jul. 26th 08 16:20 5 14
27 78°02.810N 013°35.525E 6m Jul. 26th 08 17:05 0 3
28 78°02.810N 013°36.725E 5m Jul. 26th 08 17:45 2 5
29 78°03.369N 013°37.825E 6m Jul. 26th 08 18:30 7 3
30 78°02.864N 013°38.912E 3m Jul. 27th 08 10:10 6 5
31 78°02.460N 013°39.848E 5m Jul. 27th 08 10:55 6 7
32 78°02.349N 013°39.588E 6m Jul. 27th 08 11:15 10 4
33 78°02.318N 013°39.258E 4m Jul. 27th 08 11:45 13 4
34 78°02.095N 013°38.981E 5m Jul. 27th 08 12:20 10 3
35 78°01.890N 013°39.429E 5m Jul. 27th 08 12:55 10 5
36 78°01.339N 013°39.620E 7m Jul. 27th 08 13:40 8 18
37 78°01.238N 013°39.504E 8m Jul. 27th 08 14:05 4 7
38 78°00.981N 013°39.314E 5m Jul. 27th 08 14:30 4 5
39 78°00.830N 013°39.261E 10m Jul. 27th 08 15:00 12 6
40 78°01.916N 013°40.204E 4m Jul. 27th 08 16:15 11 8
41 78°03.916N 013°37.992E 5m Jul. 27th 08 17:25 13 6
42 77°56.922N 013°37.346E 5m Jul. 28th 08 13:50 0 8
43 77°57.282N 013°36.995E 4m Jul. 28th 08 14:30 1 517
44 77°57.375N 013°36.985E 5m Jul. 28th 08 14:50 0 60
45 77°57.522N 013°37.331E 6m Jul. 28th 08 15:20 0 8
46 77°58.032N 013°37.972E 6m Jul. 28th 08 16:10 0 10
47 77°58.825N 013°38.323E 4m Jul. 28th 08 16:50 9 9
48 77°59.594N 013°38.697E 5m Jul. 28th 08 17:30 3 13

29
Table 6: Position, elevation, sampling date/time and measured total phosphorous for locations in
Ny-Ålesund.
N1 78°55.971N 011°51.556E 6m Aug. 1st 08 14:35 0 9
N2 78°56.083N 011°49.015E 5m Aug. 1st 08 15:40 35 7
N3 78°56.157N 011°47.893E 10m Aug. 2nd 08 12:50 51 8
N4 78°56.490N 011°49.149E 4m Aug. 2nd 08 13:30 21 8
N5 78°56.691N 011°51.141E 7m Aug. 2nd 08 14:00 0 6
N6 78°55.422N 011°52.512E 4m Aug. 2nd 08 15:25 18 8
N7 78°55.041N 011°52.068E 4m Aug. 2nd 08 16:10 29 6
N8 78°54.824N 012°03.507E 7m Aug. 3rd 08 13:30 0 8
N9 78°55.056N 011°55.661E 6m Aug. 3rd 08 14:50 36 6
N10 78°55.111N 011°29.071E 4m Aug. 5th 08 11:40 45 17
N11 78°57.105N 011°27.543E 6m Aug. 5th 08 12:05 40 9
N12 78°57.248N 011°28.042E 11m Aug. 5th 08 12:25 40 9
N13 78°57.459N 011°27.153E 19m Aug. 5th 08 12:45 39 8
N14 78°57.647N 011°25.948E 7m Aug. 5th 08 13:10 15 9
N15 78°58.006N 011°24.732E 5m Aug. 5th 08 13:40 0 7
N16 78°58.084N 011°25.443E 5m Aug. 5th 08 14:05 0 9
N17 78°58.254N 011°27.691E 4m Aug. 5th 08 14:30 0 10
N18 78°58.285N 011°28.011E 6m Aug. 5th 08 14:50 0 9
The average for all 62 locations was 15.8 μg P/L. There are, however, two locations with
extremely high TP values, location 43 (Figure 6a) and 44. If these two are excluded, the
average drops to 6.7 μg P/L. The range over all locations spends from 1 to 517 μg P/L.
For the Ny-Ålesund area, the minimum value is 6 μg P/L, the maximum at 17 μg P/L and
the average is 8.5 μg P/L, with a standard deviation of 2.4. The Cape Linné area has an
average value of 18.8 μg P/L, minimum of 1 μg P/L and a maximum at 517 μg P/L
(Figure 6a), with a standard deviation of 77.4.
For the Ny-Ålesund area, there is a week correlation between the phosphorous content
and the number of species at a given location (figure 14), R2= 0,54. For Cape Linné there
seem to be no correlation between these to variables (figure 13), R2=0,07.

30
Tot. P - Cape Linné
0
2
4
6
8
0 20 40 60 80 100
Tot. P
Nu
mb
er
of
sp
ecie
s
Figure 13: The number of species related to the mean content of phosphorous for
locations at Cape Linné.
Tot. P - Ny-Ålesund
0
2
4
6
0 5 10 15 20
Tot. P
Nu
mb
er
of
sp
ecie
s
Figure 14: The number of species related to the mean content of phosphorous for
locations in Ny-Ålesund.

31
4 Discussion
Gullestad & Halvorsen (1976) surveyed a large number of localities especially just north
of Ny-Ålesund. They questioned some of the earlier findings in regards to zooplankton
on Svalbard. Olofsson (1918) and Summerhayes & Elton (1923) describe Daphnia spp.
as D.pulex, while Amrén (1964) describes Daphnia spp. as D.tenebrosa =
D.middendorfiana. Gullestad & Halvorsen (1976) compare the two species D.pulex and
D.middendorfiana with the two distinct forms they found and based on the distinct brown
coloration together with the far northern range of D.middendorfiana in Northern
America. They conclude that Daphnia spp. of Svalbard is D.middendorfiana and that the
smaller form probably is a new generation of the same species. Amrén (1964a,b)
conducted a massive survey in the Cape Linné area and describes Daphnia spp. as D.
tenebrosa. Jørgensen & Eie (1993) describe Daphnia spp. as D.pulex in an investigation
on the Mossel-peninsula. More recent surveys, i.e. Van Geest et al. (2007), reveal that
there not only exist two species of Daphnia at Svalbard, but in addition to D.tenebrosa,
as described by Amrén (1964b), there is both a polar and a European subspecies of D.
pulicaria. During the summer of 1977, altogether 20 locations at the Mossel peninsula
located at the north side of Spitsbergen were surveyed by Jørgensen and Eie (1993). Out
of the 20 locations, there were 9 lakes, 8 ponds and 3 rivers/streams. They discovered
three species not observed at Svalbard earlier; Limnocalanus macrurus, Bosmina
longirostris and Sida crystalline. In addition they also found D. middendorffiana,
Chydorus spaericus, Macrotrix hirsuticornis, Alona guttata, Cyclops abyssorum and
Diacyclops spp.
The increase in population of migratory birds affects other areas than the Arctic. Since a
larger population needs a larger amount of resources, the area of over wintering gets
affected as well the breeding area. For geese using Vårsolbukta as a pre-breeding area,
there are several advantages of using an Arctic area for this purpose. First, the nesting
date is usually varying with snowmelt and by being closer to the breeding area the birds
will receive signals concerning snowmelt. Secondly, there is 24 hours daylight at
Vårsolbukta, making it possible to forage more than it will on lower latitudes (Hubner

32
2006). As these birds forage on mosses, they also contribute to increased fertilization and
higher productivity, for terrestrial systems as well as aquatic.
In accordance to Green et al. (2002) and Figureola & Green (2002) it would be expected
to find more species at Cape Linné, than in Ny-Ålesund. The reason for this is that the
chance of dispersal is higher in an area of more water bodies, than with fewer ponds per
area. The fact that coastal plain around and south of Cape Linné have a very dense
population of ponds compared to Ny-Ålesund should suggest that dispersal of new
species are more likely to occurs at Cape Linné, than the Ny-Ålesund area.
Considering the relative content of total P, it seems like a fraction of the ponds at Cape
Linné is undergoing eutrophication, while Ny-Ålesund is less affected. While Ny-
Ålesund has a standard deviation of 2.4 in total P, Cape Linné has a standard deviation of
77.4, yet admittedly mainly due to two extremely enriched localities that were heavily
affected by geese grazing and droppings. There were also a number of more modestly
affected localities in this area. If larger parts of the Nordenskiold Coast become a pre-
breeding area for geese, as Vårsolbukta in the south is (Hubner 2006), it will increase the
probability both for bird-induced dispersal of zooplankton species as well as community
shifts due to eutrophication.
The ponds around Ny-Ålesund were less enriched in P and also had more even
zooplankton community compositions. The copepod E. raboti was detected in ponds near
the shoreline and not in ponds located distant from the sea at higher elevation. This is
consistent to Olofsson (1918), that the copepod needs longer development time and are
able to live in conditions with up to 50% seawater. That the more elevated ponds in
further distance from the sea should have a shorter growth period and longer ice cover
seems plausible. However, this is not entirely consistent with the location N3, which is
not in near proximity to sea and has an elevation approximately 50 m.a.s.l. Location N8
is the pond located at Gluudneset, which entirely consisted of copepods, E. raboti, and
different development stages of undetermined species. No cladocerans was detected here,
however, this could be an effect of seasonal variation or sampling strategy. About

33
location N9, this was a small pond heavily influenced by iron oxides, and contained no
zooplankton. This was more or less expected as the pond seemed to be used as a waste
area for old machinery.
Not all species inhabiting a water body is necessary sampled by a single sample and that
cumulative sampling may neither gives a “true” measure, since visiting species may be
sampled (cf. Hessen et al. 2007). However, the relatively low biodiversity of Svalbard
makes it plausible that most species are sampled by a single sample method. However,
the seasonal change in the zooplankton communities may be of a more important factor.
As shown by Amrén (1964b) the entire zooplankton community in a pond could be
inhabited only by copepods at one time, while it earlier in the same season only consisted
of Daphnia spp. Also, the patchy distribution of zooplankton, as observed at Cape Linné,
may influence the number of species collected in a sample. In ponds of fairly size, for
instance Tunsjøen and Fyrsjøen at Cape Linné and Brandallaguna and the lagoons of
Kvadehuken, wind conditions may also have influenced the sampling method.
Subsampling of several locations from the Cape Linné area may have given an inaccurate
result, as species may have been left out.

34
5 Conclusion
Over the last decades there has been climate induced changes in the zooplankton
communities at Svalbard. These changes are apparent at Cape Linné, where the
distribution of zooplankton has changed substantially since early 1960’s (Amrén 1964b).
For Ny-Ålesund the changes are not as apparent as for Cape Linné, mainly since because
of the lack of earlier comparable surveys. The increase in the population of migratory
birds as well as the recent increase in temperature seems likely to be an effect of these
changes. However, since the composition of zooplankton communities changes during
the season, some species may not show in this sampling method. To be sure to have
sampled all existing species, samples has to be made over an entire season. More surveys
are also needed to investigate further what is happening with eutrophication as well as the
warming of the climate and the effects from birds.
35
6 Acknowledgements
I would like to thank several persons who have played different parts during my
fieldwork and other aspects of writing my thesis.
First of all I want to thank my supervisor Dag Olav Hessen for making my project
possible and always being helpful, even in cases of very short notice.
I would also like to thank the following persons:
Espen Bang Donali for assisting me in field during fieldwork in the Cape Linné area, and
for the use of his laboratory at the University of Oslo.
Øyvind Skaugrud, my father, for assisting me during the fieldwork carried out in Ny-
Ålesund. Thank you for taking a week off, just walking around with me in the Arctic
tundra.
Trine Marianne Holm for sharing her experiences and network at UNIS and Cape Linné.
Berit Kaasa for analyzing the content of total phosphorous in my samples.
Synne M. Sidenius for learning methods of sampling for zooplankton.
Bjørn Walseng, NINA, for determination of zooplankton species.
All staff at Isfjord Radio at Cape Linné and Kings Bay in Ny-Ålesund, for use of
telephone rental of weapons and being generally helpful in all aspects.
The Svalbard Science Forum for grant of scholarship of 15.000,- NOK.

36
7 References
Albritton DL, Meira Filho LG, Cubasch U, Dai X, Ding Y, Griggs DJ, Hewitson B,
Isaksen I, Karl T, McFarland M, Meleshko VP, Mitchell JFB, Nyenzi BS,
Oppenheimer M, Penner JE, Pollonais S, Stocker T and Trenberth KE.
2001. Technical Summary of the Working Group I Report. In: Climate
Change 2001: The Scientific Basis. Contribution of Working Group I to the
Third Assessment Report of the Intergovernmental Panel on Climate
Change [Houghton JT, Ding Y, Griggs DJ, van der Linden PJ, Dai X,
Maskell K and Johnson CA (eds.)]. Cambridge University Press.
Cambridge, United Kingdom and New York, NY, USA, pp. 21-93.
Amrén H. 1964a. Ecological studies of zooplankton populations in some ponds of
Spitsbergen. Zool. Bidr.Uppsala. 36: 161-191
Amrén H. 1964b. Ecological and taxonomical studies on zooplankton from Spitsbergen.
Zool. Bidr. Uppsala. 36: 209-276
Botkin DB & Keller EA. (2003). Enivironmental Science: earth as a living planet. 4th
ed.
John Wiley & Sons, Inc., Hoboken, NJ, USA.
Christoffersen K. 2001. Predation on Daphnia pulex by Lepidurus arcticus.
Hydrobiologia. 442: 223-229
Dyurgerov MB and Meier MF. 2000. Twentieth century climate change: Evidence from
small glaciers. Proceedings of the National Academy of Sciences. 97 (4),
1406-1411.
Elton C. (1930). Animal Ecology and Evolution. Oxford, Clarendon Press.
Enckell PH. (1998). Kräftdjur. Knud Gr@phic, Odense, Denmark.

37
Figureola J & Green AJ. (2002). Dispersal of aquatic organisms by waterbirds: a review
of past research and priorities for future studies. Freshwater Biology. 47:
483-494
Green AJ, Figuerola J & Sánchez MI. (2002). Implications of waterbird ecology for the
dispersal of aquatic organisms. Acta Oecologica. 23(3): 177-189
Halvorsen G & Gullestad N. 1978. Freshwater Crustacea in some areas of Svalbard.
Arch. Hydrobiol. 78: 383-385
Hanssen-Bauer I. 2003. Klimavariasjoner i Arktis – Sammenhenger og gåter. Cicerone.
2003(1): 19-21.
Hessen DO. (1996). Competitive trade-off strategies in Arctic Daphinia linked to
melanism and UV-B stress. Polar Biology. 16: 573-579.
Hessen DO, Bakkestuen V & Walseng B. (2007). Energy input and zooplankton richness.
Ecography. 30: 749-758.
Hessen DO, Faafeng BA, Smith VH, Bakkestuen V og Walseng B. (2006). Extrinsic and
intrinsic controls of zooplankton diversity in lakes. Ecology, 87(2): 433-
443
Houghton JT, Ding Y, Griggs DJ, van der Linden PJ, Dai X, Maskell K and Johnson CA.
2001. Summary for Policymakers. In: Climate Change 2001: The Scientific
Basis. Contribution of Working Group I to the Third Assessment Report of
the Intergovernmental Panel on Climate Change [Houghton JT, Ding Y,
Griggs DJ, van der Linden PJ, Dai X, Maskell K and Johnson CA (eds.)].
Cambridge University Press. Cambridge, United Kingdom and New York,
NY, USA, pp. 2-20.
38
Hubner CE. (2006). The importance of pre-breeding areas for the arctic Barnacle Goose
Branta leucopsis. Ardea. 94(3): 701-713.
Jørgensen I & Eie JA. 1993. Utbredelsen av zooplankton, bunndyr og fisk i innsjøer og
dammer på mosselhalvøya, Svalbard. NINA Forskningsrapport 045: 1-25
Olofsson O. 1918. Studien über die süsswasserfauna Spitzbergens. Beitrag zur
Systematik, Biologie und Tiergeographie der Crustaceen und
Rotatorien. Zool.Bidr. Uppsala 6: 183-648
Prop J, Black JM, Shimmings P, Owen M. 1998. The spring range of barnacle geese
Branta leucopsis in relation to changes in landmanagement and
climate. Biol. Conserv. 86: 339–346
Smol JP, Wolfe AP, Briks HJB, Douglas MSV, Jones VJ, Korhola A, Pienitz R, Rühland
K, Sorvari S, Antoniades D, Brookis SJ, Fallu M-A, Hughes M,
Keatley BE, Laing TE, Michelutti N, Nazarova L, Nyman M, Paterson
AM, Perren B, Quinland R, Rautio M, Saulnier-Talbot E, Siitonen S,
Solovieva N & Weckstrøm J. 2005. Climate-driven regime shifts in the
biological communities of arctic lakes. Proceedings of the National
Academy of Sciences. 102(12): 4397-4402
Summerhayes VS & Elton CS. 1923. Contributions to the ecology of Spitsbergen and
Bear Island. J. Ecol. 11: 214-286
Thomasson K. 1958. Zur Planktonkunde Spitzbergens. Hydrobiologia 12: 226-236
Thomasson K. 1961. Zur Planktonkunde Spitzbergens. 2. Hydrobiologia 18: 192-198

39
Van Geest GJ, Hessen DO, Spierenburg P, Dahl-Hansen GAP, Christensen G, Faerovig
PJ, Brehm M, Loonen MJJE, Van Dunk E. 2007. Goose-mediated
nutrient enrichment and planktonic grazer control in arctic
freshwaterponds. Oecologia. 153(3): 653-662
Wagner A & Benndorf J. (2007). Climate-driven warming during spring destabilises a
Daphnia population: a mechanistic food web approach. Oecologica.
151: 351-364
http://encarta.msn.com/: Date: June 1st 2009;
http://encarta.msn.com/map_701516871/svalbard.html