Embed Size (px)
Citation preview
Effects of Inoculation Level During and After Fermentation

Student Team
Meredith Bell, Sarah Harper, Joanne Oh, Diego Roig and Luke Bohanan

Fermentation Analysis
Diego Roig

Goal of Study
• To compare the effect of different levels of inoculation of active dry commercial yeast preparations on fermentation and sensory characteristics of wine
• Used Chardonnay juice and Premiere cuvee
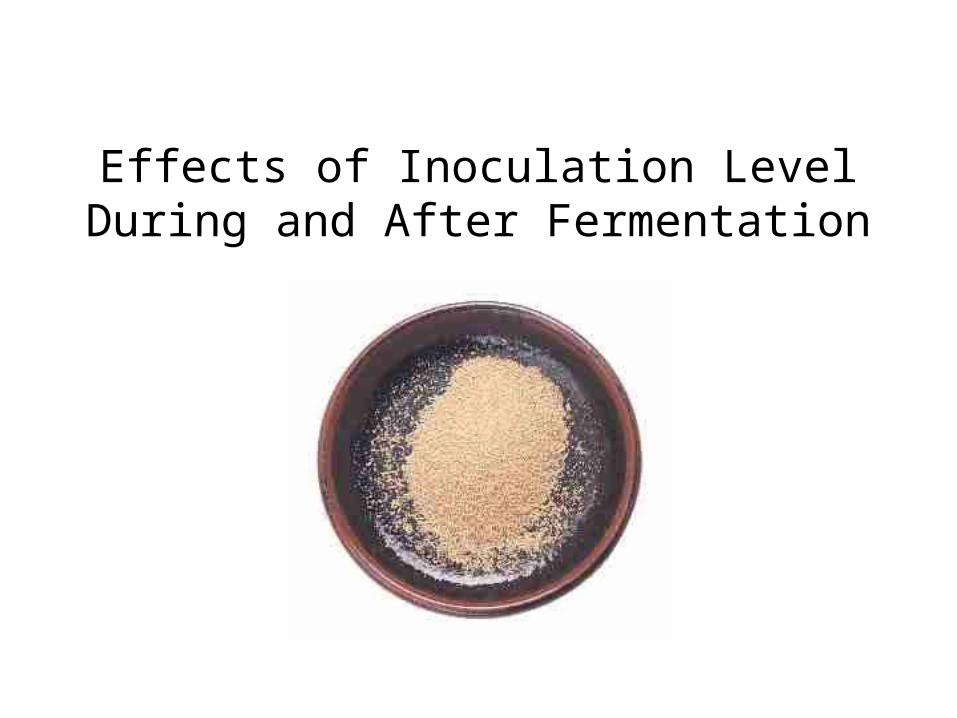
2010 UC Davis Chardonnay• Crushed and Pressed 9/2/10• Healdsberg crusher destemmer • Bucher Vaslin Press• Juice held in cold storage
news.ucdavis.edu

2010 UC Davis Chardonnay• Split into six, 10 gal drums• Inoculated 10/8/10• Premier cuvee• 6 inoculation levels
skolnik.com

Inoculation Levels
Lot 1 2 3 4 5 6
Yeast (g) 0g 0.008 0.25 8.0g 80.0g 140g
Cells/ml 0 103 104.5 106 107 1.8x10⁷
Chemistry of Juice:Brix: 25.25; pH3.66; TA 4.98 (g/L)NOPA: 56; Ammonia:132; YAN: 188
Fermentation
• Cold fermentation cellar• Brix and Temp taken twice daily• When Dry, moved to cold storage

-5
0
5
10
15
20
25
30
°Bri
x
Hours after inoculation
Fermentation of 2010 Chardonnay
Sample 1 Temperature
Sample 1 °Brix
Sample 2 Temperature
Sample 2 °Brix
Sample 3 Temperature
Sample 3 °Brix
Sample 4 Temperature
Sample 4 °Brix
Sample 5 Temperature
Sample 5 °Brix
Sample 6 Temperature
Sample 6 °Brix
C
30
25
15
10
5
0
20

Rate of FermentationInoculation Level
• Inoculation size directly effects the rate of fermentation
• Larger initial biomass • Less time/energy spent on achieving
maximum cell density (2 x 10⁸ cells/mL) despite lower maximum growth rate

Temperature• Temperature is important component of
any fermentation.• Premier cuvee yeast has temp. range of 7-
35°C• Chardonnay temps were b/w 12-18°C,
with no irregular heat spikes
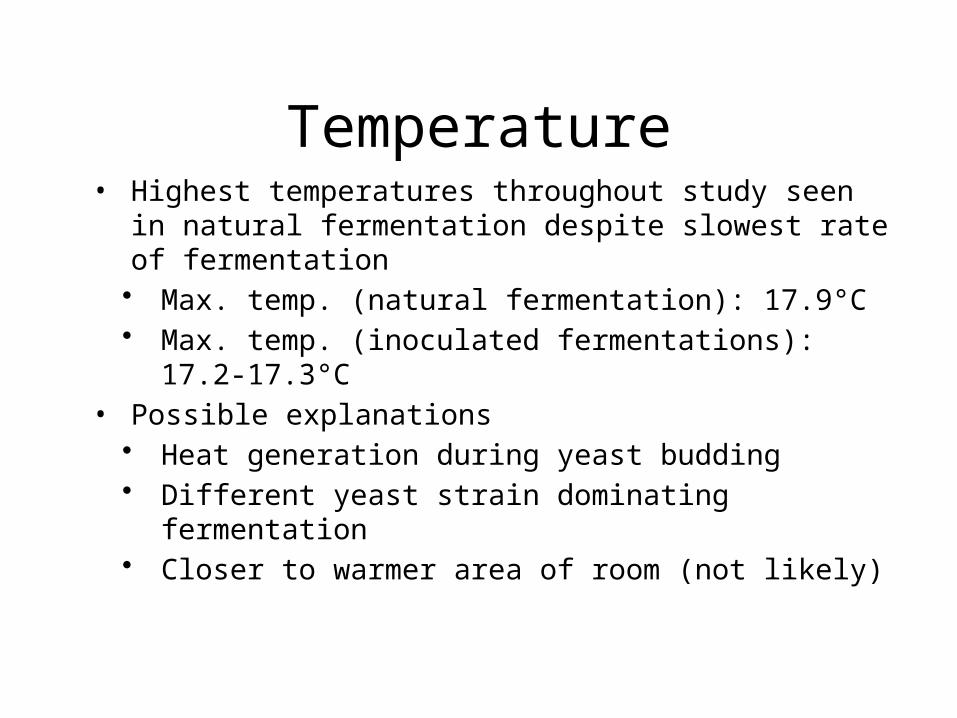
Temperature• Highest temperatures throughout study seen in natural
fermentation despite slowest rate of fermentation• Max. temp. (natural fermentation): 17.9°C• Max. temp. (inoculated fermentations): 17.2-17.3°C
• Possible explanations• Heat generation during yeast budding• Different yeast strain dominating fermentation• Closer to warmer area of room (not likely)
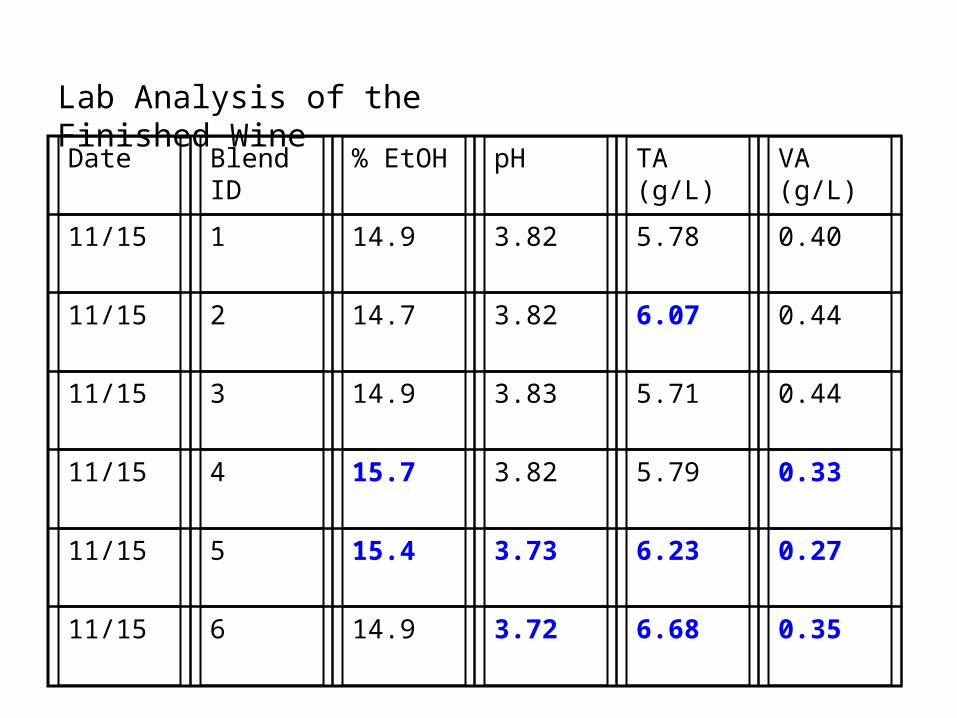
Date Blend ID % EtOH pH TA (g/L) VA (g/L)
11/15 1 14.9 3.82 5.78 0.40
11/15 2 14.7 3.82 6.07 0.44
11/15 3 14.9 3.83 5.71 0.44
11/15 4 15.7 3.82 5.79 0.33
11/15 5 15.4 3.73 6.23 0.27
11/15 6 14.9 3.72 6.68 0.35
Lab Analysis of the Finished Wine

1 2 3 4 5 6
10/29 2-3% 1-1.5%
1-1.5%
Trace Trace - Neg
Neg
11/5 2% 1% 0.5% Trace Neg Neg
11/12 Trace 0.5-1%
0.5-1%
Trace Neg Neg
Results of the Residual Sugar Testing
Chemical AnalysisEthanol Inhibition
• Inoculation levels shown to increase EtOH tolerance
• Current study confirms previous findings.• Slower rates of fermentation at lower inoculation
levels possibly due to decreased EtOH tolerance of yeast

Chemical AnalysisVolatile Acidity
• Lower VA measurements at higher inoculation levels
• Acetobacter repressed in absence of oxygen• Lower VA measurements correlated to shorter
lag phase?• Different strains of S. cerevisiae produce
varying amounts of acetic acid• May explain lower measurement in Lot 1

Chemical AnalysispH/Titratable Acidity
• Malolactic fermentation results in increase in pH and decrease in TA
• Slower fermentations saw pH increase and decrease in TA
• Possible that ML fermentation began?• Colder temps inhibit ML, Lots 5/6 moved to cold
room 2 weeks sooner than rest of Lots

Sensory Analysis
Luke Bohanan

Sensory Evaluation
• Acceptance test with hedonic scale• Aroma only• 2 Repetitions all wines• Randomly numbered• Randomly ordered• Judge tracking

Mean Preference Scores
0 1 2 3 4 5 6 70.00
1.00
2.00
3.00
4.00
5.00
6.00
7.00
Series1
• Reasonable Variance• Two Distinct groups• Outliers…

ANOVA
• XLSTAT used • Judges H0 rejected = Not all Judges scored the same
• Wines H0 rejected = Not all wines were scored the same
• Reps H0 accepted = No significant difference between reps

Judge Grouping From LS Mean
3.000 3.250 3.500 3.750 4.000 4.250 4.500 4.750 5.000 5.250 5.500 5.750 6.000 6.250
J3J7J4J10
J6J12J13J5J14
J9J8J1J2J9
Series1D C B A

Wine Grouping from LS Mean
1.500 2.000 2.500 3.000 3.500 4.000 4.500 5.000 5.500 6.000 6.500 7.000
W4W2
W1W3W5W6
Series1
C B A

Preference Mapping
W1W2
W3 W4W5W6
J1J2J3J4J5J6J7
J8J9J10J11J12J13J14
-200
-150
-100
-50
0
50
100
150
-250 -200 -150 -100 -50 0 50 100 150 200
F2 (0
.00
%)
F1 (100.00 %)
Biplot (axes F1 and F2: 100.00 %)
• Judges in tight group compared to wines• Drastic difference in wine grouping

Mean Factor Score from PCA
-15
-10
-5
0
5
10
1 2 3 4 5 6
Mean Factor Score by Wine Treatment
Mean Factor Score
• Wines 5 and 6 are disliked • Wines 1-4 are liked• Wine 4 is liked the most

What does sensory tell us?
• Highest concentration of desired aroma compounds at 106 cells/ml
• Higher concentration of undesirable compounds at 107 cell/ml and above
• Concentrations below 106 cells/ml show acceptable levels of desirable aromas
Possible causes of negative aromas
• Treatment 5 and 6 left on mass of lees = reductive environment = sulfur
• Lack of nutrients• Post fermentation contamination• Headspace post fermentation = O2 Exposure

Questions?