Embed Size (px)
Citation preview

U.S. Army Corps of EngineersPortland District
Effects of John Day Dam Bypass Screensand Project Operations on the Behaviorand Survival of Juvenile Pacific Lamprey(Lampetra tridentata)
FINAL REPORT
14 January 2000
Pacific Northwest National LaboratoryOperated by Battelle for the U.S. Department of EnergyP.O. Box 999Richland, WA 99352

Effects of John Day Dam Bypass Screens and ProjectOperations on the Behavior and Survival of Juvenile Pacific
Lamprey (Lampetra tridentata)
R.A. MoursundD.D. DaubleM.D. Bleich
FINAL REPORT
14 January 2000
Prepared for:U.S. Army Corps of Engineers
Portland DistrictPortland, Oregon
By:Pacific Northwest National Laboratory
Richland, Washington

ii
Executive Summary
Pacific lamprey (Lampetra tridentata) is the largest and most abundant lamprey species inthe Snake and Columbia River system. As an endemic and anadromous species, the U.S.Army Corps of Engineers has an interest in facilitating their protection at federallyoperated hydroelectric projects. The goal of this study was to begin to determine theeffects of the John Day Dam bypass facilities, specifically the turbine intake screens, andproject operations on the behavior and survival of juvenile Pacific lamprey. Laboratorystudies were conducted to determine swim speed capability and response to a fixed barscreen in an experimental flume.
We found that juvenile Pacific lamprey were highly nocturnal with >90% of theirswimming activity restricted to hours of darkness. They also had a strong preference forsubstrate and remained near the bottom of test aquaria during daylight hours. Thisbehavior is consistent with lack of buoyancy compensation (i.e., they have no swimbladder and slightly negative specific gravity). That lamprey are mainly demersal andnocturnal would be advantageous for predator avoidance, but this same behavior increasesthe possibility that they will pass dams via turbines and underneath the screen or surfacebypass systems designed to guide juvenile salmonids.
Our studies also demonstrated that juvenile Pacific lamprey are fairly weak swimmers.They had an average maximum burst speed of 2.3 ft/sec, or less than the averageperpendicular velocity at the face of extended length submersible bar screens at John DayDam. We also found that 70% and 97% of test fish became impinged on bar screens atvelocities of 1.5 ft/sec for 1-min and 12-hr exposures, respectively. The tendency ofjuvenile lamprey to use their tails for locomotion resulted in some individuals becomingpermanently wedged between the bar spacings.

iii
Acknowledgments
Mike Langeslay of the U.S. Army Corps of Engineers Portland District provided projectoversight.
Pacific Northwest National Laboratory staff: Bob Mueller, Scott Abernethy,Brett Amidan, Kris Hand, and Sue Blanton.
U.S. Department of Energy Community College Initiative intern: Celso Reyes.
U.S. Army Corps of Engineers personnel at John Day Dam: Bob Cordie and Miro Zyndol
Pacific States Marine Fisheries Commission personnel at John Day Dam:Greg Kovalchuck, Rick Martinson, and Jeff Camps.
Washington Department of Fish and Wildlife personnel at McNary Dam: Rosanna Tudorand Paul Hoffarth.
Fisheries Engineering Team at North Bonneville, Washington: Gene Ploskey,Peter Johnson, Larry Lawrence, and Deborah Patterson. Many thanks for the use ofadditional infrared illuminators and power supplies.

iv
Table of Contents
Executive Summary ii
Acknowledgments iii
Table of Contents iv
Introduction 1
Methods 3
Diel Behavior 4Swim Speed 6Response to Bar Screens 8Shear Stress 10
Results and Discussion 12
Diel Behavior 12Swim Speed 15Response to Bar Screens 17Shear Stress 22Other Observations 22
Conclusions 24
References 25
Appendix A: Equipment Specifications A.1
Appendix B: Flume Velocity Calibration B.1

v
List of Figures
Figure 1. Location of John Day Dam in relation to the mainstem Columbia and Snakerivers. ........................................................................................................................ 2
Figure 2. Oral cavity of juvenile Pacific lamprey. Note tooth development and lack oforal fimbrae pigmentation. ......................................................................................... 3
Figure 3. Juvenile Pacific lamprey run timing from the Smolt Monitoring Program. Thesingle value off the vertical scale is the passage of 60,000 lamprey through McNaryDam on May 29. ........................................................................................................ 4
Figure 4. Selection of cobble substrate for cover by juvenile lamprey.............................. 5Figure 5. Group diel tank shown with observation window and camera........................... 5Figure 6. Juvenile lamprey exhibiting anguilliform motion in paired trough during burst
speed trials................................................................................................................. 6Figure 7. Electrified mesh tube inside the respirometer flume. A juvenile lamprey is
shown to the right swimming upstream...................................................................... 7Figure 8. Electrified downstream portion of mesh tube. The wires extended some
distance along the bottom as well............................................................................... 7Figure 9. Lamprey were unable to grasp the nylon mesh, though it wasn't for lack of
trying. ........................................................................................................................ 7Figure 10. The bar screen insert placed in the flume. All tests were conducted as shown
with the bar screen perpendicular to flow................................................................... 8Figure 11. Infrared lighting shown here above the flume illuminated the observation area
and bar screen during night-time tests. ....................................................................... 8Figure 12. Example of lamprey shear test at 50 ft/s jet velocity, recorded at 500 frames/s.
................................................................................................................................ 10Figure 13. Total length frequencies of tested juvenile lamprey; n = 121. ....................... 12Figure 14. Relative distribution of attached juvenile Pacific lamprey with and without
cobble substrate (group test, both day and night combined), n = 7680. Depth strata 4is the bottom of the observation tank........................................................................ 13
Figure 15. Relative distribution of actively swimming juvenile Pacific lamprey with andwithout substrate (group test, both day and night combined), n = 7680. Depth strata 4is the bottom of the observation tank........................................................................ 13
Figure 16. Depth distribution for actively swimming individuals and groups of juvenilePacific lamprey (both day and night combined). Depth strata 4 is the bottom of theobservation tank....................................................................................................... 13
Figure 17. Diel activity levels (active swimmers) of grouped and individual juvenilePacific lamprey, both with cobble substrate. ............................................................ 13
Figure 18. Diel activity patterns for all diel tests. The dark period began at 1800h andended at 0600h......................................................................................................... 14
Figure 19. Distribution of burst speed values for individual lamprey. Average maximumburst speed was 2.3 ft/s (n = 30)............................................................................... 15
Figure 20. Fatigue curve based on a hypothetical logarithmic fit to median sustainedswim speed. ............................................................................................................. 16
Figure 21. Relative position of juvenile lamprey during 12-hour screen exposures, n =1960 per velocity (7840 total observations). Position 1 is the most downstreamlocation, i.e., next to or on the bar screen. ................................................................ 18

vi
Figure 22. Example of 12-hour bar screen exposure at 0 ft/s flume velocity (control).Note that lamprey are swimming freely throughout the water column. ..................... 19
Figure 23. Example of 12-hour bar screen exposure at 1.5 ft/s flume velocity. The barscreen is at the left (downstream) portion of the picture. Most lamprey are impingedon the bar screen, others are attached to the tank wall or floor.................................. 19
Figure 24. Relative position of juvenile lamprey during 1-minute exposures, n = 10 pervelocity (40 total observations). Position 1 is the most downstream location, i.e. nextto or on the bar screen.............................................................................................. 20
Figure 25. Back view (left) and front view (right) of impinged lamprey on bar screen.Note the tail-first orientation .................................................................................... 21
Figure 26. Cross-section diagram of the velocity vectors at a deployed ESBS based onphysical model data from the Corps. ........................................................................ 21
Figure 27. Juvenile lamprey feeding on dead rainbow trout in freshwater...................... 23
List of Tables
Table 1. Experimental design for 12-hr screen exposure.................................................. 9Table 2. Jet velocity and rate of strain relationship. ....................................................... 11

1
Introduction
Pacific lamprey (Lampetra tridentata) is the largest and most abundant lamprey species inthe Snake and Columbia river systems (Wydoski and Whitney 1979). It is parasitic as anadult in the ocean, migrates into freshwater to spawn, and larvae develop in the gravel-mud substrate for several years before migrating downstream as young adults. Thecurrent distribution of the Pacific lamprey extends to Chief Joseph and Hells Canyondams, in the mainstem Columbia and Snake rivers, respectively. Principal spawning andrearing habitats occur in tributary streams (Kan 1975), with limited use of mainstemcorridors except during adult and juvenile migration periods. A widespread decline innumbers of Pacific lamprey has occurred since the 1960s or the period when most damconstruction occurred in the lower Snake and Columbia rivers. This decline has beenattributed to several causes, including habitat loss, water pollution, ocean conditions, anddam passage (Close et al. 1995).
Operations at mainstem hydroelectric projects may impact juvenile lamprey duringdownstream passage. One concern is that juvenile lamprey have a higher potential forentrainment through turbines because they swim lower in the water column thananadromous salmonids (Long 1968). Their ability to survive turbine passage, includingresponse to changes in pressure, turbulent flow, and shear stress are unknown. Anotherkey concern is how juvenile lamprey respond to barrier screens designed to bypass fishinto collection facilities. For example, some investigators have reported large numbers ofjuvenile lamprey were impinged between individual bars of fixed bar screens at TheDalles and McNary dams (Hatch and Parker 1998). Addressing the uncertaintiesassociated with these potential mortality factors during passage of mainstem hydroelectricdams was the focus of our research.
The goal of this study was to begin to determine the effects of the John Day Dam bypassfacilities, specifically the turbine intake screens, and project operations on the behaviorand survival of juvenile Pacific lamprey. John Day Dam is the third most downstreamhydroelectric facility in the Columbia River system located at river mile 216 (Figure 1). Ithas a generating capacity of 2,160 MW from 16 turbine units. Prototype extended-lengthsubmersible bar screens (ESBS) are undergoing field testing for use in the turbine intakes.

2
Figure 1. Location of John Day Dam in relation to the mainstem Columbia and Snakerivers.
Laboratory studies were designed to determine potential injury mechanisms and turbinepassage conditions that affect the survival of juvenile lamprey. Specifically, theswimming performance of the juvenile lamprey was evaluated in our laboratory todocument their behavior and threshold impingement velocities. Shear stress affectingsurvival during turbine passage was also documented using a simulated turbine passagesystem (Neitzel et al. 1998). Collectively, the studies will provide the U.S. Army Corpsof Engineers (Corps) with information to mitigate any adverse effects of ESBS on juvenilePacific lamprey. This information will also be generally applicable to other hydroelectricprojects with submersible bar screens.

3
Methods
Juvenile Pacific lamprey (Lampetra tridentata) were collected from the juvenile bypassfish facilities at John Day and McNary (river mile 292) dams. All the juvenile lampreyhad, therefore, been intercepted by the intake bypass screen and traveled through thejuvenile bypass system before their transport to the Pacific Northwest National Laboratory(PNNL). All these fish were actively migrating downstream and were in the seventh andfinal stage of metamorphosis according to the criteria described in Youson and Potter(1979; Figure 2). All tests were conducted at PNNL in Richland, Washington, during orimmediately following the peak juvenile outmigration period of May and June (Figure 3).
Figure 2. Oral cavity of juvenile Pacific lamprey. Note tooth development and lack oforal fimbrae pigmentation.

4
1998 Run Timing
0
5,000
10,000
15,0001-
Mar
1-A
pr
1-M
ay
1-Ju
n
1-Ju
l
1-A
ug
1-S
ep
1-O
ct
Pas
sage
Inde
xMcNary Dam John Day Dam
Figure 3. Juvenile Pacific lamprey run timing from the Smolt Monitoring Program. Thesingle value off the vertical scale is the passage of 60,000 lamprey through McNary Damon May 29.
Diel BehaviorA preliminary search of the literature suggested the outmigrating individuals were moreactive at night (Hardisty and Potter 1971). Therefore, we designed a series of tests tobetter understand juvenile lamprey responses to the diel cycle. Initial results indicatedthat laboratory experiments needed to be conducted during periods of darkness becauselamprey exhibited little volitional activity during daylight hours. Infrared illuminatorswere used to record events on video without altering behavior. The 880-nm wavelengthoutput of the illuminators is beyond the visible spectrum, but certain cameras are sensitiveto that range.
We designed two tests under static flow conditions, with and without a cobble substrate.The primary objective was to characterize diel activity and general behavior; a secondaryobjective was to evaluate substrate choice. Substrate choice in this case was for cobble orbare tank similar to the photo below (Figure 4).

5
Figure 4. Selection of cobble substrate for cover by juvenile lamprey.
A 50-L observation tank (94 cm wide × 63.5 cm deep × 47 cm height) was used with afull side observation window. This was supplied with flow-through 10°C raw river water.A white backdrop included four depth reference strata. The tank was top-lit with infraredilluminators, and the camera had a full field of view (Figure 5). The laboratory was on a12-hr light cycle with approximately a 20-min transition period. For the test, 20 lampreywere placed in the tank. Videotaping occurred continuously over 3 days with a time-lapsed video tape recorder in 72-hr mode (0.6-s frame interval). Position and activity ofall lamprey were recorded at 15-min intervals.
Figure 5. Group diel tank shown with observation window and camera.
An additional set of tests was conducted to evaluate the diel behavior of individuallamprey. Four 10-gallon tanks with cobble substrate were set up with flow-throughchilled 8.5°C well water. These tests were conducted after the ambient river watertemperature had increased and the lamprey were being held in chilled river water (see the

6
Other Observations in the Results section for more details). In each test, a single juvenilelamprey was placed into a tank 12 hours before testing began. Taping occurredcontinuously over 24 hours with a time-lapsed video tape recorder in 72-hr mode (0.6-sframe interval). Position and activity were recorded at 15-min intervals.
Swim SpeedTwo holding troughs were designed to examine maximum burst speed. A plastic grid wasplaced on the bottom with markings at 10-cm intervals, and a camera was suspended overthe troughs to record lamprey movement. Each lamprey was placed into one of thetroughs and allowed to acclimate for 3 minutes. Once the fish was in view of the camera,it was induced to swim by squirting water through a pipette. The fish was then allowed torest for 3 minutes before being stimulated again. This process was repeated a total of fivetimes per fish and was conducted on 30 lamprey. Video was collected in 2-hr mode(1/30-s frame interval). The maximum speed attained was the fastest run as measuredwithin a 10-frame (1/3-s) interval. An average maximum burst speed was attained for all30 individuals (Figure 6).
Figure 6. Juvenile lamprey exhibiting anguilliform motion in paired trough during burstspeed trials.
A second set of experiments was designed to measure sustained swim speed. Thisrequired that we deal with the general unwillingness of juvenile lamprey to swim. A40-cm diameter × 115-cm length mesh tube was constructed and placed inside a 2,200-LBrett-type respirometer (Figure 7). The 1/8-in nylon mesh was from a John Day Damsubmersible traveling screen. The tube was sealed at both ends, had a small entry port atthe upstream end, and a downstream end that was electrified with wire woven into themesh (Figure 8). This design succeeded in accomplishing three things necessary toconduct the experiment. First, juvenile lamprey were forced to continuously swim

7
because they could not attach to the mesh screen. Second, the electrification preventedthem from resting at the back of the tube. Third, fish could be observed through the light-colored mesh (Figure 9). A control panel was used to regulate the voltage and current ofthe electrified portion to 5V and 0.6A DC. Initially, water velocity was increased at0.5 ft/s intervals every 15-min until the lamprey became fatigued. The time intervalbetween velocities was later decreased to 5-min because of observations that fish werebecoming fatigued in the second half of the longer interval.
Figure 7. Electrified mesh tube inside the respirometer flume. A juvenile lamprey isshown to the right swimming upstream.
Figure 8. Electrified downstream portion of mesh tube. The wires extended somedistance along the bottom as well.
Figure 9. Lamprey were unable to grasp the nylon mesh, though it wasn't for lack oftrying.

8
Response to Bar ScreensAll bar screen exposures were conducted in the 2,200-L Brett-type respirometer (Brett1965). A 25-hp variable speed alternating-current motor drove an impeller to providevelocities from 0 to 2 ft/s. A 50 cm × 50 cm section of bar screen (1/8" spaced wedgewire or Johnson bar) was used. This was set perpendicular to flow and all subsequenttests were conducted with the bar screen perpendicular to flow (Figure 10). Cameras wereset to look through the observation window to evaluate behavior during tests. Infraredilluminators were used to capture lamprey activity on video at night (Figure 11). Thevelocity of the water within the test apparatus was measured using an acoustic dopplervelocimeter. Appendix B describes the details of the flume velocity calibration in greaterdetail.
Figure 10. The bar screen insert placed in the flume. All tests were conducted as shownwith the bar screen perpendicular to flow.
Figure 11. Infrared lighting shown here above the flume illuminated the observation areaand bar screen during night-time tests.

9
We conducted a series of tests to determine the velocity at which juvenile lamprey becameimpinged on the bar screen while under continuous flow. (We define the criticalimpingement velocity for lamprey as the water velocity at which individuals are unable toremove themselves from the screen face.) All bar screen exposures were done at night toensure that movement was volitional. Two groups of 20 randomly selected lamprey eachwere tested over an 8-day period (4 days for each group). Four treatment velocities weretested: control (no flow), 0.5 ft/s, 1.0 ft/s, and 1.5 ft/s. This range was based on previoustesting which showed that a 12-hr exposure to greater than 2 ft/s flume velocity was lethal.That is, all juvenile Pacific lamprey in Stage 7 of metamorphosis exposed to 2.5 ft/s flowsfor 12 hours became impinged on the bar screen and died. Each of the four experimentaltreatments was applied overnight (1800h to 0600h) with no treatment (i.e. staticconditions) applied during the day. Velocity regimes were randomized over each of tworeplicate test series (Table 1). Time-lapse video recorded events in 72-hr mode (0.6-sframe interval).
Table 1. Experimental design for 12-hr screen exposure.
WEEK 1 (Group 1)Day 1 Day 2 Day 3 Day 4Control 1.5 ft/sec 1 ft/sec 2 ft/sec
WEEK 2 (Group 2)Day 1 Day 2 Day 3 Day 4Control 2 ft/sec 1 ft/sec 1.5 ft/sec
A final test was designed to determine initial reactions of juvenile lamprey to the barscreen. Four groups of 10 lamprey each were introduced into the swim chamber of therespirometer via a Plexiglas tube. They were placed into 0 to 1.5 ft/s velocity flows.Observations of their behavior (i.e., interaction with the bar screen, swimming patterns)were made from the video record. All video was recorded in normal 2-hr mode. Thisentire test was conducted in the dark using infrared illuminators.

10
Shear StressJuvenile lamprey were subjected to a range of shear forces, such as those encountered as afish passes through a turbine. Individual lamprey were placed directly into the shear zoneand their location in the water column recorded using high-speed video photography.Three replicates with 10 fish per treatment were exposed to jet velocities (0, 20, 30, 40,50, 60).
Figure 12. Example of lamprey shear test at 50 ft/s jet velocity, recorded at 500 frames/s.
Each group was observed five times after the shear exposure (0 hr, 24 hr, 48 hr, 72 hr,96 hr), and their health was categorized into grades. Proportional tests were performed tocompare biological endpoints of control fish to those of the test population.
Jet Plume
Entry

11
The reported jet velocities correspond to a rate of strain shown in Table 2. It should benoted that the scale at which the strain calculations are made is critical. The rate of straincalculations are based on an assumed ∆y = 1 cm (Equation 1) and are consistent with thecalculations currently used by Neitzel et al. (pers comm). The 1-cm unit was chosen torepresent the order of magnitude of a smolt width.
Table 2. Jet velocity and rate of strain relationship.
Jet Velocity (ft/s) Rate of Strain (cm/s/cm)0 010 30520 61030 91540 122050 152560 1830
yue
∂∂=
Equation 1. Laminar form of the rate of strain.

12
Results and Discussion
Juvenile lamprey ranged from 110 to 165 mm in total length; the mean length was 136 forthe test population (Figure 13). Lamprey lack a swim bladder for buoyancy regulation.They also lack paired fins, e.g., pectorals that produce upward lift forces for some othernon-teleosts (Alexander 1990). Negative buoyancy may be deduced from the observationthat the bodies of all lamprey hang down when attached to a tank surface, and all inactivelamprey were either attached or on the bottom. Lamprey must rely on their tail to moveoff the bottom and to propel forward. The lack of pectoral fins and proportionately highernumber of body segments involved in movement likely has higher energetic costs (Webb1975).
Length Frequencies
0
5
10
15
20
25
30
100 105 110 115 120 125 130 135 140 145 150 155 160 165 170
Total Length (mm)
Freq
uenc
y (%
)
Figure 13. Total length frequencies of tested juvenile lamprey; n = 121.
Diel BehaviorInitial experiments showed that volitional movement of juvenile lamprey was restricted tonight only. We also noted the availability of cobble substrate affected the resting orattached position of juvenile lamprey (Figure 14). When given a choice, lamprey alwayschose a cobble substrate over the bare tank. Without a choice, lamprey attached to theside of the observation tank near the surface or top strata, often by the water inlet. Therewas no apparent influence of substrate on swimming activity or depth distribution (Figure15).
The presence of other lamprey did not appear to affect the vertical distribution of activelyswimming individuals, based on their depth in the water column (Figure 16). In general,the activity of individual lamprey appeared greater than that noted for group tests (Figure17). That is, individual lamprey spent a higher proportion of the time actively swimmingthan lamprey that were tested in groups of 20.

13
Attached Depth With vs. Without Substrate
0 20 40 60 80 100
1
2
3
4
Dep
th S
trat
a
Observations (%)
With substrateNo substrate
Figure 14. Relative distribution ofattached juvenile Pacific lamprey withand without cobble substrate (group test,both day and night combined), n = 7680.Depth strata 4 is the bottom of theobservation tank.
Swimming Depth With vs. Without Substrate
0 20 40 60 80 100
1
2
3
4
Dep
th S
trat
a
Observations (%)
With substrateNo substrate
Figure 15. Relative distribution ofactively swimming juvenile Pacificlamprey with and without substrate(group test, both day and nightcombined), n = 7680. Depth strata 4 isthe bottom of the observation tank.
Group vs. Individual Swimming Depth
0 20 40 60 80 100
1
2
3
4
Dep
th S
trat
a
Observations (%)
GroupIndividuals
Figure 16. Depth distribution foractively swimming individuals andgroups of juvenile Pacific lamprey (bothday and night combined). Depth strata 4is the bottom of the observation tank.
Group vs. Individual Activity Levels
0
5
10
15
20
25
30
Day Night
Act
ive
Sw
imm
ers
(%)
GroupIndividuals
Figure 17. Diel activity levels (activeswimmers) of grouped and individualjuvenile Pacific lamprey, both withcobble substrate.

14
For all the tests, swimming activity was greatest in the early evening and graduallydeclined through the night. This pattern was the same for all tests regardless of substrateor group status (Figure 18). Nearly all (94%) of the swimming activity was observedduring the dark period. Increased movement at night is consistent with diel movementobserved for downstream migrant juvenile Pacific lamprey at mainstem dams. Forexample, Long (1968) reported 62% of lamprey ammocoetes were collected during thenight at The Dalles Dam powerhouse.
Diel Activity
0
10
20
30
40
50
60
70
80
18:0
0
0:00
6:00
12:0
0
Time
Act
ive
Sw
imm
ers
(%)
Individuals
Group w ith substrate
Group no substrate
Figure 18. Diel activity patterns for all diel tests. The dark period began at 1800h andended at 0600h.

15
Swim SpeedFish swimming performance metrics and nomenclature are not standardized. Burst speedis typically defined as the maximum speed attained on the order of seconds. Sustainedspeed is usually described on longer exposures, on the order of minutes. A cruising speedmay be defined as a speed that can be maintained for hours (Bell 1986, Webb 1975).Subcategories may also be defined. For instance, Webb notes that the burst definitionincludes speeds for less than 1 second, but that these may be considered in a separatecategory for unsteady peak speeds.
Burst speed of juvenile Pacific lamprey during our paired trough tests ranged from 1.8 to3.1 with a mean of 2.3 ft/s for n = 30 (Figure 19). This equates to a specific swim speed(normalized to body length) of approximately 5.2 L/s. The specific swim speed measurehas been shown to be length dependent and varies for different species; however, it is stilla useful metric to make comparisons between otherwise disparate experiments. The elverstage of Anguilla, for example, was shown to have a specific swim speed of 7.5 L/s for a0.27-min interval. Juvenile salmonids have been shown to be generally capable of burstspeeds on the order of 9-12 L/s. (McCleave 1980, Webb 1975).
Burst Speed
0
5
10
15
20
25
30
1.5 2 2.5 3 3.5
Maximum Individual Speed (ft/s)
Obs
erva
tions
(%)
Figure 19. Distribution of burst speed values for individual lamprey. Average maximumburst speed was 2.3 ft/s (n = 30).

16
Sustained swim speed at 5-minute intervals in the mesh tube ranged from 0 to 1.5 ft/s witha median of 0.75 ft/s (n = 30). Sustained swim speed at 15-minute intervals was slowerand ranged from 0 to 1.0 ft/s with a median of 0.5 ft/s (n = 10). Collectively, these valuesshow that swimming endurance decreased slightly from 0.5 to 1.0 ft/s, then rapidly atvelocities ≥ 1.5 ft/s (Figure 20). The shape of this curve also concurs with the followingswim speed relationship equation (Equation 2).
Fatigue Curve
0
1
2
3
0 5 10 15
Time Interval (min)
Med
ian
Sw
im S
peed
(ft/s
)
Figure 20. Fatigue curve based on a hypothetical logarithmic fit to median sustainedswim speed.
Dart Speed = Sustained Speed × 2 = Cruise Speed × 6
Equation 2. Swim speed relationships based on Bell (1986).
Based on these data, we find that juvenile Pacific lamprey are relatively poor swimmers.This fact becomes critical when the turbine intake environment is considered where theaverage perpendicular velocity at an ESBS is 2.4 ft/s (Figure 26). We will also see in thenext section that their behavioral response to bar screens is markedly different from thesalmonids for which the screens were designed.
17
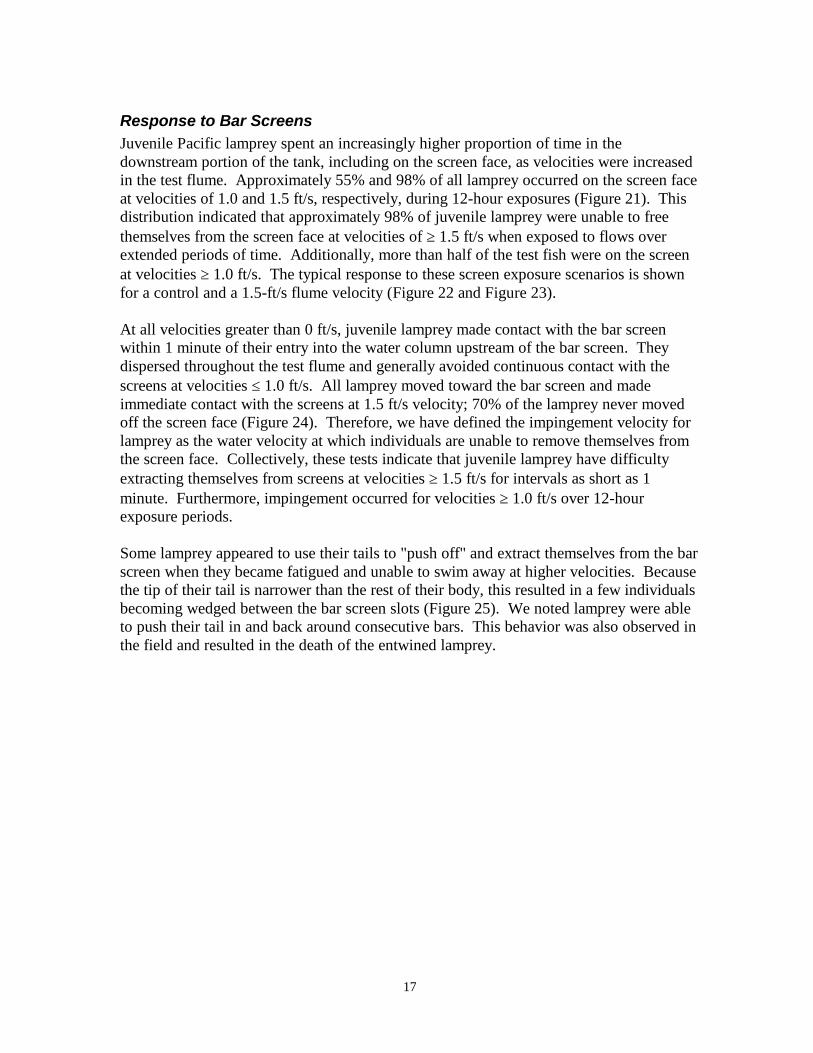
Response to Bar ScreensJuvenile Pacific lamprey spent an increasingly higher proportion of time in thedownstream portion of the tank, including on the screen face, as velocities were increasedin the test flume. Approximately 55% and 98% of all lamprey occurred on the screen faceat velocities of 1.0 and 1.5 ft/s, respectively, during 12-hour exposures (Figure 21). Thisdistribution indicated that approximately 98% of juvenile lamprey were unable to freethemselves from the screen face at velocities of ≥ 1.5 ft/s when exposed to flows overextended periods of time. Additionally, more than half of the test fish were on the screenat velocities ≥ 1.0 ft/s. The typical response to these screen exposure scenarios is shownfor a control and a 1.5-ft/s flume velocity (Figure 22 and Figure 23).
At all velocities greater than 0 ft/s, juvenile lamprey made contact with the bar screenwithin 1 minute of their entry into the water column upstream of the bar screen. Theydispersed throughout the test flume and generally avoided continuous contact with thescreens at velocities ≤ 1.0 ft/s. All lamprey moved toward the bar screen and madeimmediate contact with the screens at 1.5 ft/s velocity; 70% of the lamprey never movedoff the screen face (Figure 24). Therefore, we have defined the impingement velocity forlamprey as the water velocity at which individuals are unable to remove themselves fromthe screen face. Collectively, these tests indicate that juvenile lamprey have difficultyextracting themselves from screens at velocities ≥ 1.5 ft/s for intervals as short as 1minute. Furthermore, impingement occurred for velocities ≥ 1.0 ft/s over 12-hourexposure periods.
Some lamprey appeared to use their tails to "push off" and extract themselves from the barscreen when they became fatigued and unable to swim away at higher velocities. Becausethe tip of their tail is narrower than the rest of their body, this resulted in a few individualsbecoming wedged between the bar screen slots (Figure 25). We noted lamprey were ableto push their tail in and back around consecutive bars. This behavior was also observed inthe field and resulted in the death of the entwined lamprey.

18
0 ft/s Flume Velocity
0
25
50
75
100
1 2 3 4 5
Tank Position
Ob
se
rva
tio
ns
(%
)
_
0.5 ft/s Flume Velocity
0
25
50
75
100
1 2 3 4 5
Tank Position
Ob
se
rva
tio
ns
(%
)
_
1.0 ft/s Flume Velocity
0
25
50
75
100
1 2 3 4 5
Tank Position
Ob
se
rva
tio
ns
(%
)
_
1.5 ft/s Flume Velocity
0
25
50
75
100
1 2 3 4 5
Tank Position
Ob
se
rva
tio
ns
(%
)
_
Figure 21. Relative position of juvenile lamprey during 12-hour screen exposures, n =1960 per velocity (7840 total observations). Position 1 is the most downstream location,i.e., next to or on the bar screen.

19
Figure 22. Example of 12-hour bar screen exposure at 0 ft/s flume velocity (control).Note that lamprey are swimming freely throughout the water column.
Figure 23. Example of 12-hour bar screen exposure at 1.5 ft/s flume velocity. The barscreen is at the left (downstream) portion of the picture. Most lamprey are impinged onthe bar screen, others are attached to the tank wall or floor.

20
0 ft/s Flume Velocity
0
25
50
75
100
1 2 3 4 5
Maximum Distance from Screen(Tank Position)
Ob
se
rva
tio
ns
(%
)
_
0.5 ft/s Flume Velocity
0
25
50
75
100
1 2 3 4 5
Maximum Distance from Screen(Tank Position)
Ob
se
rva
tio
ns
(%
)
_
1.0 ft/s Flume Velocity
0
25
50
75
100
1 2 3 4 5
Maximum Distance from Screen(Tank Position)
Ob
se
rva
tio
ns
(%
)
_
1.5 ft/s Flume Velocity
0
25
50
75
100
1 2 3 4 5
Maximum Distance from Screen(Tank Position)
Ob
se
rva
tio
ns
(%
)
_
Figure 24. Relative position of juvenile lamprey during 1-minute exposures, n = 10 pervelocity (40 total observations). Position 1 is the most downstream location, i.e. next to oron the bar screen.

21
Figure 25. Back view (left) and front view (right) of impinged lamprey on bar screen.Note the tail-first orientation
The average velocity of flow perpendicular to the ESBS's at John Day Dam is estimated tobe 2.4 ft/s (Figure 26). This velocity exceeds the levels resulting in impingement ofjuvenile lamprey during all our laboratory tests. This value is also slightly higher than theaverage burst speed of our test population. Highest velocities occurred at the upperportion of the ESBS and sweeping velocities exceeded 10 ft/s near the gatewell slotentrance.
Figure 26. Cross-section diagram of the velocity vectors at a deployed ESBS based onphysical model data from the Corps.

22
Shear StressCurrently no data exist pertaining to the effects of shear on juvenile Pacific lamprey. Theresults from our study provide baseline species information for quantifying the biologicalcriteria of the turbine passage environment. In addition, they provide a comparative dataset for salmonid research.
Lamprey did not suffer any ill effects at exposure to the jet velocities (equivalent to ratesof strain 1220 to 1830 cm/s/cm) that injured and/or killed salmonids (Neitzel et al 1998).There were no immediate deaths and no immediate gross injuries. Gross injuries toteleosts (bony fish) included missing eyes, hemorrhaging from the eyes and/or gills,inverted gills, torn isthmus, severe bruising, and greater than 80% scale removal. Possiblereasons for the hardiness of juvenile lamprey may include their flexibility (Figure 12) andthe reduced size of vulnerable structures. For example, injuries to salmonids ofteninvolved the operculum or jaw— structures absent in lamprey.
Other ObservationsIncreased water temperatures resulted in greatly increased incidence of fungal infectionfor lamprey held at the Aquatic Laboratory. Ambient river water temperature exceeded15° C in June, 1999, when lamprey were held in raw river water tanks. Other researchersholding juvenile lamprey at that time noted problems with infections (Jen Bayer, USGS,pers comm, and Carl Shreck, OSU, pers comm). It was assumed this was a fungalinfection, but the exact nature of the disease has not been determined.
We used salt as a treatment in order to avoid water discharge regulations withprophylactic chemicals (e.g. formalin). We tested survivability of juvenile lamprey inboth 50% (17 ppt) and full (35 ppt) seawater concentrations. Transfer from freshwater tofull seawater was lethal. In contrast, survival rates were high in the 50% seawatersolution, and the fungal infection ceased. Lamprey held in seawater were returned tochilled well water to hold for the sustained swim speed tests. Due to limited availabilityof test fish, formal bioassays regarding a seawater prophylaxis protocol were notconducted. A suggested procedure is to hold juvenile lamprey in 50% seawater for 1week, then place in cold sterile freshwater (e.g., ≤10° C well water). We currently havejuvenile lamprey that have been held in chilled 50% seawater for 4 months that are stillhealthy.

23
We observed juvenile lamprey feeding on dead rainbow trout while held in freshwater(Figure 27). Richards and Beamish (1981) exposed live Pacific herring to juvenilelamprey at Stage 7 of metamorphosis in freshwater, but observed no feeding until theywere transferred to saltwater. We also observed attachment and feeding on live rainbowtrout regularly for juvenile lamprey held in the 50% seawater tanks.
Figure 27. Juvenile lamprey feeding on dead rainbow trout in freshwater.

24
Conclusions
We found that juvenile Pacific lamprey were highly nocturnal during our laboratorystudies, with >90% of their swimming activity restricted to hours of darkness. They alsohad a strong preference for substrate and remained near the bottom of test aquaria duringdaylight hours. This behavior is consistent with lack of buoyancy compensation (i.e., theyhave no swim bladder and slightly negative specific gravity). That lamprey are mainlydemersal and nocturnal would be advantageous for predator avoidance, but this samebehavior increases the possibility that they will pass dams via turbines and underneath thescreen or surface bypass systems designed to guide juvenile salmonids.
Our studies also demonstrated that juvenile Pacific lamprey are fairly weak swimmers.They had an average maximum burst speed of 2.3 ft/s, or less than the averageperpendicular velocity at the face of extended length submersible bar screens at John DayDam. We also found that 70% and 97% of test fish became impinged on bar screens atvelocities of 1.5 ft/sec for 1-minute and 12-hour exposures, respectively. The tendency ofjuvenile lamprey to use their tails for locomotion resulted in some individuals becomingpermanently wedged between the bar spacings.
Additional tests are planned in FY 2000 to evaluate lamprey behavior with differentscreen materials (e.g., STS-type 1/8-in nylon mesh, narrower bar screen with 3/32-inspacing; or ESBS-type bar screen in a lateral configuration). The stamina or ability oflamprey to survive impingement over a range of velocities that occur in the turbine intakewill also be tested. This information, along with in-turbine observations of juvenilelamprey on bypass screens, could be used to provide insight toward optimum brushcleaning cycles.

25
References
Alexander RM. 1990. Size, speed, and buoyance adaptations in aquatic animals. Amer.Zool. 30:189-196.
Bell, MC. 1986. Fisheries handbook of engineering requirements and biological criteria.Fish Passage Development and Evaluation Program, U.S. Army Corps of Engineers,North Pacific Division, Portland, Oregon.
Brett JR. 1965. The respiratory metabolism and swimming performance of youngsockeye salmon. J. Fish. Res. Bd. Can. 21:1183-1226.
Close DA, M Fitzpatrick, H Li, B Parker, D Hatch, and G James. 1995. Status report ofthe Pacific lamprey (Lampetra tridentata) in the Columbia River basin. Prepared for theU.S. Department of Energy, Bonneville Power Administration, Portland, Oregon.
Hardisty MW and IC Potter (eds.). 1971. The biology of lampreys. London: AcademicPress.
Hatch D, and B Parker. 1998. Lamprey research and restoration project. 1996 AnnualReport. Part (B) Abundance monitoring for Columbia and Snake Rivers. Prepared forU.S. Department of Energy, Bonneville Power Administration, Portland, Oregon.
Kan TT. 1975. Systematics, variation, distribution and biology of lampreys of the genusLampetra in Oregon. PhD Thesis. Oregon State University, Corvallis, Oregon.
Long CW. 1968. Diurnal movement and vertical distribution of juvenile anadromous fishin turbine intakes. Fishery Bulletin 66(3):599-609.
McCleave JD. 1980. Swimming performance of European eel (Anguilla anguilla (L.))elvers. J. Fish. Biol. 16:445-452.
Neitzel DA, CS Abernethy, MC Richmond. 1998. Laboratory studies of the effects ofturbulence and shear stresses on turbine-passed fish: 1997-98 program report. Preparedfor the Idaho National Engineering and Environmental Laboratory.
Richards JE, and FWH Beamish. 1981. Initiation of feeding and salinity tolerance in thePacific lamprey Lampetra tridentata. Mar. Biol. 63:73-77.
Youson JH, and IC Potter. 1979. A description of the stages in the metamorphosis of theanadromous sea lamprey, Petromyzon marinus L. Can. J. Zool. 57:1808-1817.
Webb PW. 1975. Hydrodynamics and energetics of fish propulsion. Bull. Fish. Res. Bd.Canada 190:1-158.
Wydoski RS, and RR Whitney. 1979. Inland fishes of Washington. University ofWashington Press. Seattle, Washington.

A.1
Appendix A: Equipment Specifications
A custom-built 2,200-L Brett-type respirometer (Brett 1965) was constructed of stainlesssteel and contained a working section with removable cover, impeller, flow straightener,and view window. The observation section measured 1.8 m long, 0.53 m wide, and 0.53m high. A 25-hp variable speed alternating-current (AC) motor drove the impeller thatprovided velocities that ranged from 0 to 150 cm/s. The respirometer unit was immersedin a fiberglass cooling tank that measured 4.5 X 1.7 m. Water temperature could beregulated between 10 and 23°C. The respirometer operated with the follow motor andcontroller:25 hp Reliance Electric AC motor P32G0431K, s/n 05MN320431Powermaster AC motor speed controller CIMR-G304018, s/n E131457
Flow measurements were taken with an acoustic doppler velocimeter, Sontek ADV Fields/n A205.
The following infrared illuminators, 880 nm λ output, and associated power supplies wereused:Infrared illuminators, 30W American Dynamics AD1020/3050Infrared illuminators, 60W American Dynamics AD1020/6050Power supplies, Trip Lite PR-15 (13.8V DC 15A)
The low-light, black and white, CCD cameras, with peak sensitivity in the infrared bandwere:Video camera, Ikegami ICD-4224 with 6mm lens, s/n F07807Video camera, Ikegami ICD-4224 with 6mm lens, s/n F07857
The following video tape recorders were used:Time-lapse SVHS video recorder, Panasonic AG-6730P s/n C4TA00357Time-lapse SVHS video recorder, Panasonic AG-6730P s/n C4TA00339Video Hi8 recorder, Sony EV-C200Video Hi8 recorder, EV-S5000Video overlay, Video Typewriter 5100 serial number 3113
A research stereo microscope was used for identifying the morphological features used indetermining the developmental stage:Research stereo microscope, Olympus SZH10Video camera (attached to scope), Sony DXC-970MD

B.1
Appendix B: Flume Velocity Calibration
The following relationship was determined with an acoustic doppler velocimeter (FigureB.1). For the screen exposure tests, these measurements were taken at the screen face inthe center of the flume. For the swimming performance test, measurements were takenimmediately downstream of the tube in the center of the flume. Variation of velocitywithin the tank ranged approximately ± 0.1 ft/s. Turbulence was not measured for thesetests. The turbulence intensity that lamprey or other fish may encounter in the turbineintake environment is not yet known.
Motor Frequency vs. Flume Velocity
y = 12.906xR2 = 0.9995
0
5
10
15
20
25
0 0.5 1 1.5
Flume Velocity (ft/s)
Mot
or F
requ
ency
(Hz)
Figure B.1. Relationship between motor frequency and flume velocity.