Embed Size (px)
Citation preview

1003
Conservation Biology, Pages 1003–1014Volume 16, No. 4, August 2002
Effects of Land-Use Intensity in Tropical Agroforestry Systems on Coffee Flower-Visiting and Trap-Nesting Bees and Wasps
ALEXANDRA-MARIA KLEIN,*‡ INGOLF STEFFAN-DEWENTER,* DAMAYANTI BUCHORI,† AND TEJA TSCHARNTKE*
*Agroecology, University of Göttingen, Waldweg 26, D-37073 Göttingen, Germany†Department of Pest and Plant Disease, Jl. Raya Pajajaran, IPB Bogor 16144, Indonesia
Abstract:
Tropical landscapes are dominated by agroecosystems, and most species that survive in forest rem-nants interact with these agroecosystems. The potential value of agroecosystems for aiding species survival isoften ignored. Essential ecosystem services may suffer when functional groups such as pollinators and preda-tors are affected by land use. We used agroforestry systems differing in land-use intensity to examine flower-visiting bees on coffee plants and the community structure of trap-nesting bees and wasps and their naturalenemies. The number and abundance of all species of coffee-visiting bees did not show a significant correla-tion with land-use intensity. The abundance (but not the number of species) of solitary bees increased withland-use intensity, whereas the abundance and number of species of social bees significantly decreased. In afurther experiment, abundance and number of trap-nesting species increased with land-use intensity. Theseresults contrast with the common expectation that intensively used agroforestry systems are characterizedonly by loss of species. Furthermore, they support the idea that many nonpest and beneficial insect speciesmay even profit from agricultural land use. Parasitism and predation of trap-nest inhabitants did not changewith land-use intensity, but species diversity (number of enemy species) and ecological function (mortality)were correlated.
Efectos de la Intensidad del Uso del Suelo en Sistemas Agroforestales Tropicales sobre las Abejas y Avispas queVisitan las Flores del Café
Resumen:
Los sistemas tropicales son dominados por agro-ecosistemas y la mayoría de las especies que so-breviven en los remanentes intactos de bosque interactúan con estos agro-ecosistemas. El valor potencial delos agro-ecosistemas para ayudar a las especies a sobrevivir es frecuentemente ignorado. Los servicios esen-ciales de los ecosistemas pueden sufrir cuando grupos funcionales, tales como los polinizadores y los depreda-dores, son afectados por el uso del suelo. Empleamos sistemas agroforestales que difieren en su intensidad deuso para examinar abejas visitadoras de flores en plantas de café y la estructura de la comunidad de abejasque anidan en trampas y avispas y sus enemigos naturales. El número y abundancia de todas las especies deabejas visitadoras de café no mostraron una correlación significativa con la intensidad de uso del suelo. Laabundancia (pero no el número de especies) de abejas solitarias incrementó con una baja intensidad de usodel suelo, mientras que el número de especies y la abundancia de abejas sociales disminuyó significativa-mente. En otro experimento, la abundancia y el número de especies que anidan en trampas incrementó conla intensidad de uso del suelo. Estos resultados se contrastan con lo esperado normalmente que supone quelos sistemas agroforestales usados intensivamente se caracterizan únicamente por la pérdida de especies.Más aún, los datos apoyan la idea de que muchas especies de insectos que no son plagas y de insectos benéfi-cos podrían beneficiarse del uso agrícola del suelo. El parasitismo y la depredación de los ocupantes de tram-pas no cambiaron con la intensidad de uso del suelo, pero la diversidad de especies (número de especies ene-
migas) y la función ecológica (mortalidad) estaban correlacionados.
‡
email [email protected] submitted November 21, 2000; revised manuscript accepted September 5, 2001.
1004
Land-Use Effects on Bees and Wasps Klein et al.
Conservation BiologyVolume 16, No. 4, August 2002
Introduction
Tropical landscapes are characterized by agroecosystemsand expanding land use, so rainforest is often only patch-ily distributed in them (Schelhas & Greenberg 1996; Lau-rance & Bierregaard 1997). Efforts to preserve biodiver-sity have been focused primarily on the remaining areasof natural ecosystems (Tuomisto et al. 1995; Dyer & Le-tourneau 1999; Moguel & Toledo 1999), but only 5% ofthe terrestrial environment is unmanaged and uninhab-ited (Western & Pearl 1989). Thus, most species that sur-vive in forest remnants interact with agricultural systems,but the contribution of management type to species sur-vival is often ignored, as is the potential value of agroeco-systems for conservation (Pimentel et al. 1992; Perfectoet al. 1996, 1997; Power 1996; Watt et al. 1997; Power &Flecker 2000). Traditional land-use systems such as agro-forestry (Nair 1993) are characterized by high vegeta-tional diversity, and these traditional systems can main-tain surprisingly high levels of biodiversity (Pimentel etal. 1992). Traditionally, coffee is grown under a canopyof shade trees. Due to the structural and floristic com-plexity of the shade trees, such coffee ecosystems maysupport relatively high biodiversity (Perfecto et al. 1996,1997; Moguel & Toledo 1999; Greenberg et al. 2000).
The lowland coffee
Coffea canephora
Pierre ex Froeh-ner, syn.
Coffea robusta
, is an important cash crop. Al-though this species produces lower-quality coffee than
C.arabica
, it is able to grow at lower elevations and hashigher resistance to some pests and diseases (Willmer &Stone 1989; Rehm & Espig 1995). Because
C. canephora
isself-sterile and pollinated by bees (Willmer & Stone 1989),the coffee yields depend on pollination (Free 1993). Abun-dance and diversity of bees are known to be associated withfrequency of flower visitation, pollination, and seed set( Free 1993; Rathcke & Jules 1993; Aizen & Feinsinger1994
a
, 1994
b
; Steffan-Dewenter & Tscharntke 1999).Flower visitation rate is often a good predictor of pollinationsuccess, as is the abundance and number of trap-nestingbees (Tscharntke et al. 1998), whereas trap-nesting waspsmay be important enemies of pest insects (Harris 1994).
We studied the abundance and number of social andsolitary bees and wasps in agroforestry systems of theprovince Central Sulawesi. We observed flower-visitingbees on coffee and exposed standardized nesting trapsfor solitary bees and wasps, because trap-nesting bees andwasps are known to be bioindicators sensitive to envi-ronmental change (Tscharntke et al. 1998). We testedtwo hypotheses with respect to the influence of land-useintensity on these insect communities: (1) traditional, ex-tensively managed agroforestry systems support a highernumber of bees and wasps than intensively managed agro-forestry systems, and (2) land-use intensity does not af-fect all bee and wasp species equally, and some habitatgeneralists or species that prefer open habitats may evenprofit from intensive management.
Methods
Study Area and Experimental Sites
Our study was carried out at the border of the Lore-LinduNational Park in Central Sulawesi, 60 km away from thenearest city, Palu, from October 1998 to March 1999.Normally, these months are part of the rainy season, butduring the study period they were unusually dry due tothe effects of La Niña, which causes unusually cold anddry ocean temperatures in the equatorial Pacific. TheLore-Lindu National Park is characterized by a tropicalmonsoon climate with an annual rainfall of 2000–3000mm (World Wildlife Fund 1981). Seasonal temperatureranges from 17
�
to 35
�
C and the seasonal relative hu-midity from 77% to 85% (1998 draft final report of theCentral Sulawesi Integrated Area Development and Con-servation Project).
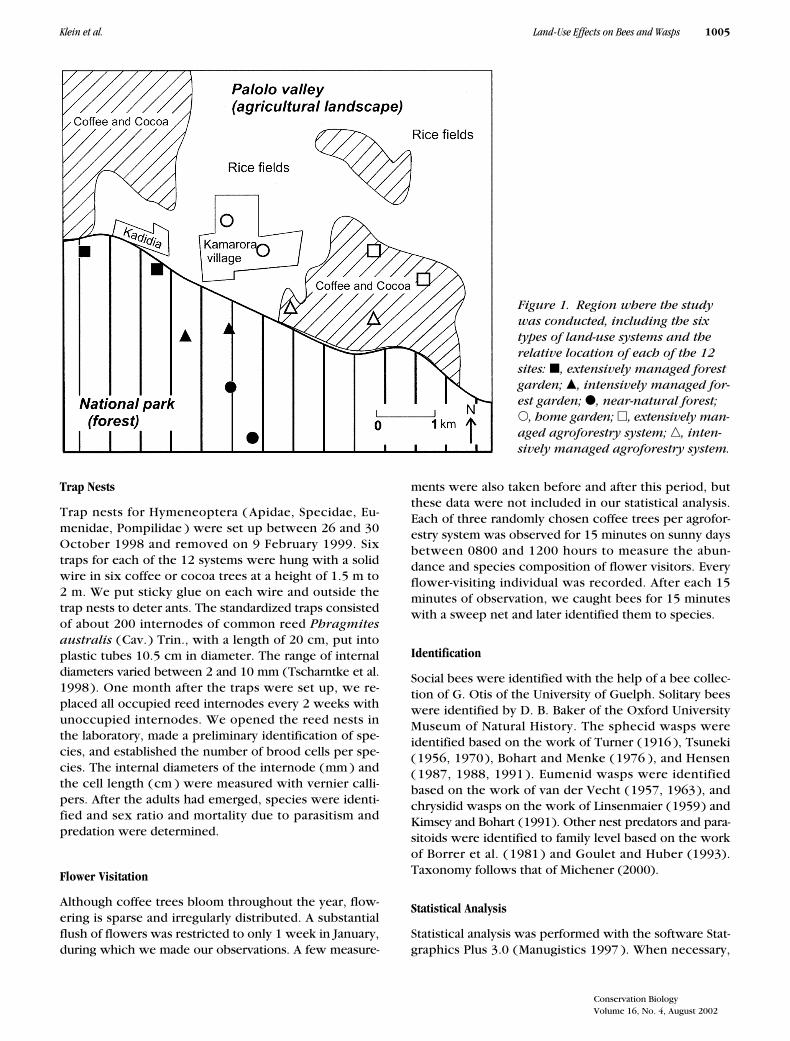
The environment of the national park is character-ized by extensively managed agroforestry systems (Nair1993; 1998) dominated by coffee and cocoa. We selected12 agroforestry systems, six types with two replicateseach, on a gradient of land-use intensity with a mini-mum size of 0.5 ha and a minimum distance of 500 mbetween each study system. We did not include opensun monocultures as the extreme. Half the systems werelocated outside the forest ( intensively used 2-year-oldagroforestry systems, extensively used 4- to 5-year-old agro-forestry systems, 8-year-old home gardens) and the otherhalf was located inside the forest ( extensively and in-tensively managed forest gardens and near-naturalforest) (Fig. 1).
Habitat Parameters
Abiotic and biotic habitat parameters were character-ized for each of the 12 agroforestry systems. The threeabiotic parameters were temperature (
�
C), relative hu-midity (%), and day-light intensity (lux). Each parameterwas measured three times per system under standard-ized conditions (1.5 m above ground for temperature andhumidity, on the ground for the light intensity, on sunnydays, 8–10 a.m.). The vegetation was mapped within twodifferent 10-m
2
plots for herbs and two different 100-m
2
plots for shrubs and trees per study system. We esti-mated the incidence (in percent) of every species insidethe plots. We also estimated for each system mean val-ues for the following biotic parameters inside the plots:percent vegetation cover; mean height of vegetationseparately for trees, shrubs, and herbs; and percentageof cover of dead organic material on the ground, such asdead branches and leaves. The percent cover of flower-ing coffee plants was recorded for each study system inone 100-m
2
plot, while we sampled the flower-visitingbees, to quantify the resources available to bees.
Conservation BiologyVolume 16, No. 4, August 2002
Klein et al. Land-Use Effects on Bees and Wasps
1005
Trap Nests
Trap nests for Hymeneoptera ( Apidae, Specidae, Eu-menidae, Pompilidae ) were set up between 26 and 30October 1998 and removed on 9 February 1999. Sixtraps for each of the 12 systems were hung with a solidwire in six coffee or cocoa trees at a height of 1.5 m to2 m. We put sticky glue on each wire and outside thetrap nests to deter ants. The standardized traps consistedof about 200 internodes of common reed
Phragmitesaustralis
(Cav.) Trin., with a length of 20 cm, put intoplastic tubes 10.5 cm in diameter. The range of internaldiameters varied between 2 and 10 mm (Tscharntke et al.1998). One month after the traps were set up, we re-placed all occupied reed internodes every 2 weeks withunoccupied internodes. We opened the reed nests inthe laboratory, made a preliminary identification of spe-cies, and established the number of brood cells per spe-cies. The internal diameters of the internode (mm ) andthe cell length (cm ) were measured with vernier calli-pers. After the adults had emerged, species were identi-fied and sex ratio and mortality due to parasitism andpredation were determined.
Flower Visitation
Although coffee trees bloom throughout the year, flow-ering is sparse and irregularly distributed. A substantialflush of flowers was restricted to only 1 week in January,during which we made our observations. A few measure-
ments were also taken before and after this period, butthese data were not included in our statistical analysis.Each of three randomly chosen coffee trees per agrofor-estry system was observed for 15 minutes on sunny daysbetween 0800 and 1200 hours to measure the abun-dance and species composition of flower visitors. Everyflower-visiting individual was recorded. After each 15minutes of observation, we caught bees for 15 minuteswith a sweep net and later identified them to species.
Identification
Social bees were identified with the help of a bee collec-tion of G. Otis of the University of Guelph. Solitary beeswere identified by D. B. Baker of the Oxford UniversityMuseum of Natural History. The sphecid wasps wereidentified based on the work of Turner (1916 ), Tsuneki(1956, 1970), Bohart and Menke (1976 ), and Hensen( 1987, 1988, 1991 ). Eumenid wasps were identifiedbased on the work of van der Vecht (1957, 1963), andchrysidid wasps on the work of Linsenmaier (1959) andKimsey and Bohart (1991). Other nest predators and para-sitoids were identified to family level based on the workof Borrer et al. ( 1981 ) and Goulet and Huber (1993).Taxonomy follows that of Michener (2000).
Statistical Analysis
Statistical analysis was performed with the software Stat-graphics Plus 3.0 (Manugistics 1997 ). When necessary,
Figure 1. Region where the study was conducted, including the six types of land-use systems and the relative location of each of the 12 sites: �, extensively managed forest garden; �, intensively managed for-est garden; �, near-natural forest; �, home garden; �, extensively man-aged agroforestry system; �, inten-sively managed agroforestry system.

1006
Land-Use Effects on Bees and Wasps Klein et al.
Conservation BiologyVolume 16, No. 4, August 2002
logarithmic or square-root-transformed variables were usedto achieve a normal distribution. The habitat parameterswere closely intercorrelated, so we used a factor analysisto express covariation of the parameters (Sokal & Rohlf1995). Pearson correlations were used for the analysis ofnormally distributed data, and Spearman rank correla-tions were used for non-normal distributed data (Sokal &Rohlf 1995). For further analyses of habitat use, we usedgeneral linear models. To estimate the number of beespecies based on equal sample size, we calculated for ev-ery land-use type the rarefaction algorithm by Hurlbert andSimberloff, as follows (Krebs 1989; Achtziger et al. 1992):
where
E
(
n
) is the expected number of species in a ran-dom sample of
n
individuals,
S
is the total number ofspecies in the entire collection,
N
i
is the number of indi-viduals in species
I
;
N
is the total number of individualsin collection (i.e.,
Ε
N
i
),
n
is the number of individualschosen for standardization (
n
�
N
); and
is the number of combinations of
n
individuals that canbe chosen from a set of
N
individuals (
N
!/
n
! (
N
�
n
)!).
Results
Land-use Intensity
The abiotic habitat parameters ( relative humidity, day-light intensity, temperature) and the biotic habitat pa-rameters influencing these abiotic parameters (percentcanopy cover, average height of the trees, and percentcover of dead organic material) were highly intercorre-lated ( Table 1 ). Because of the close correlation be-tween the habitat parameters, multiple regressions or
E Sn( ) 1
N Ni–n
Nn
---------------------– ,
i 1–
s
∑=
S
N
n
general linear models could not be used to separate thepossible effects of single parameters. Therefore, we usedfactor analysis to condense the biotic and abiotic param-eters to only one factor. We called the index that re-sulted from factor analyses of the six habitat parameters“land-use intensity.”
The agroforestry systems outside the forests were ob-viously characterized by intense land use, because thesesystems were established after a complete clearing ofthe forest. It was only afterward that shade trees andcrops were planted, whereas in the forest gardens cropswere planted beneath primary trees. In completely re-planted agroforestry systems, the trees were shorter andless dense, so temperature and day-light intensity werehigher and relative humidity lower than in the systemsinside the forest. In the intensively managed systems, hu-mans had regularly burned dead organic material, whereasin the forest gardens at most a few dead branches hadbeen collected. Inside the near-natural forest character-ized by a high and dense canopy, little burning tookplace because dead branches usually decayed and hu-man land use was almost absent.
We ordered the following sequence of agroforestrysystems and near-natural systems with respect to de-creasing land-use intensity: (1) near-natural forest, (2)extensively managed forest garden, (3) intensively man-aged forest garden, (4) home garden, (5) extensively man-aged agroforestry system, (6) and intensively managedagroforestry system (Fig. 2). Land-use intensity was neg-atively correlated with the number of tree species (
r
2
�
0.84,
n
�
12,
p
�
0.001) but not with total number ofplant species. In the following evaluations we used land-use intensity as a predictor variable for the communitiesof flower-visiting and trap-nesting bees and wasps andtheir natural enemies.
Trap-Nesting Bees and Wasps and Their Natural Enemies
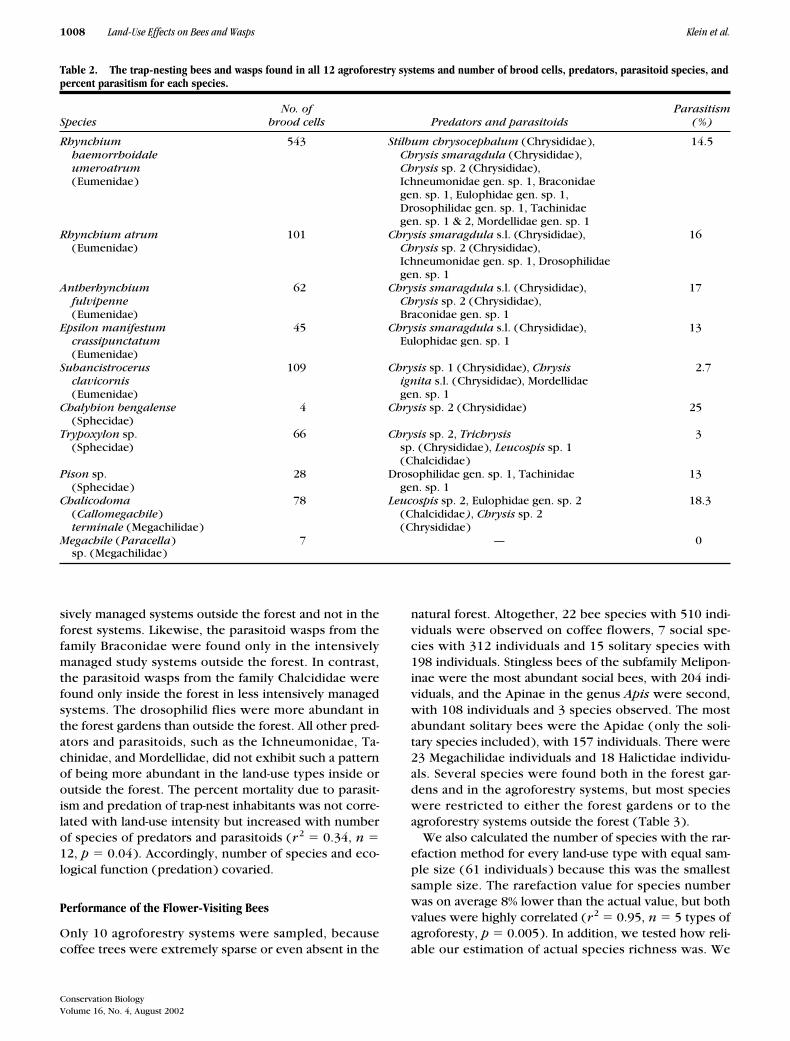
Altogether 26 species were reared from trap nests, in-cluding 2 bee species, 8 wasp species, and 16 species oftheir natural enemies (Table 2). The eumenid wasps were
Table 1. Correlation
a
matrix based on simple linear regression between the abiotic and biotic habitat parameters measured in all agro- forestry systems.
b
Land-useintensity
c
Canopycover(%)
Height oftrees(m)
Relativehumidity
(%)
Day-lightintensity
(Lux)Temperature
(
�
C)
Canopy cover (%) 0.79** — — — — —Height of trees (m) 0.96*** 0.63* — — — —Relative humidity (%)
�
0.95*** 0.72** 0.88*** — — —Day-light intensity (Lux) 0.81**
�
0.85***
�
0.77**
�
0.63* — —Temperature (
�
C) 0.89***
�
0.57*
�
0.86***
�
0.90*** 0.62* —Dead organic materials (%)
�
0.90*** 0.49 n.s. 0.93*** 0.87*** 0.61* 0.83***
a
Pearson correlation coefficient
(r
p
)
.
b
Significance,
*p
�
0.05;
**p
�
0.01;
***p
�
0.001;
n
�
12 study systems.
c
Factor analyses based on six habitat parameters.

Conservation BiologyVolume 16, No. 4, August 2002
Klein et al. Land-Use Effects on Bees and Wasps
1007
most diverse and abundant, with 860 individuals (83% ofall) and 5 species. The sphecid wasps included 98 indi-viduals (9%) and 3 species, and the megachilid bees 85individuals (8%) and 2 species.
The eumenid wasps appeared to prefer nesting sitesoutside the forest, because we found only 22% of alleumenid individuals in the forest gardens and no nests atall in the natural forest. So the abundance of eumenidwasps was positively correlated with the land-use inten-sity (
r
2
�
0.67,
n
�
12,
p
�
0.001). Nests of the sphecidwasps and megachilid bees were found in all study sys-tems inside and outside the forest, and abundance did not
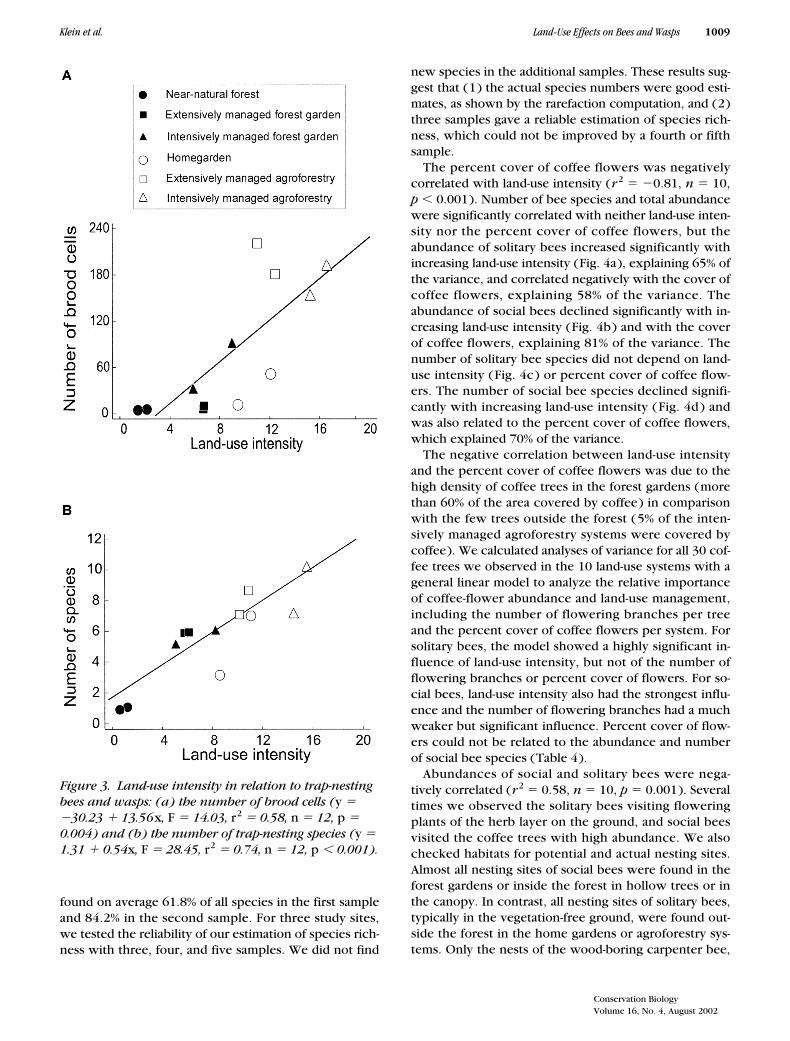
change with land use. The number of all species wasclosely correlated with the number of occupied nests(
r
2
�
0.75,
n
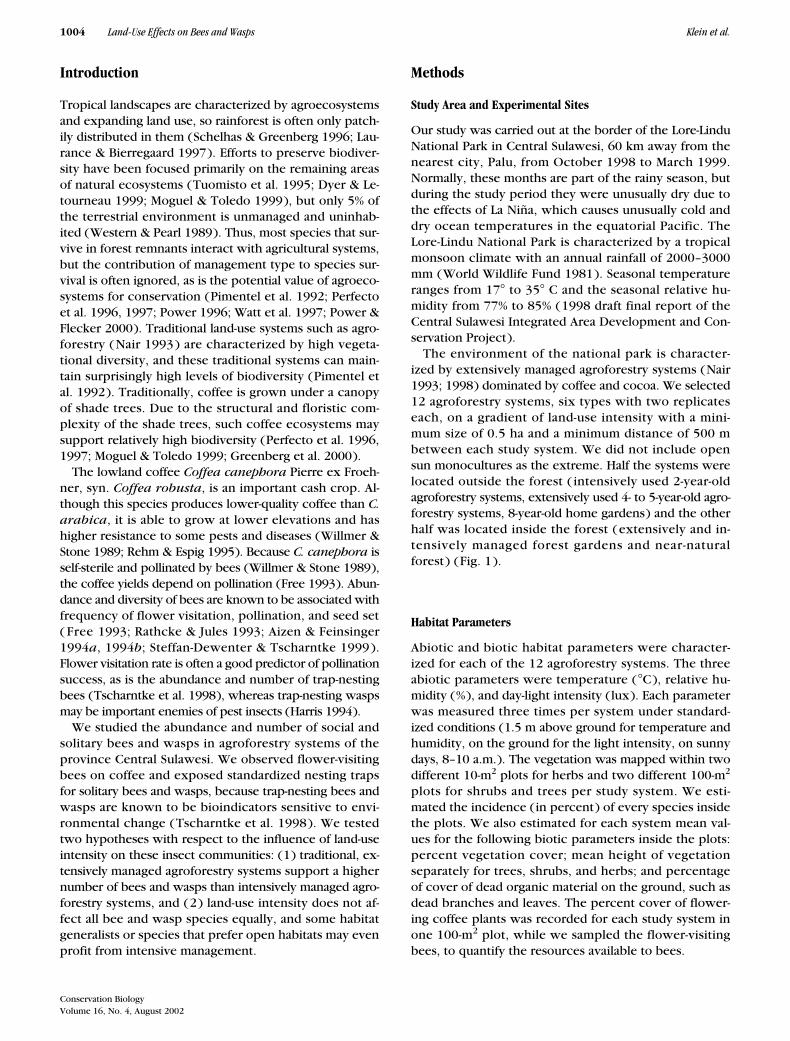
� 12, p � 0.001). Due to the dominanceof the eumenid wasps, the correlation of land-use inten-sity and abundance (number of brood cells) held for allspecies ( Fig. 3a ). The number of species in the trapnests increased with land-use intensity (Fig. 3b).
Sixteen natural enemies, including parasitoids such asichneumonid and chalcid wasps and predators such aschrysidid wasps, drosophilid flies, and mordellid bee-tles, were found in the trap nests (Table 2). The chrysi-did wasps were found only and abundantly in the inten-
Figure 2. A schematic representation of five land-use types studied, showing shade gradient, vegeta-tional complexity, height of canopy, and variety of shade and crop trees: y-axis is vegetation height in meters; filled, oval trees in the understory are coffee shrubs at different ages; empty, oval trees are cocoa trees; palm-form trees are other crops of different height and age; canopy trees are shade trees.
1008 Land-Use Effects on Bees and Wasps Klein et al.
Conservation BiologyVolume 16, No. 4, August 2002
sively managed systems outside the forest and not in theforest systems. Likewise, the parasitoid wasps from thefamily Braconidae were found only in the intensivelymanaged study systems outside the forest. In contrast,the parasitoid wasps from the family Chalcididae werefound only inside the forest in less intensively managedsystems. The drosophilid flies were more abundant inthe forest gardens than outside the forest. All other pred-ators and parasitoids, such as the Ichneumonidae, Ta-chinidae, and Mordellidae, did not exhibit such a patternof being more abundant in the land-use types inside oroutside the forest. The percent mortality due to parasit-ism and predation of trap-nest inhabitants was not corre-lated with land-use intensity but increased with numberof species of predators and parasitoids (r2 � 0.34, n �12, p � 0.04). Accordingly, number of species and eco-logical function (predation) covaried.
Performance of the Flower-Visiting Bees
Only 10 agroforestry systems were sampled, becausecoffee trees were extremely sparse or even absent in the
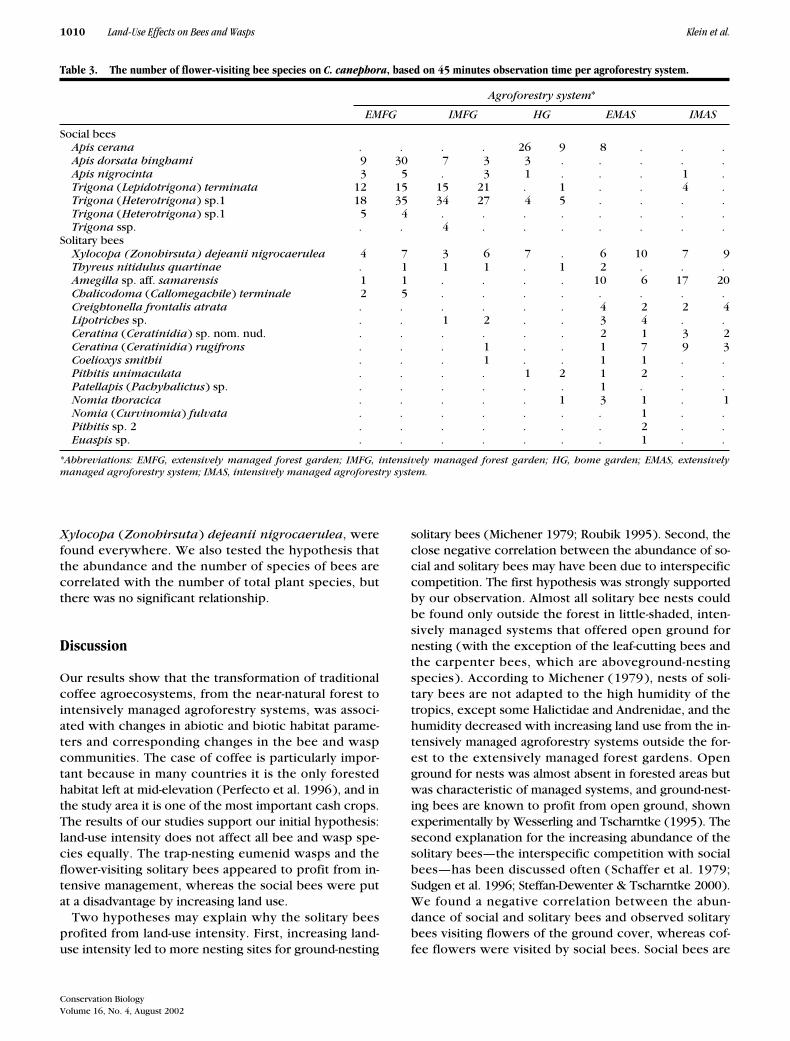
natural forest. Altogether, 22 bee species with 510 indi-viduals were observed on coffee flowers, 7 social spe-cies with 312 individuals and 15 solitary species with198 individuals. Stingless bees of the subfamily Melipon-inae were the most abundant social bees, with 204 indi-viduals, and the Apinae in the genus Apis were second,with 108 individuals and 3 species observed. The mostabundant solitary bees were the Apidae (only the soli-tary species included), with 157 individuals. There were23 Megachilidae individuals and 18 Halictidae individu-als. Several species were found both in the forest gar-dens and in the agroforestry systems, but most specieswere restricted to either the forest gardens or to theagroforestry systems outside the forest (Table 3).
We also calculated the number of species with the rar-efaction method for every land-use type with equal sam-ple size (61 individuals ) because this was the smallestsample size. The rarefaction value for species numberwas on average 8% lower than the actual value, but bothvalues were highly correlated (r2 � 0.95, n � 5 types ofagroforesty, p � 0.005). In addition, we tested how reli-able our estimation of actual species richness was. We
Table 2. The trap-nesting bees and wasps found in all 12 agroforestry systems and number of brood cells, predators, parasitoid species, and percent parasitism for each species.
SpeciesNo. of
brood cells Predators and parasitoidsParasitism
(%)
Rhynchiumhaemorrhoidaleumeroatrum(Eumenidae)
543 Stilbum chrysocephalum (Chrysididae),Chrysis smaragdula (Chrysididae),Chrysis sp. 2 (Chrysididae),Ichneumonidae gen. sp. 1, Braconidaegen. sp. 1, Eulophidae gen. sp. 1,Drosophilidae gen. sp. 1, Tachinidaegen. sp. 1 & 2, Mordellidae gen. sp. 1
14.5
Rhynchium atrum(Eumenidae)
101 Chrysis smaragdula s.l. (Chrysididae),Chrysis sp. 2 (Chrysididae),Ichneumonidae gen. sp. 1, Drosophilidaegen. sp. 1
16
Antherhynchiumfulvipenne(Eumenidae)
62 Chrysis smaragdula s.l. (Chrysididae),Chrysis sp. 2 (Chrysididae),Braconidae gen. sp. 1
17
Epsilon manifestumcrassipunctatum(Eumenidae)
45 Chrysis smaragdula s.l. (Chrysididae),Eulophidae gen. sp. 1
13
Subancistrocerusclavicornis(Eumenidae)
109 Chrysis sp. 1 (Chrysididae), Chrysisignita s.l. (Chrysididae), Mordellidaegen. sp. 1
2.7
Chalybion bengalense(Sphecidae)
4 Chrysis sp. 2 (Chrysididae) 25
Trypoxylon sp.(Sphecidae)
66 Chrysis sp. 2, Trichrysissp. (Chrysididae), Leucospis sp. 1(Chalcididae)
3
Pison sp.(Sphecidae)
28 Drosophilidae gen. sp. 1, Tachinidaegen. sp. 1
13
Chalicodoma(Callomegachile)terminale (Megachilidae)
78 Leucospis sp. 2, Eulophidae gen. sp. 2(Chalcididae), Chrysis sp. 2(Chrysididae)
18.3
Megachile (Paracella)sp. (Megachilidae)
7 — 0
Conservation BiologyVolume 16, No. 4, August 2002
Klein et al. Land-Use Effects on Bees and Wasps 1009
found on average 61.8% of all species in the first sampleand 84.2% in the second sample. For three study sites,we tested the reliability of our estimation of species rich-ness with three, four, and five samples. We did not find
new species in the additional samples. These results sug-gest that (1) the actual species numbers were good esti-mates, as shown by the rarefaction computation, and (2)three samples gave a reliable estimation of species rich-ness, which could not be improved by a fourth or fifthsample.
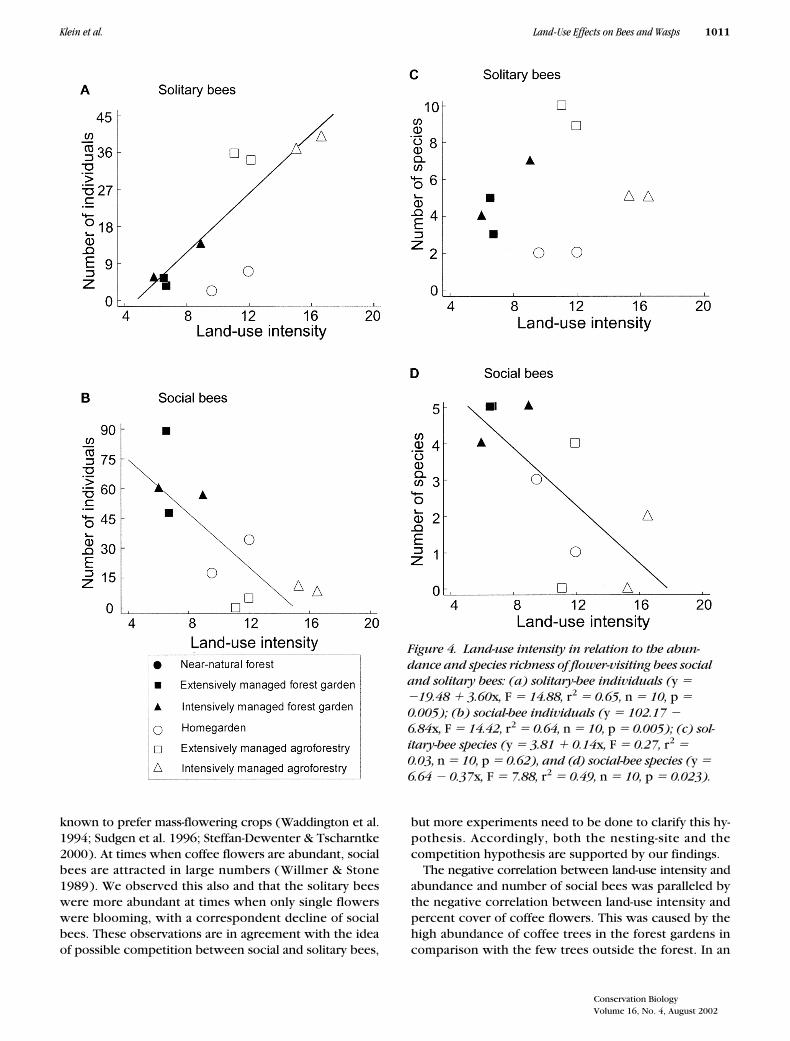
The percent cover of coffee flowers was negativelycorrelated with land-use intensity (r2 � �0.81, n � 10,p � 0.001). Number of bee species and total abundancewere significantly correlated with neither land-use inten-sity nor the percent cover of coffee flowers, but theabundance of solitary bees increased significantly withincreasing land-use intensity (Fig. 4a), explaining 65% ofthe variance, and correlated negatively with the cover ofcoffee flowers, explaining 58% of the variance. Theabundance of social bees declined significantly with in-creasing land-use intensity (Fig. 4b) and with the coverof coffee flowers, explaining 81% of the variance. Thenumber of solitary bee species did not depend on land-use intensity (Fig. 4c) or percent cover of coffee flow-ers. The number of social bee species declined signifi-cantly with increasing land-use intensity (Fig. 4d) andwas also related to the percent cover of coffee flowers,which explained 70% of the variance.
The negative correlation between land-use intensityand the percent cover of coffee flowers was due to thehigh density of coffee trees in the forest gardens (morethan 60% of the area covered by coffee) in comparisonwith the few trees outside the forest (5% of the inten-sively managed agroforestry systems were covered bycoffee). We calculated analyses of variance for all 30 cof-fee trees we observed in the 10 land-use systems with ageneral linear model to analyze the relative importanceof coffee-flower abundance and land-use management,including the number of flowering branches per treeand the percent cover of coffee flowers per system. Forsolitary bees, the model showed a highly significant in-fluence of land-use intensity, but not of the number offlowering branches or percent cover of flowers. For so-cial bees, land-use intensity also had the strongest influ-ence and the number of flowering branches had a muchweaker but significant influence. Percent cover of flow-ers could not be related to the abundance and numberof social bee species (Table 4).
Abundances of social and solitary bees were nega-tively correlated (r2 � 0.58, n � 10, p � 0.001). Severaltimes we observed the solitary bees visiting floweringplants of the herb layer on the ground, and social beesvisited the coffee trees with high abundance. We alsochecked habitats for potential and actual nesting sites.Almost all nesting sites of social bees were found in theforest gardens or inside the forest in hollow trees or inthe canopy. In contrast, all nesting sites of solitary bees,typically in the vegetation-free ground, were found out-side the forest in the home gardens or agroforestry sys-tems. Only the nests of the wood-boring carpenter bee,
Figure 3. Land-use intensity in relation to trap-nesting bees and wasps: (a) the number of brood cells (y � �30.23 � 13.56x, F � 14.03, r2 � 0.58, n � 12, p � 0.004) and (b) the number of trap-nesting species (y � 1.31 � 0.54x, F � 28.45, r2 � 0.74, n � 12, p � 0.001).
1010 Land-Use Effects on Bees and Wasps Klein et al.
Conservation BiologyVolume 16, No. 4, August 2002
Xylocopa (Zonohirsuta) dejeanii nigrocaerulea, werefound everywhere. We also tested the hypothesis thatthe abundance and the number of species of bees arecorrelated with the number of total plant species, butthere was no significant relationship.
Discussion
Our results show that the transformation of traditionalcoffee agroecosystems, from the near-natural forest tointensively managed agroforestry systems, was associ-ated with changes in abiotic and biotic habitat parame-ters and corresponding changes in the bee and waspcommunities. The case of coffee is particularly impor-tant because in many countries it is the only forestedhabitat left at mid-elevation (Perfecto et al. 1996), and inthe study area it is one of the most important cash crops.The results of our studies support our initial hypothesis:land-use intensity does not affect all bee and wasp spe-cies equally. The trap-nesting eumenid wasps and theflower-visiting solitary bees appeared to profit from in-tensive management, whereas the social bees were putat a disadvantage by increasing land use.
Two hypotheses may explain why the solitary beesprofited from land-use intensity. First, increasing land-use intensity led to more nesting sites for ground-nesting
solitary bees (Michener 1979; Roubik 1995). Second, theclose negative correlation between the abundance of so-cial and solitary bees may have been due to interspecificcompetition. The first hypothesis was strongly supportedby our observation. Almost all solitary bee nests couldbe found only outside the forest in little-shaded, inten-sively managed systems that offered open ground fornesting (with the exception of the leaf-cutting bees andthe carpenter bees, which are aboveground-nestingspecies). According to Michener (1979), nests of soli-tary bees are not adapted to the high humidity of thetropics, except some Halictidae and Andrenidae, and thehumidity decreased with increasing land use from the in-tensively managed agroforestry systems outside the for-est to the extensively managed forest gardens. Openground for nests was almost absent in forested areas butwas characteristic of managed systems, and ground-nest-ing bees are known to profit from open ground, shownexperimentally by Wesserling and Tscharntke (1995). Thesecond explanation for the increasing abundance of thesolitary bees—the interspecific competition with socialbees—has been discussed often ( Schaffer et al. 1979;Sudgen et al. 1996; Steffan-Dewenter & Tscharntke 2000).We found a negative correlation between the abun-dance of social and solitary bees and observed solitarybees visiting flowers of the ground cover, whereas cof-fee flowers were visited by social bees. Social bees are
Table 3. The number of flower-visiting bee species on C. canephora, based on 45 minutes observation time per agroforestry system.
Agroforestry system*
EMFG IMFG HG EMAS IMAS
Social beesApis cerana . . . . 26 9 8 . . .Apis dorsata binghami 9 30 7 3 3 . . . . .Apis nigrocinta 3 5 . 3 1 . . . 1 .Trigona (Lepidotrigona) terminata 12 15 15 21 . 1 . . 4 .Trigona (Heterotrigona) sp.1 18 35 34 27 4 5 . . . .Trigona (Heterotrigona) sp.1 5 4 . . . . . . . .Trigona ssp. . . 4 . . . . . . .
Solitary beesXylocopa (Zonohirsuta) dejeanii nigrocaerulea 4 7 3 6 7 . 6 10 7 9Thyreus nitidulus quartinae . 1 1 1 . 1 2 . . .Amegilla sp. aff. samarensis 1 1 . . . . 10 6 17 20Chalicodoma (Callomegachile) terminale 2 5 . . . . . . . .Creightonella frontalis atrata . . . . . . 4 2 2 4Lipotriches sp. . . 1 2 . . 3 4 . .Ceratina (Ceratinidia) sp. nom. nud. . . . . . . 2 1 3 2Ceratina (Ceratinidia) rugifrons . . . 1 . . 1 7 9 3Coelioxys smithii . . . 1 . . 1 1 . .Pithitis unimaculata . . . . 1 2 1 2 . .Patellapis (Pachyhalictus) sp. . . . . . . 1 . . .Nomia thoracica . . . . . 1 3 1 . 1Nomia (Curvinomia) fulvata . . . . . . . 1 . .Pithitis sp. 2 . . . . . . . 2 . .Euaspis sp. . . . . . . . 1 . .
*Abbreviations: EMFG, extensively managed forest garden; IMFG, intensively managed forest garden; HG, home garden; EMAS, extensivelymanaged agroforestry system; IMAS, intensively managed agroforestry system.
Conservation BiologyVolume 16, No. 4, August 2002
Klein et al. Land-Use Effects on Bees and Wasps 1011
known to prefer mass-flowering crops (Waddington et al.1994; Sudgen et al. 1996; Steffan-Dewenter & Tscharntke2000). At times when coffee flowers are abundant, socialbees are attracted in large numbers (Willmer & Stone1989). We observed this also and that the solitary beeswere more abundant at times when only single flowerswere blooming, with a correspondent decline of socialbees. These observations are in agreement with the ideaof possible competition between social and solitary bees,
but more experiments need to be done to clarify this hy-pothesis. Accordingly, both the nesting-site and thecompetition hypothesis are supported by our findings.
The negative correlation between land-use intensity andabundance and number of social bees was paralleled bythe negative correlation between land-use intensity andpercent cover of coffee flowers. This was caused by thehigh abundance of coffee trees in the forest gardens incomparison with the few trees outside the forest. In an
Figure 4. Land-use intensity in relation to the abun-dance and species richness of flower-visiting bees social and solitary bees: (a) solitary-bee individuals (y � �19.48 � 3.60x, F � 14.88, r2 � 0.65, n � 10, p � 0.005); (b) social-bee individuals (y � 102.17 � 6.84x, F � 14.42, r2 � 0.64, n � 10, p � 0.005); (c) sol-itary-bee species (y � 3.81 � 0.14x, F � 0.27, r2 � 0.03, n � 10, p � 0.62), and (d) social-bee species (y � 6.64 � 0.37x, F � 7.88, r2 � 0.49, n � 10, p � 0.023).

1012 Land-Use Effects on Bees and Wasps Klein et al.
Conservation BiologyVolume 16, No. 4, August 2002
analysis of variance including all 30 coffee trees in the10 sites, however, the abundance and number of socialbees was best explained by the intensity of land use.Cover of coffee flowers did not contribute to the expla-nation, and the number of flowering branches was ofonly minor importance. These results suggest that theabundance of social bees depends primarily on land-useintensity and only secondarily on the local performanceof the coffee trees. Distance from forest may also be animportant factor influencing bee communities (Aizen &Feinsinger 1994b). Because some of our study systemswere located within and some outside the forest, the dis-tance from forest might have been a confounding factorinfluencing the bee communities. But outside the forest,the intensively managed agroforestry systems were lo-cated nearer the forest than the house gardens and ex-tensively managed agroforestry systems. This suggeststhat land-use intensity was most important.
With respect to pollination success, it would be inter-esting to know which species of coffee pollinators weremost responsible for seed set. Willmer and Stone (1989)found in Papua New Guinea that only a single solitaryspecies was responsible for a high seed set, whereas pol-len transfer between trees is probably rather poor in so-cial bees. In a study of 24 agroforestry systems (A.-M.K.et al., unpublished data), we found that the abundanceof bees was related to fruit set of C. canephora and thatsocial bees had an important influence on pollinationsuccess.
The availability of suitable nesting sites and resources(pollen or prey insects) was related to the abiotic condi-tions of the study systems, and shade inside the habitatsappeared to be a major parameter influencing bees, wasps,and their natural enemies (Heithaus 1979; Roubik 1995).Our characterization of land-use intensity was based onabiotic parameters such as relative humidity, day-light in-tensity, and temperature, and on biotic parameters suchas percent canopy cover, height of trees, and percent
cover of dead organic material. Systems with many shadetrees provide a more diverse layer of decaying wood andleaf litter (Power 1996) and protection from rain andwind (Beer 1987). Canopy density is an important factorin the microclimate of the coffee understory (Perfectoet al. 1996; Perfecto & Vandermeer 1996) and is oftenused for indirect measurement of moisture and tempera-ture (Beer 1987). Microclimatic conditions are some ofthe most important factors in habitat changes (Lovejoyet al. 1986; Bierregaard et al. 1992; Didham et al. 1996;Turner 1996). The type of coffee system, determined bydifferent degrees of ecosystem manipulation, affects bio-logical diversity (Moguel & Toledo 1999).
The strong correlation of the number of individualsof all trap-nesting species with land-use intensity wascaused by the dominance of the eumenid wasps in theintensively managed agroforestry systems. The eu-menids were frequent: 83% of all specimens and morethan half of all eumenid individuals came from one spe-cies, Rhynchium haemorrhoidale umeroatrum. We of-ten observed this seemingly synanthropic species nest-ing inside houses in small holes between or in thewooden structures. Therefore, the high abundance oftrap-nesting species was presumably due to the availabil-ity of suitable nesting sites. Because the abundance andnumber of common pests, including harmful caterpil-lars, increases with land-use intensity (Klein et al. 2002),the eumenids should have also found large numbers ofprey in these anthropogenic habitats.
In contrast to common hypotheses that species num-bers decline with increasing land use, the number of spe-cies of the trap-nest community increased with intensityof land use. The species richness of insects and plants isoften found to correlate closely (Siemann et al. 1999)and does so in trap-nesting communities (Tscharntkeet al. 1998 ), but we could not find a correlation be-tween the species richness of trap-nesting insects orflower-visiting bees and plants. This may be due to the
Table 4. Effects of land-use intensity, flowering branches per observed tree, and percent cover of coffee flowers per agroforestry system on the abundance of social and solitary bees.*
Source of variation df MS F p
Social beesland-use intensity 4 1.93 7.63 �0.001number of flowering branches 1 1.43 5.64 0.026cover of coffee flowers per study site (%) 1 0.16 0.65 0.43residuals 24 0.25model with all variables 6 4.06 16.01 �0.001
Solitary beesland-use intensity 4 108.88 7.26 �0.001number of flowering branches 1 23.61 1.58 0.221cover of coffee flowers per study site (%) 1 5.82 0.39 0.539residuals 26 14.99model with all variables 6 117.81 7.86 �0.001
*Results of a general linear model analysis for all sources of variation and the complete model are given. We included all 30 coffee trees we ob-served in 10 sites (n � 30).

Conservation BiologyVolume 16, No. 4, August 2002
Klein et al. Land-Use Effects on Bees and Wasps 1013
use of herbicides in the study systems. Only the numberof species of the woody plants showed the expectedcorrelation with the number of species of the trap-nest-ing inhabitants and the flower-visiting bee species.
One might expect an increasing percentage of parasit-ism and predation with increasing habitat complexityand decreasing land-use intensity ( Roland & Taylor1997; Lawton et al. 1998; Menalled et al. 1999; Thies &Tscharntke 1999). In our experiments, the mortality ofthe trap-nesting bees and wasps due to parasitoids andpredators was neither correlated with the species rich-ness of plants nor with land-use intensity, so increasingprey abundance (bees and wasps) and decreasing land-use intensity appeared to have contrasting effects onpredation rates. In a parallel study with phytophagousand entomophagous insects on cocoa, predator-prey ra-tios showed the expected decrease with land-use inten-sity (Klein et al. 2002).
Studies show that land-use intensity does not affectall insects equally, which supports conclusions from in-sect studies in forested ecosystems in Sulawesi (Stork &Brendell 1990; Holloway & Stork 1991). Lawton et al.(1998) also found that the number of species does notgenerally decline with increasing habitat modificationthrough land use. With respect to biodiversity, the in-creasing abundance of eumenid wasps and solitary beeswith land-use intensity suggests that tropical agroecosys-tems may be more important for nature conservationthan previously thought.
Acknowledgments
We are grateful to M. Ohl, J. Gusenleitner, and O. Nie-huis for the identification of solitary wasps. For the iden-tification of solitary bees we thank D. B. Baker. The manu-script profited from the reviews of G. Stone, J. Kraub,C. H. Schulze, R. Greenberg, and two anonymous review-ers. We thank the guides from the Lore Lindu NationalPark, especially Palentinus Pariu, for searching the ex-perimental sites; many Indonesian smallholders for help inthe fields, and the head of the national park for the per-mission to do research inside the park. For accommoda-tion and great hospitality we thank the Palentinus familyin Kamarora as well as the Tamalagi family in Palu.
Literature Cited
Achtziger, R., U. Nigmann, and H Zwölfer. 1992. Rarefaction-Methodenund ihre Einsatzmöglichkeiten bei der zooökologischen Zustandsan-alyse und Bewertung von Biotopen. Zeitschrift für Ökologie und Na-turschutz 1:99–105.
Aizen, M. A., and Feinsinger, P. 1994a. Forest fragmentation, pollina-tion, and plant reproduction in a chaco dry forest, Argentina. Ecol-ogy 75:330–351.
Aizen, M. A., and P. Feinsinger. 1994b. Habitat fragmentation, native
insect pollinators, and feral honey bees in Argentine ‘chaco ser-rano’. Ecological Applications 4:378–392.
Beer, J. 1987. Advantages, disadvantages and desirable characteristicsof shade trees for coffee, cacao and tea. Agroforestry Systems 5:3–13.
Bierregaard, R. O., T. E. Lovejoy, V. Kapos, A. A. Dos Santos, and R. W.Hutchings. 1992. The biological dynamics of tropical rainforestfragments. BioScience 42:859–866.
Bohart, R.M., and A. S. Menke. 1976. Sphecid wasps of the world: a ge-neric revision. University of California Press, London.
Borrer, D. J., D. M. DeLong, and C. A. Triplehorn. 1981. The introduc-tion of the study of insects. Saunders College Publishing, Philadel-phia.
Didham, R. K., J. Ghazoul, N. E. Stork, and A. Davis. 1996. Insects infragmented forests: a functional approach. Trends in Ecology &Evolution 11:255–260.
Dyer, L. A, and D. K. Letourneau. 1999. Relative strengths of top-downand bottom-up forces in a tropical forest community. Oecologia119:265–274.
Free, J. B. 1993. Insect pollination of crops. Academic Press, London.Goulet, H., and J. T. Huber. 1993. Hymenoptera of the world, an iden-
tification guide to families. Centre for Land & Biological Resources,Ottawa, Ontario, Canada.
Greenberg, R., P. Bichier, A. Cruz Angon, C. MacVean, R. Perez, and E.Cano. 2000. The impact of avian insectivory on arthropods and leafdamage in some Guatemalan coffee plantations. Ecology 81:1750–1755.
Harris, A. C. 1994. Ancistrocerus gazella (Hymenoptera: Vespoidea:Eumenidae): a potentially useful biological control agent for leaf-rollers Planotortrix octo, P. excessana, Ctenopseustis oblinquana,C. herana and Epiphyas postvittana (Lepidoptera: Tortricidae) inNew Zealand. New Zealand Journal of Crop and Horticultural Sci-ence 22:235–238.
Heithaus, E. R. 1979. Community structure of Neotropical flower visit-ing bees and wasps: diversity and phenology. Ecology 60:190–220.
Hensen, R. V. 1987. Revision of the subgenus Prosuliphron van derVecht (Hymenoptera, Sphecidae). Tijdschrift voor Entomologie129:217–261.
Hensen, R. V. 1988. Revision of the nominate subgenus ChalybionDahlbom (Hymenoptera, Sphecidae) Tijdschrift voor Entomologie131:13–64.
Hensen, R. V. 1991. Review of Malesian Sphecina (Hymenoptera,Sphecidae, Sphecinae). Tijdschrift voor Entomologie 134:9–30.
Holloway, J. D., and N. E. Stork. 1991. The dimensions of biodiversity:the use of invertebrates as indicators of human impact. Pages 37–62 in D. L. Hawksworth, editor. The biodiversity of microorgan-isms and invertebrates: its role in sustainable agriculture. CAB In-ternational, Wallingford, United Kingdom.
Kimsey, L. S., and R. M. Bohart. 1991. The chrysidid wasps of theworld. Oxford University Press, Oxford, United Kingdom.
Klein, A.-M., I. Steffan-Dewenter, and T. Tscharntke. 2002. Predator-prey ratios on cocoa in a land-use gradient in Indonesia. Biodiver-sity and Conservation 11:683–693.
Krebs, C. J. 1989. Ecological methodology. Harper Collins, New York.Laurance, V. F., and R. O. Bierregaard Jr. 1997. Tropical forest rem-
nants. The University of Chicago Press, Chicago.Lawton, J. H., D. E. Bignell, B. Bolton, G. F. Bloemers, P. Eggleton, P. M.
Hammond, M. Hodda, R. D. Holt, T. B. Larsen, N. A. Mawsley, N. E.Stork, D. S. Srivastava, and A. D. Watt. 1998. Biodiversity invento-ries, indicator taxa and effects of habitat modification in tropicalforest. Nature 391:72–76.
Linsenmaier, W. 1959. Revision der Familie Chrysididae (Hymenoptera)mit besonderer Berücksichtigung der europäischen Spezies. Mitteil-ungen der Schweizerischen Entomologischen Gesellschaft 32:1–232.
Lovejoy, T. E., R. O. Bierregaard Jr., A. B. Rylands, J. R. Malcolm, C. E.Quintela, L. H. Harper, K. S. Brown, A. H. Powell, G. N. V. Powell,O. R. Schubart, and M. B. Hays. 1986. Edge and other effects of iso-lation on Amazon forest fragments. Pages 257–285 in M. E. Soulé,
1014 Land-Use Effects on Bees and Wasps Klein et al.
Conservation BiologyVolume 16, No. 4, August 2002
editor. Conservation biology: the science of scarcity and diversity.Sinauer Associates, Sunderland, Massachusetts.
Manugistics 1997. Statgraphics plus for Windows 3.0. Manugistics,Inc., Rockville, Maryland.
Menalled, F. D., P. C. Marino, S. H. Gage, and D. A. Landis. 1999. Doesagricultural landscape structure affect parasitism and parasitoid di-versity? Ecological Applications 9:634–641.
Michener, C. D. 1979. Biogeography of the bees. Annals of the Mis-souri Botanical Garden 66:278–347.
Michener, C. D. 2000. The bees of the word. The Johns Hopkins Uni-versity Press, Baltimore, Maryland.
Moguel, P., and W. M. Toledo. 1999. Biodiversity conservation in tradi-tional coffee systems of Mexico. Conservation Biology 13:11–21.
Nair, P. K. R. 1993. An introduction to agroforestry. Kluwer AcademicPublishers, Dordrecht, The Netherlands.
Nair, P. K. R. 1998. Directions in tropical agroforestry research: past,present, and future. Agroforestry-Systems 38:223–245.
Perfecto, I., and J. Vandermeer. 1996. Microclimatic changes and theindirect loss of ant diversity in a tropical agroecosystem. Oecologia108:577–582.
Perfecto, I., R. A. Rice, R. Greenberg, and M. E. Van der Voort, 1996.Shade coffee: a disappearing refuge for biodiversity. Shade coffeeplantations can contain as much biodiversity as forest habitats. Bio-Science 46:598–608.
Perfecto, I., J. Vandermeer, P. Hanson, and V. Cartin. 1997. Arthropodbiodiversity loss and the transformation of a tropical agroecosys-tem. Biodiversity and Conservation 6:935–945.
Pimentel, D., U. Stachow, D. A. Takacs, H. W. Brubaker, A. R. Dumas,J. J. Meaney, J. A. S. O’Neil, D. E. Onsi, and D. B. Corzilius. 1992.Conserving biological diversity in agricultural/forestry systems: mostbiological diversity exists in human-managed ecosystems. BioScience42:354–362.
Power, A. G. 1996. Arthropod diversity in forest patches and agroeco-systems of tropical landscapes. Pages 91–110 in J. Schelhas and R.Greenberg, editors. Forest patches in tropical landscapes. IslandPress, Washington, D.C.
Power, A. G., and A. S. Flecker. 2000. Agroecosystems and biodiver-sity. Smithsonian Institution, Washington, D.C. Available from http://natzoo.si.edu/smbe/research/cacao/power.htm (accessed May 2002).
Rathcke, B. J., and E. S. Jules. 1993. Habitat fragmentation and plant-pollinator interactions. Current Science 65:273–277.
Rehm, S., and G. Espig. 1995. Die Kulturpflanzen der Tropen und Sub-tropen. Verlag Eugen Ulmer GmbH & Co, Hohenheim, Germany.
Roland, J., and P. D. Taylor. 1997. Insect parasitoid species respond toforest structure at different spatial scales. Nature 386:710–713.
Roubik, D. W. 1995. Pollination of cultivated plants in the tropics. Ag-ricultural services bulletin 118. Food and Agriculture Organization,Rome.
Schaffer, W. M., D. J. Jensen, D. E. Hobbs, J. Gurevitch, J. R. Tood, andM. V. Schaffer. 1979. Competition, foraging energetics, and thecost of sociality in three species of bees. Ecology 60:976–987.
Schelhas, J., and R. Greenberg. 1996. Forest patches in tropical land-scapes. Island Press, Washington, D.C.
Siemann, E., J. Haarstad, and D. Tilman. 1999. Dynamics of plant and ar-thropod diversity during old field succession. Ecography 22:406–414.
Sokal, R. R., and F. J. Rohlf. 1995. Biometry: the principles and prac-tice of statistics in biological research. Freeman and Company,New York.
Steffan-Dewenter, I., and T. Tscharntke. 1999. Effects of habitat isola-tion on pollinator communities and seed set. Oecologia 121:432–440.
Steffan-Dewenter, I., and T. Tscharntke. 2000. Resource overlap andpossible competition between honey bees and wild bees in centralEurope. Oecologia 122:288–296.
Stork, N. E., and M. J. D. Brendell. 1990. Variation in the insect fauna of Su-lawesi trees with season, altitude, and forest type. Pages 173–190 inW. J. Knight and J. D. Holloway, editors. Insects and the rain forests ofSouth East Asia (Wallacea). Royal Entomological Society, London.
Sudgen, E. A., R. W. Thorp, and S. L. Buchmann. 1996. Honey bee, na-tive bee competition: focal point for environmental change andapicultural response in Australia. Bee World 77:26–44.
Thies, C., and T. Tscharntke. 1999. Landscape structure and biologicalcontrol in agroecosystems. Science 285:893–895.
Tscharntke, T., A. Gathmann, and I. Steffan-Dewenter. 1998. Bioindica-tion using trap-nesting bees and wasps and their natural enemies:community structure and interactions. Journal of Applied Ecology35:708–719.
Tsuneki, K. 1956. Die Trypoxylonen der nordöstlichen Gebiete Asiens(Hymenoptera, Sphecidae, Trypoxyloninae). Memoirs of the Fac-ulty of Liberal Arts and Education, Ser II, Natural Science 6:1–42,pl. I–IV. Fukue University, Japan.
Tsuneki, K. 1970. Gleanings on the bionomics of the East-Asiatic non-social wasps (Hymenoptera) VI. Some species of Trypoxyloninae.Etizenia 45:1–20.
Tuomisto, H., K. Ruokolainen, R. Kalliola, A. Linna, W. Danjoy, and Z.Rodriguez. 1995. Dissecting Amazonian biodiversity. Science 269:63–66.
Turner, R. E. 1916. Notes on the wasps of the genus Pison, and someallied genera. Proceedings of the Zoological Society of London 86:591–629.
Turner, J. M. 1996. Species loss in fragments of tropical rain forest: areview of the evidence. Journal of Applied Ecology 33:200–209.
van der Vecht, J. 1957. The Vespinae of the Indomalayan and Papuanareas. Zoologische Verhandlungen Leiden 34:1–83.
van der Vecht, J. 1963. Studies on Indo-Australian and East-Asiatic Eu-menidae. Zoologische Verhandlungen Leiden 60:1–116.
Waddington, K. D., P. D. Visscher, T. J. Herbert, and M. R. Richter.1994. Comparison of forager distribution from matched honeybeecolonies in suburban environments. Behavioural Ecology and So-ciobiology 35:423–429.
Watt, A. D., N. E. Stork, P. Eggleton, D. Srivastara, B. Bolton, T. B.Laren, M. J. D. Brendell, and D. E. Bignell. 1997. Impact of forestloss and regeneration on insect abundance and diversity. Pages273–286 in S. D. Watt, N. E. Stork, and M. D. Hunter, editors. For-est and insects. Chapman & Hall, London.
Wesserling, J., and T. Tscharntke. 1995. Habitat selection of bees anddigger wasps: experimental habitat management of plots. Mitteil-ungen der Deutschen Gesellschaft für allgemeine und angewandteEntomologie 9:697–701.
Western, D., and M. C. Pearl. 1989. Conservation for the twenty-firstcentury. Oxford University Press, New York.
Willmer, P. G., and G. N. Stone. 1989. Incidence of entomophilouspollination of lowland coffee (Coffea canephora): the role of leafcutter bees in Papua New Guinea. Entomologia Experimentalis etApplicata 50:113–124.
World Wildlife Fund (WWF). 1981. Lore Lindu National Park. Manage-ment plan 1981–1986. WWF, Bogor, Indonesia.