Embed Size (px)
Citation preview
National Aeronautics and Space Administration
Effects of Laser Wavelength on Ablator Testing Susan White
NASA Ames Research Center
NASA Program support: Hypersonics Entry Descent and Landing (HEDL)
Exploration Technology Development and Demonstration (ETDD) Entry Descent and Landing Technology Development Project (EDL TDP)
2014 38th Annual Conference on Composites, Materials and Structures
https://ntrs.nasa.gov/search.jsp?R=20140011553 2018-04-30T10:28:39+00:00Z
2
• Background / Motivation
• Approach
• Test Results
• Summary & Conclusions
Outline

3
Motivation: Need for Advanced TPS
NASA conducted study in 2008 to establish entry system technologies required to put 40+ metric tons* on the surface of Mars *state-of-the-art ~ 1 MT
Heritage TPS / Entry Systems (5 m, 1 MT) do not meet requirements Concepts included ablative flexible thermal protection systems (TPS)
time (sec)
Fully Margined 23 meter diameter Deployable Heat Shield 80 MT Aero Capture & Entry
100 200 300
20
40
60
80
100
120
Tota
l Hea
t Flu
x (W
/cm
2 )
Entry
Heat Flux
100 200 300
20
40
60
80
100
Inte
grat
ed H
eat L
oad
(MJ/
m2 )
Aero Capture
Entry
Integrated Heat Load
Aero Capture
DK KM
4
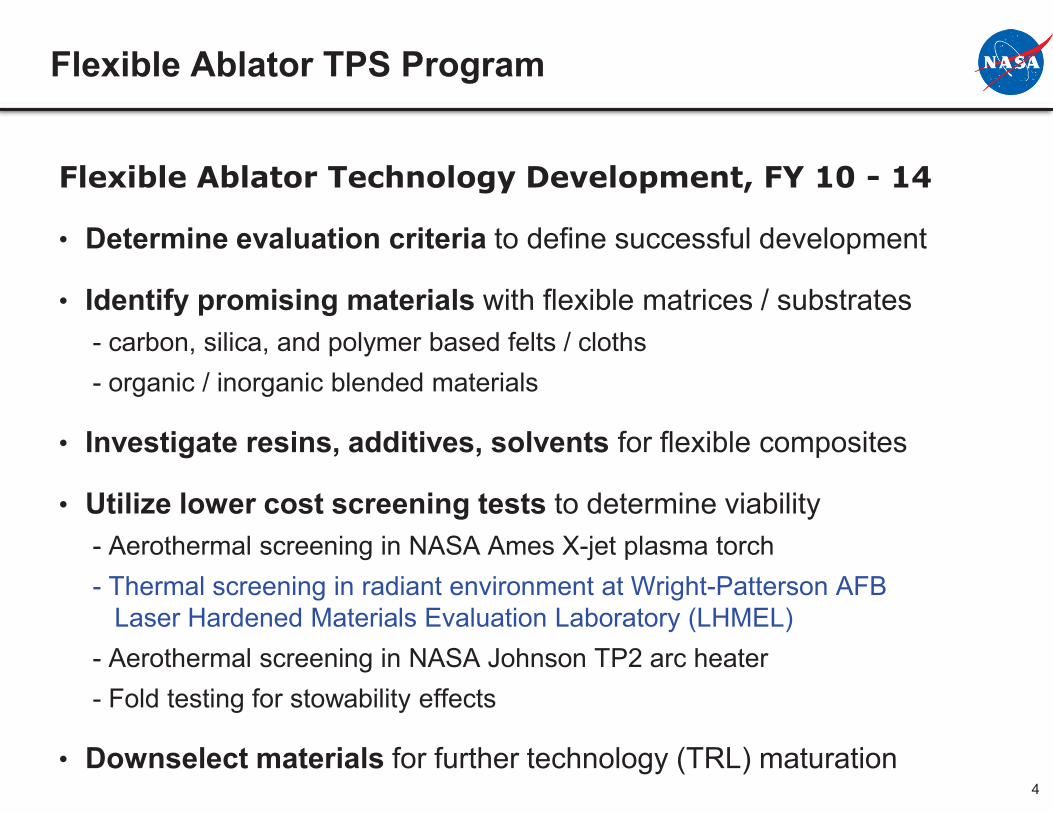
Flexible Ablator Technology Development, FY 10 - 14
• Determine evaluation criteria to define successful development
• Identify promising materials with flexible matrices / substrates - carbon, silica, and polymer based felts / cloths - organic / inorganic blended materials
• Investigate resins, additives, solvents for flexible composites
• Utilize lower cost screening tests to determine viability - Aerothermal screening in NASA Ames X-jet plasma torch - Thermal screening in radiant environment at Wright-Patterson AFB Laser Hardened Materials Evaluation Laboratory (LHMEL) - Aerothermal screening in NASA Johnson TP2 arc heater - Fold testing for stowability effects
• Downselect materials for further technology (TRL) maturation
Flexible Ablator TPS Program
5
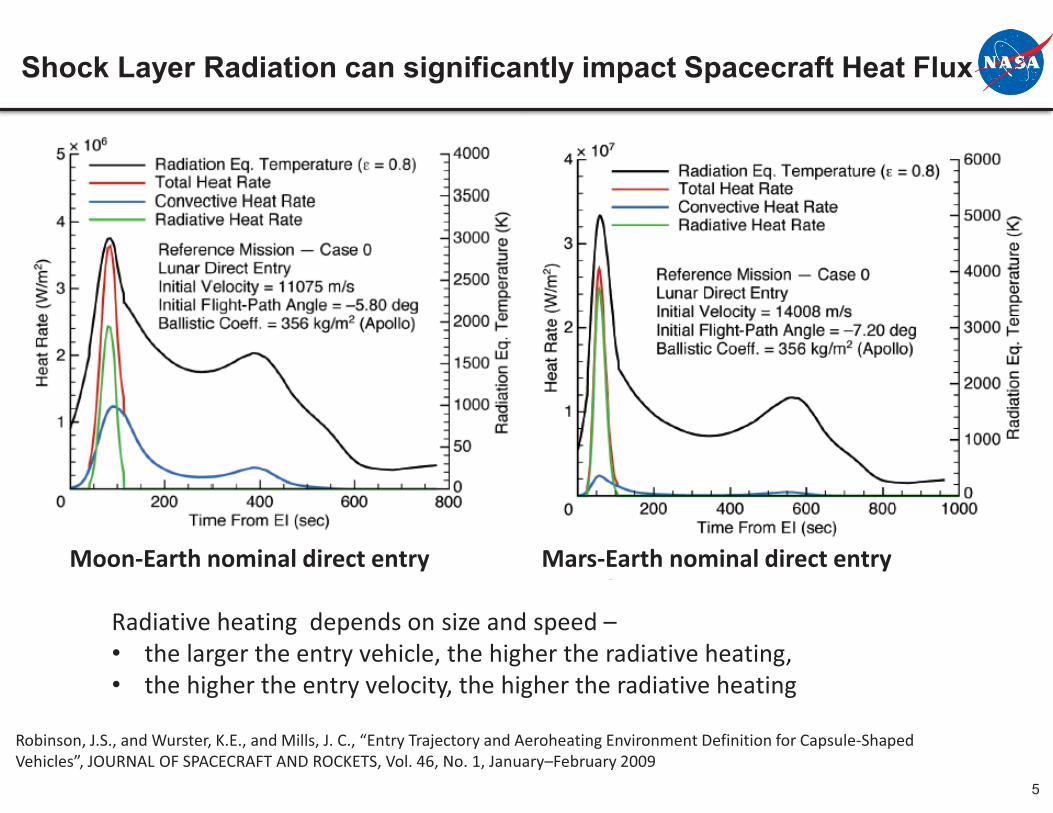
Shock Layer Radiation can significantly impact Spacecraft Heat Flux
Robinson, J.S., and Wurster, K.E., and Mills, J. C., “Entry Trajectory and Aeroheating Environment Definition for Capsule-Shaped Vehicles”, JOURNAL OF SPACECRAFT AND ROCKETS, Vol. 46, No. 1, January–February 2009
Radiative heating depends on size and speed – • the larger the entry vehicle, the higher the radiative heating, • the higher the entry velocity, the higher the radiative heating
Moon-Earth nominal direct entry Mars-Earth nominal direct entry
6
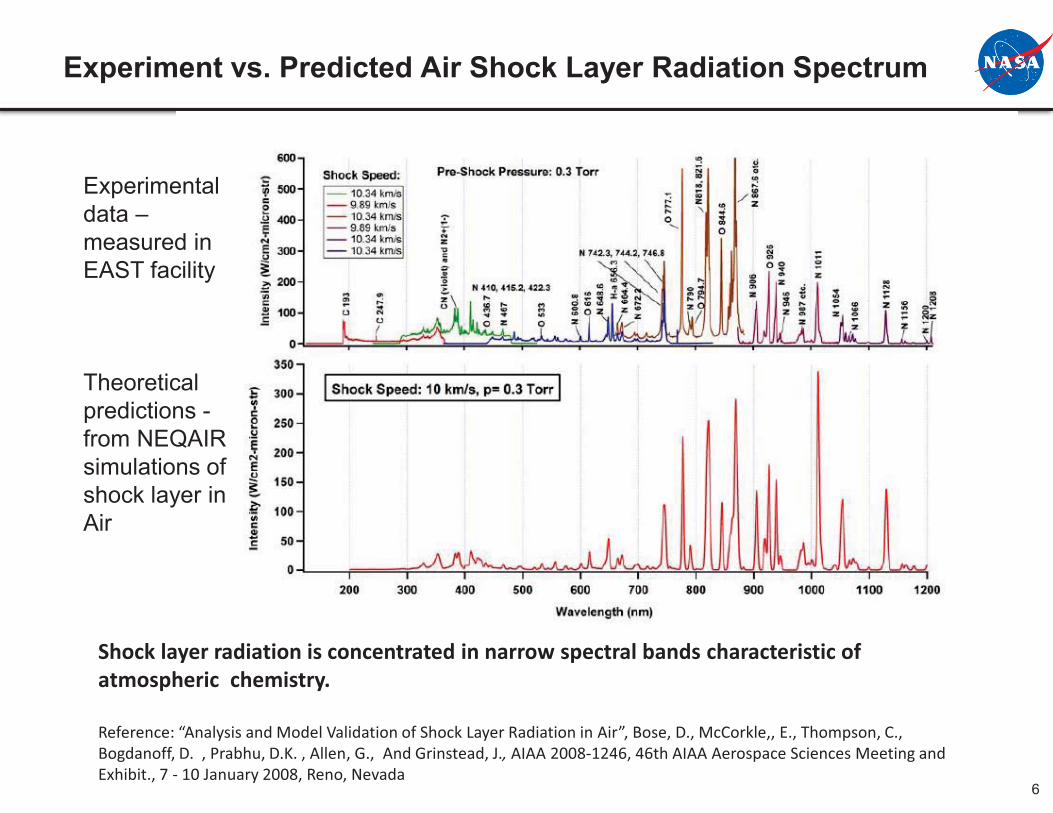
Experiment vs. Predicted Air Shock Layer Radiation Spectrum
Experimental data – measured in EAST facility Theoretical predictions - from NEQAIR simulations of shock layer in Air
Shock layer radiation is concentrated in narrow spectral bands characteristic of atmospheric chemistry. Reference: “Analysis and Model Validation of Shock Layer Radiation in Air”, Bose, D., McCorkle,, E., Thompson, C., Bogdanoff, D. , Prabhu, D.K. , Allen, G., And Grinstead, J., AIAA 2008-1246, 46th AIAA Aerospace Sciences Meeting and Exhibit., 7 - 10 January 2008, Reno, Nevada
7
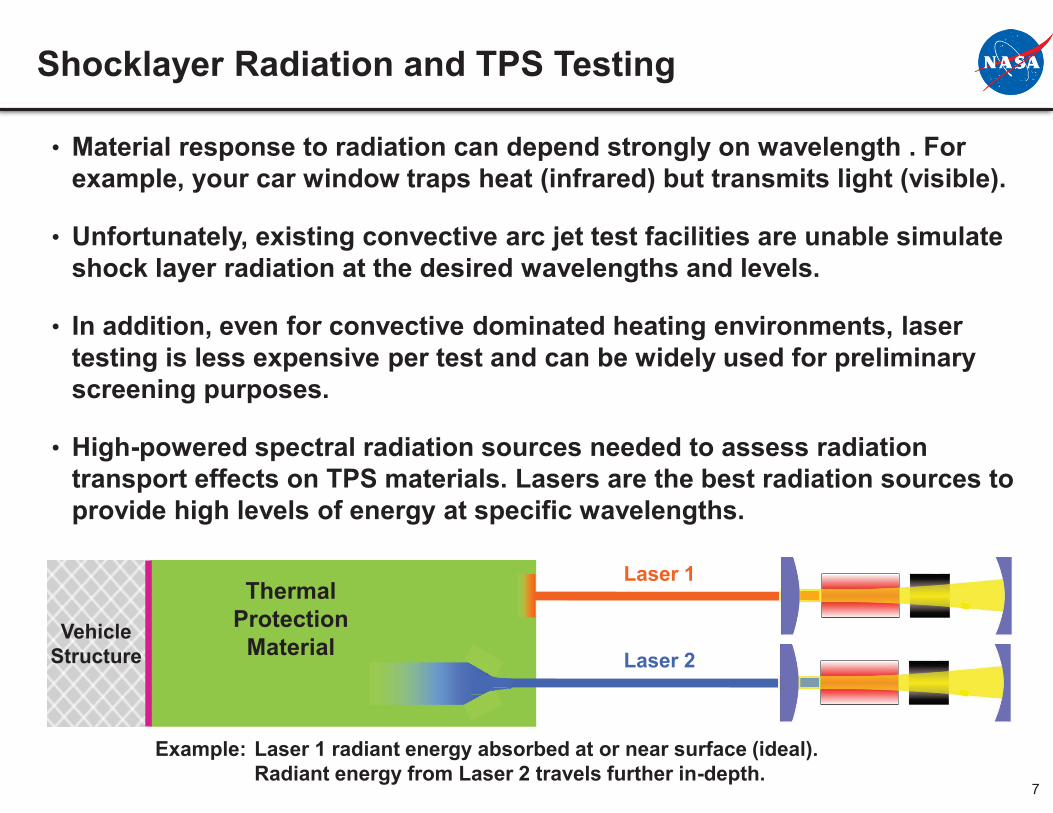
• Material response to radiation can depend strongly on wavelength . For example, your car window traps heat (infrared) but transmits light (visible).
• Unfortunately, existing convective arc jet test facilities are unable simulate shock layer radiation at the desired wavelengths and levels.
• In addition, even for convective dominated heating environments, laser testing is less expensive per test and can be widely used for preliminary screening purposes.
• High-powered spectral radiation sources needed to assess radiation transport effects on TPS materials. Lasers are the best radiation sources to provide high levels of energy at specific wavelengths.
Example: Laser 1 radiant energy absorbed at or near surface (ideal). Radiant energy from Laser 2 travels further in-depth.
Vehicle Structure
Thermal Protection
Material
Laser 1
Laser 2
Shocklayer Radiation and TPS Testing
8
• Background / Motivation
• Approach
• Test Results
• Summary & Conclusions
9
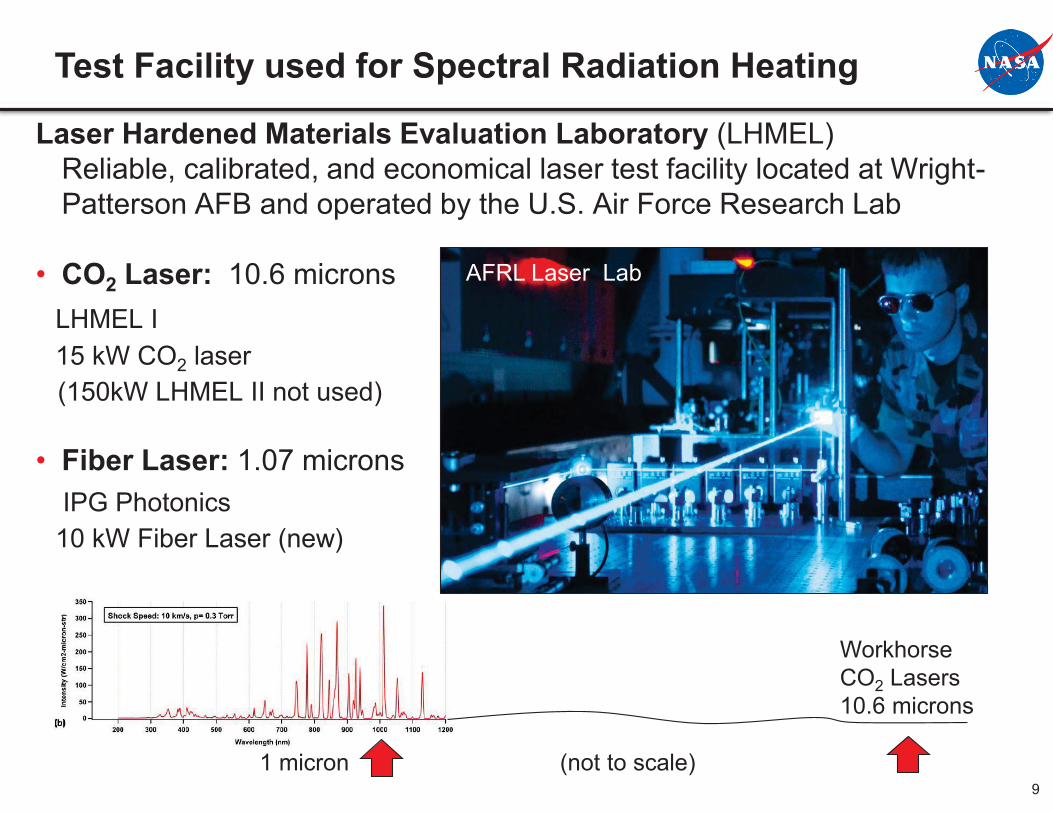
Laser Hardened Materials Evaluation Laboratory (LHMEL) Reliable, calibrated, and economical laser test facility located at Wright-Patterson AFB and operated by the U.S. Air Force Research Lab
• CO2 Laser: 10.6 microns LHMEL I 15 kW CO2 laser (150kW LHMEL II not used)
• Fiber Laser: 1.07 microns IPG Photonics 10 kW Fiber Laser (new)
AFRL Laser Lab
Test Facility used for Spectral Radiation Heating
1 micron
Workhorse CO2 Lasers 10.6 microns
(not to scale)
10
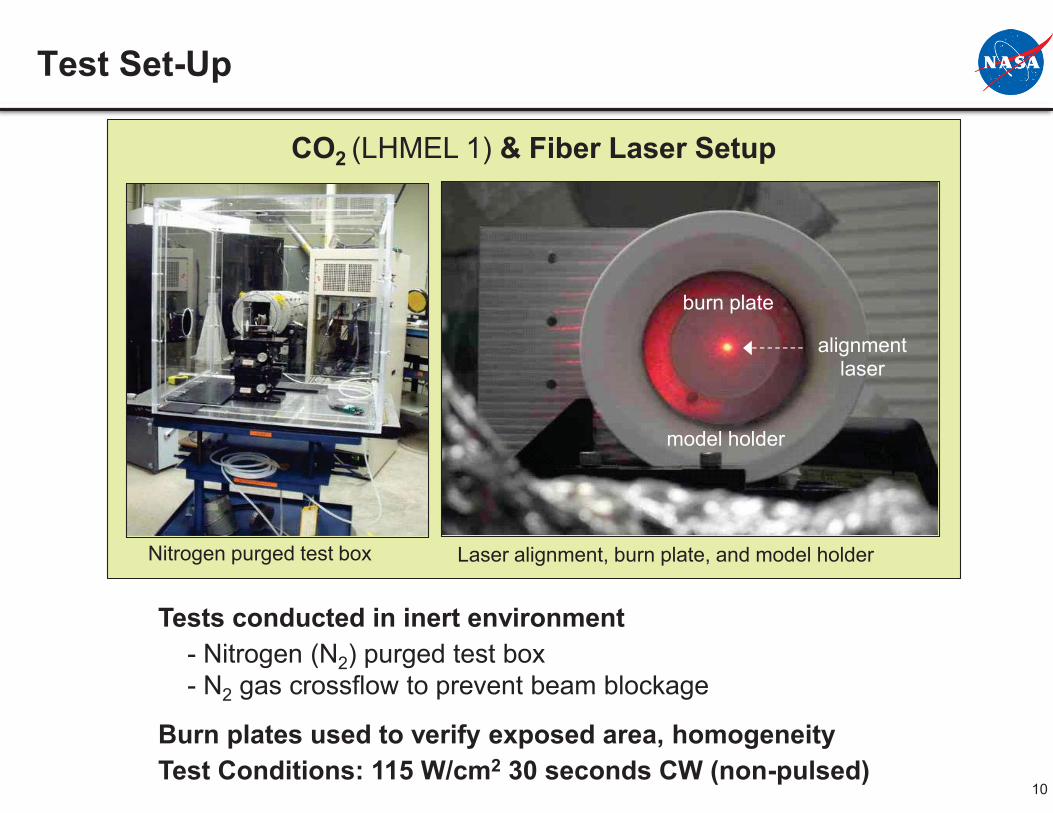
Test Set-Up
Tests conducted in inert environment - Nitrogen (N2) purged test box - N2 gas crossflow to prevent beam blockage
Burn plates used to verify exposed area, homogeneity Test Conditions: 115 W/cm2 30 seconds CW (non-pulsed)
CO2 (LHMEL 1) & Fiber Laser Setup
Nitrogen purged test box Laser alignment, burn plate, and model holder
model holder
burn plate
alignment laser
11
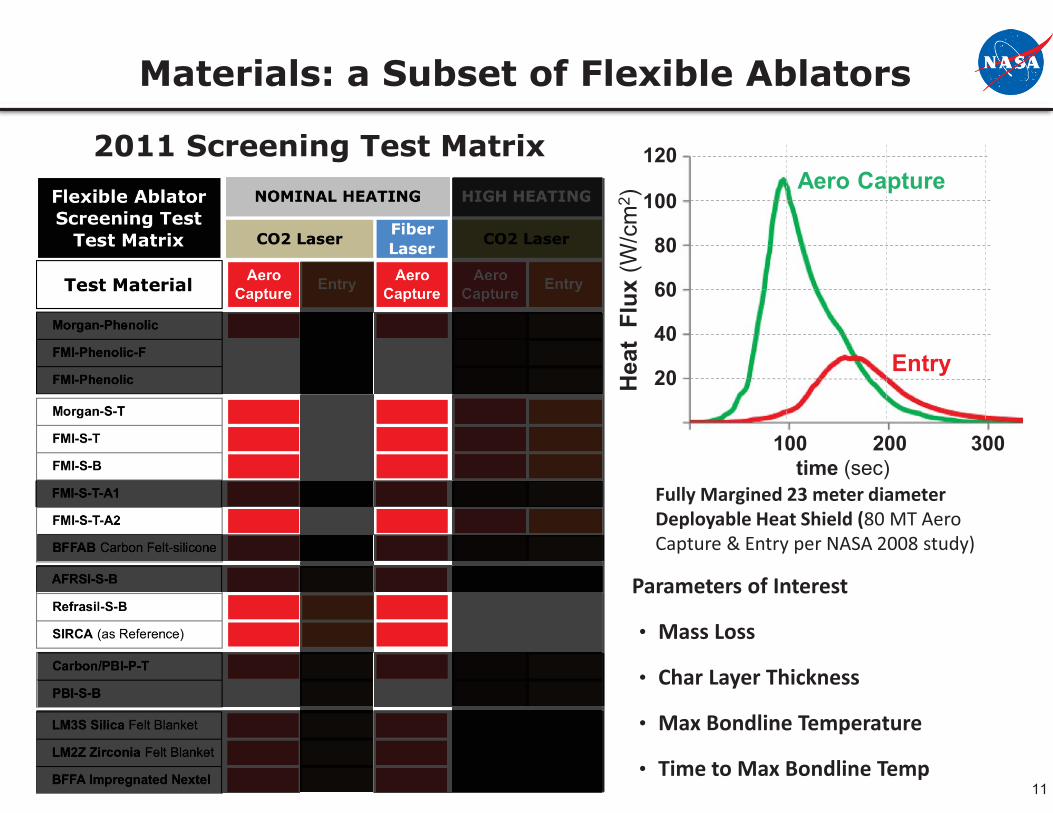
Materials: a Subset of Flexible Ablators
2011 Screening Test Matrix
Fully Margined 23 meter diameter Deployable Heat Shield (80 MT Aero Capture & Entry per NASA 2008 study)
time (sec) 100 200 300
20
40
60
80
100
120
Entry
Aero Capture
Parameters of Interest
• Mass Loss
• Char Layer Thickness
• Max Bondline Temperature
• Time to Max Bondline Temp
Hea
t Fl
ux (W
/cm
2 )
12
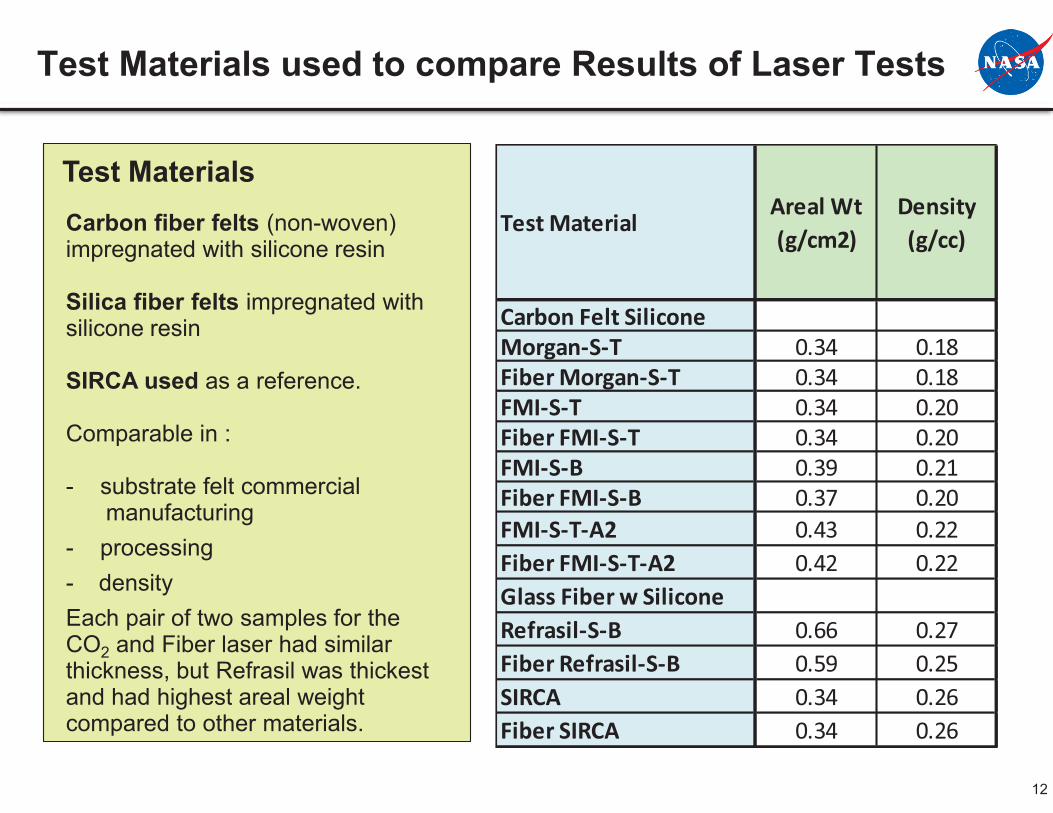
Test Materials used to compare Results of Laser Tests
• )
Carbon fiber felts (non-woven) impregnated with silicone resin
Silica fiber felts impregnated with silicone resin
SIRCA used as a reference.
Comparable in :
- substrate felt commercial manufacturing
- processing - density Each pair of two samples for the CO2 and Fiber laser had similar thickness, but Refrasil was thickest and had highest areal weight compared to other materials.
Test Materials
Test MaterialAreal Wt (g/cm2)
Density (g/cc)
Carbon Felt Silicone Morgan-S-T 0.34 0.18Fiber Morgan-S-T 0.34 0.18FMI-S-T 0.34 0.20Fiber FMI-S-T 0.34 0.20FMI-S-B 0.39 0.21Fiber FMI-S-B 0.37 0.20FMI-S-T-A2 0.43 0.22Fiber FMI-S-T-A2 0.42 0.22Glass Fiber w Silicone Refrasil-S-B 0.66 0.27Fiber Refrasil-S-B 0.59 0.25SIRCA 0.34 0.26Fiber SIRCA 0.34 0.26
13
• Background / Motivation
• Approach
• Test Results
• Summary & Conclusions
14
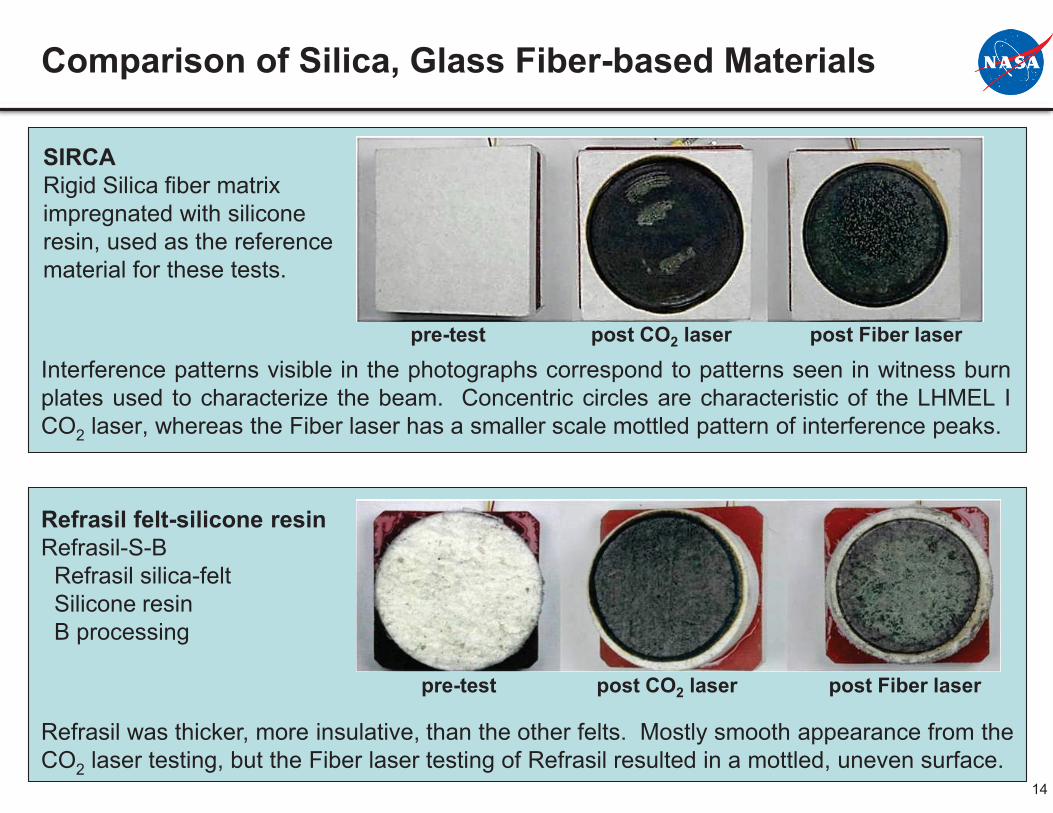
Comparison of Silica, Glass Fiber-based Materials
Refrasil was thicker, more insulative, than the other felts. Mostly smooth appearance from the CO2 laser testing, but the Fiber laser testing of Refrasil resulted in a mottled, uneven surface.
pre-test post CO2 laser post Fiber laser
Refrasil felt-silicone resin Refrasil-S-B Refrasil silica-felt Silicone resin B processing
Interference patterns visible in the photographs correspond to patterns seen in witness burn plates used to characterize the beam. Concentric circles are characteristic of the LHMEL I CO2 laser, whereas the Fiber laser has a smaller scale mottled pattern of interference peaks.
pre-test post CO2 laser post Fiber laser
SIRCA Rigid Silica fiber matrix impregnated with silicone resin, used as the reference material for these tests.
15
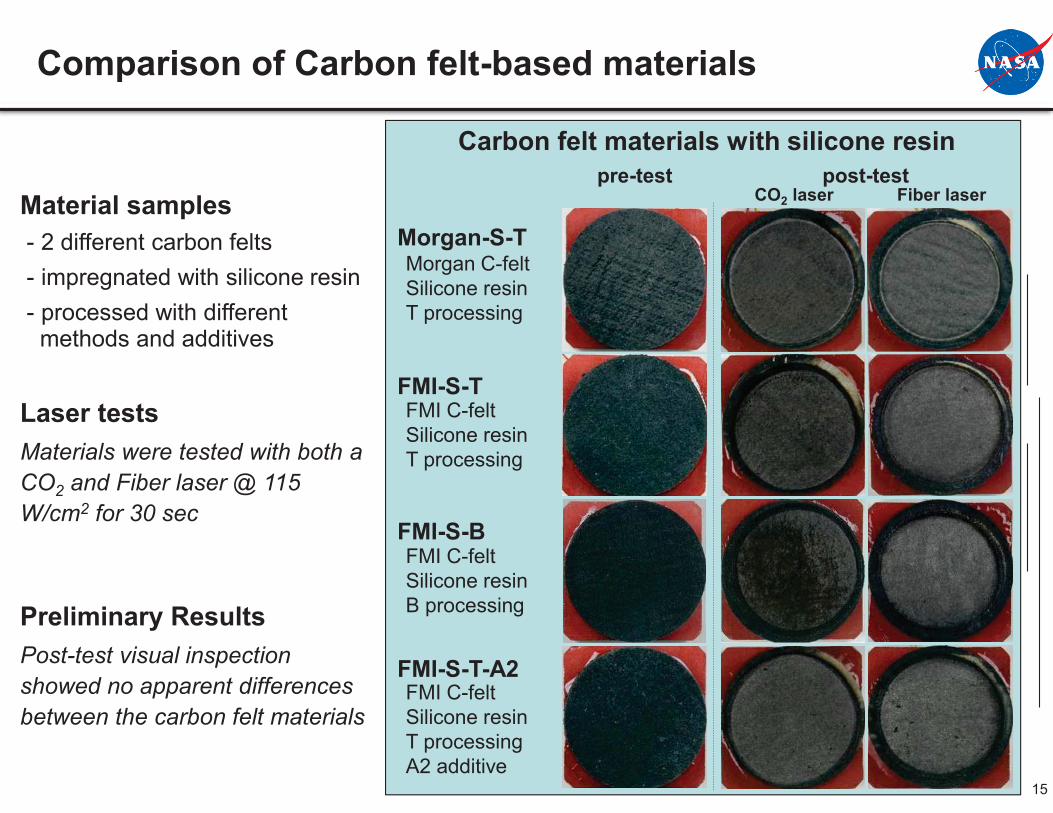
Comparison of Carbon felt-based materials
pre-test CO2 laser Fiber laser
Carbon felt materials with silicone resin
Morgan-S-T Morgan C-felt Silicone resin T processing
FMI-S-T FMI C-felt Silicone resin T processing
FMI-S-B FMI C-felt Silicone resin B processing
FMI-S-T-A2 FMI C-felt Silicone resin T processing A2 additive
Material samples - 2 different carbon felts - impregnated with silicone resin - processed with different
methods and additives
Laser tests Materials were tested with both a CO2 and Fiber laser @ 115 W/cm2 for 30 sec
Preliminary Results Post-test visual inspection showed no apparent differences between the carbon felt materials
post-test
16
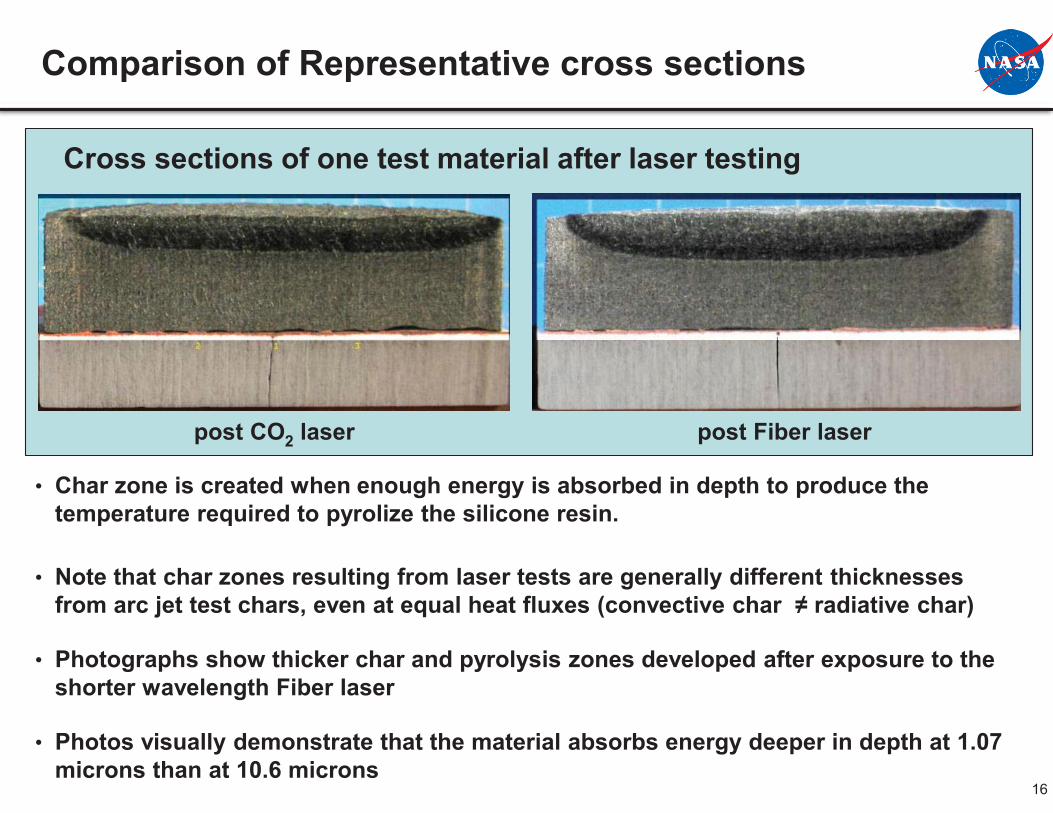
Cross sections of one test material after laser testing
post Fiber laser post CO2 laser
• Char zone is created when enough energy is absorbed in depth to produce the temperature required to pyrolize the silicone resin.
• Note that char zones resulting from laser tests are generally different thicknesses from arc jet test chars, even at equal heat fluxes (convective char ≠ radiative char)
• Photographs show thicker char and pyrolysis zones developed after exposure to the shorter wavelength Fiber laser
• Photos visually demonstrate that the material absorbs energy deeper in depth at 1.07 microns than at 10.6 microns
Comparison of Representative cross sections
17
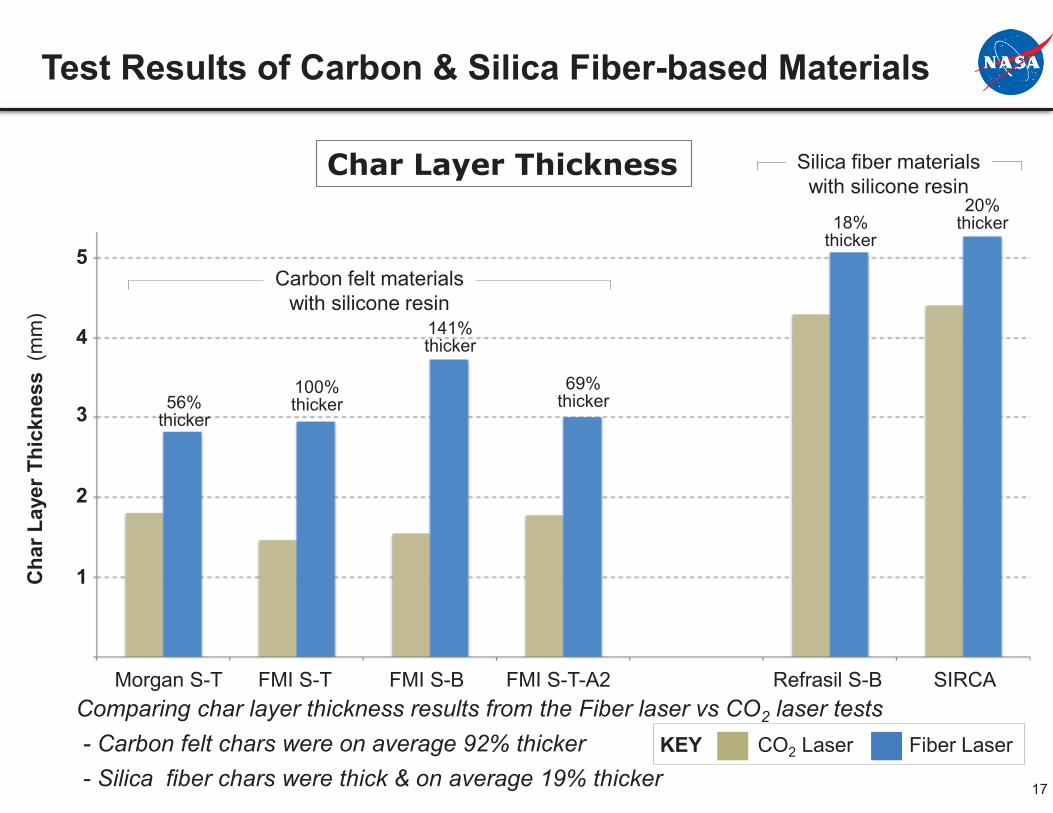
Test Results of Carbon & Silica Fiber-based Materials
Char Layer Thickness
Comparing char layer thickness results from the Fiber laser vs CO2 laser tests - Carbon felt chars were on average 92% thicker - Silica fiber chars were thick & on average 19% thicker
Cha
r Lay
er T
hick
ness
(m
m)
56% thicker
100% thicker
69% thicker
18% thicker
CO2 Laser Fiber Laser KEY
Carbon felt materials with silicone resin
Silica fiber materials with silicone resin
Morgan S-T FMI S-T FMI S-B FMI S-T-A2 Refrasil S-B SIRCA
1
2
3
4
5
20% thicker
141% thicker
18
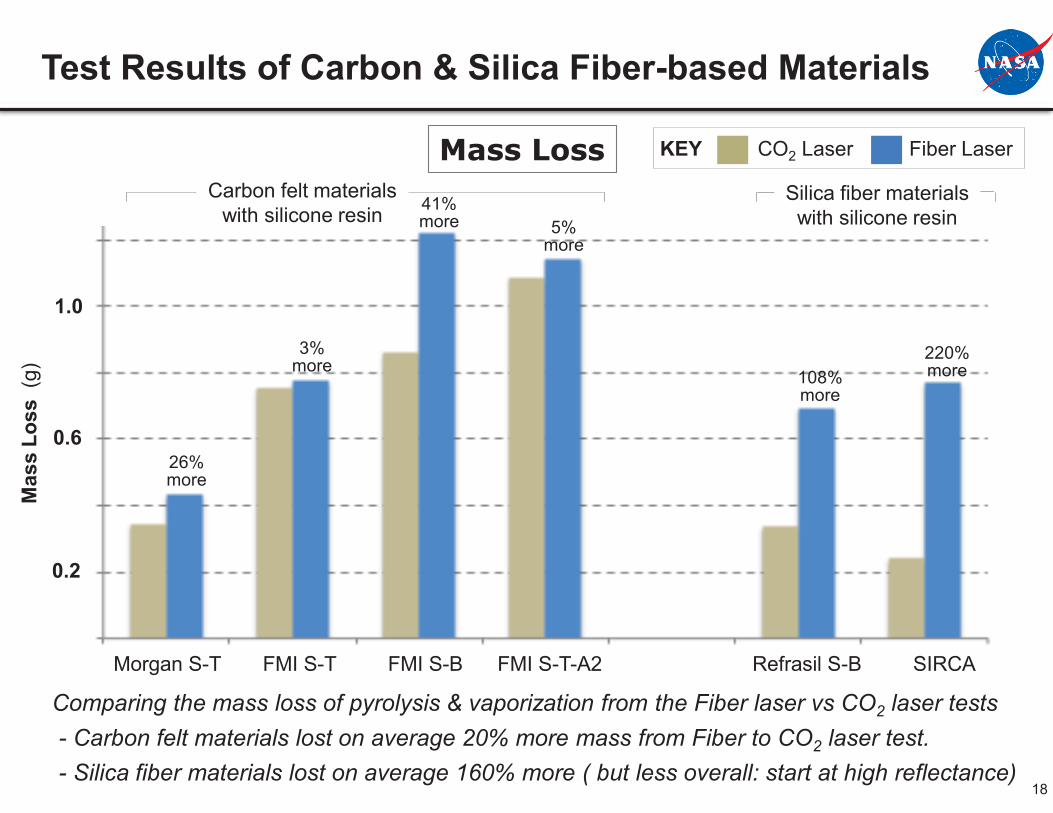
Test Results of Carbon & Silica Fiber-based Materials
Mass Loss
Comparing the mass loss of pyrolysis & vaporization from the Fiber laser vs CO2 laser tests - Carbon felt materials lost on average 20% more mass from Fiber to CO2 laser test. - Silica fiber materials lost on average 160% more ( but less overall: start at high reflectance)
0.2
Mas
s Lo
ss (
g)
0.6
1.0
26% more
3%more
41% more 5%
more
108%more
220%more
CO2 Laser Fiber Laser KEY
Carbon felt materials with silicone resin
Silica fiber materials with silicone resin
Morgan S-T FMI S-T FMI S-B FMI S-T-A2 Refrasil S-B SIRCA
19
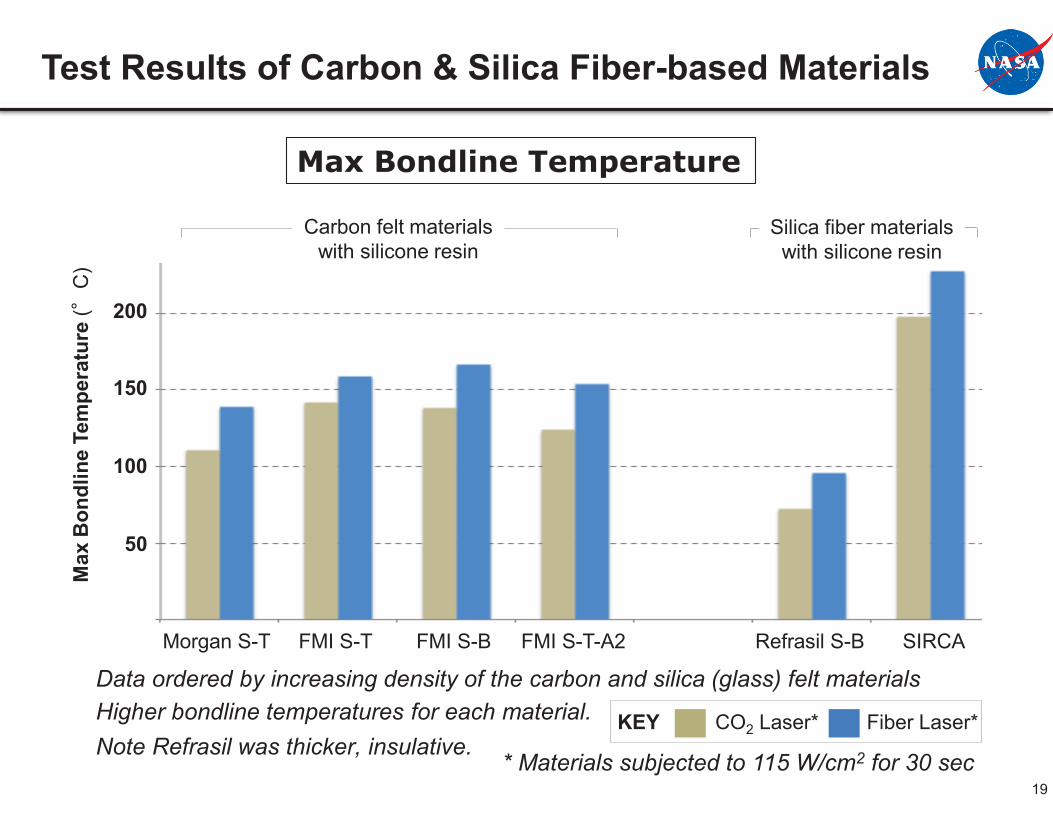
Data ordered by increasing density of the carbon and silica (glass) felt materials Higher bondline temperatures for each material. Note Refrasil was thicker, insulative.
Morgan S-T FMI S-T FMI S-B FMI S-T-A2 Refrasil S-B SIRCA
50
100
150
200
Max
Bon
dlin
e Te
mpe
ratu
re (
C)
Test Results of Carbon & Silica Fiber-based Materials
CO2 Laser* Fiber Laser* KEY
Carbon felt materials with silicone resin
Silica fiber materials with silicone resin
Max Bondline Temperature
* Materials subjected to 115 W/cm2 for 30 sec
20
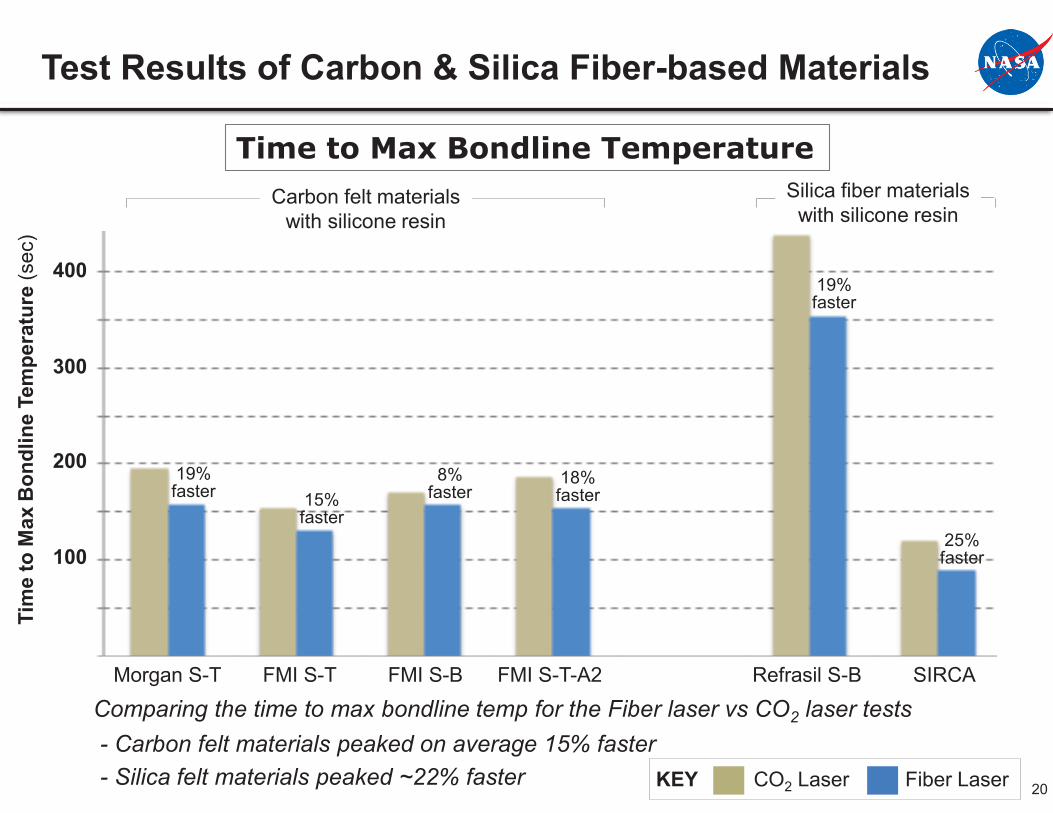
Test Results of Carbon & Silica Fiber-based Materials
Time to Max Bondline Temperature
Morgan S-T FMI S-T FMI S-B FMI S-T-A2 Refrasil S-B SIRCA
100
200
300
400
Tim
e to
Max
Bon
dlin
e Te
mpe
ratu
re (s
ec)
19% faster 15%
faster
8% faster
18% faster
19% faster
25% faster
Carbon felt materials with silicone resin
Silica fiber materials with silicone resin
CO2 Laser Fiber Laser KEY
Comparing the time to max bondline temp for the Fiber laser vs CO2 laser tests - Carbon felt materials peaked on average 15% faster - Silica felt materials peaked ~22% faster
21
• Background / Motivation
• Approach
• Test Results
• Summary & Conclusions
22
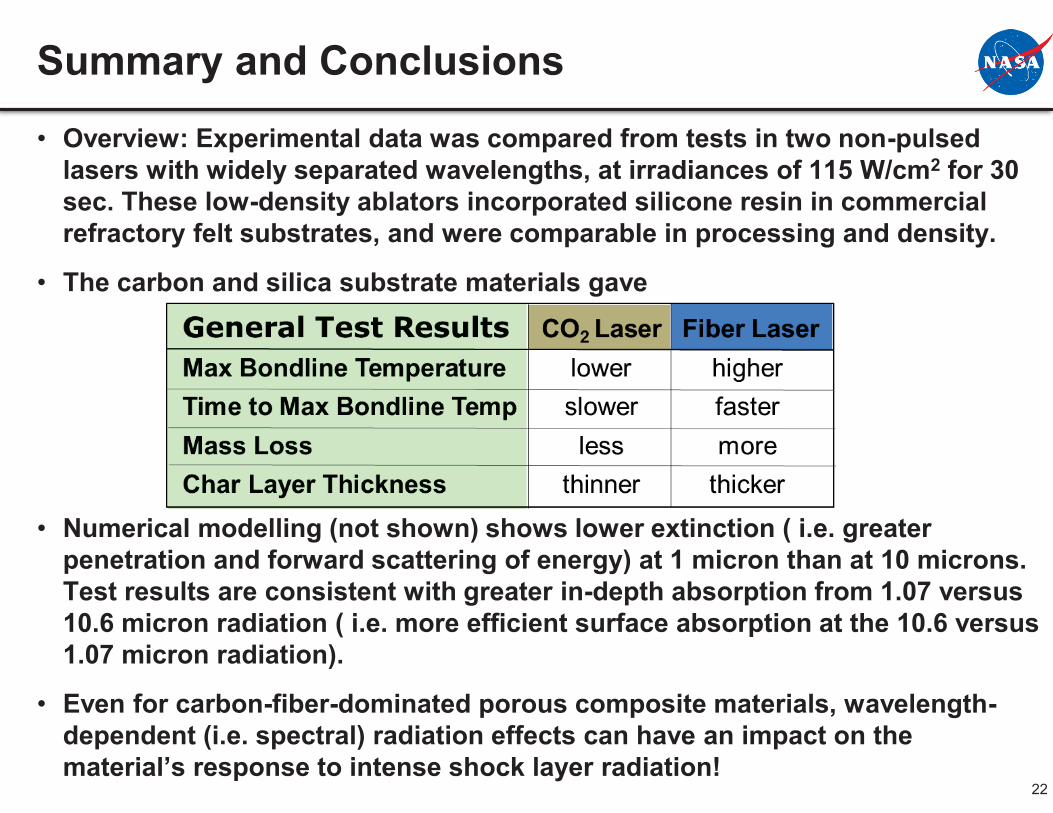
Summary and Conclusions
• Overview: Experimental data was compared from tests in two non-pulsed lasers with widely separated wavelengths, at irradiances of 115 W/cm2 for 30 sec. These low-density ablators incorporated silicone resin in commercial refractory felt substrates, and were comparable in processing and density.
• The carbon and silica substrate materials gave
• Numerical modelling (not shown) shows lower extinction ( i.e. greater penetration and forward scattering of energy) at 1 micron than at 10 microns. Test results are consistent with greater in-depth absorption from 1.07 versus 10.6 micron radiation ( i.e. more efficient surface absorption at the 10.6 versus 1.07 micron radiation).
• Even for carbon-fiber-dominated porous composite materials, wavelength-dependent (i.e. spectral) radiation effects can have an impact on the material’s response to intense shock layer radiation!
23
Acknowledgements
• This work was supported by the EDL TDP of the Exploration Technology Development and Demonstration (ETDD) Program, managed at NASA-Glenn Research Center.
• Robin Beck and Matt Gasch, project managers
• The entire NASA Ames EDL/TDP materials team (Parul Agrawal, Jim Arnold, Al Covington, Wendy Fan, Matt Gasch, Howard Goldstein, Bernie Laub, Joe Mach, Frank Milos, Steve Sepka, Mairead Stackpoole, Jeremy Thornton )
• Test materials described herein were from NASA Ames. The vendors Boeing, Lockheed Martin and Textron supplied materials for related testing not described here.
• John Bagford and Dan Seibert from the LHMEL facility.
• S-C Lee of Applied Sciences Laboratory for fiber radiation scattering theoretical modelling & consultation.
24
Effects of Laser Wavelength on Ablator Testing
• Background / Motivation
• Approach
• Test Results
• Summary & Conclusions
• Appendix
25
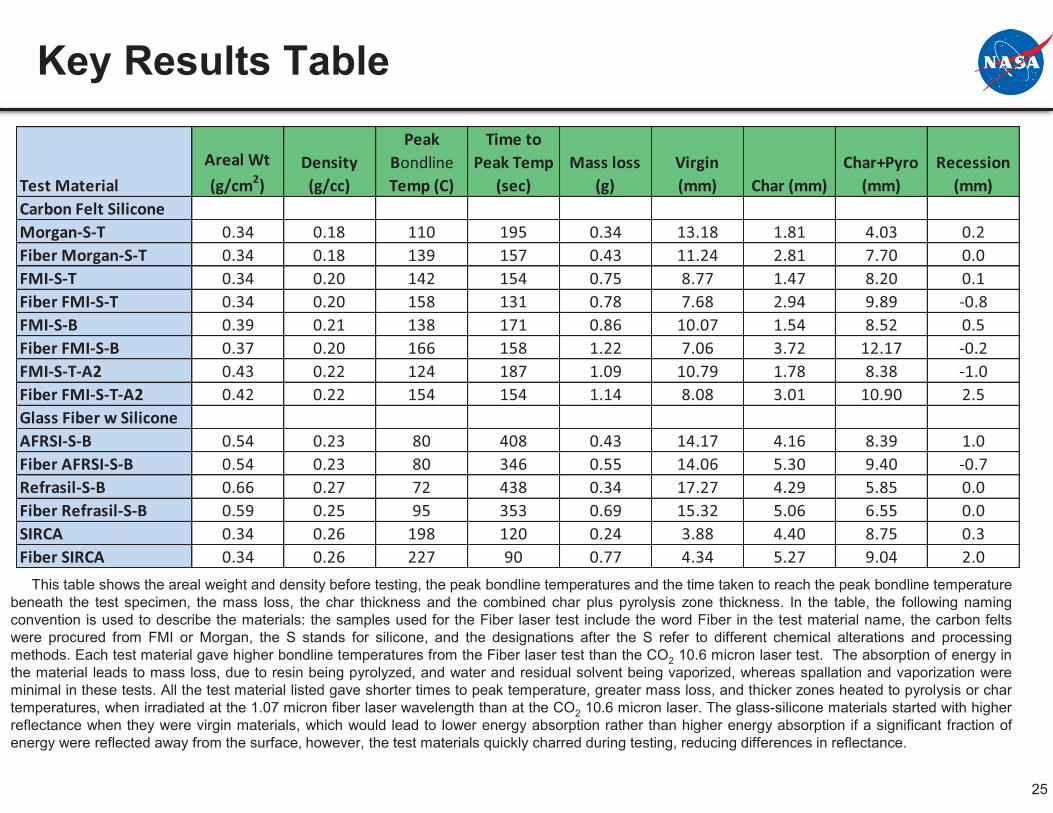
Key Results Table
This table shows the areal weight and density before testing, the peak bondline temperatures and the time taken to reach the peak bondline temperature beneath the test specimen, the mass loss, the char thickness and the combined char plus pyrolysis zone thickness. In the table, the following naming convention is used to describe the materials: the samples used for the Fiber laser test include the word Fiber in the test material name, the carbon felts were procured from FMI or Morgan, the S stands for silicone, and the designations after the S refer to different chemical alterations and processing methods. Each test material gave higher bondline temperatures from the Fiber laser test than the CO2 10.6 micron laser test. The absorption of energy in the material leads to mass loss, due to resin being pyrolyzed, and water and residual solvent being vaporized, whereas spallation and vaporization were minimal in these tests. All the test material listed gave shorter times to peak temperature, greater mass loss, and thicker zones heated to pyrolysis or char temperatures, when irradiated at the 1.07 micron fiber laser wavelength than at the CO2 10.6 micron laser. The glass-silicone materials started with higher reflectance when they were virgin materials, which would lead to lower energy absorption rather than higher energy absorption if a significant fraction of energy were reflected away from the surface, however, the test materials quickly charred during testing, reducing differences in reflectance.
Test MaterialAreal Wt (g/cm2)
Density (g/cc)
Peak Bondline Temp (C)
Time to Peak Temp
(sec)Mass loss
(g)Virgin (mm) Char (mm)
Char+Pyro (mm)
Recession (mm)
Carbon Felt Silicone Morgan-S-T 0.34 0.18 110 195 0.34 13.18 1.81 4.03 0.2Fiber Morgan-S-T 0.34 0.18 139 157 0.43 11.24 2.81 7.70 0.0FMI-S-T 0.34 0.20 142 154 0.75 8.77 1.47 8.20 0.1Fiber FMI-S-T 0.34 0.20 158 131 0.78 7.68 2.94 9.89 -0.8FMI-S-B 0.39 0.21 138 171 0.86 10.07 1.54 8.52 0.5Fiber FMI-S-B 0.37 0.20 166 158 1.22 7.06 3.72 12.17 -0.2FMI-S-T-A2 0.43 0.22 124 187 1.09 10.79 1.78 8.38 -1.0Fiber FMI-S-T-A2 0.42 0.22 154 154 1.14 8.08 3.01 10.90 2.5Glass Fiber w Silicone AFRSI-S-B 0.54 0.23 80 408 0.43 14.17 4.16 8.39 1.0Fiber AFRSI-S-B 0.54 0.23 80 346 0.55 14.06 5.30 9.40 -0.7Refrasil-S-B 0.66 0.27 72 438 0.34 17.27 4.29 5.85 0.0Fiber Refrasil-S-B 0.59 0.25 95 353 0.69 15.32 5.06 6.55 0.0SIRCA 0.34 0.26 198 120 0.24 3.88 4.40 8.75 0.3Fiber SIRCA 0.34 0.26 227 90 0.77 4.34 5.27 9.04 2.0
26
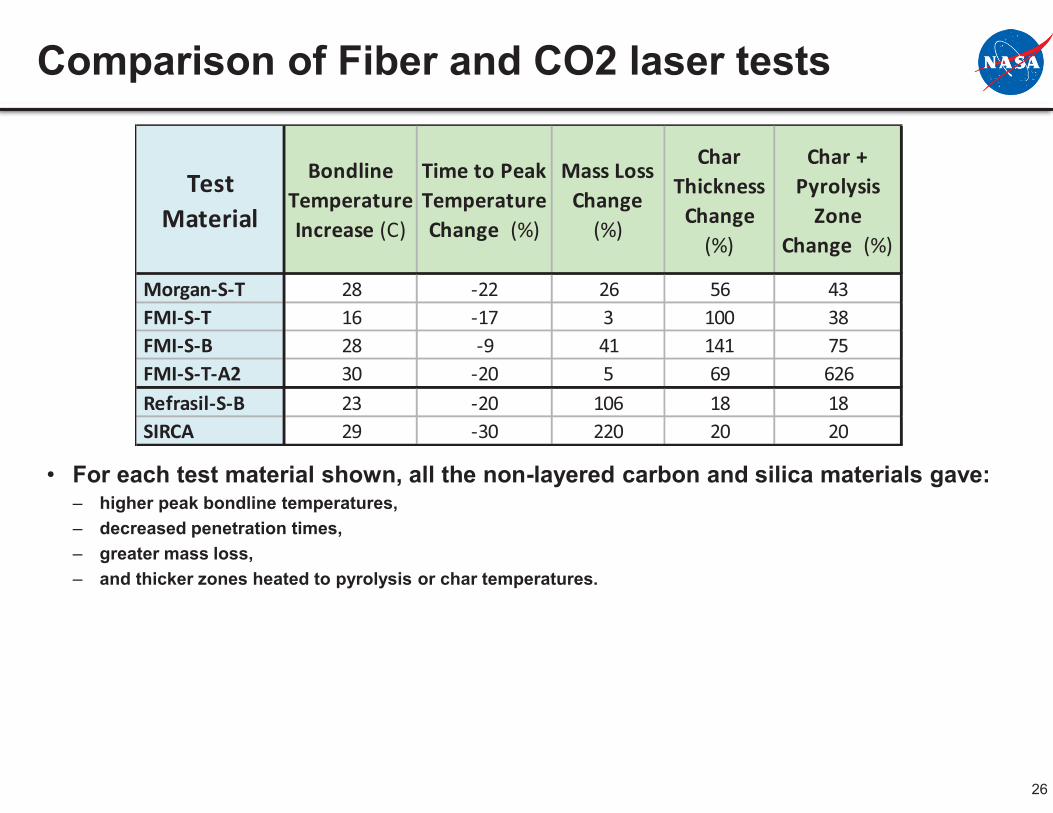
Comparison of Fiber and CO2 laser tests
• For each test material shown, all the non-layered carbon and silica materials gave: – higher peak bondline temperatures, – decreased penetration times, – greater mass loss, – and thicker zones heated to pyrolysis or char temperatures.
Test Material
Bondline Temperature Increase (C)
Time to Peak Temperature Change (%)
Mass Loss Change
(%)
Char Thickness
Change (%)
Char + Pyrolysis
Zone Change (%)
Morgan-S-T 28 -22 26 56 43 FMI-S-T 16 -17 3 100 38 FMI-S-B 28 -9 41 141 75 FMI-S-T-A2 30 -20 5 69 626 Refrasil-S-B 23 -20 106 18 18 SIRCA 29 -30 220 20 20
27
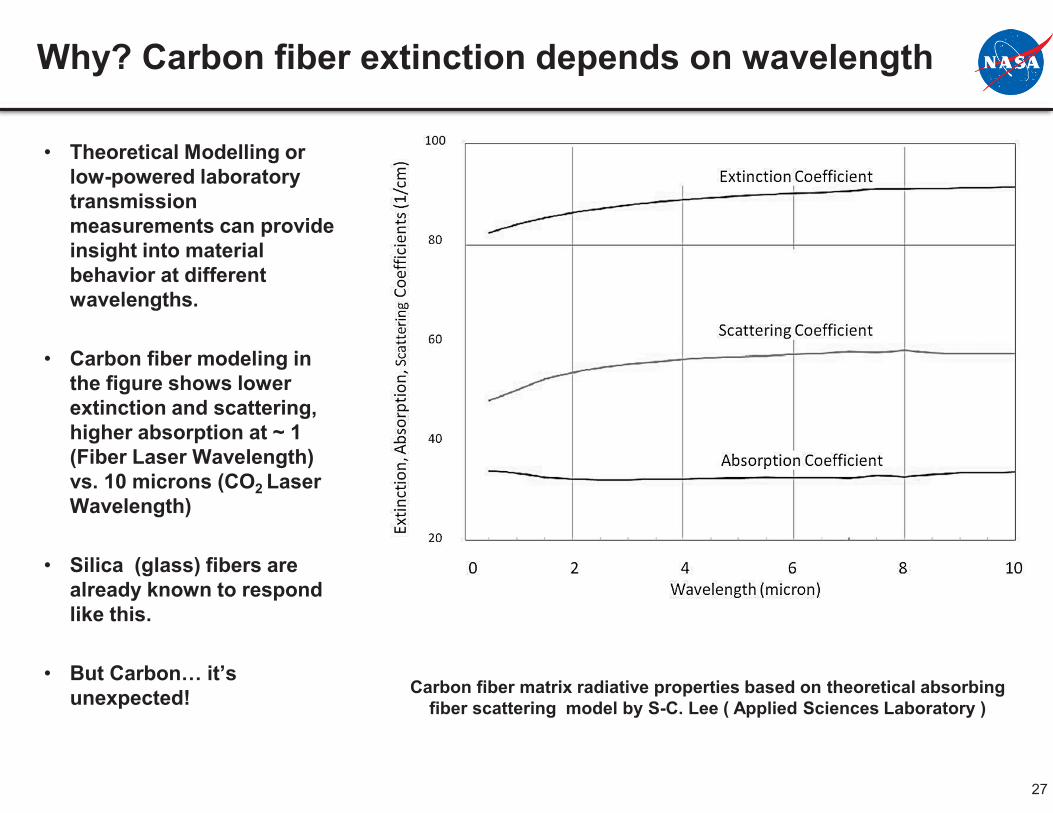
Why? Carbon fiber extinction depends on wavelength
• Theoretical Modelling or low-powered laboratory transmission measurements can provide insight into material behavior at different wavelengths.
• Carbon fiber modeling in the figure shows lower extinction and scattering, higher absorption at ~ 1 (Fiber Laser Wavelength) vs. 10 microns (CO2 Laser Wavelength)
• Silica (glass) fibers are already known to respond like this.
• But Carbon… it’s unexpected! Carbon fiber matrix radiative properties based on theoretical absorbing
fiber scattering model by S-C. Lee ( Applied Sciences Laboratory )
28
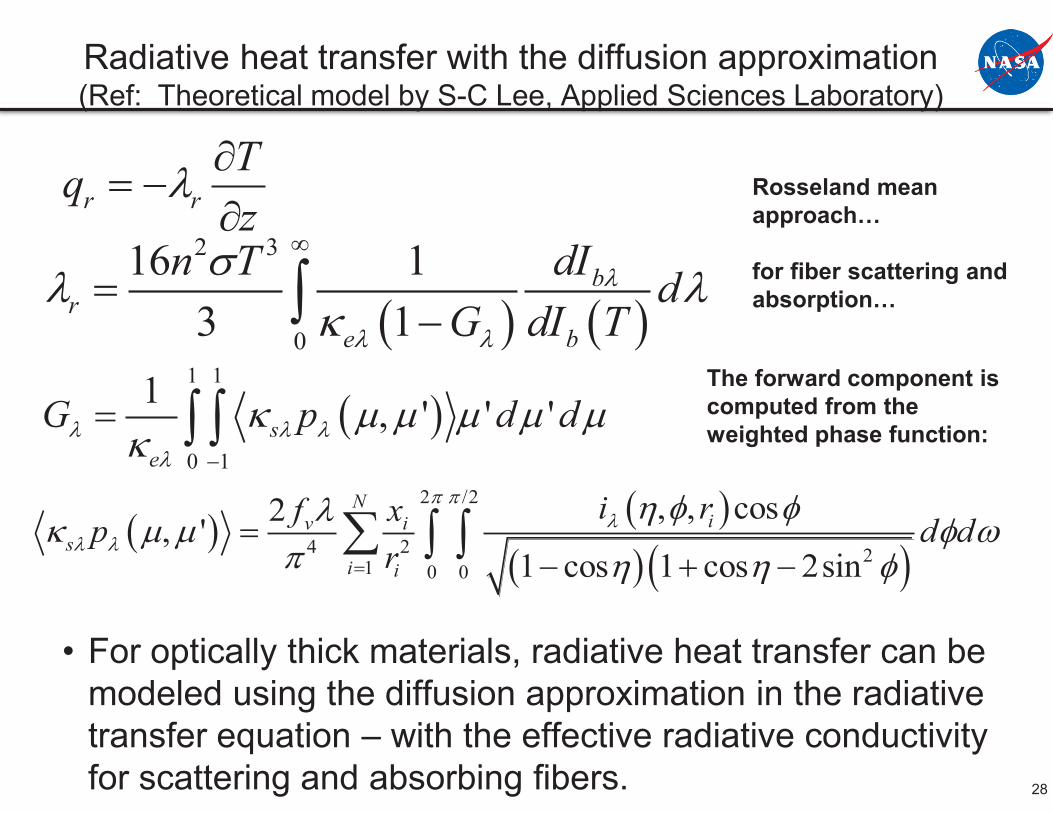
Radiative heat transfer with the diffusion approximation (Ref: Theoretical model by S-C Lee, Applied Sciences Laboratory)
• For optically thick materials, radiative heat transfer can be modeled using the diffusion approximation in the radiative transfer equation – with the effective radiative conductivity for scattering and absorbing fibers.
r rTqz
� �� �
�
� � � �2 3
0
16 13 1
br
e b
n T dI dG dI T
�
� �
�� �
���
� �1 1
0 1
1 , ' ' 'se
G p d d� � ��
� � � � � �
� � �
� � � �� � � �
2 /2
4 2 21 0 0
, , cos2, '1 cos 1 cos 2sin
Niv i
si i
i rf xp d dr
�
� �
� � �� � � � � � � ��
�� � �
� � �
Rosseland mean approach… for fiber scattering and absorption…
The forward component is computed from the weighted phase function:
29
0
1000
2000
3000
4000
5000
0.0 0.5 1.0 1.5 2.0 2.5 3.0 3.5 4.0Wavelength (�m)
Ste
radi
ance
(W/c
m2 -�
m-s
ter)
Solar (6000 K source) (GREEN)
Xenon lamp (5800 K source) (BLACK)
Nd:YAG (line doubled/pulsed)Nd:YAGCOIL
CN radiation at Titan (102) (RED)
HF
LASERS (PURPLE)Excimer lasers (pulsed)
Mercury-Xenon lamp radiation (102) (BLUE)
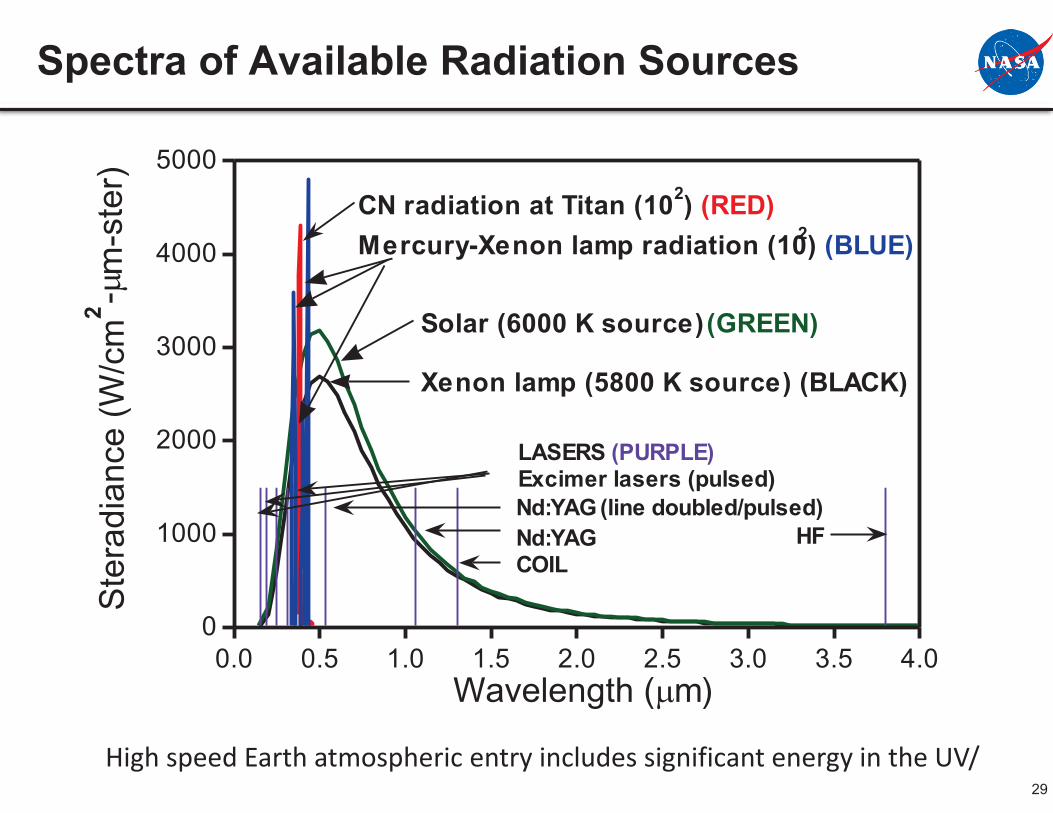
High speed Earth atmospheric entry includes significant energy in the UV/
Spectra of Available Radiation Sources
30
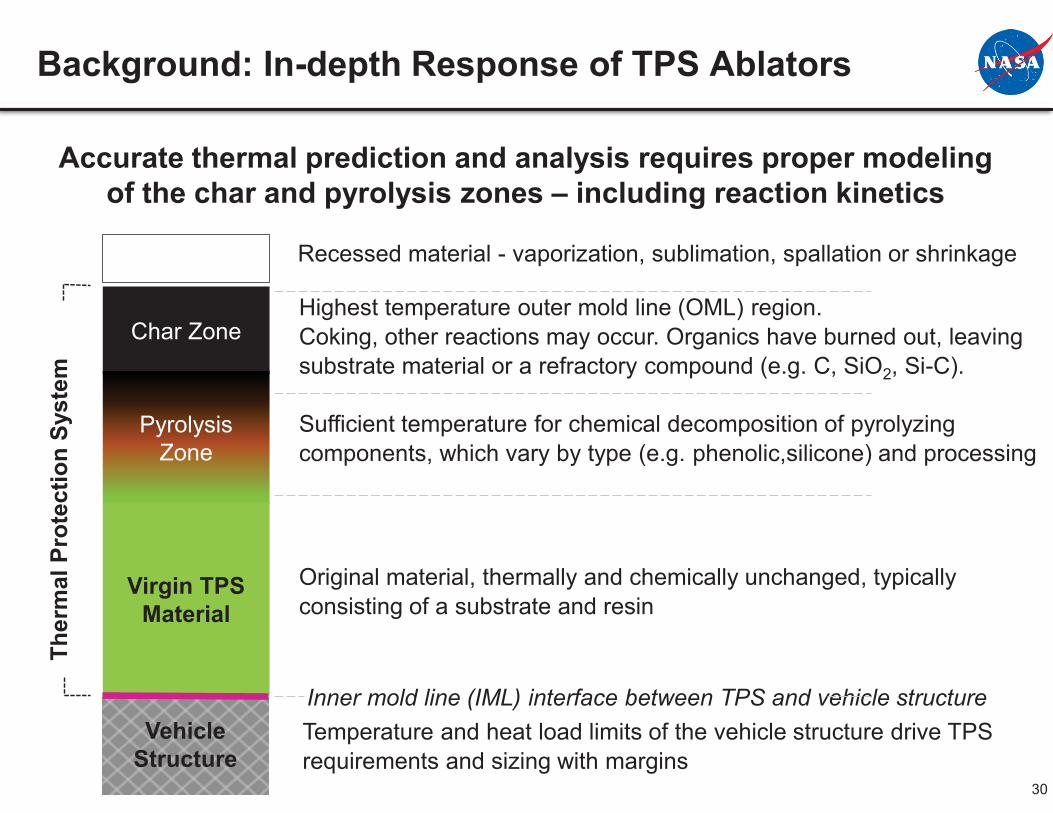
Char Zone
Pyrolysis Zone
Virgin TPS Material
Recessed material - vaporization, sublimation, spallation or shrinkage
Highest temperature outer mold line (OML) region. Coking, other reactions may occur. Organics have burned out, leaving substrate material or a refractory compound (e.g. C, SiO2, Si-C).
Sufficient temperature for chemical decomposition of pyrolyzing components, which vary by type (e.g. phenolic,silicone) and processing
Original material, thermally and chemically unchanged, typically consisting of a substrate and resin
Vehicle Structure
Accurate thermal prediction and analysis requires proper modeling of the char and pyrolysis zones – including reaction kinetics
Temperature and heat load limits of the vehicle structure drive TPS requirements and sizing with margins
Ther
mal
Pro
tect
ion
Syst
em
Inner mold line (IML) interface between TPS and vehicle structure
Background: In-depth Response of TPS Ablators