Embed Size (px)
DESCRIPTION
Abstract— An investigation into the effects of low light (meanPPFD169-493Ms-1m-1), red light (meanPPFD657-843Ms-1m-1) and normal light (meanPPFD1061-1260Ms-1m-1) on physiological changes including yield attributes, nutritional status at Panicle initiation (PI), flowering and harvest stages in winter rice (genotype: Monoharsali) was carried out from 40 days after transplanting (DAT) to crop maturity under both pot and field conditions. There was reduction in available PPFD at flowering as compared to PI stage of the crop. The genotype exhibited significantly higher total dry matter (TDM) and lower leaf area index (LAI) values at normal light or red light than at reduced light situation. The bio-economical yield and harvest index (HI) under normal light exceeded those at low light regime. The yield attributes viz., number of panicles, number of field grains per panicle, 1000 grain weight (test weight), high density (HD) grains, potential 1000 grain weight and sink capacity were sup
Citation preview
International Journal of Environmental & Agriculture Research (IJOEAR) ISSN:[2454-1850] [Vol-2, Issue-3, March- 2016]
Page | 65
Effects of Light Intensity and Quality on Physiological Changes
in Winter Rice (Oryza Sativa L.) Basanta Barmudoi
1, Bhagawan Bharali
2
1, 2Department of Crop Physiology, Assam Agricultural University, Jorhat
Abstract— An investigation into the effects of low light (meanPPFD169-493Ms-1
m-1
), red light (meanPPFD657-
843Ms-1
m-1
) and normal light (meanPPFD1061-1260Ms-1
m-1
) on physiological changes including yield attributes,
nutritional status at Panicle initiation (PI), flowering and harvest stages in winter rice (genotype: Monoharsali) was carried
out from 40 days after transplanting (DAT) to crop maturity under both pot and field conditions. There was reduction in
available PPFD at flowering as compared to PI stage of the crop. The genotype exhibited significantly higher total dry
matter (TDM) and lower leaf area index (LAI) values at normal light or red light than at reduced light situation. The bio-
economical yield and harvest index (HI) under normal light exceeded those at low light regime. The yield attributes viz.,
number of panicles, number of field grains per panicle, 1000 grain weight (test weight), high density (HD) grains, potential
1000 grain weight and sink capacity were superior at normal or red light to low light condition. Higher the total
carbohydrate contents in grains, higher were the sink capacity with the normal /red light illuminations at harvest stage. At PI
stage, leaf nitrogen content was reduced by low light, but it increased at flowering stage significantly. Grain protein
contents, under normal/red light exceeded its value at low light treatment. A positive correlation of most of the yield
attributes with grain yield at normal/red light, and a negative correlation of these parameters were found at low light
conditions.
Keywords— low light, red light, white light, PPFD, HI, test weight, HD grains, Sink capacity.
I. INTRODUCTION
Rice (Oryza sativa L.) grown in winter season in tropical and subtropical regions are influenced adversely by the climatic
conditions, which is characterized by overcast sky posing low sunshine hours during the vegetative to reproductive growth
stages of the crop. Rice plant requires about 1500 bright sunshine (BSS) hours for the period from transplanting to maturity.
Instead, prevalence of only about 800-900 BSS hours during August to December in places like Northeastern region of India
hampers the physiological efficiencies, and ultimately the productivity of winter rice crop (Bharali et al., 1994). It’s because,
solar radiation in tropics is one of the major climatic factors limiting grain yield in rice (Vergara et al., 1976).
Apart from light intensity, an illumination condition is determinant for proper growth and development of plant, which
ensures interactions of all photoreactions (Voskresenenskya, 1979). Many vital biosynthetic processes of plant can be
regulated by simple alteration of light quality. Accumulation of carbohydrate, particularly starch is a notable metabolic
feature of plants photosynthesizing under red light during a long period. In plants under the influence of blue light, the
carbon is preferentially utilized for biosynthesis of proteins (Pierson and Lowallik, 1964). The peculiarities in metabolism
due to effects of light quality are accompanied by changes in chloroplast organization. The plants under red light form lesser
active chloroplast than plants under blue light. Moreover, the plants photosynthesizing under red light have limited CO2
exchange, week photophosphorylation and low activity of electron transport from water (Voskresenskaya, 1972). Low light
at PI and flowering stages of crop causes physiological aberrations in rice including nutritional imbalance (Bharali et al.,
1993). The present study attempted to compare the physiological performance of winter rice crop modulated by low light and
red light in comparison to normal light in field and pot culture conditions.
II. MATERIALS AND METHODS
A field experiment laid in RBD and another pot culture experiment framed in CRD, were conducted on winter rice (Variety
Manoharsali), to study the impacts of low light cum red light and normal sunlight light on physiological changes of the crop.

International Journal of Environmental & Agriculture Research (IJOEAR) ISSN:[2454-1850] [Vol-2, Issue-3, March- 2016]
Page | 66
In field, 30 days old seedlings (n=2) were transplanted at 10cm (Plant x Plant) and 20cm (Row x Row) apart onto the well
puddle and leveled plots. Fertilizers @40:20:20 NPK per hectare were applied as Urea, Single super phosphate (SSP) and
Muriate of potash (MoP). In case of pot culture, rice seedlings (n=1) of 30 days old, was transplanted to the earthen pots
(diameter: 32cm). A mixture of sandy loamy soil with FYM @4:1 was used to fill in one pot (capacity: 6.5 Kg soil). The pot
mixture also contained the NPK fertilizers @40:20:20. In both the experiments, half of N and entire doses of P and K were
applied as basal, and the remaining half of the N was top-dressed at 30 days after transplanting (DAT). In the field plots and
laboratory pots, constant water supply (2-3cm) was ensured from transplanting till seven days before harvesting.
Normal sunlight was reduced to 50% (Low light) using standard hessian cloth fitted in a bamboo frame at one meter above
the ground, at 40 DAT till maturity of the crop. Each plant was wrapped with two layers of red cellophane papers loosely
allowing the gaseous exchange, which permitted only the red spectrum of visible light with emission maximum 650nm
(Sharma et.al., 1976). Light intensity below and above the crop canopy was measured using a Lux Meter (York Scientific
Industries, YORCO) at PI and flowering stages of the crop. The light intensity readings (Lux) were converted into ES-1
m-2
(Dhopte et al., 1989; Clayton, R. K. (1970)). The total rainfall and BSS during the crop season (July to December) were
927.4mm and 1060.7 hours respectively (Meteorological Observatory, AAU, Jorhat).
III. PHYSIOLOGICAL PARAMETERS
Leaf area (L x B x constant factor) was measured at PI and flowering stages (Yoshida et al., 1976) of crop growth, where L:
maximum length, B: Average breath of leaf. Constant factor for PI: 0.69 & Flowering stage: 0.75. LAI was calculated as the
ratio of total leaf area to the ground area covered by the plant canopy. The second leaf from the top was sampled, oven dried
at 60oC to a constant weight and recorded as specific leaf weight (SLW). Panicle length measured from the nodal base to the
tip of the panicle.
The above ground parts of five observational plants in each plot or the whole plant in each pot, were oven dried at 60oC to a
constant weight. Dry matter /m2 (average dry weight x total no. of plants/m
2) was converted into kg/ha at PI and flowering
stages. At harvest, plants/m2 area from each plot were threshed to separate grains from straw and after proper drying in
sunshine, biological (straw + grains) and economic yield were expressed as q/ha. In case of pot experiment, these parameters
were recorded as g/pot. Harvest index (HI) were calculated by proportioning biological yield to grain yield. 1000 seeds were
randomly collected from each seed lot of individually harvested plot and pot, weighed in electrical balance after proper
drying (14% moisture) and recorded as test weight. The per cent well filled grains, high density (HD) grains were determined
using 1.20 specific gravity salt solution and 50g seed from each treatment in the experiments (Nichiporovich, 1967). Sink
capacity (number of panicles/m2 x spikelet/panicle x individual grain weight) was calculated as suggested by Venkateswrulu
and Visperas (1987).
IV. CHEMICAL ANALYSIS
In field and pot experiments, five randomly selected leaves were ground in electrical grinder after drying in oven at 60oC into
a constant weight. Powdered materials were sieved and stored in desiccators. Nitrogen estimation in leaf samples was done
by Micro-Kjeldhal method (A.O.A.C. 1965) at PI and flowering stages. Nitrogen estimated in grains on dry weight basis
following the same procedure was converted into crude protein multiplying it by a factor of 5.95 (Juliano, 1972). Total
carbohydrate content was determined in leaf and dehusked grain (Daniel, 1982; Yoshida et. al. 1976) too.
V. STATISTICAL ANALYSIS
Data for each character was analyzed by Fisher’s method of analysis of variance. Least significance difference (LSD)
between a pair of treatment means at P<0.05 was used for determination of the significance difference between two treatment
means. The relationship of economic yield with yield attributing parameters under different light regimes was determined
from simple correlation studies.
International Journal of Environmental & Agriculture Research (IJOEAR) ISSN:[2454-1850] [Vol-2, Issue-3, March- 2016]
Page | 67
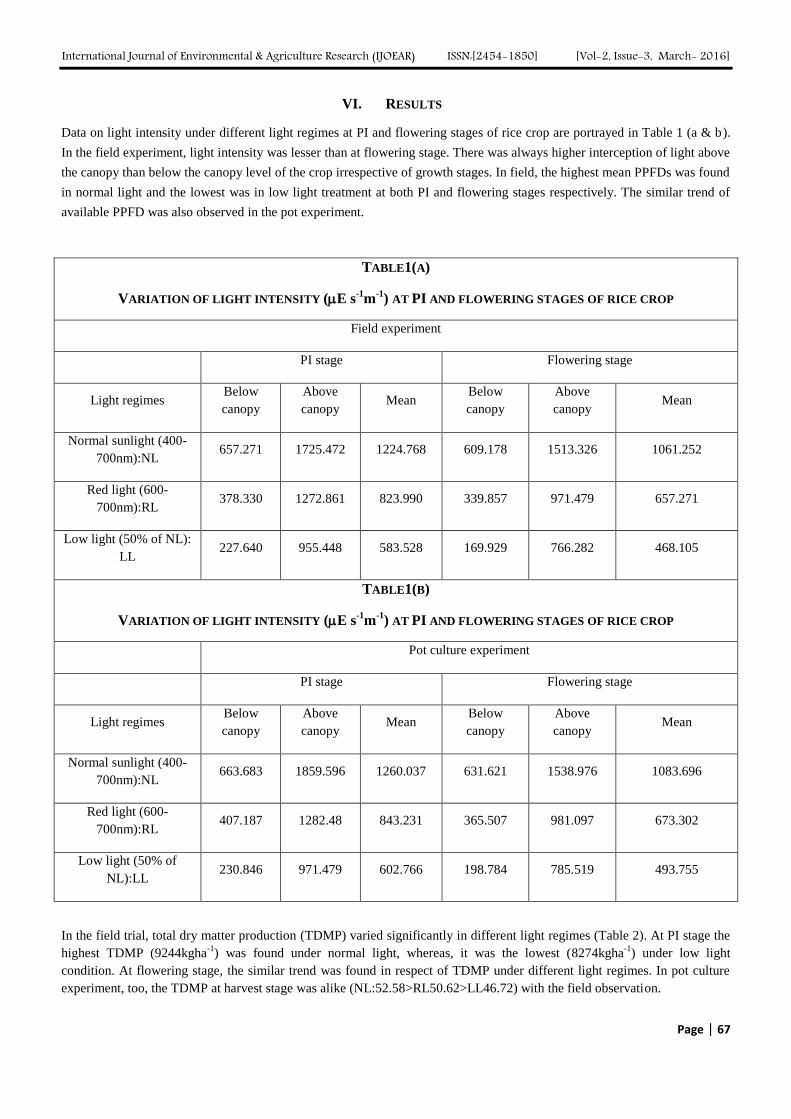
VI. RESULTS
Data on light intensity under different light regimes at PI and flowering stages of rice crop are portrayed in Table 1 (a & b).
In the field experiment, light intensity was lesser than at flowering stage. There was always higher interception of light above
the canopy than below the canopy level of the crop irrespective of growth stages. In field, the highest mean PPFDs was found
in normal light and the lowest was in low light treatment at both PI and flowering stages respectively. The similar trend of
available PPFD was also observed in the pot experiment.
TABLE1(A)
VARIATION OF LIGHT INTENSITY (E s-1
m-1
) AT PI AND FLOWERING STAGES OF RICE CROP
Field experiment
PI stage Flowering stage
Light regimes Below
canopy
Above
canopy Mean
Below
canopy
Above
canopy Mean
Normal sunlight (400-
700nm):NL 657.271 1725.472 1224.768 609.178 1513.326 1061.252
Red light (600-
700nm):RL 378.330 1272.861 823.990 339.857 971.479 657.271
Low light (50% of NL):
LL 227.640 955.448 583.528 169.929 766.282 468.105
TABLE1(B)
VARIATION OF LIGHT INTENSITY (E s-1
m-1
) AT PI AND FLOWERING STAGES OF RICE CROP
Pot culture experiment
PI stage Flowering stage
Light regimes Below
canopy
Above
canopy Mean
Below
canopy
Above
canopy Mean
Normal sunlight (400-
700nm):NL 663.683 1859.596 1260.037 631.621 1538.976 1083.696
Red light (600-
700nm):RL 407.187 1282.48 843.231 365.507 981.097 673.302
Low light (50% of
NL):LL 230.846 971.479 602.766 198.784 785.519 493.755
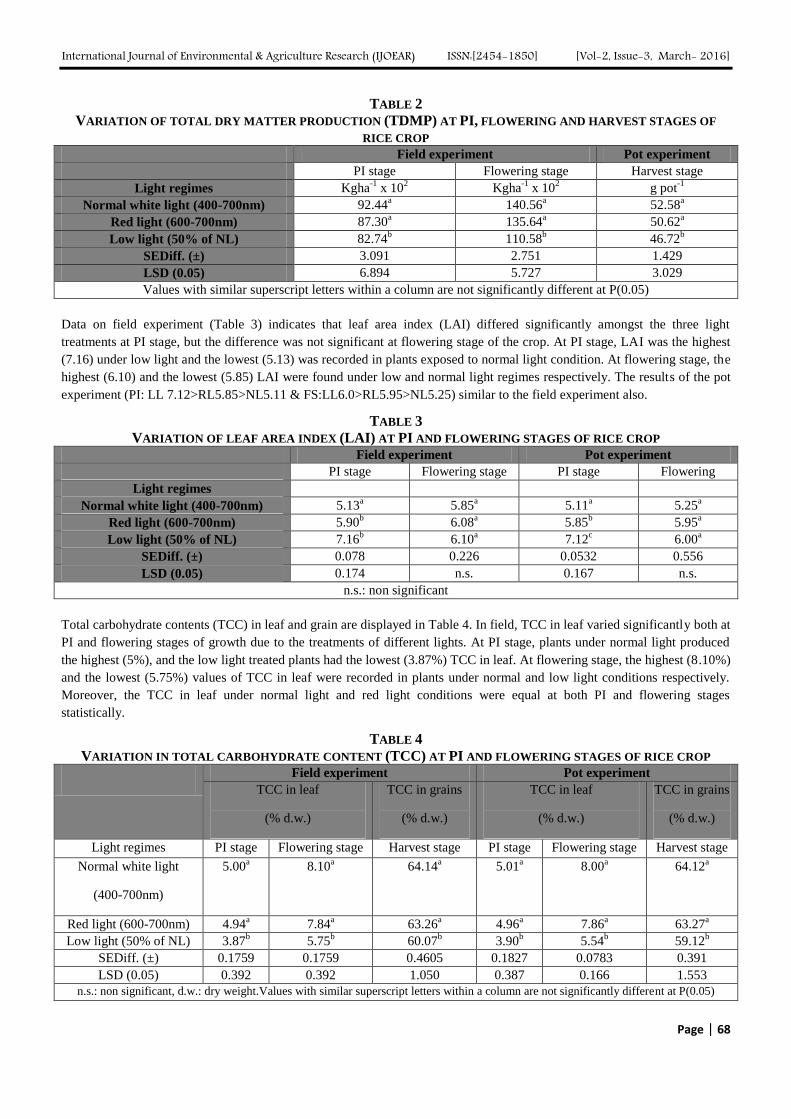
In the field trial, total dry matter production (TDMP) varied significantly in different light regimes (Table 2). At PI stage the
highest TDMP (9244kgha-1
) was found under normal light, whereas, it was the lowest (8274kgha-1
) under low light
condition. At flowering stage, the similar trend was found in respect of TDMP under different light regimes. In pot culture
experiment, too, the TDMP at harvest stage was alike (NL:52.58>RL50.62>LL46.72) with the field observation.
International Journal of Environmental & Agriculture Research (IJOEAR) ISSN:[2454-1850] [Vol-2, Issue-3, March- 2016]
Page | 68
TABLE 2
VARIATION OF TOTAL DRY MATTER PRODUCTION (TDMP) AT PI, FLOWERING AND HARVEST STAGES OF
RICE CROP Field experiment Pot experiment
PI stage Flowering stage Harvest stage
Light regimes Kgha-1
x 102 Kgha
-1 x 10
2 g pot
-1
Normal white light (400-700nm) 92.44a 140.56
a 52.58
a
Red light (600-700nm) 87.30a 135.64
a 50.62
a
Low light (50% of NL) 82.74b 110.58
b 46.72
b
SEDiff. (±) 3.091 2.751 1.429
LSD (0.05) 6.894 5.727 3.029
Values with similar superscript letters within a column are not significantly different at P(0.05)
Data on field experiment (Table 3) indicates that leaf area index (LAI) differed significantly amongst the three light
treatments at PI stage, but the difference was not significant at flowering stage of the crop. At PI stage, LAI was the highest
(7.16) under low light and the lowest (5.13) was recorded in plants exposed to normal light condition. At flowering stage, the
highest (6.10) and the lowest (5.85) LAI were found under low and normal light regimes respectively. The results of the pot
experiment (PI: LL 7.12>RL5.85>NL5.11 & FS:LL6.0>RL5.95>NL5.25) similar to the field experiment also.
TABLE 3
VARIATION OF LEAF AREA INDEX (LAI) AT PI AND FLOWERING STAGES OF RICE CROP
Field experiment Pot experiment
PI stage Flowering stage PI stage Flowering
stage Light regimes
Normal white light (400-700nm) 5.13a 5.85
a 5.11
a 5.25
a
Red light (600-700nm) 5.90b 6.08
a 5.85
b 5.95
a
Low light (50% of NL) 7.16b 6.10
a 7.12
c 6.00
a
SEDiff. (±) 0.078 0.226 0.0532 0.556
LSD (0.05) 0.174 n.s. 0.167 n.s.
n.s.: non significant
Values with similar superscript letters within a column are not significantly different at P(0.05)
Total carbohydrate contents (TCC) in leaf and grain are displayed in Table 4. In field, TCC in leaf varied significantly both at
PI and flowering stages of growth due to the treatments of different lights. At PI stage, plants under normal light produced
the highest (5%), and the low light treated plants had the lowest (3.87%) TCC in leaf. At flowering stage, the highest (8.10%)
and the lowest (5.75%) values of TCC in leaf were recorded in plants under normal and low light conditions respectively.
Moreover, the TCC in leaf under normal light and red light conditions were equal at both PI and flowering stages
statistically.
TABLE 4
VARIATION IN TOTAL CARBOHYDRATE CONTENT (TCC) AT PI AND FLOWERING STAGES OF RICE CROP Field experiment Pot experiment
TCC in leaf
(% d.w.)
TCC in grains
(% d.w.)
TCC in leaf
(% d.w.)
TCC in grains
(% d.w.)
Light regimes PI stage Flowering stage Harvest stage PI stage Flowering stage Harvest stage
Normal white light
(400-700nm)
5.00a 8.10
a 64.14
a 5.01
a 8.00
a 64.12
a
Red light (600-700nm) 4.94a 7.84
a 63.26
a 4.96
a 7.86
a 63.27
a
Low light (50% of NL) 3.87b 5.75
b 60.07
b 3.90
b 5.54
b 59.12
b
SEDiff. (±) 0.1759 0.1759 0.4605 0.1827 0.0783 0.391
LSD (0.05) 0.392 0.392 1.050 0.387 0.166 1.553
n.s.: non significant, d.w.: dry weight.Values with similar superscript letters within a column are not significantly different at P(0.05)
International Journal of Environmental & Agriculture Research (IJOEAR) ISSN:[2454-1850] [Vol-2, Issue-3, March- 2016]
Page | 69
In field, TCC in grain at harvest differed significantly between red light and low light as well as normal light and low light
conditions. Of course, under low light, plants produced the highest (64.14%) TCC in grain. The lowest (60.07%) TCC in
grain was found under low light condition. A similar trend was also found in respect of TCC in leaf
(NL:5.01%>RL:4.96>LL3.90) and grain (NL:64.12>RL:63.27>LL:59.12) in case of pot experiment.
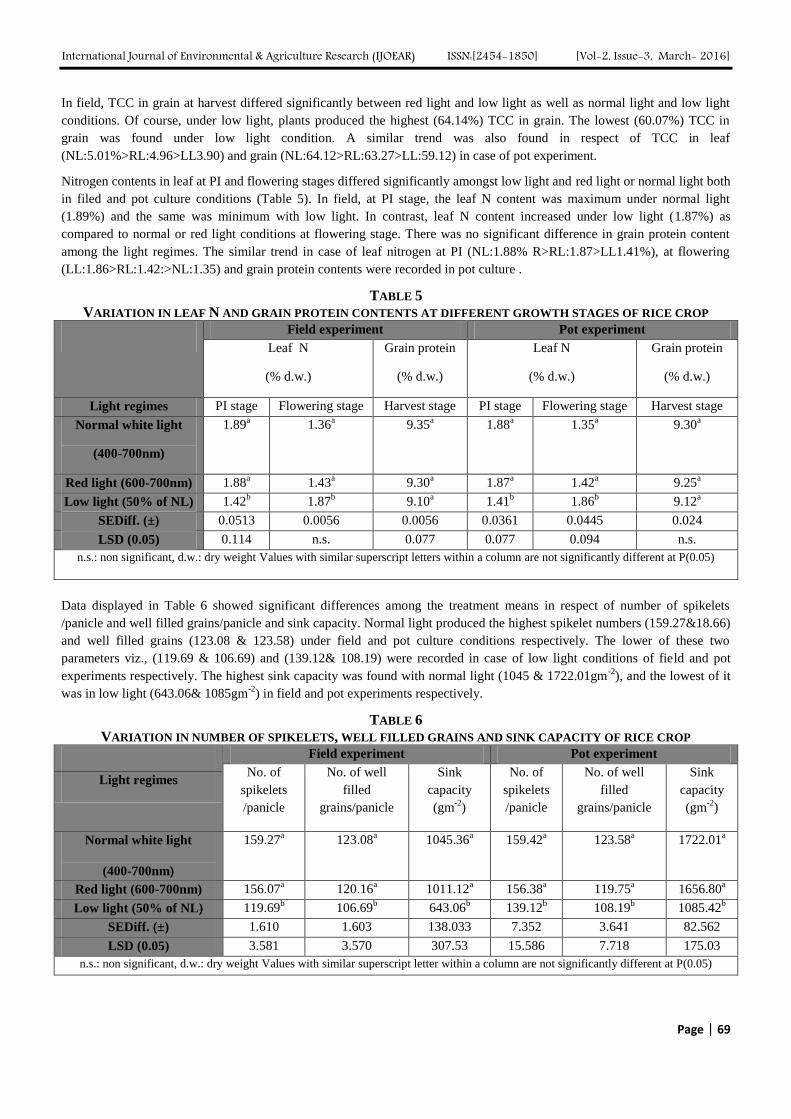
Nitrogen contents in leaf at PI and flowering stages differed significantly amongst low light and red light or normal light both
in filed and pot culture conditions (Table 5). In field, at PI stage, the leaf N content was maximum under normal light
(1.89%) and the same was minimum with low light. In contrast, leaf N content increased under low light (1.87%) as
compared to normal or red light conditions at flowering stage. There was no significant difference in grain protein content
among the light regimes. The similar trend in case of leaf nitrogen at PI (NL:1.88% R>RL:1.87>LL1.41%), at flowering
(LL:1.86>RL:1.42:>NL:1.35) and grain protein contents were recorded in pot culture .
TABLE 5
VARIATION IN LEAF N AND GRAIN PROTEIN CONTENTS AT DIFFERENT GROWTH STAGES OF RICE CROP Field experiment Pot experiment
Leaf N
(% d.w.)
Grain protein
(% d.w.)
Leaf N
(% d.w.)
Grain protein
(% d.w.)
Light regimes PI stage Flowering stage Harvest stage PI stage Flowering stage Harvest stage
Normal white light
(400-700nm)
1.89a 1.36
a 9.35
a 1.88
a 1.35
a 9.30
a
Red light (600-700nm) 1.88a 1.43
a 9.30
a 1.87
a 1.42
a 9.25
a
Low light (50% of NL) 1.42b 1.87
b 9.10
a 1.41
b 1.86
b 9.12
a
SEDiff. (±) 0.0513 0.0056 0.0056 0.0361 0.0445 0.024
LSD (0.05) 0.114 n.s. 0.077 0.077 0.094 n.s.
n.s.: non significant, d.w.: dry weight Values with similar superscript letters within a column are not significantly different at P(0.05)
Data displayed in Table 6 showed significant differences among the treatment means in respect of number of spikelets
/panicle and well filled grains/panicle and sink capacity. Normal light produced the highest spikelet numbers (159.27&18.66)
and well filled grains (123.08 & 123.58) under field and pot culture conditions respectively. The lower of these two
parameters viz., (119.69 & 106.69) and (139.12& 108.19) were recorded in case of low light conditions of field and pot
experiments respectively. The highest sink capacity was found with normal light (1045 & 1722.01gm-2
), and the lowest of it
was in low light (643.06& 1085gm-2
) in field and pot experiments respectively.
TABLE 6
VARIATION IN NUMBER OF SPIKELETS, WELL FILLED GRAINS AND SINK CAPACITY OF RICE CROP
Field experiment Pot experiment
No. of
spikelets
/panicle
No. of well
filled
grains/panicle
Sink
capacity
(gm-2
)
No. of
spikelets
/panicle
No. of well
filled
grains/panicle
Sink
capacity
(gm-2
)
Light regimes
Normal white light
(400-700nm)
159.27a 123.08
a 1045.36
a 159.42
a 123.58
a 1722.01
a
Red light (600-700nm) 156.07a 120.16
a 1011.12
a 156.38
a 119.75
a 1656.80
a
Low light (50% of NL) 119.69b 106.69
b 643.06
b 139.12
b 108.19
b 1085.42
b
SEDiff. (±) 1.610 1.603 138.033 7.352 3.641 82.562
LSD (0.05) 3.581 3.570 307.53 15.586 7.718 175.03
n.s.: non significant, d.w.: dry weight Values with similar superscript letter within a column are not significantly different at P(0.05)
International Journal of Environmental & Agriculture Research (IJOEAR) ISSN:[2454-1850] [Vol-2, Issue-3, March- 2016]
Page | 70
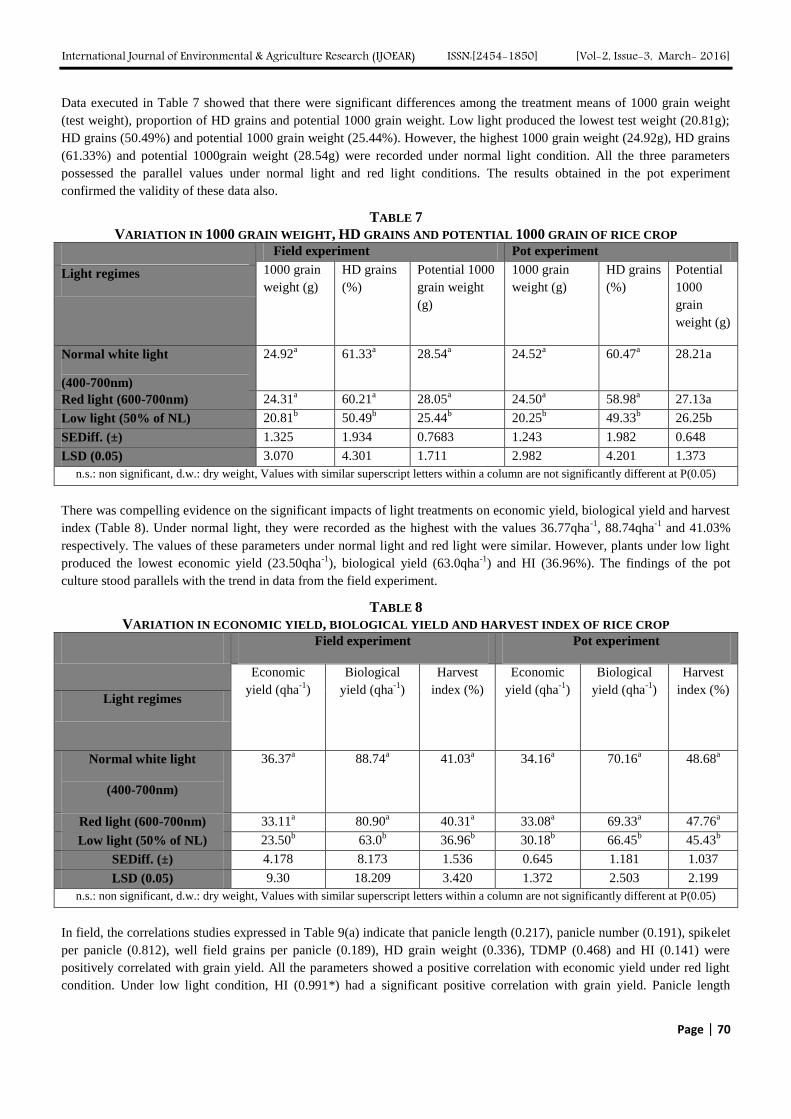
Data executed in Table 7 showed that there were significant differences among the treatment means of 1000 grain weight
(test weight), proportion of HD grains and potential 1000 grain weight. Low light produced the lowest test weight (20.81g);
HD grains (50.49%) and potential 1000 grain weight (25.44%). However, the highest 1000 grain weight (24.92g), HD grains
(61.33%) and potential 1000grain weight (28.54g) were recorded under normal light condition. All the three parameters
possessed the parallel values under normal light and red light conditions. The results obtained in the pot experiment
confirmed the validity of these data also.
TABLE 7
VARIATION IN 1000 GRAIN WEIGHT, HD GRAINS AND POTENTIAL 1000 GRAIN OF RICE CROP Field experiment Pot experiment
1000 grain
weight (g)
HD grains
(%)
Potential 1000
grain weight
(g)
1000 grain
weight (g)
HD grains
(%)
Potential
1000
grain
weight (g)
Light regimes
Normal white light
(400-700nm)
24.92a 61.33
a 28.54
a 24.52
a 60.47
a 28.21a
Red light (600-700nm) 24.31a 60.21
a 28.05
a 24.50
a 58.98
a 27.13a
Low light (50% of NL) 20.81b 50.49
b 25.44
b 20.25
b 49.33
b 26.25b
SEDiff. (±) 1.325 1.934 0.7683 1.243 1.982 0.648
LSD (0.05) 3.070 4.301 1.711 2.982 4.201 1.373
n.s.: non significant, d.w.: dry weight, Values with similar superscript letters within a column are not significantly different at P(0.05)
There was compelling evidence on the significant impacts of light treatments on economic yield, biological yield and harvest
index (Table 8). Under normal light, they were recorded as the highest with the values 36.77qha-1
, 88.74qha-1
and 41.03%
respectively. The values of these parameters under normal light and red light were similar. However, plants under low light
produced the lowest economic yield (23.50qha-1
), biological yield (63.0qha-1
) and HI (36.96%). The findings of the pot
culture stood parallels with the trend in data from the field experiment.
TABLE 8
VARIATION IN ECONOMIC YIELD, BIOLOGICAL YIELD AND HARVEST INDEX OF RICE CROP Field experiment Pot experiment
Economic
yield (qha-1
)
Biological
yield (qha-1
)
Harvest
index (%)
Economic
yield (qha-1
)
Biological
yield (qha-1
)
Harvest
index (%) Light regimes
Normal white light
(400-700nm)
36.37a 88.74
a 41.03
a 34.16
a 70.16
a 48.68
a
Red light (600-700nm) 33.11a 80.90
a 40.31
a 33.08
a 69.33
a 47.76
a
Low light (50% of NL) 23.50b 63.0
b 36.96
b 30.18
b 66.45
b 45.43
b
SEDiff. (±) 4.178 8.173 1.536 0.645 1.181 1.037
LSD (0.05) 9.30 18.209 3.420 1.372 2.503 2.199
n.s.: non significant, d.w.: dry weight, Values with similar superscript letters within a column are not significantly different at P(0.05)
In field, the correlations studies expressed in Table 9(a) indicate that panicle length (0.217), panicle number (0.191), spikelet
per panicle (0.812), well field grains per panicle (0.189), HD grain weight (0.336), TDMP (0.468) and HI (0.141) were
positively correlated with grain yield. All the parameters showed a positive correlation with economic yield under red light
condition. Under low light condition, HI (0.991*) had a significant positive correlation with grain yield. Panicle length

International Journal of Environmental & Agriculture Research (IJOEAR) ISSN:[2454-1850] [Vol-2, Issue-3, March- 2016]
Page | 71
(0.466), spikelet per panicle (0.377), well filled grain per panicle (0.478), HD grain weight (0.255) and TDMP (0.412) had
positive correlation with grain yield. Low light maintained negative correlation of Panicle/m2 area (-0.314) with grain yield.
The correlation studies from the pot culture data (Table 9b) exhibited that under normal light condition, number of panicle
per pot (0.892*) and number of well filled grains per panicle (0.836*) had significant positive correlations with economic
yield. Spikelet number per panicle (0.596), HD grain weight (0.644) and HI (0.778) were also positively correlated with
grain yield. Under red light condition, panicle length (0.890*) and HD grain weight (0.816*) only maintained significant
positive relationship with economic yield. Panicle number per pot (0.610), number of spikelet per panicle (0.391), number of
well filled grains per panicle (0.293), leaf area (0.157), TDMP (0.385) and HI (0.752) were positively correlated with grain
yield. Under shade condition, panicle length (0.360), well filled grains per panicle (0.563), HD grain weight (0.393) and HI
(0.641) were positively correlated with economic yield. Panicle number per pot, spikelet per panicle, and TDMP, were
negatively correlated with grain yield.
TABLE 9
RELATIONSHIP OF GRAIN YIELD WITH YIELD ATTRIBUTING PARAMETERS UNDER DIFFERENT LIGHT
REGIMES
(a)
In Field
Panicle
length
Panicle/m2 Spikelet/panicle Well filled
grains/Panicle
HD grain
weight
TDMP HI
NL 0.217 0.191 0.182 0.109 0.366 0.468 0.141
RL 0.700 0.122 0.521 0.169 0.086 0.468 0.272
LL 0.466 -0.300 0.377 0.478 0.255 0.412 0.991*
(b)
In Pot
culture
NL 0.588 0.892* 0.596 0.863* 0.644 0.760 0.778
RL 0.890* 0.610 0.391 0.293 0.816* 0.385 0.752
LL 0.360 -0.179 -0.363 0.563 0.393 0.248 0.641
NL: Normal white light, RL: Red light, LL: Low light (50% of NL), * Significance at P(0.05).
VII. DISCUSSION
In the present study, several physiological parameters (e.g. TDMP, TCC, N contents, yield and yield attributes) except LAI
were reduced markedly by low light in comparison to red light and normal light both in filed and pot culture conditions. The
effects of the light regimes have been studied at the canopy level of the crop. Light intensity declined gradually ‘above and
below canopy’ from panicle to flowering stages under normal white light, red light and low light conditions. Hoover (1934)
stated utilization of incident solar radiation by crops of different structures. The rate of photosynthesis and light intensity has
a linear relationship, photosynthesis increases with increase in light intensity and declines at light saturation point. In
photosynthesis, the only radiation absorbed by chlorophyll is limited to wave band 400-700 nm (PAR). In our field and pot
culture studies, light intensity at canopy level was in conformity within the normal ranges (full sunlight: 2500-4500 Em-2
and cloudy: 250-1000Em-2
), which prevail in Northeast India. The percentage utilization of energy in photosynthesis is
maximal (2.5-3%) at about 100-200 K Cal m-2
hr-1
. This relationship suggests that L (Leaf area index) should be sufficiently
high to absorb as much as possible of the incoming solar energy. The condition involves some mutual shading of leaves, but
still higher L with more severe mutual shading has adverse effects.
International Journal of Environmental & Agriculture Research (IJOEAR) ISSN:[2454-1850] [Vol-2, Issue-3, March- 2016]
Page | 72
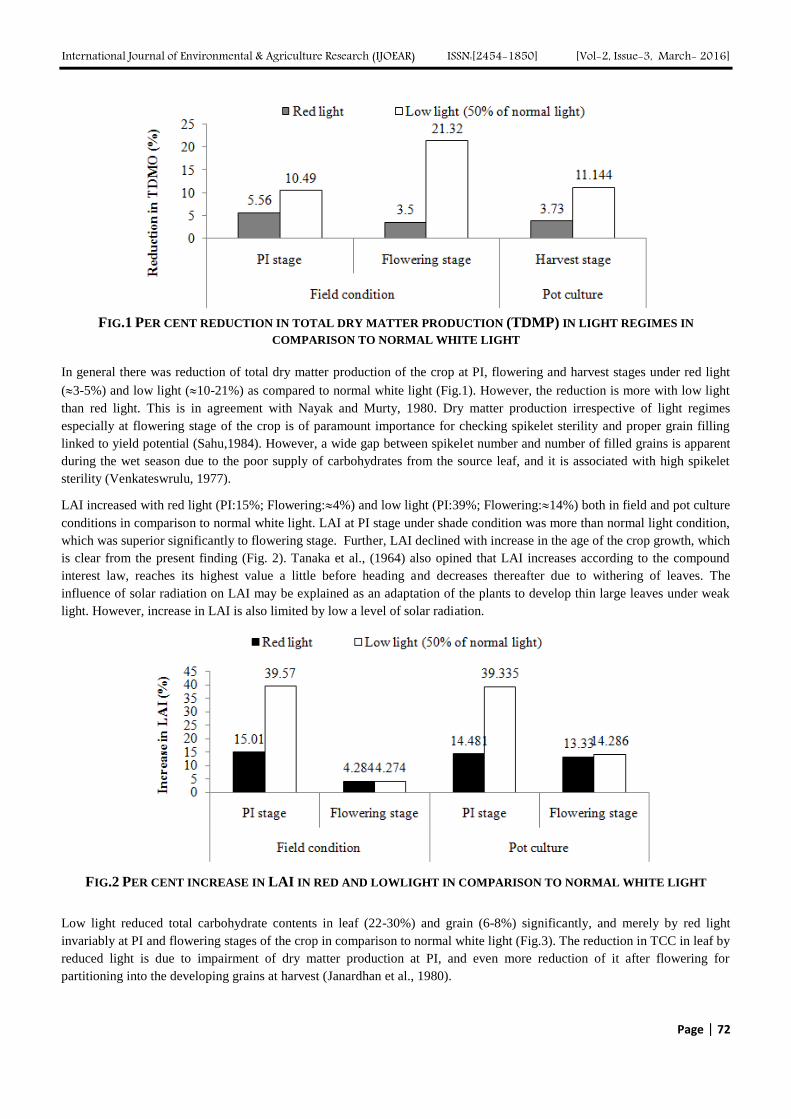
FIG.1 PER CENT REDUCTION IN TOTAL DRY MATTER PRODUCTION (TDMP) IN LIGHT REGIMES IN
COMPARISON TO NORMAL WHITE LIGHT
In general there was reduction of total dry matter production of the crop at PI, flowering and harvest stages under red light
(3-5%) and low light (10-21%) as compared to normal white light (Fig.1). However, the reduction is more with low light
than red light. This is in agreement with Nayak and Murty, 1980. Dry matter production irrespective of light regimes
especially at flowering stage of the crop is of paramount importance for checking spikelet sterility and proper grain filling
linked to yield potential (Sahu,1984). However, a wide gap between spikelet number and number of filled grains is apparent
during the wet season due to the poor supply of carbohydrates from the source leaf, and it is associated with high spikelet
sterility (Venkateswrulu, 1977).
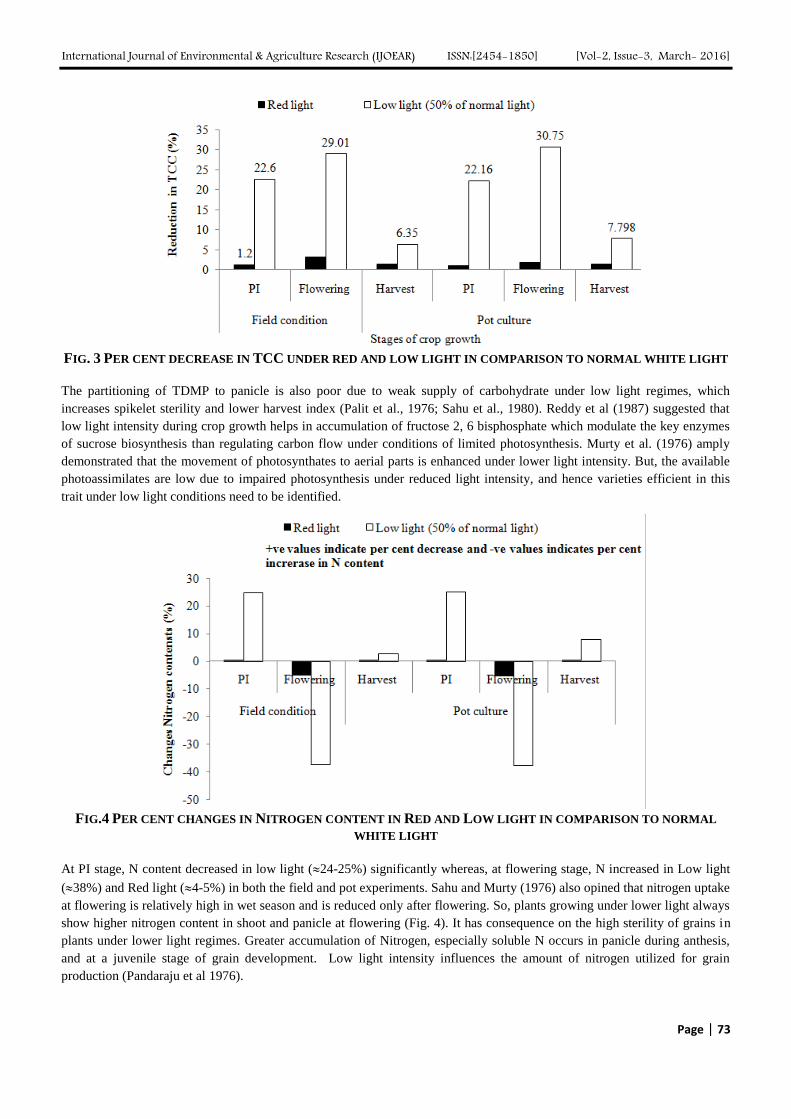
LAI increased with red light (PI:15%; Flowering:4%) and low light (PI:39%; Flowering:14%) both in field and pot culture
conditions in comparison to normal white light. LAI at PI stage under shade condition was more than normal light condition,
which was superior significantly to flowering stage. Further, LAI declined with increase in the age of the crop growth, which
is clear from the present finding (Fig. 2). Tanaka et al., (1964) also opined that LAI increases according to the compound
interest law, reaches its highest value a little before heading and decreases thereafter due to withering of leaves. The
influence of solar radiation on LAI may be explained as an adaptation of the plants to develop thin large leaves under weak
light. However, increase in LAI is also limited by low a level of solar radiation.
FIG.2 PER CENT INCREASE IN LAI IN RED AND LOWLIGHT IN COMPARISON TO NORMAL WHITE LIGHT
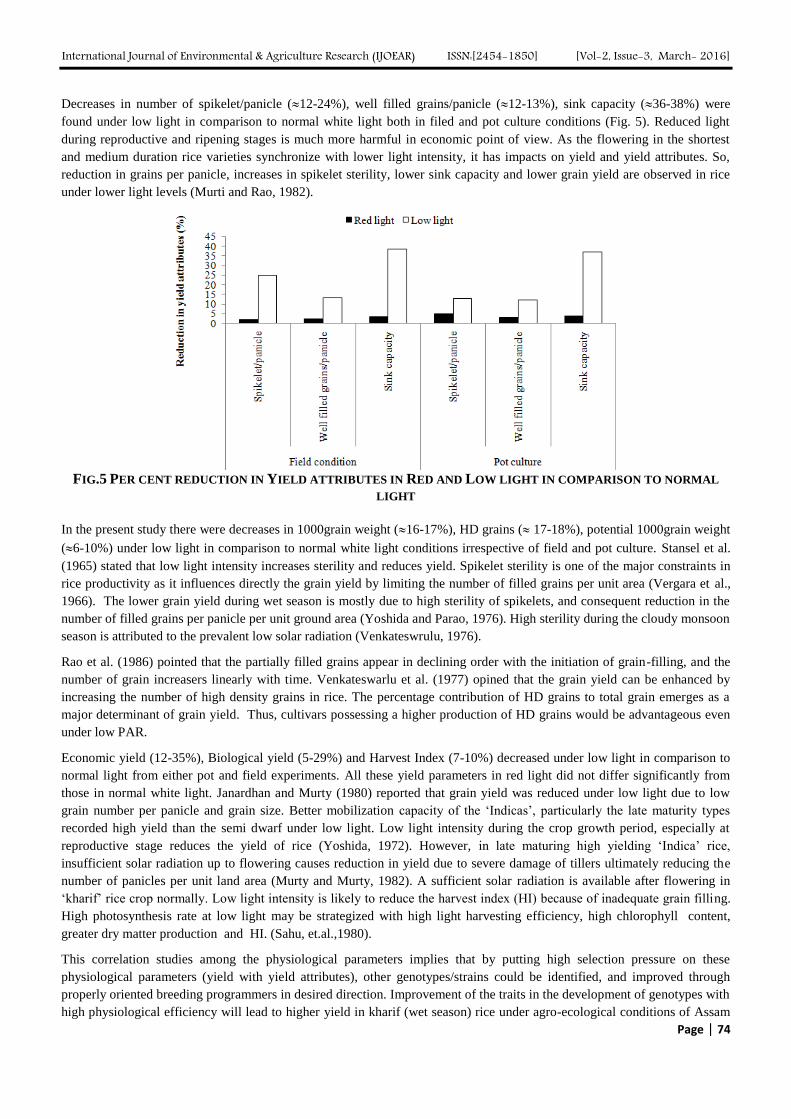
Low light reduced total carbohydrate contents in leaf (22-30%) and grain (6-8%) significantly, and merely by red light
invariably at PI and flowering stages of the crop in comparison to normal white light (Fig.3). The reduction in TCC in leaf by
reduced light is due to impairment of dry matter production at PI, and even more reduction of it after flowering for
partitioning into the developing grains at harvest (Janardhan et al., 1980).
International Journal of Environmental & Agriculture Research (IJOEAR) ISSN:[2454-1850] [Vol-2, Issue-3, March- 2016]
Page | 73
FIG. 3 PER CENT DECREASE IN TCC UNDER RED AND LOW LIGHT IN COMPARISON TO NORMAL WHITE LIGHT
The partitioning of TDMP to panicle is also poor due to weak supply of carbohydrate under low light regimes, which
increases spikelet sterility and lower harvest index (Palit et al., 1976; Sahu et al., 1980). Reddy et al (1987) suggested that
low light intensity during crop growth helps in accumulation of fructose 2, 6 bisphosphate which modulate the key enzymes
of sucrose biosynthesis than regulating carbon flow under conditions of limited photosynthesis. Murty et al. (1976) amply
demonstrated that the movement of photosynthates to aerial parts is enhanced under lower light intensity. But, the available
photoassimilates are low due to impaired photosynthesis under reduced light intensity, and hence varieties efficient in this
trait under low light conditions need to be identified.
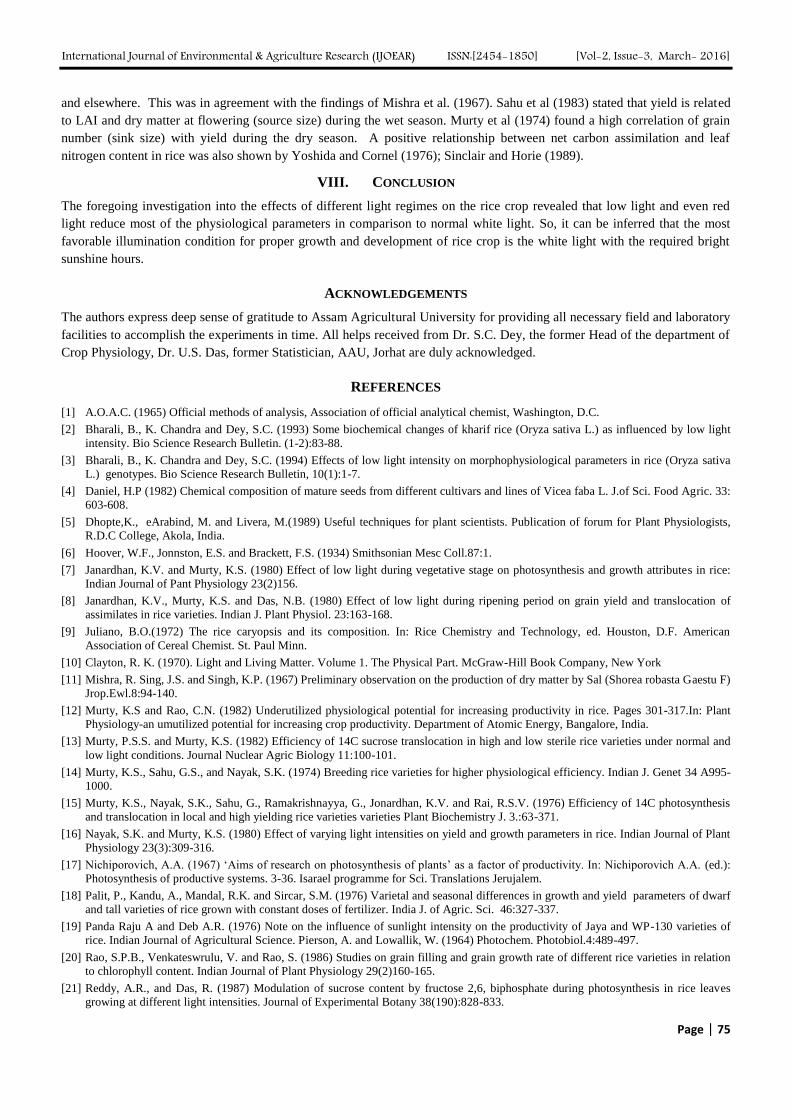
FIG.4 PER CENT CHANGES IN NITROGEN CONTENT IN RED AND LOW LIGHT IN COMPARISON TO NORMAL
WHITE LIGHT
At PI stage, N content decreased in low light (24-25%) significantly whereas, at flowering stage, N increased in Low light
(38%) and Red light (4-5%) in both the field and pot experiments. Sahu and Murty (1976) also opined that nitrogen uptake
at flowering is relatively high in wet season and is reduced only after flowering. So, plants growing under lower light always
show higher nitrogen content in shoot and panicle at flowering (Fig. 4). It has consequence on the high sterility of grains in
plants under lower light regimes. Greater accumulation of Nitrogen, especially soluble N occurs in panicle during anthesis,
and at a juvenile stage of grain development. Low light intensity influences the amount of nitrogen utilized for grain
production (Pandaraju et al 1976).
International Journal of Environmental & Agriculture Research (IJOEAR) ISSN:[2454-1850] [Vol-2, Issue-3, March- 2016]
Page | 74
Decreases in number of spikelet/panicle (12-24%), well filled grains/panicle (12-13%), sink capacity (36-38%) were
found under low light in comparison to normal white light both in filed and pot culture conditions (Fig. 5). Reduced light
during reproductive and ripening stages is much more harmful in economic point of view. As the flowering in the shortest
and medium duration rice varieties synchronize with lower light intensity, it has impacts on yield and yield attributes. So,
reduction in grains per panicle, increases in spikelet sterility, lower sink capacity and lower grain yield are observed in rice
under lower light levels (Murti and Rao, 1982).
FIG.5 PER CENT REDUCTION IN YIELD ATTRIBUTES IN RED AND LOW LIGHT IN COMPARISON TO NORMAL
LIGHT
In the present study there were decreases in 1000grain weight (16-17%), HD grains ( 17-18%), potential 1000grain weight
(6-10%) under low light in comparison to normal white light conditions irrespective of field and pot culture. Stansel et al.
(1965) stated that low light intensity increases sterility and reduces yield. Spikelet sterility is one of the major constraints in
rice productivity as it influences directly the grain yield by limiting the number of filled grains per unit area (Vergara et al.,
1966). The lower grain yield during wet season is mostly due to high sterility of spikelets, and consequent reduction in the
number of filled grains per panicle per unit ground area (Yoshida and Parao, 1976). High sterility during the cloudy monsoon
season is attributed to the prevalent low solar radiation (Venkateswrulu, 1976).
Rao et al. (1986) pointed that the partially filled grains appear in declining order with the initiation of grain-filling, and the
number of grain increasers linearly with time. Venkateswarlu et al. (1977) opined that the grain yield can be enhanced by
increasing the number of high density grains in rice. The percentage contribution of HD grains to total grain emerges as a
major determinant of grain yield. Thus, cultivars possessing a higher production of HD grains would be advantageous even
under low PAR.
Economic yield (12-35%), Biological yield (5-29%) and Harvest Index (7-10%) decreased under low light in comparison to
normal light from either pot and field experiments. All these yield parameters in red light did not differ significantly from
those in normal white light. Janardhan and Murty (1980) reported that grain yield was reduced under low light due to low
grain number per panicle and grain size. Better mobilization capacity of the ‘Indicas’, particularly the late maturity types
recorded high yield than the semi dwarf under low light. Low light intensity during the crop growth period, especially at
reproductive stage reduces the yield of rice (Yoshida, 1972). However, in late maturing high yielding ‘Indica’ rice,
insufficient solar radiation up to flowering causes reduction in yield due to severe damage of tillers ultimately reducing the
number of panicles per unit land area (Murty and Murty, 1982). A sufficient solar radiation is available after flowering in
‘kharif’ rice crop normally. Low light intensity is likely to reduce the harvest index (HI) because of inadequate grain filling.
High photosynthesis rate at low light may be strategized with high light harvesting efficiency, high chlorophyll content,
greater dry matter production and HI. (Sahu, et.al.,1980).
This correlation studies among the physiological parameters implies that by putting high selection pressure on these
physiological parameters (yield with yield attributes), other genotypes/strains could be identified, and improved through
properly oriented breeding programmers in desired direction. Improvement of the traits in the development of genotypes with
high physiological efficiency will lead to higher yield in kharif (wet season) rice under agro-ecological conditions of Assam
International Journal of Environmental & Agriculture Research (IJOEAR) ISSN:[2454-1850] [Vol-2, Issue-3, March- 2016]
Page | 75
and elsewhere. This was in agreement with the findings of Mishra et al. (1967). Sahu et al (1983) stated that yield is related
to LAI and dry matter at flowering (source size) during the wet season. Murty et al (1974) found a high correlation of grain
number (sink size) with yield during the dry season. A positive relationship between net carbon assimilation and leaf
nitrogen content in rice was also shown by Yoshida and Cornel (1976); Sinclair and Horie (1989).
VIII. CONCLUSION
The foregoing investigation into the effects of different light regimes on the rice crop revealed that low light and even red
light reduce most of the physiological parameters in comparison to normal white light. So, it can be inferred that the most
favorable illumination condition for proper growth and development of rice crop is the white light with the required bright
sunshine hours.
ACKNOWLEDGEMENTS
The authors express deep sense of gratitude to Assam Agricultural University for providing all necessary field and laboratory
facilities to accomplish the experiments in time. All helps received from Dr. S.C. Dey, the former Head of the department of
Crop Physiology, Dr. U.S. Das, former Statistician, AAU, Jorhat are duly acknowledged.
REFERENCES
[1] A.O.A.C. (1965) Official methods of analysis, Association of official analytical chemist, Washington, D.C.
[2] Bharali, B., K. Chandra and Dey, S.C. (1993) Some biochemical changes of kharif rice (Oryza sativa L.) as influenced by low light
intensity. Bio Science Research Bulletin. (1-2):83-88.
[3] Bharali, B., K. Chandra and Dey, S.C. (1994) Effects of low light intensity on morphophysiological parameters in rice (Oryza sativa
L.) genotypes. Bio Science Research Bulletin, 10(1):1-7.
[4] Daniel, H.P (1982) Chemical composition of mature seeds from different cultivars and lines of Vicea faba L. J.of Sci. Food Agric. 33:
603-608.
[5] Dhopte,K., eArabind, M. and Livera, M.(1989) Useful techniques for plant scientists. Publication of forum for Plant Physiologists,
R.D.C College, Akola, India.
[6] Hoover, W.F., Jonnston, E.S. and Brackett, F.S. (1934) Smithsonian Mesc Coll.87:1.
[7] Janardhan, K.V. and Murty, K.S. (1980) Effect of low light during vegetative stage on photosynthesis and growth attributes in rice:
Indian Journal of Pant Physiology 23(2)156.
[8] Janardhan, K.V., Murty, K.S. and Das, N.B. (1980) Effect of low light during ripening period on grain yield and translocation of
assimilates in rice varieties. Indian J. Plant Physiol. 23:163-168.
[9] Juliano, B.O.(1972) The rice caryopsis and its composition. In: Rice Chemistry and Technology, ed. Houston, D.F. American
Association of Cereal Chemist. St. Paul Minn.
[10] Clayton, R. K. (1970). Light and Living Matter. Volume 1. The Physical Part. McGraw-Hill Book Company, New York
[11] Mishra, R. Sing, J.S. and Singh, K.P. (1967) Preliminary observation on the production of dry matter by Sal (Shorea robasta Gaestu F)
Jrop.Ewl.8:94-140.
[12] Murty, K.S and Rao, C.N. (1982) Underutilized physiological potential for increasing productivity in rice. Pages 301-317.In: Plant
Physiology-an umutilized potential for increasing crop productivity. Department of Atomic Energy, Bangalore, India.
[13] Murty, P.S.S. and Murty, K.S. (1982) Efficiency of 14C sucrose translocation in high and low sterile rice varieties under normal and
low light conditions. Journal Nuclear Agric Biology 11:100-101.
[14] Murty, K.S., Sahu, G.S., and Nayak, S.K. (1974) Breeding rice varieties for higher physiological efficiency. Indian J. Genet 34 A995-
1000.
[15] Murty, K.S., Nayak, S.K., Sahu, G., Ramakrishnayya, G., Jonardhan, K.V. and Rai, R.S.V. (1976) Efficiency of 14C photosynthesis
and translocation in local and high yielding rice varieties varieties Plant Biochemistry J. 3.:63-371.
[16] Nayak, S.K. and Murty, K.S. (1980) Effect of varying light intensities on yield and growth parameters in rice. Indian Journal of Plant
Physiology 23(3):309-316.
[17] Nichiporovich, A.A. (1967) ‘Aims of research on photosynthesis of plants’ as a factor of productivity. In: Nichiporovich A.A. (ed.):
Photosynthesis of productive systems. 3-36. Isarael programme for Sci. Translations Jerujalem.
[18] Palit, P., Kandu, A., Mandal, R.K. and Sircar, S.M. (1976) Varietal and seasonal differences in growth and yield parameters of dwarf
and tall varieties of rice grown with constant doses of fertilizer. India J. of Agric. Sci. 46:327-337.
[19] Panda Raju A and Deb A.R. (1976) Note on the influence of sunlight intensity on the productivity of Jaya and WP-130 varieties of
rice. Indian Journal of Agricultural Science. Pierson, A. and Lowallik, W. (1964) Photochem. Photobiol.4:489-497.
[20] Rao, S.P.B., Venkateswrulu, V. and Rao, S. (1986) Studies on grain filling and grain growth rate of different rice varieties in relation
to chlorophyll content. Indian Journal of Plant Physiology 29(2)160-165.
[21] Reddy, A.R., and Das, R. (1987) Modulation of sucrose content by fructose 2,6, biphosphate during photosynthesis in rice leaves
growing at different light intensities. Journal of Experimental Botany 38(190):828-833.
International Journal of Environmental & Agriculture Research (IJOEAR) ISSN:[2454-1850] [Vol-2, Issue-3, March- 2016]
Page | 76
[22] Sahu, G. and Murty, K.S. (1976) Seasonal influence of on dry matter production, nitrogen uptake and yield in rice varieties. Indian
Agric. 20:43-50.
[23] Sahu, G., Rao, CHN and Murty, K.S. (1983) Influence and temperature and solar radiation on growth and yield of rice. Oryza 20:51-
54.
[24] Sahu, G., Murty, K.S. and Rai, R.S. (1980) Effect of season, nitrogen rate and plant density on harvest index in rice. Oryza 17:28-33.
[25] Sahu,G.(1984) Screening for shade tolerance in rice. Intl. Rice Res. Newl. 9(3)26-27. Sharma, R., Sopory, S.K. and Guha Mukherjee,
S. (1976) Phytochrome regulation of peroxidase activity in maize. Plant Science Letters, 6:69-75.
[26] Sinclair, T.R., Horie, T. (1989) Leaf nitrogen, photosynthesis and crop radiation use efficiency. A review Crop Science 29:90-98.
[27] Stansel, J.W., Bolli, C.N., Thysell, J.R. and Hall, V.L. (1965) The influence of light intensity and nitrogen fertility on rice yield and
components of yield. Rice Journal 68:34-35.
[28] Tanaka, A., Navascro, S.A., Ga, C.V., Parao, F.T. and Ramirez, E. (1964) Growth habit of the rice plant in the tropics and its effect on
nitrogen response. Technical Bulletin. The Intl. Rice Rese. Institute, Philippines, 45-47.
[29] Venkateswrulu, B., Prasad, V.V.S.S. and Rao, A.V. (1977) Effects of low light intensity on different growth phases in rice (Oryza
sativa L.) Plant and Soil 47:837-847.
[30] Venkateswrulu, B. and Visperas, R.M. (1987) Solar radiation and rice productivity. IRRI Research Paper Series. 129:3.
[31] Venkateswrulu, B.(1976) Source sink interrelationship in low land rice. Plant and Soil 44:575-586.
[32] Venkateswrulu, B. (1977) Influence of light intensity on growth and productivity of rice (Oryza sativa L.) Plant Soil 47:712-719.
[33] Vergara, B.S., Jackson, B. and De Dutta (1976) In ‘Climate and Rice’ IRRI, Philippines, 301-3016.
[34] Voskresenskaya, N.P. (1972) Effects of light quality on carbon metabolism, In ‘Encyclopedia of plant Physiol.’ 6:177.
[35] Voskresenenskya, N.P.(1979) Effects of light quality on carbon metabolism, In ‘Encyclopedia of plant Physiol.’ 6:174-179.
[36] Yoshida, S. and Cornel, V. (1976) Nitrogen nutrition, leaf resistance and leaf photosynthesis rate of rice plant. Soil Sci. Plant Nutrn.
22(2):207-211.
[37] Yoshida, S. and Parao, F.T. (1976) Climatic influence on yield and yield components of low land rice in the tropics, 474-494. In:
IRRI, Climate and Rice, Los Banos, Philippines. Soil Science and Plant Nutrition, 23(1), 93-107.
[38] Yoshida, S. (1976) Physiological consequences of altering plant type and maturity. In: Proc. Of Intl. rice Res. Conf. Intl. rice Res.
Inst. Los Banos, Philippines.
[39] Yoshida, S., Douglasa, A forno, JAMESH Coak Kwanchai, Gomez, A. (1976) Measurement of leaf area and leaf area index.
Laboratory Manual for Physiological Studies of Rice, 69-71.
[40] Yoshida, S. (1972) Physiological aspects of grain yield. Annual Review of Plant Physiology 23:437-464.