Embed Size (px)
Citation preview

1
EFFECTS OF MEGALAC®-R SUPPLEMENTATION ON MEASURES OF INFLAMMATION AND PERFORMANCE IN TRANSPORT-STRESSED BEEF CALVES
By
DAVI BRITO DE ARAUJO
A THESIS PRESENTED TO THE GRADUATE SCHOOL OF THE UNIVERSITY OF FLORIDA IN PARTIAL FULFILLMENT
OF THE REQUIREMENTS FOR THE DEGREE OF MASTER OF SCIENCE
UNIVERSITY OF FLORIDA
2009

2
© 2009 Davi Brito de Araujo

3
To my mother Arlete, my father Dudu and my sister Mazinha “Saudade existe para quem sabe ter...”

4
ACKNOWLEDGMENTS
I am deeply indebted to Dr. John D. Arthington, my supervisory committee chair. Dr.
Arthington provided endless encouragement, opportunities, guidance, and financial support. I am
proud of the chance that I had to work with him and I will always consider Dr. Arthington as an
excellent mentor and great friend. I appreciate his patience during my first steps trying to learn a
new language and to live in a new country. Dr Arthington’s character, professionalism and
attitudes are the best lessons I have learned to build my future.
I thank all members of my committee who provided important support throughout my
M.S. program. Dr. Matt Hersom gave me the opportunity to work with his group in two research
projects which became essential to my professional development. I also like to show my
appreciation for Dr. Charles Staples for guidance and help during research trials in his
laboratory. In addition, I would like to express appreciation to Dr. Bill Brown for his assistance
during my first weeks in Gainesville, and his dedication for teaching the importance of the
principles of the ruminant nutrition.
I am very fortunate to have had Dr. Lynn Sollenberger, Dr. Joel Brendemuhl, Prof.
Ashlee Mantooth, Dr. Adesogan Adegbola, Dr. Joel Yelich, Dr. William Thatcher, Dr. Tim
Olson, Dr. Goeffrey Dahl, Dr. Michael Fields, Dr. Dan Sharp and Dr. Cliff Lamb as professors.
They have made a huge contribution on the improvement of my knowledge, criticism, and
professionalism during my 2 years at the U. F. Special thanks go to Dr. Garry Hansen and all his
family who treated me as a son during the 4 weeks I spent in Marianna, FL, and to Dr. Chad
Chase Jr. for his assistance during my first experiment at the IFAS – USDA – STARS,
Brooksville, FL. I extend my appreciation to Dr. Peter Hansen who more than a professor,
became also a mentor and friend. Dr. Hansen is a great man, father and an excellent scientist.

5
Science is so much easy and pleasant with him. Thanks also to Dr. Richard Miles for his
guidance during seminars, friendship, and jokes.
I extend my utmost sincere appreciation to my parents who never stopped supporting me
in any decision that I made in life. Their unconditional love, moral presence and courage have
taught me to never quit, and always try to be happy. They always encouraged my sister and I to
look towards the future and experience life. I thank them for always being there for me. I also
would like to thank my beloved grandmother Eivany “Vó Ni” for her endless love and influence
during my childhood on choosing the profession that I work in today. I am very appreciated for
all company, friendship and moments which I have shared with my little sister Marília. My sister
was essential to make my life beautiful during the four months that she spent with me here in
USA.
I am very grateful to my girlfriend Mariele Pansani. She was very important in helping
me during the conclusion of this thesis. Her loveliness, serenity, amicability, attitude and
intelligence have always encouraged and inspired me. After I met Mariele I have learned that
even the most difficult things are not impossible to happen. Mariele has been a truly present in
my life, because “the distance between us is just a geographical detail.”
Thanks to all my relatives that have supported me in any way to finish this step in my
journey. I really appreciate my grandparents Edmar “Vô Mar” and Maria Stela “Vó Tela” to be
the roots of my background. I want to thank my aunts and uncles Lica, Eliane, Teté, Carla,
Dema, Robertana and, specially Ulisses “in memoriam”, Sebastião, Tuti, Haidê “in memoriam”,
and Eliete who contributed to build my “cowboy” personality. Thanks also to my cousins Linho,
Lucas “Sequela”, Ju “Gorda”, Zé “Kusseco”, Danilo, Daniel “Tropeço”, Fael, Gus, Vi, Thiago,
Diego, Fer, Beco and Nana who never stopped believing in our selves , even when we are so far

6
from each other. Thanks to my godfather Edmundo “Tito” and his wife Paula, as well as my
godmother Mayara Brait for all support and phone calls. Special thanks go to my physician and
cousin Rodrigo Hoffmann and his wife Kelly who I have shared great moments in Miami and
Orlando, and on telephone. I also want to show my appreciation to Dona Júlia, Cidinha and
Genilda for the good food, hard work and friendship.
I am very grateful to my friends and staffs from the IFAS – Range Cattle R. E. C.,
specially Andrea Dunlap and Tony Woods who were my “every-time-help” and contributed to
improve my English skills. In the station, I had the opportunity to meet true friendship and had a
great work environment. Thanks to Mr. Alvin English, my buddies Austin Bateman and Joe
“Crazy” Aldana, Mr. Terry Neels, Mr. Jeffery Steele, Mr. Dennis Kalich, Clay Newman, Joshua
Sosa, Walt Beattie, Carly Althoff, Ms. Cindy Holley, Mrs. Kim Parks, Dr. Brent Sellers Ms.
Shirley Searcy, Dr. Qiu and Mrs. Christina Markham, and Paulo Gustavo. I would like to thank
my great friends João “Joe” Vendramini and Maria Lúcia “Malú” Silveira for every
conversation, advice, and the moments in their house where I always felt like home. Special
thanks go to Reinaldo “Anabol” and Flávia “Fuinha” Cooke for all their help and friendship.
Reinaldo was a tremendous contributor in my research.
Thanks go to Harvey Standland, David Thomas, Todd Mathews “in memoriam”, and
Don Jones for all their help during my research at the IFAS - N. F. R. E. C., Marianna, FL.
Special thanks also to “Butch” for his friendship, support and to make the work easier at the
station. I would also like to thank my friend Herb and the Limestone Country Club for quenching
me when it was necessary.
I thank my friend and mentor Dr. José “Zé” Eduardo Portela Santos as well as his family
Christiane, Dudu and Laura for all care, amity and guidance. Zé was responsible for teaching me

7
how to be a veterinarian, during my internship at the V. M. T. R. C. – U. C. Davis in 2005.
Today Zé is teaching me how to be professional scientist. Special thanks go to Fábio “Muzamba”
Lima a priceless friend, Heloísa “Xup” Rutigliano, Ralph Bruno and Daniele Resende for all
assistance and help during my days in Tulare, CA. We had very great time when we were
roommates in that small house. Very special thanks to my great friends Ronaldo “Drac-
Minininho-Preto” Cerri and his wife Mayra Cruppe for all “every-time-help”, guidance, and
friendship during the last 9 years. Ronaldo is important on contributing to build my character and
professionalism.
Heartfelt thanks go to my first professor and first advisor José “Zequinha” Luiz Moraes
de Vasconcelos and his family Carla, Gabriel and Rafaela for all encouragement, patience and
support during my 5 years of Vet School. Zequinha open the U. S. doors for me to start my M. S.
program. Zequinha is much more than a professor; he is also an estimated father, husband,
friend, mentor and leader. Special appreciation goes to Ricarda Maria dos Santos who really
showed me for the first time how good research really is made. Her friendship is precious.
Thanks also to Gabriela “Penada” Perez, Edmundo “Pigarro” Vilela and Nelson “Perna” Ferreira
Jr. for all friendship, belief and guidance during my years of undergraduate. Thanks to the
CONAPEC Jr. group where my dream started.
Thanks to my friend Jackie Warhmund who gave me the opportunity to help on her
research trial, Dr. Sam Kim for his valuable friendship and for teaching me all the fatty acid
analysis, and Serguei Sennikov and Joyce Hayen for their help during part of my laboratorial
analysis. I thank Mrs. Glenda Tucker and Mrs. Joann Fisher for all the help I have asked them.
Special thanks go to Mrs. Cora Webb for always taking care of our department and for her
kindness and “every-day-smile.”

8
Thanks to all the friends I made at the Department of Animal Science and in the U. S.
that direct or indirectly helped in research or my stay in Gainesville: Nick Lavieri and Luciano
Silva very estimated buddies; my officemates Oscar “Ataq” Queiroz, Eduardo “Cabrón” Alava,
Jamie Foster, Regina Esterman, Adriane Bell, Megan Thomas, Erin McKinniss, Ashley Hughes,
Katie Arriola, and Aline Monari; I want to thank my friends Linconl Zotarelli and Vanessa Silva,
Frank “Zé” Lissoni, Tânia Broisler and their kids João e Antônio, Jeremy Block, Cristina
Caldari-Torres, Tara Felix, J. G. Vickers, André Pedroso and his family, Sylvia Morais, Alain
Pozzo and Leanne Jepson, Franklin and Lidiane Behlau, Kathleen Pennington, Dillon Walker,
Milerky Perdomo, Drew Cotton, Qien Yang, Jim Moss and his family, Rosana Serikawa, Bruno
“Baiano” and Sylvia Pedreira, Flávio Avila, Juliano and Juliana Laran, Belén Rabaglino, Carlos
Canas, Bárbara Loureiro, Luciano and Aline Bonila, Maria Pádua, Dr. Aloísio Bueno, Tibério
Saraiva and his family, Robson Giglio, Marcelo Tamassia and Agda Barreirinhas, Cássio
Ferrigno and Vanessa Castro, Miguel Castillo, Alex Oliveira, Beatriz Bernardo, Augusto “Guto”
e Camila Brito, Bryan Thompson , and Rafael Bisinotto. Thanks to my “French” roommates
Jeremy “J” Campfield and Christopher “Chris” Catalouppe. I really have good time living with
those guys. I also want to thank my friends Lilian Oliveira and Izabella Thompson for helping
me correcting and formatting this chapter.
I want to thank my buddies Gabriel Soligo, Tiago Ruiz and Gustavo “Gu” Mazon for all
the great times in Jacksonville during the spring of 2008, mainly to Gu for all support, fellowship
and parties at the time we were roommates. Special thanks to my friends Bruno “Caboclo” do
Amaral and Flávio Silvestre who contributed a lot with their research and opinions to the success
and fulfillment of my thesis. In addition, I thank my classmates Matthew Kemp, Heather Welsh,

9
Michelle Texier, Seth Jenkins, Karen Chandler, Erin Mullen, and Kyle Fisk for making our
classes so more enjoyable.
I would like to expresses my appreciation to my good and old friends from my BNZ
fraternity for always giving me the pure friendship: Dona Teresa for everything and for every
day, Fausto “Tilango” and his wife Thamara, Mário “Brakiara, Mauro “Fudêncio, Pedro
Henrique “K-bção”, Tiago “Beudo”, Ivan “Cirola”, Marcel “Braxola”, Vinícius “Zorba”, Vagner
“K-t-to”, Guilherme “Pit Bull”, Gilherme “ Japa”, Pedro “Torresmo”, Rafael “ Corin”, Marcelo
“Fofão”, Natal “Paraquat”, Tomás “Panada”, Eduador “Dorrego”, Ruy “Genny” and Gabriel
“Spantaio”. Thanks to Aloysio “Guaxo”, Rafel “Spaia” and Tiago “Tocinho” for the help during
my experiments in Ona. I thank my best buddies Pietro “Peta” Micheri and Luciano Mazon for
always being present, even when absent. I would like to thank my sweet friends Leane “K-peta”
Oliveira, Juliana “Vareta” Pescara and Milena “Injú” Blanes for being in the same fight that I
am. I would like to thank my good and old friend Guilherme “Trôxa” Marquezini and his wife
Maria Fernanda Pardo for their friendship and provision attended me. Thanks also to my
unforgettable friend Tiziu “in memoriam.”
Last, but not least, I thank God for always blessing and helping me in any decision of my
life.

10
TABLE OF CONTENTS
page
ACKNOWLEDGMENTS ...............................................................................................................4
LIST OF TABLES .........................................................................................................................12
LIST OF FIGURES .......................................................................................................................13
LIST OF ABBREVIATIONS ........................................................................................................14
ABSTRACT ...................................................................................................................................17
CHAPTER
1 INTRODUCTION ..................................................................................................................19
2 LITERATURE REVIEW .......................................................................................................21
Lipids ......................................................................................................................................21 Definition of Dietary Lipids ............................................................................................21 Supplemental Fat Intake and Digestion ...........................................................................22 Fatty Acid Metabolism in the Rumen .............................................................................25 Fatty Acids Metabolism in Tissues .................................................................................26
Immune Function ....................................................................................................................29 The Acute-Phase Reaction ..............................................................................................30 Physiological Stress and Growth .....................................................................................32 Supplemental Fat, Stress and Growth .............................................................................36
3 EFFECTS OF MEGALAC®-R INCLUSION IN RECEIVING DIETS OF WEANED FEEDER STEERS ..................................................................................................................41
Materials and Methods ...........................................................................................................41 Animals and Facilities .....................................................................................................41 Diets .................................................................................................................................42 Sampling ..........................................................................................................................43 Blood analysis .................................................................................................................44 Statistical analysis ...........................................................................................................45
Results.....................................................................................................................................46 Measurements of Performance ........................................................................................46 Plasma Measurements and Coefficients of Correlation ..................................................47
Discussion ...............................................................................................................................48 Performance .....................................................................................................................48 Inflammatory Reaction ....................................................................................................50

11
4 EFFECTS OF MEGALAC®-R SUPPLEMENTATION ON MEASURES OF PERFORMANCE AND ACUTE-PHASE REACTION IN TRASPORTED BEEF HEIFERS ................................................................................................................................63
Material and Methods .............................................................................................................63 Animals and Facilities .....................................................................................................63 Diets .................................................................................................................................64 Sampling ..........................................................................................................................64 Blood Analysis ................................................................................................................65 Statistical Analysis ..........................................................................................................66
Results.....................................................................................................................................68 Measurements of Performance ........................................................................................68 Plasma Measurements and Coefficients of Correlation ..................................................68
Discussion ...............................................................................................................................69 Performance .....................................................................................................................69 Inflammatory Reaction ....................................................................................................69
5 GENERAL CONCLUSION ...................................................................................................83
LIST OF REFERENCES ...............................................................................................................84
BIOGRAPHICAL SKETCH .........................................................................................................96

12
LIST OF TABLES
Table page 3-1 Ingredients and nutrient composition of grain-based concentrate treatments fed to
steers during pre- and post-shipping phase of the study. 1 .................................................54
3-2 Fatty acid profile of supplemental fat sources used in the formulation of experimental diets. .............................................................................................................55
3-3 Nutrient composition of TMR fed to transport-stressed steers during the post-shipping phase of the study. ...............................................................................................56
3-4 Effect of supplemental fat source on plasma fatty acid concentrations on d 0 and d 29 of the study. ........................................................................................................................57
3-5 Correlations between plasma measurements, DMI and ADG of transport-stressed steers during post-shipping phase of the study. .................................................................59
4-1 Ingredient and nutrient composition of grain-based supplements fed heifers during the pre- and post-shipping phases of the study. .................................................................75
4-2 Fatty acid profile of supplemental fat source used in the formulation of experimental MG supplement ..................................................................................................................76
4-3 Nutrient composition of mineral and vitamin mix supplement .........................................77
4-4 Correlations between plasma measurements, DMI and ADG of transport-stressed heifers during post-shipping phase of the study. ...............................................................78

13
LIST OF FIGURES
Figure page 3-1 Least squares means of DMI of steers during the post-shipping phase of the study. ........60
3-2 Least squares means of covariately adjusted plasma fibrinogen concentrations of steers during the post-shipping phase of the study.. ..........................................................61
3-3 Least squares means of plasma ceruloplasmin concentrations of steers during the post-shipping phase of the study. .......................................................................................62
4-1 Least squares means for DMI of pen-fed heifers during the post-shipping phase of the study. ............................................................................................................................79
4-2 Post-shipping concentrations of plasma ceruloplasmin of heifers fed grain-based supplements containing Megalac®-R (MG) or no supplemental fat (CO) from 30 d before to 27 d after shipping ..............................................................................................80
4-3 Post-shipping concentrations of plasma cortisol of heifers fed grain-based supplements containing Megalac®-R (MG) or no supplemental fat (CO) from 30 d before to 27 d after shipping. .............................................................................................81
4-4 Plasma concentrations of haptoglobin of heifers fed grain-based supplements containing Megalac®-R (MG) or no supplemental fat (CO) from 30 d before to 27 d after shipping. ....................................................................................................................82

14
LIST OF ABBREVIATIONS
ADG average daily gain
APP acute-phase proteins
ARA arachidonic acid
BH biohydrogenation
BW body weight
CCK cholecystokinin
CLA conjugated linoleic acids
CNS central nervous system
CO control
COX cyclo-oxygenases
Cp ceruloplasmin
CP crude protein
CSFA calcium salts of fatty acids
CV coefficient of variation
DGLA dihomo-γ-linolenic acid
DHA docosahexaenoic acid
DMI dry matter intake
DPA docosapentaenoic acid
EN Energy Booster 100®
EPA eicosapentaenoic acid
ETA eicosatetraenoic acid
FA fatty acids
Fb fibrinogen
FL Florida

15
G:F gain to feed ratio
GLNA γ-linolenic acid
HETE hydroxyl-eicosatetraenoic acid
HPETE hydroperoxy-eicosatetraenoic acid
Hp haptoglobin
ID identification
IGF-1 insulin-like growth factor 1
IL-1 interleukin 1
IL-6 interleukin 6
LA linoleic acid
LNA α-linolenic acid
LPS lypopolysaccharide
LSD least significant difference
LT leukotrienes
MG Megalac®-R
MUFA monounsaturated fatty acids
NDF neutral detergent fiber
OM organic matter
PG prostaglandins
PUFA polyunsaturated fatty acids
SEM standard error of the mean
SFA saturated fatty acids
SD standard deviation
TDN total digestible nutrients
TNF-α tumoral necrosis factor α

16
TMR total mix ratio
TX thromboxanes
UFA unsaturated fatty acids
VFA volatile fatty acids

17
Abstract of Thesis Presented to the Graduate School of the University of Florida in Partial Fulfillment of the
Requirements for the Degree of Master of Science
EFFECTS OF MEGALAC®-R SUPPLEMENTATION ON MEASURES OF INFLAMMATION AND PERFORMANCE IN TRANSPORT-STRESSED BEEF CALVES
By
Davi Brito de Araujo
August 2009 Chair: John David Arthington Major: Animal Sciences Two studies were conducted to evaluate measures of performance and inflammation in
transport-stressed beef calves supplemented with saturated or unsaturated fatty acids. In the first
study, prior to transport (d -40 to 0), 64 weaned, Braford steers were stratified by initial BW and
age, and randomly allocated to 2 pastures. Each pasture was randomly assigned to receive 1 of 2
treatments, which consisted of grain-based supplements with (EN) or without (CO) the inclusion
of a prilled saturated fat source (Energy Booster 100®). On d 0, steers were loaded onto a
commercial trailer and transported for approximately 1,600 km over a 24 h period and delivered
to a feedlot. Upon arrival (d 1), steers were stratified by pre-shipping treatment and randomly re-
assigned in to receive EN, CO, or MG (grain-based supplement containing Megalac®-R). Shrunk
BW was recorded on d -40, 0 and 30 to determine ADG. Individual DMI was recorded daily
during the post-shipping period using the GrowSafe® system (Model 4000E). Blood samples
were collected on d 0, 1, 4, 8, 15, 22 and 29 for determination of fibrinogen and ceruloplasmin
concentrations. No pre-treatment effects or pre- x post-shipping treatment interactions were
observed. During the post-shipping phase, steers fed MG had decreased (P < 0.05) ADG and
lower mean DMI (P < 0.01) compared to CO-fed steers (0.80 and 1.04 kg/d, and 2.37 and 2.80%
of BW, respectively). Steers fed MG had poorer G:F (P < 0.05) compared to EN steers, and

18
tended (P = 0.10) to have decreased G:F compared to CO-fed steers (0.37, 0.35 and 0.29 mean
G:F for EN, CO and MG steers, respectively).
In the second study, prior to shipping (d -30 to 0), 48 Brahman-crossbred heifers were
stratified by initial BW and randomly allocated to 6 pastures. Each pasture was randomly
assigned to receive 1 of 2 daily supplement treatments, consisting of a grain-based supplement,
with (MG) or without (CO) the inclusion of Megalac®-R. On d 0, heifers were transported for
approximately 1,600 km over a 24 hour period. Upon arrival (d 1), 24 of the 48 heifers were
stratified by BW and assigned to individual feedlot pens. Pre-shipping treatment allocation
continued in the post-shipping phase. Shrunk BW was recorded on d -30, 1 and 28 to determine
ADG. Individual voluntary hay intake was recorded daily from d 1 to 28. Blood samples were
collected on d 0, 1, 4, 8, 15, 22 and 28 were used to determine plasma concentrations of
ceruloplasmin, haptoglobin, and cortisol. A treatment x time interaction was detected for
haptoglobin (P < 0.01) because MG-fed heifers had decreased (P < 0.05) haptoglobin
concentrations on d 1, 3 and 5, relative to transport, compared with CO-fed heifers.
These data imply that that Megalac®-R supplementation appears to negatively affect
performance of transport-stressed beef calves; decreasing ADG, DMI and G:F. In addition, the
acute-phase reaction following transport appears to be modulated when Megalac®-R is
supplemented to beef calves at least 30 d prior shipping.

19
CHAPTER 1 INTRODUCTION
In 2007, the beef cow herd of Florida (FL) was composed of 936,000 head and 68% of
this herd was located in the Southern half of the state. The calves marketed from FL in 2007
totaled 721,000 head, over 80% of the calf crop (USDA-NASS, 2008). Nationally, FL ranked
12th in beef cows and 18th in total cattle, and its beef industry consists basically of cow-calf
enterprises with high British-Brahman crossbred genetic influence and grazed pasture as the
major source of nutrition.
Florida is the leading state in the United States for the number of large cow/calf
operations (> 2,500 cows; USDA, 2002), with no commercial feedlot industry in FL, nearly all
market steers are weaned and shipped outside of the state for further growing and finishing
(Arthington et al., 2008). For example, Texas is the state which receives the majority of FL-
market calves, and it is located approximately 2,400 km to the west. This isolation results in
important impacts on subsequent animal health and performance, caused mainly by stressors
associated with weaning, weather changes and transportation. In the U.S., the calf morbidity and
mortality associated with respiratory disease and shipping fever complex is estimated to cost
approximately $500 million to the beef industry (NASS, 1996). Many factors contribute to the
cost of these diseases, such as pharmaceutical purchase, feed resources lost, increased labor,
death and poor performance of animals (Loerch & Fluharty, 1999).
Marketing processes at feedlot arrival are crucial events causing a considerable amount of
stress for cattle. Most of the health problems with newly arrived calves occur within the first 2
weeks due to the impact of stress on feed intake and immunocompetency (Fluharty & Loerch,
1997). Previous studies have evaluated the effects of weaning management and transportation on
the acute-phase reaction and performance of beef calves (Arthington et al., 2003 and 2005), and

20
indicate that plasma concentrations of acute-phase proteins (APP) are significantly affected by
these procedures, and may be used as an indicator of stress and performance of these animals.
The inclusion of polyunsaturated fatty acids (PUFA) into diets has been shown to
modulate immune responses (Calder et al., 2002). The majority of PUFA originating from
common feedstuffs are extensively modified in the rumen (Palmquist & Jenkins, 1980), and the
addition of calcium soaps of fatty acids into diets may provide protection of these PUFA from
the rumen microorganisms (Ngidi et al., 1990). Being a rumen-inert technology, the
supplementation of Megalac®-R (Church & Dwight Co., Inc. Princeton) might be a management
option for increasing the delivery of PUFA to the small intestine, providing essential precursors
for modulating the immune system.
For these reasons, two experiments were conducted to evaluate the effect of supplemental
Megalac®-R on measures of performance and physiological responses of growing cattle
following transportation.

21
CHAPTER 2 LITERATURE REVIEW
Lipids
Definition of Dietary Lipids
Lipids are a chemically diverse group of compounds defined commonly by their
insolubility in water, but are generally soluble in organic solvents. Dietary lipids of significant
importance include fatty acids (FA), triglycerides, cholesterol and esters of cholesterol, and fat-
soluble vitamins (Spallholz et al., 1999). Lipids have multiple functions including supplying
dietary energy, serving as a source of heat, insulation and protection for the animal body,
providing essential FA, and serving as a carrier for absorption of fat-soluble vitamins (Jurgens,
2002).
The fats and oils used almost universally as stored forms of energy in living organism are
derivates of fatty acids (Nelson & Cox, 2005). Although fat usually comprises less than 5% of
the ruminant diet, ruminants depend more on nonglucose metabolites for energy metabolism than
nonruminants (Palmquist & Jenkins, 1980). Traditionally, in beef cattle grazing systems, pasture
is the primary feed source and the range of FA content in forages varies widely from 1.6 to 10%
(Clapham, 2005). In green plants, FA are predominantly in the form of glycolipids and
phospholipids. Glycolipids account for 70 to 80% of ether extract in plant leaves whereas the
concentration of triacylglycerol is negligible in the leaf (Harfoot, 1978). In contrast,
triacylglycerols are the primary lipid in grains and whole seeds, and triacylglycerol are the major
lipid class in the diet of cows fed in confinement management programs, unless fat sources
containing free FA are included as dietary components of the ration (Doreau & Ferlay, 2004).
Linoleic acid (LA) is the predominant FA in most oilseeds, whereas in fresh forages α-
linolenic acid (LNA) is usually greatest. Linoleic acid and LNA are considered essential FA

22
because they cannot be synthesized by mammals and ruminal microorganisms (Sprecher, 1981),
and both LA and LNA are considered PUFA, because they contain more than one point of
unsaturation, or double-bond. Fatty acids are classified and abbreviated according to the length
of the acyl chain, number of unsaturations, and location and configuration of the unsaturation.
By convention, essential FA are indentified according to simplified nomenclature of the ω-
numbering system, which begins numbering carbons starting at the methyl end of the FA. For
example, LA has 18 carbons and 2 double bonds (C18:2), and it belongs to the ω-6 family, also
called n-6, because the first of its double bonds is localized at the sixth carbon from the methyl
end. Processing of FA in one family can only generate fatty acids of the same family. For
example, FA of the n-3 family cannot be converted into a member of n-6 family and vice versa
(Mattos et al., 2000).
Supplemental Fat Intake and Digestion
Beef cattle production systems are traditionally classified into two broad categories:
grazing and feedlot. In addition to the lipids provided by the forages, grazing cattle can obtain
triacylglycerol and other FA through supplements. Most feedlot diets are grain-based to increase
their energy concentration, which typically improves the efficiency and cost of gain (Gibb,
2004). Although containing less energy than grain, sources of fiber are often included in diets to
help maintain rumen function (Bull et al., 1965) and animal health (Cheng et al., 1998). In
confinement, lipids are often fed to increase energy density without decreasing fiber of the diet
(Gibb, 2004).
The inclusion of fat to cattle diets can affect dry matter intake (DMI; Jerred et al., 1990).
The type of fat fed, and the type and amount of forage offered, also have an effect on the extent
to which DMI is affected (Allen, 2000). The mechanisms involved with the FA-induced
depression of DMI are unclear, but may include alterations in palatability, gut motility, brain

23
signaling satiety centers and fiber digestion. The palatability of a fat can vary according to type
(saturated or unsaturated), source (oil or whole seeds), and concentration in the diet (Miller et al.,
1958). Grummer et al. (1990) stated that adaptation to supplements improved fat acceptability,
and the differences in acceptability among fats can be minimized by mixing fats with other
dietary ingredients. Chemical nature and other factors, such as odor, physical form, and
appearance also influence fat acceptability (Grummer et al., 1990)
Fat is a potent stimulator of cholecystokinin (CCK) release and evidence exists that CCK
contributes to satiety control (Reidelberger, 1994). It is probable that the CCK suppresses feed
intake by inhibiting gastric emptying (Moran, 1992). Choi and Palmquist (1996) observed
decreased DMI following decreased postprandial plasma concentrations of insulin and increased
postprandial plasma concentrations of CCK by feeding fat to lactating dairy cows. Also, an
intravenous injection of exogenous CCK depressed feed intake of sheep (Grovum, 1981).
Reidelberger et al. (1994) suggested that peripheral action of gut CCK may activate vagal and
splanchnic afferent neurons that inhibit the brain satiety centers, and an increased rate of
oxidation of FA in the liver can alter signals generated by hepatic vagal afferent nerves to brain
satiety centers (Allen, 2000). In addition, gut motility may be decreased by the presence of
PUFA in the small intestine, which could decrease DMI (Drackley et al.,1992).
Devendra and Lewis (1974) summarized four theories to explain the negative effect of
supplemental fat on fiber digestibility; 1) Physical coating of the fiber with fat, thus preventing
microbial interaction; 2) Modification of the ruminal microbial population from possible toxic
effects of fat on certain microorganisms; 3) Inhibition of microbial activity from surface active
effects of fatty acids on the cell membrane; and 4) Reduction of cation availability to key
ruminal microbes resulting from formation of insoluble complexes with long chain fatty acids.

24
The substitution of non-fiber carbohydrate with fat sources can reduce microbial protein
production since carbohydrates are the primary energy source for ruminal microbes. Further,
excessive unsaturated FA (UFA) supplementation may lead to depressed fiber digestion due to
the toxic effects of UFA on ruminal microorganisms (Jenkins & Jenny, 1992). To avoid the
inhibitory effects of free FA on ruminal bacteria, the calcium soaps technology was developed
(Jenkins & Palmquist, 1982; Sukhija & Palmquist, 1990). Calcium salts of FA (CSFA) should be
inert in the rumen, dissociating in the abomasum at low pH (Wu & Palmquist, 1991, Wu et al.,
1991), thus becoming available in the small intestine for further absorption (Jenkins, 1993).
Palmquist and Jenkins (1980) reported beneficial effects of fat added to diets of high
producing dairy cows. Cows fed fat from 3 to 5% of the total diet increased energy intake
without negative effects on fiber digestion. Feedlot finishing diets containing 2 to 5% of total fat
may stimulate weight gain of beef cattle (Moore et al., 1986), although apparent digestibility
increased, whereas true digestibility decreased when fat was added up to 8% of dietary DM
(Haaland et al., 1981). Grummer (1988) reported no effect on nutrient digestion and ruminal
fermentation in dry Holstein cows fed CSFA or prilled fat when supplemented at 3.5% or less of
the total ration DM, but cows fed prilled fat consumed a greater amount of fat than those fed
CSFA due to the greater fat content in the prilled fat. Differently, Chalupa et al. (1986) reported
reduced feed intake and lower milk yields from low producing dairy cows fed prilled fat at 6 or
9% of the total ration DM compared to prilled fat-fed cows at 0 and 3%.
The effects of fat supplementation on digestibility and performance were reported by
several authors. Garcia et al. (2003) fed whole sunflower seeds (containing approximately 70%
LA) at 5% of dietary DM and reported no differences in the live weight, average daily gain
(ADG), or carcass weight of beef heifers compared to those fed no dietary lipid supplement.

25
Atkinson et al. (2006) supplemented sheep with increasing amounts of high-linoleate safflower
oil (0, 3, 6, or 9% of dietary DM) and sugested no effects on apparent ruminal digestibility of
organic matter, neutral detergent fiber (NDF), and nitrogen. Elliot et al. (1997) demonstrated a
decrease in ruminal organic matter (OM) digestibility but no difference in postruminal OM
digestibility when tallow was supplemented to beef steers consuming a 60% forage diet. Brokaw
et al. (2002) sugested that total tract OM digestibility decreased when soybean oil (2.25% of
dietary DM) was supplemented to ruminants consuming high-forage diets, and Brokaw et al.
(2000) noted that heifers supplemented with high-oil corn at 0.5 % of body weight (BW) selected
forage that was less digestible than forage selected by heifers fed conventional corn. However
OM intake was not affected by feeding supplemental high-oil corn at 1.5% to 1.74% of dietary
DM (Brokaw et al, 2001). Additionally, forage intake and diet digestibility were not affected in
steers offered switchgrass hay and canola seeds to provide approximately 4% of dietary DM as
crude fat (Leupp et al., 2006).
Hess et al. (2008), in a review of summarized results, indicated that an optimal inclusion
rate for supplemental fat is less than 3% of dietary DM if the goal is to maximize the use of
forage-based diets, and that supplemental fat should be limited to 2% of DM or less if the goal is
to prevent substitution of forage with intake of supplemental fat. However, ruminants fed high-
concentrate diets may receive up to 6% supplemental fat in the diet without ill effects on
utilization of other components (Kucuk et al., 2004; Atkinson et al., 2006; and Hess et al., 2008).
Fatty Acid Metabolism in the Rumen
The first step in lipid metabolism in the rumen is hydrolysis of ester bonds via microbial
lipases (Dawson et al., 1977). The end-products produced by ruminal hydrolysis are free FA,
glycerol and galactose, which are converted to volatile fatty acids (VFA), mainly propionate and
butyrate (Hazlewood & Dawson, 1975). The extent of hydrolysis ranges from 85 to 95% for

26
most unprotected lipids, and this percentage is greater for diets rich in fats than for conventional
diets, in which most of the lipids are in the cellular structure (Bauchart et al., 1990). Lipolysis is
a prerequisite to biohyrogenation (BH), which provides the free carboxyl group from UFA
(Chalupa & Kutches, 1968). The microbial BH only occurs on free FA, released from
triacylglycerols, adsorbed on feed particles or microbial cells (Doreau & Ferlay, 1994).
The BH process involves a series of microbial enzymes called isomerases and reductases
that initially isomerizes UFA and sequentially hydrogenate the double bonds (Kepler et al.,
1966). Because the BH of PUFA is very extensive, 92% for LNA and 80% for LA (Doreau &
Ferlay, 1994), most of the dietary PUFA is modified and therefore not absorbed as such in the
small intestine. Consequently, the composition of absorbed FA does not reflect the same
composition of FA intake from the diet. Gulati et al. (2005) evaluated BH of prilled fat, CSFA,
extruded oilseeds, formalin-treated oilseeds and untreated oilseeds. Formalin treatment provided
the most protection from BH at around 90%, followed by CSFA at about 60% and then prilled
fat or extruded fat at 30%.
Therefore, CSFA can be used as one of the alternatives to increase delivery of PUFA
postruminally. This method of protection of FA promotes a chemical linkage between the free
carboxyl group and a molecule of calcium, making the FA carboxyl group unavailable for
microbial enzymes (Wu et al., 1991), avoiding reducing ruminal BH (Chalupa & Kutches, 1968).
Megalac®-R is a commercial example of CSFA, composed of a mixture of palm and soybean
oils, which contains about 39% LA and 3% LNA (Church & Dwight Co, Princeton, NJ).
Fatty Acids Metabolism in Tissues
The amount of each FA incorporated into organs and tissues depends on the amount of
precursors present in the diet (Mattos et al., 2000). Lessard et al. (2003) showed an increased
concentration of blood FA in Holstein cows fed whole flaxseed, micronized soybean and CS of

27
soybean oil prior to and during the breeding period. Cows fed CS of soybean oil presented a
lesser blood concentration of LNA on d 5 and 21 after calving; and on d 0 and 20 after first
artificial insemination when compared to cows fed flaxseed. Cows fed flaxseed had a blood n-6
to n-3 ratio three times less than cows fed CS of soybean oil. Increased milk fat content and oleic
acid concentration were observed when lactating dairy cows were supplemented with CSFA
(Megalac®) at 3 and 6% of the total diet DM compared to cows not fed CSFA (Schauff & Clark,
1992). In contrast, Harrison et al. (1995) reported a decreased concentration of oleic acid and an
increased concentration of LA in milk when lactating dairy cows were fed CSFA (Megalac®;
2.7% of dietary DM) during the 3 months after calving compared to cows fed saturated fat
source. Biohydrogenation of dietary LA and oleic acid in lactating dairy cows decreased slightly
when soybean oil was fed to cows as CSFA (Lundy, III, et al., 2004).
The term conjugated linoleic acids (CLA) refers generically to a class of positional and
geometric conjugated dienoic isomers of LA, two of which (cis-9,trans-11 and trans-10,cis-12
CLA) are known to posses biological activity (Pariza et al., 2001). These two types of CLA are
produced in the rumen of cattle and other ruminant animals during an incomplete microbial BH
of LA and LNA (Pariza et al., 2000), thus their principal dietary sources for humans are dairy
products, beef and other foods derived from ruminants (Dhiman et al., 1999). Changes in
substrate supply and extent of BH will affect the supply of intermediate and end products of BH
resulting in an altered LA, LNA and CLA content of milk and meat (Kelly et al., 1998). The
CLA are primarily recognized for their anti-carcinogenic and lipolytic effects (Park et al., 1997),
but CLA also influence immunity (Pariza, 2001) and reproduction (Garcia, 2003) affecting the
synthesis of eicosanoids, cytokines, and steroid hormones.

28
Gassman et al. (2000) fed CS of CLA to finishing steers, with diets containing 0, 1 and
2.5% of CLA (DM basis) and reported decreased feed intake and BW gain as the intake of CLA
increased. Additionally, increased CLA concentrations in adipose and lean tissue were
suggested. In contrast, Gillis et al. (2004) reported an increased ADG when finishing steers were
supplemented with CS of CLA (2% of dietary DM) when compared to steers fed corn oil (4% of
dietary DM) or no oil supplement. Haddad & Younis (2004) also observed decreased DMI when
Awassi lambs were supplemented with CS of CLA added at 2.5 and 5% of total dietary DM.
Park et al. (1997) fed CLA to mice at 0 or 0.5% of total dietary DM in 2 experiments and no
differences in DMI and ADG were reported between CLA-fed group and the control group,
although the concentration of CLA was 2.5 times greater in the body of mice fed CLA,
indicating that greater dietary CLA increases CLA content in body tissues.
Cholesterol is a precursor of several reproductive hormones such as steroids and
prostaglandins (Mattos et al., 2000). Dietary fat supplementation in cows consistently increases
plasma cholesterol concentration (Grummer & Carroll, 1991) and the greater availability of
cholesterol can result in increased secretion of progesterone (Staples et al., 1998). Oldick el al.
(1997) reported an increased plasma concentration of non-esterified FA, triglyceride and
cholesterol when ruminally cannulated dairy cows received abomasal infusion of tallow or
yellow grease (0.45 kg/d) compared to cows which received an infusion of glucose (1 kg/d).
Lloyd et al. (2002) suggested increased serum cholesterol and triglyceride concentrations when
CSFA (Megalac®; 0.113g/heifer daily) were supplemented to pubertal Angus heifers prior to
breeding. These data agree with Lucy et al. (1991), who suggested increased plasma
concentrations of cholesterol and basal LH in early postpartum dairy cows receiving CSFA
(Megalac®).

29
Dietary supplementation of LNA reduced the in vitro synthesis of prostaglandin (PG)
F2α, one important eicosanoid responsible for luteolysis. Feeding fish meal (Mattos et al., 2004)
or abomasally infusing a fat source rich in LA (Oldick et al., 1997) resulted in an attenuation of
the induced PGFM (a measurable metabolite of PGF2α) response in peripheral plasma compared
with control animals. These results indicate that high concentrations of PUFA can decrease the
endometrial secretion of prostaglandins resulting in greater chances of pregnancy establishment
(Thatcher et al., 1997). Conclusively, feeding fats and targeting of FA to reproductive tissues
may be a potential strategy to integrate nutritional management to improve animal productivity
(Santos et al., 2008).
Among these multiple biological functions, dietary PUFA also appear to impact multiple
immunological functions. Lessard et al. (2003) indentified that blood concentration of PGE2 was
reduced in cows fed flaxseed compared with those fed CS of soybean oil or micronized soybean,
while progesterone concentrations were increased in cows fed flaxseed compared with those fed
CSFA during the breed period. Essential FA, such as LA and LNA, may modulate immune
reactions and inflammatory responses, by influencing biological membrane fluidity (Schmitz &
Ecker, 2008), and activating cellular communication by stimulating eicosanoids biosynthesis
(Calder & Grimble, 2002; Yaqoob, 2004).
Immune Function
The specific immune response can be classified into two types, humoral and cell-
mediated. Humoral immunity is mediated by antibodies that are released by B-lymphocytes into
the bloodstream and are responsible for specific recognition and elimination of antigens. Cell-
mediated immunity involves specific antigen recognition by T-lymphocytes Miles & Calder,
1998). According to Calder et al. (1996) and Miles & Calder (1998) the leucocytes are the
principal group of cells of the immune system, consisting of: B-lymphocytes, T-lymphocytes,

30
dendritic cells, natural killer cells, mononuclear phagocytes (including monocytes and
macrophages), and granulocytes (including neutrophils, eosinophils and basophils)
The Acute-Phase Reaction
The acute-phase reaction involves an organism’s response to disturbances of its
homeostasis due to infection, tissue injury, neoplastic growth, or immunological disorders
(Heinrich et al., 1990). It consist of an early and local reaction at the site of injury characterized
by an accumulation and activation of leukocytes, mainly granulocytes and mononuclear cells,
fibroblasts and endothelial cells, which in turn release acute-phase glycoprotein mediators called
cytokines. The acute-phase reaction may be beneficial to the injured organism with the objective
of restoring the disturbed homeostasis (Pepys & Balyz, 1983).
Cytokines act on specific receptors in several organs and tissues, leading to a systemic
reaction characterized mainly by fever, leukocytosis, increase of adrenocorticotropic hormone
and glucocorticoids secretion, activation of the clotting cascade, and dramatic changes in the
plasma concentration of some liver-derived proteins called APP (Heinrich, 1990). Macrophages
and monocytes secrete three cytokines that have a profound metabolic effect on the organism:
interleukin-1 (IL-1), interleukin-6 (IL-6), and tumor necrosis factor-α (TNF-α). Because
macrophages and monocytes represent the first line of defense in the immune system,
collectively these three immune mediators are recognized as pro-inflammatory cytokines
(Johnson, 1997). Tumor necrosis factor-α is the first cytokine to be released in response to
bacterial endotoxin, followed by IL-1 and IL-6, and TNF-α also stimulates the production of IL-
1 and IL-6 (Peck, 1994).
The analysis of plasma concentrations for APP is commonly used as a sensitive indicator
of inflammation in mammals (Breazile, 1996). In addition to their secondary response to an
activated immune system, the APP also have other vital functions in the organism, specific of

31
each protein. Ceruloplasmin (Cp), also known as ferroxidase, is an enzyme containing 6 atoms of
carbon in its structure. It is the major copper-carrying protein in the blood and participates in iron
homeostasis. Concentrations of Cp may increase due to inflammation. Haptoglobin (Hp) is
responsible to bind free hemoglobin in the blood, forming the Hp-hemoglobin complex. Also, it
prevents the loss of body iron and its concentrations are normally undetectable in bovine blood
unless there is tissue damage. Fibrinogen (Fb) is involved in the clotting cascade and in the
formation of the fibrin matrix for tissue repair. Increased Fb concentrations are detected during
internal hemorrhage or tissue damage.
According to Johnson (1997), the proinflammatory cytokines are large, hydrophilic
molecules (17 to 26 kDa) and therefore incapable of crossing the blood-brain-barrier. The
mechanism by which cytokines communicate with the brain is through accessing
circumventricular organs devoid of a blood-brain-barrier, following production of secondary
signals, such as prostaglandins. Receptors for IL-1 have been observed in the hippocampus and
choroid plexus (Farrar et al., 1991) and binding sites for TNF-α have been identified also in the
brainstem, cortex, cerebellum, thalamus, and basal ganglia of rats’ brain (Kinouchi et al., 1991).
In cattle, the APP reaction following transport has been characterized by Arthington et al.
(2003). The magnitude of this response may be a key indicator of subsequent productivity in the
feedlot, especially during the initial receiving period (Qiu et al., 2007; Arthington et al., 2005).
Arthington et al. (2005) observed increased plasma concentrations of Cp and Hp in steers
following 24 hours of transportation, and the concentration of these APP (Cp and Hp) was
greater in calves weaned normally were compared with calves which were weaned 211 d prior to
transport. In another experiment, Arthington et al. (2008) evaluated performance and the acute-
phase reaction following transportation of steers submitted to 4 weaning management strategies.

32
During the 29-d receiving period, plasma Cp concentrations were decreased for the pre-weaned
group when compared to control or creep-fed steers. Also, ADG, DMI, and feed efficiency were
greater for pre-weaned steers compared with control steers. These data are supported by
Dhuyvetter et al. (2005), who indicated that preconditioning of calves before marketing helped to
avoid depression of performance and health upon feedlot arrival. Weaning and diet management
prior to shipment can become an important practice to decrease morbidity and mortality rates of
transported beef cattle.
Physiological Stress and Growth
In terms of the marketing process, weaning is likely the greatest stress imposed to cattle,
and according to Loerch & Fluharty (1999) many other factors are able to cause stress in calves.
For example, weaning breaks the bond between dam and calf and causes prolonged vocalization.
Marketing and transportation causes depravation of water and feed, which is a common
occurance in cattle shipments from Florida to other states. Weather changes, over-crowding,
unexpected and loud noises, poor air quality, and poor sanitization are extra stressors often
experienced by the calves during the weaning and transport process. Upon arrival at the feedlot,
calves are exposed to new diets and unfamiliar feeders and waterers. In the new feedlot
environment, calves also may have to acclimate to a new social dominance and new pathogens.
Processing procedures, such as vaccination, castration, commingling and dehorning are stressors
commonly found in feedlot facilities.
The effects of weaning and transportation on blood serum components have been studied
by several groups. Large increases in blood concentrations of cortisol, epinephrine, and
norepinephrine have been observed in steers after weaning and transportation (Cole et al., 1988;
Lefcourt & Elsasser, 1995), although corticosteroids were most responsive to transport stress.

33
Agnes (1990) compared isolated metabolic effects of stress caused by transport, loading and
noise; all three caused rapid increases in cortisol.
Growth is a genetically programmed sequence of events in the young animal (Klasing &
Korver, 1997), and when this sequence is disrupted by stress, several physiological changes
contribute to favor a process of reallocation of animal resources important in survival.
Conceptually, the status of the immune system (immunosuppression versus immunopotentiation)
will depend upon the net effect of these changes (Khansari et al. 1990). Domestic food animals
with clinical and subclinical infections eat less, grow slower, and convert feed to body tissues
and products in an inefficient manner (Johnson, 1998), suggesting that a suppressed immune
status can interact with the central nervous system and modulate feed intake. Summarily, the
immune system is able to use cytokines to delivery information to other systems, including the
central nervous system, regarding the level of immunologic activity.
Selye (1976) stated that biological stress is the non-specific response of the body to any
demand, and when animals are exposed to stress, they react in a three-step process named
“General Adaptative Syndrome.” The first answer to this syndrome is called “Alarm Reaction”
and it is characterized by vocalization, hypothalamic-pituitary-adrenal axis response, and
catabolism. The second stage is called “Resistance” which is characterized by anabolism and
increased feed intake. When resistance is not successful, the animals start the third and last step
of the syndrome called “Exhaustion.” In this stage the adaptative capability of the animal is
limited, resulting in exhaustion before it adapts to the stressor. Survival and/or recovery of
stressed animals are dependent on the level of stress they were exposed to prior, during, and after
the marketing process.

34
Changes in the ruminal environment are normally observed in cattle after a long period of
water and feed depravation. Cole & Hutcheson (1985) reported that fermentative capacity of
ruminal micorbes was reduced by 75% following a 48-h period without feed as well as total
reduction in bacterial numbers by 10 to 25% of baseline (Baldwin, 1967). Animals returned to
control levels by 7 d after re-alimentation. According to Loerch & Fluharty (1999), DMI,
ruminal volume, and weight of ruminal contents decreased as duration of feed and water absence
increased; however, 4 d after arrival, there were no longer differences in DMI or weight of
ruminal contents. These results may indicate that fermentative and digestive capacities play a
minor role in low feed intakes during the first two weeks after arrival into the feedlot. Probably,
the most important impact of stress on feed intake is due to its negative effects on animal
immunocompetency.
The inflammatory response is marked by accelerated muscle degradation and increased
hepatic APP synthesis. At least 60% of the amino acids liberated by body protein degradation are
utilized by the liver as fuel for production of APP (Johnson, 1997). The cytokines IL-1 and TNF-
α induce production of liver APP in vivo, and IL-6 induces in vitro (Richards et al., 1991).
Muscle degradation is mediated by IL-1, IL-6, and TNF-α (Spurlock, 1997), while IL-1 has been
shown to inhibit the anabolic effects of insulin on skeletal muscle (Klasing & Johnstone, 1991).
Increased plasma concentration of nonesterified FA and hyperglyceridemia is associated with a
variety of infections (Grunfeld et al., 1989). Tumor necrosis factor-α modulates lipid metabolism
by increasing hepatic FA synthesis, inhibiting lipase activity, and stimulating lipolysis (Memon
et al., 1994). High cortisol and plasma urea nitrogen concentrations have been observed in pigs
exposed to environments that provide high immunological challenges (Williams, 1993).

35
Ban et al. (1992) proposed a neural link between the periphery and CNS. In this
association, peripheral cytokines are able to stimulate vagal afferent nerves in the viscera,
avoiding the necessity of an elevated concentration of peripheral cytokines to activate afferent
nerves which lead to cytokine synthesis within direct CNS involvement. It is concluded,
therefore, that inflammatory stimuli in the periphery induces synthesis of pro-inflammatory
cytokines in the brain. Peripheral and central injection of recombinant IL-1 induced anorexia as
well as a number of profound behavioral alterations that are reminiscent of sickness in rats
(Dantzer & Kelley, 1989). This reduction in food intake is attributed to a reduction in both meal
size and meal duration. Peripheral intra-venous and intra-parenteral administration of
recombinant human TNF-α in rodents suppressed food intake and appetite (Johnson, 1998).
Sonti et al. (1996) reported synergistic effects of IL-1 and TNF-α in inducing anorexia in rats
when these cytokines were administered intravenous or intra-cerebroventricular.
It is known that pro-inflammatory cytokines suppress appetite and feed intake by acting
directly on the CNS, although the same cytokines can regulate appetite in immune-challenged
animals indirectly. Tumor necrosis factor-α stimulated leptin secretion by acting directly on
adipocytes (Finck et al., 1998). Both peripheral and central injection of leptin reduced food
intake, increased energy expenditure, and deplete adipose tissue in lean mice (Hallas et al.,
1995). Interleukin-1 induces a decrease in the plasma concentrations of thyroxin and an even
larger decrease in triidothyronine concentrations (Klasing & Korver, 1997), and in combination
with TNF-α, both cytokines reduced concentrations of growth hormone (Elsasser et al., 1988)
and insulin-like growth factor 1(IGF-1) in the circulation, liver, skeletal muscle, and pituitary
(Klasing & Kover, 1997), which presumably contributes to impaired growth. In addition, the
release of growth hormone-releasing hormone from medial basal hypothalamic explants was

36
decreased by IL-1, whereas somatostatin release wass increased (Spurlock, 1997). In conclusion,
pro-inflammatory cytokines can act on a number of targets that are likely to contribute to poor
intake and growth of immunologically challenged animals (Klasing, 1988). The immunological
stress is characterized by the direct and indirect impacts of cytokines on CNS and other organ
systems (Johnson, 1997).
Supplemental Fat, Stress and Growth
Eicosanoids are a group of chemical messengers synthesized from 3 types of 20-carbon
chain PUFA: dihomo-γ-linolenic acid (DGLA; 20:3n-6), arachidonic acid (ARA; 20:4n-6) and
eicosapentaenoic acid (EPA; 20:5n-3). Eicosanoids include mainly PG, thromboxanes (TX),
leukotrienes (LT), and other inflammatory mediators. The PUFA precursors for eicosanoid
synthesis are stored in an esterified form in cell and organelle membrane phospholipids or in
cytoplasmatic lipid bodies bound to glycerides and phospholipids at the cytosolic surface
(Schmitz & Elker, 2008). They are mobilized and re-hydrolized usually by the action of
phospholipase A2 activation in response to a cellular stimulus (Calder et al., 2002). Because the
majority of cell membranes contain predominately ARA compared to EPA and DGLA, ARA is
the key precursor for eicosanoid biosynthesis.
Linoleic acid is converted to γ-linolenic acid (GLNA; 18:3n-6) by action of delta-6-
desaturase. A specific enzyme called elongase 5 converts GLNA into DGLA which is converted
to the key intermediate ARA by action of delta-5-desaturase. Arachidonic acid is further
metabolized to docosapentaenoic acid (DPA; 20:5n-6) and eicosanoids. The n-3 LNA is
converted to stearidonic acid (18:4n-3) and to eicosatetraenoic acid (ETA; 20:4n-3) to form EPA
using the same series of enzymes as those used to synthesize ARA. The EPA is further
metabolized to docosahexaenoic acid (DHA, 22:6n-3) or eicosanoids.

37
The n-6 ARA can be converted to eicosanoids of the PG2, TX2, LT, derivates of HPETE
and HETE, lipoxin A4 by action of COX and lipo-oxygenases. In contrast, EPA is converted to
PG3, TX3, and LT5. Resolvins, docosatrienes, and neuroprotectins are synthesized from DHA.
For example, PGE2 and PGI2 are pro-arrhythmic while PGE3 and PGI3 are anti-arrhythmic;
TXA2 is a platelet activator and TXA3 is platelet inhibitor; TXB2 causes vasoconstriction and the
TXB3 causes vasodilatation; LTB4 is pro-inflammatory and HPETE and HETE are involved in
inflammation processes, in contrast to LTB5, resolvin E1, resolvin D, and neuroprotectin D1
which promote anti-inflammatory responses. According to Schmitz & Ecker (2008), the main
difference between n-6 and n-3 FA-derived eicosanoids is that most of the mediators formed
from ARA are pro-inflammatory whereas those formed from EPA and DHA are anti-
inflammatory.
Several studies have investigated the effects of the amount and type of fat in the diet on
immune reactions (Yaqoob & Calder, 1993; Jolly et al, 1997; Cullens, 2005), and the inclusion
of PUFA into diets have been shown to modulate immune cell function (Calder et al., 2002). The
mechanism by which FA might modulate immune functions is not yet understood, but apparently
PUFA alter the production of mediators involved in communication between cells of the immune
system through the synthesis of eicosanoids, cytokines and nitric oxide (Miles & Calder, 1998),
and to alter the expression of adhesion molecules which are involved in direct cell-to-cell contact
(Calder, 1999).
Farran et al. (2008) fed flaxseed, rolled full-fat soybeans and tallow at 13, 20 and 4% of
dietary DM to beef heifers, respectively. Heifers supplemented with flaxseed and full-fat
soybeans showed greater ADG than heifers fed tallow. Also, the flaxseed-fed heifers had
increased plasma concentrations of total n-3 PUFA, whereas, full fat-soybean-fed heifers had

38
increased plasma concentrations of total n-6 PUFA. In another experiment, the same authors fed
flaxseed (12.9% of dietary DM), rolled full-fat soybeans, and tallow (both at 20% of dietary DM)
to lipopolysaccharide-challenged (LPS) heifers. After LPS challenge, rectal temperatures were
less for flaxseed- and soybean-fed heifers than those fed for tallow; and concentrations of plasma
TNF was greater in heifers supplemented with soybean than tallow. In agreement, Chang et al.
(1992) observed increased serum TNF for LPS-challenged mice fed n-3-enriched fish oil
compared with those fed corn, coconut oil, or a low-fat diet. Pomposelli et al. (1989) reported
that diets containing fish oil reduced fever response in guinea pigs.
Flaxseed is rich in LNA while fish oil is abundant in EPA and DHA, all members of the
n-3 FA family. Because many studies have demonstrated the anti-inflammatory effects of n-3
FA, these results may explain the decreased fever and serum concentrations of TNF. Calder et
al. (2002) stated that DHA and LNA can be converted to EPA in animal cells. Additionally,
EPA, by virtue of its ability to compete with ARA receptors, can competitively inhibit
production of eicosanoids such as the 2-series PG and 4-series LT from ARA, thereby reducing
inflammation (Calder, 1999).
Silvestre (2009) observed a lesser n-6 to n-3 FA ratio in neutrophils of dairy cows fed CS
of fat-enriched fish oil compared with those fed CS of palm oil. In addition, mean concentration
of TNF-α in supernatants of isolated neutrophils were lower for cows fed CS of fish oil. Further,
the neutrophil concentration of EPA, DPA and DHA was greater in cows fed CS of fish oil than
cows fed CS of palm oil. Do Amaral (2008) reported greater plasma concentrations of acid
soluble proteins after calving when Holstein cows were fed CS of trans C18:1 (55% C18:1 trans)
starting five wk prepartum than cows fed sunflower oil (80% C18:1 cis). In another experiment
using PUFA supplementation prior to calving in heifers and mature cows, the same author

39
observed an effect of fat source and parity on plasma concentration of APP. Plasma
concentration of Cp were greater in heifers fed n-6 FA (CS of sunflower oil) when compared
with heifers fed n-3 FA (CS of palm and fish oils), although heifers fed n-3 FA had greater
plasma concentrations of Fb compared to heifers fed n-6 FA. Cows and heifers fed n-3 FA from
linseed-oil had lower concentrations of blood neutrophils than these fed n-6 FA from Megalac®-
R (Do Amaral, 2008).
Lower postpartum Fb concentrations were reported by Cullens (2005) when primiparous
lactating cows were fed CSFA (Megalac®-R; 2% of dietary DM) during the prepartum period
compared to those not fed fat. In the same experiment, multiparous cows fed CSFA had greater
plasma PGFM concentrations at approximately d 5, 6, and 7 postpartum compared with those not
fed fat prepartum. Juchem et al. (2008) sugestedd greater plasma concentrations of PGFM at d 1
postpartum when primiparous cows where fed prepartum with CS of fat enriched in LA and
trans-octadecenoic acids. This response was associated with a lesser incidence of uterine
infection compared to cows fed CS of palm oil. Polyunsaturated FA, such as EPA and DHA,
inhibited production of IL-1β and TNF-α by human monocytes (Purasiri et al., 1994). These
results agree with Farran et al. (2008) and Caughey et al. (1996), who demonstrated that diets
enriched with flaxseed and fish oil inhibited IL-1 and TNF-α production by monocytes in cattle.
Palm and coconut oils provide mainly saturated FA (SFA). Megalac®-R, sunflower oil,
and soybean oil are sources of n-6 FA. Opposite to effects of the n-3 FA, n-6 FA are associated
with pro-inflammatory and inflammatory responses, observed by the stimulation of cytokines
and other physiological mediators, such as PGE2 and LTB4. Greater concentrations of blood
neutrophil in n-6 FA-fed cows suggested by Do Amaral (2008) may indicate that n-6 FA
stimulate neutrophil activity during the peripartum period, which may explain the lesser post-

40
partum uterine infection and greater serum concentrations of PGFM observed by Juchem (2008)
in primiparous cows fed CS of fats enriched in trans C18:1 and LA.
Conclusively, dietary FA participate in immunomodulatory effects in mammals, and the
role of lipids in immunity is focused on PUFA, especially the n-3 and n-6 families. The nature of
the difference between these two families on immunomodulation is not certain, although
speculations about changes in lipid sources and their interactions on physiological responses of
immune-challenged animals have been made.

41
CHAPTER 3 EFFECTS OF MEGALAC®-R INCLUSION IN RECEIVING DIETS OF WEANED FEEDER
STEERS
Materials and Methods
This experiment was conducted from July to September 2006, and was divided into a pre-
shipping (d -40 to 0) and a post-shipping phase (d 1 to 30). The pre-shipping phase was
conducted at the University of Florida – IFAS, Range Cattle Research and Education Center,
Ona, and the post-shipping phase at the University of Florida – IFAS, North Florida Research
and Education Center, Marianna.
The animals utilized in these experiments were cared for in accordance with acceptable
practices as outlined in the Guide for the Care and Use of Agricultural Animals in Agricultural
Research and Teaching (FASS, 1999).
Animals and Facilities
Sixty-four weaned Braford steers (BW ± SD = 218 ± 23 kg; age ± SD = 226 ± 27 d) were
utilized in this experiment. For the pre-shipping phase (d -40), steers were stratified by initial
BW and age, and randomly allocated to two bahiagrass (Paspalum notatum) pastures (32
steers/pasture) of 2.04 ha. Each pasture was randomly assigned to one of the two following
supplementation treatments: 1) No fat control (CO) or 2) Saturated Fat (EN).
On d 0, all steers were loaded into a commercial livestock trailer and transported 1,600
km from Ona, FL to a research feedlot facility in Marianna, FL. Steers remained in the truck for
24 h, before being received into the feedlot. Upon arrival, steers were stratified by pre-shipping
treatment and current BW, received electronic ear ID tags (Allflex USA, Inc., Dallas-Ft. Worth,
TX) for the measurement of individual feed intake with the GrowSafe® System (Model 4000 E,
GrowSafe® Systems Ltd., Airdrie, AB, Canada), and re-allocated into three feedlot pens (104.6
m2) during the first 7 d. Each pen was concrete floor, covered, and provided of two feed bunks

42
and one waterer. Animals were then randomly assigned, in a 2 x 3 factorial arrangement, to one
of three supplemental treatments: 1) CO, 2) EN, or 3) Megalac®-R supplementation (MG). On d
8, three more feedlot pens were added (two pens/treatment; eleven animals/pen).
Diets
Pasture quality during the pre-shipping phase was estimated to be 54.0% TDN and 9.6%
CP (DM basis) from hand-plucked samples collected at the beginning of the trial and analyzed
by a commercial laboratory (Dairy One Forage Laboratory, Ithaca, NY). Samples were taken at
30 locations per pasture according to procedures determinated by Vendramini et al. (2006). The
pastures utilized in this experiment were not fertilized prior to or during the experimental period.
Treatments consisted of two grain-based supplements (Tables 3-1 and 3-2) with (EN) or
without (CO) the inclusion of a prilled saturated fat source (Energy Booster 100®; MSC Co,
Carpentersville, IL). Supplement intake was limited (4.1 kg/d) with the EN providing 5.91% of
dietary fat/steer daily (DM basis).
For the post-shipping phase, diets were prepared and fed as a TMR in ad libitum amounts
daily, except the first four days when steers were offered daily with 5 kg of Tifton 85
bermudagrass (Cynodon dactylon) hay (as-fed) and a 70:30 mixture of concentrate:cottonseed
hulls, separately.
Following this initial period, steers were offered in ad libitum amounts a 60:25:15
mixture of concentrate:cottonseed hulls:bermudagrass hay from d 5 to 12, and followed by a
65:28:7 mixture of the same ingredients in ad libitum amounts from d 13 to the end of the
experiment (d 30). The EN and CO concentrate ingredients were similar to the pre-shipping
phase, whereas the MG treatment consisted of a grain-based supplement with the inclusion of a
source rumen-inert PUFA (Megalac®-R; Tables 3-1, 3-2) providing approximately 5.0% of

43
dietary fat/steer daily (DM basis; Table 3-3). Water was offered ad libitum throughout all phases
of the experiments.
Sampling
During the pre-shipping phase, steer shrunk BW (16 h of feed restriction) was recorded
on d -40, whereas full BW was recorded on d -25, -11, and immediately prior to shipping on d 0.
During the post-shipping phase, steer shrunk BW was recorded on d 1 (immediately following
arrival at feedlot facility) and at the end of the experiment (d 30). Full BW was recorded on d 4,
8, 15, 22 and 29. Only shrunk BW values were utilized to determine ADG during the pre-
shipping and post-shipping phases.
Individual feed intake was recorded daily during the post-shipping phase using the
GrowSafe® feed intake system. The GrowSafe® system is a technology which continuously
measures individual feed consumption.
Representative samples of all feedstuffs were obtained weekly during each phase.
Samples were dried after collection for 96 h at 60oC in a forced air oven to calculate
concentration of DM. The weekly samples were ground through a 1-mm Wiley mill screen
(Model 4, A. H. Thomas, Philadelphia, PA) to be analyzed for nutrient composition according to
analytical procedures of a commercial feed laboratory (Dairy One Forage Laboratory, Ithaca,
NY).
Following transport, blood samples were collected on d 0, 1, 4, 8, 15, 22, and 29 for
determination of fibrinogen and ceruloplasmin concentrations. Plasma samples used for
determination of fatty acid composition were collected on d 0 and 29.

44
Blood analysis
Blood samples were collected via jugular venipuncture into commercial blood collection
tubes (Vacutainer, 10 mL; Becton Dickinson, Franklin Lakes, NJ) containing sodium heparin.
Samples were placed immediately on ice and centrifuged at 2,000 × g at 5oC for 30 min (GPR
Centrifuge, Model 349702; Beckman Instruments Inc., Fullerton, CA) for plasma separation and
collection. Plasma was frozen at -20°C on the same day of collection.
A Coagulation Analyzer (Fibrometer, Rankin Biomedical Corp., Holly, MI) was used to
determine plasma fibrinogen concentration from a standard curve using a human reference
(Sigma procedure No. 880; Sigma Diagnostics, St. Louis, MO). A spectrophotometer
(ThermoSpectronic™ Genesys™ 20; Thermo Fisher Scientific Inc., Waltham, MA) was used to
determine plasma ceruloplasmin concentration. The plasma ceruloplasmin oxidase activity was
measured in duplicate samples using colorimetric procedures described by Demetriou et al.
(1974). Ceruloplasmin concentrations were expressed as mg/dL, as described by King (1965).
The intra and interassay CV were 4.8 and 6.4% for fibrinogen and 3.2 and 6.7 for ceruloplasmin,
respectively.
Plasma fatty acid extraction and methylation were determined using procedures described
by Kramer et al. (1997). The fatty acid methyl esters were determined using a gas-liquid
chromatography (GLC; CR-3800 Gas Chromatograph, Varian, Inc. Corparate Headquaters, Palo
Alto, CA) equipped with auto-sampler (Varian CP-8400), flame ionization detector, and Varian
capillary column (CP-Sil 88, 100 m x 0.25 mm x 0.2 µm). The peak was indentified and
calculated based on the retention time and peak area of known standards.

45
Statistical analysis
Performance data from the pre-shipping phase were not statistically analyzed and are
reported as mean ± SD because steers were allocated to a single pasture per treatment and
supplements were group-fed, therefore the experimental unit (pasture) was not replicated.
For the post-shipping phase, performance and physiological data were analyzed using the PROC
MIXED procedure of SAS (SAS, 2001).
The statistical model used for plasma measurements and DMI was:
Yijkl = µ + TRTAi + TRTBj + CALFk(ij) + Dl + TRTADik + TRTBDjk + TRTABDijk + + Eijkl
where
Y = response variable
µ = mean
TRTA = fixed effect of pre-shipping treatment
TRTB = fixed effect of post-shipping treatment
CALF = random effect of steer within pre- x post-shipping treatment
D = fixed effect of day
TRTAD = effect due to interaction of pre-shipping treatment and day
TRTBD = effect due to interaction of post-shipping treatment and day
TRTABD = effect due to interaction between pre- and post-shipping treatment and d
E = residual error
The statistical model used for ADG analysis was:
Yij = µ + TRTAi + TRTBj + CALFk(i) + Eij
where
Y = response variable
µ = mean

46
TRTA = fixed effect of pre-shipping treatment
TRTB = fixed effect of post-shipping treatment
CALF = random effect of steer within pre- x post-shipping treatment
E = residual error
Plasma measurements were analyzed using values from d 0 as a covariate. Results are
reported as least square means. Means were separated using LSD. Significance was determined
at P ≤ 0.05 and tendencies include P > 0.05 and ≤ 0.10. Only significant interactions were
reported. Pearson correlation coefficients among plasma measurements, ADG and DMI were
generated using the CORR procedure of SAS (SAS, 2001).
Results
Measurements of Performance
The ADG observed during the pre-shipping phase of the study was 0.35 ± 0.18 kg/d for
EN-fed steers and 0.34 ± 0.20 kg/d for CO-fed steers. No pre-shipping or pre-shipping x post-
shipping treatment effects were detected, therefore, all results reported herein are derived from
the post-shipping treatments in the post-shipping phase of the study.
Steers fed MG had decreased (P < 0.05) ADG when compared with CO-, but not EN-,
fed steers (1.04, 0.98, and 0.80 kg/d for CO, EN, and MG treatments, respectively; SEM = 0.08).
Treatment x day interactions was observed (P < 0.01) for DMI (Figure 3-1). Steers fed MG had
less overall DMI compared to CO-fed steers (P < 0.01), but not compared to EN-fed steers (2.37,
2.80, and 2.55 % of BW for MG, CO, and EN, respectively; SEM = 0.10). Steers fed MG had
decreased (P < 0.05) G:F when compared to EN-fed steers, and tended (P < 0.10) to have less
G:F compared to CO-fed steers (0.29, 0.37, and 0.35 kg/kg of G:F for MG, EN, and CO,
respectively; SEM = 0.026).

47
Plasma Measurements and Coefficients of Correlation
No differences were observed among treatments for covariately adjusted mean plasma
fibrinogen concentrations (331.0, 351.9, and 378.9 mg/dL for CO, EN, and MG, respectively;
SEM = 27.0) and mean plasma ceruloplasmin concentrations (18.0, 17.7, and 18.9 mg/dL for
CO, EN, and MG, respectively, SEM = 0.69). A day effect (P < 0.01) for fibrinogen and
ceruloplasmin was observed (Figure 3-2 and 3-3).
Pearson correlation coefficients among ceruloplasmin, fibrinogen, DMI, and ADG are
presented in Table 3-7. Significant positive correlations were observed between ceruloplasmin
and fibrinogen concentrations (P < 0.05), and between ADG and DMI (P < 0.01). Fibrinogen
and ceruloplasmin concentrations were both negatively correlated with ADG and DMI (P <
0.05).
Plasma FA concentrations from d 0 and 29 are presented in Table 3-6. Concentrations of
C16:0, C17:0, C18:0, C18:1c9, SFA, MUFA, total n-6 and SFA/UFA were less (P < 0.03) for
CO- compared with EN-fed steers on d 0 (feedlot entry). Also on d 0, steers supplemented with
CO tended to have decreasedd (P < 0.09) concentrations of LNA, ARA and total FA when
compared to EN-fed steers. On d 29, CO-fed steers had decreased (P < 0.05) plasma
concentrations of C14:0, C16:0, C17:0, LA, SFA, PUFA, total n-6 and total FA than EN-fed
steers.
When compared to MG-fed calves, concentrations on d 29 of C16:0, LA, LNA, PUFA,
total n-3, total n-6 and total FA were less (P < 0.04) and tended to be less (P < 0.08) for DPA
and SFA in CO-fed steers. In contrast CO-fed steers tended to have a greater (P = 0.08) SFA to
UFA ratio than MG-fed steers. On d 29, MG-fed steers had less C14:0, C17:0 (P = 0.05) than
EN-fed steers, and tended to have greater (P < 0.09) concentrations of EPA, total n-3 and n-3 to
n-6 ratio.

48
Discussion
Performance
Growth can be disrupted by many factors including the pattern of DMI and
immunological status (Baumann & Gauldie, 1994). Decreased DMI and BW gain as a result of
supplemental fat has been reported previously in cattle (Pavan et al., 2007; Gibb et al., 2004;
Harrison et al., 1995; Sklan et al., 1991; Beam & Buttler, 1998). Among the several types of fat
sources used as supplements, the CSFA appears to have the greatest impact for inhibiting intake
(Bateman et al., 1996; Simas et al., 1995; Ngidi et al., 1990), which might help describe the
differences in ADG observed between the fat supplements evaluated in the current experiment.
In the feedlot, MG-fed steers had decreased less overall ADG compared with CO- and EN-fed,
and decreased less overall DMI when compared with CO-fed steers. In addition, MG-fed steers
had reduced (P < 0.08) feed efficiency (G:F) compared with EN- and CO-fed steers. These
results are in agreement with Allen (2000) who proposed that feed sources of PUFA, mainly CS
(i.e. Megalac®-R), are more detrimental to intake than prilled fats or other sources of SFA.
Hess et al. (2008) stated that an optimal inclusion rate for supplemental fat should be less
than 3% of dietary DM if the goal is to maximize the use of forage-based diets, and supplemental
fat should be limited to less than 2% of dietary DM if the goal is to prevent substitution of forage
with intake of supplemental fat. The maximum fat content observed in the CO diet was 3.6%
(DM basis). In this experiment a TMR was utilized to feed the treatment supplement with hay
and cottonseed hulls. Megalac®-R and EN contributed 1.4 to 1.7% fat to the final diets which
contained a total fat content of 4.9 and 4.8%, respectively. According to Hess et al. (2008), these
values indicate that the diets offered during this experiment were formulated to avoid potential
negative effects on DMI and fiber digestibility. Further, there were no differences for DMI and
ADG between EN- and CO-fed calves, suggesting that the dietary fat concentration in the diets

49
likely did not inhibit intake, but the type of fat utilized may have contributed to decreased DMI
due to lower acceptability of CSFA provided by MG, than the prilled fat provided by EN.
According to Grummer et al. (1990), Energy Booster 100® is a source of prilled long-
chain SFA, which is more acceptable to dairy cows than CSFA (i.e. Megalac®-R). The author’s
results showed that the CSFA acceptability was less than other commercial fat sources even if
CSFA had been offered alone, in a top-dressing, or mixed (TMR) into other dietary components.
Zinn (1988) and Zinn (1989) recommended that fat should be introduced into diets gradually,
facilitating the animal’s adaption for the new feed ingredient.
This experiment was developed as a 2 x 3 factorial design. During the pre-shipping
phase, steers received EN or no-fat supplement (CO) for a period of 40 d prior to transport. In the
feedlot, steers allocated to the MG treatment received this fat source for the first time. The
absence of gradual adaptation in addition to the lower acceptability of MG, may contribute to the
reduced performance measures observed in MG-fed steers compared to EN- and CO-fed steers.
Unsaturated long chain FAs are potentially more detrimental on ruminal fermentation
(Schauff & Clark, 1989) because UFA are more soluble, and therefore are more likely to adsorb
onto bacteria (Chalupa et al., 1984). In other words, impaired ruminal fermentation is more likely
with diets containing UFA compared SFA. Calcium salts of FA are classified as rumen-inert and
may decrease BH rate of PUFA and may increase absorption of PUFA in the small intestine (Wu
et al., 1991). Juchem (2007) demonstrated that more than 70% of the LA and more than 85% of
the LNA fed to lactating cows were BH in the rumen when fed as unprotected oils or as CS of
long chain FA.
According to the manufacturer, the SFA to PUFA ratio of MG is 0.4 and of EN is 1.2,
which means that MG has a greater PUFA proportion content compared to EN. It is suggested,

50
therefore, that MG may more negatively affect ruminal fermentation. This negative effect of MG
on ruminal fermentation might decrease microbial synthesis and then decrease the availability of
amino acids for protein synthesis in other tissues (Palmquist and Moser, 1981), which might
have affected the growth of MG-fed steers in the current experiment. This observation is in
agreement with Palmquist (1994) who suggested that feeding more PUFA may negatively affect
microbial production in the rumen. Additionally, Schauff & Clark (1989) have reported that
prilled saturated fat appears to depress the acetate to propionate ratio compared to CSFA, and
therefore, potentially improve animal performance.
Inflammatory Reaction
In response to immunological stress, the liver will produce the acute phase proteins Cp
and Fb (Baumann & Gauldie, 1994). It is unclear whether increased concentrations of APP are
due to greater stress (indicating an adverse state) or due to a greater immune response (indicating
a healthier state). In this study, the plasma concentration of Fb and Cp ranged from 63.5 to 922.9
mg/dL and 4.8 to 27.1 mg/dL, respectively. According to The Merck Veterinary Manual (1997),
normal values of APP in cattle range from 100 to 600 mg/dL for Fb and 16.8 to 34.2 mg/dL for
Cp. In this study no differences among treatments were observed for mean plasma Cp and
covariately adjusted Fb concentrations during the first 29 d post-shipping.
Immune reactions have been reported to be modulated by the diet; including the PUFA
composition of the diet (Yacoob & Calder, 1993; Miles & Calder, 1998; Pamposelli et al., 1989).
The mechanisms involved in this regulation are not yet understood, but evidences exist that n-3
and n-6 FA composition in the diet may influence cellular activation through the synthesis of
eicosanoids, steroid hormones, and cytokines (Calder et al., 2002). Several authors have reported
immunological and physiological changes in animals provided diets containing PUFA during
immune challenge (Calder et al., 2002; Farran et al., 2008; Cullens, 2005; Silvestre, 2009, Do

51
Amaral, 2008), but these studies mainly examined inflammatory processes caused by parturition
or LPS-challenge, and not by transport. Lessard et al. (2004) evaluated the cellular immune
function of dairy cows fed supplemental CS of palm oil, flaxseed and micronized soybeans from
6 wk pre-partum to 6 wk postpartum. The authors concluded that cellular immune function was
modulated around parturition; however, feeding diets rich in n-3 or n-6 FA did not have a major
impact on immune function. Cullens (2005) reported that mean plasma concentrations of Fb
during the first 27 d postpartum tended to be greater for control cows than for cows fed CS of
long-chain FA (Megalac®-R). In addition, the author suggested that the initiation of PUFA
supplementation before parturition can affect the immune status and physiological response of
mature cows after parturition. In these studies, PUFA supplementation commonly started at least
3 wk prior to immune challenge and continues at least 3 wk after. The authors suggest that a
preliminary period of supplementation is necessary to observe the effects of PUFA on
immunomodulation, and the duration of this supplementation period must be long enough to
potentiate these effects. Continual feeding of CS of a mixture enriched with fish oil increased
concentrations of EPA and DHA in endometrium, liver, mammary, muscle, subcutaneous and
internal adipose tissues of dairy cows (Bilby et al., 2006), which may indicate that daily feeding
CS of FA is a practical approach to manipulate tissue FA composition (Silvestre, 2009).
In the current experiment, the steers began MG consumption immediately after shipping.
Because MG supplementation did not occur during the pre-shipping phase of the experiment,
changes on immune responses by MG could not be expected during the first d after shipping.
Further, steers provided EN in the pre-shipping phase experienced an APP reaction to shipping,
which did not differ from CO-fed steers. Energy Booster 100® is a supplemental fat source that
is rich in SFA and low in PUFA. In a review of research investigating effects of SFA compared

52
to PUFA on measures of immune function, it was concluded that SFA impacts immune
competence to a lesser degree compared to PUFA (Miles & Calder, 1998). Similarly, Farran et
al. (2008) observed no difference in concentrations of plasma TNF-α of LPS-challenged steers
provided tallow (rich in SFA and MUFA) or no supplemental fat (control).
Ruminal BH can influence the amount of PUFA reaching the small intestine, although
according to Juchem (2007), the continual feeding of PUFA, regardless the source, can increase
the concentration of PUFA in cells and tissues despite BH. It is in agreement with Mattos et al.
(2000) who stated that the amount of each FA incorporated into organs and tissues depend on the
amount of precursors present in the diet. According to the manufacturer, EN contains 60% SFA
and MUFA and 36% PUFA. Megalac®-R contains 55% PUFA, and LA and LNA represents
87% and 9% of this PUFA. It is suggested that feeding steers with EN or MG may affect
concentration and composition of FA in the blood differently.
Total plasma FA concentration was increased after fat supplementation during pre- and
post-shipping phases of the current experiment. On d 29, MG-fed steers tended to have
increased EPA and DPA and total n-3 FA compared to EN-fed steers. Also, MG-fed steers had
greater LNA and lesser SFA to UFA ratio compared to CO-fed steers. It is likely that MG
increased plasma concentrations of n-3 FA such as LNA, EPA and DPA due to the greater
amount of n-3 FA in this treatment. These results agree with Lessard et al. (2003) who observed
no differences in plasma LA concentrations in dairy cows supplemented with Megalac® or
flaxseed during the first 21 d of the feeding period, likely due to the similar amounts of LA
provided by the Megalac® and flaxseed diets. However, greater plasma n-3 FA concentrations
were observed in flaxseed-fed cows due to a greater concentration of LNA in this source of
supplemental fat. In addition, Petit (2002) fed diets containing Megalac® and micronized

53
soybean to lactating dairy cows during 16 wk post partum. On d 70, there were no treatment
differences in plasma concentrations of LNA and EPA; however, greater plasma n-6 FA
concentrations were suggested in micronized soybean-fed cows because of greater concentration
of LA in micronized soybeans compared to Megalac®.
A negative relationship among plasma APP concentrations and ADG and DMI was
observed in this study. Similar findings have been reported in weaned, transported calves
(Arthington et al., 2005). These results are supportive of the link between inflammatory
processes and feed intake and performance (Johnson, 1998). Growing evidence linking dietary
PUFA to immune function, especially modulation of inflammatory processes (Calder et al.,
2002), strengthens the concept for using dietary fats to modulate the acute phase reaction and
improve livestock performance. Further studies are required to better understand the effects of
PUFA on inflammatory responses of transport-stressed beef steers.

54
Table 3-1. Ingredients and nutrient composition of grain-based concentrate treatments fed to steers during pre- and post-shipping phase of the study. 1
Treatments2 CO EN MG Ingredients (% as-fed) Wheat middlings 30.63 29.97 29.85 Cracked corn 20.00 19.58 19.50 Ground corn 20.00 19.58 19.50 Cottonseed meal 11.85 11.60 11.55 Cottonseed hulls 10.00 9.80 9.75 Cane molasses 6.25 6.12 6.10 Calcium carbonate 1.25 1.22 1.22 Mineral and vitamin mix3 0.03 0.03 0.03 Energy Booster 100® … 2.10 ... Megalac®-R ... ... 2.50 Nutrient (DM basis) NEg, Mcal/kg 1.17 1.24 1.24 TDN, % 72.97 75.42 75.37 CP, % 17.31 16.94 16.87 NDF, % 26.26 25.72 25.60 EE, % 3.93 5.91 6.02 Ca, % 0.68 0.67 0.90 P, % 0.64 0.62 0.62
1 Steers were provided supplement daily (4.1 kg/steer) for a period of 40 d while grazing bahiagrass pastures (54.0 and 9.6% TDN and CP, respectively). 2 CO = grain-based supplement non-fortified with a rumen-inert fat source; EN = grain-based supplement fortified with Energy Booster 100® (MSC Co, Carpentersville, IL), MG = grain based supplement fortified with Megalac®-R (Church & Dwight Co, Priceton, NJ). 3 Cattle Select (Lakeland Animal Nutrition; Lakeland, FL); Ca (14%), P (9%), NaCl (64%), K (0.2%), Mg (0.3%), S (0.3%), Co (50 ppm), Cu (1,500 ppm), I (210 ppm), Mn (500 ppm), Se (40 ppm), Zn (3,000 ppm), F (800 ppm), Fe (800 ppm), Vitamin A (360,000 ppm).

55
Table 3-2. Fatty acid profile of supplemental fat sources used in the formulation of experimental diets (% of fatty acids).1
Fat Supplements2 EN MG
C12:0 0.1 0.1 C14:0 2.7 0.9 C16:0 41.5 36.3 C16:1 1.4 0.2 C18:0 38.7 3.9 cis-C18:1 12.6 26.7 trans-C18:1 0.1 01 C18:2 1.7 28.5 C18:3 0.1 3.0 Others3 1.1 0.3
1 C12:0 = Lauric acid; C14:0 = Myristic acid; C16:0 = Palmitic Acid; C16:1 = Palmitoleic acid; C18:0 = Stearic Acid; cis-C18:1 = Oleic acid; trans-C18:1 = Vaccenic acid; C18:2 = Linoleic acid; and C18:3 = α-Linolenic acid. 2 The fatty acid profile of the fat supplement was determined according to the manufacturer; EN = grain-based diet fortified with Energy Booster 100® (MSC Co, Carpentersville, IL); MG = Megalac®-R (Church & Dwight Co, Priceton, NJ). 3 Others = Not detected.

56
Table 3-3. Nutrient composition of TMR fed to transport-stressed steers during the post-shipping phase of the study.
Treatments1
Nutrient (DM basis)2 CO EN MG D 1 to 43
CP, % 14.1 13.9 13.9 NDF, % 58.6 58.4 58.4 EE, % 2.7 3.4 3.4 TDN, % 62.9 63.8 63.7 NEg,, Mcal/kg 0.8 0.8 0.8 Ca, % 0.5 0.5 0.5 P, % 0.4 0.4 0.4
D 5 to 124
CP, % 14.8 14.6 14.5 NDF, % 46.5 46.2 46.1 EE, % 3.4 4.6 4.7 TDN, % 62.8 64.2 64.2 NEg, Mcal/kg 0.8 0.9 0.9 Ca, % 0.6 0.5 0.7 P, % 0.5 0.5 0.5
D 13 to 295
CP, % 14.9 14.7 14.6 NDF, % 44.1 43.8 43.7 EE, % 3.6 4.8 4.9 TDN, % 62.5 64.1 64.1 NEg, Mcal/kg 0.8 0.9 0.9 Ca, % 0.6 0.6 0.7 P, % 0.5 0.5 0.5
1 CO = grain-based diet non-fortified with a rumen-inert fat source; EN = grain-based diet fortified with Energy Booster 100® (MSC Co, Carpentersville, IL); MG = grain-based diet fortified with Megalac®-R (Church & Dwight Co, Priceton, NJ). 2 Except NEg which unit is Mcal/kg of DM. 3 D 1 to 4 = free-choice of hay and 70:30 mixture of treatment concentrate:CSH6. 4 D 5 to 13 = free-choice of 60:25:15 mixture of treatment concentrate:CSH:hay. 5 D 12 to 29 = free-choice of 65:28:7 mixture of treatment concentrate:CSH:hay. 6 CSH = Cottonseed hulls.

57
Table 3-4. Effect of supplemental fat source on plasma fatty acid concentrations on d 0 and d 29 of the study1. d 0 d 29 P-value3 SEM4
Fatty acid2 CO EN CO EN MG a b c d x y ----------------------------mg/mL--------------------------- C14:0 0.0064 0.0073 0.0054 0.0067 0.0054 0.18 0.05 0.92 0.05 0.0006 0.0006 C16:0 0.0880 0.1050 0.1301 0.1611 0.1621 0.01 0.02 0.01 0.93 0.0064 0.0135 C16:1 0.0036 0.0035 0.0034 0.0035 0.0035 0.88 0.82 0.85 0.96 0.0003 0.0006 C17:0 0.0052 0.0061 0.0073 0.0089 0.0074 0.03 0.04 0.91 0.05 0.0004 0.0007 C18:0 0.1061 0.1367 0.1969 0.2344 0.2307 0.01 0.11 0.14 0.87 0.0100 0.0220 C18:1t 0.0080 0.0067 0.0087 0.0109 0.0113 0.11 0.29 0.21 0.85 0.0008 0.0021 C18:1c 0.0695 0.0849 0.0750 0.0850 0.0850 0.01 0.16 0.15 0.97 0.0054 0.0068 C18:2n-6 0.2226 0.2422 0.4422 0.5557 0.5656 0.45 0.04 0.03 0.85 0.0260 0.0550 C18:3n-3 0.0102 0.0130 0.0060 0.0073 0.0090 0.07 0.22 0.01 0.12 0.0010 0.0010 CLAc 0.0009 0.0009 0.0001 0.0001 0.0001 0.98 0.70 0.73 0.97 0.0001 0.0001 CLAt 0.0001 0.0002 0.0002 0.0002 0.0003 0.25 0.99 0.78 0.78 0.0001 0.0001 C20:4n-6 0.0143 0.0122 0.0177 0.0208 0.0183 0.07 0.20 0.79 0.29 0.0010 0.0020 C20:5n-3 0.0029 0.0033 0.0010 0.0010 0.0017 0.26 0.98 0.11 0.09 0.0004 0.0004 C22:5n-3 0.0048 0.0047 0.0019 0.0022 0.0036 0.70 0.74 0.08 0.15 0.0004 0.0010 C22:6n-3 0.0021 0.0018 0.0006 0.0005 0.0005 0.19 0.67 0.66 0.99 0.0001 0.0003 SFA5 0.2056 0.2547 0.3396 0.4110 0.4056 0.01 0.05 0.07 0.88 0.0200 0.0350 MUFA6 0.0810 0.0951 0.0870 0.0991 0.0997 0.02 0.15 0.12 0.94 0.0059 0.0080 PUFA7 0.2581 0.2783 0.4697 0.5879 0.5991 0.48 0.05 0.03 0.84 0.0280 0.0580 Total n-38 0.0200 0.0230 0.0095 0.0110 0.0150 0.20 0.47 0.01 0.07 0.0022 0.0020 Total n-69 0.2370 0.2540 0.4600 0.5800 0.5800 0.03 0.05 0.03 0.89 0.5100 0.0600 Total CLA10 0.0010 0.0010 0.0003 0.0003 0.0004 0.99 0.86 0.72 0.85 0.0001 0.0002 Total FA11 0.5447 0.6282 0.8963 1.0980 1.1044 0.09 0.05 0.04 0.94 0.0500 0.1000
Ratios SFA/UFA12 0.6185 0.7036 0.6240 0.6020 0.5840 0.01 0.33 0.08 0.44 0.0260 0.0225 n-3/n-613 0.0870 0.0950 0.0200 0.0200 0.0250 0.18 0.83 0.13 0.07 0.0050 0.0030 1 CO = grain-based diet non-fortified with a rumen-inert fat source. EN = grain-based diet fortified with Energy Booster® (MSC Co, Carpentersville, IL); MG = grain-based diet fortified with Megalac®-R (Church & Dwight Co, Priceton, NJ).

58
2 C12:0 = Lauric acid; C14:0 = Myristic acid; C16:0 = Palmitic Acid; C16:1 = Palmitoleic acid; C18:0 = Stearic Acid; C18:1t = Vaccenic; C18:1c9 = Oleic acid; C18:2n-6 = Linoleic acid; C18:3n-3 = α-Linolenic acid; CLAc = cis-9, trans-11CLA; CLAt = CLA trans-10, cis-12; C20:4n-6 = Arachidonic acid; C20:5n-3 = eicosapentaenoic acid; C22:5n-3 = decosapentaenoic acid; C22:6 = docosahexaenoic acid. 3 a = difference of LS means of CO x EN on d 0; b = difference of LS means of CO x EN on d 29; c = difference of LS means of CO x MG on d 29; d = difference of LS means of EN x MG on d 29. 4 x = standard error of measurement on d 0; y = standard error of measurement on d 29. 5 SFA = C14:0 + C16:0 + C17:0 + C18:0. 6 MUFA = C16:1 + C18:1c + C18:1t. 7 PUFA = C18:2n-6 + C18:3n-3 + CLAc + CLAt + C20:4n-6 + C20:5n-3 + C22:5n-3 + C22:6n-3. 8 Total n-3 = C18:3n-3 + C20:5n-3 + C22:5n-3 + C22:6n-3. 9 Total n-6 = C18:2n-6 + C20:4n-6. 10 Total CLA = CLAc + CLAt. 11 Total FA = Sum of all indentified fatty acids. 12 SFA/UFA ratio = (C14:0 + C16:0 + C17:0 + C18:0) / (C16:1 + C18:1c + C18:1t + C18:2n-6 + C18:3n-3 + CLAc + CLAt + C20:4n-6 + C20:5n-3 + C22:5n-3 + C22:6n-3). 13 n-3/n-6 ratio = (C18:3n-3 + C20:5n-3 + C22:5n-3 + C22:6n-3) / (C18:2n-6 + C20:4n-6).

59
Table 3-5. Correlations between plasma measurements, DMI and ADG of transport-stressed steers during post-shipping phase of the study.1
Item Ceruloplasmin Fibrinogen ADG Fibrinogen 0.25 0.05 ADG -0.26 -0.26 < 0.05 < 0.05 DMI -0.39 -0.24 0.76 < 0.01 0.05 < 0.01
1 Upper row = correlation coefficients; Lower row = P–values.

60
Figure 3-1. Least squares means of DMI of steers during the post-shipping phase of the study. Steers were fed diets containing Megalac®-R (MG), Energy Booster 100® (EN), or no supplemental fat (CO). The asterisks indicate when CO-fed steers had greater (P ≤ 0.05) DMI compared to MG-fed steers (treatment x day interaction; P ≤ 0.05). A day effect was observed (P < 0.001).
*
* *
* * *
*
0.0
1.0
2.0
3.0
4.0
2 4 6 8 10 12 14 16 18 20 22 24 26 28
DM
I (%
of B
W)
Days after shipping
CO EN MG
*
**
***
*† †**
*
*
*

61
Figure 3-2. Least squares means of covariately adjusted plasma fibrinogen concentrations of
steers during the post-shipping phase of the study. Steers were fed diets containing Megalac®-R (MG), Energy Booster 100® (EN), or no supplemental fat (CO). Steers arrived in the feedlot on d 1. A day effect was observed (P < 0.01).
150.0
250.0
350.0
450.0
550.0
1 4 8 15 22 29
Fibr
inog
en (m
g/dL
)
Days after shipping
CO EN MG

62
Figure 3-3. Least squares means of plasma ceruloplasmin concentrations of steers during the
post-shipping phase of the study. Steers were fed diets containing Megalac®-R (MG), Energy Booster 100® (EN), or no supplemental fat (CO). Steers arrived in the feedlot on d 1. A day effect was observed (P < 0.01).
10.0
15.0
20.0
25.0
1 4 8 15 22 29
Cer
ulop
lasm
in (m
g/dL
)
Days after shipping
CO EN MG

63
CHAPTER 4 EFFECTS OF MEGALAC®-R SUPPLEMENTATION ON MEASURES OF PERFORMANCE
AND ACUTE-PHASE REACTION IN TRASPORTED BEEF HEIFERS
Material and Methods
This experiment was conducted from September to November 2007 at the University of
Florida – IFAS, Range Cattle and Education Center, Ona, in 2 phases: pre-shipping (d -30 to 0),
and post-shipping (d 1 to 29).
The animals utilized in this experiment were cared for in accordance with acceptable
practices outlined in the Guide for the Care and Use of Agricultural Animals in Agricultural
Research and Teaching (FASS, 1999).
Animals and Facilities
Forty-eight Brahman-crossbred heifers (BW ± SD = 276 ± 32 kg; age ± SD = 330 ± 17 d)
were utilized for this experiment. Prior to the start of the study, heifers were separated from dams
and allowed to acclimate for a period of seven days from the stress of weaning. Following
acclimation, heifers were stratified by BW and age, and randomly assigned to two
supplementation treatments (pre-shipping-phase). Treatments consisted of a 1) grain-based
supplement with Megalac®-R (MG), or 2) grain-based supplement without Megalac®-R (CO).
Heifers were randomly allocated into six bahiagrass pastures (three pastures/treatment; eight
heifers/pasture) and fed for a period of 30 days.
On d 0 the heifers were loaded onto a commercial livestock trailer and transported 1,600
km for a period of 24 h. Post-shipping, heifers were stratified by shrunk BW and assigned to one
of the following two housing systems; 1) pasture-based system identical to the pre-shipping
model (n = 24; three pastures / treatment; four heifers / pasture) or 2) individual feedlot facility
(24 pens; twelve pens / treatment; one heifer / pen). Pre-shipping treatment allocations were
continued in the 29-d post-shipping phase.

64
Pastures areas used during the pre- and the post-shipping phase were 1.07 ha in size.
Individual pens used during the post-shipping phase had concrete floors and were 48 m2 in size.
Each pen contained a water source and two feed bunks (one for hay; one for concentrate).
Diets
Two grain-based supplements were utilized for this experiment, one with and one without
the inclusion of Megalac-R® (150 g/heifer daily; Tables 4-1 and 4-2). Supplements were limit-
fed at a rate of 3.0 and 2.5 kg of DM/heifer daily for CO and MG, respectively, during pre and
post-shipping phases. Quality of bahiagrass pastures was determined to be 55.0% TDN and 8.7%
CP (DM basis) from hand-plucked samples collected at the beginning of the trial and analyzed
by a commercial laboratory (Dairy One Forage Laboratory, Ithaca, NY). Samples were taken at
20 locations per pasture according to procedures determinated by Vendramini et al. (2006).
Pastures were not fertilized prior to or during the experimental period. Stargrass
(Cynodon nlemfuensis) hay was offered to individually-fed heifers in the feedlot in amounts to
ensure ad libitum consumption. Hay quality was calculated to be 53.5% TDN and 10.1% CP
(DM basis) from hay samples collected weekly and analyzed by a commercial laboratory (Dairy
One Forage Laboratory).
A complete commercial mineral and vitamin mix and water were offered ad libitum
throughout both phases of the experiment (Table 4-3).
Sampling
During the pre-shipping phase, heifers shrunk BW (16 h of feed restriction) was recorded
on d -30. In the post-shipping phase, heifers shrunk BW was recorded on d 1 (immediately
following arrival at feeding facility) and at the end of the experiment (d 29). Full BW was
recorded on d -15, 0, 4, 8, 15, 22, 28 in order to calculate DMI as a % of BW. Shrunk BW values
were utilized to determine ADG during the pre- and post-shipping phases.

65
During the post-shipping phase, daily samples of offered and refused hay were collected,
weighed, and analyzed for DM. Random representative samples of supplements ingredients were
collected on a weekly basis for each phase of the trial for DM and nutrient determination.
Samples were dried in a 60oC forced air oven for 96 h, ground through a 1-mm Wiley
laboratory mill screen (Model 4, A. H. Thomas, Philadelphia, PA) and analyzed for nutrient
composition according to analytical procedures of a commercial feed laboratory (Dairy One
Forage Laboratory, Ithaca, NY).
Blood samples were collected from heifers on d 0, 1, 4, 8, 15, 22, and 28 and analyzed for
plasma concentrations of ceruloplasmin, haptoglobin, and cortisol.
Blood Analysis
All blood samples were collected via jugular venipuncture into commercial blood
collection tubes (Vacutainer, 10 mL; Becton Dickinson, Franklin Lakes, NJ) containing sodium
heparin, placed on ice immediately after sampling, and centrifuged (GPR Centrifuge, Model
349702; Beckman Instruments Inc., Fullerton, CA) at 2,000 x g for 30 min for plasma separation.
The plasma of each sample was removed by transfer pipet to it respective vial and frozen at -
20°C on the same day of collection.
A microplate spectrophotometer (PowerWave™ 340; BioTek Instruments, Inc.,
Winooski, VT) was used to determine plasma haptoglobin concentrations in duplicate samples
by measuring haptoglobin/hemoglobin complexing (HpHbB) by the estimation of differences in
peroxidase activity as described previously (Makimura and Suzuki, 1982). For haptoglobin
concentrations ≤1.0 mg of HpHbB/100 mL, the intraassay CV was 12.6%, and for concentrations
>1.0 mg of HpHbB/100 mL, the intraassay CV was controlled to values 7.1%. The interassay
CV was controlled to values 8.9%.

66
A spectrophotometer (ThermoSpectronic™ Genesys™ 20; Thermo Fisher Scientific Inc.,
Waltham, MA) was used to determine plasma ceruloplasmin concentration. Plasma
ceruloplasmin oxidase activity was measured in duplicate samples using colorimetric procedures
described by Demetriou et al. (1974). The intraassay and interassay CV were 4.6 and 8.8%,
respectively. Ceruloplasmin concentrations were expressed as mg/dL, as described by King
(1965).
Concentrations of plasma cortisol were determined using a Coat-A-Count Kit (DPC®
Diagnostic Products Inc., Los Angeles, CA) solid phase 125I radioimmunoassay (RIA) via Gama
Counter (Packard Cobra Auto Gamma 85005, GMI Inc., Ransey, MN). All samples were
analyzed in duplicate with procedures previously validated for bovine samples (Eicher et al.,
2000). Reference plasma samples containing 50 ng/mL of cortisol were analyzed for the
calculation of intra- and interassay CV (5.5 and 6.4%, respectively). The minimum detectable
concentration of cortisol was 5 ng/mL.
Statistical Analysis
Data were analyzed using the PROC MIXED procedure of SAS (SAS, 2001).
The statistical model used for plasma measurements and DMI from individually-fed
heifers was:
Yijk = µ + TRTi + Dj + TRTDij + HEIFERk(i) + Eijk
where
Y = response variable
µ = mean
TRT = fixed effect of treatment
D = fixed effect of day
TRTD = effect due to interaction of treatment and day

67
HEIFER = random effect of heifer within treatment
E = residual error
The statistical model used for ADG analysis for data obtained from individually-fed
heifers was:
Yij = µ + TRTi + HEIFERj(i) + Eij
where
Y = response variable
µ = mean
TRT = fixed effect of treatment
HEIFER = random effect of heifer within treatment
E = residual error
The statistical model used for ADG analysis for data obtained from heifers on pasture
during the pre-shipping phase was:
Yijk = µ + TRTi + HEIFERj(k) + PENk(i) + Eijk
where
Y = response variable
µ = mean
TRT = fixed effect of treatment
HEIFER = random effect of heifer within pen
PEN = random effect of pen within treatment
E = residual error
Results are reported as least square means. Means were separated using LSD.
Significance was determined at P ≤ 0.05 and tendencies include P > 0.05 and ≤ 0.10. Only

68
significant interactions were reported. Pearson correlation coefficients among plasma
measurements, ADG, and DMI were generated using the CORR procedure of SAS (SAS, 2001).
Results
Measurements of Performance
No differences (P = 0.99) were reported in ADG between treatments in the pre-shipping
phase (0.12 kg/d for both CO and MG treatments; SEM = 0.06). In addition, no post-shipping
differences (P ≤ 0.30) in ADG (0.78 and 0.66 kg/d for CO and MG treatments, respectively;
SEM = 0.13) and G:F ratio (0.13 and 0.11 for CO and MG treatments, respectively; SEM = 0.01)
among heifers maintained in the individual feeding facility were detected. No treatment effects
(P < 0.27) or treatment x day interaction (P < 0.77) were detected for total DMI (2.01 and 1.92%
of BW for CO and MG; SEM = 0.06; Figure 4-1) and voluntary hay DMI (1.03 and 1.10 % of
BW for CO and MG, respectively; SEM = 0.04) of heifers following transportation. A day effect
was observed (P < 0.01).
Plasma Measurements and Coefficients of Correlation
No treatment (P ≤ 0.54) or treatment x day interactions (P ≤ 0.86) for plasma
ceruloplasmin (31.5 vs. 29.1 mg/dL for CO and MG, respectively; SEM = 1.40; Figure 4-2) and
plasma cortisol (3.97 and 3.62 ug/mL for CO and MG, respectively; SEM = 0.39; Figure 4-3)
concentrations were detected. A treatment (P < 0.01) effect was detected for plasma haptoglobin
concentration (0.021 and 0.013 absorption at 450 nm x 100 for CO and MG, respectively; SEM
= 0.002). Control-fed heifers had greater haptoglobin concentrations on d 1, 3 and 7 (Treatment x
day interaction, P < 0.002; Figure 4-4) compared to MG-fed heifers. The effect of day was
significant (P < 0.01) for all analyses completed. Pearson correlation coefficients among
ceruloplasmin, haptoglobin, cortisol, DMI, and ADG are presented in Table 4-4. Significant
positive (P ≤ 0.05) correlations were detected between ceruloplasmin x cortisol, and haptoglobin

69
x DMI. The relationship between ADG x DMI tended (P = 0.09) to be positive. A negative (P ≤
0.05) correlation was observed between ceruloplasmin x ADG.
Discussion
Performance
The means between supplement treatments for ADG, DMI, and G:F were non-significant,
even if though differences were numerically less for MG- than CO-fed heifers. These data are in
agreement with Espinoza et al. (1995) and Kucuk et al. (2004) who suggested no effect of CSFA
supplementation on the performance of growing and finishing steers. Differences in
performance responses in Exp. 1 compared to Exp. 2 may be a result of adaptation to the
supplemental fat. Heifers in Exp. 2 were offered MG supplements during the 30-d pre-shipping
phase. This allowed for a period of adaptation to MG, which may have allowed for a more
consistent DMI in the post-shipping phase of the study. In contrast, the steers in Exp. 1 were not
provided a period of MG acclimation prior to the start of the post-shipping phase of the study.
Further, in Exp. 2, heifers were provided their fat supplements in a limit-fed concentrate offered
separately from the ground hay whereas fat was mixed in the TMR in Exp. 1. Complete
consumption of the daily supplement was observed for all heifers, suggesting that the heifers
were adapted to their fat treatment. According to Grummer et al. (1990) and Zinn (1988), a
period of adaptation to fat supplementation is essential to maintain optimal feed intake;
especially when CS of FA are the source of fat being supplemented.
Inflammatory Reaction
The significant day effect for plasma concentrations of Cp and cortisol was detected in
the study, where independent of fat treatment; concentrations increased after shipping.
According to The Merck Veterinary Manual (1997), normal values of Cp in cattle range from
16.8 to 34.2 mg/dL, and in this experiment Cp ranged from 17.8 to 45.8 mg/dL. The peaks at d 1

70
followed by a period of decreasing concentration of Cp confirm the presence of an acute-phase
inflammatory reaction in heifers-fed treatments by d 1. This response is in agreement to a
previous study by Arthington et al. (2008) that observed peak Cp during the first 72 h after
transport followed by a gradual decrease in the concentration of this protein. In addition, Cullens
(2005) observed no differences in plasma Cp concentrations in post-partum lactating dairy cows
supplemented with CSFA (Megalac®-R) compared to cows receiving no supplement fat,
although lactating heifers had lower concentration of plasma Cp when fed CSFA.
A treatment x day interaction was observed for Hp due to a greater concentration in CO-
compared to MG-fed heifers on d 1, 3 and 7 after shipping. This response suggests that CO-fed
heifers experienced a greater pro-inflammatory response to shipping compared with MG-fed
heifers. Because in this experiment Hp was detected in plasma of all heifers suggesting that each
was experiencing an acute-phase pro-inflammatory reaction. Supplementation with MG resulted
in decreased Hp concentrations compared with CO-fed heifers. This decrease in Hp appears to be
an anti-inflammatory response to the stress caused by shipping, and this type of response might
be expected when animals are supplemented with an n-3 and not an n-6 (i.e. Megalac®-R) FA
source.
The inclusion of PUFA into diets has been shown to modulate immune cell function
(Calder et al., 2002). Schmitz & Ecker (2008) stated that the main difference between n-6 and n-
3 FA-derived eicosanoids is that most of the mediators formed from ARA are pro-inflammatory;
whereas those formed from EPA and DHA are anti-inflammatory. Megalac®-R is a CS of PUFA
rich in LA (30% of total FA) which have been shown to stimulate cytokines (Farran et al., 2008)
and other physiological mediators such as PGE2 and LTB4 (Yaqoob & Calder, 1993).

71
Lessard et al., (2004) suggested that the regulation of cytokine synthesis can be
influenced by differences in the ratio of n-3 and n-6 PUFA in blood and other tissues. Lessard et
al. (2003) fed whole flaxseed (16% LA; 57% LNA), CS of palm oil (8% LA; 0.3% LNA) and
micronized soybeans (57% LA; 7% LNA) to lactating dairy cows from calving to 108 d of
lactation. Twenty-one d after calving and 20 d after artificial insemination, serum concentrations
of LNA and the n-3 to n-6 ratio was greater for cows fed whole flaxseed than cows fed
micronized soybeans or CS of palm oil. Blood serum concentrations of PGE2 were reduced in
cows fed flaxseed for a minimum of 60 d, which is in agreement to the proposed anti-
inflammatory effects of n-3 supplementation (Lessard et al., 2003).
Other research has shown conflicting results relative to the anti-inflammatory and
inflammatory effects of n-3 and n-6 FA. Do Amaral (2008) reported lower plasma Cp
concentrations in lactating heifers fed CS of palm and fish oils after calving compared to those
fed an n-6 FA supplement. Greater plasma Fb concentrations were found in multiparous lactating
cows fed an n-6 FA supplement compared to cows fed an n-3 FA supplement.
Yaqoob & Calder (2007) stated that DHA and LNA can be converted to EPA in animal
cells. Because EPA is able to compete with ARA for the same enzymes and receptors, EPA can
inhibit the production of eicosanoids such as PG-2 and LT-4 series from ARA (Calder, 1999);
thereby reducing inflammation. The concentration of LNA and other n-3 FA in ruminant tissues
is less compared with other FA, such as LA and stearic acid. Therefore, small tissue changes in
n-3 FA’s concentration may cause significant physiological transformation in cellular activation
and communication, mainly due to synthesis of eicosanoids.
In the post-shipping phase of Exp. 2, 50% of the diet was stargrass hay, and during the
pre-shipping phase, heifers were grazing bahiagrass pasture. In general, forages are recognized to

72
have greater n-3 FA concentration compared with grains which have greater n-6 FA content
(Jurgens, 2002). The natural protection of the forage provided by cell wall components may be
more adequate to prevent the release of fat and thus BH of PUFA, compared to the protection of
other diet components such as grains and oils (Petit, 2002). Perhaps the combination of both
factors: greater concentration of “protected” n-3 FA provided by forage, and greater changes in
PUFA profile (mainly LA) caused by the ruminal BH, would allow increased absorption of n-3
FA in the small intestine by MG-fed heifers, and consequently, would influence the magnitude of
an inflammatory response.
According to Farran et al. (2008), BH can be affected by many factors including: nature
and amount of dietary lipid fed, type of protective treatment, and the nature and amount of
forages and concentrates included in the diet. The reason to protect fat is to provide a greater
amount of UFA in the small intestine, although CSFA are not completely inert to the actions of
rumen bacteria (Wu et al., 1981). Sukhija & Palmquist (1990) suggested that the FA profile of
CS may affect properties of inertness. According to the authors, CS of SFA are less dissociated
than CS of UFA at any given ruminal pH. In agreement, Juchem (2007) observed BH rates
greater than 85% for LA and 92% for LNA when fish oil were supplemented in CS- or oil-form.
Despite BH, continuous, long-term PUFA supplementation has shown to modulate immune
responses in cattle (Bilby et al., 2006; Silvestre, 2009), because certain amounts of PUFA are
able to successfully escape microbial BH in the rumen, and be absorbed in the small intestine
(Palmquist & Jenkins, 1980).
If BH occurs, the concentration of LA in the small intestine compared to that consumed
by the animal will be less, and likely the concentrations of intermediate FA, such as trans C18:1
and CLA will be greater. A greater dietary supply of LA and LNA is known to increase milk

73
C18:1 concentrations (Dhiman et al., 1995) and CS of fish oil result in a greater concentration of
trans-fatty acids in the rumen (Baumgard et al., 2000). Lundy, III et al. (2004) observed a greater
concentration of trans C18:1 in the omasum of dairy cows supplemented with CS or amides of
soybean oil (56% LA) than cows supplemented with unprotected soybean oil. This observation is
in agreement with Harfoot & Hazlewood (1978) who suggested that greater concentrations of
PUFA in ruminal contents may cause the accumulation of trans C18:1 by inhibiting the
conversion of trans C18:1 to C18:0 (stearic acid), especially when PUFA are present as free
acids. If this theory is applied to the current experiment, MG-fed heifers would have had a
greater absorption of trans-fatty acids and CLA, which may affect FA composition, especially
the n-3 to n-6 ratio, of cellular membranes.
Monounsaturated fatty acids, such as oleic acid (C18:1), are non-essential since they can
be synthesized de novo. In vitro studies have shown that oleic acid is able to suppress
lymphocyte inflammation (Miles & Calder, 1998), additionally, Jeffery et al. (1996) observed
that feeding diets containing high-oleic sunflower oil and olive oil (80% C18:1) decreased the
proliferation of spleen lymphocytes in rats compared with feeding low-fat or safflower oil (75%
LA) diets. Besler & Grimble (1995) demonstrated that feeding rats for eight wk with diets
containing 5 or 10% butter (rich in oleic acid) or olive oil completely suppressed increases of
tissue zinc content, liver protein synthesis, and serum Cp concentrations in response to
subcutaneous Escherichia coli endotoxin, when compared with maize oil (47% LA) diet. These
studies are in agreement with Yaqoob (2002) who stated that MUFA-rich oils have physiological
effects which are similar to fish oils. Pariza et al. (2000) demonstrated that CLA supplementation
to LPS-challenged rats appeared to stimulate an anti-inflammatory response. Additionally, Cook
et al. (1993) observed that CLA-derived eicosanoids could affect synthesis of PGs negatively;

74
therefore decreasing synthesis of TNF-α. Therefore, it is suggested that increased availability of
MUFA, mainly trans C18:1, and CLA may modulate anti-inflammatory immune responses in
mammals.
The APP are often used as a marker of stress and which is commonly confused with an
undesirable response (Silvestre, 2009). However, the acute-phase reaction provides an early non-
specific defense mechanism against insult before specific immunity is achieved (Petersen et al.,
2004). In turn, Calder et al. (2002) suggested controversy exists in the literature concerning the
effects of n-6 and n-3 FA on the immune response, and the discrepancies among experiments
could be due to differences among species, source of PUFA added to diets, time of
supplementation, and physiological status of the animals. The concentrations of cytokines in
blood or in neutrophills were not evaluated in this study. However, several authors (Johnson,
1997; Spurlock, 1997; Calder, 1999) have reported that synthesis of APP, such as Hp, is directly
stimulated by cytokines, mainly IL-6 and TNF-α. In conclusion, it is suggested that MG-fed
heifers experienced decreased blood Hp concentrations due to a reduced inflammatory reaction
may caused in response to PUFA supplementation, even if LA is one of the FA present in more
abundance in the MG product.

75
Table 4-1. Ingredient and nutrient composition of grain-based supplements fed heifers during the pre- and post-shipping phases of the study.
Treatments1
CO MG Ingredient (% of dietary DM) Soybean Hulls 74.3 72.6 Cracked Corn 10.3 … Cottonseed Meal 14.1 21.5 Megalac-R … 5.9 Limestone 1.2 … Component (DM basis) NEg, Mcal/kg 0.8 0.85 TDN, % 63.3 67.1 CP, % 16.9 19.4 NDF, % 54.9 55.0 EE, % 3.0 7.9 Ca, % 0.5 1.2 P, % 0.3 0.3
1 CO = grain-based supplement without Megalac®-R (Church & Dwight Co, Priceton, NJ); MG = grain-based supplement with Megalac®-R.

76
Table 4-2. Fatty acid profile of supplemental fat source used in the formulation of experimental MG supplement (% of fatty acids).1
Fat Supplement2
MG C12:0 0.1 C14:0 0.9 C16:0 36.3 C16:1 0.2 C18:0 3.9 cis-C18:1 26.7 trans-C18:1 01 C18:2 28.5 C18:3 3.0 Others3 0.3
1 C12:0 = Lauric acid; C14:0 = Myristic acid; C16:0 = Palmitic Acid; C16:1 = Palmitoleic acid; C18:0 = Stearic Acid; cis-C18:1 = Oleic acid; trans-C18:1 = Vaccenic acid; C18:2 = Linoleic acid; and C18:3 = α-Linolenic acid. The fatty acid profile of the fat supplement was determined according to the manufacturer. 2 MG = Megalac®-R (Church & Dwight Co, Priceton, NJ). 3 Others = Not detected.
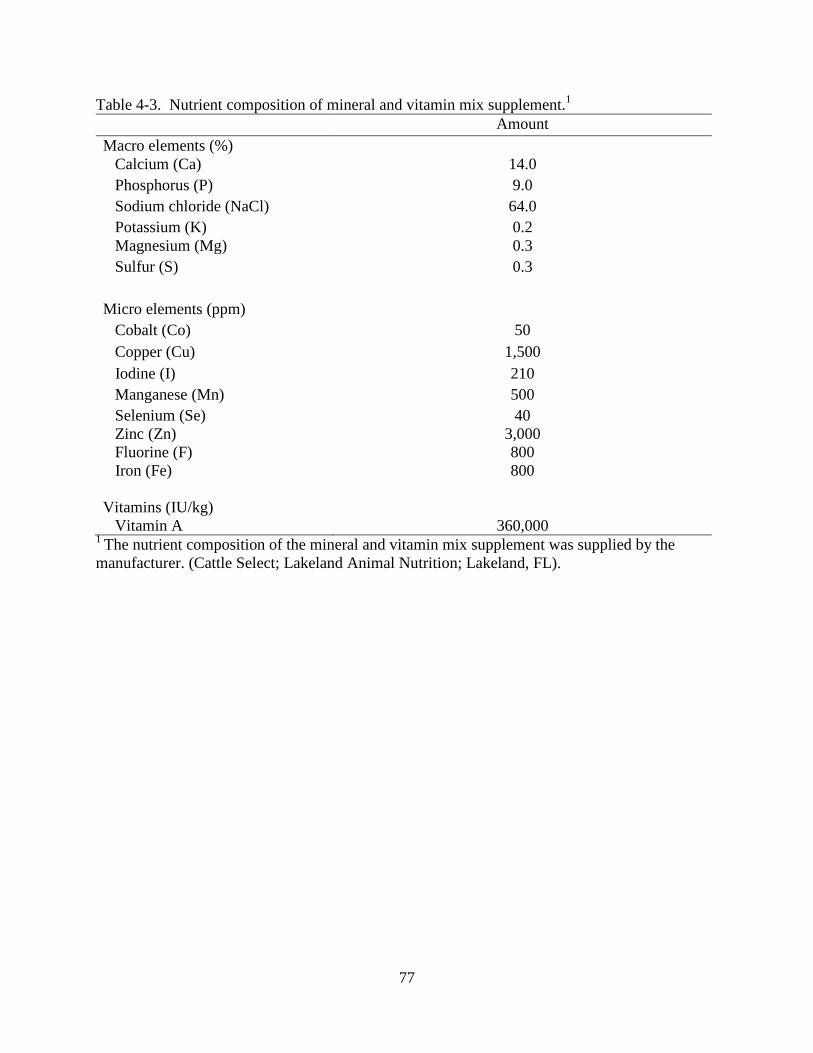
77
Table 4-3. Nutrient composition of mineral and vitamin mix supplement.1 Amount Macro elements (%) Calcium (Ca) 14.0 Phosphorus (P) 9.0 Sodium chloride (NaCl) 64.0 Potassium (K) 0.2 Magnesium (Mg) 0.3 Sulfur (S) 0.3 . Micro elements (ppm) Cobalt (Co) 50 Copper (Cu) 1,500 Iodine (I) 210 Manganese (Mn) 500 Selenium (Se) 40 Zinc (Zn) 3,000 Fluorine (F) 800 Iron (Fe) 800 Vitamins (IU/kg) Vitamin A 360,000
1 The nutrient composition of the mineral and vitamin mix supplement was supplied by the manufacturer. (Cattle Select; Lakeland Animal Nutrition; Lakeland, FL).

78
Table 4-4. Correlations between plasma measurements, DMI and ADG of transport-stressed heifers during post-shipping phase of the study.1
Item Haptoglobin Ceruloplasmin Cortisol DMI Ceruloplasmin 0.32 0.13 Cortisol 0.10 0.40 0.65 0.05 DMI 0.51 -0.03 -0.03 0.01 0.90 0.88 ADG 0.14 -0.40 -0.18 0.35 0.51 0.05 0.39 0.09
1 Upper row = correlation coefficients. Lower row = P–values.

79
Figure 4-1. Least squares means for DMI of pen-fed heifers during the post-shipping phase of the study. Heifers were fed grain-based
supplements containing Megalac®-R (MG) or no supplemental fat (CO) from 30 d before to 27 d after shipping. A day effect was detected (P < 0.001).
1.25
1.50
1.75
2.00
2.25
2.50
1 2 3 4 5 6 7 8 9 10 11 12 13 14 15 16 17 18 19 20 21 22 23 24 25 26 27
DM
I (%
BW
)
Days after shipping
CO MG

80
Figure 4-2. Post-shipping concentrations of plasma ceruloplasmin of heifers fed grain-based
supplements containing Megalac®-R (MG) or no supplemental fat (CO) from 30 d before to 27 d after shipping. Heifers were loaded onto a trailer on d 0 and arrived in the feedlot on d 1. A day effect was observed (P < 0.001).
15.0
20.0
25.0
30.0
35.0
40.0
0 1 3 7 14 21 28
Cer
ulop
lasm
in (m
g/dL
)
Days after shipping
CO MG

81
Figure 4-3. Post-shipping concentrations of plasma cortisol of heifers fed grain-based
supplements containing Megalac®-R (MG) or no supplemental fat (CO) from 30 d before to 27 d after shipping. Heifers were loaded onto a trailer on d 0 and arrived in the feedlot on d 1. A day effect was observed (P < 0.001).
2.0
2.7
3.4
4.1
4.8
5.5
0 1 3 7 14 21 28
Cor
tisol
(µg/
mL
)
Days after shipping
CO MG

82
Figure 4-4. Plasma concentrations of haptoglobin of heifers fed grain-based supplements containing Megalac®-R (MG) or no supplemental fat (CO) from 30 d before to 27 d after shipping. Heifers were loaded onto a trailer on d 0 and arrived in the feedlot on d 1. The asterisks at d 1, 3 and 7 indicate that CO-fed heifers had greater plasma concentration of haptoglobin compared to MG-fed heifers (Treatment x d interaction; P < 0.001). A d effect was observed (P < 0.001).
0.00
0.01
0.02
0.03
0.04
0.05
0 1 3 7 14 21 28
Hap
togl
obin
(abs
@ 4
50 n
m x
100
)
Days after shipping
CO MG
*
*
*

83
CHAPTER 5 GENERAL CONCLUSION
The data from these experiments suggest MG supplementation to growing cattle during
the feedlot receiving period negatively affects ADG, DMI, and G:F negatively, mainly if they
have not been exposed to it previously. One potential explanation for this response is palatability.
A poor acceptability of CS of PUFA by cattle may impact DMI, particularly over a short-term,
feedlot receiving period (approximately 30 d). A period of adaptation to MG may be a useful
prior to transport and feedlot entry.
Supplementation of MG appears to impact the inflammatory reaction of transport-
stressed cattle. However, it appears likely that supplementation of MG, prior to the immune-
challenge, is required to illicit this response. This supposition is derived from the current studies,
where heifers supplemented with MG for 30 d prior to shipping experienced a decreased acute-
phase reaction compared to CO-fed heifers. In contrast, the same results were not observed in
transported steers that started MG supplementation only after shipping stress and received into
the feedlot.
The reason why MG-fed heifers experienced a reduced inflammatory response is
unknown. However, one explanation might be related to the concentration of MUFA and LA in
the diet. In addition, the ruminal BH rate may influence the amount and type of FA absorbed in
the small intestine. Further research is required to understand the effects of the supplemental
PUFA sources, as well as the timing of PUFA supplementation on measures of performance and
inflammation of transport-stressed beef calves.

84
LIST OF REFERENCES
Agnes, F., P. Sartorelli, B. H. Abdi, and A. Locatelli. 1990. Effect of transport loading or noise on blood biochemical variables in calves. Am. J. Vet. Res. 51: 1679-1681.
Allen, M. S. 2000. Effects of diet on short-term regulation of feed intake by lactating dairy cattle. J. Dairy Sci. 83:1598-1624.
Arthington, J. D., S. D. Eichert, W. E. Kunkle, and F. G. Martins. 2003. Effect of transportation and commingling on the acute-phase protein response, growth, and feed intake of newly weaned beef calves. J. Anim. Sci. 81:1120-1125.
Arthington, J. D., J. W. Spears, and D. C. Miller. 2005. The effect of early weaning on feedlot performance and measures of stress in beef calves. J. Anim. Sci. 83:933-939.
Arthington, J. D., X. Qiu, R. F. Cooke, J. M. B. Vendramini, D. B. Araujo, C. C. Chase Jr., and S. W. Coleman. 2008. Effects of pre-shipping management on measures of stress and performance of beef steers during feedlot receiving. J. Anim. Sci. 86:2016-2023.
Atkinson, R. L., E. J. Scholljegerdes, S. L. Lake, V. Nayigihugu, B. W. Hess, and D. C. Rule. 2006. Site and extent of digestion, duodenal flow, and intestinal disappearance of total and esterified fatty acids in sheep fed a high-concentrate diet supplemented with high-linoleate safflower oil. J. Anim. Sci. 84:387-396.
Baldwin, D. E., R. G. Marshall, and G. E. Wessman. 1967. Experimental infection of calves with myxovirus parainfluenza-3 and Pasteurella haemolytica. Am. J. Vet. Res. 28:1773-1782.
Ban, E., F. Haour, and R. Lenstra. 1992. Brain interleukin 1 gene expression induced by peripheral lipopolysaccharide administration. Cytokines 4:48-54.
Bateman, H. G., II, J. N. Spain, M. R. Ellersieck. 1996. Influence of by-product feeds and tallow on lactation performance of Holstein cows during two seasons. J. Dairy Sci. 79:114-120.
Bauchart, D., F. Legay-Carmier, M. Doreau, and B. Gaillard. 1990. Lipid metabolism of liquid-associated and solid-adherent bacteria in rumen contents of dairy cows offered lipid-supplemented diets. Br. J. Nutr. 63:563-578.
Baumann, H. and J. Gauldie. 1994. The acute phase response. Immunol. Today 15:74-80.
Baumgard, L. H., B. A. Corl, D. A. Dwyer, A. Saebo, and D. E. Bauman. 2000. Identification of the conjugated linoleic acid isomer that inhibits milk fat synthesis. Am. J. Physiol. Regul. Integr. Comp. Physiol. 278: R179-R184.
Beam, S. W. and W. R. Butler. 1998. Energy balance, metabolic hormones, and early postpartum follicular development in dairy cows fed prilled lipid. J. Dairy Sci. 81:121-131.
Besler, H. T. and R. F. Grimble (1995). Comparison of the modulatory influence of maize and olive oils and butter on metabolic responses to endotoxin in rats. Clin. Sci. 88: 59-66.

85
Bilby, T. R., T. Jenkins, C. R. Staples, and W. W. Thatcher. 2006. Pregnancy, bovine somatotropin, and dietary n-3 fatty acids in lactating dairy cows: III. Fatty acid distribution. J. Dairy Sci. 89: 3386-3399.
Breazile, J. E. 1996. The physiology of stress and its relationship to mechanisms of disease and therapeutics. Vet. Clin. N. Am. 4:441-480.
Brokaw, L., B. W. Hess, A. D. Schleicher, E. J. Scholljegerdes, L. M. Yun, J. D. Hegg, and J. Bratka. 2000. Evaluation of supplemental high oil corn for heifers grazing summer pasture. Proc. West. Sect. Am. Soc. Anim. Sci. 51:290-294.
Brokaw, L., B. W. Hess, and D. C. Rule. 2001. Supplemental soybean oil or corn for beef heifers grazing summer pasture: effects on forage intake, ruminal fermentation, and site and extent of digestion. J. Anim. Sci. 79:2704-2712.
Brokaw, L., B. W. Hess, S. J. Bartle, R. D. Landeis, B. M. Alexander, and G. E. Moss. 2002. Effects of hand-fed versus self-fed fat supplementation on growth and reproductive performance of developing beef heifers. Prof. Anim. Sci. 18:38-43.
Bull, L. S., L. J. Bush, J. D. Friend, B. Harris, and E. W. Jones. 1965. Incidence of ruminal parakeratosis in calves fed different rations and its relation to volatile fatty acid absorption. J. Dairy Sci. 48:1459-1466.
Calder, P. C. 1999. Dietary fatty acids and the immune system. Lipids 34(Suppl.): S137-S140.
Calder, P. C. and R. F. Grimble. 2002. Polyunsaturated fatty acids, inflammation and immunity. Eur. J. Clin. Nutr. 56(Suppl 3):S14-S19.
Calder, P. C., P. Yaqoob, F. Thies, F. A. Wallace, and E. A. Miles. 2002. Fatty acids and lymphocyte functions. Br. J. Nutr. 87(Suppl. 1):S31-S48.
Caughey, G. E., E. Mantzioris, R. A. Gibson,L. G. Cleland, and M. J. James. 1996. The effect on human tumor necrosis factor alpha and interleukin 1 beta production of diets enriched in n-3 FA from vegetable oil and fish oil. Am. J. Clin. Nutri. 63:116-122.
Chalupa, W. and A. J. Kutches. 1968. Biohydrogenation of linoleic-1-14C acid by rumen protozoa. J. Dairy Sci. 27:1502-1508.
Chalupa, W., B. Rickabaugh, D. S. Kronfeld, D. Sklan. 1984. Rumen fermentation in vitro as influenced by long chain fatty acids. J. Dairy Sci. 67: 1439-1444.
Chalupa, W., B. Vecchiarelli, A. E. Elser, D. S. Kronfeld, D. Sklan, and D. L. Palmquist. 1986. Ruminal fermentation in vivo as influenced by long-chain fatty acids. J. Dairy Sci. 69:1293-1301.
Chang, H. R., D. Arsenijevic, J. C. Pechère , P. F. Piguet, N. Mensi, L. Girardier, and A. G. Dulloo. 1992. Dietary supplementation with fish oil enhances in vivo synthesis of tumor necrosis factor. Immunol. Lett. 34: 13-17.

86
Cheng, K. J., T. A. McAllister, J. D. Popp, A. N. Hristov, Z. Mir, and H. T. Shin. 1998. A review of bloat in feedlot cattle. J. Anim. Sci. 76: 299-308.
Choi, B., and D. L. Palmiquist. 1996. High fat diets increase plasma cholecystokinin and pancreatic polypeptide, and decrease plasma insulin and feed intake in lactating cows. J. Nutr. 126:2913-2919.
Clapham, W. M., J. G. Foster, J. P. S. Neel, and J. M. Fedders. 2005. Fatty acid composition of traditional and novel forages. J. Agric. Food Chem. 53: 10068-10073.
Cole, N. A., T. H. Camp, L. D. Rowe, D. G. Stevens, and D. P. Hutcheson. 1988. Effect of transport on feeder calves. Am. J. Vet. Res. 49:178-183.
Cole, N. A. and D. P. Hutcheson.1985. Influence of pre-fast feed intake on recovery from feed and water deprivation by beef steers. J. Anim. Sci. 60:772-780.
Cook, J. A., J. Geisel, P. V. Halushka, and H. D. Reines.1993. Prostaglandins, thromboxanes, leukotrienes, and cytochrome P-450 metabolites of arachidonic acid. New. Horiz. 1:60-69.
Cullens, F. M. 2005. Effects of the timing of initiation of fat supplementation on productive and reproductive responses of periparturient dairy cows during summer. M.S. Thesis, University of Florida, Gainesville, FL.
Dantzer, R. and K. W. Kelley. 1989. Stress and immunity: an integrated view of relationships between the brain and the immune system. Life Sci. 44:1995-2008.
Dawson, R. M., N. Hemington, and G. P. Hazlewopd. 1977. On the role of higher plant and microbial lipases in the ruminal hydrolysis of grass lipids. Br. J. Nutr. 38:225-232.
Demetriou, J. A., P. A. Drewes, and J. B. Gin, 1974. Ceruloplasmin. In Clinical Chemistry: Principles and Techniques. Pages 857-846. 2nd Edition. Harper and Row, Hagerstown, MD.
Devendra , C. and D. Lewis. 1974. The interaction between dietary lipids and fibre in the sheep. II. Digestability studies. Anim. Prod. 19:67-76.
Dhiman, T. R., G. R. Anand, L. D. Satter, and M. W. Pariza. 1999. Conjugated linoleic acid content of milk from cows fed different diets. J. Dairy Sci. 82:2146-2156.
Dhuyvetter, K. C., A. M. Bryant, and D. A. Blasi 2005. Case of study: Preconditioning beef calves: Are expected premiums sufficient to justify the practice? Prof. Anim. Sci. 21:502-514.
Do Amaral, B. C. Effect of supplemental fat source on production, immunity, hepatic gene expression, and metabolism of periparturient dairy cows. Doctorate Dissertation. University of Florida, Gainesville, FL.

87
Doreau, M. and A. Ferlay. 1994. Digestion and utilization of fatty acids by ruminants. Anim. Feed Sci. Tech. 45:379-396.
Drackley, J. K., T. H. Klusmeyer, A. M. Trusk, and J. H. Clark. 1992. Infusion of long-chain fatty acids varying in saturation and chain length into the abomasum of lactating dairy cows. J. Dairy Sci. 75:1517-1526.
Eicher, S. D., J. L. Morrow-Tesch, J. L. Albright, J. W. Dailey, C. R. Young, and L. H. Stanker. 2000. Tail-docking influences on behavioral, immunological, and endocrine responses in dairy heifers. J. Dairy Sci. 83: 1456-1462.
Elliot, J. P., J. K. Drackley, C. G. Aldrich, and N. R. Merchen. 1997. Effects of saturation and esterification of fat sources on site and extent of digestion in steers: Ruminal fermentation and digestion of organic matter, fiber, and nitrogen. J. Anim. Sci. 75:2803-2812.
Elsasser, T. H., T. S. Rumsey, A. C. Hammond and R. Fayer. 1988. Influence of parasitism on plasma concentrations of growth hormone, somatomedin-C and somatomedin-binding proteins in calves. J. Endocrinol. 116:191-200.
Espinoza, J. L., J. A. Ramirez-Godinez, J. A. Jimenez, and A. Flores. 1995. Effects of calcium soaps of fatty acids on postpartum reproductive activity in beef cows and growth of calves. J. Anim. Sci. 73:2888-2892.
Farran, T. B., C. D. Reinhardt, D. A. Blasi, J. E. Minton, T. H. Elsasser, J. J. Higgins, and J. S. Drouillard. 2008. Source of dietary lipid may modify the immune response in stressed feeder cattle. J. Anim. Sci. 86:1382-1394.
Farrar, W. L., M. Korner, and K. A. Clouse .1991. Cytokine regulation of human immunodeficiency virus expression. Cytokine 3: 531-542.
FASS. 1999. Guide for the Care and Use of Agricultural Animals in Agricultural Research and Teaching. 1st rev. Edition. Federation of Animal Science Societies, Savoy, IL.
Finck, B. N., K. W. Kelley, R. Dantzer, and R. W. Johnson. 1998. In vivo and in vitro evidence for the involvement of tumor necrosis factor-alpha in the induction of leptin by lipopolysaccharide. Endocrinology 139:2278-2283.
Fluharty, F. L., and S. C. Loerch. 1997. Effects of concentration and source of supplemental fat and protein on performance of newly arrived feedlot steers. J. Anim. Sci. 75:2308-2316.
Garcia, M. R., M. Amstalden, C. D. Morrison, D. H. Keisler, and G. L. Williams. 2003. Age at puberty, total fat and conjugated linoleic acid content of carcass, and circulating metabolic hormones in beef heifers fed a diet high in linoleic acid beginning at four months of age. J. Anim. Sci. 81:261-268.
Gassman, K. J., D. C. Beitz, F. C. Parrish, and A. Trenkle. 2000). Effects of feeding salts of CLA to finishing steers. Abstracts. J. Anim. Sci. 78(Suppl. 1):S85.

88
Gibb, D. J., F. N. Owens, P. S. Mir, Z. Mir, M. Ivan, and T. A. McAllister. 2004. Value of sunflower seed in finishing diets of feedlot cattle. J. Anim. Sci. 82:2679-2692.
Gillis, M. H., S. K. Duckett, J. R. Sackman, C. E. Realini, D. H. Keisler, and T. D. Pringle. 2004. Effects of supplemental rumen-protected conjugated linoleic acid or linoleic acid on feedlot performance, carcass quality, and leptin concentrations in beef cattle. J. Anim. Sci. 82:851-859.
Grovum, W. L. 1981. Factors affecting the voluntary intake of food by sheep: III. The effect of intravenous infusions of gastrin, cholecystokinin and secretin on motility of the reticulo-rumen and intake. Br. J. Nutr. 45:183-201.
Grummer, R. R.1988. Influence of prilled fat and calcium salt of palm oil fatty acids on ruminal fermentation and nutrient digestibility. J. Dairy Sci. 71: 117-123.
Grummer, R. R., M. L. Hatfield, and M. R. Dentine. 1990. Our industry today: Acceptability of fat supplements in four dairy herds. J. Dairy Sci. 73:852-857.
Grummer, R. R. and D. J. Carroll. 1991. Effects of dietary fat on metabolic disorders and reproductive performance of dairy cattle. J. Anim. Sci. 69:3838-3852.
Grunfeld, C., R. Gulli, A. H. Moser, L. A. Gavin, and K. R. Feingold. 1989. Effect of tumor necrosis factor administration in vivo on lipoprotein lipase activity in various tissues of the rat. J. Lipid Res. 30: 579-585.
Gulati, S. K., M. R. Garg, and T. W. Scott. 2005. Rumen protected protein and fat produced from oilseeds and/or meals by formaldehyde treatment; their role in ruminant production and product quality: A review. Aust. J. Exp. Agric. 45:1189-1203.
Haaland, G. L., J. K. Matsushima, D. E. Johnson, and G. M. Ward (1981). Nutritive value of protected tallow product fed with hay to beef cattle as assessed by respiration calorimetry. J. Anim. Sci. 52:394-397.
Haddad, S. G. and H. M. Younis. 2004. The effect of adding ruminally protected fat in fattening diets on nutrient intake, digestibility and growth performance of Awassi lambs. Anim. Feed Sci. Tech. 113:61-69.
Hallas, J L., K. S. Gajinala, M. Maffei, S. L. Cohen, B. T. Chait, D. Rabinowitz, R. L. Lallone, S. K. Burley, and J. M. Friedman. 1995. Weight-reducing effects of the plasma protein encoded by the obese gene. Science 269:543-546.
Harfoot, C. G. 1978. Lipid metabolism in the rumen. Prog. Lipid Res. 17:21-54.
Harrison, J. H., R. L. Kincaid, J. P. McNamara, S. Waltner, K. A. Loney, R. E. Riley, and J. D. Cronrath. 1995. Effect of whole cottonseeds and calcium salts of long-chain fatty acids on performance of lactating dairy cows. J. Dairy Sci. 78:181-193.

89
Hazlewood, G. P. and R. M. Dawson. 1975. Intermolecular transacylation of phosphatidylethanolamine by a Butyrivibrio sp. Biochem. J. 150:521-525.
Heinrich, P. C., J. V. Castell, and T. Andus. 1990. Interleukin-6 and the acute phase response. Biochem. J. 265:621-636.
Hess, B. W., G. E. Moss, D. C. Rule. 2008. A decade of developments in the area of fat supplementation research with beef cattle and sheep. J. Anim. Sci. 86 (E. Suppl.):E188-E204.
Jeffery, N. M., P. Sanderson, E. J. Sherrington, E. A. Newsholme, and P. C. Calder. 1996. The ratio of n-6 to n-3 polyunsaturated fatty acids in the rat diet alters serum lipid levels and lymphocyte functions. Lipids 31:737-745.
Jenkins, T. C., and D. L. Palmquist. 1982. Effect of added fat and calcium on invitro formation of insoluble fatty acid soaps and cell wall digestibility. J. Anim. Sci. 55:957-963.
Jenkins, T. C., and B. F. Jenny. 1992. Nutrient digestion and lactation performance of dairy cows fed combinations of prilled fat and canola oil. J. Dairy Sci. 75:796-803.
Jenkins, T. C. 1993. Lipid Metabolism in the Rumen. J. Dairy Sci. 76:3851-3863.
Jerred, M. J., D. J. Carroll, D. K. Combs, and R. R. Grummer. 1990. Effects of fat supplementation and immature alfalfa to concentrate ratio on lactation performance of dairy cattle. J. Dairy Sci. 73: 2842-2854.
Johnson, R. W. 1997. Inhibition of growth by pro-inflammatory cytokines: An integrated view. J. Anim. Sci. 75:1244-1255.
Johnson, R. W. 1998. Immune and endocrine regulation of food intake in sick animals. Domest. Anim. Endocrinol. 15: 309-319.
Jolly, C. A., Y. H. Jiang, R. S. Chapkin, and D. N. McMurray. 1997. Dietary (n-3) polyunsaturated fatty acids suppress murine lymphoproliferation, interleukin-2 secretion and the formation of dicylglicerol and ceramide. J. Nutr. 127:37-43.
Juchem, S.O. (2007). Lipid digestion and metabolism in dairy cows: Effects on production, reproduction and health. Doctorate Dissertation. University of California, Davis, CA.
Juchem, S., R. Cerri, M. Villaseñor, K. N. Galvão, R. G. S. Bruno, H. M. Rutigliano, E. J. DePeters, F. T. Silvestre, W. W. Thatcher. 2008. Supplementation with Calcium Salts of Linoleic and trans-Octadecenoic Acids Improves Fertility of Lactating Dairy Cows. Reprod. Dom. Anim. 10.1111/j.1439-0531.2008.01237.x
Jurgens, M. H. 2002. Review of Nutrients and Digestion. Pages 17-24. In Animal feeding and nutrition. 9th Edition. Dubuque, IA, Kendall/Hunt Pub.

90
Kelly, M. L., J. R. Berry, D. A. Dwyer, J. M. Griinari, P. y. Chouinard, M. E. Van Amburg, and D. E. Bauman. 1998. Dietary fatty acid sources affect conjugated linoleic acid concentrations in milk from lactating dairy cows. J. Nutr. 128: 881-885.
Kepler, C. R., K. P. Hirons, J. J. McNeill, and S. B. Tove. 1966. Intermediates and products of the biohydrogenation of linoleic acid by Butyrinvibrio fibrisolvens. J. Biol. Chem. 241:1350-1354.
Khansari, D. N., A. J. Murgo, and R. E. Faith. 1990. Effects of stress on the immune system. Immunol. Today 11:170-175.
King, P. 1965. Infection in General Practice. Appl. Ther. 7:490-495.
Kinouchi, K., G. Brown, G. Pasternak, and В. Donner. 1991. Identification and characterization of receptors for tumor necrosis factor-alpha in the brain. Biochem. Biophys. Res. Commun. 18:1532-1538.
Klasing, K. C. 1988. Nutritional aspects of leukocytic cytokines. J. Nutr. 118: 1436-1446.
Klasing, K. C. and B. J. Johnstone. 1991. Monokines in growth and development. Poult. Sci. 70:1781-1789.
Klasing, K. C. and D. R. Korver. 1997. Leukocytic cytokines regulate growth rate and composition following activation of the immune system. J. Anim. Sci. 75:58-67.
Kramer, J. K., V. Fellner, M. E. R. Dugan, F. D. Sauer, M. M. Mossola, and M. P. Yurawecz. 1997. Evaluating acid and base catalysts in the methylation of milk and rumen fatty acids with special emphasis on conjugated dienes and total trans fatty acids. Lipids 32:1219-1228.
Kucuk, O., B. W. Hess, and D. C. Rule. 2004. Soybean oil supplementation of a high-concentrate diet does not affect site and extent of organic matter, starch, neutral detergent fiber, or nitrogen digestion, but influences both ruminal metabolism and intestinal flow of fatty acids in limit-fed lambs. J. Anim. Sci. 82:2985-2994.
Lefcourt, A. M. and T. H. Elsasser. 1995. Adrenal responses of Angus x Hereford cattle to the stress of weaning. J. Anim. Sci. 73: 2669-2676.
Nelson, D. L., and M. M. Cox. 2005. Storage lipids. Pages 343-346. In Lehninger principles of biochemistry. 4th Edition. New York, NY, W. H. Freeman and Company.
Lessard, M., N. Gagnon, H. V. Petit. 2003. Immune response of postpartum dairy cows fed flaxseed. J. Dairy Sci. 86: 2647-2657.
Lessard, M., N. Gagnon, D. L. Godson, and H. V. Petit. 2004. Influence of parturition and diets enriched in n-3 or n-6 polyunsaturated fatty acids on immune response of dairy cows during the transition period. J. Dairy Sci. 87:2197-2210.

91
Leupp, J. L. G. P. Lardy, S. A. Soto-Navarro, M. L. Bauer, and J. S. Caton.2006. Effects of canola seed supplementation on intake, digestion, duodenal protein supply, and microbial efficiency in steers fed forage-based diets. J. Anim. Sci. 84: 499-507.
Lloyd, K. E., C. S. Whisnant, G. W. Huntington, and J. W. Spears. 2002. Effects of calcium salts of long-chain fatty acids on growth, reproductive performance, and hormonal metabolite concentrations in pubertal beef heifers and postpartum cows. Prof. Anim. Sci. 18:66-73.
Loerch, S. C., and F. L. Fluharty. 1999. Physiological changes and digestive capabilities of newly received feedlot cattle. J. Anim. Sci. 77:1113-1119.
Lucy, M. C., C. R. Staples, F. M. Michael, W. W. Thatcher, and D. J. Bolt. 1991. Effect of feeding calcium soaps to early postpartum dairy cows on plasma prostaglandin F2 alpha, luteinizing hormone, and follicular growth. J. Dairy Sci. 74:483-489.
Lundy, III, F. P., E. Block, W. C. Bridges Jr., J. A. Bertrand, T. C. Jenkins. 2004. Ruminal biohydrogenation in Holstein cows fed soybean fatty acids as amides or calcium salts. J. Dairy Sci. 87: 1038-1046.
Makimura, S. and N. Suzuki. 1982. Quantitative determination of bovine serum haptoglobin and its elevation in some inflammatory diseases. Jpn. J. Vet. Sci. 44: 15-21.
Mattos, R., C. R. Staples, and W. W. Thatcher. 2000. Effects of dietary fatty acids on reproduction in ruminants. Rev. Reprod. 5: 38-45.
Mattos, R., C. R. Staples, A. Arteche, M. C. Wiltbank, F. J. Diaz, T. C. Jenkins, and W. W. Thatcher. 2004. The effects of feeding fish oil on uterine secretion of PGF2alpha, milk composition, and metabolic status of periparturient Holstein cows. J. Dairy Sci. 87:921-932.
Memon, R. A., C. Grunfeld, A. H. Moser, and K. R. Feingold. 1994. Fatty acid synthesis in obese insulin resistant diabetic mice. Horm. Metab. Res. 26: 85-87.
The Merck Veterinary Manual. 1997. 8th Edition. Merck and Co., Inc., Whitehouse, NJ.
Miles, E. A. and P. C. Calder. 1998. Modulation of immune function by dietary fatty acids. Proc. Nutr. Soc. 57: 277-292.
Miller, W. J., J. L. Carmon, and H. L. Dalton. 1958. Influence of high levels of plant and animal fats in calf starters on growth, feed consumption, and palatability. In Journal Paper 71. College of Agriculture Experiment Station, University of Georgia, Athens, GA.
Moore, J. A., R. S. Swingle, W. H. Hale. 1986. Effects of whole cottonseed, cottonseed oil or animal fat on digestibility of wheat straw diets by steers. J. Anim. Sci. 63:1267-1273.
Moran, T. H., P. J. Ameglio, G. J. Schwartz, and P. R. McHugh. 1992. Blockade of type A, not type B, CCK receptors attenuates satiety actions of exogenous and endogenous CCK. Am. J. Physiol. 262: R46-R50.

92
NASS. The National Agriculture Statistical Service. Livestock National Statistics. 1996.
Ngidi, M. E., S. C. Loerch, F. L. Fluharty, D. L. Palmquist. 1990. Effects of calcium soaps of long-chain fatty acids on feedlot performance, carcass characteristics and ruminal metabolism of steers. J. Anim. Sci. 68:2555-2565.
Oldick, B. S., C. R. Staples, W. W. Thatcher, and P. Gyawu. 1997. Abomasal infusion of glucose and fat-effect on digestion, production, and ovarian and uterine functions of cows. J. Dairy Sci. 80:1315-1328.
Palmquist, D. L. and T. C. Jenkins.1980. Fat in lactation rations: Review. J. Dairy Sci. 63:1-14.
Palmquist, D. L. and E. A. Moser. 1981. Dietary fat effects on blood insulin, glucose utilization, and milk protein content of lactating cows. J. Dairy Sci. 64:1664-1670.
Palmiquist, D. L. 1994. The role of dietary fats in efficiency of ruminants. J. Nutr. 124(Suppl.):S1377-S1382.
Pariza, M. W., Y. Park, M. E. Cook. 2000. Mechanisms of action of conjugated linoleic acid: evidence and speculation. Proc. Soc. Exp. Biol. Med. 223:8-13.
Pariza, M. W., Y. Park, M. E. Cook. 2001. The biologically active isomers of conjugated linoleic acid. Prog. Lipid. Res. 40:283-298.
Park, Y., K. J. Albright, J. M. Storkson. M. E. Cook., and M. W. Pariza. 1997. Effect of conjugated linoleic acid on body composition in mice. Lipids 32:853-858.
Pavan, E., S. K. Duckett, and J. G. Andrae. 2007. Corn oil supplementation to steers grazing endophyte-free tall fescue. I. Effects on in vivo digestibility, performance, and carcass traits. J. Anim. Sci. 85:1330-1339.
Peck, M. D. 1994. Interactions of lipids with immune function II: Experimental and clinical studies of lipids and immunity. J. Nutr. Biochem. 5:514-521.
Pepys, M. B. and M. L. Baltz. 1983. Acute phase proteins with special reference to C-reactive protein and related proteins (pentaxins) and serum amyloid A protein. Adv. Immunol. 34:141-212.
Petersen, H. H., J. P. Nielsen, and P. M. Heegard. 2004. Application of acute-phase protein measurements in veterinary clinical chemistry. Vet. Res. 35:163-187.
Petit, H. V. 2002. Digestion, milk production, milk composition, and blood composition of dairy cows fed whole flaxseed. J. Dairy Sci. 85:1482-1490.
Pomposelli, J. J., E. A. Mascioli, B. R. Bistrian, S. M. Lopes, and G. L. Blackburn.1989. Attenuation of the febrile response in guinea pigs by fish oil enriched diets. J. Parenter. Enteral Nutr. 13:136-140.

93
Purasiri, P., A. Murray, S. Richardson, S. D. Heys, D. Horrobin, and O. Eremin. 1994. Modulation of cytokine production in vivo by dietary essential fatty acids in patients with colorectal cancer. Clin. Sci. 87:711-717.
Qiu, X., J. D. Arthington, D. G. Riley, C. C. Chase Jr., W. A. Phillips, S. W. Coleman, and T. A. Olson. 2007. Genetic effects on acute phase protein response to the stresses of weaning and transportation in beef calves. J. Anim. Sci. 85: 2367-2374.
Reidelberger, R. D. 1994. Cholecystokinin and control of food intake. J. Nutr. 124(Suppl. 8):S1327-S1333.
Reidelberger, R. D., G. Varga, and R. M. Liehr. 1994. Cholecystokinin suppresses food intake by a nonendocrine mechanism in rats. Am. J. Physiol. 267:R901-R908.
Richards, C., J. Gauldie, and H. Baumann. 1991. Cytokine control of acute phase protein expression. Eur. Cytokine Netw. 2: 89-98.
Santos, J. E. P., T. R. Bilby, W. W. Thatcher, C. R. Staples, F. T. Silvestre. 2008. Long chain fatty acids of diet as factors influencing reproduction in cattle. Reprod. Dom. Anim. 43(Suppl. 2):23-30.
SAS Software Statistics. Version 8.2 Edition. 2001. SAS inst. Inc., Cary, NC.
Schauff, D. J. and J. H. Clark. 1989. Effects of prilled fatty acids and calcium salts of fatty acids on rumen fermentation, nutrient digestibilities, milk production, and milk composition. J. Dairy Sci. 72: 917-927.
Schauff, D. J. and J. H. Clark. 1992. Effects of feeding diets containing calcium salts of long-chain fatty acids to lactating dairy cows. J. Dairy Sci. 75:2990-3002.
Schmitz, G. and J. Ecker. 2008. The opposing effects of n-3 and n-6 fatty acids. Prog. Lipid Res. 47:147-155.
Spallholz, J. E., L. M. Boylan, and J. A. Driskell. 1999. Lipids. Pages 23-40. In Nutrition : Chemistry and Biology. 2nd Edition. Boca Raton, FL, CRC Press.
Sprecher, H. 1981. Biochemistry of essential fatty acids. Prog. Lipid Res. 20:13-22.
Selye, H. 1976. Stress in Health and Disease. Butterworth Inc., Boston, MA.
Silvestre, F. T., T. S. M. Carvalho, C. Crowford, N. Francisco, J. E. P. Santos, S. C. Kim, T. Jenkins, C. R. Staples, and W. W. Thatcher. 2009. Feeding n-6 and n-3 fatty acids to dairy cows: Effects on immunity, fertility and lactation. Proc. FL Rum. Nutr. Symp. 20:75-90.
Simas, J. M., J. T. Huber, Z. Wu, K. H. Chen, S. C. Chan, C. B. Theurer, and R. S. Swingle. 1995. Influence of steam-flaked sorghum grain and supplemental fat on performance of dairy cows in early lactation. J. Dairy Sci. 78: 1526-1533.

94
Sklan, D., U. Moallem, Y. Folman. 1991. Effect of feeding calcium soaps of fatty acids on production and reproductive responses in high producing lactating cows. J. Dairy Sci. 74:510-517.
Sonti, G., S. E. Ilyin, and C. R. Plata-Salaman. 1996. Anorexia induced by cytokine interactions at pathophysiological concentrations. Am. J. Physiol. 270:R1394-R1402.
Sprecher, H. (1981) Biochemistry of essential fatty acids. Prog. Lipid Res. 20:13-22.
Spurlock, M. E. 1997. Regulation of metabolism and growth during immune challenge: an overview of cytokine function. J. Anim. Sci. 75:1773-1783.
Staples, C. R., J. M. Burke, and W. W. Thatcher. 1998. Influence of supplemental fats on reproductive tissues and performance of lactating cows. J. Dairy Sci. 81: 856-871.
Sukhija, P. S., and D. L. Palmquist. 1990. Dissociation of calcium soaps of long-chain fatty acids in rumen fluid. J. Dairy Sci. 73: 1784-1787.
Thatcher, W. W., M. Binelli, J. M. Burke, C. R. Staples, J. D. Ambrose, and S. Coelho. 1995. Antiluteolytic signals between conceptus and endometrium. Theriogenology 47:131-140. USDA. The United States Department of Agriculture; the Consensus of Agriculture Statistics. 2002.
USDA – NASS. The United States Department of Agriculture; National Agriculture Statistical Service. Florida Agricultural Statistics Districts. 2008.
Vendramini, J. M. B., L. E. Sollenberger, J. C. B. Dubeux Jr., S. M. Interrante, R. L. Stewart Jr., and J. D. Arthington. 2006. Concentrate supplementation effects on forage characteristics and performance of early weaned calves grazing rye-ryegrass pastures. Crop Sci. 46:1595-1600.
Williams, P. P. 1993. Immunomodulating effects of intestinal absorbed maternal colostral leukocytes by neonatal pigs. Can. J. Vet. Res. 57:1-8.
Wu, Z., and D. L. Palmquist. 1991. Synthesis and biohydrogenation of fatty acids by ruminal microorganisms in vitro. J. Dairy Sci. 74:3035-3046.
Wu, Z., O. A. Ohajuruka, and D. L. Palmquist. 1991. Ruminal synthesis, biohydrogenation, and digestibility of fatty acids by dairy cows. J. Dairy Sci. 74:3025-3034.
Yaqoob, P. and P. C. Calder. 1993. The effects of fatty acids on lymphocyte functions. Int. J. Biochem. 25: 1705-1714.
Yaqoob, P. 2002. Monounsaturated fatty acids and immune function. Eur. J. Clin. Nutr. 56(Suppl. 3): S9-S13.
Yaqoob, P. 2004. Fatty acids and the immune system: From basic science to clinical applications. Proc. Nutr. Soc. 63:89-104.

95
Yaqoob, P. and P. C. Calder. 2007. Fatty acids and immune function: new insights into mechanisms. Br. J. Nutr. 98(Suppl.):S41-S45.
Zinn, R. A. 1988. Comparative feeding value of supplemental fat in finishing diets for feedlot steers supplemented with and without monensin. J. Anim. Sci. 66:213-227.
Zinn, R. A. 1989. Influence of level and source of dietary fat on its comparative feeding value in finishing diets for feedlot steers: Feedlot cattle growth and performance. J. Anim. Sci. 67:1038-1049

96
BIOGRAPHICAL SKETCH
Davi Brito de Araujo was born in Mogi Mirim, a small town located in the Citrus Belt of
the State of São Paulo/Brazil in 1981. He is the oldest son of Eduardo Netto de Araujo and
Arlete Aparecida Brito de Araujo; and brother of Marília Brito de Araujo. He is also the oldest
grandson of Eivany Julianetti de Brito, who owns a cattle ranch in Aquidauana / MS, and an
orange grove and feedlot ranch in Mogi Mirim /SP, where he spent all his childhood and when
his background in cattle began.
Davi started the School of Veterinary Medicine at the São Paulo State University
(UNESP) - Botucatu / SP, in 2000. The UNESP - Botucatu Vet School has been ranked among
the Top 2 programs in the country during the last 15 years. During the five years of the vet
school program, Davi participated at the Student Enterprise of Beef and Dairy Production
(CONAPEC Jr.) with his first advisor Dr. José Luiz Moraes Vasconcelos, who offered the
opportunity for Davi to study as an intern in the USA during his last two semesters of his Vet
School program.
In January 2005, Davi started an internship at UC Davis – VMTRC (Tulare, CA) advised
by Dr. José Eduardo Portela Santos, where he had the chance to work with nutrition,
reproduction, and health of dairy cattle. On July 2005, he moved to Ona, Florida, where he
started another internship, advised by Dr. John Arthington at the Range Cattle REC.
Davi received his DVM degree in December of 2005, and came back to the RCREC in
March of 2006 to work on another internship; as a result he started a MS degree in the summer
of 2007. In 2008, Davi started a MAB, which is combined with his first MS, in the Department
of Food Resource and Economics, advised by Dr. Allen Wysocki.

97
At Ona, Davi have worked with Dr. Arthington on evaluation of strategies to improve
performance and health of immune-challenged beef cattle. Fatty acids and trace minerals
supplementation to calves during the receiving period of feedlot are the highlights of his
research. During his four years in the US, Davi has already published with other authors, three
manuscripts in refereed journals and 16 abstracts.