Embed Size (px)
Citation preview
LIBRARY - A:R RESCURC:b Sv.-i..,<1..1
EFFECTS OF OZONE INHALATION DURING
EXERCISE ON SELECTED HEART
DISEASE PATIENTS
H. Robert Superko, M.D. William C. Adams, Ph.D. Patricia A. Webb, B.A.
Human Performance Laboratory Physical Education Department University of California Davis, CA 95616
577


l.
1-'\bstract
Heart and lung patients are considered at greater risk during episodes of
significant oxidant pollution and, although there are no quantitative laboratory
data avai1ab1e, are advised to curtail physical activity. In the present inves
tigation, six male volunteers, ages 46-64 years, with clinically documented
coronary artery disease and a well defined symptomatic angina pectoris threshold
on physical exertion, served as subjects. Each patient was exposed on three
occasions for 40 minutes to either filtered air or to ozone at concentrations of 0.20 or 0.30 parts per million, while walking on a treadmill at workloads simu
lating their regularly prescribed symptom limited exercise training regimen.
Standard pulmonary function tests and periodic observations of exercise ventila
tion, respiratory metabolism, electrocardiographic changes, hemodynamic
response, and clinical signs and symptoms were noted. Analysis of variance
revealed that none of the patients' physiologic responses to ozone exposure were
statistically significant. Furthermore, neither onset of angina pain or
ischemic changes were related to ozone exposure in a dose dependent fashion.
Hence, the patients not only failed to exhibit any unexpected cardiovascular
strain while exposed to ozone, but also evidenced no significant pulmonary func
tion impairment or exercise ventilatory pattern alteration as has been observed
in clinically normal subjects exercising at similar ozone concentration levels.
This apparent incongruity may be due to the fact that ozone toxicity is more
c1osely related to the total amount of ozone inhaled (that is, as a function of
pulmonary ventilation volume and exposure time, as well as ozone concentration).
Hence, the angina patients' symptom limited exercise tolerance resulted in a
lower total amount of ozone inhaled (termed effective dose) than that observed
to effect ozone toxicity in clinically normal subjects, who exercised at greater
intensities and for longer durations. It was concluded that the angina patients
appear to be no more susceptible to ozone.toxicity effects than are clinically
normal subjects at the effective doses imposed. However, had the patients
exercised longer, they might well have evidenced pulmonary function impairment
and/or cardiovascular strain, as would other heart disease patients with greater
work capacity while exercising at their higher exercise training intensities for
periods approximately one hour. Hence, caution is advised in generalizing our
observations to other patient groups and conditions.
2. Acknowledgements. The expert technical assistance of Mr. Richard Fadling, Electronics Technician, is gratefully acknowledged. We are also appreciative
of the able laboratory assistance afforded by Mr. Mike Catlin, Ms. Debbie
Chippendale, Messrs. Dave Condon and Mark Freitas, Ms. Susan Lauritzen, and
Messrs. Pierre Rouzier, Ed Schelegle, Perry Seltz, and Jim Shaffrath. Sincere
appreciation is extended to the subjects for their willing contribution of time
and effart.
This report was submitted in fulfillment of ARB Contract AS-120-31, "Ozone
Effects on Heart and Lung Patients," by the Regents of the University of Cali
fornia, Davis, under the partial sponsorship of the California Air Resources
Board. Work was accomplished as of 8 December 1980.
Disclaimer
The statements and conclusions in this report are those of the contractor
and not necessarily those of the California Air Resources Board. The mention
of commercial products, their source or their use in connection with material
reported herein is not to be construed as either an actual or implied endorse
ment of such products.
3.
TABLE OF CONTENTS
Abstract . . . . Acknowledgements and Disclaimer List of Figures
List of Tables Summary and Conclusions
Recommendations Body of Report
a. Introduction . . . . b. Methodology
c. Results . . . d. Discussion
References Glossary of Terms, Abbreviations, and Symbols
Append i X • • • • • • • • • • • • • • • • • • •
Page 1
2
4
5
6
7
8
8
14 25
29
45 49
50

4.
LIST OF FIGURES
Fig. No. Title Page
1 Schematic Diagram of the o3 Exposure System Employed. 22
2 Comparison of Percent Change in FEV1_ as a Function of o0 3 Effective Dose for the Patients (open circles), Middle-Age
Normals (darkened circles), and the Young Adult Males (regression line). 34
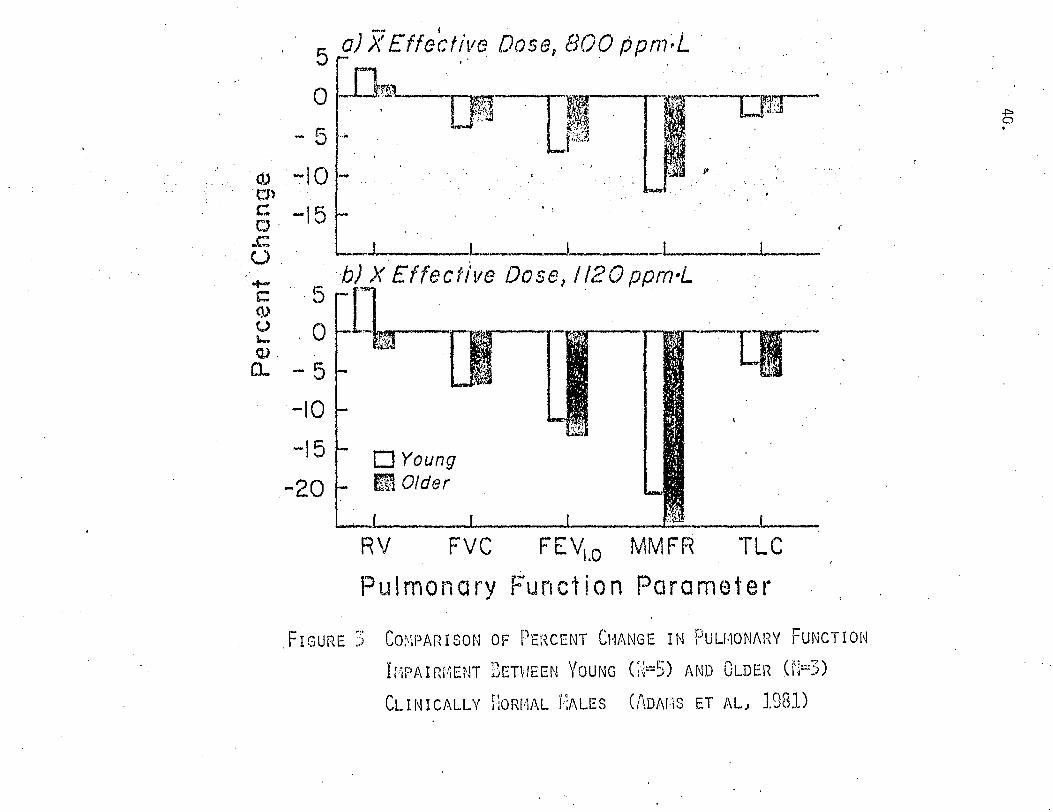
. 3 Comparison of Percent Change in Pulmonary Function Impair-
ment Between Young (N=5) and Older (N=3) Clinically Normal
Males (Adams et al, 1981). 40
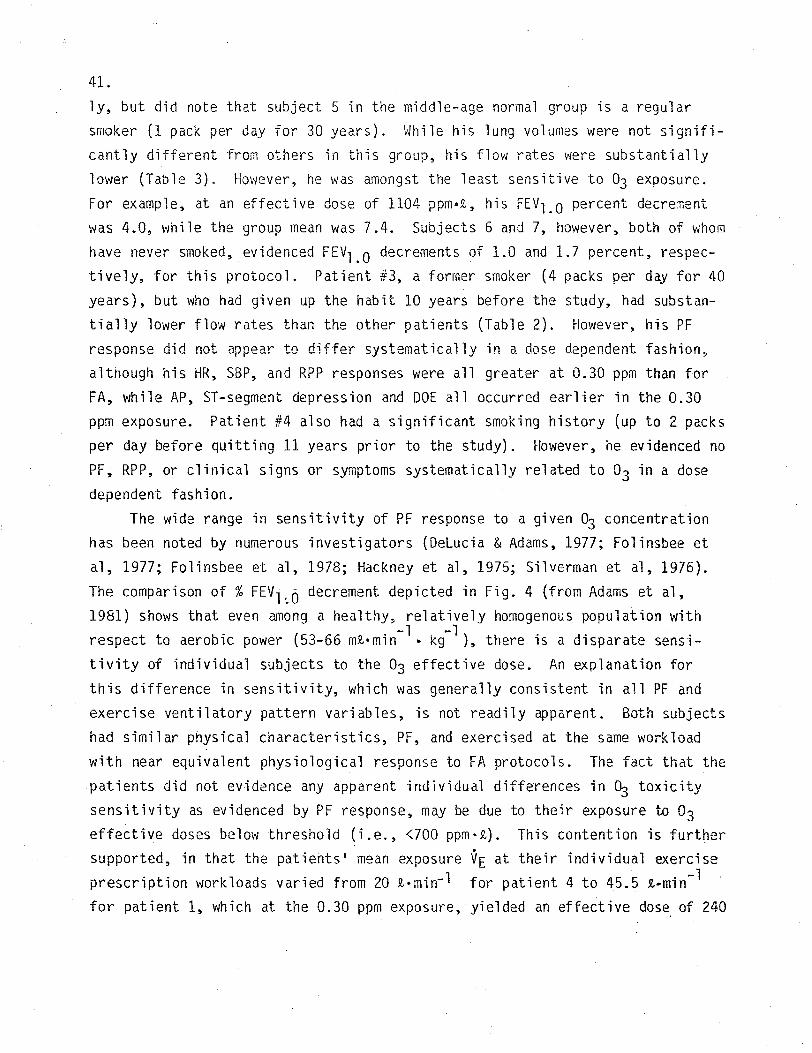
4. Comparison of Group Mean Percent Change in FEVi.e (solid line) to that for the Least Sensitive (upper dashed line)
and the Most Sensitive Subject (lower dashed line) (Adams
et al, 1981). 42
5.
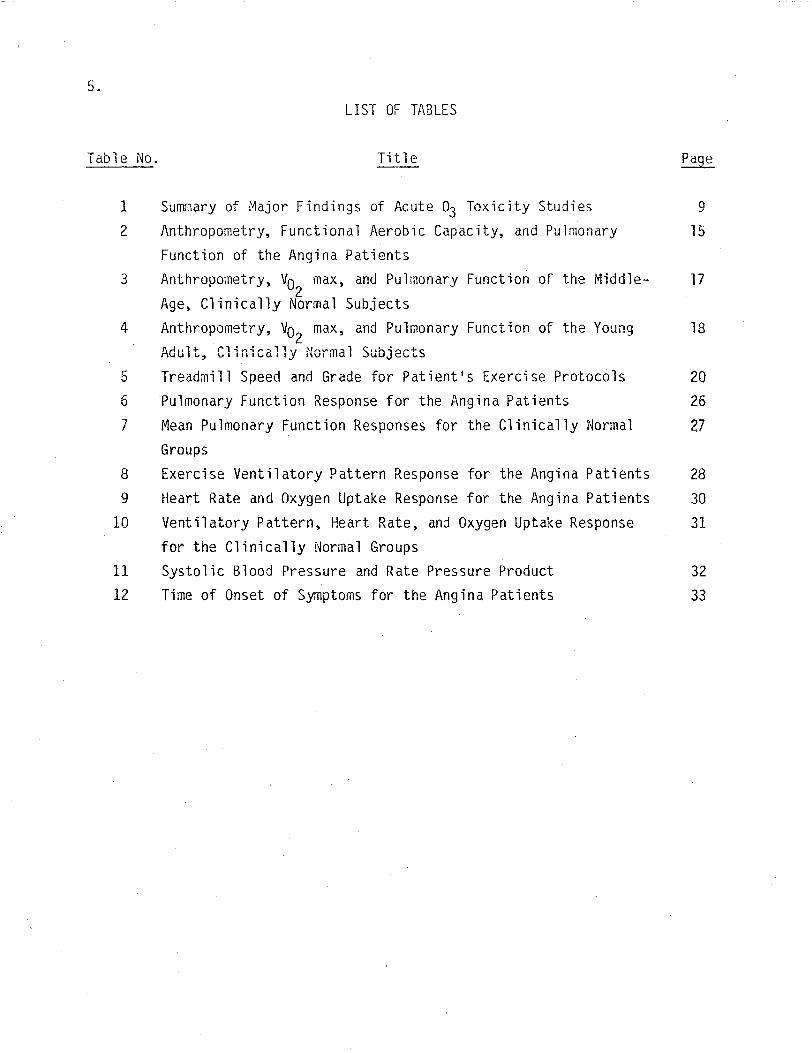
LIST OF TABLES
Table No. Title Page
1 Summary of Major Findings of Acute o3 Toxicity Studies 9 2 Anthropometry, Functiona1 Aerobic Capacity, and Pulmonary 15
Function of the Angina Patients 3 Anthropometry, max, and Pu1monary Function of the Middle- 17
2 v0
Age, Clinically Norma1 Subjects 4 Anthropometry, Vo max, and Pulmonary Function of the Young 18
2 Adult, Clinically Normal Subjects
5 Treadmill Speed and Grade for Patient's Exercise Protocols 20
Groups
for the Clinically Normal Groups
6 Pulmonary Function Response for the Angina Patients 26
7 Mean Pulmonary Function Responses for the Clinically Normal 27
8 Exercise Ventilatory Pattern Response for the Angina Patients 28
9 Heart Rate and Oxygen Uptake Response for the Angina Patients 30
10 Ventilatory Pattern, Heart Rate, and Oxygen Uptake Response 31
11 Systolic Blood Pressure and Rate Pressure Product 32
12 Time of Onset of Symptoms for the Angina Patients 33

6.
SUMMARY AND CONCLUSIONS
The enhanced ozone toxicity effected by exercising at ozone concentrations
in the range of oxidant smog alert levels has been documented utilizing clini
cally normal young adult males. Individuals with heart disease are thought to
be more susceptible to ozone during physical exertion on the basis of reduced
functional reserve or on possible potentiation of disease symptoms, although no
quantitative data is currently available. Hence, the present study was designed
to determine the difference in ozone toxicity, if any, in a group of angina pa
tients undergoing prescribed exercise training, compared to that of clinically
normal subjects. The patients 1 response during 40 minute exposures to filtered
air or to ozone at concentrations of 0.20 and 0.30 parts per million, while en
gaged in their normal exercise training regimen, was ascertained and compared to
that of two clinically normal groups. Standard pulmonary function tests and
periodic observations of exercise ventilation, respiratory metabolism, electro
cardiographic changes, hemodynamic response, and cl i nica 1 signs and symptoms
were noted. None of the patients• physiologic responses to ozone exposure were
statistically significant. Furthermore, neither onset of angina pain or ische
mic changes were related to ozone exposure in a dose dependent fashion. Hence,
the patients not only failed to exhibit any unexpected cardiovascular strain
while exposed to ozone, but also evidenced no physiologic impairment previously
observed in clinically normal subjects exercising at similar ozone concentration
levels. This apparent incongruity may be due to the fact that ozone toxicity is
more closely related to the total amount of ozone inhaled (that is, as a func
tion of pulmonary ventilation volume and exposure time, as well as ozone concen
tration). Hence, the angina patients 1 symptom limited exercise tolerance
resulted in a lower total amount of ozone inhaled (termed effective dose) than
that observed to effect ozone toxicity in our clinically normal subjects when
they exercised at greater intensities and for longer durations. It was con
cluded that: (1) Angina patients are apparently no more susceptible to ozone
toxicity effects than are clinically normal subjects at effective doses found to
be below threshold in the latter group; (2) If the angina patients 1 exercise
intensity had been reduced slightly and their exposure increased substantially,
the effective dose would be increased above the normals 1 threshold level; (3)
Heart disease patients with high functional capacity can reach above threshold
effective doses in less than one hour when exercising at their prescribed·train
ing intensity; (4) Thus, caution is advised in generalizing our observations to
other patient groups and conditions.
7.
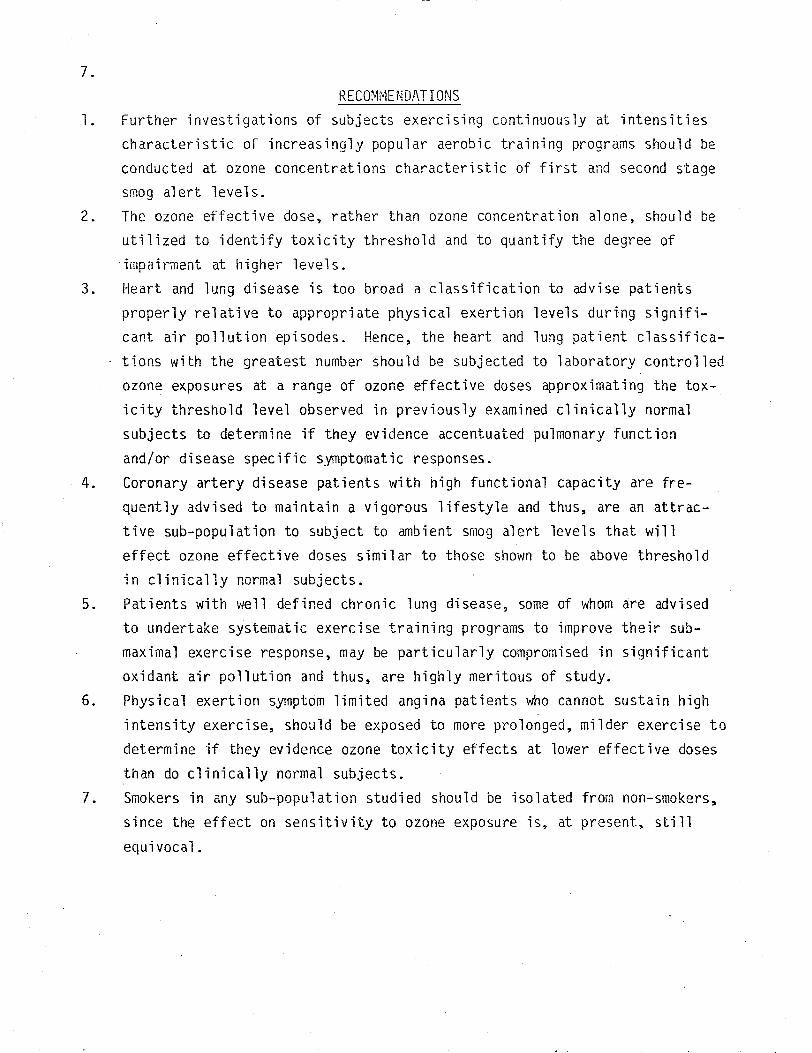
RECOMMENDATIONS
l. Further investigations of subjects exercising continuously at intensities
characteristic of increasingly popular aerobic training programs should be
conducted at ozone concentrations characteristic of first and second stage
smog alert levels.
2. The ozone effective dose, rather than ozone concentration alone, should be
utilized to identify toxicity threshold and to quantify the degree of
impairment at higher levels.
3. Heart and lung disease is too broad a classification to advise patients
properly relative to appropriate physical exertion levels during signifi
cant air pollution episodes. Hence, the heart and lung patient classifica
tions with the greatest number should be subjected to laboratory controlled
ozone exposures at a range of ozone effective doses approximating the tox
icity threshold level observed in previously examined clinically normal
subjects to determine if they evidence accentuated pulmonary function
and/or disease specific symptomatic responses.
4. Coronary artery disease patients with high functional capacity are fre
quently advised to maintain a vigorous lifestyle and thus, are an attrac
tive sub-population to subject to ambient smog alert levels that will
effect ozone effective doses similar to those shown to be above threshold in clinically normal subjects.
5. Patients with well defined chronic lung disease, some of whom are advised
to undertake systematic exercise training programs to improve their sub
maximal exercise response, may be particularly compromised in significant
oxidant air pollution and thus, are highly meritous of study.
6. Physical exertion symptom limited angina patients who cannot sustain high
intensity exercise, should be exposed to more prolonged, milder exercise to
determine if they evidence ozone toxicity effects at lower effective doses
than do clinically normal subjects.
7. Smokers in any sub-population studied should be isolated from non-smokers,
since the effect on sensitivity to ozone exposure is, at present, still
equivocal.
8.
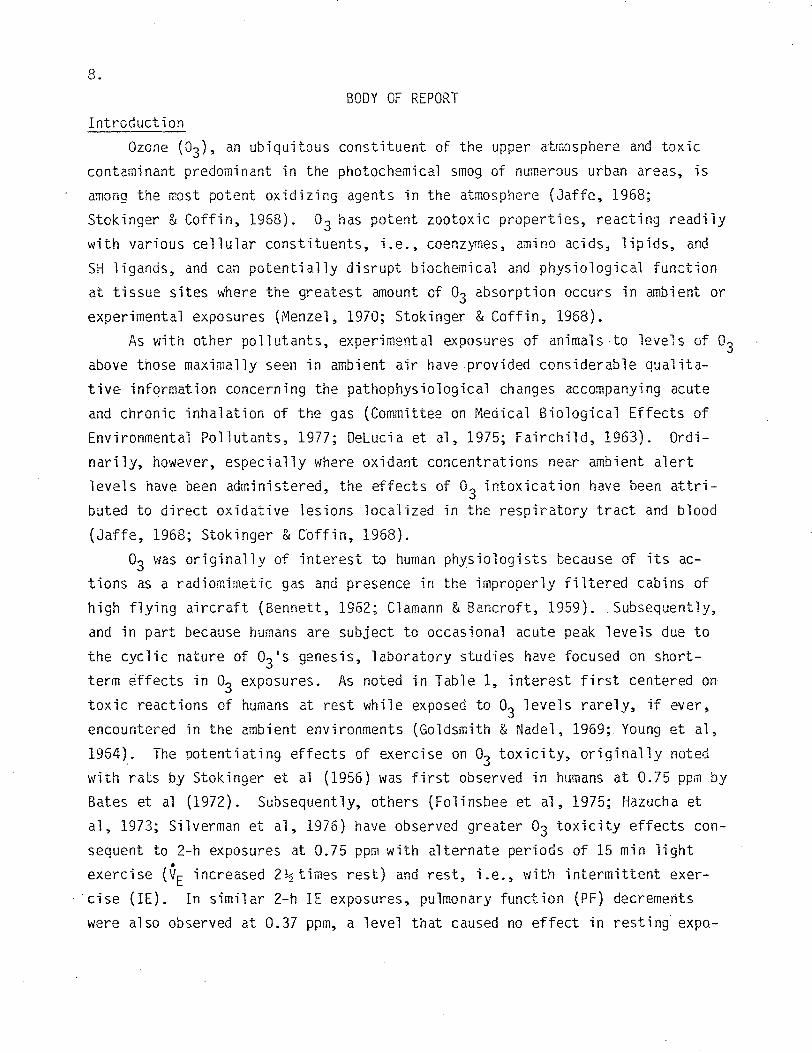
BODY OF REPORT
Introduction
Ozone (03), an ubiquitous constituent of the upper atmosphere and toxic
contaminant predominant in the photochemical smog of numerous urban areas, is
among the ~ost potent oxidizing agents in the atmosphere (Jaffe, 1968;
Stokinger &Coffin, 1968). o3 has potent zootoxic properties, reacting readily
with various cellular constituents, i.e., coenzymes, amino acids, lipids, and
SH ligands, and can potentially disrupt biochemical and physiological function
at tissue sites where the greatest amount of o3 absorption occurs in ambient or
experimental exposures (Menzel, 1970; Stokinger &Coffin, 1968).
As with other pollutants, experimental exposures of animals to levels of o3 above those maximally seen in ambient air have provided considerable qualita
tive information concerning the pathophysiological changes accompanying acute
and chronic inhalation of the gas (Committee on Medical Biological Effects of
Environmental Pollutants, 1977; Delucia et al, 1975; Fairchild, 1963). Ordi
narily, however, especially where oxidant concentrations near ambient alert
levels have been administered, the effects of o3 intoxication have been attri
buted to direct oxidative lesions localized in the respiratory tract and blood
(Jaffe, 1968; Stokinger &Cbffin, 1968).
o3 was originally of interest to human physiologists because of its ac
tions as a radiomimetic gas and presence in the improperly filtered cabins of
high flying aircraft (Bennett, 1962; Clamann &Bancroft, 1959). Subsequently,
and in part because humans are subject to occasional acute peak levels due to
the cyclic nature of o3•s genesis, laboratory studies have focused on short
term effects in o3 exposures. As noted in Table 1, interest first centered on
toxic reactions of humans at rest while exposed to o3 levels rarely, if ever,
encountered in the ambient environments (Goldsmith & Nadel, 1969; Young et al,
1964). The potentiating effects of exercise on o3 toxicity, originally noted
with rats by Stokinger et al (1956) was first observed in humans at 0.75 ppm by
Bates et al (1972). Subsequently, others (Folinsbee et al, 1975; Hazucha et
al, 1973; Silverman et al, 1976) have observed greater o3 toxicity effects con
sequent to 2-h exposures at 0.75 ppm with alternate periods of 15 min light •exercise (VE increased 2½times rest) and rest, i.e., with intermittent exer-
·cise (IE). In similar 2-h IE exposures, pulmonary function (PF) decrements
were also observed at 0.37 ppm, a level that caused no effect in resting· expo-
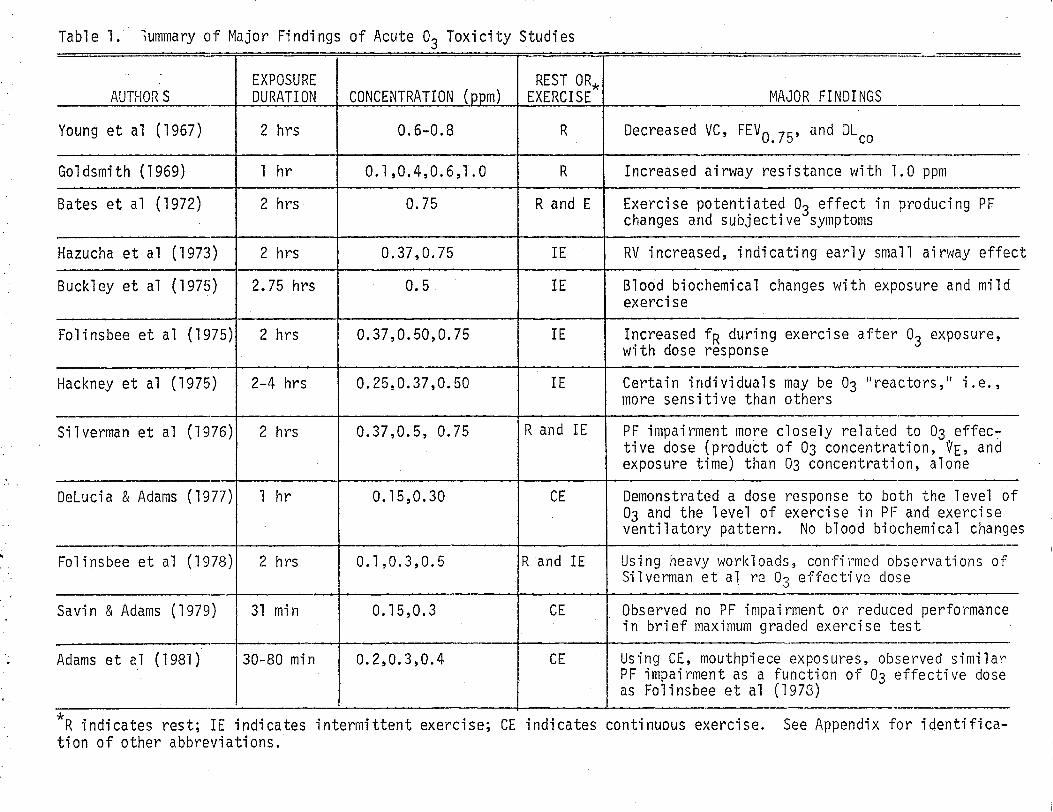
Table 1. 1ummary of Major Findings of Acute o3 Toxicity Studies
EXPOSURE AUTHORS DURATION
Young et al (1967) 2 hrs
Go 1 dsmith (1969) l hr
Bates et al (1972) 2 hrs
Hazucha et al (1973) 2 hrs
Buckley et al (1975) 2.75 hrs
Folinsbee et al (1975) 2 hrs
Hackney et al (1975) 2-4 hrs
Silverman et al (1976) 2 hrs
Delucia &Adams (1977) l hr
Folinsbee et al (1978) 2 hrs
Savin &Adams (1979) 31 min
Adams et al (1981) 30-80 min
CONCENTRATION (ppm)
0.6-0.8
0.1,0.4,0.6,l.O
0.75
0.37,0.75
0.5
0.37,0.50,0.75
0.25,0.37,0.50
0.37,0.5, 0.75
0. 15,0.30
0.1,0.3,0.5
0. 15,0.3
0.2,0.3,0.4
REST OR* EXERCISE MAJOR FINDINGS
R Decreased VC, FEV 0. 75 , and Oleo
R Increased airway resistance with 1.0 ppm
R and E Exercise potentiated o3 effect in producing PF changes and subjective symptoms
IE RV increased, indicating early small airway effec
IE Blood biochemical changes with exposure and mild exercise
IE Increased fR during exercise after o3 exposure, with dose response
11IE Certain individuals may be 03 reactors," i.e., more sensitive than others
Rand IE PF impairment more closely related to 03 effec~ tive dose (product of 03 concentration, ~E, and exposure time) than 03 concentration, alone
CE Demonstrated a dose response to both the level of 03 and the level of exercise in PF and exercise ventilatory pattern. No blood biochemical change
Rand IE Using heavy workloads, confirmed observations of Silverman et al re o3 effective dose
CE Observed no PF impairment or reduced performancein brief maximum graded exercise test
CE Using CE, mouthpiece exposures, observed similar PF impairment as a function of 03 effective dose as Folinsbee et al (1978)
t
s
*R indicates rest; IE indicates intermittent exercise; CE indicates continuous exercise. See Appendix for identification of other abbreviations.
10.
sures (Hackney et al, 1975; Hazucha et al, 1973; Silverman et al, 1976). More
recently, Delucia and Adams (1977) observed PF decrements and exercise ventila
tory pattern alterations during continuous, heavy exercise (~E increased 6
times rest) for 1 n while exposed to 0.30 ppm o3, and at 0.15 ppm in two parti
cularly sensitive subjects. The latter observations are of practical signifi
cance, in tl1at many occupational or recreationa1 pursuits entail sustained
periods of moderate to heavy metabolic demand, thus increasing VE and the total
amount of o3 inhaled in a given time at a particular ambient concentration.
They are also of significance with respect to the existence of toxicity effects
consequent to rather brief exposure at o3 levels more routinely observed. For
example, while peak 1 h concentrations exceeding 0.50 ppm have been reco.rded at
certain locations in the Los Angeles Basin (Hackney et al, 1975; Mosher et al,
1970), the average daily maximum 1 h concentration during September ranges from
0.26 ppm in inland areas to less than 0.10 ppm at monitoring stations adjacent
to the Pacific Ocean (Air Quality and Meteorology, 1979).
Hackney et al (1975) were apparently the first to advance a dose-response
relationship with respect to an enhanced PF decrement as a function of o3con
centration. Hov,ever, Silverman et al (1976) emphasized that PF impairment was
more closely related (as a second order polynomial function) to the effective
dose of o3, as calculated from the product of concentration, exposure time and
VE. Recently, Fo1 i nsbee et al (1978) extended the effective dose concept in
evaluating both rest and IE protocols of 2 h duration in filtered air (FA) and
at three levels of o3 concentration (0.10, 0.30, and 0.50 ppm). Further, their exercise workloads varied in intensity, entailing approximately 3, 5 and 7
times resting OE•. Again, PF declined as a second order polynomial function of
the effective dose of o3. Further, we (Adams et ai, 1981) have recently
observed similar PF impairment as a function of o3 effective dose in young
adult male subjects exercising continuously for 30-80 min in FA and at 0.2, 0.3
and 0.4 ppm o3.
One recurring question of significance is the validity of comparison of o3 toxicity consequent to chamber exposures at rest or with light IE to the CE
mode with obligatory oral inhalation employed in our 1aboratory. Recently we
(Adams et al, 1981) observed that the percent FEV 1_0 decrement as a function of
o3 effective dose, at least within the range of Oto 1,200 ppm-j, identifies
the degree of o3 toxicity as approximately equal for CE and IE exposures~ It

11.
also suggests that the obligatory shift from nasal breathing at rest, in light
IE and recovery, to primarily oral breathing at heavier workloads noted by
Folinsbee et al (1978), does not substantially affect o3 toxicity in humans_, within VE ranging from 10 to 70..9...•min '. Previous work 'tlith anaesthesized dogs
(Yokoyama & Frank, 1972) indicates that o3 uptake is higher when administered
orally tnan nasally, especially at flow rates typical of resting VE (i.e., the
nasal passages are less effective o3 "scrubbers" at higher flow rates typical
of exercise). Thus, it appears that the mouthpiece obligatory oral inhalation
method used in combination with the CE mode can be used interchangeably with
the IE chamber method in the study of o3 toxicity, although definitive compari
son using the same subjects exposed in the same laboratory remains to be done.
Although the o3 effective dose predicts more accurately the degree of PF
impairment than does o3 concentration alone, the latter has consistently been
shown by multiple regression analysis to be the most influential of the three
effective dose components (Adams et al, 1981; Folinsbee et al, 1978; Silverman
et al, 1976). That is, as first noted by Silverman et al (1976), for any given
effective dose, exposure to a high concentration for a short period has rrore
effect than a longer exposure at a lower concentration. This would imply that
there is not only a threshold effective dose (as denoted by the consistently
observed second order relationship to PF impairment), but also a threshold
effective concentration. The latter is of significance since photochemical air
pollution occurs widely and because o3 concentration has been correlated with
hospital admissions for respiratory disease (Paprosk i & Walker, 1974). Governmental agencies have attempted to set appropriate standards of air quality, but
unfortunately, there are only limited data relating a given o3 concentration
for short-term exposures to PF decrement during exercise when the total amount
of inhaled in a given time is dependent both on the ambient concentrationo3 and the increased ventilatory demand characteristic of enhanced metabolic
demand. Recently, however, significant advances have been made, in that
Folinsbee et al (1978) observed that the o3 concentration at which no PF
impairment occurred, varied according to the level of activity. That is, in
2-h exposures, when subjects remained at rest, a PF impairment effect occurred
only at 0.50 ppm. At the highest IE workload, no PF effect was observed at
0.10 ppm, while at 0.30 ppm, a moderate IE workload elicited an effect.
Working independently on a similar attempt to identify a threshold o3
12. concentration using a continuous exercise mode (Adams et al, 1981) we observed
that for eight trained adult males, ages 21-45, there was no significant PF
decrement consequent to 75 min exposure at 0.20 ppm o3 when exercise\ was
maintained at 63 liters per min. On the other hand, after 60 min exercise at
the same workload ~vhile exposed to 0.30 ppm, there was significant impairment
in several PF parameters. Furthermore, even greater toxic effects were noted
after only 30 min exposure to 0.40. Hence, it would appear that the threshold
03 concentration for subjects exercising at moderate intensity during short
term exposures(< 2-h), lies between 0.20 and 0.30 ppm, although Delucia & Adams (1977) observed PF impairment in two particularly sensitive subjects
exposed to 0.15 ppm while exercising continuously for 1-h at a mean VE of 65
J/mi n.
Folinsbee et al (1978) have astutely noted that present data identifying
the degree of PF impairment with 03 exposure have been largely limited to young
adult male, non-smokers .. Thus, there would appear to be a clear need for
examining the o3 toxicity effect amongst other, presumably more sensitive sub
populations, e.g., females, children, elderly subjects, and patients with car
diopulmonary dysfunction. The current CARB advisory chart for~ stipulates
that at concentrations between 0.10 and 0.20 ppm, 11 persons with existing heart
or respiratory ailments should reduce physical exertion and outdoor activity. 11
Furtner, at ambient o3 concentrations between 0.20 and 0.35 ppm, it is advised
that the "elderly and persons with existing heart or lung disease should stay
indoors and reduce physical activity, 11 although these 11cautionary statements"
are not based on any known objective data. Since an estimated 29 million Amer
icans have cardiovascular diseases (Marx &Kolata, 1978), elucidating the de
gree and type of impairment caused during physical activity in photochemical
smog is of vital concern to the public and the medical community. This has
especial significance, in that therapeutic physical activity programs are com
monly prescribed for cardiovascular patients (Haskell, 1979). Further, one of
us (Superko) has· frequent experience with patients inquiring whether they
should modify their physical activity on days of moderate or severe air pollu
tion, and if so, how much. Hence, it seems essential to develop data that will
permit CARB and phys·ici ans to advise heart disease patients accurately about
activity levels during days of significant o3 pollution levels.
At present, clinical investigations of patients subjected to o3 exposures
13.
have involved rather nonspecific pulmonary disease groups. Hackney et al
(1977) studied six subjects with "respiratory hyperactivity" who lived in the
Los Angeles area, but no PF test patient definition was given. Hackney et al
(1975) studied a group of patients with a history of hyperactive airways, but
again, no documentation and definition of pulmonary dysfunction was given.
Linn et al (1978) studied physician diagnosed asthmatics and did not find sig
nificant changes in PF after exposure at rest to 0.2 ppm o3 for 2 hours. All
of these investigations employed loosely defined patient groups and none in
volved subjects with coronary artery disease (CAD), or ~-iith well defined chron
ic obstructive lung disease (COLD). Reid et al (1964} estimated that between
8-17% of the American population suffer from COLD at some time. It seems
reasonable to assume that heart and lung patients may have a threshold o3 toxi
city effect that is lower than that for young, clinically normal adult males.
However, the degree of difference may be related to the particular disease pro
cess, as the principal area of short-term acute o3 exposure impact is centered
in the lungs and respiratory tract.
Cardiovascular impairment has not been demonstrated, although Buckley et
al (1975) have reported evidence of o 1 s penetrating the alveolar membrane and3 interacting with blood components, increasing both red blood cell fragility and
specific enzyme activities. Further, symptom limited CAD patients have well
defined symptom thresholds, as indicated by the triple, or more practically,
the double product of heart rate (HR) and systolic blood pressure (SBP)
(Robinson, 1967). This symptom threshold may be altered by o3 effect on HR
(Fol insbee et al, 1975), SBP, pulmonary edema, increased respiratory rate (FR)
and bronchoconstriction, which would increase the work of breathing and pos
sibly lower the symptom threshold (Golden et al, 1978; Holtzman et al, 1979).
The mechanism is important to elucidate, as it may be affected by cardiogenic
medicines (Watanabe et al, 1973). Further, alteration in any of the above
parameters in CAD patients has the potential for increasing cardiovascular
stress and would be sufficient cause to alter the presumed therapeutic exercise
prescription on days of significant oxidant pollution.
In a similar manner, exercise limitations can be seen 1n patients with
COLD based on their ~E and predicted MVV (Robertson et al, 1979}. Reflex
bronchoconstriction (Folinsbee et al, 1975), decreased inspiratory capacity
(Folinsbee et al, 1978), increased FR (Delucia & Adams, 1977) and decreased

14.
diffusion capacity (Young et al, 1964) could potentially alter these patients'
o3 threshold effect during physical activity. Further, especially where activ
ity is concerned, most of these patients will have a diminished functional 0
reserve capacity due to aging, per se (Astrand &Rodahl, 1977; Raven, 1979), as
well as that effected by the disease itself. Thus, although there is good reason to suspect that certain patients with
heart and lung disease {especially those who are middle-age and older) will
have a lower threshold for an o3 toxicity effect, the paucity of quantitative
data supporting the current CARB cautionary statements can either place undue
hardship on some heart and lung disease patients by unnecessarily restricting
their activity, or alternatively, may underestimate the health hazards imposed.
One important patient group to study is that afflicted with angina pectoris,
many of whom are advised to undertake exercise training for improvement of
their physical activity tolerance and functional reserve capacity (Haskell,
1979). While there is clear evidence that there is a substantial decrease in
time to onset of pain during treadmill exercise and the level of expired carbon
monoxide (CO) in the lungs of angina patients exposed to freeway air, as well
as laboratory induced increased COHb levels (Goldsmith &Aronow, 1975), no such
direct implications for 03 effect on angina patients has been reported.
The present study was designed to obtain quantitative data relative to the
difference in o3 toxicity, if any, in a group of angina patients undergoing
prescribed exercise training, compared to young adults and middle-age clinical
ly normal subjects, also regularly engaged in aerobic training. More specific
ally, the patients' response during o3 exposures while engaged in their normal
exercise training regimen was ascertained and compared to that of two clinical-. ly normal groups exercising at similar VE and o3 concentrations.
Methodology
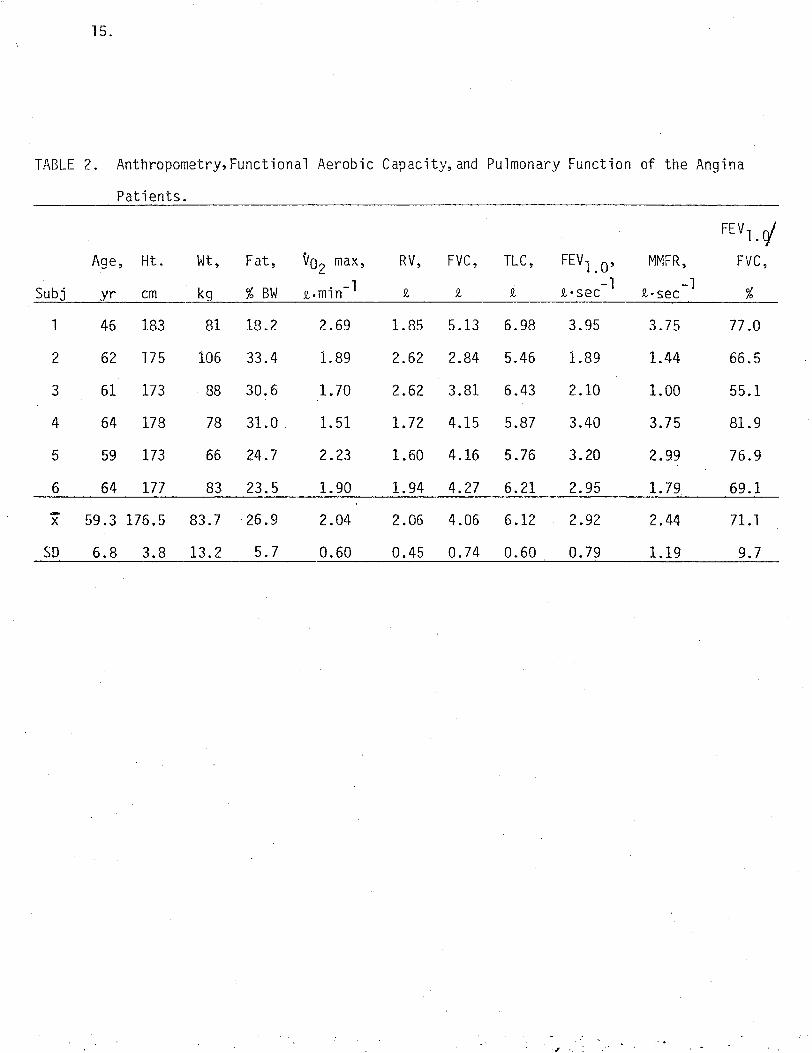
Subject description and baseline measurements. The patient group consist
ed of six male volunteers with documented coronary artery disease (CAD). Their
basic anthropometry, functional aerobic capacity, and pulmonary function data
are given in Table 2. Although several had previously smoked cigalettes, none
had smoked for within two years prior to the study. The diagnosis of CAD was
made by a clinical history of angina pectoris associated with either a previous
confirmed myocardial infarction, an ischemic graded exercise test, or coronary
angiography. Each patient had a well defined symptomatic angina pectoris
15.
TABLE 2. Anthropometry,Functional Aerobic Capacity,and Pulmonary Function of the Angina
Patients.
FEV,_ c/ Age, Ht. Wt, Fat, Vo2 max, RV, FVC, TLC, FEV1. 0, MMFR, FVC,
Subj yr cm kg % BW £-min-1 Q, 9., 9., -1t•sec -1t-sec %
1 46 183 81 18.2 2.69 1.85 5.13 6.98 3.95 3.75 77.0
2 62 175 106 33.4 1.89 2.62 2.84 5.46 1.89 1.44 66.5
3 61 173 88 30.6 1. 70 2.62 3.81 6.43 2.10 1.00 55.1
4 64 178 78 31.0 1.51 1.72 4.15 5.87 3.40 3. 75 81.9
5 59 173 66 24.7 2.23 1.60 4.16 5.76 3.20 2.99 76.9
6 64 177 83 23.5 1. 90 1. 94 4.27 6.21 2.95 1. 79 69.l
-X 59.3 176.5 83.7 26.9 2.04 2.06 4.06 6.12 2.92 2.44 71.1
SD 6.8 3.8 13.2 5.7 0.60 0.45 0.74 0.60 0.79 1.19 9.7
., . :
16.
threshold as defined by the double product of HR and SBP (Clausen &Trap
Jensen, 1970) that was determined by previous graded exercise tests. Pulmonary
function tests indicated that there was no significant restrictive or obstruc
tive lung disease that vwuld limit exercise training.
Prior to entrance into the study, the patient's infoFmed consent and his
private physician's consent were obtained. A complete medical history and
physical exam with resting 12-lead electrocardiogram (ECG), PF tests, and a
symptom limited maxi mum treadmi 11 graded exercise test, were perfarmed on each
subject before acceptance into the study. Prior to each experimental pr-otocol
run, recent clinical history and a 12-lead ECG were reviewed. Contraindica
tions that disallowed participation in the study are listed in Appendix A.
Each of the six patients studied were regular participants in the UC Davis
Cardiopulmonary Rehabilitation Clinic. This physician supervised program en
tailed an individually prescribed, educationally oriented training session
three days per week. Each session included a 10-min warm-up, 40-min of endur
ance activity at the individual training HR, and a 10-min cool-down period.
Following each session was a 20-min lecture. All subjects had participated on
a regular basis for at least three months and had achieved a training plateau.
Training intensities were not modified significantly during the course of the
experiment.
To attentuate habituation effects, al 1 patients completed two orientation
sessions in which PF was measured, followed by a 10-min warm-up walk, a 40-min
training walk, and a 5-min cool-down walk, while breathing FA through a mouth
piece. Each of these sessions was concluded with a repeat of the PF tests.
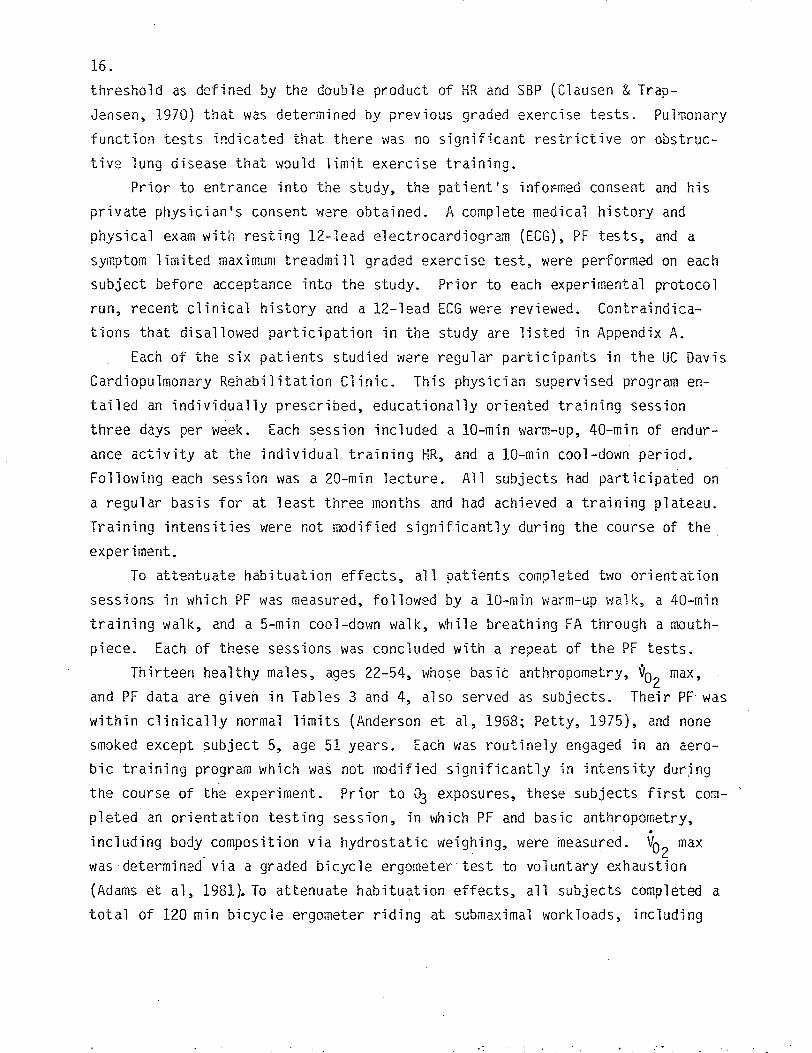
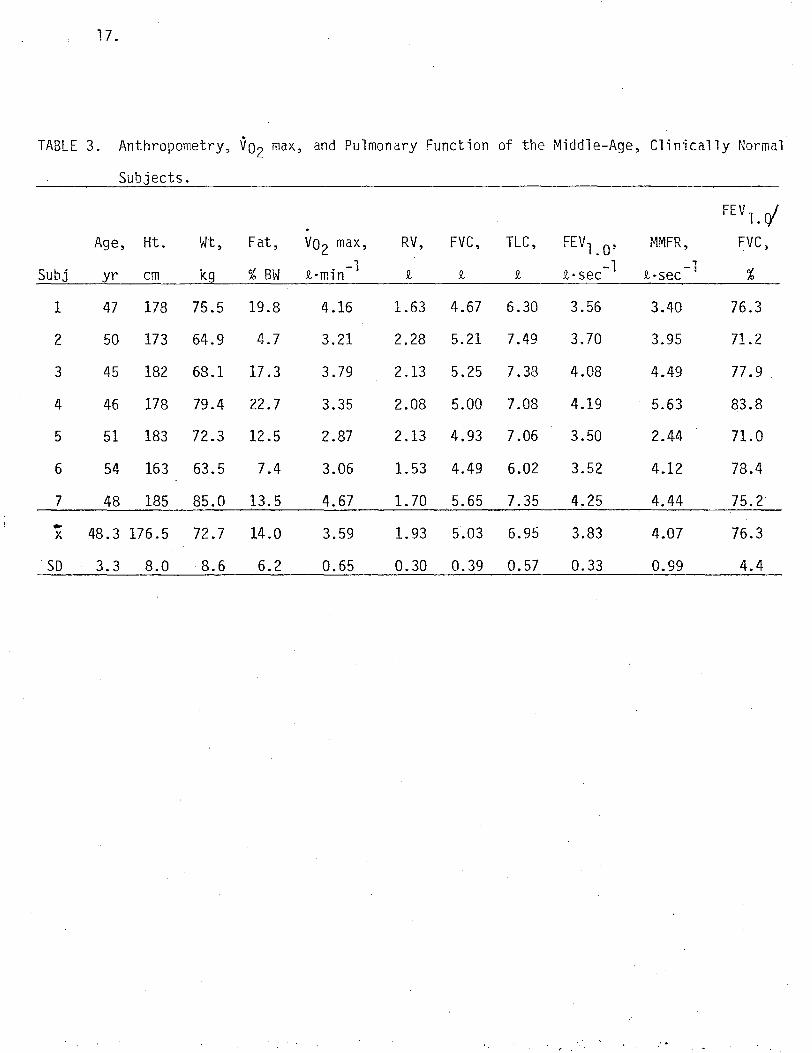
Thirteen healthy males, ages 22-54, whose basic anthropometry, v max,02 and PF data are given in Tables 3 and 4, also served as subjects. Their PF was
within clinically normal limits (Anderson et al, 1968; Petty, 1975), and none
smoked except ~ubject 5, age 51 years. Each was routinely engaged in an aerobic training program which was not rrodified significantly in intensity durJng
the course of the experiment. Prior to~ exposures, these subjects first com
pleted an orientation testing session, in which PF and basic anthropometry,. including body_ composition via hydrostatic weighing, were measured. ~ max
2 was determined via a graded bicycle ergometer· test to voluntary exhaustion
(Adams et al, 1981). To attenuate habituation effects, all subjects completed a
total of 120 min bicycle ergometer riding at submaximal workloads, including
17.
TABLE 3. Anthropometry, va 2 max, and Pulmonary Function of the Middle-Age, Clinically Normal
Subjects.
FEV 1. rf Age, Ht. Wt, Fat, Vo 2 max, RV, FVC, TLC, FEV1_O' MMFR, FVC,
Subj yr cm kg %BW . -1£·mm Q, Q, Q, £·sec-l -1£-sec %
1 47 178 75.5 19.8 4.16 1.63 4.67 6.30 3.56 3.40 76.3
2 50 173 64.9 4.7 3.21 2.28 5.21 7.49 3.70 3.95 71.2
3 45 182 68.1 17.3 3.79 2.13 5.25 7.38 4.08 4.49 77 .9
4 46 178 79.4 22.7 3.35 2.08 5.00 7.08 4.19 5.63 83.8
5 51 183 72.3 12.5 2.87 2.13 4.93 7.06 3.50 2.44 71.0
6 54 163 63.5 7.4 3.06 1.53 4.49 6.02 3.52 4.12 78.4
7 48 185 85.0 13.5 4.67 1. 70 5.65 7.35 4.25 4.44 75.2 .. X 48.3 176.5 72. 7 14.0 3.59 1. 93 5.03 6.95 3.83 4.07 76.3
SD 3.3 8.0 8.6 6.2 0.65 0.30 0.39 0.57 0.33 0.99 4.4
18.
TABLE 4. Anthropometry, vo2 max, and Pulmonary Function of the Young Adult, Clinically
Normal Subjects.
FEV 1. r/ .
Age, Ht. Wt, Fat, max, RV, FVC, TLC, FEVl. O' MMFR, FVC,Vo2 -l -1 -1Subj yr cm kg %BW JI.. min JI, JI, !l Jl.•sec Jl.·sec %
1 27 183 62.0 4.4 4.15 1.91 6.63 8.54 5.40 5.51 81.4
2 33 189 90.3 12.3 4.15 1.66 5.76 7.42 4.71 4.66 81.8
3 25 187 81.7 6.4 4.35 1.57 6.41 7.98 5.66 6.65 88.3
4 25 182 63.1 5.6 3.34 1.09 6.28 7.37 5.17 5.92 82.3
5 22 180 74.9 10.7 4.47 1.13 5.92 7.05 4.61 4.11 77.9
6 22 172 72.0 8.8 3.69 1.49 5.75 7.24 4.33 3.73 75.3
-X ~.
25.6 182.2 74.0 8.0 4.02 1.48 6.13 7.60 4.98 5.10 81.2
SD 3.7 6.0 10.9 3. l 0.43 0.32 0.37 0.56 0.51 1.12 4.4

19. one 30 min session while breathing FA through the roouthpiece delivery system
employed in the experimental procotols.
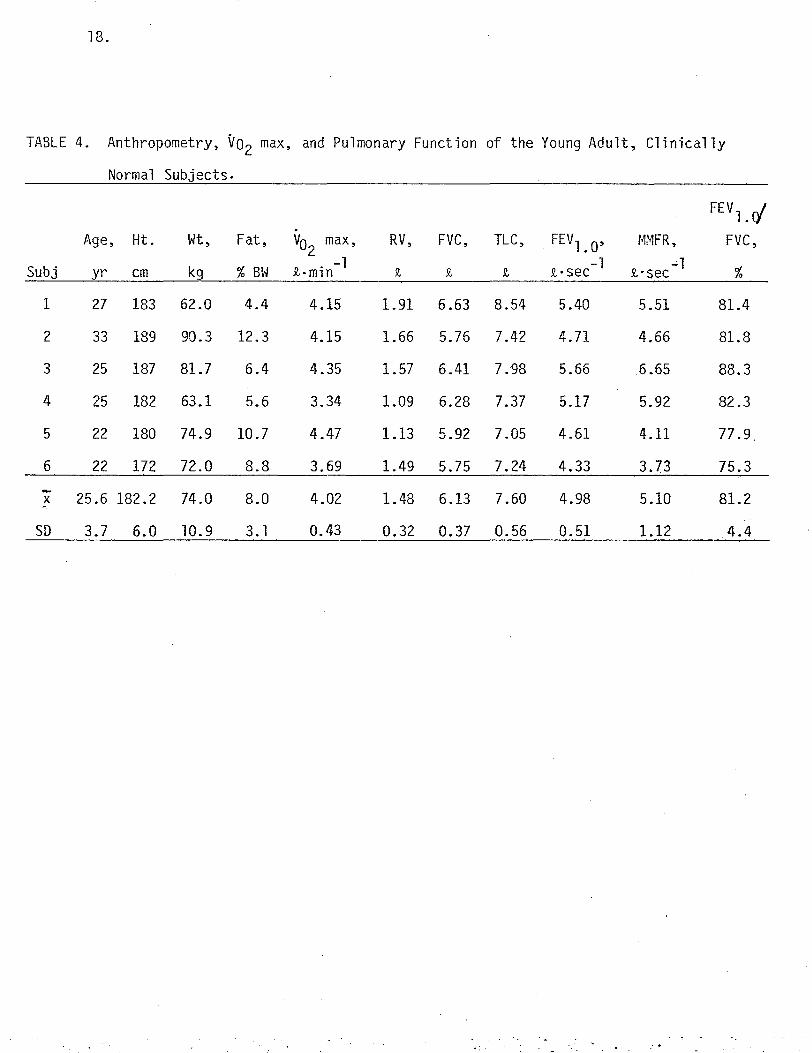
Experimental design. Following an initial 5 min seated at rest, each
patient exercised on the treadmill on three separate occasions according to a
protocol designed to elicit his usual training HR (after 15-20 min gentle warm
up walking), which was then maintained for a period of 25-30 min, i.e., total
of 40 min. The range of warm-up speeds and that maintained for the final 25-30
min of exercise for each patient is given in Table 5. Ideally, the warm-up
period was designed to bring the patient gradually up to his normal training
workload, i.e., just below his 1+ angina, or ischemic ECG changes as defined by
1 mm of ST- depression at 80 msec past the J point.
During the three protocols, each patient breathed either FA, or o3 at con
centrations of 0.2 or 0.3 ppm, respectively, throughout. The order of exposure
was randomized, with a minimum of three days intervening between treatments.
Subjects, and the physician, who made the decision regarding any premature dis
continuation of the test, were not informed whether o3 was being administered.
Upon completion of the exercise protocol, each patient continued walking at a reduced speed ("cool-down") for 5 min while breathing room air.
All experimental treatments were completed in a room, 3.0 m x 2.4 m x 3.7
m, in which dry bulb temperature and relative humidity were maintained
within 22-25° C and 25-50%, respectively. To facilitate convective and
evaporative cooling, a constant airflow of 2.5 m/sec was directed at the
subject's anterior surface via an industrial grade floor fan.
The above design permitted each patient to serve as his own control in de
termining if the o3 exposures elicited any significant changes in the physio
logical parameters monitored when compared to the FA exposure. Additionally,
data from exposures of the clinically normal young adult and middle-age groups
at similar VE were available. That is, each of these subjects completed 1 h of
continuous bicycle ergometer exercise at a mean VE of approximately 35 £/min
while exposed to either FA, or to 0.2 ppm or 0.3 ppm o3. Again~ the order of
experimental protocols was randomized for each subject, with a minimum of 3
days intervening between treatments. Subjects were not informed whether they
v,ere receiving o3, and in order to mask olfactory detection, 0.3 ppm o3 was
generated for 1-2 min just prior to initiating each experimental protocol.
Pulmonary function measurements. A short battery of PF tests was adminis-
20.
TABLE 5. Treadmi 11 Speed and Grade for Patient's Exercise protocols*
Time Period
Subj 1-5 min 6-8 min 8-10 min 10-12 min 12-15 min 15-18 min 18-20 min 20-45 min
1 1.7-2.0 2.0-2.4 2.4-2.6 2.6-2.8 2.8-3.0 3.0-3.2 3.2 3.2
2 1.7-2.0 2.0-2.2 2.2 2.2-2.4 2.4-2.6 2.6 2.6-2.8 2.8
3 1.7-2.0 2.0-2.4 2.4-2.8 2.8-3.2 3.2-3.4 3.4-3 ..6 3.6 3.6
4 1. 7-2.0 3.0-3.4 3.4-3.8 3.8-4.2 4.2-4.4 4.4, + 2% 4.4,+ 5% 4.4,+ 5%
5 1.7-2.0 3.0-3.4 3.4-3.6 3.6 3.6 3.6-4.0 4.0 4.0,+ 2%
6 1.7-2.0 2.4-2.8 2.8 2.8-3.2 3.2-3.4 3.4-3.6 3.6 3.6
*Treadmi 11 speed in miles per hour; grade in percent
21.
tered immediately prior to each experimental protocol and repeated within 10
,nin following exercise. Residual volume was determined utilizing a modified
Collins 9-liter spirometer by the~ rebreathing method (Wilmore, 1969), with initial and equilibrium N readings taken on an Ohio 700 digital N2 analyzer.2 At least two determinations each of passive vital capacity (PVC) and forced
vital capacity (FVC) were made on a Collins 10-liter Stead-Wells Spirometer
assembly of the Basic Clinical Spirometer Module, No. 03000, with simultaneous
measurement of flow volume loops on a Hewlett-Packard x-y recorder, No. 7045.l\.
Forced expiratory volume at 1 (FEV1_0 ) and mid-maximum expiratory flow rate5
(MMFR) were calculated from the spirometric tracings. PF determinations for
the clinically normal subjects were obtained pre- and postexposure as for the
patients, except that PVC, FVC, FEV1_0 and MMFR were determined from
spirometric tracings on the Collins 9-liter spirometer .
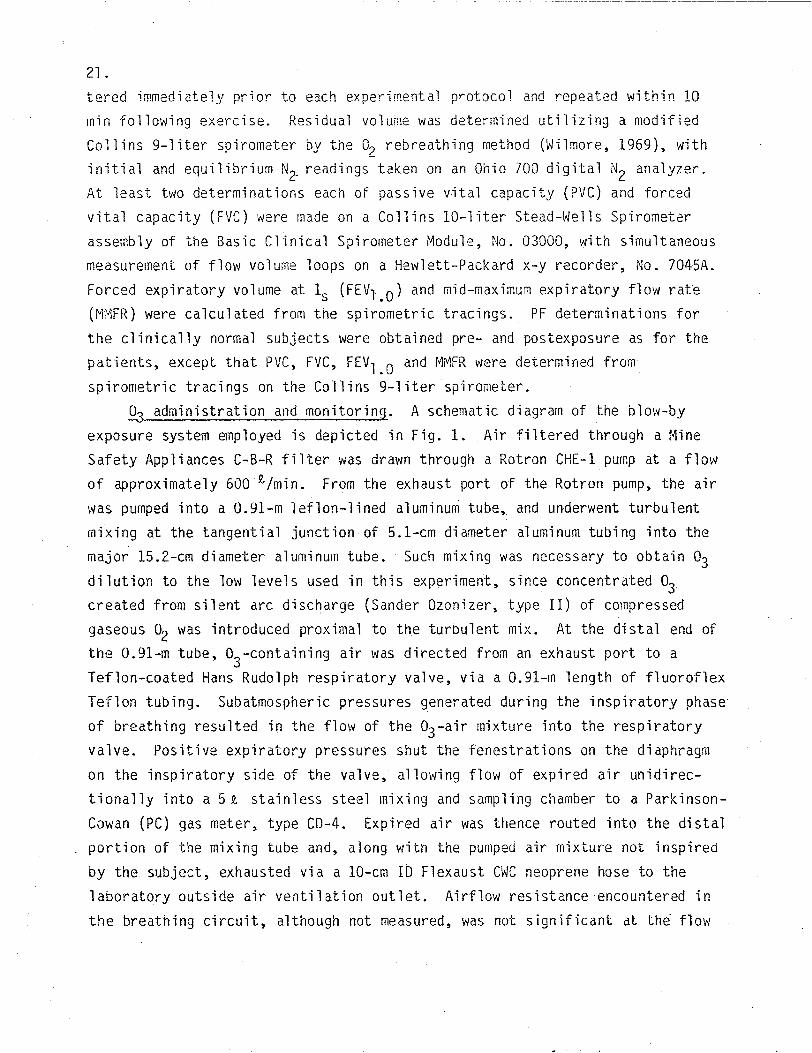
.93 administration and monitoring. A schematic diagram of the blow-by
exposure system employed is depicted in Fig. 1. Air filtered through a Mine
Safety Appliances C-8-R filter was drawn through a Rotron CHE-1 pump at a flow
of approximately 600 Jl,/min. From the exhaust port of the Rotron pump, the air
was pumped into a 0.91-m Teflon-lined aluminu~ tube, and underwent turbulent
mixing at the tangential junction of 5.1-cm diameter aluminum tubing into the major 15.2-cm diameter aluminum tube. Such mixing was necessary to obtain o3 dilution to the 1ow levels used in this experiment, since concentrated o3 created from silent arc discharge (Sander Ozonizer, type II) of compressed
gaseous o2 was introduced proximal to the turbulent mix. At the distal end of the 0.91-m tube, o -containing air was directed from an exhaust port to a
3 Teflon-coated Hans Rudolph respiratory valve, via a 0.91-m length of fluoroflex
Teflon tubing. Subatmospheric pressures generated during the inspiratory phase
of breathing resulted in the flow of the o3-air mixture into the respiratory
valve. Positive expiratory pressures shut the fenestrations on the diaphragm
on the inspiratory side of the valve, allowing flow of expired air unidirec
tionally into a 5 t stainless steel mixing and sampling chamber to a Parkinson
Cowan (PC) gas meter, type CD-4. Expired air was thence routed into the distal
portion of the mixing tube and, along with the pumped air mixture not inspired
by the subject, exhausted via a 10-cm ID Flexaust CWC neoprene hose to the
laboratory outside air ventilation outlet. Airflow resistance encountered in
the breathing circuit, although not measured, was not significant at thi flow
,·
,..
Mixing Chamber .N
\ 1I - - - - - - - - - - - - - - - - - -, j Topl_v~o: - -· - - - - - - -,
N
'-.:!: - . ~--..... ...., ... .... .... .. .... ...... ...,., -... -.. .......... - - ' ', . t r .... - - ...,.. .... -· _,, _. ..., I
o ~ . ll ·_rr1 UmD · /1. \ " I i
Air \-~-\ .. __ I I ~ I~ -~:-::-J::-.!Q7-_ --r-Ou!sida ~,,~---L_:..J
• • .',., • ~ . MOll ll1 Picco Volumo
Exha
I r I I t I I I
us t--t' Meior Air Fl Itor "-1--r-
1 r~ -.,;--- Exl1aust Ozonizor
l &--B ; I ::...J~ ~ lntako
Oz
""-----..;. Mixing Chamber -;,,,- Sida VioYI .Intake
,1
FIGURE 1 SCHEMATIC DiiGRAM OF_ THE G3 EXPOSURE SYSTEM EMPLOYED,

23. rates incurred by the subjects.
o3 concentration was routinely determined by sampled air from the inspira
tory side of the Hans-Rudolph valve, drawn through a O.64-cm Teflon tube connected to a 0asibi o3 meter. The digital reading of 0:3 concentration in ppm
was compared on several occasions to that determined by the UV absorption pho
tometric method (DeMore et al, 1976) at the University of California, Davis,
Primate Center. The 03 containing air from the sampling point on the inspired
side of the respiratory valve to the subject was not likely reduced in concen
tration by passage tnrough the respiratory valve diaphragms which, although of
silicon-rubber, did not show typical deterioration indicative of reactivity
with the oxidant.
Exercise measurements. Following an initial 5 min of seated rest and
another 5 min of preliminary warmup at 1.7-2.0 mph at the particular FA or o3 exposure, the patient 1 s physiological responses were monitored each minute.
Respiratory metabolism was determined via expired air volume (PC meter) and
percent o2 and CO2 by a semiautomated sampling method incorporating a manually
rotated three-way valve sampling system (Wilmore &Costill, 1974), and utiliz
ing Applied Electrochemistry S-3A and Beckman LB-2 gas analyzers. Expired air
volumes and respiratory metabolism values were calculated according to procedures outlined by Consolazio et al (1963). Respiratory frequency (Fp) was
,\
determined via a temperature probe inserted into the respiratory valve, from
which a signal was amplified in a Yellow Springs Instrument scanning te1ether.,.
mometer and recorded on a Hewlett-Packard 680 M stripchart recorder. Heart
rate was determined from a 12-lead ECG placement which was connected to an
oscilloscope and monitored continuously by the attending physician for ST-seg
ment changes and arrythmi as. The ECG 1 s \'/ere analyzed in a randomized manner by the physician (see
Appendix B for list of factors analyzed). A full 12-lead ECG was obtained in
the sitting and standing position prior to treadmill walking and at 5 min
intervals throughout the run. Twelve leads were also obtained at the conclu
sion of the run, 1 min into recovery, and at any time angina was noted. R wave
amplitude was measured in V5 as an average of 6 consecutive beats. ST depres
sion was defined as 1 mm of depression from the baseline flat, downsloping or
upsloping at 80 msec past the J point. Arrythmias were noted at time of onset
and time when the frequency exceeded 6 per minute.

24.
Systolic blood pressure was assessed via the auscultatory method by the
same technician throughout, and combined with HR in the calculation of the rate
pressure product (RPP), an index of myocardial o2 consumption. Additionally,
subjective symptoms were monitored via use of relative perceived exertion
(Appendix C), dyspnea on exertion (Appendix D), and angina pain (Appendix E)
scales.
Several criteria for cessation of the testing protocol were utilized, including the appearance of 3+ angina pain (AP), or if 2+ AP persisted for longer
than 5 min. The test protocol was also broken if ischemic ECG changes occurred or arrythmias, including unifocal or multifocal premature ventricular contrac
tions, occurred at greater than 10 per min, or if ventricular tachycardia or
fibrillation occurred. Exercise induced hypotension with a systolic drop of
>15 mmHg was also a reason for protocol cessation. In fact, only one testing
protocol, an exposure to 0.3 ppm o3 for patient 2, resulted in the occurrence
of any of the specified criteria (in this case, 3+ AP at 14 min). All other
protocols were consistently maintained for each patient.
Immediately following the postexposure PF tests, the patient completed a
subjective symptoms questionnaire, indicating whether they had received o3 and,
if so, at what concentration. The patient was then cleared for release by the
physician.
The clinically normal subjects completed 60 min of continuous bicycle. ergometer exercise at workloads selected to elicit a steady-state VE of approx-imately 35 9-•min-1 . Exercise data acquisition procedures employed with the
young adult subjects incorporated an IMSAI 8080 mini-computer which was pro
grammed to print out running one minute average values for respiratory rnetabo-
1ism variables every 15 sec. Instruments interfaced to the mini-computer in
cluded a Beckman LB-2 CO2 analyzer, an Applied Electrochemi stry S-3A ~ ana
lyzer, and the PC gas meter with linear potentiometer attachment and a thermis
tor located immediately adjacent to its exhaust port. Minor gas analyzer
drifts, assuming linearity with time, were corrected by introducing a standard
gas sample periodically. Additionally, HR was determined from the elapsed time
between 5 consecutive R waves read from an ECG tracing taken every tenth
minute. Respiratory frequency (FR) was determined as described above for the
patients.
Respiratory metabolism and ventilatory pattern were measured in the clini-
--- -- - - ---------------------
25. cally normal middle-age subjects according to methods described for the pa
tients. Heart rate was determined as for the young adult subjects. Respira
tory metabo 1ism measurements \'/ere taken every tenth minute and vent il atory pat
tern measurements every fifth minute, as the previous computer data acquisition
study had indicated these intervals satisfactory for detecting any significant
change in response in clinically normal subjects.
Stat i st i cal procedures. Duplicate PF measurements were corrected to BTPS
and averaged for pre- and postexposure. The postexposure value for each param
eter was subtracted from the preexposure value to obtain differences represent
ing the treatment effect for each protocol. Values for Vo2 max, VE, FR, and HR
obtained during the last minute of exercise were subtracted from those obtained
in the 10th min of exercise for the clinically normal groups and from the
values obtained in the 20th min of exercise (5 min after the last warmup
workload increment) for the patients. To determine if the (s exposures resulted in statistically significant
alterations in physiological response from that for the FA control exposure, a
one-way ANOVA was applied for each group. No attempt was made to compare the
difference in treatment responses between groups, since the method of ergometry
and exposure times differed for the patients compared to the two clinically
normal groups. Statistical significance between treatment conditions within
each subject group was determined from the F ratio derived by dividing treat
ment mean square by error mean square, with two numerator and 12 (patients), 15 (young adult normals), and 18 (middle-age normals) denominator degrees of free
dom. In all analyses, the significance level was set at p ~ .05.
RESULTS
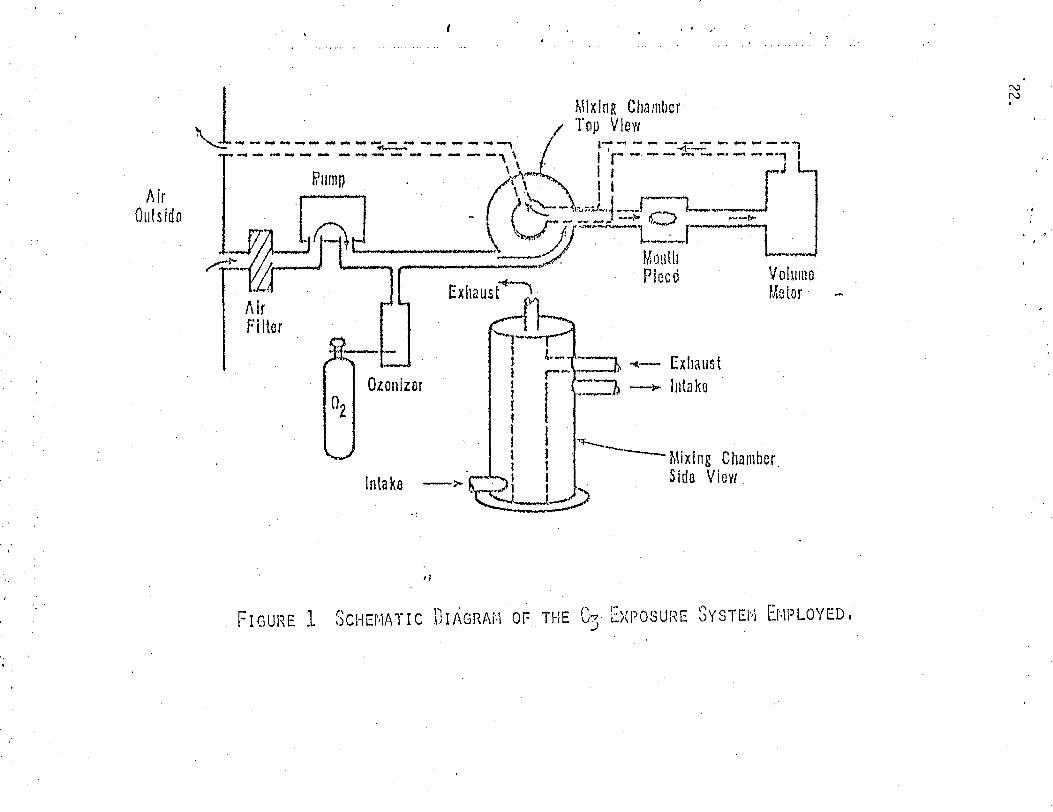
Individual patient and group mean PF responses, together with F ratios
from one-way ANOVA for the three exposures, are given in Table 6. None of the
F ratios reached significance at the .05 level of probability. The mean PF
responses and F ratios for similar FA and o3 exposures for the middle-age and
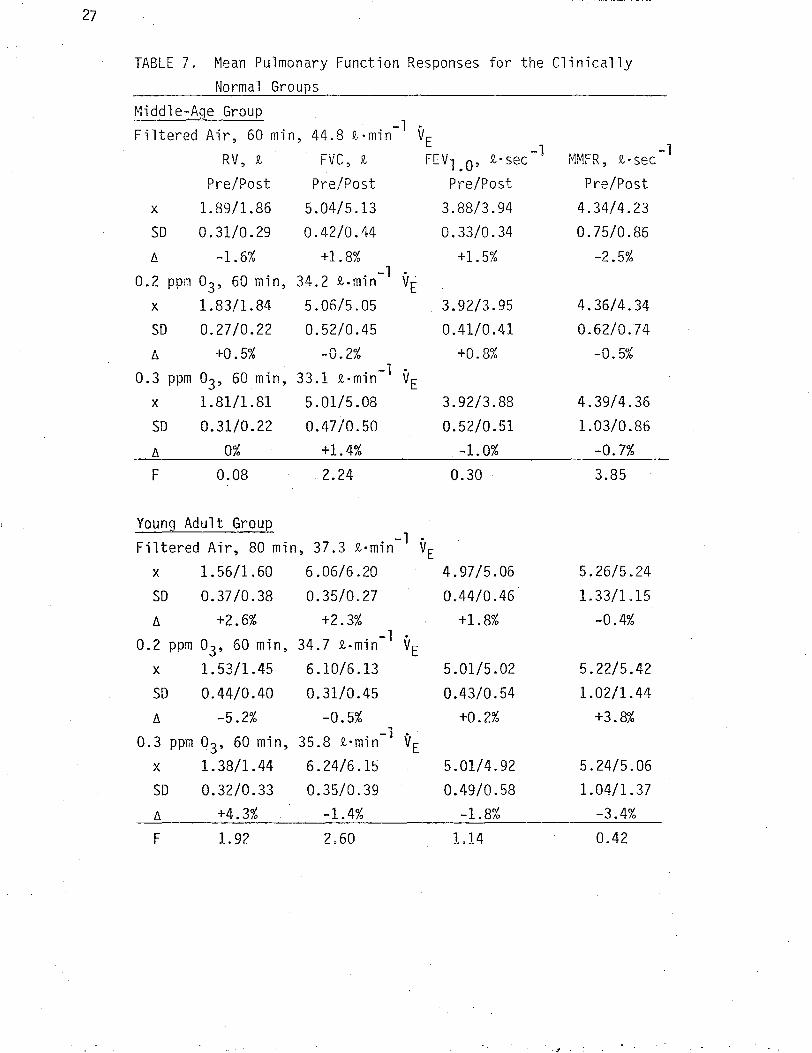
young adult, clinically normal, groups are given in Table 7. Again, no sig
nificant differences in PF response were observed.
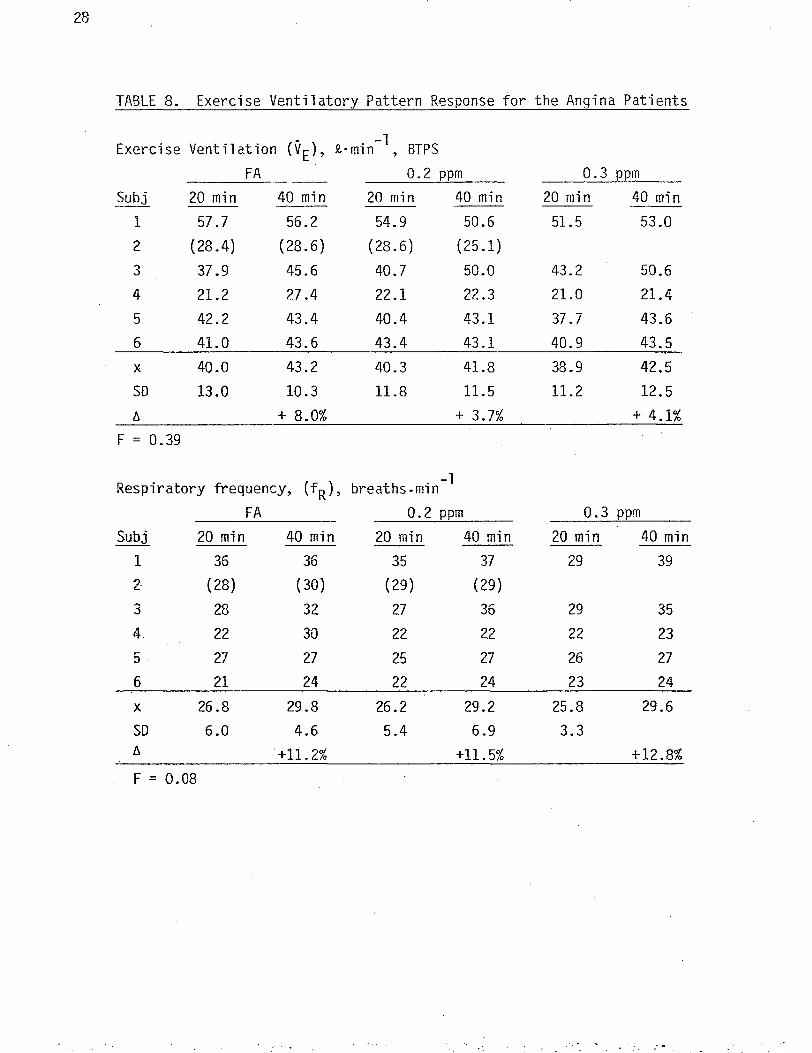
Table 8 contains individual patient and group mean exercise ventilatory
pattern responses, as well as F ratios for the three exposures.* Although
* It should be noted that although all exercise data are reported for angina patient No. 2 for the FA and 0.2 ppm OJ exposures, none are given for the 0.3 ppm 03 exposure because of premature protocol cessation at 14 min due to.3+ angina pain (AP). The significance of this occurrence will be treated in the discussion.
LV
TABLE 6. Pulmonary Function Response for the Angina Patients Filter
Subj
ed Air, 40 min, RV, 2
Pre/Post
35.7 2·min-1
FVC, !l
Pre/Post
VE -1FEV1_0, !l·sec
Pre/Post
-1MMF.R, 2-sec
Pre/Post
1 1. 85/2. 03 5.13/5.24 3.95/4.22 3.75/3.82
2 2.62/2.67 2.84/3.39 1. 89/2 .12 1.44/1. 74
3 2.62/2.35 3.81/3.52 2.10/1. 99 l.00/1.08
4 1. 72/1.66 4.15/4.ll 3.40/3.33 3.75/3.38
5 1.60/1.59 4.16/4.50 3. 20/3.40 2.99/3.11
6 1. 94/1. 97 4.27/4.31 2.95/3.08 1. 79/2.13 -X 2.06/2.05 4.06/4.18 2.92/3.02 2.44/2.54
SD 0.45/0.41 0.74/0.68 0.79/0.84 l.19/1.06 l!, -0.49% +3.0% +3.4% +3.9%
0.2 ppm o3, 40 min, 34.6 !l·min-1 VE
1 2.07/1.85 5.36/5.33 4.17/4.27 4.00/4.04
2 2.65/2.72 3.17/2.90 2.00/1.82 1. 51/1. 22
3 2.39/2.64 3.73/3.65 2.06/2.ll l.05/1.00
4 1. 69/1.66 4.13/4.36 3.41/3.55 3.48/3.94
5 1.57/1.59 4.24/4.40 3.00/3.37 3.18/3.37
6 2.10/2.16 4.19/4.04 3.02/2.85 2.29/2.06
X 2.08/2.10 4.14/4.ll 2.94/3.00 2.59/2.60
SD 0.41/0.49 0.72/0.81 0.82/0.92 1. 16/1.35 l!, +0.96% -0.72% +2.0% +0.38%
0.3 ppm o3, 40 min, 35.7 !l·min-1 VE
1 1.88/2.02 5.46/5.37 4.18/4.05 3.81/3.56
2 2.40/2.60 3.29/3.17 2.22/2.17 1. 97/2.20
3 2.38/2.63 3.42/3.53 2.08/1. 88 l.18/1.04
4 1.63/1.65 4.28/4.38 3.46/3.42 3.72/3.52
5 1.57/1.74 4.36/4.25 3.32/3.18 3.26/2.95
6 2.12/2.16 4.18/4.28 2.97/3.26 2.10/2.32 -X 2.00/2.13 4.17/4.16 3.04/2.99 2.67/2.59
SD 0.36/0.42 0.78/0.76 0.79/0.81 1.08/0.95
l!, +6.5% -0.24% -1. 64% -3.0%
F 2.03 0.67 1.09 0. 13
-----------
27
-1
TABLE 7. Mean Pulmonary Function Responses for the Clinically Normal Groups
Middle-Age Group -1 .
Filtered Air, 60 min, 44.8 2·min VE RV, 2
Pre/Post
X 1.89/1.86
SD 0.31/0.29
t:,, -1.6%
0.2 ppm o3, 60 min,
X 1.83/1.84
SD 0.27/0.22
t:,, +0.5%
0.3 ppm o3, 60 min, X 1.81/1.81
SD 0.31/0.22
t:,, 0%
FVC, 2
Pre/Post
5.04/5.13
0.42/0.44
+l.8%
34.2 2-min-l
5.06/5.05
0.52/0.45
-0.2% . -1
33.l 2•mrn 5.0l/5.08
0.47/0.50
+1.4%
FEV1_0, t·sec -1
Pre/Post
3.88/3.94
0.33/0.34
+1.5%
VE . 3.92/3.95
0.41/0.41
+0.8% .VE
3.92/3.88
0.52/0.51
-1.0%
F 0.08 2.24
Young Adult Group Filtered Air, 80 min, 37.3 2·min-l VE
X 1.56/1.60 6.06/6.20
SD 0.37/0.38 0.35/0.27
t:,, +2.6% +2.3%
0.2 ppm o3, 60 min, 34.7 2-min-1
VE.
x l.53/1.45 6.10/6.13
SD 0.44/0.40 0.31/0.45
t:,, -5.2% -0.5% -1 .
0.3 ppm o3, 60 min, 35.8 £·min VE x l.38/1.44 6.24/6.15
SD 0.32/0.33 0.35/0.39
l:,, +4.3% -1.4%
0.30
4.97/5.06
0.44/0.46
+1.8%
5.01/5.02
0.43/0.54
+0.2%
5.01/4.92
0.49/0.58
-1.8%
MMFR, 2 • sec Pre/Post
4.34/4.23
0.75/0.86
-2.5%
4.36/4.34
0.62/0.74
-0. 5%
4.39/4.36
1.03/0.86
-0.7%
3.85
5.26/5.24
l.33/L 15
-0.4%
5.22/5.42
l.02/1.44
+3.8%
5.24/5.06
l.04/1.37
-3.4%
F 1. 92 2,60 1.14 0.42
J' .
28
TABLE 8. Exercise Ventilatory Pattern Response for the Angina Patients
Exercise Ventilation (VE), t·min-l, BTPS
FA---- 0.2 ppm 0.3 ppm
Subj 20 min 40 min 20 min 40 min 20 min 40 min
1 57.7 56.2 54.9 50.6 51.5 53.0
2 (28.4) (28.6) (28.6) (25.1)
3 37.9 45.6 40.7 50.0 43.2 50.6
4 21.2 27.4 22.1 22.3 21.0 21.4
5 42.2 43.4 40.4 43.1 37.7 43.6
6 41.0 43.6 43.4 43.1 40.9 43.5
X 40.0 43.2 40.3 41.8 38.9 42.5
SD 13.0 10.3 11.8 11.5 11.2 12.5 t:, + 8.0% + 3.7% + 4.1%
F = 0.39
Respiratory frequency, (fR), breaths-min-l
FA 0.2 ppm 0.3 ppm
Subj 20 min 40 min 20 min 40 min 20 min 40 min
1 36 36 35 37 29 39
2 (28) (30) (29) (29)
3 28 32 27 36 29 35
4. 22 30 22 22 22 23
5 27 27 25 27 26 27
6 21 24 22 24 23 24
X 26.8 29.8 26.2 29.2 25.8 29.6
SD 6.0 4.6 5.4 6.9 3.3 6. '+11.2% +11. 5% +12.8% F = 0.08
29.
there was a tendency for increased values at the end of exercise, this was con
sistent in all exposures and thus, as indicated by the F ratios, no significant
treatment effect was noted. The patient I s HR and v response data and F02 ratios are shown in Table 9. Again, none of the F values reached statistical
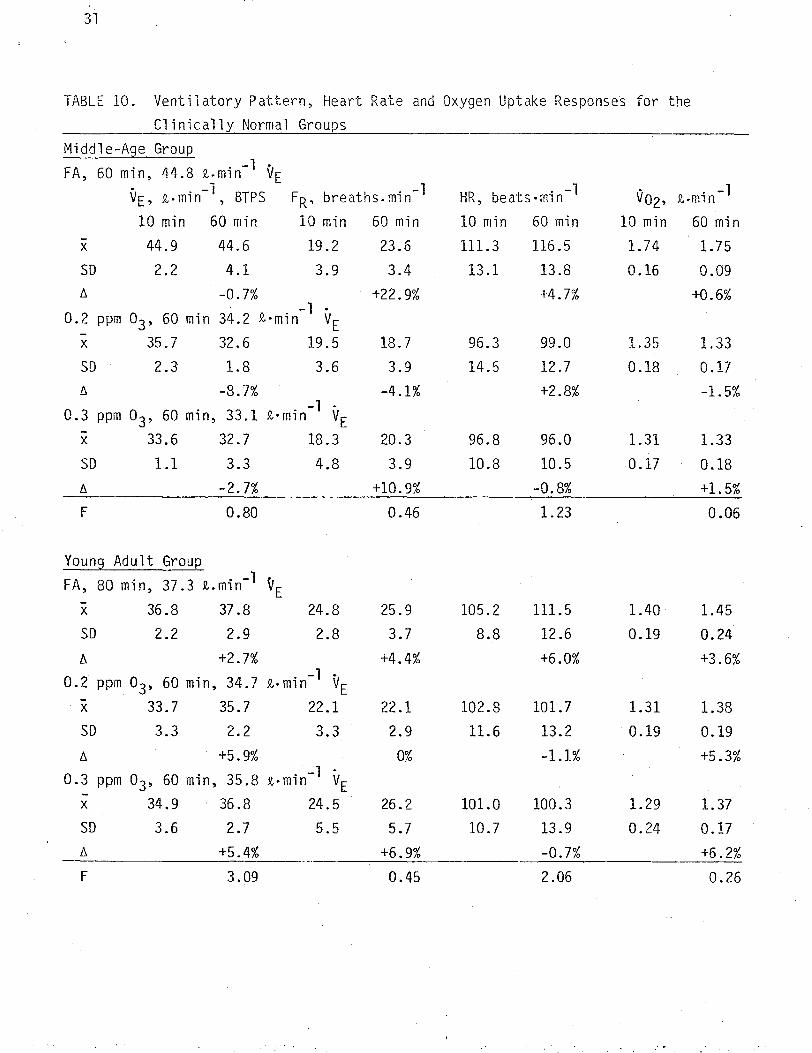
significance. The mean ventilatory pattern, HR and Vo 2 responses and F ratios
for the young adult and middle-age normal groups are given in Table 10. None
of the F values approached statistical significance.
Table 11 shows the individual patient and group mean responses for SBP and
RPP for each of the exposures. Neither of the F values were significant~
Other individual patient data, including onset time for l+ AP, 2_ l mm ST
segment depression and l+ dyspnea on exertion (DOE), together with the
calculated RPP at these occurrences are given in Table 12. Since the patients
did not always evidence symptoms, there were numerous instances of missing data
and thus, no statistical analyses were performed. However, careful inspection
of the data revealed no systematic trends due to an treatment effect. Theo3 difference in the patients• rating of perceived exertion (RPE) at 20 min and 40
min did not demonstrate a statistically significant treatment effect (F= l .56).
The mean FEV1.o response, calculated as a 2d order polynomial function of o3 effective dose (the product of concentration, ~E• and exposure time) for young
adult males exercising continuously at both a moderate and heavy workload, while
exposed to o3 concentrations of 0.2, 0.3, and 0.4 ppm for 30-80 min (Adams et ~,
1981), is depicted as a solid line in Fig. 2. The patients 1 mean values for each
protocol are shown as open circles, while those for the clinically normal
middle-age males are represented by darkened circles. It is apparent that
neither group exhibited a consistent difference from the young adult's regression line.
DISCUSSION
Ozone, a principal constituent of photochemical smog, has been implicated
as the primary agent effecting increased hospital admissions amongst those
afflicted with respiratory disease (Paproski & \~alker, 1974), as well as re
duced athletic performance (Wayne et al, 1967). In acute laboratory chamber
exposures (_g h), numerous investigators have demonstrated that light exer
cise, usually perfor~ed for 15 min, with 15 min rest, intermittently (IE),
intensifies PF impairment at a particular o3 concentration, even as low as
0.37 ppm (Bates et al, 1972; Folinsbee et al, 1975; Hackney et al, 1975;

30
TABLE 9. Heart Rate and Oxygen Uptake Response for Angina Patients
Heart Rate (HR), beats-min-1
FA 0.2 ppm 0.3 ppm
Subj 20 min 40 min 20 min 40 min 20 min 40 min
1 122 132 129 130 128 129
2 (90) (92) (85) (83)
3 84 90 80 94 87 98
4 69 73 69 69 69 71
5 102 102 96 98 96 99
6 82 86 76 83 82 87 X 91.8 96.6 90.0 94.8 92.4 96.8
SD 20.6 22.3 23.9 22.7 22.2 21. 2 f:,_ 5.2% +5.3% +4.8%
F = 0.01
Oxygen Uptake (Voz), i-min-1
FA __0.2 ppm 0.3 ppm
Subj 20 min 40 min 20 min 40 min 20 min 40 min
1 1.71 1. 70 1. 71 1.59 1.75 1.64
2 (0.99) (0.98) (0.88) (0.78)
3 1.10 1.18 1.09 1.20 1.10 1.20
4 0. 72 0.74 0. 71 0.71 0.59 0.64
5 1.30 1.31 1.30 1.37 1.28 1.31 6 1.21 1.27 1.21 1.20 1.19 1.26
X 1.21 1.24 1.20 1.21 1.18 1.21
SD 0.36 0.34 0.36 0.32 0.41 0.36 f:,_ +2.5% +0.8% +2.5%
F= 0 .13
31
TABLE 10. Ventilatory Pattern, Heart Rate and Oxygen Uptake Response~ for the Clinically Normal Groups
Middle-Age Group -1 .FA, 60 min, 44.8 i.min VE
. - lVE, i-min , BTPS FR• breat'ns.min. - l HR, beats•min-1 Vo2, i-min-1
10 min 60 min 10 min 60 min 10 min 60 min 10 min 60 min -X 44.9 44.6 19. 2 23.6 111.3 116.5 1.74 1. 75 SD 2.2 4.1 3.9 3.4 13.1 13.8 0 .16 0.09 /J. -0.7% +22.9% +4.7% +0.6%
. -1 . 0.2 ppm o3, 60 min 34.2 i-min VE
-X 35.7 32.6 19.5 18.7 96.3 99.0 1.35 1.33 SD 2.3 1.8 3.6 3.9 14.5 12.7 0.18 0.17 /J. -8.7% -4.1% +2.8% -1.5%
.0.3 ppm o3, 60 min, 33.1 5!.·mrn -1 VE
-X 33.6 32.7 18.3 20.3 96.8 96.0 1.31 1.33 SD 1.1 3.3 4.8 3.9 10.8 10.5 0.17 0.18 /J. -2.7% +10. 9% -0.8% +1.5%
F 0.80 0.46 1.23 0.06
Young Adult Group
FA, 80 min, 37.3 5!..min-1
-X 36.8 37.8
VE 24.8 25.9 105.2 111.5 1.40 1.45
SD 2.2 2.9 2.8 3.7 8.8 12.6 0.19 0.24
/J. .0.2 ppm
-X
+2. 7¾ -1 o3, 60 min, 34.7 $!.,min VE
33.7 35.7 22.1
+4.4%
22.1 102.8
+6.0%
101.7 1.31
+3.6%
1.38 SD 3.3 2.2 3.3 2.9 11.6 13.2 0.19 0.19
/J.
0.3 ppm
X
+5.9% . o3, 60 min, 35.8 t•min-1
VE 34.9 36.8 24.5
0%
26.2 101.0
-1.1%
100.3 1.29
+5.3%
1.37 SD 3.6 2.7 5.5 5.7 10.7 13.9 0.24 0.17 /J. +5.4% +6.9% -0.7% +6.2% F 3.09 0.45 2.06 0.26

32
TABLE 11. Systolic Blood Pressure and Rate Pressure Product.
Systolic Blood Pressure (SBP), mmHg
FA 0.2 pp~ 0.3 ppm
Subj 20 min 40 min 20 min 40 min 20 min 40 min 1 162 156 156 156 168 154
2 (152) (166) (164) (168)
3 134 148 142 144 170 176
4 164 166 158 154 164 162
5 108 114 110 116 112 114
6 106 112 90 104 112 120 -X 134.8 139.2 131.2 134.8 145.2 145.2
SD 28.0 24.8 30.0 23.5 30.4 27.0 /), +3.3% +2.7% 0%
F = 0.47
Rate-Pressure Product, (HR x SBP) = (RPP)
FA 0.2 ppm 0.3 ppm
Subj 20 min 40 min 20 min 40 min 20 min 40 min 1 19,764 20,592 20,124 20,280 21,504 19,866
2 (13,680) (15,272) (13,940) (13,944)
3 11,256 13,320 11,360 13,536 14,790 17,244
4 11,316 12,118 10,902 10,626 11,316 11,502
5 11,016" 11,628 10,560 11,368 10,752 11,286
6 8,683 9,632 6,840 8,632 9,184 10,440 -X 12,407 13,458 11,957 12,888 13,509 14,068
so 4,256 4,204 4,907 4,489 4,916 4,219 /), +8.5% +7.8% +4.1%
F = 0. 27

, 33
TABLE 12. Time of Onset of Symptoms for the Anqina Patients*
l+ Angina pain lasting~ 2 min FA 0.2 ppm
Subj Onset Time 1 25
2 15
3 23
4 18
5 7
6 7 .
RPP Onset Time RPP 20,898 (No 13,870 13
11,592 20
11,664 27
9,078 7
7,200 8
chest pain) 13,393
11,360
11,218
8,352
6,750
0.3 ppm
Onset Time RPP-18 20,252
3 12,600
16 13,944
(No chest pain) 7 7,990
11 8,470
1 mm ST depression FA
Subj Onset Time RPP 1 18 18,960
2 16 13,248
3 (No ST depression) 4
5 (No ST depression) 6 17 8,216
0.2 ppm Onset Time RPP
34 21,222
14 13,393
30 12,780
(No ST depression) (No ST depression)
20 6,840
0.3 ppm Onset Time RPP
18 20,252
1 12,136
14 13,440
19 11,016
(No ST depression) 18 9,348
+1 dyspnea on exertion lasting~ 2 min FA----- 0.2 ppm
Subj Onset Time RPP Onset Time RPP 1 (Not evidenced) (Not evidenced) 2 (Not evidenced) (Not evidenced) 3 23 11,592 14 10,902
4 38 12,240 (Not evidenced) 5 (Not evidenced) (Not evidenced) 6 7 7,200 8 5,984
0. 3 ppm
Onset Time RPP 21 20,916
(Not evidenced) 16 13,944
(Not evidenced) (Not evidenced)
11 8,470
*Onset time expressed as minutes into exercise prescription workload.

0
l~.o
(0 ... $ w
.;.:,. ~
01 ·~,o
-5 -'
Cl) en C: 0 -10•.r;:, f-
~
u <1-
C: ()) -15 0 ).,-
<1.) o_
-20
-25 .__~l ~-1.__..__ _.____L I 0 200 400 600 800 1000 1200
Effective Dose, ppm· L0 3 F1GuRE 2 CoMPAR1soN or PERCENT CHANGE rN FEv1.0 As _A FuNcr10~1
OF 0~ EFFECTIVE DosE FOR THE PATIENTS (OPEN CIRCLES),.,,
f-1IDDLE·.P,Gt: i!om·i/\LS (DJ\F~KENED CIRCLES)) /\ND Your•W {\DULT
NALES (REGRESSION LINE).
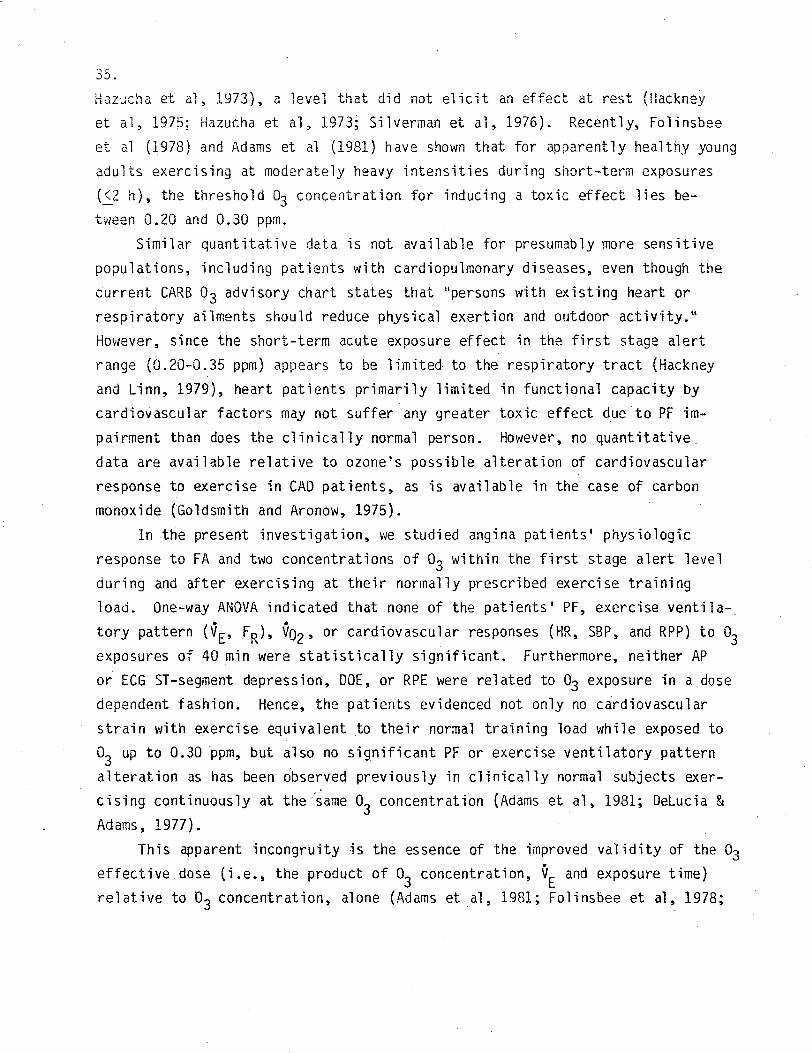
35.
Ho.zucha et al, 1Y73), a level that did not elicit an effect at rest (Hackney et al, 1975; Hazucha et al, 1973; Silverman et al, 1976). Recently, Folinsbee
et al (1978) and Adams et al (1981) have shown that for apparently healthy young
adults exercising at moderately heavy intensities during short-term exposures
(.S.2 h), the threshold o3 concentration for inducing a toxic effect lies between 0.20 and 0.30 ppm.
Similar quantitative data is not available for presumably more sensitive
populations, including patients with cardiopulmonary diseases, even though the
current CARB o3 advisory chart states that "persons with existing heart or respiratory ailments should reduce physical exertion and outdoor activity. 11
However, since the short-term acute exposure effect in the first stage alert
range (0.20-0.35 ppm) appears to be limited to the respiratory tract (Hackney and Linn, 1979), heart patients primarily limited in functional capacity by
cardiovascular factors may not suffer any greater toxic effect due·to PF im
pairment than does the clinically normal person. However, no quantitative
data are available relative to ozone's possible alteration of cardiovascular
response to exercise in CAD patients, as is available in the case of carbon monoxide (Goldsmith and Aronow, 1975).
In the present investigation, we studied angina patients' physiologic
response to FA and two concentrations of o3 within the first stage alert level during and after exercising at their normally prescribed exercise training
load. One-way ANOVA indicated that none of the patients' PF, exercise ventila-.
tory pattern (VE, FR), Vo2 , or cardiovascular responses (HR, SBP, and RPP) to o3 exposures of 40 min were statistically significant. Furthermore, neither AP
or ECG ST-segment depression, DOE, or RPE were related to o3 exposure in a dose
dependent fashion. Hence, the patients evidenced not only no cardiovascular
strain with exercise equivalent to their normal training load while exposed to o3 up to 0.30 ppm, but also no significant PF or exercise ventilatory pattern
alteration as has been observed previously in clinically normal subjects exercising continuously at the ··~ame o concentration (Adams et al, 1981; Delucia &
3 Adams, 1977).
This apparent incongruity is the essence of the improved validity of the o3 effective dose (i.e., the product of o concentration, VE and exposure time)3 relative to o3 concentration, alone (Adams et al, 1981; Folinsbee et al, 1978;

36.
Silverman et a1, 1976). That is, at a particular o3 concentration, both exer
cise enhanced OE and exposure time will result in an increased o3 dosage. For
example, Silverman et al (1976) observed no 03 toxicity effect when subjects at
rest were exposed to 0.37 ppm for 2-h, while with light IE for 2-h they did.
Similarly, Folinsbee et al (1978) observed no toxic effect on exposure to 0.30
ppm for 2-h, but did in their IE exposures at moderately severe workloads.
Exposure time is also of importance as demonstrated by Delucia &Adams' (1977)
observation that exercise ventilatory pattern alteration was not evidenced at·
the heaviest workload (VE= 66-2.•min-l) until after 45 min of the 1-h exposure
to 0.30 ppm o3. Even at a higher o3 concentration, 0.38 ppm, but only for 30
min of CE on a graded increment test to voluntary exhaustion, no significant PF
impairment was noted (Savin & Adams 1979).
In the present study, the o3 effective dose for the patients was calcu
lated as 277 ppm•! for the 0.20 ppm exposure, and 428 ppm•! for the 0.30 ppm
exposure, while those for the clinically normal groups were 414 and .621 ppm•!,
respectively. In Fig. 2, the 2d order polynomial regression line of percent
decrement in FEV1_0 as a function of o3 effective dose, was calculated from
data obtained on young adult males exercising at two workloads {VE= 35 and
63£•min'"'1 ) for periods of 30 to 80 min \vhile exposed to FA or to 0.20, 0.30,
or 0.40 ppm o (Adams et a1, 1981). Neither the patients or the middle-age3 normals mean responses exhibit a consistent variance from the line. Thus, it
appears that the effective dose must exceed 700 ppm•£ before a FEV 1_0 decre
ment of 3% (about 100-120 m£•sec-l) is to be expected. Thereafter, there is a
progressively enhanced decrement as evidenced by the regression line for the
young adults and the two exposures to 0.40 ppm 03 for the middle-age group.
In addition to FEVi.o, we have observed relatively similar impairment in
other PF variables as a function of o3 effective dose {Adams et al, 1981).
They are particularly evident at o3 concentrations~ 0.30 ppm, in combination
with exercise VE and exposure times resulting in effective doses exceeding 800
ppm-2.. Mechanisms for these transient changes (usually allayed within 4 h)
(Delucia & Adams, 1977) are not definitely identified. However, Folinsbee et
al (1978) have suggested that reduced FVC is due to decreased maximum inspira
tion resulting from either a voluntary or reflex reduction of inspiratory
effort, which could also account, in part, for reduced maximum expiratory flow
37.
via a lower absolute lung volume on the flow volume curve. In our study of
young adults (Adams et al, 1981), we noted a significant increase in RV following the most severe protocols, as have others (Folinsbee et al, 1978; Hazucha et al, 1973), which together with decreased maximal inspiratory posi
tion noted by other investigators (Fo1insbee et al, 1977; Hackney et al, 1975;
Silverman et al, 1976), contributes to a decreased FVC. Increased RV may
result from gas trapping and premature airway closure due to direct effect of
on small airway smooth muscle (Folinsbee et al, 1978). It seems likely thato3 o3 inhibits inspiration via stimulation of irritant receptors involved in a
vagally mediated bronchoconstrictor reflex (Silverman et al, 1976), and may
inhibit maximal expiration by the same mechanism (Cohen &Gold, 1975).
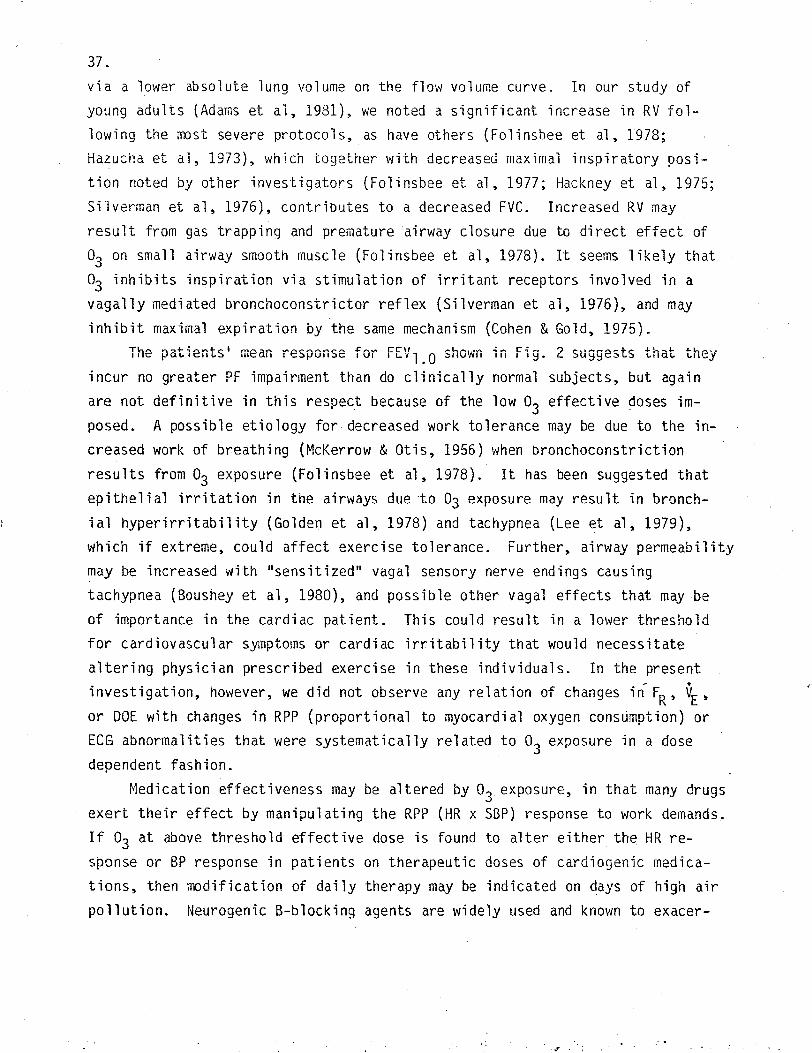
The patients• mean response for FEV 1_0 shown in Fig. 2 suggests that they
incur no greater PF impairment than do clinically normal subjects, but again
are not definitive in this respect because of the low o3 effective 9oses im
posed. A possible etiology for. decreased work tolerance may be due to the in
creased work of breathing (McKerrow &Otis, 1956) when bronchoconstriction
results from o3 exposure (Folinsbee et al, 1978). It has been suggested that
epithelial irritation in the airways due ·to 03 exposure may result in bronch
ial hyperirritability (Golden et al, 1978) and tachypnea (Lee et al, 1979), which if extreme, could affect exercise tolerance. Further, airway permeability
may be increased with 11 sens it i zed" vagal sensory nerve endings causing
tachypnea (Boushey et al, 1980), and possible other vagal effects that may be
of importance in the cardiac patient. This could result in a lower thresho1d for cardiovascular symptoms or cardiac irritability that would necessitate
altering physician prescribed exercise in these individuals. In the present
investigation, however, we did not observe any relation of changes in' FR, VE,
or DOE with changes in RPP (proportional to myocardial oxygen consumption) or ECG abnormalities that were systematically related to o3 exposure in a dose
dependent fashion.
Medication effectiveness may be altered by o3 exposure, in that many drugs
exert their effect by manipulating the RPP (HR x SBP) response to work demands. If o3 at above threshold effective dose is found to alter either the HR re
sponse or BP response in patients on therapeutic doses of cardiogenic medica
tions, then modification of daily therapy may be indicated on days of high air
pollution. Neurogenic 8-blocking agents are widely used and known to exacer-
-T • ;
38.
bate tendencies to bronchial hyperactivity (Orehek et al, 1975). This in it
self may result in an increased myocardial oxygen consumption (proportional to
RPP) due to increased work of breathing and adverse tolerance in CAD patients
with a tendency to bronchospasm.
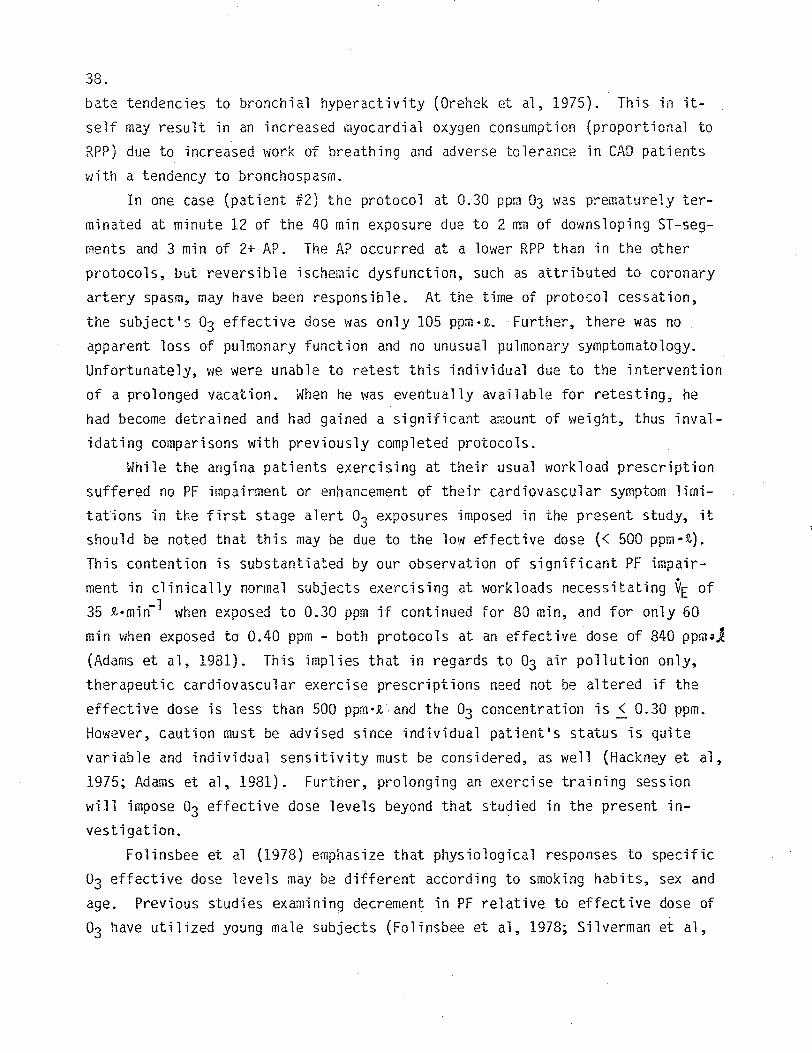
In one case (patient #2) the protocol at 0.30 ppm 03 was prematurely ter
minated at minute 12 of the 40 min exposure due to 2 rrm of downsloping ST-seg
ments and 3 min of 2+ AP. The AP occurred at a lower RPP than in the other
protocols, but reversible ischemic dysfunction, such as attributed to coronary
artery spasm, may have been responsible. At the time of protocol cessation,
the subject's o3 effective dose was only 105 ppm-i. Further, there was no
apparent loss of pulmonary function and no unusual pulmonary symptomatology.
Unfortunately, we were unable to retest this individual due to the intervention
of a prolonged vacation. When he was eventually available for retesting, he
had become detrained and had gained a significant amount of weight, thus inval
idating comparisons with previously completed protocols.
While the angina patients exercising at their usual workload prescription
suffered no PF impairment or enhancement of their cardiovascular symptom limi
tations in the first stage alert o3 exposures imposed in the present study, it
should be noted that this may be due to the low effective dose {< 500 ppm•t).
This contention is substantiated by our observation of significant PF impair
ment in clinically normal subjects exercising at workloads necessitating VE of
35 i•min-1 when exposed to 0.30 ppm if continued for 80 min, and for only 60
min when exposed to 0.40 ppm - both protocols at an effective dose of 840 ppm,J
(Adams et al, 1981). This implies that in regards to 03 air pollution only,
therapeutic cardiovascular exercise prescriptions need not be altered if the
effective dose is less than 500 ppm•i and the o3 concentration is~ 0.30 ppm.
However, caution must be advised since individual patient's status is quite
variable and individual sensitivity must be considered, as well {Hackney et al,
1975; Adams et al, 1981). Further, prolonging an exercise training session
will impose o3 effective dose levels beyond that studied in the present in
vestigation.
Folinsbee et al (1978) emphasize that physiological responses to specific
o3 effective dose levels may be different according to smoking habits, sex and
age. Previous studies examining decrement in PF relative to effective dose of
o3 have utilized young male subjects (Folinsbee et al, 1978; Silverman et al,

39. 1976). Recently (Adams et al, 1981), we studied the o3 toxicity response of 8
males, none of whom smoked, but who varied in age from 22 to 46 years. Comparison of the mean change in PF between the three oldest subjects (33-46) and the
five youngest subjects for protocols at effective doses above threshold, depicted in Fig. 3, revealed only small, inconsistent differences. In the pre
sent study, the middle-age, clinically normal group's PF and exercise ventilatory pattern response was similar to that of the young adult group (Tables 7
and 10, and Fig. 2). That is, inspite of the expected age associated decline
in FVC (which is only partially accounted for by an increased RV) and flow
rates (FEV1 .O and MMFR) - even when expressed as a percent of FVC - there was no appreciable difference in o3 toxicity through the full range of effective
doses studied {Fig. 2). Thus, it appears that the primary factors effecting
lung function deterioration with age advanced by Cotes {1975), viz., (1) deter
ioration in the tissues of which the lung is composed, (2) reduction in the strength of the respiratory muscles, and (3) an increase in stiffness of the
thoracic cage, do not materially affect the 03 toxicity response of clinically normal individuals, at least within the effective dose range studied. That is,
the effective dose threshold and progressive impairment thereafter, seem to be similar for clinically normal middle-age and young adult males, with about the
same relative impairment as a function of increasing effective dose. The
possibility remains, however, that older less well trained subjects might
respond differently than do healthy young adult males. Further, whether the older angina patients studied in the present investigation, who demonstrated
significantly lower FVC, FEV1_0, and MMFR than the middle-age normals, might
have an enhanced o3 toxicity response relative to that of the clinically normal
subjects is not definitively apparent, since the highest effective dose imposed (428 ppm•t) was below threshold.
Conflicting results relative to whether smokers are more sensitive to o3 than non smokers have been reported. Light IE exposures to 0.37 ppm (Hazucha
et al, 1973) and 0.50 ppm o3 (Kerr et al, 1975), revealed that smokers showed less FEV 1_0 decrement. On the other hand, Hackney et al (1977) and Hazucha et
al (1973) have found smokers slightly more sensitive to IE exposures at 0.30 and 0.75 ppm 03, respectively. We have not examined this question definitive-
-• I ,
f!) >( Effecti~e Dose,. 800 ppn1~L · 5
0 J.-,Ao,-<l ~ . ~ l~Y . ~ ~~ I~._J~w
+:> .0
- 5 ~ ...
OJ -IO,en c: -15O·
.. B. LJ . !--__J-----~L ,.
· +-- b) >< Effecfitte Dose, 1120 ppm·L .: 5 .[1
0~ . -1m-rw-n1-nr-r-.-a. -5 lfl 111 lll L-tl
-10
-15 □ Young ~ Older-20
RV FVC FEV1.o MMFR TLC Pulmonary Function Parameter
FIGURE 3 Cor1'iPAR I SOM OF PEr~CENT CHf.\NGE IN Puu,10NARY FUNCTION
lr:iPAim'iENT l:it:nlEEN YOUNG c;.>::5) AND OLDER (('1==3)
CL IN 1CALLY ilORf·iAL !',;ALES C/\DNlS ET l\LJ J.981)
41.
ly, but did note that subject 5 in the middle-age normal group is a regular
smoker (1 pack per day for 30 years). While his lung volumes were not signifi
cantly different from others in this group, his flow rates were substantially
lower (Table 3). However, he was amongst the least sensitive to o3 exposure.
For example, at an effective dose of 1104 ppm•i, his FEV1_0 percent decrement
was 4.0, while the group mean was 7.4. Subjects 6 and 7, however, both of whom
have never smoked, evidenced FEV1_0 decrements of 1.0 and 1.7 percent, respec
tively, for this protocol. Patient #3, a forrner smoker (4 packs per day for 40
years), but who had given up the habit 10 years before the study, had substan
tially lower flow rates than the other patients (Table 2). However, his PF
response did not appear to differ systematically in a dose dependent fashion,
although his HR, SBP, and RPP responses were all greater at 0.30 ppm than for
FA, while AP, ST-segment depression and DOE all occurred earlier in the 0.30
ppm exposure. Patient #4 also had a significant smoking history (up to 2 packs
per day before quitting 11 years prior to the study). However, he evidenced no
PF, RPP, or clinical signs or symptoms systematically related to o3 in a dose
dependent fashion.
The wide range in sensitivity of PF response to a given o3 concentration
has been noted by numerous investigators (Delucia &Adams, 1977; Folinsbee et
al, 1977; Folinsbee et al, 1978; Hackney et~. 1975; Silverman et al, 1976).
The comparison of% FEV1"0 decrement depicted in Fig. 4 (from Adams et al,
1981) shows that even ~nong a healthy~ relatively homogenous population with respect to aerobic power (53-66 ml•min-l • kg-l ), there is a disparate sensi
tivity of individual subjects to the 03 effective dose. An explanation for
this difference in sensitivity, which was generally consistent in all PF and
exercise ventilatory pattern variables, is not readily apparent. Both subjects
had similar physical characteristics, PF, and exercised at the same workload
with near equivalent physiological response to FA protocols. The fact that the
patients did not evidence any apparent individual differences in ~ toxicity
sensitivity as evidenced by PF response, may be due to their exposure to o3 effective doses below threshold (i.e., <700 ppm•l). This contention is further supported, in that the patients' mean exposure VE at their individual exercise
prescription workloads varied from 20 l•min-1 for patient 4 to 45.5 1-min-l
for patient 1, which at the 0.30 ppm exposure, yielded an effective dose. of 240
5 N. Q)
.... -... ...... ... ___....;.·---·---------·-~:,·
O'l 0 P'_-1'~~~ .... ,.,.,,."'.,- .... :..-..,,_C: F"' "" ..... -·-.,;-;;;;; - - - -....,, . . ... - ...... _ .. _ .... _ ... ,... . .CJ
..c: . -5 ',' ,,u
+- -10 ',,,c; (!) . u -15 ',,..,\mo .._ ......OJ ... "' ...a. -20 1 ........·-
L l _J ·o 200 400 600 800 1000 .. 1200
03 Effective Dose, ppm·L
FIGURE L~ COfilPAR I SON OF GRouri f':JE/\N PERCENT CHA[~G E IN
FtVJ..0 (SOLID LINE) TO THAT FOR. THE LEAST
SENSITIVE (UPPER DASHED LINE) AND THE f10ST
SENSITIVE (LO\·JEH D/\SHED LINE), (/\DAMS ET ALJ
J.981)
43.
and 546 ppm•t, respectively (both well below threshold for clinically normal
subjects).
In the group of symptom limited CAD patients studied in the present inves
tigation, there appeared to be no measurable detrimental effect of fulfilling
their exercise therapy while exposed to the first stage alert levels of~ im
posed. Although some ischemic changes and arrythmias were observed, angina
pain and arr_ythmias, as well as RPP, RPE, DOE, and pulmonary function test
response were not altered in a dose dependent fashion by exposure to o3. How
ever, our subjects had relatively low functional capacity and the lack of sig
nificant changes in the above parameters was very likely due to not achieving
the effective dose of .700 ppm •Q, at which PF alterations have been observed in
normal subjects (Adams et al, 1981). These observations imply that in this
sub-group of cardiac patients, routine exercise therapy of 40 min duration is
not contraindicated at an o3 concentration of 0.30 ppm or lower (03 effective
dose 5._500 ppm•t). This finding is somewhat paradoxical, in that these symptom
limited patients' restricted exercise intensity tolerance partially protects
them from o3 toxicity effects. However, were these patients to undertake a
golf game lasting 3 hours at the same 0.30 ppm 03 concentration and requiring
2½ times resting OE, their o3 effective dose would be 1350 ppm•1 for this IE
exposure. This represents a potentially vital factor that clinicians must keep in mind _when prescribing physical activity for CAD patients.
Numerous investigators have noted exaggerated symptoms, including dyspnea,
wheezing, cough and chest tightness, in combination with PF impairment when
subjects engage in exercise during o3 exposure.at levels above the effective
dose threshold (Adams et al, 1981; Bates et~. 1972; Delucia and Adams, 1977;
Hackney et al, 1975). It is important to be able to differentiate clinically
between pulmonary discomfort that might accompany 03 exposure at above thresh
hold levels and that stemming from true AP. Symptomatic angina patients are
commonly taught to cease physical activity when angina occurs and sublingual
nitroglycerin is frequently used to both relieve the symptom and prophylac
tically to avoid it. In the present study, with sub-threshold ~ exposures, no
pulmonary pain that could be confused with AP was experienced. Nevertheless,
caution must be advised, as angina is quite variable in nature and any undiag
nosed chest discomfort should be considered ischemic in nature until proven
otherwise.

44.
Another factor of significance to physicians prescribing exercise for
cardiac patients who might be exposed to significant ambient oxidant levels, is
that a significant number of these patients have a relatively high functional
capacity and can undertake substantial amounts of exertion. A few patients are
in jogging programs and some have successfully completed 42 km marathon races.
In one study, CAD patients completed a 42 km race with a mean of Vo 2 of 29.8
mt/kg•min-1 (Dressendorfer et al, 1977). This is quite impressive, although
others have advised against this form of u·nmonttored ultraendurance activity in
CAD patients due to the possibility of fatal cardiovascular events
(Hellerstein, 1977). This group of patients may easily achieve and surpass the
o3 effective dose threshold of 700 ppm·t characteristic of clinically normal
male subjects~ For example, exercise at a workload requiring 30 m1/kg·min1iio 2 will necessitate a VE of approximately 65 1/min for an average size adult male.
If this level of exercise is maintained for 1 hour at an 03 concentration of
0.30 ppm o3, an o3 effective dose exposure of 1170 ppm•! would be achieved.
This could result in pulmonary alterations that might adversely affect exercise
tolerance and cardiovascular response through neurogenic and as yet other
undetermined mechanisms. Of course, if the o3 concentration was greater than
0.30 ppm, the effect at the same effective dose (i.e., 1170 ppm•i) would be
greater, reflecting the preeminent role of o3 concentration in the effective
dose equation (Adams et al, 1981; Folinsbee et al, 197~; Silverman et al,
1976).
It should be apparent from the results of the present study and the
discussion developed above, that not all classifications of heart and lun~
patients are simila~ly affected on exposure to ambient alert levels of oxidant
air pollution. Thus, it is of vital importance that precise answers be found
to the clinical implications of such air pollution. Only then can clinicians
and scientists give adequate advice on the possible need to modify physical
activity on days of poor air quality.
45. References
1. Adams, W.C., W.M. Savin, and A.E. Christo. Detection of ozone toxicity during continuous exercise via the effective dose concept. J. Appl. Physiol: Respirat. Environ. Exercise Physiol. 1981 (In press).
2. Air Quality and Meteorology. 25(9):16, September, 1979, South Coast Air Quality Management District, El Monte, Calif.
3. Anderson, T., J. Brown, J. Hall, and R. J. Shephard. The limitations of linear regressions for the prediction of vital capacity and forced expiratory volume. Respirat. 25:140-158, 1968.
4. ~strand, P.-0., and K. Rodahl. Textbook of Work Physiology. New York: McGraw-Hill, 1977 (2d edit.), pp. 385-6.
5. Bates, O.V., G.M. Bell, C.D. Burham, M. Hazucha, J. Mantha, l.D. Pengelley, and F. Silverman. Short-term effects of ozone on the lung. J. Appl. _Physiol. 32:175-181, 1972.
6. Bennett, G. Ozone contamination of high altitude aircraft cabins. Aerospace Med. 33:969-973, 1962.
7. Boushey, H.A., M.J. Holtzman, J.R. Sheller, and J.A. Nadel. Bronchial hyperactivity. Am. Rev. Respir. Dis. 121:389-413, 1980.
8. Buckley, R.D., J.H. Hackney, K. Clark, and C. Pesin. Ozone and human blood. Arch. Environ. Health 30:40-42, 1975.
9. Clamann, H., and R. Bancroft. Toxicity of ozone in high altitude flight. Advan. Chem. 21:352-359, 1959.
10. Clausen, J.P., and J. Trap-Jensen. Effects of training on the distribution of cardiac output in patients with coronary artery disease. Circulat. 42:611-624, 1970.
11. Cohen, A.B., and W.M. Gold. Defense mechanis~s of the lungs. Ann. Rev. Physiol. 37:325-350, 1975.
12. Committee on Medical and Biologic Effects of Environmental Pollutants: Ozone and Other Photochemical Oxidants. National Academy of Sciences, 1977, pp. 280-436.
13. Consolazio, C.F., R.E. Johnson, and L.J. Pecora. Physiological Measurements of Metabolic Functions in Man. New York: McGraw-Hill, 1963, pp. 5-9.
14. Cotes, J.E. lun Function: Assessment and Aoplication in Medicine. Oxford: Blackwe 3rd edit. , pp. 369-383.
15. Delucia, A.J., and W.C. Adams. Effects of O inhalation during exercise on pulmonary function and blood biochemistry. J. Appl. Physiol: Respirat. Environ. Exercise Physiol. 43:75-81, 1977.
16. Delucia~ A.J., M.G. Mustafa, C.E. Cross, C.G. Plopper, D.l. Oungworth, and W.S. Tyler. Biochemical and morphological alterations in the lung following O exposure. In: Air. I. Pollution Control and Clean Energy, edited by C. Rai and L.A. Spielman. A.I. Ch. E. Symp. Ser. 71:93-100, 1975.
17. OeMore, W.B., J.C. Romanovsky, M. Feldstein, W.J. Hamming, and P.K. Mueller. Interagency comparison of iodometric methods of ozone determination. In: Calibration in Air Monitoring. ASTM Technical Publication No. 598. Philadelphia: American Society for Testing and Materials, 1976, pp. 131-143.
46.
18. Oressendorfer, R.H., J.H. Scaff, Jr., J.O. Wagner, and J.O. Gallup. Metabolic adjustments to marathon running in coronary patients. Ann. N.Y. Acad. Sci. 301:466-483, 1977.
19. Fairchild, E.J. Neurohumoral factors in injury from inhaled irritants. Arch. Environ. Health 6:79-86, 1963.
20. Folinsbee, L.J., 8.L. Drinkwater, J.F. Bedi, and S.M. Horvath. The influence of exercise on the pulmonary function changes due to 1ow concentrations of ozone. In: Environmental Stress. (L.J. Folinsbee et al, editors). New York: Academic Press, 1978, pp. 125-145.
21. Folinsbee, L.J., S.M. Horvath, P.B. Raven, J.F. Bedi, A.R. Morton, B~L. Drinkwater, N.W. Bolduan, and J.A. Gliner. Influence of exercise and heat stress on pulmonary function during ozone exposure. J. Appl. Physiol.: Respirat. Environ. Exercise Physiol. 43:409-413, 1977.
22. Folinsbee, L.J., F. Silverman, and R.J. Shephard. Exercise responses fol lowing ozone exposure. J. Appl. Physiol. 38:996-:-1001, 1975.
23. Golden, J.A., J.A. Nadel, and H.A. Boushey. Bronchial hyperirritability in healthy subjects after exposure to ozone. Am. Rev. Respir. Dis. 118:287-294, 1978.
24. Goldsmith, J.R., and W.S. Aronow. Carbon rronoxide and coronary heart disease: A review. Environ. Res. 10:236-248, 1975.
25. Goldsmith, J.R., and J.A. Nadel. Experimental exposure of human subjects to ozone. J. Air Pollut. Control Assoc. 19:329-330, 1969.
26. Hackney, J.D., and W.S. Linn. Koch's postulates updated: A potentially useful application to laboratory research and policy analysis in environmental toxicology. Am. Rev. Respir. Dis. 119:849-852, 1979.
27. Hackney, J.O., W.S. Linn, S.K. Karuza, R.D. Buckley, D.C. Law, D.V. Bates, M. Hazucha, L.D. Pengelly, and F. Silverman. Effects of ozone exposure in Canadians and Southern Californians: Evidence for adaptation? Arch. Environ. Health, 32:110-116, 1977.
28. Hackney, J.D., W.S. Linn, O.C. Law, S.K. Karuza, H. Greenberg, R.D. Buckley, and E.E. Pedersen. Experimental studies on human health effects of air pollutants. III. Two-hour exposure to ozone alone and in combination with other pollutant gases. Arch. Environ. Health 30:385-390, 1975.
29. Haskell, W.L. Mechanisms by which physical activity may enhance the clinical status of cardiac patients. In: Heart Disease and Rehabilitation. (M.L. Pollock and D.H. Schmidt, eds.). Boston: Houghton Mifflin, 1979, pp. 276-296.
30. Hazucha, M., F. Silverman, C. Parent, S. Field, and D.V. Bates. Pulmonary function in man after short-term exposure to ozone. Arch. Environ. Health 27:183-188, 1973.
31. Hellerstein, H. Limitations of marathon running in the rehabilitation of coronary patients: Anatomic and physiologic determinants. N.Y. Acad. Sci. 301:484-494, 1977.
32. Holtzman, M., et al. Effect of ozone on broncial reactivity in atopic and nonatopic subjects. Clin. Res. 27:56A, 1979.
47.
33. Jaffe, L.S. Photochemical air pollutants and their effects on men and animals. II. Adverse effects. Arch. Environ. Health 16:241-255, 1968
34. Kerr, H.D., T.J. Kulle, M. Mcilhany, and P. Swidersky. Effects of ozone on pulmonary function in normal subjects. Am. Rev. Respir. Dis. 111:763-773, 1975.
35. Lee, L.-Y., C. Dumont, T.D. Ojokic, T. E. Menzel, and J .. A. Nadel .. Mechanism of rapid, shallow breathing after ozone exposure in conscious dogs. J. Appl. Physiol.: Respirat. Environ. Exercise Physiol. 46:1108-1114, 1979.
36. Linn, W.S., et al. Health effects of ozone exposure in asthmatics. Am. Rev. Resp. Dis. 117:835-843, 1978.
37. Marx, J.L., and G. Kolata. Combating the #1 killer. Amer. Assoc. for the Advancement of Science. Publication 78-3, p. 3, 1978.
38. McKerrow, C.8., and A.B. Otis. Oxygen cost of hyperventilation. J. Appl~ Physiol. 9:375-379, 1956.
39. Menzel, 0.8. Toxicity of ozone, oxygen, and radiation. Ann. Rev. Pharmacol. 10:379-394, 1970.
40. Mosher, J.C., W. G. MacBeth, M.J. Leonard, T.P. Mullins, and M.F. Brunelle. The distribution of contaminants in the Los Angeles Basin resulting from atmospheric reactions and transport. J. Air Pollut. Control Assoc. 20:35-42, 1970.
41. Orehek, J, R. Gayrard, Ch. Grimaud, and J. Charpin. Effect of beta-adrenergic blockade on bronchial sensitivity to inhaled acetycholine in normal subjects. J. Allergy Clin. Immunol. 55:164-169, 1975.
42. Paproski, D.M., and J.R. Walker. Air Quality in Canadian Urban Areas. Discussion Paper 18. Ottawa: Economic Council of Canada, 1974.
43. Petty, T.L. Pulmonary Diagnostic Techniques. Philadelphia: Lea and Febiger, 1975, pp. 1-30.
44. Raven, P.B. Heat and air pollution: The cardiac patient. In: Heart Disease and Rehabilitation. (M.L. Pollock and D.H. Schmidt, eds.). Boston: Houghton Mifflin, 1979, pp. 563-586.
45. Reid, D.D., et al. An Anglo-American comparison of the prevalence of bronchitis. Br. Med. J. 2:1487-1495, 1964.
46. Robertson, H.T. Exercise testing for patients with dyspnea. In: Weekly Update: Pulmonary Medicine. M.A. Sackner, editor. Lesson 37, 1979, A~erican Thoracic Society, pp. 2-7.
47. Robinson, B.F. Relation of heart rate and systolic blood pressure to the onset of pain in angina pectoris. Circulat. 35: 1073-1083, 1967.
48. Savin, W.M., and W.C. Adams. Effect of ozone inhalation on work performance and V max. J. Appl. Physiol.: Respirat. Environ. Exercise Physiol. 46:309-314, 1979.
49. Silverman, F., L.J. Folinsbee, J. Barnard, and R.J. Shephard. Pulmonary function changes in ozone-interaction of concentration and ventilation. J. Appl. Physiol. 41:859-864, 1976.
50. Stokinger, H.E., and D.L. Coffin. Biological effects of air pollutants. In: Air Po1lution, edited by A.C. Stern. New York: Academic, 3rd edition, 1968, Vol. 1, p. 401-456.
48.
51. Stokinger, H.E., W. Wagner, and P, Wright. Studies of ozone toxicity. 1. Potentiating effects of exercise and tolerance development. AMA Arch. Ind. Health 14: 158-162, 1956.
52. Watanabe, S., R. · Frank, and E. Yokoyama. Acute effects of ozone on lungs of cats. 1. Functional. Am. Rev. Respir. Dis. 108:1141-1151, 1973.
53. Wayne, W., P. Wehrle, and R. Carroll. Oxidant air pollution and athletic performance. J. Am. Med. Asso_c. 199:901-904, 1967.
54. \~ilmore, J.H. A simplified method for determination of residual lung volumes. J. Appl. Physiol. 27:96-100, 1969.
55. Wilmore, J.H., and D.L. Costill. Semiautomated systems approach to the assessment of oxygen uptake during exercise. J. Appl. Physiol. 36:618-620, 1974.
56. Yokoyama, E., and R. Frank. Respiratory uptake of ozone in dogs. Arch. Environ. Health 25:132-138, 1972.
57. Young, W.A., 0.8. Shaw, and D.V. Bates. Effects of low concentrations of ozone on pulmonary function in man. J. Appl. Physiol. 19:765-768, 1964.

49.
GLOSSARY OF TERMS, ABBREVIATIONS AND SYMBOLS
ANOVA Analysis of Variance AP Angina Pain CAO Coronary Artery Disease CARB California Air Resources Board CE Continuous Exercise co Carbon Monoxide COHb Carboxyhemoglobin COLD Chronic Obstructive Lung Disease
□ Leo Lung Diffusion for Carbon Monoxide DOE Dyspnea on Exertion ECG Electrocardiogram FA Filtered Air
FEV1.o Forced Expiratory Volume at 1 sec FR Respiratory Frequency FVC Forced Vital Capacity HR Heart Rate IE Intermittent Exercise MMFR Mid-maximum Expiratory Flow Rate
03 Ozone PC Parkinson-Cowan PF Pulmonary Function ppm Parts per Million
•ppm Parts per Million x Liters VE PVC Passive Vital Capacity R Rest RPE Rated Perceived Exertion RPP Rate Pressure Product RV Residual Volume SBP Systolic Blood Pressure TLC Total Lung Capacity vc Vital Capacity
VE Pulmonary Ventilation Volume •Vo2 Maximal Oxygen Uptake Volume
max
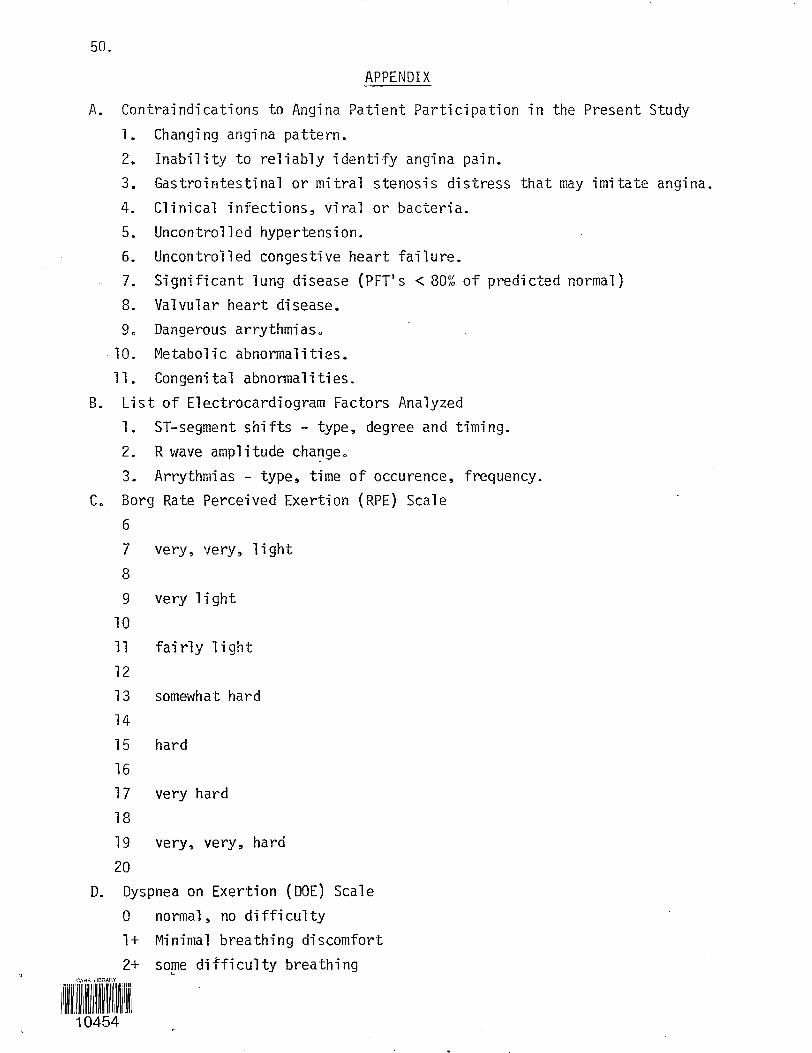
50.
APPENDIX
A. Contraindications to Angina Patient Participation in the Present Study
1. Changing angina pattern. 2. Inability to reliably identify angina pain.
3. Gastrointestinal or mitral stenosis distress that may imitate angina.
4. Clinical infections, viral or bacteria. 5. Uncontrolled hypertension. 6. Uncontrolled congestive heart failure. 7. Significant 1ung disease (PFT' s < 80~~ of predicted norma1)
8. Valvular heart disease. 9o Dangerous arrythmiaso
•10. Metabolic abnormalities. 11. Congenital abnonnalities.
B. List of Electrocardiogram Factors Analyzed l. ST-segment shifts - type, degree and timing.
2. R wave amplitude cha~geo 3. Arrythmias - type, time of occurence, frequency.
Co Borg Rate Perceived Exertion (RPE) Scale
6
7 very, very, light
8
9 very 1 i ght
10 11 fairly light
12
13 somewhat hard
14
15 hard
16
17 very hard
18
19 very, very, hard
20
D. Dyspnea on Exertion (DOE) Scale O normal, no difficulty l+ Minimal breathing discomfort
2+ so~e difficulty breathing
1111111 l~l~\11\1~11~11\11111\ 10454

51.
3+ very difficult to breathe, but can continue to exercise 4+ must stop due to lack of breath
E. Angina Pain (AP) Scale l+ Minimal pain, some degree of uncertainty regarding its presence 2+ Clear cut pain, but tolerable 3+ Pain severe enough to cease activity 4+ unacceptable pain
F. Summary of Patients Smoking History
Subj. Smoking History l Never 2 Quit 2 yrs before; formerly smoked l pack of cigarettes per day
for 30 yrs.
3 Quit 10 yrs before; formerly smoked 4 packs of cigarettes per day for 40 yrs.
4 Quit 11 yrs before; formerly smoked 1-2 packs of cigarettes per day for 30 yrs.
5 Quit 5 yrs before; formerly smoked ½-1 pack of cigarettes per day for 40 yrs.
6 Never
----
5'2.
G" Subjective Symptom Report
Exposure date: Time:
Subject:
We would like you to assist in our evaluation of the effects of ozone inhalation on human subjects performing exercise. This you can provide by noting below: l) Which symptoms you noticed during your exercise today. 2) Designating your own subjective feeling of the severity of these disturbances, and 3) Logging (to your recollection) an approximate time of onset. In addition, you are requested to rate the difficulty of today's testing compared to the others (if any) of this experiment which you participated in.
Symptom No Yes (subjective description)
Time of Onset (min into exposure)
Shortness of breath Cough
Excessive sputum Throat tickle Raspy throat Wheezing Congestion Headache Nausea Dizziness Chest pain (angina) Other (please describe briefly)
v's experiment involve ozone inhalation? ppm