Embed Size (px)
Citation preview
Effects of Personality Distribution on Collective Behavior
Brent E. Eskridge1 and Ingo Schlupp2
1Southern Nazarene University, Bethany, OK 730082University of Oklahoma, Norman, OK 73019
Abstract
Optimizing group success is challenging for multi-robot sys-tems, especially for large systems such as robot swarmswhere even simple individual interaction rules can lead tocomplex group behavior. Studies of natural systems haveshown that heterogeneous groups can outperform homoge-neous groups, especially when individual differences lead torole or niche specialization. This happens even when the indi-viduals are seemingly identical. Although individuals withina group may appear physically identical, they can vary widelyin their personality, which significantly affects their behavior.However, determining the most effective composition of per-sonalities in a group is particularly difficult in natural systemsgiven the ambiguities of animal personalities and the physi-cal challenges of repeated evaluations. Using a biologically-based collective movement model, we evaluate different per-sonality distributions to determine their effect on the overallsuccess of the group. Results show that although there aredistributions that are clearly more effective than others, inmany cases, there is a broad range of distributions that re-sults in high group success. Furthermore, experiments usingvariable, or adaptive, personalities demonstrate that success-ful distributions are stable equilibriums as initially extremedistributions converge to these successful distributions as per-sonalities change.
IntroductionIn many robot swarms, individuals within the swarm are as-sumed to be heterogeneous, especially, and perhaps mostimportantly, with respect to their decision-making. In fact,heterogeneity is argued to be a requirement for a multi-robotsystem even to be considered a swarm (Sahin, 2005). Vari-ations in either morphology or decision-making can presentsignificant challenges given the complexities that arise asrobots interact. However, such differences can also providesignificant benefits (Couzin et al., 2005).
While most work involving these benefits focuses on mor-phological differences, of particular interest here are differ-ences in the decision-making process, especially those thatare adaptive. The ability for individuals in a group to adapttheir decision-making to improve group-level performanceis key to the usefulness of multi-robot systems in dynamic,real-world tasks. Recent research in animal groups has
shown that such systems exist in nature. Animals are knownto exhibit sets of correlated traits referred to as personali-ties, that in part, determine their behavior (Sih et al., 2004).Furthermore, these personalities are known to change in re-sponse to both individual experiences and the distributionof personalities in the overall group (Dall et al., 2004; Mon-tiglio et al., 2013). As such, animal personalities can provideinspiration as a means of integrating adaptive individual dif-ferences within a group to improve performance. Further-more, we have previously shown that using a simple mech-anism to introduce personality into a collective movementmodel can result in a significant increase in success (Es-kridge et al., 2013). However, it is not well understood howthe distribution of personalities affects group performance,nor how stable effective personality distributions are.
In the work presented here, we use a biologically-basedcollective movement model to explore how distribution ofpersonalities, especially as they pertain to leaders and fol-lowers, affects the overall success of the group in initiatinga movement. Simulations demonstrate that, for many of thegroups evaluated, there is a wide range of personality dis-tributions that results in high group success. Furthermore,the results demonstrate that these successful distributions arestable equilibriums. This is indicated not only by the widerange of successful distributions, but also by additional ex-periments using variable personalities in which extreme per-sonality distributions converge to the more successful distri-butions as personalities change.
Related WorkAnimal personalities are the focus of much recent researcheffort (Sih et al., 2004; Wolf et al., 2007). Personalities referto correlated behavioral traits in animals that are frequentlyfound together such as an insensitivity to social informationand an increased likelihood of leaving the safety of coverto forage for food. The most commonly studied personal-ity traits lie along the bold-shy continuum and have beenobserved in a variety of animal species (Frost et al., 2007;Harcourt et al., 2009b). Of particular interest to the workpresented here is the fact that individuals with bold person-
ALIFE 14: Proceedings of the Fourteenth International Conference on the Synthesis and Simulation of Living Systems

alities are frequently leaders of collective behavior, whileshy individuals are frequently followers (Dyer et al., 2009;Harcourt et al., 2009a; Kurvers et al., 2009, 2011). Personal-ities are known to be shaped by experience through mecha-nisms such as winner and loser effects (Hsu et al., 2006). Inone case, bold losers became shyer and shy winners becamebolder (Frost et al., 2007).
Personality differences between individuals can lead todifferentiation in roles within a group. The combinationof different personalities within a group and the associatedroles assumed by different members have been found to im-prove the overall success of the group (Couzin et al., 2005;Dyer et al., 2009; Modlmeier and Foitzik, 2011; Modlmeieret al., 2012). Studies have shown that these personalitydifferences can be stable and maintained over time (Dallet al., 2004; Oosten et al., 2010). One explanation for themaintenance of personality differences is through niche rolespecialization (Montiglio et al., 2013), with some theoriz-ing that specialization occurs at the genetic level (Montiglioet al., 2013; Nonacs and Kapheim, 2007).
Although these personality differences are known to con-fer benefits to group performance, the effects of the distri-bution of these personalities within a group on that perfor-mance are not well understood. This is in part due to thecomplexity of the interactions between individual person-alities, including the effects on group behavior through in-dividual personalities (Magnhagen and Staffan, 2005; Coteet al., 2011) and the effects on individual behaviors by grouppersonality (Cote et al., 2011). Furthermore, it is difficultto precisely measure the distribution of individual person-alities in a group. In fact, few studies even report the spe-cific distribution of personalities. Distributions that are re-ported consist of groups that are either randomly createdin the lab (Magnhagen and Staffan, 2005), are drawn fromenvironments that have unique fitness effects on personali-ties (Magnhagen, 2006), or do not classify personalities asbold and shy (David et al., 2011). While some studies haveconstructed groups with artificial personality distributions toevaluate the effects of different compositions (Sih and Wat-ters, 2005; Pruitt et al., 2013), most did not systematicallyevaluate a range of different personality distributions to di-rectly test the effects on overall group performance. How-ever, Pruitt and Keiser (2014) recently observed that spidercolony success in collective foraging was tied to the degreeto which a leader is bold. Their results indicate that evenwhen the number of bold and shy individuals were kept con-stant, groups were more successful when the difference be-tween bold and shy personalities was large.
MethodsThe simulations used for this work were performed using amodified version of a collective movement model developedthrough observations of collective movement attempts in agroup of white-faced capuchin monkeys (Gautrais, 2010;
Petit et al., 2009), and was later confirmed in observationsof sheep (Pillot et al., 2011). The model could be classi-fied as a probabilistic finite state machine (PFSM) (Bram-billa et al., 2013) and uses anonymous quorum-sensing todetermine the rates of collective movement decisions. Theanonymous quorum-sensing nature of the model means thatleaders, whether successful or unsuccessful, cannot be rec-ognized as such, and decision-making must rely on the num-ber of participating individuals only. Despite being a col-lective movement model, actual movement through an en-vironment is not a part of the model. Rather, the focus ofthe model is on the decision-making process that precedesa movement. Examples of such situations are found in na-ture where individuals exhibit notifying behaviors indicatinga preferred direction of movement during a predeparture pe-riod (Pyritz et al., 2011).
Collective Movement ModelThe collective movement model uses three rules to governthe decision-making process involved in starting collectivemovements (Petit et al., 2009; Gautrais, 2010). The first ruleassumes that all individuals within the group can initiate acollective movement attempt with a constant rate of 1/!o,with !o = 1290. While this assumption may not hold forgroups with dominant leaders, studies have shown that it isa viable assumption for egalitarian animal groups, such asthe capuchin monkeys used in the model’s development androbot swarms (Brambilla et al., 2013).
The second rule describes the rate at which followers jointhe collective movement attempt and is calculated by 1/!r.The time constant !r for the following rate is calculated us-ing the following:
!r = "f + #fN ! r
r(1)
where "f = 162.3 and #f = 75.4 are constants determinedthrough direct observation, N is the number of individuals inthe group, and r is the number of individuals following theinitiator. As the number of individuals following the initiatorincreases, the rate at which individuals decide to join themovement also increases.
Not all initiation attempts are successful as initiators oftencancel and return to the group. The third rule calculates thiscancellation rate using the following:
Cr ="c
1 + (r/$c)!c(2)
where "c = 0.009, $c = 2.0, and %c = 2.3 are constants de-termined through direct observation, and r is the number ofindividuals following the initiator. Simulations of the modelinclude the implicit assumption that a successful collectivemovement requires all of the members of the group to partic-ipate since there is a non-zero probability of canceling even
ALIFE 14: Proceedings of the Fourteenth International Conference on the Synthesis and Simulation of Living Systems

if all but one member participates. While this is not neces-sarily the case in nature, cohesive collective movements arethe primary objective of this work and, as such, incompletemovements are considered failures.
Integrating Personality
As with our previous work (Eskridge et al., 2013), person-ality was incorporated into the collective model using anindividual-specific value referred to as a “k factor” (Gau-trais, 2010). In the original model, this value was a constantand was used to investigate the effects of altering the rate atwhich individuals initiate, follow, and cancel. With the ad-dition of the k factor, initiation attempts are calculated at theconstant rate of k/!o, and the following and canceling ratecalculations are calculated as follows:
!r =1
k
!"f + #f
N ! r
r
"(3)
Cr = k
!"c
1 + (r/$c)!c
"(4)
where the variables are defined as before. Since this k fac-tor can either increase or decrease the three decision-makingrates, it was an ideal means of incorporating the effects ofpersonality into the model.
Three important points were considered in integratingpersonality with the collective movement model. First, per-sonality has been observed in natural systems to affect theevents used in this model in different ways. For example, abold personality should result in a higher initiation rate andlower following and canceling rates, while a shy personalityshould result in a lower initiation rate and higher followingand canceling rates (Harcourt et al., 2009a). Second, themagnitude with which a shy personality affects the modelshould be the same as a bold personality so as not to biaseffects of one personality value over another. Since k hada non-inclusive lower limit of zero, the non-inclusive upperlimit of two was chosen to ensure balance. In the simula-tions described below, personalities used to calculate k werelimited to the range [0.1, 0.9] to ensure these limits were sat-isfied. Lastly, although neither the original model nor theobservations on which the model was based, discuss person-ality of the individual animals involved one can assume thatthe individuals could be classified as having either bold orshy personalities. Therefore, the integration of personalityincorporated the concept of a moderate personality (p = 0.5)which produced the same equations as the original model.Larger personality values were interpreted as bolder person-alities (e.g., p = 0.9) and smaller values were interpreted asshyer personalities (e.g., p = 0.1). To accentuate the effectsof even minor differences in personality in values close to amoderate personality and minimize the effects of differencesin extreme personalities, a personality p was converted to a
corresponding k value using the following sigmoid function:
k = 2#1 + e
0.5!p"10
$!1
(5)
where p" is p for initiating and is 1!p for canceling and fol-lowing. Although different parameter values could be cho-sen for each decision, the choice of a single parameter wasmade to avoid over-complicating the model.
Winner and loser effects are feedback mechanisms inwhich experience affects future success. They sometimesexist as a self-assessment mechanism that affects an individ-ual’s perception of its own abilities to the point where it canalter behavior without any actual change in ability (Fawcettand Johnstone, 2010). This self-assessment was incorpo-rated into the model by updating the initiator’s personalityafter every initiation attempt using the following standardupdate (or learning) rule (Bernstein et al., 1988; Katsnelsonet al., 2012; Sutton and Barto, 1998):
pt+1 = pt(1! &) + &r (6)
where pt was the initiator’s personality before the move-ment, pt+1 was the personality after the movement, & wasthe rate at which updates changed the personality, and rwas the reinforcement value used to update the personality.When & was low, the personality was primarily determinedthrough long-term historical success and changes were mi-nor. When & was high, the personality was primarily deter-mined through short-term success, namely the last initiationattempt, and changes from one attempt to the next were sig-nificant. For the simulations described here, a low value oflambda was chosen (& = 0.02) to emphasize long-term ini-tiation success. For successful initiations, the reinforcementwas r = 1, while it was r = 0 for unsuccessful initiations.
Numerical ImplementationNumerical simulations of the collective movement modelwere implemented in Java using a customized version1 ofthe original algorithm (Gautrais, 2010). The time of eachevent was calculated as a random number drawn from anexponential distribution using the appropriate rate equation.As such, the simulations used continuous time events andnot discrete time.
The original model was only evaluated with a group sizeof 10, but other work has shown that the success of collec-tive movement initiations increases as the group size is in-creased, with most success differences present in group sizesof 50 or less and diminishing effects beyond a group size of100 (Eskridge, 2012). To evaluate the effects of personal-ity distributions as the number of individuals is scaled up,experiments using group sizes of 10, 20, 30, 40, 50, and
1Simulation source code and data analysis scripts are avail-able for download from https://github.com/snucsne/bio-inspired-leadership.
ALIFE 14: Proceedings of the Fourteenth International Conference on the Synthesis and Simulation of Living Systems
Group Bold Bold SuccessSize Individuals Percentage Percentage10 2 20% 86.9%20 7 35% 91.7%30 12 40% 93.6%40 18 45% 94.4%50 21 42% 94.8%
100 44 44% 95.5%
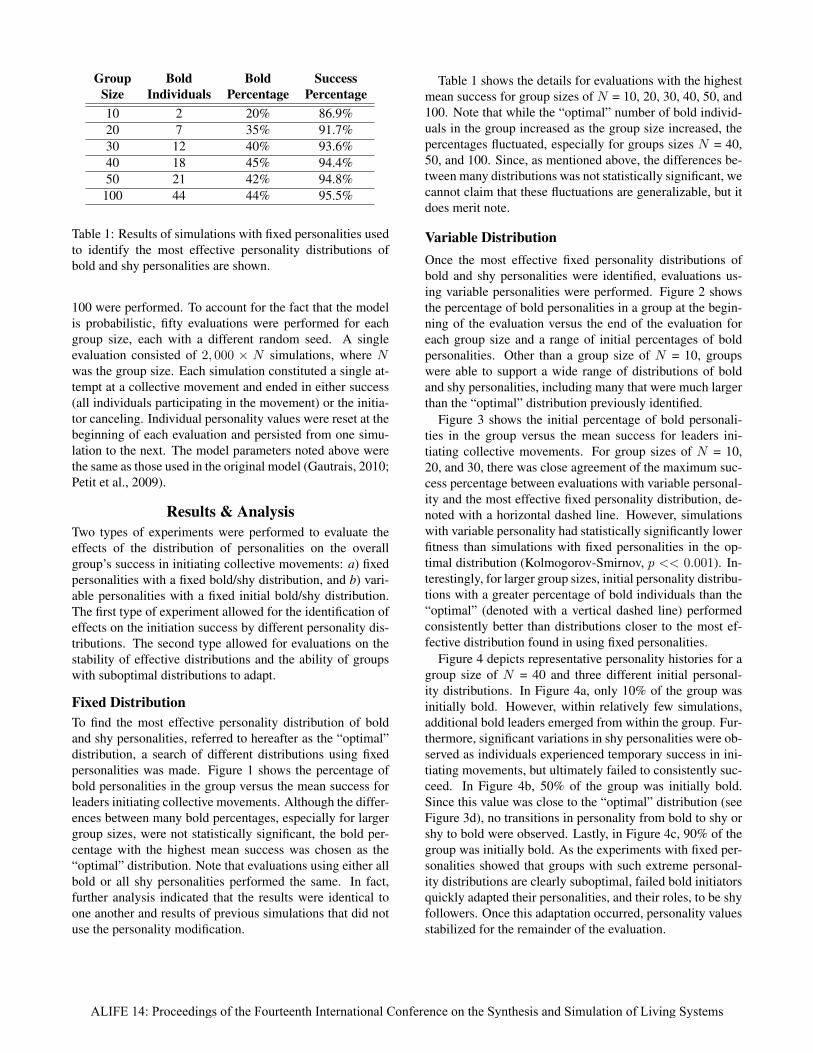
Table 1: Results of simulations with fixed personalities usedto identify the most effective personality distributions ofbold and shy personalities are shown.
100 were performed. To account for the fact that the modelis probabilistic, fifty evaluations were performed for eachgroup size, each with a different random seed. A singleevaluation consisted of 2, 000 " N simulations, where Nwas the group size. Each simulation constituted a single at-tempt at a collective movement and ended in either success(all individuals participating in the movement) or the initia-tor canceling. Individual personality values were reset at thebeginning of each evaluation and persisted from one simu-lation to the next. The model parameters noted above werethe same as those used in the original model (Gautrais, 2010;Petit et al., 2009).
Results & AnalysisTwo types of experiments were performed to evaluate theeffects of the distribution of personalities on the overallgroup’s success in initiating collective movements: a) fixedpersonalities with a fixed bold/shy distribution, and b) vari-able personalities with a fixed initial bold/shy distribution.The first type of experiment allowed for the identification ofeffects on the initiation success by different personality dis-tributions. The second type allowed for evaluations on thestability of effective distributions and the ability of groupswith suboptimal distributions to adapt.
Fixed DistributionTo find the most effective personality distribution of boldand shy personalities, referred to hereafter as the “optimal”distribution, a search of different distributions using fixedpersonalities was made. Figure 1 shows the percentage ofbold personalities in the group versus the mean success forleaders initiating collective movements. Although the differ-ences between many bold percentages, especially for largergroup sizes, were not statistically significant, the bold per-centage with the highest mean success was chosen as the“optimal” distribution. Note that evaluations using either allbold or all shy personalities performed the same. In fact,further analysis indicated that the results were identical toone another and results of previous simulations that did notuse the personality modification.
Table 1 shows the details for evaluations with the highestmean success for group sizes of N = 10, 20, 30, 40, 50, and100. Note that while the “optimal” number of bold individ-uals in the group increased as the group size increased, thepercentages fluctuated, especially for groups sizes N = 40,50, and 100. Since, as mentioned above, the differences be-tween many distributions was not statistically significant, wecannot claim that these fluctuations are generalizable, but itdoes merit note.
Variable DistributionOnce the most effective fixed personality distributions ofbold and shy personalities were identified, evaluations us-ing variable personalities were performed. Figure 2 showsthe percentage of bold personalities in a group at the begin-ning of the evaluation versus the end of the evaluation foreach group size and a range of initial percentages of boldpersonalities. Other than a group size of N = 10, groupswere able to support a wide range of distributions of boldand shy personalities, including many that were much largerthan the “optimal” distribution previously identified.
Figure 3 shows the initial percentage of bold personali-ties in the group versus the mean success for leaders ini-tiating collective movements. For group sizes of N = 10,20, and 30, there was close agreement of the maximum suc-cess percentage between evaluations with variable personal-ity and the most effective fixed personality distribution, de-noted with a horizontal dashed line. However, simulationswith variable personality had statistically significantly lowerfitness than simulations with fixed personalities in the op-timal distribution (Kolmogorov-Smirnov, p << 0.001). In-terestingly, for larger group sizes, initial personality distribu-tions with a greater percentage of bold individuals than the“optimal” (denoted with a vertical dashed line) performedconsistently better than distributions closer to the most ef-fective distribution found in using fixed personalities.
Figure 4 depicts representative personality histories for agroup size of N = 40 and three different initial personal-ity distributions. In Figure 4a, only 10% of the group wasinitially bold. However, within relatively few simulations,additional bold leaders emerged from within the group. Fur-thermore, significant variations in shy personalities were ob-served as individuals experienced temporary success in ini-tiating movements, but ultimately failed to consistently suc-ceed. In Figure 4b, 50% of the group was initially bold.Since this value was close to the “optimal” distribution (seeFigure 3d), no transitions in personality from bold to shy orshy to bold were observed. Lastly, in Figure 4c, 90% of thegroup was initially bold. As the experiments with fixed per-sonalities showed that groups with such extreme personal-ity distributions are clearly suboptimal, failed bold initiatorsquickly adapted their personalities, and their roles, to be shyfollowers. Once this adaptation occurred, personality valuesstabilized for the remainder of the evaluation.
ALIFE 14: Proceedings of the Fourteenth International Conference on the Synthesis and Simulation of Living Systems

Bold Percentage
Lead
ersh
ip S
ucce
ss
0% 25% 50% 75% 100%
0%
25%
50%
75%
100%
0%
25%
50%
75%
100%
(a) Group size N = 10
Bold Percentage
Lead
ersh
ip S
ucce
ss
0% 25% 50% 75% 100%
0%
25%
50%
75%
100%
0%
25%
50%
75%
100%
(b) Group size N = 20
Bold Percentage
Lead
ersh
ip S
ucce
ss
0% 25% 50% 75% 100%
0%
25%
50%
75%
100%
0%
25%
50%
75%
100%
(c) Group size N = 30
Bold Percentage
Lead
ersh
ip S
ucce
ss
0% 25% 50% 75% 100%
0%
25%
50%
75%
100%
0%
25%
50%
75%
100%
(d) Group size N = 40
Bold Percentage
Lead
ersh
ip S
ucce
ss
0% 25% 50% 75% 100%
0%
25%
50%
75%
100%
0%
25%
50%
75%
100%
(e) Group size N = 50
Bold Percentage
Lead
ersh
ip S
ucce
ss
0% 25% 50% 75% 100%
0%
25%
50%
75%
100%
0%
25%
50%
75%
100%
(f) Group size N = 100
Figure 1: Plots of the percentage of bold individuals in the group versus the mean percentage of successful initiations fordifferent group sizes in simulation treatments with fixed personalities and fixed distributions are shown. Horizontal and verticallines denote the “optimal” percentage of bold individuals and the resulting mean success, respectively.
Initial Bold
Fina
l Bol
d
10% 30% 50% 70% 90%
10%
30%
50%
70%
90%
10%
30%
50%
70%
90%
(a) Group size N = 10
Initial Bold
Fina
l Bol
d
10% 30% 50% 70% 90%
10%
30%
50%
70%
90%
10%
30%
50%
70%
90%
(b) Group size N = 20
Initial Bold
Fina
l Bol
d
10% 30% 50% 70% 90%
10%
30%
50%
70%
90%
10%
30%
50%
70%
90%
(c) Group size N = 30
Initial Bold
Fina
l Bol
d
10% 30% 50% 70% 90%
10%
30%
50%
70%
90%
10%
30%
50%
70%
90%
(d) Group size N = 40
Initial Bold
Fina
l Bol
d
10% 30% 50% 70% 90%
10%
30%
50%
70%
90%
10%
30%
50%
70%
90%
(e) Group size N = 50
Initial Bold
Fina
l Bol
d
10% 30% 50% 70% 90%
10%
30%
50%
70%
90%
10%
30%
50%
70%
90%
(f) Group size N = 100
Figure 2: The mean percentage of bold personalities at the end of 2000 "N simulations with variable personalities and fixedinitial distributions are shown (mean/SD). Error bars representing the standard deviation are also plotted, but are often too smallto see. Horizontal lines denote the most effective bold personality percentage found during fixed personality evaluations.
ALIFE 14: Proceedings of the Fourteenth International Conference on the Synthesis and Simulation of Living Systems

Initial Bold
Lead
ersh
ip S
ucce
ss
10% 30% 50% 70% 90%
50%
60%
70%
80%
90%
100%
50%
60%
70%
80%
90%
100%
(a) Group size N = 10
Initial Bold
Lead
ersh
ip S
ucce
ss
10% 30% 50% 70% 90%
50%
60%
70%
80%
90%
100%
50%
60%
70%
80%
90%
100%
(b) Group size N = 20
Initial Bold
Lead
ersh
ip S
ucce
ss
10% 30% 50% 70% 90%
50%
60%
70%
80%
90%
100%
50%
60%
70%
80%
90%
100%
(c) Group size N = 30
Initial Bold
Lead
ersh
ip S
ucce
ss
10% 30% 50% 70% 90%
50%
60%
70%
80%
90%
100%
50%
60%
70%
80%
90%
100%
(d) Group size N = 40
Initial Bold
Lead
ersh
ip S
ucce
ss
10% 30% 50% 70% 90%
50%
60%
70%
80%
90%
100%
50%
60%
70%
80%
90%
100%
(e) Group size N = 50
Initial Bold
Lead
ersh
ip S
ucce
ss
10% 30% 50% 70% 90%
50%
60%
70%
80%
90%
100%
50%
60%
70%
80%
90%
100%
(f) Group size N = 100
Figure 3: Plots of the percentage of bold individuals in the group versus the mean percentage of successful initiations fordifferent group sizes in simulation treatments with variable personalities and fixed initial distributions are shown (mean/SD).Error bars representing the standard deviation are also plotted, but are often too small to see. Horizontal and vertical linesdenote the “optimal” percentage of bold individuals and the resulting mean success, respectively.
0 20000 40000 60000 80000
Attempts
Pe
rso
na
lity
0.0
0.2
0.4
0.6
0.8
1.0
Shy
Mo
de
rate
Bo
ld
(a) Initial bold 10%
0 20000 40000 60000 80000
Attempts
Pe
rso
na
lity
0.0
0.2
0.4
0.6
0.8
1.0
Shy
Mo
de
rate
Bo
ld
(b) Initial bold 50%
0 20000 40000 60000 80000
Attempts
Pe
rso
na
lity
0.0
0.2
0.4
0.6
0.8
1.0
Shy
Mo
de
rate
Bo
ld
(c) Initial bold 90%
Figure 4: Representative histories of individual variable personalities and the resulting distribution of personalities are shownfor a group size of N = 40 and three different initial personality distributions.
Discussion
These results allow us to identify three significant contri-butions. First, as has been observed both in natural sys-tems (Sih and Watters, 2005; Modlmeier and Foitzik, 2011)and in previous research using artificial systems (Pinter-Wollman, 2012), groups containing a combination of boldand shy personalities performed statistically significantlybetter than groups consisting of a single personality type(see Figure 1). Although the success rate of movement ini-tiations varied with group composition, with some distribu-
tions having significantly higher success than others, theseresults indicate that there is a broad range of effective distri-butions of bold and shy personalities that have comparablyhigh performance. However, note that these effective dis-tributions do not include moderate personalities, as all in-dividuals were either bold or shy. While this is consistentwith observations in nature which indicate that larger differ-ences between bold and shy personalities result in increasedsuccess (Pruitt and Keiser, 2014), the lack of moderate per-sonalities is most likely the result of the personality updaterule. For a moderate personality to be stable, it must succeed
ALIFE 14: Proceedings of the Fourteenth International Conference on the Synthesis and Simulation of Living Systems

as often as it fails. However, this is unlikely since a bolderthan average personality is more likely to succeed and be-come bolder, while a shyer than average personality is morelikely to fail and become shyer.
Second, as a result of this broad range of effective distri-butions, we conclude that the high performing personalitydistributions are stable equilibriums between bold and shypersonalities, much like other stable distributions observedin nature (Mottley and Giraldeau, 2000). This conclusionis further reinforced by simulations using variable personal-ity in which initially extreme personality distributions (e.g.,10% or 90% bold personalities) converged to higher per-forming distributions (see Figure 2).
One particularly interesting result is that the final distri-bution of personalities was dependent on the initial distri-bution. If the final distribution of bold and shy personalitieswas independent of the initial distribution, one would expectthe plots in Figure 2 to be relatively horizontal lines. This ismost likely due to the broad range of effective distributionsshown in Figure 1 and the lack of sufficient pressure to reachthe optimal distribution. Furthermore, when one considersthat either consistent initiation success or failure is requiredto transition a personality from shy to bold or bold to shy,achieving the optimal distribution of personalities appearseven less likely.
Lastly, it was surprising that a relatively large percentageof bold leaders (approximately 70%) was supported in manygroups. At first glance, this result is counterintuitive giventhe effects of bold and shy personalities on the collectivemovement model and the general perception that such a per-centage is “too high.” However, these results indicate that abold leader only needs to recruit a sufficient number of shyfollowers to prevent a quick cancellation of the movement.Once a critical number of followers had joined the move-ment, other bold individuals joined the movement beforethe initiator canceled. In the bigger picture, a large percent-age of bold leaders can promote higher group success. Withmore bold leaders, it is more likely that a bold individual ini-tiates first, thus increasing the chances of a successful move-ment. Given that there are observations of animal groupswith both lower (Harcourt et al., 2009b) and higher (Magn-hagen, 2006; Sinn et al., 2008) percentages of bold individ-uals, no general conclusions regarding the relative frequen-cies of each personality type can be drawn. Current simu-lations allow for multiple initiations in a group, which mayaffect the percentage of bold leaders supported in a group.
Conclusions and Future WorkAs discussed above, there are three significant conclusionsthat can be drawn from this work. First, these results showthat groups with personality distributions containing a com-bination of bold and shy personalities perform at a higherlevel than those having a single personality type. In many
cases, groups with a combination of personalities had al-most twice the success in initiating collective movementsas single personality groups. Second, these high performingpersonality distributions were stable equilibriums, as is seenin the simulations with variable personality when initiallyextreme distributions converge towards the higher perform-ing personality distributions after relatively few simulations.Finally, these results show there is a wide range of effectivepersonality distributions, with some groups supporting up to70% of the group being bold leaders.
This work represents but one aspect of a larger researcheffort. The most significant opportunity for future work isto incorporate these results into simulations involving actualmovement. Such simulations would provide a number ofreal-world constraints that may affect the personality distri-butions discussed in this work, including such things as lo-cal communication, dynamic communication networks, andconflicts of interest. Another avenue of investigation wouldbe into the lack of moderate personalities in the results. Sta-ble, moderate personalities are observed in natural systems,but in these simulations, personalities diverge into distinctlyextreme bold and shy personalities. Possible reasons for thisinclude the personality function used (see Equation 5) or thecollective movement model itself.
AcknowledgmentsThis material is based upon work supported by the NationalScience Foundation under Grant No. BCS-1124837.
ReferencesBernstein, C., Kacelnik, A., and Krebs, J. (1988). Individual de-
cisions and the distribution of predators in a patchy environ-ment. The Journal of Animal Ecology, 57(3):1007–1026.
Brambilla, M., Ferrante, E., Birattari, M., and Dorigo, M. (2013).Swarm robotics: a review from the swarm engineering per-spective. Swarm Intelligence, 7(1):1–41.
Cote, J., Fogarty, S., Brodin, T., Weinersmith, K., and Sih,A. (2011). Personality-dependent dispersal in the invasivemosquitofish: group composition matters. Proceedings of theRoyal Society B: Biological Sciences, 278(1712):1670–1678.
Couzin, I. D., Krause, J., Franks, N. R., and Levin, S. A. (2005).Effective leadership and decision-making in animal groupson the move. Nature, 433(7025):513–516.
Dall, S. R., Houston, A. I., and McNamara, J. M. (2004). Thebehavioural ecology of personality: consistent individual dif-ferences from an adaptive perspective. Ecology Letters,7(8):734–739.
David, M., Auclair, Y., and Cezilly, F. (2011). Personality predictssocial dominance in female zebra finches, Taeniopygia gut-tata, in a feeding context. Animal Behaviour, 81(1):219–224.
Dyer, J. R., Croft, D. P., Morrell, L. J., and Krause, J. (2009). Shoalcomposition determines foraging success in the guppy. Be-havioral Ecology, 20(1):165–171.
ALIFE 14: Proceedings of the Fourteenth International Conference on the Synthesis and Simulation of Living Systems

Eskridge, B. E. (2012). Effects of local communication and topol-ogy on collective movement initiation. In International Con-ference on the Simulation and Synthesis of Living Things, vol-ume 13, pages 155–162.
Eskridge, B. E., Valle, E., and Schlupp, I. (2013). Using experienceto promote the emergence of leaders and followers. In Eu-ropean Conference on Complex Systems. Complex SystemsSociety.
Fawcett, T. W. and Johnstone, R. A. (2010). Learning your ownstrength: winner and loser effects should change with age andexperience. Proceedings of the Royal Society B: BiologicalSciences, 277(1686):1427–1434.
Frost, A., Winrow-Giffen, A., Ashley, P., and Sneddon, L. (2007).Plasticity in animal personality traits: does prior experiencealter the degree of boldness? Proceedings of the Royal Soci-ety B: Biological Sciences, 274(1608):333–339.
Gautrais, J. (2010). The hidden variables of leadership. Be-havioural Processes, 84(3):664–667.
Harcourt, J. L., Ang, T. Z., Sweetman, G., Johnstone, R. A., andManica, A. (2009a). Social feedback and the emergence ofleaders and followers. Current Biology, 19(3):248–252.
Harcourt, J. L., Sweetman, G., Johnstone, R. A., and Manica,A. (2009b). Personality counts: the effect of boldness onshoal choice in three-spined sticklebacks. Animal Behaviour,77(6):1501–1505.
Hsu, Y., Earley, R. L., and Wolf, L. L. (2006). Modulation of ag-gressive behaviour by fighting experience: mechanisms andcontest outcomes. Biological Reviews, 81(1):33–74.
Katsnelson, E., Motro, U., Feldman, M., and Lotem, A.(2012). Evolution of learned strategy choice in a frequency-dependent game. Proceedings of the Royal Society B: Bio-logical Sciences, 279(1731):1176–1184.
Kurvers, R., Eijkelenkamp, B., van Oers, K., van Lith, B., vanWieren, S., Ydenberg, R., and Prins, H. (2009). Personal-ity differences explain leadership in barnacle geese. AnimalBehaviour, 78(2):447–453.
Kurvers, R. H., Adamczyk, V. M., van Wieren, S. E., and Prins,H. H. (2011). The effect of boldness on decision-making inbarnacle geese is group-size-dependent. Proceedings of theRoyal Society B: Biological Sciences, 278(1714):2018–2024.
Magnhagen, C. (2006). Risk-taking behaviour in foraging young-of-the-year perch varies with population size structure. Oe-cologia, 147(4):734–743.
Magnhagen, C. and Staffan, F. (2005). Is boldness affected bygroup composition in young-of-the-year perch (Perca fluvi-atilis)? Behavioral Ecology and Sociobiology, 57(3):295–303.
Modlmeier, A. P. and Foitzik, S. (2011). Productivity increaseswith variation in aggression among group members in Tem-nothorax ants. Behavioral Ecology, 22(5):1026–1032.
Modlmeier, A. P., Liebmann, J. E., and Foitzik, S. (2012). Di-verse societies are more productive: a lesson from ants.Proceedings of the Royal Society B: Biological Sciences,279(1736):2142–2150.
Montiglio, P.-O., Ferrari, C., and Reale, D. (2013). Socialniche specialization under constraints: personality, social in-teractions and environmental heterogeneity. PhilosophicalTransactions of the Royal Society B: Biological Sciences,368(1618).
Mottley, K. and Giraldeau, L.-A. (2000). Experimental evidencethat group foragers can converge on predicted producer–scrounger equilibria. Animal Behaviour, 60(3):341–350.
Nonacs, P. and Kapheim, K. (2007). Social heterosis and the main-tenance of genetic diversity. Journal of Evolutionary Biology,20(6):2253–2265.
Oosten, J. E., Magnhagen, C., and Hemelrijk, C. K. (2010). Bold-ness by habituation and social interactions: a model. Behav-ioral Ecology and Sociobiology, 64(5):793–802.
Petit, O., Gautrais, J., Leca, J.-B., Theraulaz, G., and Deneubourg,J.-L. (2009). Collective decision-making in white-faced ca-puchin monkeys. Proceedings of the Royal Society B: Bio-logical Sciences, 276(1672):3495–3503.
Pillot, M.-H., Gautrais, J., Arrufat, P., Couzin, I. D., Bon, R., andDeneubourg, J.-L. (2011). Scalable rules for coherent groupmotion in a gregarious vertebrate. PLoS ONE, 6(1):e14487.
Pinter-Wollman, N. (2012). Personality in social insects: How doesworker personality determine colony personality? CurrentZoology, 58(4):579–587.
Pruitt, J. N., Grinsted, L., and Settepani, V. (2013). Linking levelsof personality: personalities of the ’average’ and ’most ex-treme’ group members predict colony-level personality. Ani-mal Behaviour, 86(2):391–399.
Pruitt, J. N. and Keiser, C. N. (2014). The personality types of keycatalytic individuals shape colonies’ collective behaviour andsuccess. Animal Behaviour, 93:87–95.
Pyritz, L., King, A., Sueur, C., and Fichtel, C. (2011). Reachinga consensus: Terminology and concepts used in coordinationand decision-making research. International Journal of Pri-matology, 32(6):1268–1278.
Sahin, E. (2005). Swarm robotics: From sources of inspiration todomains of application. In Swarm robotics, volume 3342 ofLecture Notes in Computer Science, pages 10–20. Springer.
Sih, A., Bell, A., and Johnson, J. C. (2004). Behavioral syndromes:an ecological and evolutionary overview. Trends in Ecology& Evolution, 19(7):372–378.
Sih, A. and Watters, J. V. (2005). The mix matters: behaviouraltypes and group dynamics in water striders. Behaviour,142:1423–1437.
Sinn, D. L., Gosling, S. D., and Moltschaniwskyj, N. A. (2008).Development of shy/bold behaviour in squid: context-specificphenotypes associated with developmental plasticity. AnimalBehaviour, 75(2):433–442.
Sutton, R. S. and Barto, A. G. (1998). Reinforcement Learning: AnIntroduction. MIT Press.
Wolf, M., van Doorn, G. S., Leimar, O., and Weissing, F. J. (2007).Life-history trade-offs favour the evolution of animal person-alities. Nature, 447(7144):581–584.
ALIFE 14: Proceedings of the Fourteenth International Conference on the Synthesis and Simulation of Living Systems