Embed Size (px)
Citation preview

Journal of Sports Science 5 (2017) 1-13
doi: 10.17265/2332-7839/2017.01.001
Effects of Plyometric and Explosive Speed Training on
Recreational Marathoners
Christopher J. Lundstrom1, Morgan R. Betker
1 and Stacy J. Ingraham
2
1. School of Kinesiology, University of Minnesota-Twin Cities, Minneapolis, MN 55455, USA
2. Mathematics and Science Department, Crown College, St. Bonifacius, MN 55375, USA
Abstract: BACKGROUND: Plyometric training has been shown to improve performance in distance running events up to 5-km, but
little research has been done on this type of training for marathon (42.195-km) runners. The purpose of this study was to examine the
effects of plyometric and explosive speed training (PLYO) on recreational marathoners. METHODS: Twenty-two subjects (ages
18-23), were randomized to either PLYO or core training (CORE) for a weekly session performed for 12 weeks, in addition to marathon
training. Sprint, jump, and distance running performance variables were measured pre- and post-intervention. RESULTS: In the sprint
tests, the PLYO group improved in both the 200-m run (P ≤ 0.001) and 60-m run (P = 0.004), and trended toward improvement in the
30-m fly (P = 0.051). The difference from CORE was significant only in the 200-m (P = 0.002). The CORE group did not change in any
of the sprint or jump variables. The PLYO group was significantly different from the CORE group in the standing long jump (P =
0.024). There were no differences between groups in distance running performance. Both improved in 2-mile (3.219-km) time trial (p ≤
0.001), VO2MAX (P = 0.026 for CORE; P = 0.002 for PLYO), and running economy (P = 0.01). CONCLUSION: Weekly PLYO
training improves sprint speed and maintains jumping ability in recreational marathoners, but does not augment improvements in
distance running performance.
Key words: Explosive training, jumps training, endurance performance, concurrent training, core training.
1. Introduction
Plyometric training consists of high velocity
movements performed in rapid succession, with a
lengthening (or eccentric) muscle contraction followed
quickly by a shortening (concentric) contraction [1].
The most common application of plyometrics is jump
training, which consists of sets of jumps, skips,
bounding and hops performed with maximal effort and
high velocity. Plyometric training is commonly utilized
by athletes in sports where jumping and explosive
lower body movements are important. Short-duration
studies suggest that plyometric training can enhance
muscular and neuromuscular function, thereby
improving lower limb strength, power and speed [2].
Sprint training (or explosive speed training), which has
been shown to increase sprint speed, consists of
Corresponding author: Christopher J Lundstrom, Ph.D.,
teaching specialist, research field: distance running
performance.
maximal velocity running efforts of 15 seconds or less
with full recovery between repetitions [3].
Explosive speed and plyometric training may have
benefits for distance runners. Plyometric training has
been shown to improve running economy (RE) and
performance in races up to 5-km in length, as well as
performance on a number of lower limb power tests in
competitive runners [4-10]. Recreational runners may
improve RE with a relatively low intensity and volume
plyometric program, with no changes in VO2MAX or
jump height and efficiency [11]. Explosive speed
training improves muscle conduction velocity, an
indicator of neuromuscular function linked closely
with sprint speed [12]. Both heavy and explosive
strength training can improve performance and RE in
distance runners [13].
The effects of plyometric and explosive speed
training on recreational runners training for a marathon
are not known. This population is unique, in that highly
D DAVID PUBLISHING
Effects of Plyometric and Explosive Speed Training on Recreational Marathoners
2
demanding aerobic training is required of
non-competitive, non-elite, and often relatively
inexperienced runners. Marathon training may have a
detrimental effect on muscle function, strength, and
power [14]. However, with effective training and a
proper taper, muscle strength and power can be
maintained or even improved [15]. Habitual exposure
to endurance training at heavy loads has been
postulated to lead to chronic, irreversible muscle
damage in some athletes [16, 17]. Higher intensity
forms of training may be effective in maintaining or
improving muscle function [1, 4, 5, 7, 10], which has
implications related not only to performance, but also
to long-term health [18].
Core training, which is widely practiced by runners
and other athletes, does not appear to improve running
performance or RE [19]. It is often utilized for
purported injury prevention benefits by athletes, and
while the evidence for this is minimal, a core training
group provides a useful, ecologically-valid control
group for a randomized-controlled trial. In this study,
the use of a core group as a control allowed for
matching of training time; both groups did muscular
strengthening exercises, but only the plyometric group
utilized high velocity and eccentric-overload exercises.
A wide range of physiological, anthropomorphic, and
training factors have been identified as related to
marathon finish time [20, 21]. The effects of high
intensity forms of training on a recreational population is
germane given the recent trend among these types of
athletes toward participation in intense forms of training.
Thus, the purposes of this study were: (1) to determine
the effects of plyometric and explosive speed training on
sprint speed and jumping ability in college-aged
recreational runners engaged in a marathon training
program, and (2) to determine whether the effects would
transfer to distance running performance.
2. Materials and Methods
2.1. Study Design
The study was a 12 week exercise intervention
utilizing a randomized-controlled parallel group design.
One group did plyometric and explosive speed (PLYO)
training, and the other did core stability (CORE)
training. The outcomes assessed were sprint and jump
performance—including vertical jump (VJ), 60-m run
(60M), 200-m run (200M), flying 30-m run (30FLY),
10-bound test (10BD), and standing long jump
(SLJ)—and distance running performance, including
2-mile (3.219-km) time trial (2MI), a standard
42.195-km marathon (MARA), VO2MAX, body mass
(BM), running economy (RE) and respiratory
exchange ratio (RER). Pre-testing was done in the
week prior to the commencement of the intervention.
Post-testing was completed within a week of the final
training session. The VO2MAX test was done slightly
earlier, both pre- and post-intervention.
2.2. Participants
Healthy young adults enrolled in a marathon training
course were recruited by a study coordinator via email.
Inclusion criteria were: enrollment in a university
marathon training course, which required a physical
and physician’s approval to train for and complete a
marathon; willingness to commit to an extra 15-20
minute training session once per week and to be
randomized into one of two exercise groups.
Exclusion criteria were any pre-existing conditions,
such as a muscle or tendon injury, history of injury, or
any other health condition that would indicate against
the completion of either the PLYO or CORE protocol.
Information sessions were conducted and consent was
obtained prior to any testing or training sessions. All
procedures and protocols were approved by the
Institutional Review Board at the University of
Minnesota.
A total of 26 subjects were enrolled and randomized,
with block randomization (groups of 4) carried out
separately for males and females in order to achieve
balanced allocation. Two subjects, one from each
group, dropped the course within the first month and
were excluded from the study. A

Effects of Plyometric and Explosive Speed Training on Recreational Marathoners
3
quasi-intention-to-treat analysis was done, with one
subject from each group excluded from the analysis
due to missing over half of the sessions for reasons
unrelated to training or health. One subject in the
PLYO group missed over half of the sessions, but cited
knee pain as the reason for not wanting to complete the
rest of the training sessions. She was included in the
spirit of an intention-to-treat analysis. Subjects in the
two groups did not differ in age, training sessions
completed, or total mileage for the marathon training
period. Descriptive data are shown in Table 1.
2.3. Procedures
2.3.1. Training
Training sessions consisted of one 15-20 minute
workout per week. While many studies on distance
runners have utilized 2-3 sessions of plyometric
training per week [4, 5, 7, 8, 10], relatively infrequent
training sessions appear to be effective at least for
women [22]. The training protocol was low to
moderate in volume, and was consistent with what has
been previously utilized for less experienced
populations [11, 23]. The workouts for the two groups
were matched for time to complete the training. For
both groups, the additional training was progressive in
nature, beginning with a lower number of repetitions
and sets, and increasing gradually over the course of
the training program.
Training sessions were conducted after a Wednesday
class session that included a run of approximately 40
minutes of varying intensity, predetermined by the
marathon training program. Upon returning from the
run, subjects had 10-15 minutes to recover. Sessions
were supervised by research staff. Subjects were
encouraged to complete all training sessions and
exercises if possible, but were advised to stop if an
exercise caused sharp pain, injury or excessive
discomfort. Subjects who missed part or all of a
training session were asked to report their reason. The
primary supervisor of the PLYO group was a jumps
coach for a local college track & field team, and the
primary supervisor of the CORE group had several
years of experience as a strength and conditioning
coach. Research staff provided demonstration,
instructions, and assistance with proper form and safe
execution of exercises.
Both groups performed 6 exercises per session, with
the specific exercises alternating weekly. The PLYO
exercises involved maximal effort, high velocity
jumping and sprinting, with 1-3 sets of 8-20 reps per
exercise in the case of the jumping exercises, and 2-4
reps of the sprinting exercises. Specifics of the PLYO
protocol are shown in Table 2. The CORE exercises
focused on abdominal, back, hip, and gluteal
strengthening, and were performed at slow to moderate
velocity. The CORE exercises consisted of 1-3 sets of
10-30 reps per exercise or 30-60 seconds for the
isometric exercises, as shown in Table 3. For both
groups, all exercises were performed with body weight
only, with no external resistance or assistance.
Approximately one minute of recovery was given
between all sets and exercises, with more recovery time
allowed.
The marathon training program performed by both
groups consisted of a 5 month progressive build-up of
mileage. Included in the 5 month build-up, subjects
underwent 6 weeks of training prior to the study, which
served as a run-in period and allowed standardization
Table 1 Descriptive data of subjects by group.
PLYO CORE
N 11 11
Sex 7F, 4M 5F, 6M
Age (years) 20.8 ± 1.3 19.8 ± 1.3
Running volume (km) 805 ± 158 763 ± 185
Training sessions 10.6 ± 2.0 10.8 ± 1.5
Age, volume, and training sessions are reported as means ± S.D.

Effects of Plyometric and Explosive Speed Training on Recreational Marathoners
4
Table 2 PLYO training protocol.
SPR SPR SPR SPR HOR HOR HOR HOR HOR VERT VERT VERT VERT
Sess 50 BLD 30 FLY 60 SPR INO FH ALB S.Leg FH Lat. CJ F/B CJ SJ SSJ DJ BJ
1 2 2 1 × 10 2 × 10 1 × 8 1 × 10
2 2 2 1 × 10 1 × 10 1 × 10 1 × 8
3 3 3 2 × 8 2 × 15 1 × 12 2 × 8
4 3 3 1 × 15 1 × 15 2 × 8 1 × 12
5 3 3 2 × 10 2 × 20 2 × 10 2 × 10
6 3 3 2 × 10 2 × 10 2 × 10 1 × 15
7 4 4 2 × 15 3 × 15 2 × 12 2 × 15
8 4 4 2 × 15 2 × 15 2 × 15 1 × 10
9 4 4 2 × 15 3 × 20 2 × 15 2 × 15
10 4 4 2 × 20 2 × 20 2 × 15 1 × 15
11 3 3 1 × 20 2 × 20 1 × 20 1 × 20
12 2 2 1 × 20 1 × 20 1 × 20 1 × 10
Sess = session number. SPR = sprint exercise, HOR = horizontal jump exercise, VERT = vertical jump exercise. Exercises
abbreviations: 50 BLD = 50-m build up to max. velocity, 30 FLY = 30-m fly with a 20-m acceleration zone, 60 SPR = 60-m sprint at
max. velocity, INO = an in-and-out sprint consisting of a 20-m acceleration zone, 10-m max. velocity zone, 20-m float, and a second
10-m max. velocity zone, FH = frog hops, ALB = alternate leg bounds, S.Leg FH = single leg forward hops, Lat. CJ = lateral cone
jumps, F/B CJ = forward/backward cone jumps, SJ = squat jumps, SSJ = split scissor jumps (or lunge jumps), DJ = depth jumps, and BJ
= box jumps from a self-selected box height. All jumps were performed at maximal intensity and repeatedly, without rest between
repetitions.
Table 3 CORE training protocol.
ABS ABS ABS ABS BACK BACK BACK BACK HIP/GL HIP/GL HIP/GL HIP/GL
Sess. # CR SCR SU VS SM BU PK SPK FH SBA BDG BD
1 1 × 20 1 × 20 1 × 20 30s 1 × 20 1 × 20
2 1 × 20 1 × 20 1 × 10 30s 1 × 20 1 × 20
3 1 × 30 1 × 30 1 × 30 45s 1 × 30 1 × 30
4 1 × 30 1 × 30 1 × 15 45s 1 × 30 1 × 30
5 2 × 20 2 × 20 2 × 20 60s 2 × 20 2 × 20
6 2 × 20 2 × 20 2 × 10 60s 2 × 20 2 × 20
7 2 × 30 2 × 30 2 × 30 2 × 45s 2 × 30 2 × 30
8 2 × 30 2 × 30 2 × 15 2 × 45s 2 × 30 2 × 30
9 3 × 30 3 × 30 3 × 30 2 × 60s 3 × 30 3 × 30
10 3 × 30 3 × 30 3 × 15 2 × 60s 3 × 30 3 × 30
11 2 × 30 2 × 30 2 × 30 60s 2 × 30 2 × 30
12 2 × 30 2 × 30 2 × 15 60s 2 × 30 2 × 30
Sess = session number. ABS = abdominal exercise. BACK = back exercise. HIP/GL = hip or gluteal exercise. Exercise abbreviations:
CR = crunches, SCR = side crunches (per side), SU = sit-ups, VS = V sit-ups, SM = supermans, BU = back-ups or back extensions,
using a training table, PK = plank, SPK = side plank (time per side), FH = fire hydrant, SBA = Swiss Ball adductors, BDG = bridging,
BD = bird dog. All exercise were performed at slow to moderate velocity.
of training status. Subjects ran 4-5 days per week, with
an average weekly mileage of 35-km per week and a
peak of 60-km per week. Long runs were done weekly,
and built up to 32-km by the peak training period.
2.3.2. Anthropometric Characteristics
Height and weight were measured pre- and post-,
prior to the treadmill RE test. Subjects removed
footwear, and height was measured using an Accustat
Genentech Stadiometer (San Francisco, CA, USA).
Weight was measured in pounds to the nearest tenth
using a ProDoc Detecto (PD300) scale (Webb City,
MO, USA) and converted to kilograms for analysis.

Effects of Plyometric and Explosive Speed Training on Recreational Marathoners
5
During weighing, subjects wore light, minimal
clothing.
2.3.3. Sub-maximal 30 Minute Running Test and
VO2MAX Test
For the sub-maximal running test, subjects ran on a
motorized Woodway Pro XL 27 treadmill (Waukesha,
WI, USA) for a total of 33 continuous minutes,
including a 3 minute warm-up and 6 stages of 5
minutes each. They were advised to follow a dietary
regiment similar to that which they typically use prior
to a race or challenging workout. Stages were
calculated off recent 2MI finish time. The warm-up
was done at 63% of 2MI velocity, and the 6 stages of 5
minutes each were at 68%, 73%, 78%, 83%, 88%, and
93% of 2-mile velocity. The final stage velocity is
equivalent to a predicted 10k velocity, based on
previously published race pace conversion charts [24].
Though this was not meant to be a maximal effort, the
duration and intensity were moderately challenging.
Research staff emphasized that if at any point the
subject wished to stop the test, he or she was free to do
so. A face mask and pneumatech were worn for gas
analysis via Medgraphics Ultima CPX metabolic cart
(MCG Diagnostics, St. Paul, MN, USA). Standard
calibration procedures were used prior to each testing
session. In order to assess metabolic response to
exercise of moderate duration over a range of
sub-maximal paces, RER and RE in ml/kg/km were
calculated by taking average values over the 30
minutes. Stage-by-stage analysis was considered, but
shed no additional light on the variables of interest.
The VO2MAX test was performed with the same
treadmill and metabolic cart on a separate visit. The
same procedures were used for height and weight. A
graduated protocol was utilized, with velocity
increasing each minute up to 2-mile velocity at 1.0%
incline, and then increasing in incline by 1.5% each
minute until volitional exhaustion was reached.
2.3.4. Running Performance Assessment
The 2MI time trials were conducted as part of the
university course curriculum, as was the MARA. The
2MI runs were held on a non-banked, Mondo
(Conshohocken, PA, USA) 200-m indoor track. Each
runner had a lap counter who marked the completion of
each lap and recorded 1-mile split time and 2MI finish
time on a data collection sheet. The pre-test 2MI was
completed at the start of the marathon training class,
one week prior to the initiation of the training
intervention. The post-test was completed near the
conclusion of the training intervention, 10 days prior to
the MARA. The MARA was run on a certified course
as part of an event open to the general public. Chip
times were gathered from online race results, and
checked against training logs for accuracy. Predicted
marathon time was calculated from the post-test 2MI
using race time predictor charts [24]. Difference
between actual and predicted MARA time is reported
as a percentage.
2.3.5. Sprint and Jump Testing
Sprint and jump tests were conducted on the same
indoor track as the 2MI, and consisted of the following,
performed in this order: 30FLY, SLJ, 60M, and 10BD
and 200M. A standard warm-up (5 minute jog, and 10
minutes of dynamic warm-up drills and accelerations)
was performed prior to the commencement of testing.
The sprint tests were timed electronically using Brower
Timing Systems TC-Timing wireless timing gates
(Draper, UT, USA) set at waist height. The 30FLY,
with a 20-m acceleration zone, was timed using two
sets of timing gates. The 60M and 200M were timed
using the touchpad starter, set to start on release, and
one set of timing gates. The 10BD consisted of a
rock-step start, into 10 continuous alternate leg strides
down the long jump runway. Subjects were instructed
to cover as much distance as possible. The SLJ was
done into a standard sand landing pit at the indoor track
facility. Jump measurements were taken using a
fiberglass measuring tape (Empire, Mukwonago, WI,
USA) with two researchers spotting and measuring.
Distances of all trials were recorded immediately by
research staff. Distance was measured from the scratch
line to furthest back point of contact upon landing (in
Effects of Plyometric and Explosive Speed Training on Recreational Marathoners
6
most cases, the heel).
Subjects were given 3 attempts to produce maximal
efforts in the jumps, with a minimum of a 1-minute rest
between attempts, and at least a 3-minute rest between
tests (ICC: SLJ = 0.987, 10BD = 0.989). They were
given a single attempt in each of the sprints, to
minimize the effects of fatigue during the testing
session. The 200M was done last as it was likely
produce greater fatigue than the other tests. All tests
were explained carefully and demonstrated to subjects
prior to testing. All timing and measurement
procedures were performed consistently and were the
same for pre- and post-testing.
On a separate visit, prior to the submaximal
30-minute running test, VJ was assessed using the
Vertec Jump and Reach system (Huntington Beach,
CA, USA). Subjects performed a self-paced 5 minute
warm-up jog on a treadmill and were given the
opportunity to perform practice jumps. Three minutes
of rest were taken between the warm-up and the VJ.
Calibration of the Vertec was done for each subject.
Subjects performed 3-6 maximal effort
countermovement jumps with stationary feet, with at
least 30 seconds of rest between attempts. Subjects
performed at least three attempts, and continued until
they failed to improve on two consecutive attempts,
with a maximum of 6 jumps allowed.
2.4 Statistics
Means and standard deviations were calculated for
each measure. Data were tested for normality and
homoscedasticity using the Shapiro-Wilk and Levene
tests. The two groups of dependent variables,
sprint/jump performance and distance running
performance, were assessed separately using
MANOVA. Baseline measures were analyzed using
independent samples t-tests to detect differences
between the groups before the intervention. Paired
samples t-tests were used to assess changes from
baseline by group. Between groups analysis on the
dependent variables was calculated based on percent
change from pre- to post-testing. Independent samples
t-tests or the Mann-Whitney U Test was used to
compare the groups. A MANOVA was used to assess
differences in the effect of training by sex and
performance level. Performance level was determined
based on pre-test 2MI time, with the top 6 males and
females being assigned to the FAST group, and the
remainder (7 females and 5 males) being assigned to the
SLOW group. Univariate ANOVA was also used for
post-hoc analysis to explore for interactions by
performance level and sex. Statistical analysis was done
using SPSS (version 21.0; IBM, Armonk, NY, USA).
3. Results
Baseline analysis showed no differences between
groups, though there was a trend toward lower BM in
the PLYO group (P = 0.063). Sprint and jump results
are presented in Table 4. Distance running performance
results are shown in Table 5. Pre- and post-test values
and percent change are reported for all variables.
Assessment with MANOVA showed a significant
effect of training group on the dependent variables
related to sprint and jump performance (P = 0.045), but
not for those related to distance running performance.
There was no interaction between training group and
either sex or performance level for the sprint/jump or
distance running dependent variables. Results are
shown for men and women independently, but they
were pooled for analysis.
The CORE group did not change from baseline in
any of the sprint or jump variables, but had a trend
toward a decrement in performance in the SLJ (P =
0.067). The PLYO group improved in both the 200M
(P ≤ 0.001) and 60M (P = 0.004), and showed a strong
trend toward improvement in the 30MFLY (P = 0.051).
In the distance running performance variables, both
groups improved in 2MI (P ≤ 0.001), VO2MAX (P =
0.026 for CORE; P = 0.002 for PLYO), and RE (P =
0.01). Both groups were also significantly slower (P ≤
0.001 for CORE; P = 0.004 for PLYO) than predicted
in the marathon.

Effects of Plyometric and Explosive Speed Training on Recreational Marathoners
7
Table 4 Pre- and post-training sprint and jump performance variables.
CORE (n = 11, 5 women) PLYO (n = 11, 7 women)
Variable
Pre- Post- % change Pre- Post- % change P =
200M (sec)
ALL 34.28 ± 5.39 33.78 ± 4.89 -1.3 ± 3.0 36.52 ± 6.24 34.64 ± 6.46† -5.8 ± 3.7‡ 0.006
M 29.94 ± 1.27 29.88 ± 1.71 -0.3 ± 3.5 31.64 ± 4.52 29.20 ± 4.81 -8.6 ± 2.5
W 39.49 ± 2.92 38.47 ± 2.41 -2.6 ± 1.9 39.31 ± 5.45 37.75 ± 5.19 -4.1 ± 3.3
60M (sec)
ALL 9.83 ± 1.40 9.67 ± 1.19 -1.8 ± 7.2 10.45 ± 1.37 9.88 ± 1.51† -6.2 ± 6.9 0.154
M 8.74 ± 0.55 8.82 ± 0.89 0.4 ± 9.0 9.54 ± 1.08 8.59 ± 0.79 -11.1 ± 8.6
W 11.15 ± 0.74 10.69 ± 0.44 -4.3 ± 3.9 10.97 ± 1.29 10.62 ± 1.33 -3.4 ± 4.2
30FLY (sec)
ALL 4.23 ± 0.77 4.20 ± 0.56 -0.3 ± 6.1 4.44 ± 0.72 4.31 ± 0.67 -3.0 ± 2.9 0.191
M 3.66 ± 0.20 3.78 ± 0.30 3.0 ± 3.0 3.84 ± 0.38 3.72 ± 0.30 -3.3 ± 3.0
W 4.91 ± 0.60 4.71 ± 0.30 -4.2 ± 7.0 4.78 ± 0.65 4.64 ± 0.57 -2.9 ± 3.4
SLJ (m)
ALL 2.22 ± 0.54 2.12 ± 0.45 -4.5 ± 7.6 1.98 ± 0.41 2.02 ± 0.38 1.9 ± 4.1‡ 0.024
M 2.62 ± 0.34 2.45 ± 0.28 -6.9 ± 8.3 2.37 ± 0.40 2.40 ± 0.29 1.7 ± 5.5
W 1.73 ± 0.13 1.71 ± 0.20 -1.6 ± 6.3 1.76 ± 0.22 1.80 ± 0.22 2.0 ± 3.6
10BD (m)
ALL 21.5 ± 3.2 20.7 ± 3.3 -4.2 ± 7.6 19.8 ± 2.6 19.8 ± 2.7 -0.5 ± 6.9 0.332
M 23.8 ± 2.0 22.8 ± 3.2 -5.4 ± 8.4 22.3 ± 1.8 22.7 ± 1.2 1.8 ± 5.6
W 18.6 ± 1.5 18.1 ± 0.6 -2.8 ± 7.2 18.4 ± 1.7 18.1 ± 1.7 -1.9 ± 7.6
VJ (m)
ALL 0.576 ± 0.193 0.554 ± 0.142 -3.0 ± 8.2 0.513 ± 0.127 0.503 ± 0.114 -1.6 ± 6.1 0.847
M 0.719 ± 0.147 0.663 ± 0.086 -8.0 ± 13.3 0.645 ± 0.076 0.617 ± 0.099 -5.6 ± 10.9
W 0.409 ± 0.038 0.424 ± 0.058 3.0 ± 8.2 0.437 ± 0.074 0.439 ± 0.064 0.7 ± 4.6
All results are ± S.D. P-values are two-tailed, based on t-tests of % change by group. ALL = all subjects. M = men. W = women.
Statistical analysis done for ALL, and M, W values provided for reference. †Significantly different from baseline. ‡Significantly
different from CORE group (P ≤ 0.05).
Table 5 Pre- and post-training distance running performance variables.
CORE (n = 11, 5 women) PLYO (n = 11, 7 women)
Variable Pre- Post- % change Pre- Post- % change P-value
VO2MAX
(ml/kg/min)
ALL 53.6 ± 8.3 57.4 ± 7.5† 6.5 ± 7.9 50.5 ± 8.8 57.8 ± 8.3† 12.5 ± 9.7 0.124
M 59.1 ± 6.4 62.2 ± 5.6 4.7 ± 10.6 55.2 ± 13.0 65.4 ± 4.7 16.2 ± 14.5
W 47.1 ± 4.7 51.5 ± 4.9 8.7 ± 2.3 47.7 ± 4.3 53.5 ± 6.6 10.4 ± 5.4
2 mile TT
(min)
ALL 14.0 ± 2.0 13.3 ± 1.7† -5.1 ± 2.2 14.7 ± 2.4 14.0 ± 2.3† -4.3 ± 3.1 0.521
M 12.8 ± 0.9 12.1 ± 0.8 -5.0 ± 2.3 12.5 ± 2.2 12.2 ± 2.5 -2.6 ± 3.1
W 15.5 ± 2.0 14.7 ± 1.5 -5.3 ± 2.3 16.0 ± 1.3 15.1 ± 1.4 -5.4 ± 2.8
Marathon
(min)
ALL 202.5 ± 25.0 237.1 ± 31.6† 14.5 ± 4.0 213.9 ± 33.5 255.5 ± 66.2† 14.0 ± 10.2 0.891
M 185.7 ± 12.1 217.8 ± 14.2 14.7 ± 3.9 186.6 ± 36.8 218.7 ± 91.2 10.1 ± 14.8
W 222.7 ± 21.3 260.4 ± 31.7 14.2 ± 4.5 229.5 ± 20.3 276.5 ± 41.5 16.2 ± 7.0
Body Mass
(kg)
ALL 73.5 ± 9.6 72.9 ± 9.6 -0.9 ± 3.0 65.8 ± 8.5 65.8 ± 7.8 0.0 ± 3.5 0.510
M 79.8 ± 8.0 79.9 ± 6.5 0.2 ± 3.2 71.8 ± 4.8 71.5 ± 1.8 -0.4 ± 4.4
W 65.9 ± 4.4 64.5 ± 3.8 -2.2 ± 2.6 62.4 ± 8.5 62.5 ± 8.1 0.2 ± 1.9
RE
(ml/kg/km)
ALL 218.6 ± 19.4 192.9 ± 37.0† -16.5 ± 20.5 216.3 ± 17.9 200.2 ± 29.5† -9.6 ± 13.2 0.519
M 219.9 ± 18.7 193.7 ± 36.0 -16.0 ± 16.6 211.9 ± 17.3 198.4 ± 24.7 -7.3 ± 6.5
W 217.1 ± 22.3 192.0 ± 42.3 -17.2 ± 26.5 218.8 ± 19.0 201.2 ± 33.7 -10.9 ± 16.3
RER
ALL 1.031 ± 0.048 1.049 ± 0.096 1.3 ± 6.3 1.028 ± 0.048 0.997 ± 0.045 -3.4 ± 6.7 0.112
M 1.047 ± 0.054 1.105 ± 0.087 4.9 ± 6.1 1.023 ± 0.041 1.013 ± 0.038 -1.1 ± 4.0
W 1.012 ± 0.035 0.982 ± 0.058 -3.1 ± 2.9 1.031 ± 0.054 0.988 ± 0.049 -4.7 ± 7.9
All results are ± S.D. P-values are two-tailed, based on t-tests of % change by group. ALL = all subjects. M = men. W = women.
Statistical analysis done for ALL, and M, W values provided for reference. Marathon: pre = predicted, post = actual finish time.
†Significantly different from baseline.

Effects of Plyometric and Explosive Speed Training on Recreational Marathoners
8
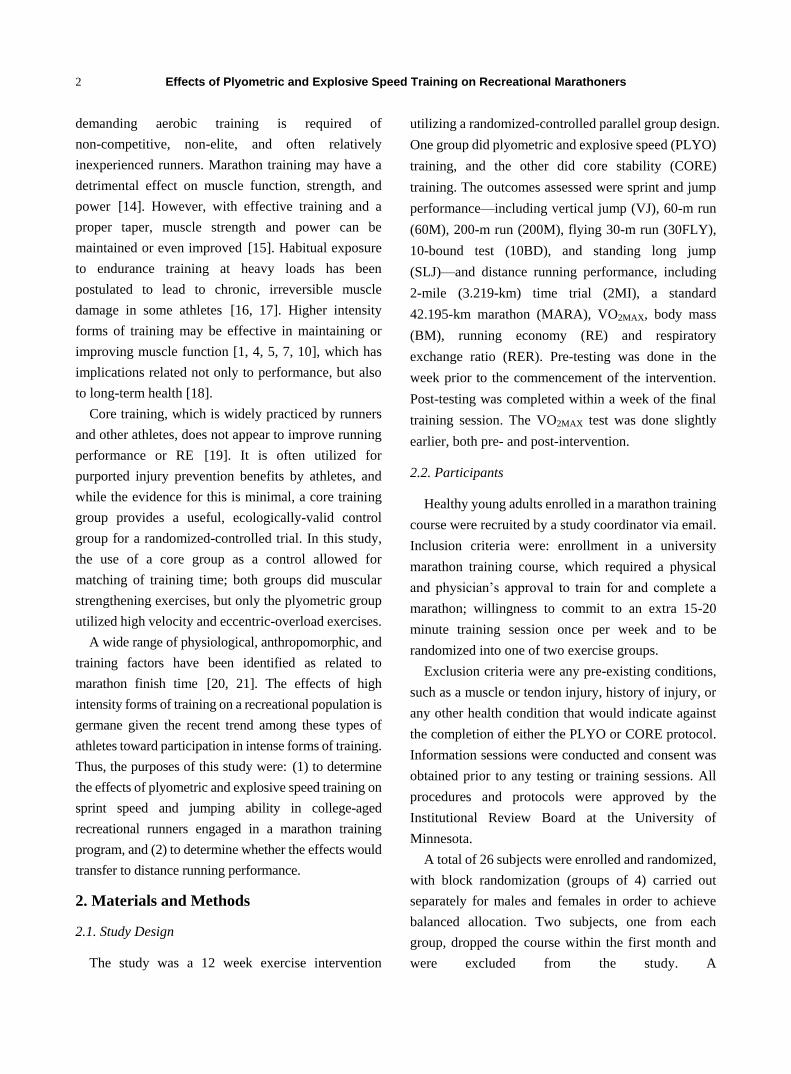
There were significant differences between PLYO
and CORE in the 200M (P = 0.006) and the SLJ (P =
0.024). The PLYO group improved 5.7% compared to
1.3% for CORE in the 200M, and improved 1.9% vs. a
4.5% decrement in CORE for the SLJ. The PLYO
group improved more than CORE in the other sprint
variables, but the differences were not significant.
Changes in sprint performance by group are shown in
Fig. 1. In all of the jump variables, CORE decreased
non-significantly in jump distance or height, whereas
PLYO increased non-significantly in SLJ and
decreased, but to a lesser degree than CORE, in 10BD
and VJ, as shown in Fig. 2.
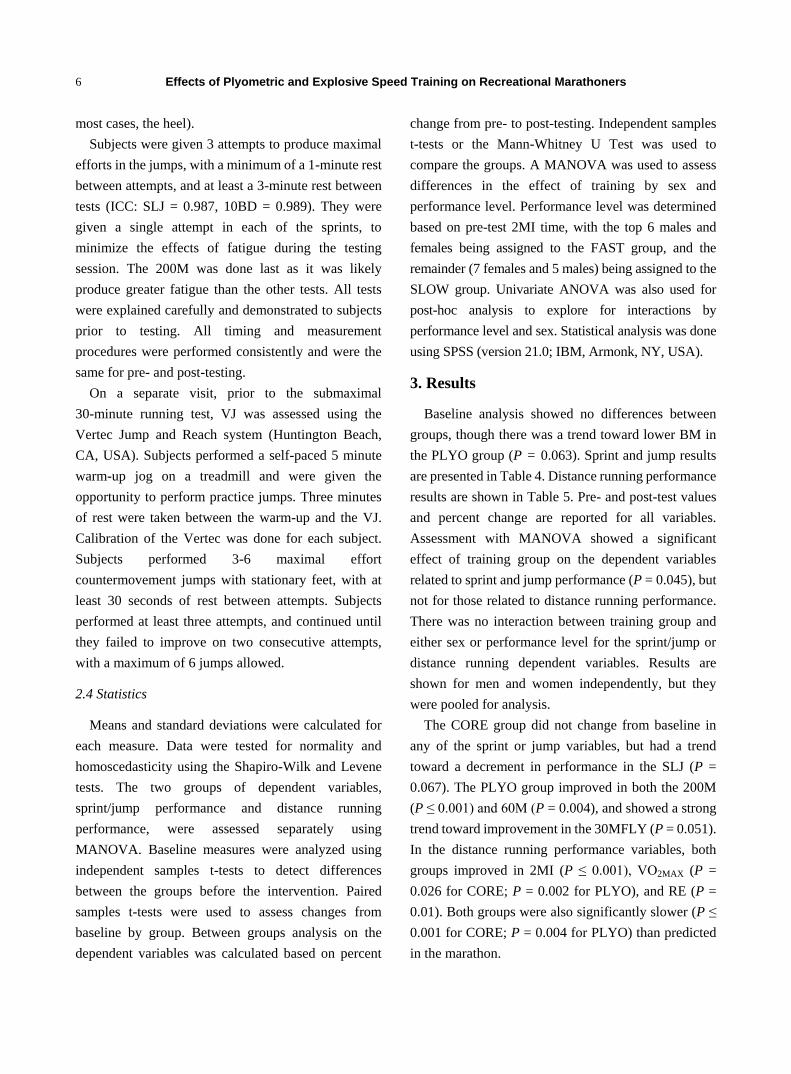
In the distance running performance variables, there
were no significant differences between the groups. In
the 2MI, improvements were very similar between the
groups, with CORE improving by 5.1% vs. 4.3% in
PLYO (P = 0.521). Marathon time as a function of
predicted times was also very similar between the
groups, with the PLYO running 14.0% slower than
predicted and CORE running 14.5% slower (P = 0.891).
No change was seen in BM in either group. There was
no difference in the change in RE between the groups,
with CORE improving by 16.5% and PLYO improving
Fig. 1 Percentage improvement in sprint performance by group for the 200M, 60M, and 30MFLY.
Fig. 2 Percentage change in jump performance by group for the SLJ, 10BD, and VJ.
0.0
2.0
4.0
6.0
8.0
200M 60M 30FLY
Improvement in Sprint Performance (%)
Core
Plyo
-5.0
-4.0
-3.0
-2.0
-1.0
0.0
1.0
2.0
3.0
SLJ 10BD VJ
Change in Jump Performance (%)
Core
Plyo

Effects of Plyometric and Explosive Speed Training on Recreational Marathoners
9
Fig. 3 Percentage improvement by group in distance running performance variables: VO2MAX, 2MI, BM, RE, and RER.
Reductions in 2MI, BM, RE (per km), and RER are inverted here in a positive direction, so that all positive percentages
indicate adaptations consistent with improvement in running performance.
Fig. 4 Percent slower than predicted in the marathon, based off 2MI performance, by group and performance level. The
cut-points were 12.5 minutes for men and 15.5 minutes for women.
by 9.6% (P = 0.519). In VO2MAX, PLYO improved by
12.5% vs. 6.5% in CORE (P = 0.124). Average RER
dropped by 3.4% in PLYO, but increased 1.3% in
CORE (P = 0.112). A univariate ANOVA of difference
from predicted marathon time, including performance
level and training group, showed a significant
interaction between training group and performance
level (P = 0.047), with the FAST runners from the
PLYO group performing better in the marathon than
those in the CORE group, but the SLOW runners in the
PLYO group performing worse than those in the CORE
group.
4. Discussion
This study examined the effects of a 12 week
plyometric training program on sprint and jump
performance, and distance running performance in
college-aged recreational marathon runners. This study
was novel in examining this type of training for
marathon runners. While marathon training and
plyometric training have very different physiological
aims, it appears that among this population, beneficial
-2.0 0.0 2.0 4.0 6.0 8.0
10.0 12.0 14.0 16.0 18.0
Improvement in Running Performance (%)
Core
Plyo
0.0
5.0
10.0
15.0
20.0
Core Plyo
15.3
9.0 13.5
20.0
Difference from Predicted (%)
FAST SLOW

Effects of Plyometric and Explosive Speed Training on Recreational Marathoners
10
adaptations specific to both types of training can be
made when training is done concurrently.
Sprint performance improved and jump performance
did not decline in the PLYO group, whereas the CORE
group did not change in sprint performance, and
decreased non-significantly in measures of jump
performance. The frequency and volume of PLYO
training was relatively low in comparison with other
studies of distance runners training for shorter races [4,
5, 7, 8, 10, 11]. The lower frequency and volume of
training in this program was intentionally conservative,
as the primary concern for this population was
completion of the marathon, and not to maximize speed
and/or power gains. However, it appears that this low
volume was effective in improving speed and
maintaining jumping performance. Greater
improvements may be possible with a more aggressive
training protocol in those who are able to tolerate such
a program. Intermittent testing and monitoring
throughout the training period could also be considered,
with volume and frequency adjusted based on
individual adaptation and tolerance for training.
The failure of the PLYO training to produce an
improvement in jump variables is somewhat surprising
given the abundance of literature on PLYO training and
improved jump performance [25]. The two dropouts
from the study and two exclusions from analysis led to
an imbalance between men and women in the groups,
with only four men in the PLYO group and six in the
CORE group. Given the evidence that women may not
have the same magnitude of response to PLYO training,
specifically in terms of jump performance [25], this
could have reduced the power of the present study to
find differences between the groups. However, no
interaction between sex and training group was
detected. The decrement in jump performance seen in
the CORE group is similar to findings in other studies
on heavy endurance training [8, 26]. In those studies,
the control group experienced a decrement in jump
performance, while the strength training group [26] or
plyometric training group [8] maintained jumping
ability. This suggests that the PLYO intervention had a
positive effect in maintaining muscular function and
lower body power.
In this population, adaptations made through PLYO
training did not transfer to improved distance running
performance. Unlike other studies that have shown
improved time trial performance in 3k to 5k distances
and/or improved RE [4, 5, 7, 8, 10, 11], this study
found no difference in 2MI performance or RE
between the groups. The lack of an effect on distance
running performance may be due to a number of factors.
First, and perhaps most importantly, is the change in
running performance experienced by the group as a
whole due to the demanding nature of the marathon
training program. The lack of an effect of training
group on distance running performance is not entirely
surprising, as any adaptation to a 15-20 minute weekly
session would be expected to be small in contrast with
the relatively high volume running training performed
by both groups. Indeed, the effect of time on the
distance running performance variables was significant
(P ≤ 0.001) for the whole population. None of the other
studies cited above implemented increases in running
training volume concurrent with the plyometric
intervention. While the 6-week run-in period in this
study represented an attempt to reduce the magnitude
of changes due to the running training, the marathon
training program required long runs of up to 20 miles,
whereas the run-in period had no runs longer than 8
miles. Another study that found no effect of PLYO on
RE, 3200-m run or VO2MAX involved high school cross
country runners during their summer training [23].
Miles per week at the initiation of the study were not
reported, but it was stated that the average participant
had run in less than five of the previous six weeks, and
then averaged between 25-30 miles per week during
the study. Both the experimental and control group
improved RE and 3200-m performance, but there was
no effect of training group. The use of a population that
is more highly trained at baseline, and/or more
experienced, may facilitate a clearer picture of the

Effects of Plyometric and Explosive Speed Training on Recreational Marathoners
11
effect of PLYO training on distance running
performance variables in marathon runners.
The trend toward lower RER and higher VO2MAX in
the PLYO group warrants further investigation. While
VO2MAX has not been shown to improve from PLYO
training in runners [4, 5, 10, 11, 23], it may be possible,
particularly in a less experienced population that is
unaccustomed to higher intensity training. While one
of the above studies did use average runners [11], many
of the exercises included in the program were either
intermittent or sub-maximal (thus arguably outside of
the standard definition of plyometric), and no explosive
speed training was included. A recent study found an
improvement in VO2MAX after 6 weeks of plyometric
training, with a larger improvement (though not
significantly greater) than the control group [8].
Studies on untrained subjects have shown increases in
VO2MAX with high intensity muscular strengthening
exercise [27, 28]. Short, high intensity interval training
has been shown to elicit favorable metabolic
adaptations such as increased fat utilization [29, 30].
The trend toward lower RER, i.e. increased fat
metabolism, may be reflective of similar adaptations.
The lower RER values in the PLYO group may also
indicate a reduction in energy cost of running, as
energy equivalent of oxygen increases as an individual
shifts from metabolizing fat to carbohydrate [31].
Because of this, some have argued that RE should be
assessed using an energy cost, rather the traditional
oxygen cost model [32].
The post-hoc analysis showing a significant
interaction between marathon finish time, training
group, and performance level should be interpreted
with caution. However, it does suggest that a more
pointed study of the effects of plyometric and explosive
speed training on competitive marathoners is warranted.
It is possible that a baseline level of distance running
ability is needed in order to be able to transfer the
benefits plyometric training to marathon performance.
Less experienced individuals may benefit more from a
basic strengthening routine such as the core program
that served as the control group in this study.
Separating the explosive speed and plyometric
components of training may also elucidate the effects
of these types of training on different sub-groups of
marathon runners. In addition, an examination of the
biomechanical and cellular mechanisms associated
with changes in performance parameters in marathon
runners could shed light on the best practices of
implementing and monitoring high intensity forms of
training in marathon runners.
5. Conclusion
The results of this study suggest that plyometric and
explosive speed training can effectively be
implemented to improve speed and maintain jumping
ability in a population of recreational runners
concurrently engaged in marathon training. Increased
frequency or volume of jump training may be
necessary to induce improvements in jumping ability,
but that may not be feasible or productive in this
population. Unlike some other studies on plyometric
training and distance runners, no improvement in
distance running performance was observed. This may
be due to the magnitude of physiological stress and
changes from marathon training alone. The trends
toward improved VO2MAX and lower RER in the PLYO
group suggest potential performance benefits from
plyometric training for marathon runners. The
interaction between performance level and training
group suggest that plyometric training may have a
positive effect on marathon performance in the faster
runners, but a negative effect on slower runners. It is
possible that a more individualized program, with a
lower load on some subjects and a more demanding
load on others, could produce stronger effects, but any
increased load must be balanced with the potential
negative effects of additional physiological stress.
Acknowledgements
The authors would like to thank the participants in
this study, as well as research assistants Jarred

Effects of Plyometric and Explosive Speed Training on Recreational Marathoners
12
Sampson and Alena Brooks. We would also like to
thank all of the students from the Human and Sport
Performance Laboratory for their assistance in this
project.
References
[1] Sáez de Villarreal, E., Requena, B., and Cronin, J. 2012.
“The Effects of Plyometric Training on Sprint
Performance: A Meta-Analysis.” J. Strength Cond. Res.
26 (2): 575-84.
[2] Markovic, G., and Mikulic, P. 2010.
“Neuro-musculoskeletal and Performance Adaptations to
Lower-extremity Plyometric Training.” Sports Med. 40
(10): 859-95.
[3] Ross, A., Leveritt, M., and Riek, S. 2001. “Neural
Influences on Sprint Running.” Sports Med. 31 (6):
409-25.
[4] Paavolainen, L. M., Hakkinen, K., Hamalainen, I.,
Nummela, A. T., and Rusko, H. K. 1999.
“Explosive-strength Training Improves 5-km Running
Time by Improving Running Economy and Muscle Power.”
J. Appl. Physiol. 86 (5): 1527-33.
[5] Spurrs, R. W., Murphy, A. J., and Watsford, M. L. 2003.
“The Effect of Plyometric Training on Distance Running
Performance.” Eur. J. Appl. Physiol. 89 (1): 1-7.
[6] Yamamoto, L. M., Lopez, R. M., Klau, J. F., Casa, D. J.,
Kraemer, W. J., and Maresh, C. M. 2008. “The Effects of
Resistance Training on Endurance Distance Running
Performance among Highly Trained Runners: A
Systematic Review.” J. Strength Cond. Res. 22 (6):
2036.
[7] Ramirez-Campillo, R., Alvarez, C., Henriquez-Olguin, C.,
Baez, E. B., Martinez, C., Andrade, D. C., and Izquierdo,
M. 2014. “Effects of Plyometric Training on Endurance
and Explosive Strength Performance in Competitive
Middle- and Long-distance Runners.” J. Strength Cond.
Res. 28 (1): 97-104.
[8] Pellegrino, C., Ruby, L., and Dumke, L. 2016. “Effect of
Plyometrics on the Energy Cost of Running and MHC and
Titin Isoforms.” Med. Sci. Sports Exerc. 48 (1): 49-56.
[9] Barnes, K., and Kilding, A. 2015. “Strategies to Improve
Running Economy.” Sports Med. 45 (1): 37-56.
[10] Saunders, P. U., Telford, R. D., Pyne, D. B., Peltola, E. M.,
Cunningham, R. B., Gore, C. J., and Hawley, J. A. 2006.
“Short-term Plyometric Training Improves Running
Economy in Highly Trained Middle and Long Distance
Runners.” J. Strength Cond. Res. 20 (4): 947.
[11] Turner, A. M., Owings, M., and Schwane, J. A. 2003.
“Improvement in Running Economy after 6 Weeks of
Plyometric Training.” J. Strength Cond. Res. 17 (1): 60-7.
[12] Ross, A., and Leveritt, M. 2001. “Long-term Metabolic
and Skeletal Muscle Adaptations to Short-sprint Training.”
Sports Med. 31 (15): 1063-82.
[13] Ronnestad, B. R., and Mujika, I. 2014. “Optimizing
Strength Training for Running and Cycling Endurance
Performance: A Review.” Scand J. Med. Sci. Sports 24 (4):
603-12.
[14] Luden, N., Hayes, E., Minchev, K., Louis, E., Raue, U.,
Conley, T., and Trappe, S. 2012. “Skeletal Muscle
Plasticity with Marathon Training in Novice Runners.”
Scand. J Med. Sci. Sports 22 (5): 662-70.
[15] Trappe, S., Harber, M., Creer, A., Gallagher, P., and
Whitsett, D. 2006. “Single Muscle Fiber Adaptations with
Marathon Training.” J. Appl. Physiol. 101 (3): 721-7.
[16] Derman, W., Schwellnus, M. P., Lambert, M. I., Emms,
M., Sinclair-Smith, C., Kirby, P., and Noakes, T. D. 1997.
“The ‘Worn-out Athlete’: A Clinical Approach to Chronic
Fatigue in Athletes.” J. Sports Sci. 15 (3): 341-51.
[17] Grobler, L. A., Collins, M., Lambert, M. I., Sinclair-Smith,
C., Derman, W., St Clair Gibson, A., and Noakes, T. D.
2004. “Skeletal Muscle Pathology in Endurance Athletes
with Acquired Training Intolerance.” Br. J. Sports Med.
38 (6): 697-703.
[18] Koopman, R., and van Loon, L. J. 2009. “Aging, Exercise,
and Muscle Protein Metabolism.” J. Appl. Physiol. 106 (6):
2040.
[19] Stanton, R., Reaburn, P. R., and Humphries, B. 2004.
“The Effect of Short-term Swiss Ball Training on Core
Stability and Running Economy.” J. Strength Cond. Res.
18 (3): 522-8.
[20] Arrese, A. L., Izquierdo, D. M., and Serveto Galindo, J. R.
2005. “Physiological Measures Associated with Marathon
Running Performance in High-level Male and Female
Homogeneous Groups.” Int. J. Sports Med. 27 (4):
289-95.
[21] McKelvie, S. J., Valliant, P. M., and Asu, M. E. 1985.
“Physical Training and Personality Factors as Predictors
of Marathon Time and Training Injury.” Percept Mot.
Skills 60 (2): 551-66.
[22] Ebben, W. P., Feldmann, C. R., VanderZanden, T. L.,
Fauth, M. L., and Petushek, E. J. 2010. “Periodized
Plyometric Training Is Effective for Women, and
Performance Is not Influenced by the Length of
post-Training Recovery.” J. Strength Cond. Res. 24 (1):
1-7.
[23] Lathrop, M. C., Womack, C. J., and Paton, C. 2001.
“Biomechanical and Physiological Effects of Plyometric
Training on Adolescent Cross-country Runners.” Int. J.
Appl. Sport Sci. 13 (2): 12-26.
[24] Daniels, J., and Gilbert, J. 1979. Oxygen Power:
Performance Tables for Distance Runners. J. Daniels, J.
Gilbert .
[25] Sàez de Villarreal, E., Kellis, E., Kraemer, W. J., and

Effects of Plyometric and Explosive Speed Training on Recreational Marathoners
13
Izquierdo, M. 2009. “Determining Variables of Plyometric
Training for Improving Vertical Jump Height Performance:
A Meta-analysis.” J. Strength Cond. Res. 23 (2): 495.
[26] Losnegard, T., Mikkelsen, K., Rønnestad, B., Hallén, J.,
Rud, B., and Raastad, T. 2011. “The Effect of Heavy
Strength Training on Muscle Mass and Physical
Performance in Elite cross Country Skiers.” Scand J. Med.
Sci. Sports. 21 (3): 389.
[27] Stone, M. H., Wilson, G. D., Blessing, D., and Rozenek, R.
1983. “Cardiovascular Responses to Short-term Olympic
Style Weight-training in Young Men.” Can. J. Appl. Sport.
Sci 8 (3): 134.
[28] McCarthy, J. P., Agre, J. C., Graf, B. K., Pozniak, M. A.,
and Vailas, A. C. 1995. “Compatibility of Adaptive
Responses with Combining Strength and Endurance
Training.” Med. Sci. Sports Exerc. 27 (3): 429.
[29] Gibala, M. J. 2006. “Short-term Sprint Interval versus
Traditional Endurance Training: Similar Initial
Adaptations in Human Skeletal Muscle and Exercise
Performance.” J. Physiol. 575 (3): 901-11.
[30] Burgomaster, K. A., Howarth, K. R., Phillips, S. M.,
Rakobowchuk, M., Macdonald, M. J., McGee, S. L., and
Gibala, M. J. 2008. “Similar Metabolic Adaptations
during Exercise after Low Volume Sprint Interval and
Traditional Endurance Training in Humans.” J. Physiol.
586 (1): 151-60.
[31] Peronnet, F., and Massicotte, D. 1991. “Table of
Nonprotein Respiratory Quotient: An Update.” Can. J.
Appl. Sport Sci. 16 (1): 23-9.
[32] Fletcher, J. R., Esau, S. P., and MacIntosh, B. R. 2009.
“Economy of Running: Beyond the Measurement of
Oxygen Uptake.” J. Appl. Physiol. 107 (6): 1918-22.