Embed Size (px)
Citation preview
Lam, C. et al. Geotechnique [http://dx.doi.org/10.1680/geot.13.P.012]
1
Effects of polymer and bentonite support fluids on concrete–sand interfaceshear strength
C. LAM�, S . A. JEFFERIS† and C. M. MARTIN‡
Support fluids are widely used for the construction of deep bored piles and diaphragm walls.Specifications for the use of these fluids vary, and a thorough understanding of their effect on pileshaft resistance has not yet been developed. This paper presents the results of a set of concrete–sandinterface shear tests carried out using both polymer and bentonite support fluids, with water as areference fluid. It was found that polymer fluids had little effect on the interface shear strength whencompared with water. Furthermore, in contrast to the results of earlier studies, concrete curing timewas found to have little effect on the results. However, when bentonite slurry was used, the interfaceshear strength was found to decrease approximately linearly with the square root of the filtration time,until the strength of the pure filter cake was reached. This was due to the development of a bentonitefilter cake at the interface so that only aggregate protruding through the filter cake made contact withthe sand. It was found that the full concrete–sand shearing resistance could be mobilised when theconcrete–sand contact area was greater than about 50% of the total area.
KEYWORDS: laboratory equipment; laboratory tests; piles; shear strength
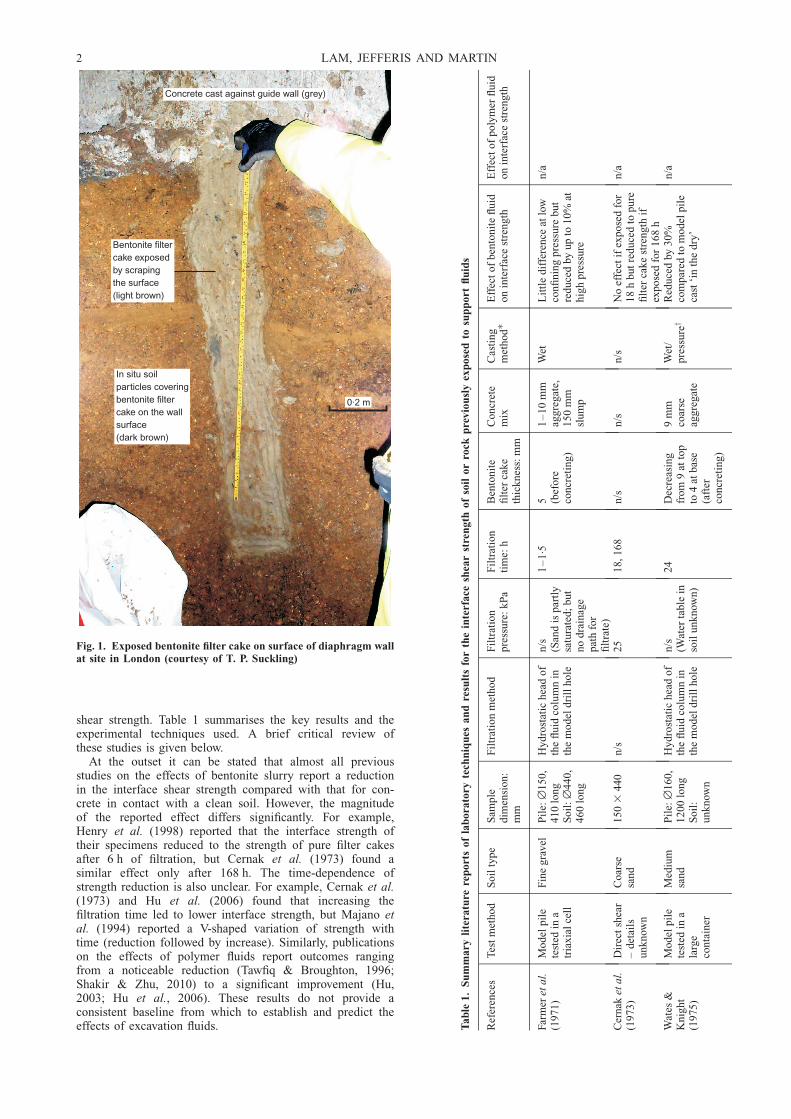
INTRODUCTIONBentonite support fluids have been used for the constructionof diaphragm walls and bored piles since the pioneeringwork of Veder (1953). It is now known that in permeablesoils such as sand and gravel, the stabilising mechanisminvolves the formation of a filter cake on the side walls.Cake formation may be assisted by rheological blocking –that is, penetration of the slurry into the ground until the gelstrength of the slurry acting over the penetrated area of soilparticles is sufficient to prevent further slurry penetration.The bentonite filter cake is of relatively low permeability, soit reduces fluid loss into the ground and provides a mem-brane against which the hydrostatic pressure of the slurrycan act, so stabilising the excavation (Nash, 1974). Theformation of a filter cake is necessary for a stable excavationwith bentonite slurry in permeable soils. However, forfriction piles and barrettes, the filter cake creates an undesir-able layer of soft interface material between concrete andsoil, and can reduce the interfacial resistance. Fig. 1 shows adiaphragm wall panel constructed at a site in London, withthe top few metres of the wall surface exposed. A layer offilter cake with adhering soil can be seen on the wall surfacebelow the level of the guide wall.
Although many studies have been carried out to investi-gate the effect of bentonite filter cake on interface resistance,a definitive understanding has not yet been developed, andunsatisfactory pile performance continues to be reported. Forexample, Randolph (2003) described load test results of twobored piles constructed using bentonite fluids in Vietnam.The shaft resistance of the first test pile was below expecta-
tion, so several modifications were made to the constructionprocedure for the second pile, including: (a) steps to reducethe delay between excavation and concreting; (b) a reductionin the head of bentonite above river level; (c) mechanicalscarifying of the side wall prior to casting the pile. Thesemeasures were all aimed at reducing the thickness of thefilter cake and were reported to have led to an improvementof about 30% in the shaft resistance. This case history posesquestions as to whether such steps are also necessary forother projects, and if not, whether current specifications arealready adequate for minimising the weakening effect ofbentonite filter cake at the concrete–soil interface.
The current UK specification (Institution of Civil Engi-neers, 2007) requires that, for the construction of boredpiles, concrete should be placed within 12 h of the start ofthe excavation. In the USA, there can also be a timerequirement, but it is slightly differently specified. Forexample, Brown et al. (2010) recommend that the timeduring which the bentonite fluid is left undisturbed in a pilebore should be less than 4 h. However, no such time restric-tion can be found in the foundation manuals of countriessuch as Canada and Hong Kong (Canadian GeotechnicalSociety, 2006; Geotechnical Engineering Office, 2006). Thediscrepancies between these requirements, or the lack ofthem, indicates that further work is needed to quantify theeffect of fluid support time for better quality control.
This paper presents the results of a laboratory investiga-tion into the effect of support fluids on the interface shearstrength between sand and cast in situ concrete. A review ofthe relevant literature is first given, followed by a descriptionof the equipment used and the test results. Both bentoniteand polymer fluids were included in the test programme,with water as the control fluid. The main effects of interestwere those of support fluid filtration time, concrete surfaceroughness and concrete curing period.
PREVIOUS STUDIESSummary of existing results
Many laboratory studies have been carried out to investi-gate the effects of excavation support fluids on interface
Manuscript received 15 January 2013; revised manuscript accepted 27September 2013.Discussion on this paper is welcomed by the editor.� School of Mechanical, Aerospace and Civil Engineering, TheUniversity of Manchester, Manchester, UK.† Environmental Geotechnics Ltd, Banbury, UK; Department ofEngineering Science, University of Oxford, Oxford, UK.‡ Department of Engineering Science, University of Oxford, Oxford,UK.
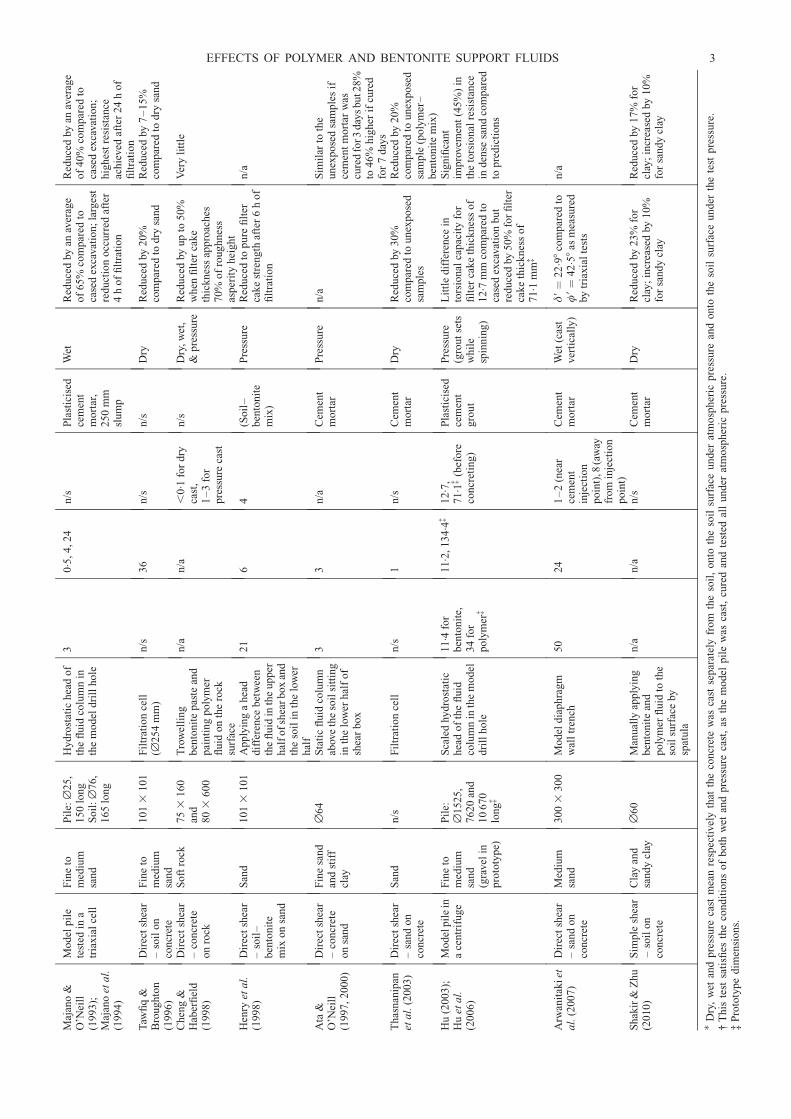
shear strength. Table 1 summarises the key results and theexperimental techniques used. A brief critical review ofthese studies is given below.
At the outset it can be stated that almost all previousstudies on the effects of bentonite slurry report a reductionin the interface shear strength compared with that for con-crete in contact with a clean soil. However, the magnitudeof the reported effect differs significantly. For example,Henry et al. (1998) reported that the interface strength oftheir specimens reduced to the strength of pure filter cakesafter 6 h of filtration, but Cernak et al. (1973) found asimilar effect only after 168 h. The time-dependence ofstrength reduction is also unclear. For example, Cernak et al.(1973) and Hu et al. (2006) found that increasing thefiltration time led to lower interface strength, but Majano etal. (1994) reported a V-shaped variation of strength withtime (reduction followed by increase). Similarly, publicationson the effects of polymer fluids report outcomes rangingfrom a noticeable reduction (Tawfiq & Broughton, 1996;Shakir & Zhu, 2010) to a significant improvement (Hu,2003; Hu et al., 2006). These results do not provide aconsistent baseline from which to establish and predict theeffects of excavation fluids.
Concrete cast against guide wall (grey)
Bentonite filtercake exposedby scrapingthe surface(light brown)
In situ soilparticles coveringbentonite filtercake on the wallsurface(dark brown)
0·2 m
Fig. 1. Exposed bentonite filter cake on surface of diaphragm wallat site in London (courtesy of T. P. Suckling)
Ta
ble
1.
Su
mm
ary
lite
ratu
rere
po
rts
of
lab
ora
tory
tech
niq
ues
an
dre
sult
sfo
rth
ein
terf
ace
shea
rst
ren
gth
of
soil
or
rock
pre
vio
usl
yex
po
sed
tosu
pp
ort
flu
ids
Ref
eren
ces
Tes
tm
eth
od
So
ilty
pe
Sam
ple
dim
ensi
on
:m
m
Fil
trat
ion
met
ho
dF
iltr
atio
np
ress
ure
:k
Pa
Fil
trat
ion
tim
e:h
Ben
ton
ite
filt
erca
ke
thic
kn
ess:
mm
Co
ncr
ete
mix
Cas
tin
gm
eth
od�
Eff
ect
of
ben
ton
ite
flu
ido
nin
terf
ace
stre
ng
thE
ffec
to
fp
oly
mer
flu
ido
nin
terf
ace
stre
ng
th
Far
mer
eta
l.(1
97
1)
Mo
del
pil
ete
sted
ina
tria
xia
lce
ll
Fin
eg
rav
elP
ile:
˘1
50
,4
10
lon
gS
oil
:˘
44
0,
46
0lo
ng
Hy
dro
stat
ich
ead
of
the
flu
idco
lum
nin
the
mo
del
dri
llh
ole
n/s
(San
dis
par
tly
satu
rate
d;
bu
tn
od
rain
age
pat
hfo
rfi
ltra
te)
1–
1. 5
5 (bef
ore
con
cret
ing
)
1–
10
mm
agg
reg
ate,
15
0m
msl
um
p
Wet
Lit
tle
dif
fere
nce
atlo
wco
nfi
nin
gp
ress
ure
bu
tre
du
ced
by
up
to1
0%
ath
igh
pre
ssu
re
n/a
Cer
nak
eta
l.(1
97
3)
Dir
ect
shea
r–
det
ails
un
kn
ow
n
Co
arse
san
d1
50
34
40
n/s
25
18
,1
68
n/s
n/s
n/s
No
effe
ctif
exp
ose
dfo
r1
8h
bu
tre
du
ced
top
ure
filt
erca
ke
stre
ng
thif
exp
ose
dfo
r1
68
h
n/a
Wat
es&
Kn
igh
t(1
97
5)
Mo
del
pil
ete
sted
ina
larg
eco
nta
iner
Med
ium
san
dP
ile:
˘1
60
,1
20
0lo
ng
So
il:
un
kn
ow
n
Hy
dro
stat
ich
ead
of
the
flu
idco
lum
nin
the
mo
del
dri
llh
ole
n/s
(Wat
erta
ble
inso
ilu
nk
now
n)
24
Dec
reas
ing
fro
m9
atto
pto
4at
bas
e(a
fter
con
cret
ing
)
9m
mco
arse
agg
reg
ate
Wet
/p
ress
urey
Red
uce
dby
30
%co
mp
ared
tom
od
elp
ile
cast
‘in
the
dry
’
n/a
2 LAM, JEFFERIS AND MARTIN
Maj
ano
&O
’Nei
ll(1
99
3);
Maj
ano
eta
l.(1
99
4)
Mo
del
pil
ete
sted
ina
tria
xia
lce
ll
Fin
eto
med
ium
san
d
Pil
e:˘
25
,1
50
lon
gS
oil
:˘
76
,1
65
lon
g
Hy
dro
stat
ich
ead
of
the
flu
idco
lum
nin
the
mo
del
dri
llh
ole
30
. 5,
4,2
4n
/sP
last
icis
edce
men
tm
ort
ar,
25
0m
msl
um
p
Wet
Red
uce
dby
anav
erag
eo
f6
5%
com
par
edto
case
dex
cavat
ion
;la
rges
tre
du
ctio
no
ccu
rred
afte
r4
ho
ffi
ltra
tio
n
Red
uce
dby
anav
erag
eo
f4
0%
com
par
edto
case
dex
cavat
ion
;h
igh
est
resi
stan
ceac
hie
ved
afte
r2
4h
of
filt
rati
on
Taw
fiq
&B
rou
gh
ton
(19
96
)
Dir
ect
shea
r–
soil
on
con
cret
e
Fin
eto
med
ium
san
d
10
13
10
1F
iltr
atio
nce
ll(˘
25
4m
m)
n/s
36
n/s
n/s
Dry
Red
uce
dby
20
%co
mp
ared
tod
rysa
nd
Red
uce
dby
7–
15
%co
mp
ared
tod
rysa
nd
Ch
eng
&H
aber
fiel
d(1
99
8)
Dir
ect
shea
r–
con
cret
eo
nro
ck
So
ftro
ck7
53
16
0an
d8
03
60
0
Tro
wel
lin
gb
ento
nit
ep
aste
and
pai
nti
ng
po
lym
erfl
uid
on
the
rock
surf
ace
n/a
n/a
,0
. 1fo
rd
ryca
st,
1–
3fo
rp
ress
ure
cast
n/s
Dry
,w
et,
&p
ress
ure
Red
uce
dby
up
to5
0%
wh
enfi
lter
cak
eth
ick
nes
sap
pro
ach
es7
0%
of
rou
gh
nes
sas
per
ity
hei
gh
t
Ver
yli
ttle
Hen
ryet
al.
(19
98
)D
irec
tsh
ear
–so
il–
ben
ton
ite
mix
on
san
d
San
d1
01
31
01
Ap
ply
ing
ah
ead
dif
fere
nce
bet
wee
nth
efl
uid
inth
eu
pp
erh
alf
of
shea
rb
ox
and
the
soil
inth
elo
wer
hal
f
21
64
(So
il–
ben
ton
ite
mix
)
Pre
ssu
reR
edu
ced
top
ure
filt
erca
ke
stre
ng
thaf
ter
6h
of
filt
rati
on
n/a
Ata
&O
’Nei
ll(1
99
7,2
00
0)
Dir
ect
shea
r–
con
cret
eo
nsa
nd
Fin
esa
nd
and
stif
fcl
ay
˘6
4S
tati
cfl
uid
colu
mn
abov
eth
eso
ilsi
ttin
gin
the
low
erh
alf
of
shea
rb
ox
33
n/a
Cem
ent
mo
rtar
Pre
ssu
ren
/aS
imil
arto
the
un
exp
ose
dsa
mp
les
ifce
men
tm
ort
arw
ascu
red
for3
day
sb
ut2
8%
to4
6%
hig
her
ifcu
red
for
7d
ays
Th
asn
anip
anet
al.
(20
03
)D
irec
tsh
ear
–sa
nd
on
con
cret
e
San
dn
/sF
iltr
atio
nce
lln
/s1
n/s
Cem
ent
mo
rtar
Dry
Red
uce
dby
30
%co
mp
ared
tou
nex
po
sed
sam
ple
s
Red
uce
dby
20
%co
mp
ared
tou
nex
po
sed
sam
ple
(po
lym
er–
ben
ton
ite
mix
)H
u(2
00
3);
Hu
eta
l.(2
00
6)
Mo
del
pil
ein
ace
ntr
ifu
ge
Fin
eto
med
ium
san
d(g
ravel
inp
roto
typ
e)
Pil
e:˘
15
25
,7
62
0an
d1
06
70
lon
g{
Sca
led
hy
dro
stat
ich
ead
of
the
flu
idco
lum
nin
the
mo
del
dri
llh
ole
11. 4
for
ben
ton
ite,
34
for
po
lym
er{
11. 2
,1
34. 4
{1
2. 7
,7
1. 1
{(b
efo
reco
ncr
etin
g)
Pla
stic
ised
cem
ent
gro
ut
Pre
ssu
re(g
rou
tse
tsw
hil
esp
inn
ing
)
Lit
tle
dif
fere
nce
into
rsio
nal
cap
acit
yfo
rfi
lter
cak
eth
ick
nes
so
f1
2. 7
mm
com
par
edto
case
dex
cavat
ion
bu
tre
du
ced
by
50
%fo
rfi
lter
cak
eth
ick
nes
so
f7
1. 1
mm
{
Sig
nifi
can
tim
pro
vem
ent
(45
%)
inth
eto
rsio
nal
resi
stan
cein
den
sesa
nd
com
par
edto
pre
dic
tio
ns
Arw
anit
akiet
al.
(20
07
)D
irec
tsh
ear
–sa
nd
on
con
cret
e
Med
ium
san
d3
00
33
00
Mo
del
dia
ph
rag
mw
all
tren
ch5
02
41
–2
(nea
rce
men
tin
ject
ion
po
int)
,8(a
way
fro
min
ject
ion
po
int)
Cem
ent
mo
rtar
Wet
(cas
tver
tica
lly
)�
9¼
22: 9
8co
mp
ared
to�
9¼
42: 5
8as
mea
sure
dby
tria
xia
lte
sts
n/a
Sh
akir
&Z
hu
(20
10
)S
imp
lesh
ear
–so
ilo
nco
ncr
ete
Cla
yan
dsa
nd
ycl
ay˘
60
Man
ual
lyap
ply
ing
ben
ton
ite
and
po
lym
erfl
uid
toth
eso
ilsu
rfac
eby
spat
ula
n/a
n/a
n/s
Cem
ent
mo
rtar
Dry
Red
uce
dby
23
%fo
rcl
ay;
incr
ease
dby
10
%fo
rsa
nd
ycl
ay
Red
uce
dby
17
%fo
rcl
ay;
incr
ease
dby
10
%fo
rsa
nd
ycl
ay
�D
ry,
wet
and
pre
ssu
reca
stm
ean
resp
ecti
vel
yth
atth
eco
ncr
ete
was
cast
sep
arat
ely
fro
mth
eso
il,
on
toth
eso
ilsu
rfac
eu
nd
erat
mo
sph
eric
pre
ssu
rean
do
nto
the
soil
surf
ace
un
der
the
test
pre
ssu
re.
†T
his
test
sati
sfies
the
con
dit
ion
so
fb
oth
wet
and
pre
ssu
reca
st,
asth
em
od
elp
ile
was
cast
,cu
red
and
test
edal
lu
nd
erat
mo
sph
eric
pre
ssu
re.
‡P
roto
typ
ed
imen
sio
ns.
EFFECTS OF POLYMER AND BENTONITE SUPPORT FLUIDS 3
Ideal test conditionsAlthough some of the discrepancies between these pre-
vious results can be explained by the different properties ofthe materials used, many are actually attributable to theexperimental techniques employed. Before discussing theindividual investigations, it is useful to consider the ‘ideal’conditions for laboratory interface shear tests involving sup-port fluids.
(a) Filtration: the filtration pressure is the difference betweenthe stabilising fluid pressure and the free-field pore-waterpressure. It should correspond to that which is experi-enced in the field, and could range from 15–20 kPa atsites with a high groundwater table to over 200 kPa atdepth in a soil with a low groundwater table.
(b) Concrete mix: the concrete mix design should be similarto that used in the field.
(c) Casting method: the concrete should be cast and curedunder a wet concrete pressure representative of fieldconditions.
(d ) Shearing procedure: the shearing rate should correspondto that of a typical field load test. According to theInstitution of Civil Engineers (2007), this may range froman effective loading rate of approximately 3:7 3 10�3%design verification load (DVL) per second (or 100% DVLin 7.5 h) in a load-controlled maintained load test (MLT),to 0.01–0.02 mm/s in a displacement-controlled constantrate of penetration (CRP) test.
Evaluation of experimental techniquesIf the experimental techniques used in previous studies
are judged against the above criteria, it is found that none ofthe studies satisfies all of them. First, most studies either didnot report the filtration pressure, or only used a low pres-sure. In two cases, the filter cake was formed by manuallyplastering the soil or rock surface with a bentonite paste.Such a technique cannot properly replicate the field processof cake formation, and in particular the effect of time onfilter cake thickness. Second, most studies either did notspecify the concrete mix or used a cement mortar. Thislimits the possibility of investigating the effect of surfaceroughness – an important effect identified by Wates &Knight (1975) and also in this research. Wates & Knightused a concrete mix containing 9 mm coarse aggregate andfound that the aggregate particles protruded from the con-crete surface, which increased the surface roughness. Finally,fewer than half of the previous investigators cited in Table 1cast and cured the concrete under an applied pressure. Thisprocedure, termed ‘pressure casting’ by Cheng & Haberfield(1998), is essential for the formation of a realistic interface.
In addition to the cake formation procedure and the typeof concrete, differences in the test geometry are important.In the review of previous work it was found that allinvestigations, except for Hu et al.’s study which used ageotechnical centrifuge, either tested model piles in a pull-out device or used an interface shear box (Hu et al., 2006).Although a centrifuge can simulate the soil stresses morerealistically, it is not without problems. First, the effectivesizes of the bentonite and soil particles are increased by afactor of n, where ng is the centrifugal acceleration. Thiswould result in the formation of a filter cake on a gravelside wall at the prototype scale (fine sand at model scale)but in fact under field conditions a filter cake can only formon the surface of a gravel bed following a rheologicalblocking process in the pores (Hutchinson et al., 1975;Jefferis, 1992). Second, in a centrifuge model, it is difficultto use any concrete mix other than a highly plasticisedcement mortar to form the model pile, because of the
constraints of centrifuge package size and the need to castthe pile in-flight. This limits the potential for modelling theimportant effect of aggregate protrusion.
The principal advantages of testing scale model piles in apull-out device are that the geometry can be based on thatof real piles, and the boundary stress conditions can becontrolled. However, since the hydrostatic pressure in amodel drill hole will be limited by the depth of the modelhole, the filter cake cannot be formed under a representativepressure unless an external pressurisation device is used.Model piles tested in the laboratory typically suffer from thesame size limitations as the centrifuge, and therefore use ofa site-type concrete mix is not possible unless the diameterof the model pile is increased to about 150–200 mm. How-ever, if this is done, the size of the surrounding soil bed alsoneeds to be increased, and the assembly can no longer beaccommodated in a modified triaxial cell such as the oneused by Majano et al. (1994).
Given the limitations of model pile test methods, it wasconcluded that the most appropriate equipment for theinvestigation of interface shearing is a purpose-designedshear box, as only the materials immediately at and adjacentto the interface are modelled. This can readily be done at1:1 scale, as opposed to testing a whole pile but at a reducedscale. The specimen can therefore be kept reasonably small,while avoiding many of the limitations of the other methods.Therefore, an interface shear box with extended capabilitieswas designed and used to carry out the research described inthis study.
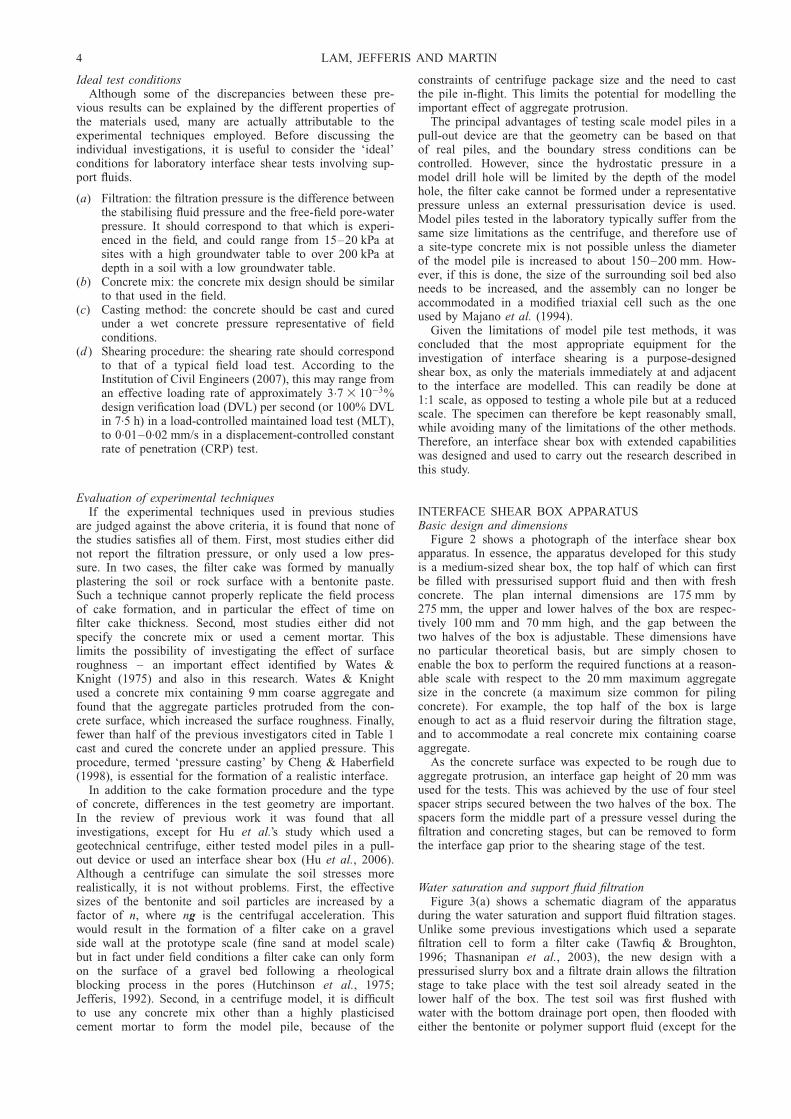
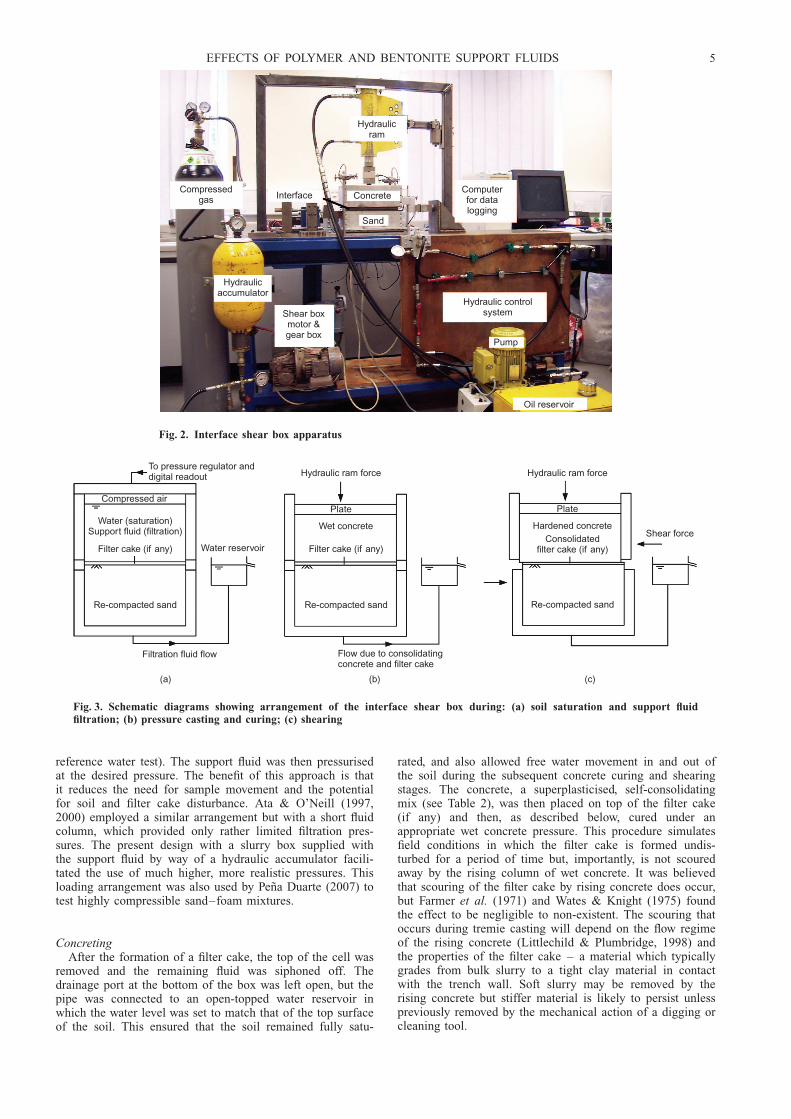
INTERFACE SHEAR BOX APPARATUSBasic design and dimensions
Figure 2 shows a photograph of the interface shear boxapparatus. In essence, the apparatus developed for this studyis a medium-sized shear box, the top half of which can firstbe filled with pressurised support fluid and then with freshconcrete. The plan internal dimensions are 175 mm by275 mm, the upper and lower halves of the box are respec-tively 100 mm and 70 mm high, and the gap between thetwo halves of the box is adjustable. These dimensions haveno particular theoretical basis, but are simply chosen toenable the box to perform the required functions at a reason-able scale with respect to the 20 mm maximum aggregatesize in the concrete (a maximum size common for pilingconcrete). For example, the top half of the box is largeenough to act as a fluid reservoir during the filtration stage,and to accommodate a real concrete mix containing coarseaggregate.
As the concrete surface was expected to be rough due toaggregate protrusion, an interface gap height of 20 mm wasused for the tests. This was achieved by the use of four steelspacer strips secured between the two halves of the box. Thespacers form the middle part of a pressure vessel during thefiltration and concreting stages, but can be removed to formthe interface gap prior to the shearing stage of the test.
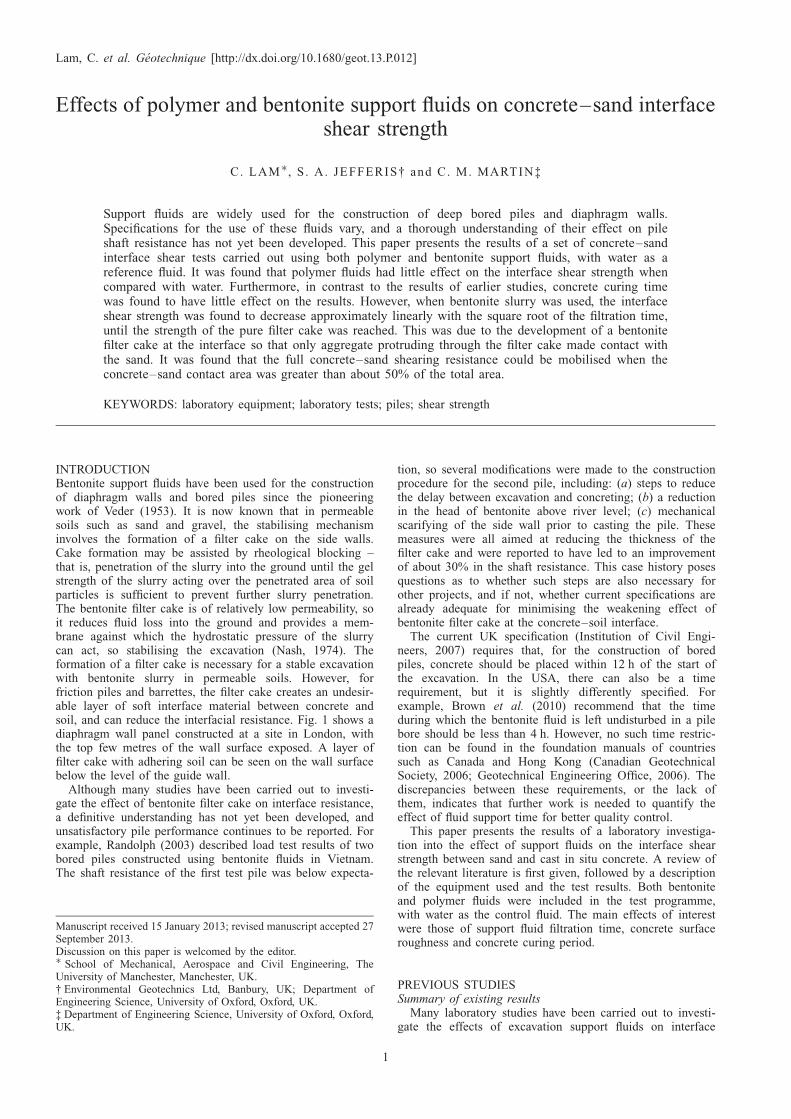
Water saturation and support fluid filtrationFigure 3(a) shows a schematic diagram of the apparatus
during the water saturation and support fluid filtration stages.Unlike some previous investigations which used a separatefiltration cell to form a filter cake (Tawfiq & Broughton,1996; Thasnanipan et al., 2003), the new design with apressurised slurry box and a filtrate drain allows the filtrationstage to take place with the test soil already seated in thelower half of the box. The test soil was first flushed withwater with the bottom drainage port open, then flooded witheither the bentonite or polymer support fluid (except for the
4 LAM, JEFFERIS AND MARTIN
reference water test). The support fluid was then pressurisedat the desired pressure. The benefit of this approach is thatit reduces the need for sample movement and the potentialfor soil and filter cake disturbance. Ata & O’Neill (1997,2000) employed a similar arrangement but with a short fluidcolumn, which provided only rather limited filtration pres-sures. The present design with a slurry box supplied withthe support fluid by way of a hydraulic accumulator facili-tated the use of much higher, more realistic pressures. Thisloading arrangement was also used by Pena Duarte (2007) totest highly compressible sand–foam mixtures.
ConcretingAfter the formation of a filter cake, the top of the cell was
removed and the remaining fluid was siphoned off. Thedrainage port at the bottom of the box was left open, but thepipe was connected to an open-topped water reservoir inwhich the water level was set to match that of the top surfaceof the soil. This ensured that the soil remained fully satu-
rated, and also allowed free water movement in and out ofthe soil during the subsequent concrete curing and shearingstages. The concrete, a superplasticised, self-consolidatingmix (see Table 2), was then placed on top of the filter cake(if any) and then, as described below, cured under anappropriate wet concrete pressure. This procedure simulatesfield conditions in which the filter cake is formed undis-turbed for a period of time but, importantly, is not scouredaway by the rising column of wet concrete. It was believedthat scouring of the filter cake by rising concrete does occur,but Farmer et al. (1971) and Wates & Knight (1975) foundthe effect to be negligible to non-existent. The scouring thatoccurs during tremie casting will depend on the flow regimeof the rising concrete (Littlechild & Plumbridge, 1998) andthe properties of the filter cake – a material which typicallygrades from bulk slurry to a tight clay material in contactwith the trench wall. Soft slurry may be removed by therising concrete but stiffer material is likely to persist unlesspreviously removed by the mechanical action of a digging orcleaning tool.
Hydraulicram
Compressedgas
Hydraulicaccumulator
Interface Concrete
Sand
Oil reservoir
Pump
Hydraulic controlsystemShear box
motor &gear box
Computerfor datalogging
Fig. 2. Interface shear box apparatus
To pressure regulator anddigital readout
Compressed air
Water (saturation)Support fluid (filtration)
Filter cake (if any)
Re-compacted sand
Filtration fluid flow
Water reservoir
(a) (b) (c)
Hydraulic ram force
Plate
Wet concrete
Filter cake (if any)
Re-compacted sand
Flow due to consolidatingconcrete and filter cake
Hydraulic ram force
Plate
Hardened concreteConsolidated
filter cake (if any)
Re-compacted sand
Shear force
Fig. 3. Schematic diagrams showing arrangement of the interface shear box during: (a) soil saturation and support fluidfiltration; (b) pressure casting and curing; (c) shearing
EFFECTS OF POLYMER AND BENTONITE SUPPORT FLUIDS 5
Concrete pressurisation and curingFigure 3(b) is a diagram of the apparatus during the
concrete pressurisation and curing stage. As shown, thenormal pressure was provided by a hydraulic ram withthe capacity to apply up to 800 kPa. This is sufficient toreplicate most field situations, as for a 30 m deep fluid-supported excavation the wet concrete pressure should onlybe about 450 kPa, according to the prediction equation givenby Lings et al. (1994). After the required curing period, theram pressure could be adjusted to provide the requirednormal stress for the shearing tests. However, for the testsreported in this study the ram pressure was left unchanged,effectively assuming that the full concrete pressure was‘locked in’ after the curing process. In the field, the validityof this assumption will depend, among other factors, on thedegree of saturation of the soil surrounding the pile. If thesoil is fully saturated, the pile concrete will expand duringcuring due to water absorption and the contact pressure willincrease; the opposite will be true for soil holding littlewater in the pores (Lam & Jefferis, 2012). In this study, theconcrete was cured inside the box at a constant roomtemperature of 208C. The curing period was typically 7 daysexcept for one test where the curing period was 3 days.
ShearingFigure 3(c) is a diagram of the apparatus during the
shearing stage. After the specified concrete curing period,the spacers between the top and bottom halves of the boxwere removed to form the interface gap. Any filter cake thatwas formed at the interface during the filtration stage couldnow be seen from the side. For the shearing test the lowerhalf of the box was displaced at a constant rate of 2 mm/min (0.033 mm/s) until a maximum displacement of 15 mmwas reached. This shearing rate is similar to that of a typicaldisplacement-controlled (CRP) field test (Institution of CivilEngineers, 2007). At this rate, coarse-grained soils in thelower box will remain fully drained, but any bentonite filtercake that is present at the interface will be sheared un-drained due to its significantly lower permeability (in theorder of 10�10 m/s according to Jefferis, 1992). It may benoted that Henry et al. (1998) used a shearing rate of0.0025 mm/min for their tests in an effort to ensure com-plete drainage of both the soil and the filter cake. Thepresent tests could have been carried out at a similar rate,but there would have been a risk of drying of the filter cakeas its outer surface was exposed by the removal of thespacers prior to shearing.
TEST CONDITIONS AND MATERIAL PROPERTIESTest conditions
For interface shear tests involving support fluids, no oneset of test conditions applies to all cases since the material
properties and pressures (pore water, support fluid, wet con-crete) are all site specific. For this study, a site at Stratfordin East London was used as a representative UK case. Thissite is located 0.5 km south-east of the Stratford Interna-tional station and bored piles were installed down to 27 mbelow ground level. The ground conditions consist of 6.5 mof made ground, 13 m of Lambeth Clay and at least 14 m ofThanet Sand (Lam et al., 2010a). The groundwater table inthe deep aquifer was reduced to about 30.5 m below groundlevel due to dewatering at the nearby Stratford Internationalstation box. The pore-water pressure in the Thanet Sand,over the length of the pile, was therefore zero. The bentonitefluid pressure within the pile bore was hydrostatic and wascalculated using a fresh slurry density of 1.02 g/cm3: Thewet concrete pressure was calculated using the methodproposed by Lings et al. (1994), in which the concretepressure is assumed to have a simple bilinear profile and thepoint of the transition, known as the critical depth, is takenas one-third of the excavation depth. The average bentoniteand concrete pressures for the pile section in the ThanetSand layer were estimated to be 230 and 360 kPa respec-tively. These values were used as the filtration and concretecuring pressures in the laboratory tests.
Concrete propertiesDetails of the concrete mix used for the tests are given in
Table 2. This is an actual piling concrete mix as developedby a UK concrete supplier, containing a superplasticiser anddesigned to be self-consolidating. The maximum aggregatesize is 20 mm, which is typical for high-workability founda-tion concrete. The target slump of this mix is 175 mm(slump class S4) and the 28-day cube strength is about50 MPa.
Thanet Sand propertiesSamples of Thanet Sand were taken from the East London
site. Based on a sieve analysis, the D10, D30 and D60 particlesizes are 0.07, 0.1 and 0.14 mm respectively. These sizes arefine enough to prevent any deep penetration of the bentonitefluid (Jefferis, 1992) but a filter cake will form as thepermeability is relatively high (�2 3 10�5 m/s, determinedby the constant head method on recompacted samples) com-pared with that of a bentonite filter cake (in the order of10�10 m/s).
The shear strength parameters of the Thanet Sand weredetermined using both a standard shear box (60 mm 360 mm) and the extended interface shear box (175 mm 3275 mm) working in sand-on-sand mode by filling the upperhalf with sand instead of concrete. The sand was compactedusing a vibrating hammer to a dry density of 1400� 25 kg/m3:This corresponds to a relative density of 68� 7% (the mini-mum and maximum dry densities of this sand have been
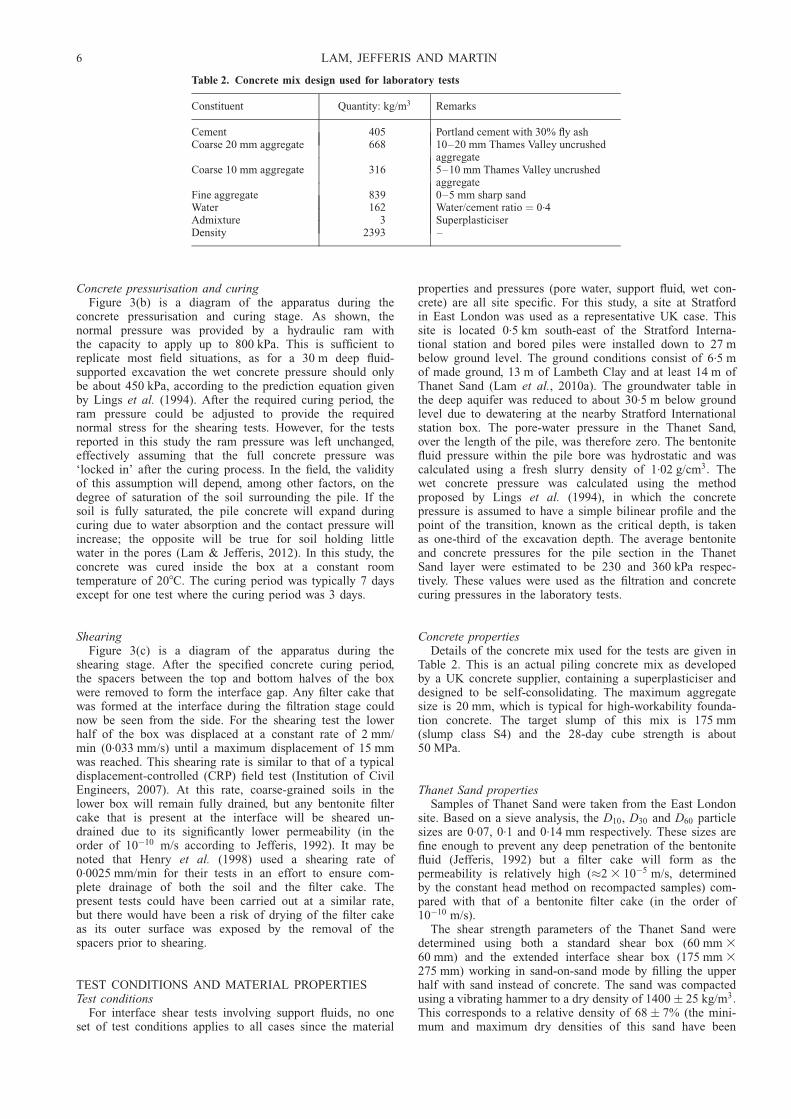
Table 2. Concrete mix design used for laboratory tests
Constituent Quantity: kg/m3 Remarks
Cement 405 Portland cement with 30% fly ashCoarse 20 mm aggregate 668 10–20 mm Thames Valley uncrushed
aggregateCoarse 10 mm aggregate 316 5–10 mm Thames Valley uncrushed
aggregateFine aggregate 839 0–5 mm sharp sandWater 162 Water/cement ratio ¼ 0.4Admixture 3 SuperplasticiserDensity 2393 –
6 LAM, JEFFERIS AND MARTIN
determined as 1200 and 1520 kg/m3 respectively). The peakangle of shearing resistance, �9p, was found to be 368 over thestress range of interest. Troughton (1992) also reported thesame peak angle on recompacted samples from a site inCanary Wharf. According to Ventouras & Coop (2009), the �9pof undisturbed Thanet Sand can range from 308 to 398 intriaxial tests.
Polymer fluid propertiesThe polymer used was a synthetic polymer system known
as SlurryPro CDP supplied by KB International. First, 1 kg/m3
of CDP base polymer was mixed at low shear for 45 min withwater to which a small amount of potassium hydroxide hadbeen added, which raised the pH to 11. LA-1 thickener at aquantity of 0.08 kg/m3 was then added to improve the viscos-ity of the fluid further. Other additives such as weighting andfluid loss control agents are available for challenging groundconditions but were not used in this study. The properties ofthe prepared fluid were determined using the test methodsprescribed by the Federation of Piling Specialists (2006) andthe results are given in Table 3. There are currently nocommonly accepted compliance values for polymers, so nocomparison is made between the properties of bentonite slurryand the polymer fluid, although it may be noted that thepolymer fluid did not form a filter cake and had a much higherfluid loss than the bentonite slurry. Discussion of the stabilisa-tion mechanism of polymers, which Lam et al. (2010b) andJefferis et al. (2011) explain is not by filter cake formation, isbeyond the scope of this paper.
Bentonite fluid propertiesThe bentonite used was a sodium-activated bentonite
known as Berkbent 163, a civil engineering grade productsupplied by Tolsa UK and commonly used for foundationprojects in the UK (e.g. Suckling et al., 2011). It was mixedwith water at 40 kg/m3 using a 5000 r/min laboratory mixerfor 30 min, allowed to hydrate for 24 h, and then brieflyremixed before use. The properties of the bentonite slurrywere determined using the same methods as for the polymerfluid, and the results are included in Table 3. It can be seenthat its properties fulfil all the requirements of the Institutionof Civil Engineers (2007) specification. The thixotropicproperty of this bentonite slurry can be found in the paperby Jefferis & Lam (2012).
Bentonite filter cake propertiesTo aid the interpretation of the interface shear test results,
the properties of the bentonite filter cake under the simu-lated field conditions of the East London site were studied.Filter cakes were formed in a standard filter press (American
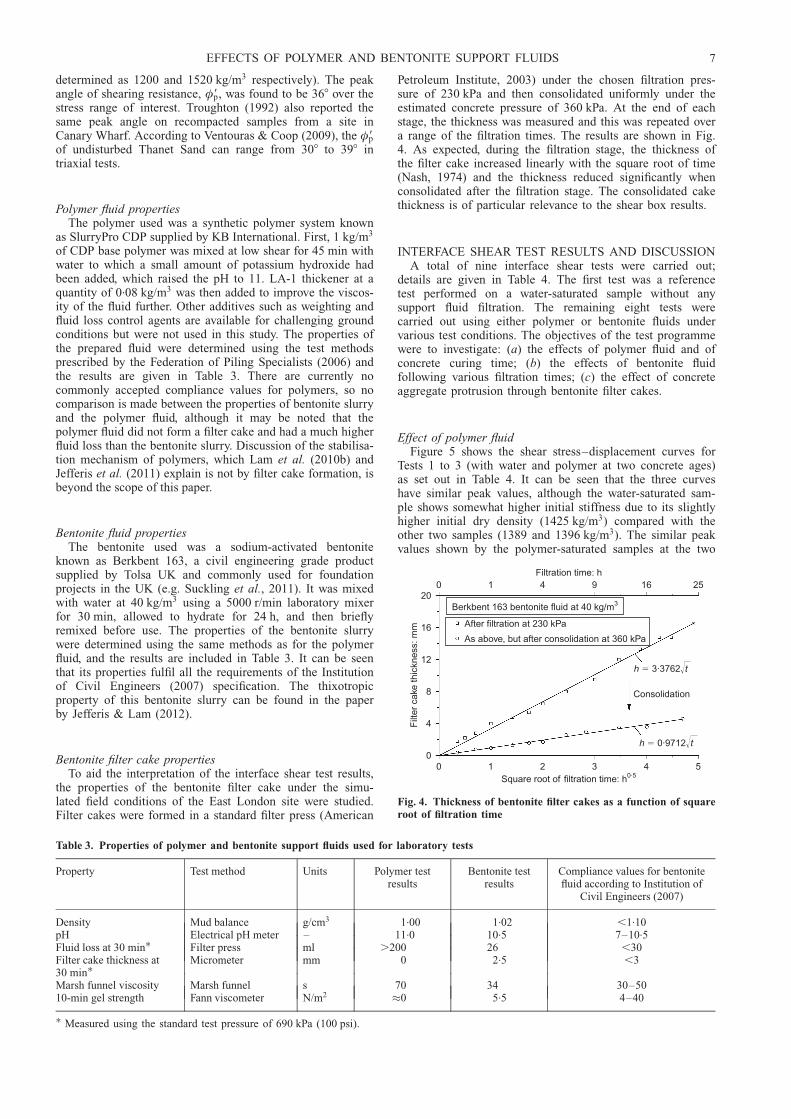
Petroleum Institute, 2003) under the chosen filtration pres-sure of 230 kPa and then consolidated uniformly under theestimated concrete pressure of 360 kPa. At the end of eachstage, the thickness was measured and this was repeated overa range of the filtration times. The results are shown in Fig.4. As expected, during the filtration stage, the thickness ofthe filter cake increased linearly with the square root of time(Nash, 1974) and the thickness reduced significantly whenconsolidated after the filtration stage. The consolidated cakethickness is of particular relevance to the shear box results.
INTERFACE SHEAR TEST RESULTS AND DISCUSSIONA total of nine interface shear tests were carried out;
details are given in Table 4. The first test was a referencetest performed on a water-saturated sample without anysupport fluid filtration. The remaining eight tests werecarried out using either polymer or bentonite fluids undervarious test conditions. The objectives of the test programmewere to investigate: (a) the effects of polymer fluid and ofconcrete curing time; (b) the effects of bentonite fluidfollowing various filtration times; (c) the effect of concreteaggregate protrusion through bentonite filter cakes.
Effect of polymer fluidFigure 5 shows the shear stress–displacement curves for
Tests 1 to 3 (with water and polymer at two concrete ages)as set out in Table 4. It can be seen that the three curveshave similar peak values, although the water-saturated sam-ple shows somewhat higher initial stiffness due to its slightlyhigher initial dry density (1425 kg/m3) compared with theother two samples (1389 and 1396 kg/m3). The similar peakvalues shown by the polymer-saturated samples at the two
Table 3. Properties of polymer and bentonite support fluids used for laboratory tests
Property Test method Units Polymer testresults
Bentonite testresults
Compliance values for bentonitefluid according to Institution of
Civil Engineers (2007)
Density Mud balance g/cm3 1.00 1.02 ,1.10pH Electrical pH meter – 11.0 10.5 7–10.5Fluid loss at 30 min� Filter press ml .200 26 ,30Filter cake thickness at30 min�
Micrometer mm 0 2.5 ,3
Marsh funnel viscosity Marsh funnel s 70 34 30–5010-min gel strength Fann viscometer N/m2 �0 5.5 4–40
� Measured using the standard test pressure of 690 kPa (100 psi).
0
4
8
12
16
200 1 4 9 16 25
Filtration time: h
Filt
er c
ake
thic
knes
s: m
m
Square root of filtration time: h0·50 1 2 3 4 5
Berkbent 163 bentonite fluid at 40 kg/m3
After filtration at 230 kPa
As above, but after consolidation at 360 kPa
h t3·3762� �
h t0·9712� �
Consolidation
Fig. 4. Thickness of bentonite filter cakes as a function of squareroot of filtration time
EFFECTS OF POLYMER AND BENTONITE SUPPORT FLUIDS 7
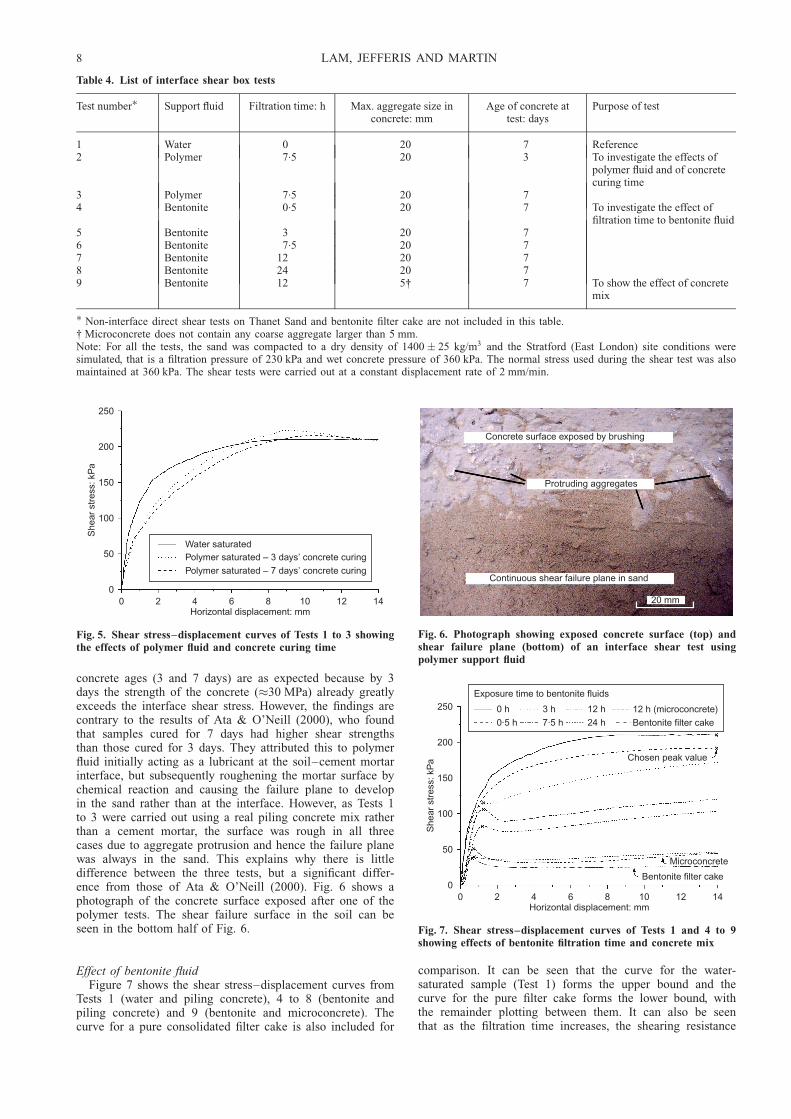
concrete ages (3 and 7 days) are as expected because by 3days the strength of the concrete (�30 MPa) already greatlyexceeds the interface shear stress. However, the findings arecontrary to the results of Ata & O’Neill (2000), who foundthat samples cured for 7 days had higher shear strengthsthan those cured for 3 days. They attributed this to polymerfluid initially acting as a lubricant at the soil–cement mortarinterface, but subsequently roughening the mortar surface bychemical reaction and causing the failure plane to developin the sand rather than at the interface. However, as Tests 1to 3 were carried out using a real piling concrete mix ratherthan a cement mortar, the surface was rough in all threecases due to aggregate protrusion and hence the failure planewas always in the sand. This explains why there is littledifference between the three tests, but a significant differ-ence from those of Ata & O’Neill (2000). Fig. 6 shows aphotograph of the concrete surface exposed after one of thepolymer tests. The shear failure surface in the soil can beseen in the bottom half of Fig. 6.
Effect of bentonite fluidFigure 7 shows the shear stress–displacement curves from
Tests 1 (water and piling concrete), 4 to 8 (bentonite andpiling concrete) and 9 (bentonite and microconcrete). Thecurve for a pure consolidated filter cake is also included for
comparison. It can be seen that the curve for the water-saturated sample (Test 1) forms the upper bound and thecurve for the pure filter cake forms the lower bound, withthe remainder plotting between them. It can also be seenthat as the filtration time increases, the shearing resistance
Table 4. List of interface shear box tests
Test number� Support fluid Filtration time: h Max. aggregate size inconcrete: mm
Age of concrete attest: days
Purpose of test
1 Water 0 20 7 Reference2 Polymer 7.5 20 3 To investigate the effects of
polymer fluid and of concretecuring time
3 Polymer 7.5 20 74 Bentonite 0.5 20 7 To investigate the effect of
filtration time to bentonite fluid5 Bentonite 3 20 76 Bentonite 7.5 20 77 Bentonite 12 20 78 Bentonite 24 20 79 Bentonite 12 5† 7 To show the effect of concrete
mix
� Non-interface direct shear tests on Thanet Sand and bentonite filter cake are not included in this table.† Microconcrete does not contain any coarse aggregate larger than 5 mm.Note: For all the tests, the sand was compacted to a dry density of 1400� 25 kg/m3 and the Stratford (East London) site conditions weresimulated, that is a filtration pressure of 230 kPa and wet concrete pressure of 360 kPa. The normal stress used during the shear test was alsomaintained at 360 kPa. The shear tests were carried out at a constant displacement rate of 2 mm/min.
0
50
100
150
200
250
0 2 4 6 8 10 12 14
She
ar s
tres
s: k
Pa
Horizontal displacement: mm
Water saturatedPolymer saturated – 3 days’ concrete curing
Polymer saturated – 7 days’ concrete curing
Fig. 5. Shear stress–displacement curves of Tests 1 to 3 showingthe effects of polymer fluid and concrete curing time
Concrete surface exposed by brushing
Protruding aggregates
Continuous shear failure plane in sand
20 mm
Fig. 6. Photograph showing exposed concrete surface (top) andshear failure plane (bottom) of an interface shear test usingpolymer support fluid
0
50
100
150
200
250
0 2 4 6 8 10 12 14
She
ar s
tres
s: k
Pa
Horizontal displacement: mm
Bentonite filter cake
Microconcrete
Chosen peak value
0 h
0·5 h
3 h
7·5 h
12 h
24 h
12 h (microconcrete)
Bentonite filter cake
Exposure time to bentonite fluids
Fig. 7. Shear stress–displacement curves of Tests 1 and 4 to 9showing effects of bentonite filtration time and concrete mix
8 LAM, JEFFERIS AND MARTIN
decreases, and that after 24 h of filtration the resistanceapproaches that of the filter cake. It is interesting to notethat Henry et al. (1998) reported a similar finding but afteronly 6 h of filtration. This difference is possibly becauseHenry et al. did not use concrete but a soil–bentonite mix,and thus the effects of aggregate protrusion may have beenmore limited. Lastly, it can be seen that, for Tests 5 to 8 (3to 24 h of filtration), the shearing resistance increased againafter the initial peak – a behaviour also observed byArwanitaki et al. (2007) in some of their direct interfaceshear tests. The post-peak rise seen in this study is believedto be an experimental effect, which is due to the sandresistance being mobilised by the slightly eccentric verticalload at large shear displacements. Had the tests been con-ducted in ring shear mode, the post-peak rise probablywould not have occurred. As it is the initial peak strengththat is of interest, the post-peak rise is ignored and the ‘true’inferred peak values are marked by crosses on the plot. It isworth noting that Broms & Hill (1973) also found a post-peak rise in the shaft resistance of a step-tapered pile, whichwas driven into a hole pre-drilled under bentonite slurry, andthat no such behaviour was found in a similar pile installedin a hole formed with water. The reason for the post-peakrise in the first pile was probably the resistance of the sandbeing increasingly mobilised by the upper sections of thetapered pile at large displacements, at which point the shearstrength of the filter cake had been overcome and was lesssignificant.
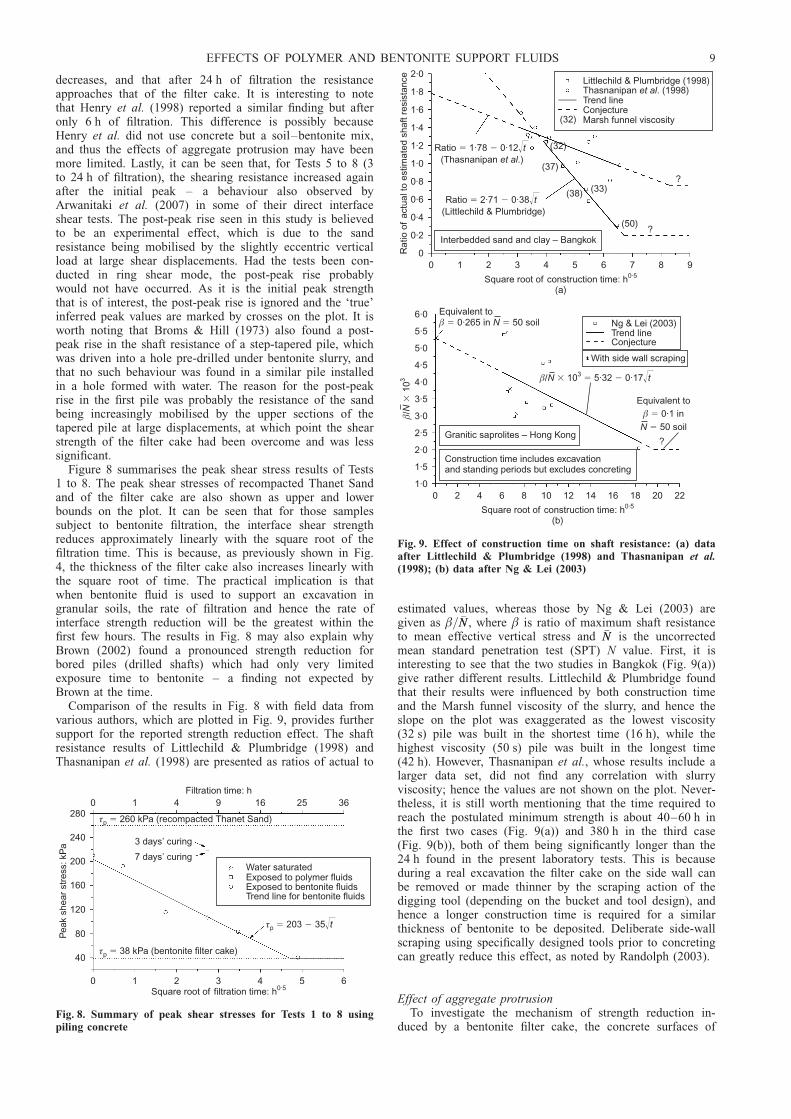
Figure 8 summarises the peak shear stress results of Tests1 to 8. The peak shear stresses of recompacted Thanet Sandand of the filter cake are also shown as upper and lowerbounds on the plot. It can be seen that for those samplessubject to bentonite filtration, the interface shear strengthreduces approximately linearly with the square root of thefiltration time. This is because, as previously shown in Fig.4, the thickness of the filter cake also increases linearly withthe square root of time. The practical implication is thatwhen bentonite fluid is used to support an excavation ingranular soils, the rate of filtration and hence the rate ofinterface strength reduction will be the greatest within thefirst few hours. The results in Fig. 8 may also explain whyBrown (2002) found a pronounced strength reduction forbored piles (drilled shafts) which had only very limitedexposure time to bentonite – a finding not expected byBrown at the time.
Comparison of the results in Fig. 8 with field data fromvarious authors, which are plotted in Fig. 9, provides furthersupport for the reported strength reduction effect. The shaftresistance results of Littlechild & Plumbridge (1998) andThasnanipan et al. (1998) are presented as ratios of actual to
estimated values, whereas those by Ng & Lei (2003) aregiven as �=�NN , where � is ratio of maximum shaft resistanceto mean effective vertical stress and �NN is the uncorrectedmean standard penetration test (SPT) N value. First, it isinteresting to see that the two studies in Bangkok (Fig. 9(a))give rather different results. Littlechild & Plumbridge foundthat their results were influenced by both construction timeand the Marsh funnel viscosity of the slurry, and hence theslope on the plot was exaggerated as the lowest viscosity(32 s) pile was built in the shortest time (16 h), while thehighest viscosity (50 s) pile was built in the longest time(42 h). However, Thasnanipan et al., whose results include alarger data set, did not find any correlation with slurryviscosity; hence the values are not shown on the plot. Never-theless, it is still worth mentioning that the time required toreach the postulated minimum strength is about 40–60 h inthe first two cases (Fig. 9(a)) and 380 h in the third case(Fig. 9(b)), both of them being significantly longer than the24 h found in the present laboratory tests. This is becauseduring a real excavation the filter cake on the side wall canbe removed or made thinner by the scraping action of thedigging tool (depending on the bucket and tool design), andhence a longer construction time is required for a similarthickness of bentonite to be deposited. Deliberate side-wallscraping using specifically designed tools prior to concretingcan greatly reduce this effect, as noted by Randolph (2003).
Effect of aggregate protrusionTo investigate the mechanism of strength reduction in-
duced by a bentonite filter cake, the concrete surfaces of
40
80
120
160
200
240
2800 1 4 9 16 25 36
0 1 2 3 4 5 6
Filtration time: h
Pea
k sh
ear
stre
ss: k
Pa
Square root of filtration time: h0·5
τp 260 kPa (recompacted Thanet Sand)�
3 days’ curing
7 days’ curing
τp 38 kPa (bentonite filter cake)�
τp 203 35� � �t
Water saturatedExposed to polymer fluidsExposed to bentonite fluidsTrend line for bentonite fluids
Fig. 8. Summary of peak shear stresses for Tests 1 to 8 usingpiling concrete
0
0·2
0·4
0·6
0·8
1·0
1·2
1·4
1·6
1·8
2·0
0 1 2 3 4 5 6 7 8 9
Ra
tio o
fac
tual
to e
stim
ate
d sh
aft r
esis
tanc
e
Square root of construction time: h(a)
0·5
Littlechild & Plumbridge (1998)Thasnanipan . (1998)et alTrend lineConjecture
(32) Marsh funnel viscosity
?
?(50)
(38) (33)
(37)
(32)
Interbedded sand and clay – Bangkok
Ratio 1·78 0·12� � �t(Thasnanipan .)et al
Ratio 2·71 0·38� � �t(Littlechild & Plumbridge)
1·0
1·5
2·0
2·5
3·0
3·5
4·0
4·5
5·0
5·5
6·0
0 2 4 6 8 10 12 14 16 18 20 22
Square root of construction time: h(b)
0·5
�/10
N�
3
Ng & Lei (2003)Trend lineConjecture
With side wall scraping
?
Construction time includes excavationand standing periods but excludes concreting
Granitic saprolites – Hong Kong
Equivalent to0·265 in 50 soil� � �N
Equivalent to0·1 in
50 soil
� �
�N
�/ 10 5·32 0·17N t� � �3 �
Fig. 9. Effect of construction time on shaft resistance: (a) dataafter Littlechild & Plumbridge (1998) and Thasnanipan et al.(1998); (b) data after Ng & Lei (2003)
EFFECTS OF POLYMER AND BENTONITE SUPPORT FLUIDS 9
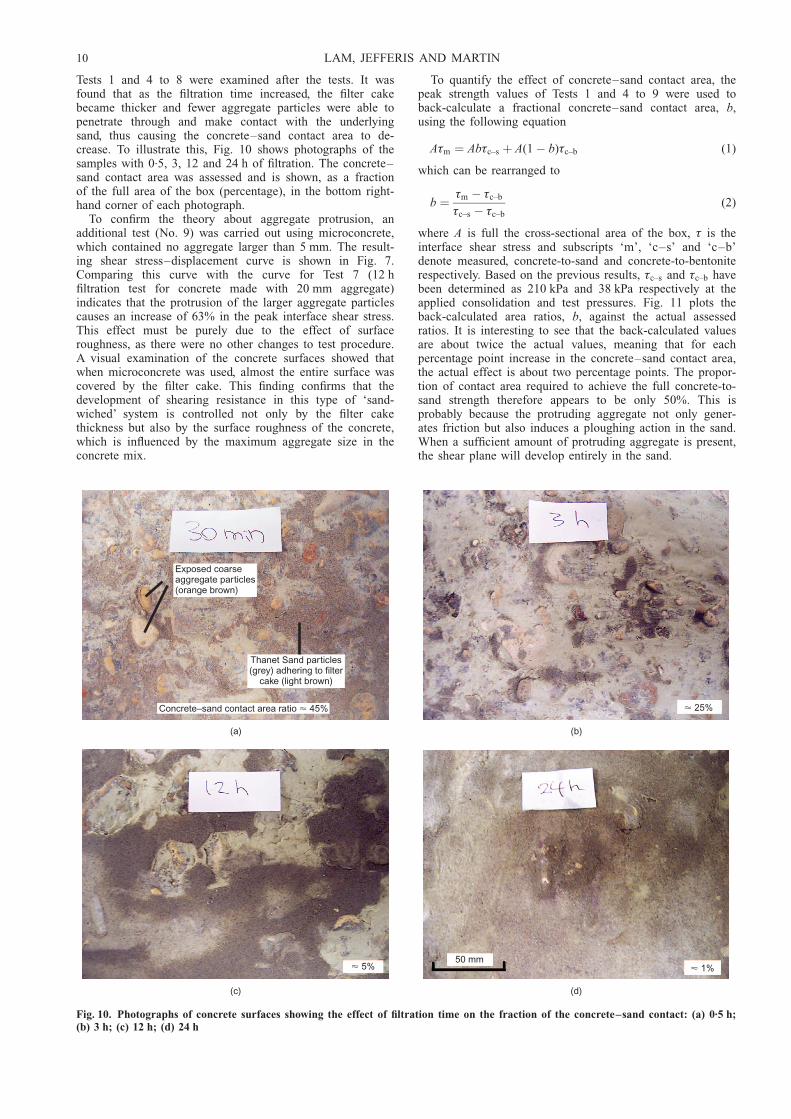
Tests 1 and 4 to 8 were examined after the tests. It wasfound that as the filtration time increased, the filter cakebecame thicker and fewer aggregate particles were able topenetrate through and make contact with the underlyingsand, thus causing the concrete–sand contact area to de-crease. To illustrate this, Fig. 10 shows photographs of thesamples with 0.5, 3, 12 and 24 h of filtration. The concrete–sand contact area was assessed and is shown, as a fractionof the full area of the box (percentage), in the bottom right-hand corner of each photograph.
To confirm the theory about aggregate protrusion, anadditional test (No. 9) was carried out using microconcrete,which contained no aggregate larger than 5 mm. The result-ing shear stress–displacement curve is shown in Fig. 7.Comparing this curve with the curve for Test 7 (12 hfiltration test for concrete made with 20 mm aggregate)indicates that the protrusion of the larger aggregate particlescauses an increase of 63% in the peak interface shear stress.This effect must be purely due to the effect of surfaceroughness, as there were no other changes to test procedure.A visual examination of the concrete surfaces showed thatwhen microconcrete was used, almost the entire surface wascovered by the filter cake. This finding confirms that thedevelopment of shearing resistance in this type of ‘sand-wiched’ system is controlled not only by the filter cakethickness but also by the surface roughness of the concrete,which is influenced by the maximum aggregate size in theconcrete mix.
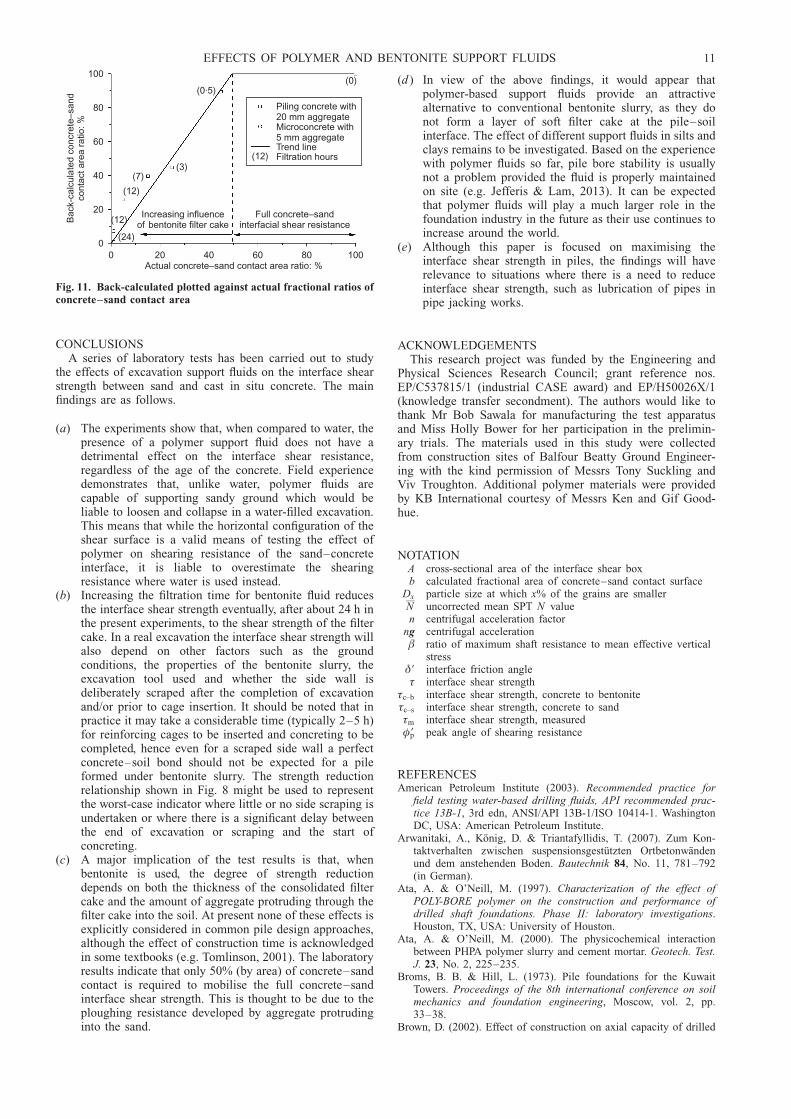
To quantify the effect of concrete–sand contact area, thepeak strength values of Tests 1 and 4 to 9 were used toback-calculate a fractional concrete–sand contact area, b,using the following equation
A�m ¼ Ab�c–s þ A(1� b)�c–b (1)
which can be rearranged to
b ¼ �m � �c–b
�c–s � �c–b
(2)
where A is full the cross-sectional area of the box, � is theinterface shear stress and subscripts ‘m’, ‘c–s’ and ‘c–b’denote measured, concrete-to-sand and concrete-to-bentoniterespectively. Based on the previous results, �c–s and �c–b havebeen determined as 210 kPa and 38 kPa respectively at theapplied consolidation and test pressures. Fig. 11 plots theback-calculated area ratios, b, against the actual assessedratios. It is interesting to see that the back-calculated valuesare about twice the actual values, meaning that for eachpercentage point increase in the concrete–sand contact area,the actual effect is about two percentage points. The propor-tion of contact area required to achieve the full concrete-to-sand strength therefore appears to be only 50%. This isprobably because the protruding aggregate not only gener-ates friction but also induces a ploughing action in the sand.When a sufficient amount of protruding aggregate is present,the shear plane will develop entirely in the sand.
(a) (b)
(c) (d)
Exposed coarseaggregate particles(orange brown)
Thanet Sand particles(grey) adhering to filter
cake (light brown)
Concrete–sand contact area ratio 45%� � 25%
� 5% � 1%50 mm
Fig. 10. Photographs of concrete surfaces showing the effect of filtration time on the fraction of the concrete–sand contact: (a) 0.5 h;(b) 3 h; (c) 12 h; (d) 24 h
10 LAM, JEFFERIS AND MARTIN
CONCLUSIONSA series of laboratory tests has been carried out to study
the effects of excavation support fluids on the interface shearstrength between sand and cast in situ concrete. The mainfindings are as follows.
(a) The experiments show that, when compared to water, thepresence of a polymer support fluid does not have adetrimental effect on the interface shear resistance,regardless of the age of the concrete. Field experiencedemonstrates that, unlike water, polymer fluids arecapable of supporting sandy ground which would beliable to loosen and collapse in a water-filled excavation.This means that while the horizontal configuration of theshear surface is a valid means of testing the effect ofpolymer on shearing resistance of the sand–concreteinterface, it is liable to overestimate the shearingresistance where water is used instead.
(b) Increasing the filtration time for bentonite fluid reducesthe interface shear strength eventually, after about 24 h inthe present experiments, to the shear strength of the filtercake. In a real excavation the interface shear strength willalso depend on other factors such as the groundconditions, the properties of the bentonite slurry, theexcavation tool used and whether the side wall isdeliberately scraped after the completion of excavationand/or prior to cage insertion. It should be noted that inpractice it may take a considerable time (typically 2–5 h)for reinforcing cages to be inserted and concreting to becompleted, hence even for a scraped side wall a perfectconcrete–soil bond should not be expected for a pileformed under bentonite slurry. The strength reductionrelationship shown in Fig. 8 might be used to representthe worst-case indicator where little or no side scraping isundertaken or where there is a significant delay betweenthe end of excavation or scraping and the start ofconcreting.
(c) A major implication of the test results is that, whenbentonite is used, the degree of strength reductiondepends on both the thickness of the consolidated filtercake and the amount of aggregate protruding through thefilter cake into the soil. At present none of these effects isexplicitly considered in common pile design approaches,although the effect of construction time is acknowledgedin some textbooks (e.g. Tomlinson, 2001). The laboratoryresults indicate that only 50% (by area) of concrete–sandcontact is required to mobilise the full concrete–sandinterface shear strength. This is thought to be due to theploughing resistance developed by aggregate protrudinginto the sand.
(d ) In view of the above findings, it would appear thatpolymer-based support fluids provide an attractivealternative to conventional bentonite slurry, as they donot form a layer of soft filter cake at the pile–soilinterface. The effect of different support fluids in silts andclays remains to be investigated. Based on the experiencewith polymer fluids so far, pile bore stability is usuallynot a problem provided the fluid is properly maintainedon site (e.g. Jefferis & Lam, 2013). It can be expectedthat polymer fluids will play a much larger role in thefoundation industry in the future as their use continues toincrease around the world.
(e) Although this paper is focused on maximising theinterface shear strength in piles, the findings will haverelevance to situations where there is a need to reduceinterface shear strength, such as lubrication of pipes inpipe jacking works.
ACKNOWLEDGEMENTSThis research project was funded by the Engineering and
Physical Sciences Research Council; grant reference nos.EP/C537815/1 (industrial CASE award) and EP/H50026X/1(knowledge transfer secondment). The authors would like tothank Mr Bob Sawala for manufacturing the test apparatusand Miss Holly Bower for her participation in the prelimin-ary trials. The materials used in this study were collectedfrom construction sites of Balfour Beatty Ground Engineer-ing with the kind permission of Messrs Tony Suckling andViv Troughton. Additional polymer materials were providedby KB International courtesy of Messrs Ken and Gif Good-hue.
NOTATIONA cross-sectional area of the interface shear boxb calculated fractional area of concrete–sand contact surface
Dx particle size at which x% of the grains are smallerN uncorrected mean SPT N valuen centrifugal acceleration factor
ng centrifugal acceleration� ratio of maximum shaft resistance to mean effective vertical
stress�9 interface friction angle� interface shear strength
�c–b interface shear strength, concrete to bentonite�c–s interface shear strength, concrete to sand�m interface shear strength, measured�9p peak angle of shearing resistance
REFERENCESAmerican Petroleum Institute (2003). Recommended practice for
field testing water-based drilling fluids, API recommended prac-tice 13B-1, 3rd edn, ANSI/API 13B-1/ISO 10414-1. WashingtonDC, USA: American Petroleum Institute.
Arwanitaki, A., Konig, D. & Triantafyllidis, T. (2007). Zum Kon-taktverhalten zwischen suspensionsgestutzten Ortbetonwandenund dem anstehenden Boden. Bautechnik 84, No. 11, 781–792(in German).
Ata, A. & O’Neill, M. (1997). Characterization of the effect ofPOLY-BORE polymer on the construction and performance ofdrilled shaft foundations. Phase II: laboratory investigations.Houston, TX, USA: University of Houston.
Ata, A. & O’Neill, M. (2000). The physicochemical interactionbetween PHPA polymer slurry and cement mortar. Geotech. Test.J. 23, No. 2, 225–235.
Broms, B. B. & Hill, L. (1973). Pile foundations for the KuwaitTowers. Proceedings of the 8th international conference on soilmechanics and foundation engineering, Moscow, vol. 2, pp.33–38.
Brown, D. (2002). Effect of construction on axial capacity of drilled
0
20
40
60
80
100
0 20 40 60 80 100
Bac
k-ca
lcul
ate
d co
ncre
te–s
and
cont
act a
rea
ratio
: %
Actual concrete–sand contact area ratio: %
(0)(0·5)
(3)(7)
(12)
(12)
(24)
Increasing influenceof bentonite filter cake
Full concrete–sandinterfacial shear resistance
Piling concrete with20 mm aggregateMicroconcrete with5 mm aggregateTrend line
(12) Filtration hours
Fig. 11. Back-calculated plotted against actual fractional ratios ofconcrete–sand contact area
EFFECTS OF POLYMER AND BENTONITE SUPPORT FLUIDS 11
foundations in Piedmont soils. J. Geotech. Geoenviron. Engng128, No. 12, 967–973.
Brown, D. A., Turner, J. P. & Castelli, R. J. (2010). Drilled shaftsconstruction procedures and LRFD design methods, ReportFHWA NHI-10–016. Washington, DC, USA: National HighwayInstitute, US Department of Transportation, Federal HighwayAdministration.
Canadian Geotechnical Society (2006). Canadian foundation engi-neering manual, 4th edn. Richmond, BC, Canada: CanadianGeotechnical Society.
Cernak, B., Dvorak, A., Hlavacek, J., Klein, K. & Petrasek, J.(1973). New approaches to problems of bearing capacity andsettlement of piles. Proceedings of the 8th international confer-ence on soil mechanics and foundation engineering, Moscow,vol. 2, pp. 67–74.
Cheng, F. & Haberfield, C. M. (1998). Laboratory study of theeffect of drilling fluids on piles socketed into soft rock. Pro-ceedings of the 2nd international symposium on the geotechnicsof hard soils–soft rocks, Naples, vol. 1, pp. 93–101.
Farmer, I. W., Buckley, P. J. C. & Sliwinski, Z. (1971). The effect ofbentonite on the skin friction of cast in-place piles. Behaviour ofPiles: Proceedings of conference organised by the Institutionof Civil Engineers, London, pp. 67–72. London, UK: Institutionof Civil Engineers.
Federation of Piling Specialists (2006). Bentonite support fluids incivil engineering, 2nd edn. Kent, UK: Federation of PilingSpecialists.
Geotechnical Engineering Office (2006). Foundation design andconstruction, Publication 1/2006. Hong Kong SAR, China:Geotechnical Engineering Office.
Henry, L. B., Filz, G. M. & Davidson, R. R. (1998). Formation andproperties of bentonite filter cakes. Proceedings of the ASCEannual convention: Filtration and drainage in geotechnical/geoenvironmental engineering, Boston, ASCE Geotechnical Spe-cial Publication No. 78, pp. 69–88. Reston, VA, USA: ASCE.
Hu, Z. (2003). Determining the optimum depth of drilled shaftssubject to combined torsion and lateral loads in saturated sandfrom centrifuge testing. Master’s dissertation, University of Flor-ida, Gainesville, FL, USA.
Hu, Z., McVay, M., Bloomquist, D., Herrera, R. & Lai, P. (2006).Influence of torque on lateral capacity of drilled shafts in sands.J. Geotech. Geoenviron. Engng., ASCE 132, No. 4, 456–464.
Hutchinson, M. T., Daw, G. P., Shotton, P. G. & James, A. N.(1975). The properties of bentonite slurries used in diaphragmwalling and their control. Proceedings of conference on dia-phragm walls and anchorages, London, pp. 33–39. London,UK: Institution of Civil Engineers.
Institution of Civil Engineers (2007). ICE specification for pilingand embedded retaining walls. London, UK: Thomas Telford.
Jefferis, S. A. (1992). Grouts and slurries. In Construction materialsreference book (ed. D. K. Doran), pp. 48/1–48/24. Oxford, UK:Butterworth-Heinemann.
Jefferis, S. A. & Lam, C. (2012). Letter to the Editor: Hydrauliccharacteristics of bentonite cake fabricated on cutoff walls.Clays Clay Miner. 60, No. 6, 557–560.
Jefferis, S. A. & Lam, C. (2013). Polymer support fluids: use andmisuse of innovative fluids in geotechnical works. Proceedingsof the 18th international conference on soil mechanics andgeotechnical engineering, Paris, vol. 4, pp. 3219–3222.
Jefferis, S. A., Troughton, V. & Lam, C. (2011). Polymer systemsfor fluid supported excavations. In Geotechnical issues in con-struction: short paper series and proceedings of 2nd conference,London, Report No. X513, pp. 7–12. London, UK: CIRIA.
Lam, C. & Jefferis, S. A. (2012). Reply to the discussion byFellenius on ‘Critical assessment of pile modulus determinationmethods’. Can. Geotech. J. 49, No. 5, 622–629.
Lam, C., Troughton, V., Jefferis, S. & Suckling, T. (2010a). Effectof support fluids on pile performance – a field trial in eastLondon. Ground Engng 43, No. 10, 28–31.
Lam, C., Jefferis, S. A. & Goodhue Jr, K. G. (2010b). Observationson viscosity reduction of PHPA polymer support fluids. Proceed-
ings of sessions of the GeoShanghai 2010 international confer-ence, Shanghai, ASCE Geotechnical Special Publication No.205, pp. 184–191. Reston, VA, USA: ASCE.
Lings, M. L., Ng, C. W. W. & Nash, D. F. T. (1994). The lateralpressure of wet concrete in diaphragm wall panels cast underbentonite. Proc. Instn. Civ. Engrs – Geotech. Engng 107, No. 3,163–172.
Littlechild, B. & Plumbridge, G. (1998). Effects of constructiontechnique on the behaviour of plain bored cast in situ pilesconstructed under drilling slurry. Proceedings of the 7th interna-tional conference exhibition on piling and deep foundations,Vienna, pp. 1.6.1–1.6.8.
Majano, R. E. & O’Neill, M. W. (1993). Effect of mineral andpolymer slurries on perimeter load transfer in drilled shafts,Report UHCE-93-1. Houston, TX, USA: University of Houston.
Majano, R. E., O’Neill, M. W. & Hassan, K. M. (1994). Perimeterload transfer in model drilled shafts formed under slurry.J. Geotech. Engng. 120, No. 12, 2136–2154.
Nash, K. L. (1974). Stability of trenches filled with fluids. J. Constr.Div. ASCE 100, No. 4, 533–542.
Ng, C. W. W. & Lei, G. H. (2003). Performance of long rectangularbarrettes in granitic saprolites. J. Geotech. Geoenviron. Engng.,ASCE 129, No. 8, 685–696.
Pena Duarte, M. A. (2007). Foam as a soil conditioner in tunnel-ling: physical and mechanical properties of conditioned sands.DPhil thesis, University of Oxford, UK.
Randolph, M. F. (2003). Science and empiricism in pile foundationdesign. Geotechnique 53, No. 10, 847–875, http://dx.doi.org/10.1680/geot.2003.53.10.847.
Shakir, R. R. & Zhu, J. (2010). An examination of the mechanicalinteraction of drilling slurries at the soil-concrete contact.J. Zhejiang Univ. – Sci. A (Appl. Sci. Engng) 11, No. 4, 294–304.
Suckling, T. P., Lam, C., Jefferis, S. A. & Pantling, C. J. (2011).Evaluation of causes of bleeding of free water from a bentoniteslurry. Proceedings of the 36th annual conference on deepfoundations, Boston, pp. 401–407.
Tawfiq, K. & Broughton, H. L. III (1996). Friction characteristicsof cohesionless soil penetrated by polymer and mineral slurries.Proceedings of the 4th materials engineering conference, Wa-shington, DC, vol. 2, pp. 1170–1178.
Thasnanipan, N., Baskaran, G. & Anwar, M. A. (1998). Effect ofconstruction time and bentonite viscosity on shaft capacity ofbored piles. Deep foundations on bored and auger piles: Pro-ceedings of the 3rd international geotechnical seminar on boredand auger piles, Ghent, Belgium (ed. W. F. Van Impe), pp. 171–177. Rotterdam, the Netherlands: Balkema.
Thasnanipan, N., Aye, Z. Z. & Boonyarak, T. (2003). Behaviour ofpolymer-based slurry for deep-seated bored piles in multi-layered soil of Bangkok. In Deep foundations on bored andauger piles: Proceedings of the 4th international geotechnicalseminar on bored and auger piles, Ghent, Belgium (ed. W. F.Van Impe), pp. 267–274. Rotterdam, the Netherlands: Millpress.
Tomlinson, M. J. (2001). Foundation design and construction, 7thedn. Harlow, UK: Pearson Education.
Troughton, V. M. (1992). The design and performance of founda-tions for the Canary Wharf development in London Docklands.Geotechnique 42, No. 3, 381–393, http://dx.doi.org/10.1680/geot.1992.42.3.381.
Veder, C. (1953). Method for the construction of impermeablediaphragms at great depth by means of thixotropic muds.Proceedings of the 3rd international conference on soil mech-anics and foundation engineering, Zurich, vol. 2, pp. 91–94 (inFrench).
Ventouras, K. & Coop, M. R. (2009). On the behaviour of ThanetSand: an example of an uncemented natural sand. Geotechnique59, No. 9, 727–738, http://dx.doi.org/10.1680/geot.7.00061.
Wates, J. A. & Knight, K. (1975). The effect of bentonite on theskin friction in cast-in-place piles and diaphragm walls. Pro-ceedings of the 6th Regional Conference for Africa on SoilMechanics and Foundation Engineering, Durban, vol. 1, pp.183–188.
12 LAM, JEFFERIS AND MARTIN