Embed Size (px)
Citation preview

Effects of Poor Workmanship on
Building Construction and Its Implication to Project
Management Practice: A Case Study in Addis Ababa City
Alsen Fromsa #1, Woyesa Ararsa #1, Emer T. Quezon*2
1# Construction Technology & Management, Ambo University Hachalu Hundessa Campus, Ambo University, Ambo, Oromia
Region, Ethiopia,
*2 Civil & Construction Engineering and Management Streams, Ambo University Hachalu Hundessa Campus, Ambo
University, Ambo, Oromia, Region, Ethiopia,
Abstract— The construction of building structure involves very complicated undertakings. It requires a trained workforce at the design
stage, approval process, supervision, and construction stages. Inferior quality of workmanship is one of the significant issues facing the
workforce to perceive and apply the proper construction methods and techniques following the quality control assurance for building
projects. This study considered some of the construction stakeholders participated in the implementation of projects in Addis Ababa
City. It focused on assessing and investigating poor workmanship on the quality of projects that included concreting works to accessible
ongoing construction sites across the study area. It involved determining the cause of low-level workmanship and identifying factors
that would significantly minimize the problems and increase client satisfaction. The study comprised of 20 construction sites, of which
55 questionnaires were collected. The data collected are related to the challenges facing the construction industry and concrete quality
as well. The causes and strategies applied to improve construction quality were analyzed using the study's variable. Results indicated
that inadequate construction management represented a low level of workmanship and a lack of training rated first with RII of 0.9556.
At the same time, the Workers' motivation was placed second with RII 0.775. Hence, it recommends close observation of construction
management factors like supervision, training, motivation, and good communication on-site to minimize the cost and effects associated
with poor workmanship when implementing building projects.
Keywords—Building industry, Cost, Time, Quality, Construction management factor, Poor workmanship.
I. INTRODUCTION
In today’s construction environment, public sector owners are finding themselves under increasing pressure to improve
project performance, complete projects faster, and reduce the cost of administering their construction programs. Construction is
a vast and an active sector, which is a backbone of the world’s economy in general and Ethiopia in particular; mobilizing an
enormous amount of various resources and budgets and embracing huge manpower by creating a large job opportunity [ 1, 2].
Building construction is a challenging project to implement. It requires a trained workforce from inception up to completion.
The building design commences with a site survey that indicates proper dimensions of the plot. To develop the plot, the client
needs to engage the services of experts in the industry. Typically, the professional or expert building team should comprise an
architect, engineers, and a quantity surveyor. These teams design buildings and the surrounding environment and submit them
to the appropriate authority for approval [3]. The project quality, cost, and timely delivery of completed structure in the
construction industry depend on workmanship. The workman's skill, experience, and personal ability go a long way in
determining the workmanship quality, measuring their efficiency and effectiveness. The failure in buildings structure comes in
various forms and degrees of severity, the worst of which is a collapse. Poor workmanship makes it difficult for workers to
perceive and apply quality control concepts and building production tolerance limits. This results in inferior construction
methods and techniques, which may finally lead to building collapse [4].
The construction industries are an intrinsic part of the countries economy and are often seen as a prime mover of economic
growth, especially in developing countries. Recently, the Ethiopian construction industry has experienced considerable growth in
construction activities [5]. The high urbanization rate shows heightened increasing demand by residential and commercial building
space, which has increased the number of construction activities. Due to its relatively labor-intensive nature, construction works
provide employment opportunities for many people; skilled, semi-skilled, and unskilled. And concrete is one of the widely used
construction material. It is composed of cement, fine and coarse aggregate, water, and other mineral admixtures. And the quality
of concrete is mostly affected by the quality of workmanship and the quality of ingredients used [6].
According to previous research conducted by the Building Research Establishment (BRE), 90% of building failures are due
to problems in the design and construction stages [7]. These problems include poor communication, inadequate information,
inability to check information, inadequate check sand controls, lack of technical expertise and skills, and insufficient feedback
leading to recurring errors. Most defects in construction projects are due to human error. It means we can say that human error
happened due to poor performance in workmanship during the construction of a building. One of the issues of this condition is
due to poor quality of workmanship during a construction project. It will affect occupants' quality of life and give a bad image of
Journal of Xidian University
VOLUME 14, ISSUE 9, 2020
ISSN No:1001-2400
http://xadzkjdx.cn/
https://doi.org/10.37896/jxu14.9/128
1174

the building's parties. Nowadays, Ethiopia's construction is one of the major labor-intensive industries, and less many of the
workmanships are unskilled laborers. Due to these and other factors, concrete quality becomes poor during mixing, casting,
vibrating, and curing fresh concrete processes. A block of fresh concrete needs proper treatment at every process until it becomes
hardened. This paper discussed some variables related to the low quality of workmanship in construction projects and their effect
on concrete quality. The objectives of the study are: to identify the different factors that will influence poor construction
workmanship; to correlate and analyze the group of factors relating the effect of construction workmanship and quality; and to
identify and recommend measures taken by the responsible stakeholders in ensuring proper quality of workmanships.
This study's scope is mainly focused on twenty construction sites in Addis Ababa, Ethiopia, where most of the contractors
and consultants of buildings are available and assessed the significant impacts of workmanship in different construction sites of
Addis Ababa. The study is considered a small, medium, and large level of building enterprises in Addis Ababa.
This study's significance is to reduce the effect of poor workmanship in Ethiopia's construction industry, directly affecting the
quality of concrete (i.e.) cost, time, and quality to an acceptable level. Suppose the cause of low-level workmanship can be
established and a solution identified. In that case, poor workmanship problems can be eliminated or significantly minimized,
increasing client satisfaction. It will enable the contractor and the consultant to be honest and confidential to the work that he/she
conducted, which will signify a vital role in the construction industry as a whole.
II. STUDY AREA AND RESEARCH METHODOLOGY
2.1 Study Area
Addis Ababa is Ethiopia's capital city and found in the western margin of the Ethiopian Rift valley. Its geographical
coordination is 90 0’ 19.4436” N, 380 45' 48.9996" E and 2355m above sea level. The study area has been located in Addis Ababa,
Ethiopia [8].
Fig. 1 Map of Addis Ababa (Source: Google Map 2020)
2.2 Research Design
Research design implies a plan and structure of investigation to obtain answers to research questions. A descriptive study is
concerned with determining the frequency with which something occurs or the relationship between variables. For this study,
descriptive research design will be used. Descriptive design is used to obtain information concerning the phenomena' status to
describe what exists concerning variables in a situation by asking individuals and questioners about their perceptions, attitudes,
behavior, or values. This approach would be appropriate for this study since the researcher intends to collect detailed information
through descriptions and observations, making it useful to identify variables under the investigation.
2.3 Target Population
Addis Ababa has many construction sites from those sites. The workmanship level is observed from work already done on-
site. In contrast, other data, such as the cause of poor workmanship, are collected through interviews and structured questionnaires
from various professionals and workers involved. The target population in this study comprised a total of 22 contraction sites.
2.4 Determining a sample size
The sample size was then calculated as follow [9, 10]:
𝑛 =𝑍2∗𝑝∗𝑞∗𝑁
𝑒2∗(𝑁−1)+𝑧2∗𝑝∗𝑞.........................................................................................................(1)
Where:
N= size of the population
n= sample of size
P= sample proportion (q= 1-P)
e= acceptable error (e= 0.05) that is estimated to be within 5% of the true value
Journal of Xidian University
VOLUME 14, ISSUE 9, 2020
ISSN No:1001-2400
http://xadzkjdx.cn/
https://doi.org/10.37896/jxu14.9/128
1175
Z= value of standard variant at a confidence level
2.5 Data Collection Process
Questionnaires, interviews, and observation are the methods of data collection to be used for this study. The data on the level
of workmanship at each sample site, which is the dependent variable, is to be collected through observation with the aid of a
checklist while the independent variables, which are the quality management factors, will be collected through questionnaires to
be distributed to the parties involved in the construction industry as well as through observation with the aid of checklist.
Questionnaires and checklists were the instruments of data collection used. Questionnaires were administered to contractors,
consultants, and workers on-site while the checklist was used by the researcher to observe the level of workmanship on sites. For
ease of administering the questionnaires and analyzing data, the researcher used a structured (closed-ended) questionnaire
developed from the research objectives, which were intended to give information on independent variables related to workers'
experience, knowledge, and motivation as tools equipment use [11].
The dependent variable, workmanship, was measured through a checklist. The operational definition of workmanship has been
taken as the number of defects on work done. Therefore, the checklist comprises possible and easily identifiable defects on
concrete work due to workmanship. These include cracks, the disintegration of concrete, and the detachment of plaster. The
researcher went to the sites and observed the workmanship level in the checklist by giving a zero (0) mark where a defect was
observed and one (1) mark where a defect was missing.
2.6 Study Variables
A variable is a measurable element that assumes different values among the subject. It is a logical way of expressing a
particular aspect of an issue.
2.6.1 Independent variable
An independent variable means that a researcher manipulates to determine its effect or influence on another. Independent
variables are selected because they are causative or significant to the research's particle analytical purpose.
In this study, the quality of management factors is considered as independent variables; these include the level of training
of workers, Availability of proper tools and equipment, Experience, Supervision, Subcontracting, Workers motivation, Lack of
care, Communication on-site, and Clarity in specifications. The measurement of this variable's components was on an ordinal
scale, derived from the study's descriptive. An ordinal scale groups subject into categories and rank them according to numerals
reflecting the increasing number of characteristics but not at intervals. The digits are used to represent relative position or order
among the values of the variables.
Based on the questionnaires' responses and observation, each site was given a score of either zero (0) or one (1) for each
of the independent variables' components to indicate its performance in that aspect. For example, a site deemed to have excelled
well in supervision would score one (1) for supervision, while an area that has not excelled would score zero (0). It was performed
for all the components of the independent variable for every site studied. Every site's cumulative score was assumed from an
interval scale and measured quality management factors.
Therefore, a site that has excelled and scored one (1) in each of the independent variable components would have a
cumulative total of nine (9). A place that scores zero (0) in every element of the variable would have a cumulative total of zero
(0), and its score of an independent variable will therefore be taken as zero (0).
TABLE I
SCORING FOR QUALITY MANAGEMENT FACTORS
Determinant Maximum Score
Training 1
Supervision 1
Lack of care 1
Experience 1
Availability of tools and equipment 1
Clarity in Specifications 1
Sub-contracting 1
Motivation for workers 1
Communication on site 1
Total 9
2.6.2 Dependent variable
For the dependent variable, their results are presumed to depend upon differences in the independent variables. Dependent
variables, therefore, vary as a function of the independent variable. In this study, the construction site's workmanship level
would be viewed as the dependent variable because it should change in some relationship to independent variables. It will be
measured on an interval scale. Six observable defects have been identified for determining the level of workmanship achieved
on site. The marks (0) or (1) on the level of workmanship have been transformed into points such that a site without defects
Journal of Xidian University
VOLUME 14, ISSUE 9, 2020
ISSN No:1001-2400
http://xadzkjdx.cn/
https://doi.org/10.37896/jxu14.9/128
1176
scores 6 points while a site with all the defects observed gets no point. It means that loss a point for the presence of each of the
six defects.
TABLE III
SCORING FOR THE LEVEL OF WORKMANSHIP
Defects Maximum Score
Cracking 1
Disintegration 1
Deflection 1
Detachment of plaster 1
Inadequate reinforcement cover 1
Brown stains 1
Total 6
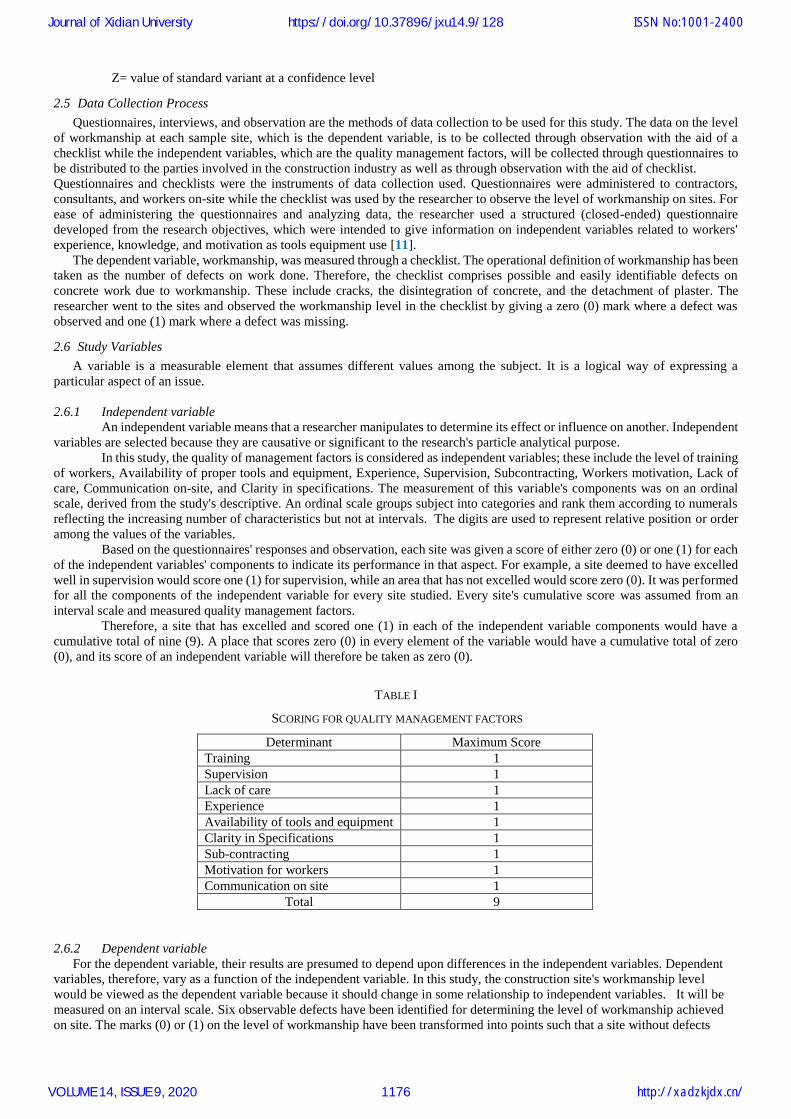
2.7 Data Analysis
The questionnaires would be structured questions related to the research work and directed to stockholders, the client, the
contractor, and the consultant. They are the major participants of the building projects. The questionnaire is divided into two
sections, namely the respondents' profile and prevalence of variation.
Data analyzed using both descriptive and qualitative analyses. Random important indexes (RII) were used for ranking the
variables. SPSS Version 21.0 is utilized to analyze the frequency and reliability of the study. The results are exhibited in the
form of tables, figures, charts, and graphs.
The answers for the structured part of the questionnaire are based on Likert’s-scale of ordinal measures of agreement towards
each statement.
To supply simplicity for the respondent to answer,
To make an evaluation of the collected data easier.
Likert's-scale is essential to know respondents' feelings or attitudes about something and is utilized for the data analysis. The
respondents must indicate how closely their feelings match with the question or statement on a rating scale [12].
MS =∑[𝑓∗𝑆]
𝑁.............................................................................................................. (2)
Where:
MS = Mean Score
f = frequency of responses for each scores.
S = Scores given to each factor.
N = Total No. of responses concerning each factor.
The Pearson correlation coefficient is utilized for measuring the differences in ranking between two groups of respondents scoring
for various factors (i.e., labor vs. consultants, labor vs. contractors, and consultants vs. contractors).
The Relative Importance Index (RII) [13] was computed using the RII Equation (2).
RII = ∑𝑤
𝐴∗𝑁 …………………………………………………………………..…….……..(3)
Where:
W = Weight given to each factor by the respondents
A = Highest weight (i.e., 5 in this case)
N = the total number of respondents
III. RESULTS AND DISCUSSION
3.1 Questionnaire Response Rate
The data collected includes questionnaires administered to contractors, consultants, and workers on construction sites
and data managed using different checklists. In the construction sites identified, the contractor and one of the workers dealing
with concreting were interviewed. A checklist was utilized to record the level of workmanship and the level of quality management
factors. Out of the 22 sites samples, 18 sites provided a full response, presenting 82%; based on the respondent rate finding, the
researcher decided it is reasonable and sufficient to proceed with the analysis. Table III shows the response rate of the
questionnaires distributed.
Journal of Xidian University
VOLUME 14, ISSUE 9, 2020
ISSN No:1001-2400
http://xadzkjdx.cn/
https://doi.org/10.37896/jxu14.9/128
1177

TABLE IIIII
RESPONSE RATE OF THE QUESTIONNAIRE
No. Respondent Questionnaire
Distributed
Returned
Questionnaire
Unfinished
Questionnaire
Analyzed
Questionnaire
No. No. Percent No. Percent No. Percent
1 Contractor 24 22 91.67 2 8.33 18 75.00
2 Consultant 22 19 86.36 3 13.64 17 77.27
3 Workers 24 21 87.50 3 12.50 20 83.33
Total 70 62 88.57 8 11.43 55 78.57
3.2 Contractor’s experience, their Position, Consultant experience
Results indicated that 55.6% of the respondents had been in operation for at least 10 years as a contractor, while 33.3%
with experience 5-10 years and 11.1% with 1-5 years of experience, while, 33.30% are project managers, and 66.70% are site
engineers. On the other hand, table IV shows the practical period of Consultants in the construction industry.
TABLE IVV
PRACTICAL PERIOD OF CONSULTANTS IN THE CONSTRUCTION INDUSTRY
Period (Years) No. of Respondents Percentage (%)
1-5 years 8 47.10
6-10 years 9 52.90
> 10 years 0 0.00
Total 17 100.00
The above table indicates that the highest percentage, 52.9%, of the consultants have been practicing for more than 5years,
followed by 47.1% who have practiced for less than 5years. It was indicated that most architects had gained enough experience
in construction matters.
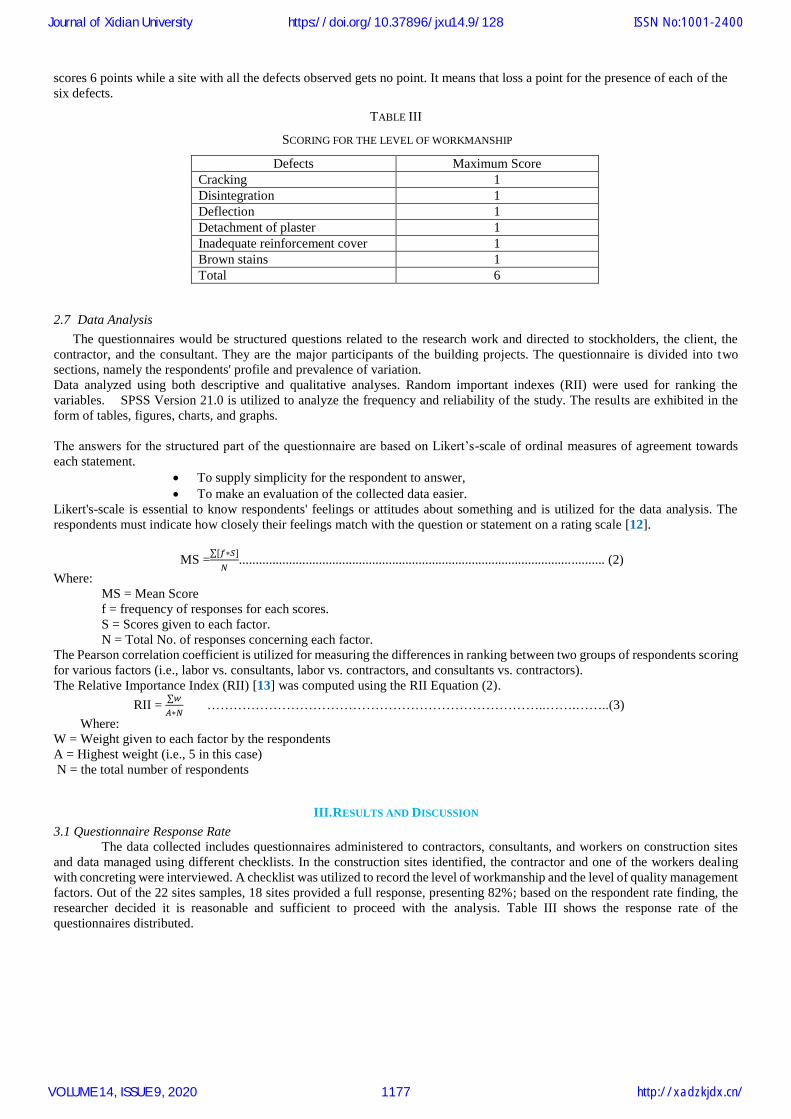
3.3 Age, Education level and Work experience of workers on site
Fig. 2 Average age of workers
It can be seen that more than 50% of the workers under study were over 26 years. And none of them was over 40years of age.
It means that all the workers met the minimum required age of employment and within the young working-age where their
productivity is high for manual work.
One of the most interesting scenarios, most of the workers comprised with elementary level of education, as shown in Table
V. This will show that lack of education and training could be the most probable issue in the construction projects in the study
area.
15%
55%
30%
Age of respondents (%)
21-25 years
26-30 years
31-35 years
Journal of Xidian University
VOLUME 14, ISSUE 9, 2020
ISSN No:1001-2400
http://xadzkjdx.cn/
https://doi.org/10.37896/jxu14.9/128
1178
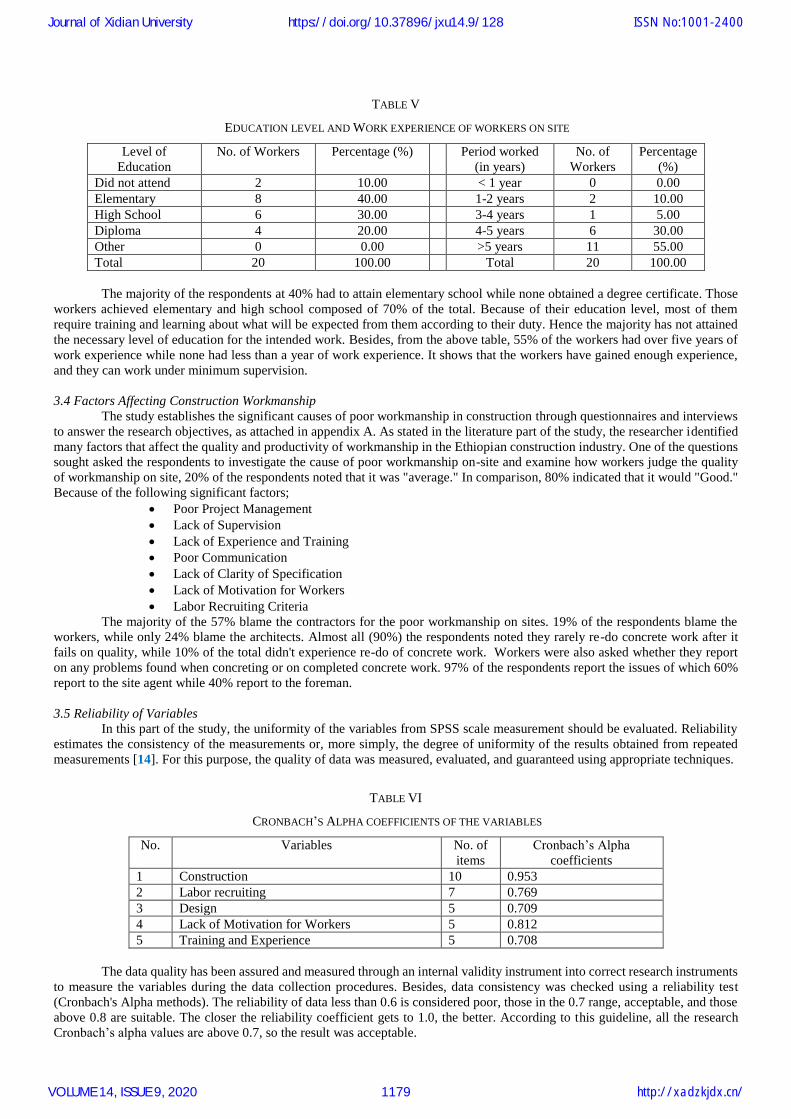
TABLE V
EDUCATION LEVEL AND WORK EXPERIENCE OF WORKERS ON SITE
Level of
Education
No. of Workers Percentage (%) Period worked
(in years)
No. of
Workers
Percentage
(%)
Did not attend 2 10.00 < 1 year 0 0.00
Elementary 8 40.00 1-2 years 2 10.00
High School 6 30.00 3-4 years 1 5.00
Diploma 4 20.00 4-5 years 6 30.00
Other 0 0.00 >5 years 11 55.00
Total 20 100.00 Total 20 100.00
The majority of the respondents at 40% had to attain elementary school while none obtained a degree certificate. Those
workers achieved elementary and high school composed of 70% of the total. Because of their education level, most of them
require training and learning about what will be expected from them according to their duty. Hence the majority has not attained
the necessary level of education for the intended work. Besides, from the above table, 55% of the workers had over five years of
work experience while none had less than a year of work experience. It shows that the workers have gained enough experience,
and they can work under minimum supervision.
3.4 Factors Affecting Construction Workmanship
The study establishes the significant causes of poor workmanship in construction through questionnaires and interviews
to answer the research objectives, as attached in appendix A. As stated in the literature part of the study, the researcher identified
many factors that affect the quality and productivity of workmanship in the Ethiopian construction industry. One of the questions
sought asked the respondents to investigate the cause of poor workmanship on-site and examine how workers judge the quality
of workmanship on site, 20% of the respondents noted that it was "average." In comparison, 80% indicated that it would "Good."
Because of the following significant factors;
Poor Project Management
Lack of Supervision
Lack of Experience and Training
Poor Communication
Lack of Clarity of Specification
Lack of Motivation for Workers
Labor Recruiting Criteria
The majority of the 57% blame the contractors for the poor workmanship on sites. 19% of the respondents blame the
workers, while only 24% blame the architects. Almost all (90%) the respondents noted they rarely re-do concrete work after it
fails on quality, while 10% of the total didn't experience re-do of concrete work. Workers were also asked whether they report
on any problems found when concreting or on completed concrete work. 97% of the respondents report the issues of which 60%
report to the site agent while 40% report to the foreman.
3.5 Reliability of Variables
In this part of the study, the uniformity of the variables from SPSS scale measurement should be evaluated. Reliability
estimates the consistency of the measurements or, more simply, the degree of uniformity of the results obtained from repeated
measurements [14]. For this purpose, the quality of data was measured, evaluated, and guaranteed using appropriate techniques.
TABLE VI
CRONBACH’S ALPHA COEFFICIENTS OF THE VARIABLES
No. Variables No. of
items
Cronbach’s Alpha
coefficients
1 Construction 10 0.953
2 Labor recruiting 7 0.769
3 Design 5 0.709
4 Lack of Motivation for Workers 5 0.812
5 Training and Experience 5 0.708
The data quality has been assured and measured through an internal validity instrument into correct research instruments
to measure the variables during the data collection procedures. Besides, data consistency was checked using a reliability test
(Cronbach's Alpha methods). The reliability of data less than 0.6 is considered poor, those in the 0.7 range, acceptable, and those
above 0.8 are suitable. The closer the reliability coefficient gets to 1.0, the better. According to this guideline, all the research
Cronbach’s alpha values are above 0.7, so the result was acceptable.
Journal of Xidian University
VOLUME 14, ISSUE 9, 2020
ISSN No:1001-2400
http://xadzkjdx.cn/
https://doi.org/10.37896/jxu14.9/128
1179
3.6 Analysis of Factors Affecting Workmanship Quality
The results are directly related to the research's second specific objective and include, Reliability of research instruments
based on SPSS scale analysis and combined relative importance index (RII) rank of factors affecting the quality of work and poor
workmanship in Ethiopian construction work.
3.6.1 From Contractor
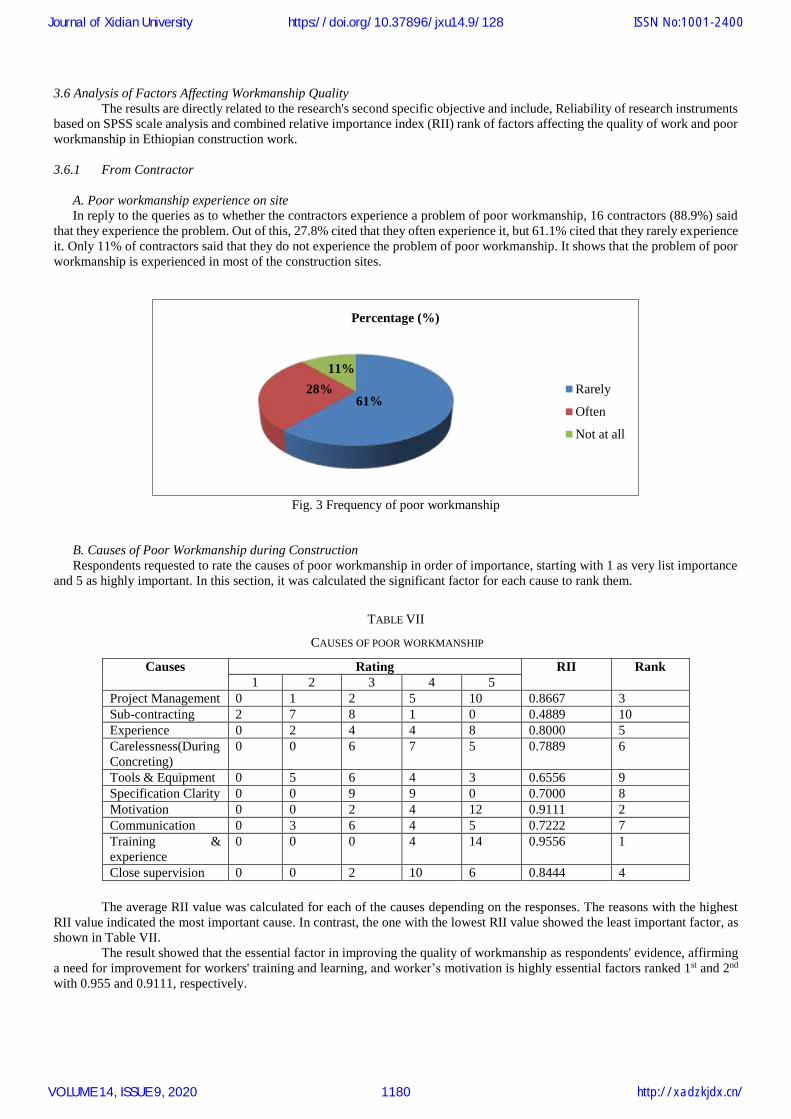
A. Poor workmanship experience on site
In reply to the queries as to whether the contractors experience a problem of poor workmanship, 16 contractors (88.9%) said
that they experience the problem. Out of this, 27.8% cited that they often experience it, but 61.1% cited that they rarely experience
it. Only 11% of contractors said that they do not experience the problem of poor workmanship. It shows that the problem of poor
workmanship is experienced in most of the construction sites.
Fig. 3 Frequency of poor workmanship
B. Causes of Poor Workmanship during Construction
Respondents requested to rate the causes of poor workmanship in order of importance, starting with 1 as very list importance
and 5 as highly important. In this section, it was calculated the significant factor for each cause to rank them.
TABLE VII
CAUSES OF POOR WORKMANSHIP
Causes Rating RII Rank
1 2 3 4 5
Project Management 0 1 2 5 10 0.8667 3
Sub-contracting 2 7 8 1 0 0.4889 10
Experience 0 2 4 4 8 0.8000 5
Carelessness(During
Concreting)
0 0 6 7 5 0.7889 6
Tools & Equipment 0 5 6 4 3 0.6556 9
Specification Clarity 0 0 9 9 0 0.7000 8
Motivation 0 0 2 4 12 0.9111 2
Communication 0 3 6 4 5 0.7222 7
Training &
experience
0 0 0 4 14 0.9556 1
Close supervision 0 0 2 10 6 0.8444 4
The average RII value was calculated for each of the causes depending on the responses. The reasons with the highest
RII value indicated the most important cause. In contrast, the one with the lowest RII value showed the least important factor, as
shown in Table VII.
The result showed that the essential factor in improving the quality of workmanship as respondents' evidence, affirming
a need for improvement for workers' training and learning, and worker’s motivation is highly essential factors ranked 1st and 2nd
with 0.955 and 0.9111, respectively.
61%28%
11%
Percentage (%)
Rarely
Often
Not at all
Journal of Xidian University
VOLUME 14, ISSUE 9, 2020
ISSN No:1001-2400
http://xadzkjdx.cn/
https://doi.org/10.37896/jxu14.9/128
1180
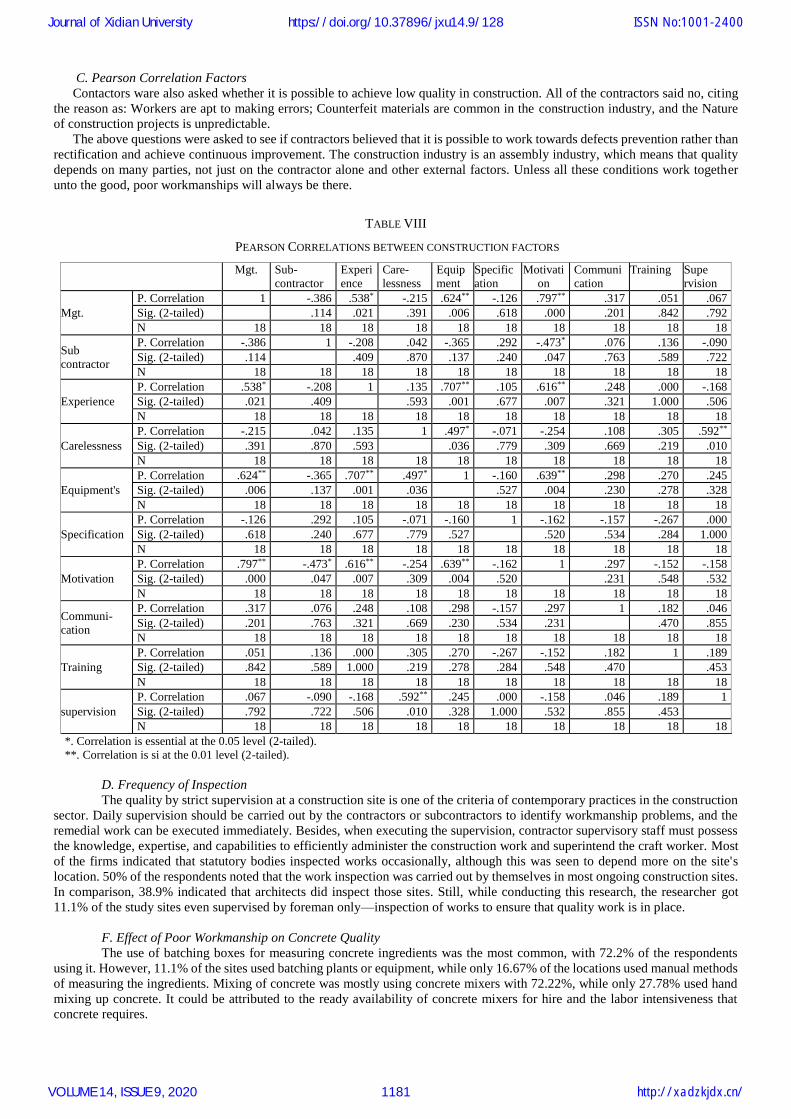
C. Pearson Correlation Factors
Contactors ware also asked whether it is possible to achieve low quality in construction. All of the contractors said no, citing
the reason as: Workers are apt to making errors; Counterfeit materials are common in the construction industry, and the Nature
of construction projects is unpredictable.
The above questions were asked to see if contractors believed that it is possible to work towards defects prevention rather than
rectification and achieve continuous improvement. The construction industry is an assembly industry, which means that quality
depends on many parties, not just on the contractor alone and other external factors. Unless all these conditions work together
unto the good, poor workmanships will always be there.
TABLE VIII
PEARSON CORRELATIONS BETWEEN CONSTRUCTION FACTORS
Mgt. Sub-
contractor
Experi
ence
Care-
lessness
Equip
ment
Specific
ation
Motivati
on
Communi
cation
Training Supe
rvision
Mgt.
P. Correlation 1 -.386 .538* -.215 .624** -.126 .797** .317 .051 .067
Sig. (2-tailed) .114 .021 .391 .006 .618 .000 .201 .842 .792
N 18 18 18 18 18 18 18 18 18 18
Sub
contractor
P. Correlation -.386 1 -.208 .042 -.365 .292 -.473* .076 .136 -.090
Sig. (2-tailed) .114 .409 .870 .137 .240 .047 .763 .589 .722
N 18 18 18 18 18 18 18 18 18 18
Experience
P. Correlation .538* -.208 1 .135 .707** .105 .616** .248 .000 -.168
Sig. (2-tailed) .021 .409 .593 .001 .677 .007 .321 1.000 .506
N 18 18 18 18 18 18 18 18 18 18
Carelessness
P. Correlation -.215 .042 .135 1 .497* -.071 -.254 .108 .305 .592**
Sig. (2-tailed) .391 .870 .593 .036 .779 .309 .669 .219 .010
N 18 18 18 18 18 18 18 18 18 18
Equipment's
P. Correlation .624** -.365 .707** .497* 1 -.160 .639** .298 .270 .245
Sig. (2-tailed) .006 .137 .001 .036 .527 .004 .230 .278 .328
N 18 18 18 18 18 18 18 18 18 18
Specification
P. Correlation -.126 .292 .105 -.071 -.160 1 -.162 -.157 -.267 .000
Sig. (2-tailed) .618 .240 .677 .779 .527 .520 .534 .284 1.000
N 18 18 18 18 18 18 18 18 18 18
Motivation
P. Correlation .797** -.473* .616** -.254 .639** -.162 1 .297 -.152 -.158
Sig. (2-tailed) .000 .047 .007 .309 .004 .520 .231 .548 .532
N 18 18 18 18 18 18 18 18 18 18
Communi-
cation
P. Correlation .317 .076 .248 .108 .298 -.157 .297 1 .182 .046
Sig. (2-tailed) .201 .763 .321 .669 .230 .534 .231 .470 .855
N 18 18 18 18 18 18 18 18 18 18
Training
P. Correlation .051 .136 .000 .305 .270 -.267 -.152 .182 1 .189
Sig. (2-tailed) .842 .589 1.000 .219 .278 .284 .548 .470 .453
N 18 18 18 18 18 18 18 18 18 18
supervision
P. Correlation .067 -.090 -.168 .592** .245 .000 -.158 .046 .189 1
Sig. (2-tailed) .792 .722 .506 .010 .328 1.000 .532 .855 .453
N 18 18 18 18 18 18 18 18 18 18
*. Correlation is essential at the 0.05 level (2-tailed).
**. Correlation is si at the 0.01 level (2-tailed).
D. Frequency of Inspection
The quality by strict supervision at a construction site is one of the criteria of contemporary practices in the construction
sector. Daily supervision should be carried out by the contractors or subcontractors to identify workmanship problems, and the
remedial work can be executed immediately. Besides, when executing the supervision, contractor supervisory staff must possess
the knowledge, expertise, and capabilities to efficiently administer the construction work and superintend the craft worker. Most
of the firms indicated that statutory bodies inspected works occasionally, although this was seen to depend more on the site's
location. 50% of the respondents noted that the work inspection was carried out by themselves in most ongoing construction sites.
In comparison, 38.9% indicated that architects did inspect those sites. Still, while conducting this research, the researcher got
11.1% of the study sites even supervised by foreman only—inspection of works to ensure that quality work is in place.
F. Effect of Poor Workmanship on Concrete Quality
The use of batching boxes for measuring concrete ingredients was the most common, with 72.2% of the respondents
using it. However, 11.1% of the sites used batching plants or equipment, while only 16.67% of the locations used manual methods
of measuring the ingredients. Mixing of concrete was mostly using concrete mixers with 72.22%, while only 27.78% used hand
mixing up concrete. It could be attributed to the ready availability of concrete mixers for hire and the labor intensiveness that
concrete requires.
Journal of Xidian University
VOLUME 14, ISSUE 9, 2020
ISSN No:1001-2400
http://xadzkjdx.cn/
https://doi.org/10.37896/jxu14.9/128
1181
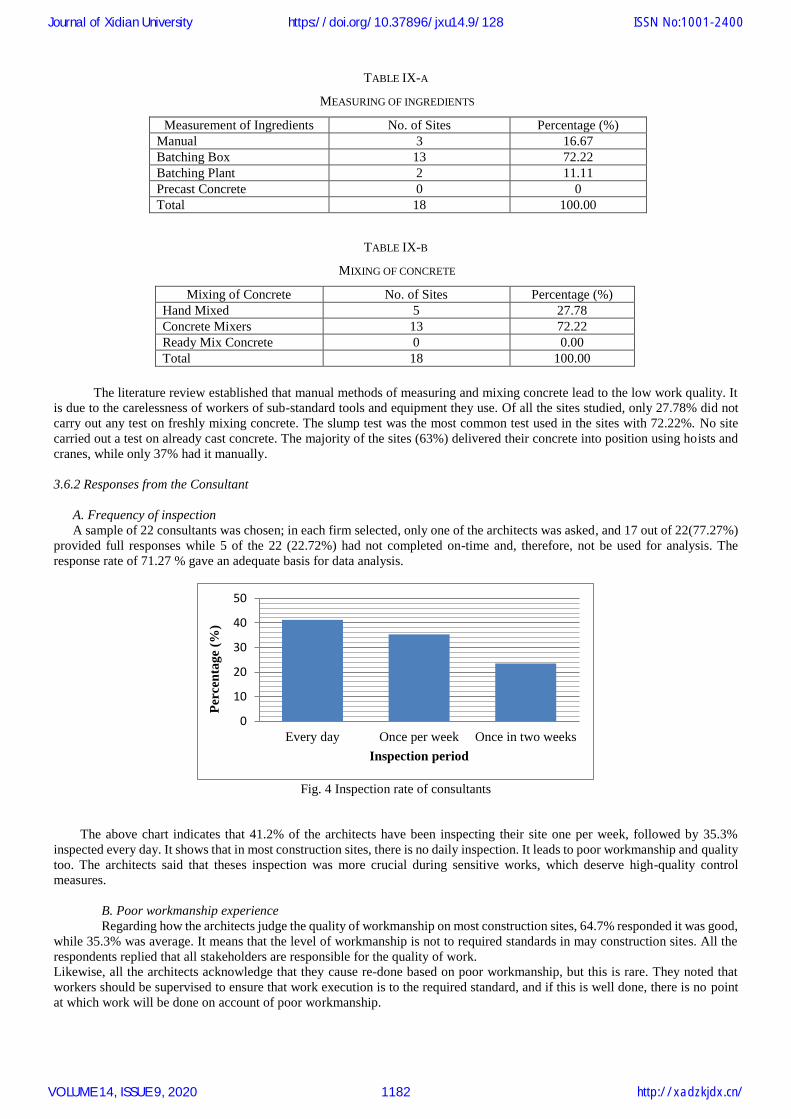
TABLE IX-A
MEASURING OF INGREDIENTS
Measurement of Ingredients No. of Sites Percentage (%)
Manual 3 16.67
Batching Box 13 72.22
Batching Plant 2 11.11
Precast Concrete 0 0
Total 18 100.00
TABLE IX-B
MIXING OF CONCRETE
Mixing of Concrete No. of Sites Percentage (%)
Hand Mixed 5 27.78
Concrete Mixers 13 72.22
Ready Mix Concrete 0 0.00
Total 18 100.00
The literature review established that manual methods of measuring and mixing concrete lead to the low work quality. It
is due to the carelessness of workers of sub-standard tools and equipment they use. Of all the sites studied, only 27.78% did not
carry out any test on freshly mixing concrete. The slump test was the most common test used in the sites with 72.22%. No site
carried out a test on already cast concrete. The majority of the sites (63%) delivered their concrete into position using hoists and
cranes, while only 37% had it manually.
3.6.2 Responses from the Consultant
A. Frequency of inspection
A sample of 22 consultants was chosen; in each firm selected, only one of the architects was asked, and 17 out of 22(77.27%)
provided full responses while 5 of the 22 (22.72%) had not completed on-time and, therefore, not be used for analysis. The
response rate of 71.27 % gave an adequate basis for data analysis.
Fig. 4 Inspection rate of consultants
The above chart indicates that 41.2% of the architects have been inspecting their site one per week, followed by 35.3%
inspected every day. It shows that in most construction sites, there is no daily inspection. It leads to poor workmanship and quality
too. The architects said that theses inspection was more crucial during sensitive works, which deserve high-quality control
measures.
B. Poor workmanship experience
Regarding how the architects judge the quality of workmanship on most construction sites, 64.7% responded it was good,
while 35.3% was average. It means that the level of workmanship is not to required standards in may construction sites. All the
respondents replied that all stakeholders are responsible for the quality of work.
Likewise, all the architects acknowledge that they cause re-done based on poor workmanship, but this is rare. They noted that
workers should be supervised to ensure that work execution is to the required standard, and if this is well done, there is no point
at which work will be done on account of poor workmanship.
0
10
20
30
40
50
Every day Once per week Once in two weeks
Per
cen
tag
e (%
)
Inspection period
Journal of Xidian University
VOLUME 14, ISSUE 9, 2020
ISSN No:1001-2400
http://xadzkjdx.cn/
https://doi.org/10.37896/jxu14.9/128
1182

C. Causes of poor workmanship during Design & Supervision
This section, the significance factor for each of the respondents' criteria was computed, and this was used in arranging
them in order of preference. The element with the highest RII value shows the most preferred factor, while the one with the lowest
RII value shows the least preferred aspect. Form the above table; the preference criteria are as follows (starting with the most
preferred).
TABLE X
CAUSE OF POOR WORKMANSHIP
Factors Rating RII Rank
1 2 3 4 5
Lack of proper
communication 0 0 0 8 9 0.90588 2
Insufficient details 0 0 3 14 0 0.76471 3
Many variations 0 0 6 11 0 0.72941 4
Insufficient Supervision 0 0 0 7 10 0.91765 1
Poor design 0 0 14 2 1 0.64706 5
D. Person correlation factors The correlation is applied between the design factors. Table XI shows the different factors as correlated indicating how it was measured
the strength and direction of a linear relationship between the different factors. Values always range between -1 (strong negative relationship)
and +1 (strong positive relationship). Values at or close to zero imply weak or no linear relationship. As it can be observed, there was strong
correlations between the different factors.
TABLE XI
PEARSON CORRELATIONS BETWEEN DESIGN FACTORS
Poor communication Insufficient
detail
Many
variation
Insufficient
supervision
Poor
design
Poor
Communication
Pearson
Correlation 1 .491* .290 -.070 -.241
Sig. (2-tailed) .045 .259 .788 .350
N 17 17 17 17 17
Insufficient
detail
Pearson
Correlation .491* 1 .304 .240 -.649**
Sig. (2-tailed) .045 .236 .354 .005
N 17 17 17 17 17
Many
variation
Pearson
Correlation .290 .304 1 -.118 -.133
Sig. (2-tailed) .259 .236 .653 .612
N 17 17 17 17 17
Insufficient
supervision
Pearson
Correlation -.070 .240 -.118 1 .142
Sig. (2-tailed) .788 .354 .653 .587
N 17 17 17 17 17
Poor design
Pearson
Correlation -.241 -.649** -.133 .142 1
Sig. (2-tailed) .350 .005 .612 .587
N 17 17 17 17 17
*. Correlation is essential at the 0.05 level (2-tailed).
**. Correlation is essential significant at the 0.01 level (2-tailed).
3.6.3. Responses from Workers on Site
The third category of questionnaires was administered to the workers on the identified sites. Only one worker involved
in concreting per site was interviewed; hence, they formed 20 workers.
The questionnaires were designed to establish their experience, education level, career development, tools, the equipment they
used, the challenges they faced, and how they perceived quality on site.
A. Quality of work on site
One of the questions sought to examine how workers judge the quality of workmanship on site; 20% of the respondents noted
that it was "average," while 80% indicated that it would "Good." The majority of the 57% blame the contractors for the poor
workmanship on sites. 19% of the respondents blame the workers, while only 24% blame the architects.
Almost all (90%) the respondents noted they rarely re-do concrete work after it fails on quality, while 10% of the total didn't
experience re-do of concrete work. Workers were also asked whether they reported any problems found when concreting or on
Journal of Xidian University
VOLUME 14, ISSUE 9, 2020
ISSN No:1001-2400
http://xadzkjdx.cn/
https://doi.org/10.37896/jxu14.9/128
1183
completed concrete work, and 97% of the respondents said the issues of which 60% report to the site agent while 40% report to
the foreman.
To improve the quality of workmanship, the respondents recommended the following (in the order of importance).
a. Contractors to enhance supervision.
b. Workers to be employed based on skill and experience.
c. Workers' welfare to be enhanced by increasing their pay.
d. Provision of proper tools and equipment.
B. Challenges faced by workers when working
Respondents must rank the challenges they faced while executing their work in importance, starting with 1 as very list importance
and 5 as highly important. The researcher calculated the significant factor for each cause to rank them.
TABLE XII
CHALLENGES OF WORKERS WHICH CAUSE POOR WORKMANSHIP
Factors Rating RII Rank
1 2 3 4 5
Lack of proper tools & equipment 0 6 4 10 0 0.6400 5
Low payment 0 0 0 5 15 0.9500 1
Being over-worked 0 0 2 6 12 0.9000 2
Poor communication 0 2 4 14 0 0.700 3
Mistreatment on site 0 0 7 13 0 0.7300 4
The researcher computed the random importance index value for each of the causes depending on the responses. The
grounds with the highest RII value indicate the most important reason, while those with the lowest RII value indicate the least
important factor. From the table above: the causes can be ranked as follows;
1. Low payment,
2. Being overworked,
3. Poor communication,
4. Mistreatment on site,
5. Lack of proper tools and equipment.
The information shows that the essential factor to be considered during the study on quality of workmanship 75% of the
respondents noted one of the significant challenges was getting low payment, 60% felt overworked. Those two factors determine
motivation hence production. Quality of workmanship to be achieved on-site will thus depend on these two factors. Mistreatment
on site and poor communication were considered significant, with 70% and 65%, respectively. Lack of proper tools and equipment
were cited as moderately necessary, with 50% of the respondents indicating this.
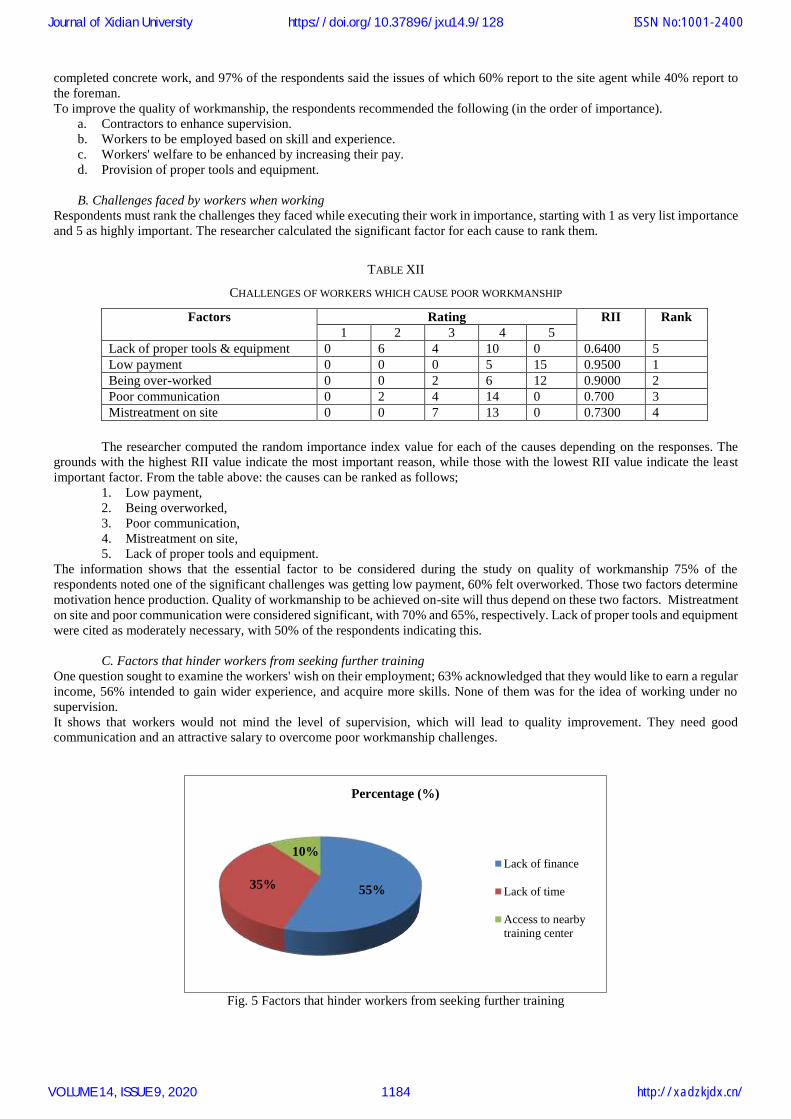
C. Factors that hinder workers from seeking further training
One question sought to examine the workers' wish on their employment; 63% acknowledged that they would like to earn a regular
income, 56% intended to gain wider experience, and acquire more skills. None of them was for the idea of working under no
supervision.
It shows that workers would not mind the level of supervision, which will lead to quality improvement. They need good
communication and an attractive salary to overcome poor workmanship challenges.
Fig. 5 Factors that hinder workers from seeking further training
55%35%
10%
Percentage (%)
Lack of finance
Lack of time
Access to nearby
training center
Journal of Xidian University
VOLUME 14, ISSUE 9, 2020
ISSN No:1001-2400
http://xadzkjdx.cn/
https://doi.org/10.37896/jxu14.9/128
1184

From the figure, the major hindrances in seeking further training are lack of finance and lack of time with 55% and 35%
respectively. It implies those factors directly related to the factor which affect productivity, and if it increases, it also increases
productivity. Lack of required minimum qualification and interest was considered as the least hindrance in seeking further training.
D. Measures to Improving Quality of Workmanship
The respondents were finally requested to give some recommendations to be implemented in the building industry to
achieve quality workmanship on site. Most of the respondents gave different opinion; hence the researcher analyzed them as
follows:
1. Responses from Contractors and Consultants
TABLE XIII
MEASURES TO IMPROVE THE QUALITY OF WORKMANSHIP
Measures to improve quality
of workmanship
Rating RII Rank
1 2 3 4 5
Train workers in quality issue 0 0 0 4 13 0.7647 2
Cease dependents on
inspection by the architects
0 0 10 7 0 0.6824 3
Provide proper tools and
equipment
0 4 8 5 0 0.6118 4
Work how to motivate workers 0 0 1 6 10 0.9059 1
The researcher computed the mean for each of the causes depending on the responses. The grounds with the highest RII
indicate the most important reason, while those with the lowest RII indicate the least important factor. From the table above: the
causes can be ranked as follows;
i. Train workers on the quality issue:
Workers should be well trained on technical issues of construction before they are allowed to work on sites. The respondents
proposed introducing more training institutes to handle a large number of workers in the building industry.
ii. Motivate workers:
Being in the right working environment is a motivator for many employees on-site, as indicated in the literature review. Therefore,
the respondents advocated for a favorable working atmosphere to be created on-site and maintain better health standards and
safety measures. It motivates workers to work to their best, enhancing the quality of workmanship on sites.
iii. Proper supervision:
The statutory bodies should regularly do proper inspections on-site. It should be taken at every stage of construction to ensure
quality workmanship on sites. The construction site's location should not determine the number of inspections carried out by
statutory bodies.
A. Person correlation factors
Results in Table XIV indicated that there was strong correlation between the different factors on improving factors of
workmanship.
TABLE XIV
PEARSON CORRELATIONS IMPROVING FACTORS OF WORKMANSHIP
Train workers
in the quality
issue
Inspection
By the
architects
Provide proper
tools &
equipment
Motivating
workers
Train workers
In quality issues.
Pearson Correlation 1 -.099 .236 .256
Sig. (2-tailed) .704 .361 .321
N 17 17 17 17
Inspection
By the architects.
Pearson Correlation -.099 1 .591* .453
Sig. (2-tailed) .704 .012 .068
N 17 17 17 17
Provide proper
tools and equipment
Pearson Correlation .236 .591* 1 .331
Sig. (2-tailed) .361 .012 .195
N 17 17 17 17
Motivating workers
Pearson Correlation .256 .453 .331 1
Sig. (2-tailed) .321 .068 .195
N 17 17 17 17
*. Correlation is essential at the 0.05 level (2-tailed).
Journal of Xidian University
VOLUME 14, ISSUE 9, 2020
ISSN No:1001-2400
http://xadzkjdx.cn/
https://doi.org/10.37896/jxu14.9/128
1185
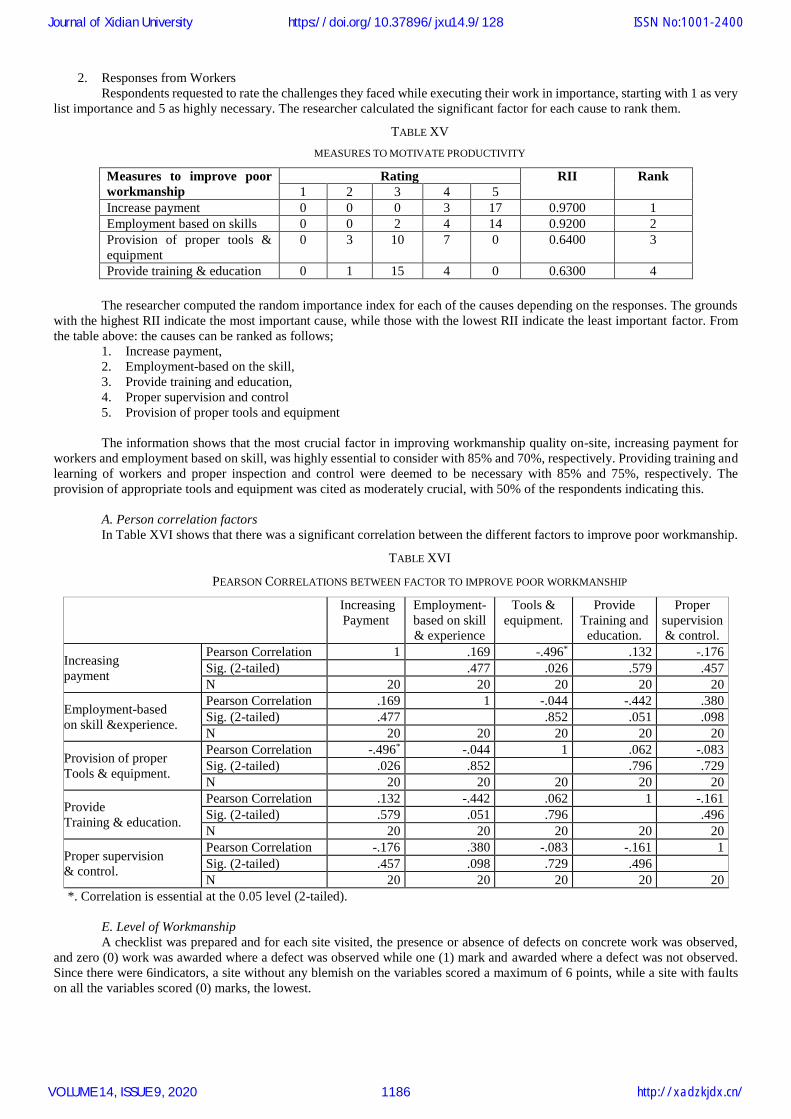
2. Responses from Workers
Respondents requested to rate the challenges they faced while executing their work in importance, starting with 1 as very
list importance and 5 as highly necessary. The researcher calculated the significant factor for each cause to rank them.
TABLE XV
MEASURES TO MOTIVATE PRODUCTIVITY
Measures to improve poor
workmanship
Rating RII Rank
1 2 3 4 5
Increase payment 0 0 0 3 17 0.9700 1
Employment based on skills 0 0 2 4 14 0.9200 2
Provision of proper tools &
equipment
0 3 10 7 0 0.6400 3
Provide training & education 0 1 15 4 0 0.6300 4
The researcher computed the random importance index for each of the causes depending on the responses. The grounds
with the highest RII indicate the most important cause, while those with the lowest RII indicate the least important factor. From
the table above: the causes can be ranked as follows;
1. Increase payment,
2. Employment-based on the skill,
3. Provide training and education,
4. Proper supervision and control
5. Provision of proper tools and equipment
The information shows that the most crucial factor in improving workmanship quality on-site, increasing payment for
workers and employment based on skill, was highly essential to consider with 85% and 70%, respectively. Providing training and
learning of workers and proper inspection and control were deemed to be necessary with 85% and 75%, respectively. The
provision of appropriate tools and equipment was cited as moderately crucial, with 50% of the respondents indicating this.
A. Person correlation factors
In Table XVI shows that there was a significant correlation between the different factors to improve poor workmanship.
TABLE XVI
PEARSON CORRELATIONS BETWEEN FACTOR TO IMPROVE POOR WORKMANSHIP
Increasing
Payment
Employment-
based on skill
& experience
Tools &
equipment.
Provide
Training and
education.
Proper
supervision
& control.
Increasing
payment
Pearson Correlation 1 .169 -.496* .132 -.176
Sig. (2-tailed) .477 .026 .579 .457
N 20 20 20 20 20
Employment-based
on skill &experience.
Pearson Correlation .169 1 -.044 -.442 .380
Sig. (2-tailed) .477 .852 .051 .098
N 20 20 20 20 20
Provision of proper
Tools & equipment.
Pearson Correlation -.496* -.044 1 .062 -.083
Sig. (2-tailed) .026 .852 .796 .729
N 20 20 20 20 20
Provide
Training & education.
Pearson Correlation .132 -.442 .062 1 -.161
Sig. (2-tailed) .579 .051 .796 .496
N 20 20 20 20 20
Proper supervision
& control.
Pearson Correlation -.176 .380 -.083 -.161 1
Sig. (2-tailed) .457 .098 .729 .496
N 20 20 20 20 20
*. Correlation is essential at the 0.05 level (2-tailed).
E. Level of Workmanship
A checklist was prepared and for each site visited, the presence or absence of defects on concrete work was observed,
and zero (0) work was awarded where a defect was observed while one (1) mark and awarded where a defect was not observed.
Since there were 6indicators, a site without any blemish on the variables scored a maximum of 6 points, while a site with faults
on all the variables scored (0) marks, the lowest.
Journal of Xidian University
VOLUME 14, ISSUE 9, 2020
ISSN No:1001-2400
http://xadzkjdx.cn/
https://doi.org/10.37896/jxu14.9/128
1186

TABLE XVII
LEVEL OF WORKMANSHIP ON SITES
Score Number of Site Percentage (%)
0 1 5.00
1 3 15.00
2 2 10.00
3 5 25.00
4 4 20.00
5 2 10.00
6 3 15.00
Total 20 100.00
A score of 6 is the highest mark showing no defect: the required level of (high level) workmanship. Only 5% met this
requirement showing that the level of workmanship is low. Ninety-five percent of the sites have at least a defect on the subject. It
is important to note that only 5 percent of all the places visited scored zero. This indicates that the majority of sites need
improvement in workmanship.
F. Summary of Findings
The researcher has established that the quality of workmanship is not to the required standards. The level of workmanship
has been observed to be equally low, with many defects appearing on works. Many factors have been established as the causes of
a low level of workmanship. These factors are management-related factors on-site, including inadequate supervision, lack of
training, inexperienced workers, unavailability of proper tools and equipment, poor communication on-site, lack of motivation
for workers, lack of clarity in specifications, and also, to a smaller extent, due to subcontracting. The level of workmanship is
directly proportional to the level of quality management factors. However, lack of proper supervision on site has been noted as
the primary cause of poor workmanship compared to the other factors.
IV. CONCLUSIONS
The research objectives had been achieved based on the literature review from articles, journals, and books; findings from a
questionnaire survey; and interview results. This study addresses a gap around workmanship and quality for works in the Ethiopian
construction industry, specifically within the study area's scope. The study adds data to existing literature concerning current
construction trends. The finding has been compared against the set objectives and conclusions made.
In this study, the following major conclusion was drawn based on findings in line with each specific objective. Poor
workmanship is one of the significant factors that lead to building defects and failure problems. High rise buildings are the one
which experienced most of the defects or failures issues due to poor workmanship. Form questioner survey senior officer of the
client, project manager, and resident engineer from the contractor and consultant side reported low quality as a significant cause
of poor quality material used. Low quality also led to project cost overrun for all entities participating in project management.
4.1 Findings of the Study
The first objective identified the leading causes of poor workmanship on construction sites. From the results obtained from the
respondents, the primary reasons for poor workmanship are:
i. Lack of training and experience from workers
ii. Lack of motivation for workers,
iii. Lack of proper supervision and management skill.
iv. Lack of care when concreting
v. Lack of proper tools and equipment
vi. Lack of clarity in drawing and specifications
The result indicated further that poor workmanship is also resulting from the contractor's speedy construction and shortcuts in
construction. Subcontracting has been noted to have less impact on workmanship. However, all respondents acknowledge a lack
of supervision as the significant cause of poor workmanship. The second objective established the relationship between the quality
management factors (supervision, training, experience, availability of proper tools and equipment), and workmanship. Field data
on quality management factors and workmanship on site were analyzed through software called SPSS and correlation, reliability
was cross-checked, and a positive relationship was established. The third objective was to identify the responsible authorities'
measures in ensuring a good quality of work. For this study, the responsible authorities have been taken as the consultants
(architects), consultants (engineers), and statutory bodies. Regarding measures taken by the architects against contractors for poor
quality work, 89% of the architects noted that contractors are forced to re-do the work at their own cost, and 63% of the respondents
also indicated that they determined whether the contact persists, and they seek damages if there is any delay to be incurred.
4.2 Implication of the Findings
From the study's findings and analysis, it can be concluded that the quality of workmanship on construction sites is relatively
poor. The study has summarized all the causes of poor workmanship, that is, quality management factors. All these elements have
a positive influence on the level of workmanship. The finding implies that a low level of workmanship on Ethiopia construction
Journal of Xidian University
VOLUME 14, ISSUE 9, 2020
ISSN No:1001-2400
http://xadzkjdx.cn/
https://doi.org/10.37896/jxu14.9/128
1187

projects will continue unless the quality management factors are enhanced (supervision, training, availability of proper tools, and
equipment, among others). Therefore, to reverse the trend, all efforts should be aimed at providing and improving the content and
context of these factors to enable acceptable quality of works on sites.
ACKNOWLEDGMENT
The authors would like to verbalize their profound gratitude to Ambo University for all supports extended during the research
activities and respondents who shared their opinions and ideas in this research study.
REFERENCES
[1] Binyam Letarge, Emer T. Quezon, Yolente C. Macarubbo, “Evaluation on the Performance of Lowest Responsive Bid Contract and the Quality of
Materials Used on Governmental Building Projects in Jimma Town.” International Journal of Scientific & Engineering Research, Volume 7, Issue
12, Pp 60-73 (2016). [2] Lucy Fekele, Prof. Emer T. Quezon, Yolente C. Macarubbo, “Evaluation of Health and Safety Practice in Building Construction: A Case Study in
Addis Ababa.” International Journal of Scientific & Engineering Research, Volume 7, Issue 10, pp 122-131 (2016). [3] A. Shittu, A. D. Adamu, A. Mohammed, B. Suleiman, R. B. Isa, K. Ibrahim, & M. A. Shehu, “Appraisal of Building Defects due to Poor Workmanship
in Public Building Projects in Minna, Nigeria,” IOSR Journal of Engineering, Vol.3, Issue 9 page 30-38 (2013).
[4] Al-Khalil, M. I., & Al-Ghafly, M. A., “Important Causes of Delay in Public Utility Projects in Saudi Arabia.” Construction Management & Economics,
17(5), 647- 655 (1999).
[5] Ali, A. S., and Wen, K. H., Building Defects: Possible Solution for Poor Construction Workmanship. Journal of Building Performance, 2(1), 59-69
(2011).
[6] Atkinson, A.R., “The Role of Human Error in Construction Defects.” Structural Survey, 17(4): 231-236 (1999). [7] Roger Courtney, “Building Research Establishment past, present and future.” Building Research & Information, 25 (5), pp285-291 (2010).
doi.org/10.1080/096132197370264
[8] Wikipedia .com (http://www.latong.net/place/addis-ababa-Ethiopia), Accessed: April 2020. [9] H. K. Sarmah1, B. Bora Hazarika & G. Choudhury. “An Investigation on Effect of Bias on Determination of Sample Size on the Basis of Data Related
to The Students of Schools of Guwahati.” International Journal of Applied Mathematics & Statistical Sciences (IJAMSS). Vol. 2, Issue 1, 33-48 (2013).
[10] Hamed Taherdoost. “Determining Sample Size; How to Calculate Survey Sample Size.” International Journal of Economics and Management Systems. Vol 2 (1), pp. 237-239 (2017). http://www.iaras.org/iaras/journals/ijems.
[11] Harlacher, J. (2016). “An educator’s guide to questionnaire development (REL 2016–108).” Washington, DC: U.S. Department of Education, Institute
of Education Sciences, National Center for Education Evaluation and Regional Assistance, Regional Educational Laboratory Central. Retrieved from http://ies.ed.gov/ncee/edlabs.
[12] Ankur Joshi, Saket Kale, Satish Chandel and D. K. Pal. “Likert Scale: Explored and Explained.” British Journal of Applied Science & Technology,
7(4): 396-403, (2015). DOI: 10.9734/BJAST/2015/14975 [13] L. Muhwezi*, J. Acai, G. Otim. “An Assessment of the Factors Causing Delays on Building Construction Projects in Uganda.” International Journal
of Construction Engineering and Management, 3(1), (2014): 13-23 DOI: 10.5923/j.ijcem.20140301.02
[14] Swain, A.D, and Guttmann, H.E, 1983 Handbook of Human Reliability Analysis, 7thedition. [15] Dires, Yebichaye. “Building Defects due to Poor Workmanship in Addis Ababa: The Case Study on 20/80 Condominium Houses.” MSc thesis,
CoTM, AAIT, Addis Ababa City, Ethiopia (2016).
[16] Aridity, D., & Mochtar, K. “Trends in Productivity Improvement in the US Construction Industry.” Construction Management & Economics, 18(1), 15-27 (2000).
[17] Dai, J., Paul, M. G., and William, F. M. “Construction Craft Workers’ Perceptions of the Factors Affecting their Productivity.” Journal of Construction
Engineering and Management, 135(3), 217-226 (2009).
Journal of Xidian University
VOLUME 14, ISSUE 9, 2020
ISSN No:1001-2400
http://xadzkjdx.cn/
https://doi.org/10.37896/jxu14.9/128
1188