Embed Size (px)
Citation preview

Florida International UniversityFIU Digital Commons
FIU Electronic Theses and Dissertations University Graduate School
5-26-2009
Effects of Repeated Readings on Reading Abilitiesof English Language Learners with SpecificLearning DisabilitiesKatrina G. LandaFlorida International University, [email protected]
DOI: 10.25148/etd.FI09070601Follow this and additional works at: https://digitalcommons.fiu.edu/etd
This work is brought to you for free and open access by the University Graduate School at FIU Digital Commons. It has been accepted for inclusion inFIU Electronic Theses and Dissertations by an authorized administrator of FIU Digital Commons. For more information, please contact [email protected].
Recommended CitationLanda, Katrina G., "Effects of Repeated Readings on Reading Abilities of English Language Learners with Specific LearningDisabilities" (2009). FIU Electronic Theses and Dissertations. 82.https://digitalcommons.fiu.edu/etd/82

FLORIDA INTERNATIONAL UNIVERSITY
Miami, Florida
EFFECTS OF REPEATED READINGS ON READING ABILITIES OF ENGLISH
LANGUAGE LEARNERS WITH SPECIFIC LEARNING DISABILITIES
A dissertation submitted in partial fulfillment of the
requirements for the degree of
DOCTOR OF EDUCATION
in
EXCEPTIONAL STUDENT EDUCATION
by
Katrina G. Landa
2009


iii
DEDICATION
I dedicate this work to Cristian and Isabella. Thanks for taking this journey with me.
iv
ACKNOWLEDGMENTS
I would like to thank the members of my committee Major Professor Dr. Patricia
M. Barbetta, Dr. Benjamin Baez, Dr. Elizabeth Cramer, and Dr. Diana Valle-Riestra for
their honesty and support. This project would not have been possible without them.
I want to extend a special thanks to Dr. Ann Nevin, who first taught me about
single subject design and whose enthusiasm taught me to love it. Also, I would like to
thank Liliana Salazar and Lissette Robles for their support, input, and time dedicated to
this study.
Throughout my tenure at FIU, I have found my fellow students, the faculty, and
staff most supportive and thoughtful. I am grateful for everyone I have met while I
worked on my doctorate and every experience this has entailed.

v
ABSTRACT OF THE DISSERTATION
EFFECTS OF REPEATED READINGS ON READING ABILITIES OF ENGLISH
LANGUAGE LEARNERS WITH SPECIFIC LEARNING DISABILITIES
by
Katrina G. Landa
Florida International University, 2009
Miami, Florida
Professor Patricia M. Barbetta, Major Professor
This study investigated the effects of repeated readings on the reading abilities of
4, third-, fourth-, and fifth-grade English language learners (ELLs) with specific learning
disabilities (SLD). A multiple baseline probe design across subjects was used to explore
the effects of repeated readings on four dependent variables: reading fluency (words read
correctly per minute; wpm), number of errors per minute (epm), types of errors per
minute, and answer to literal comprehension questions. Data were collected and analyzed
during baseline, intervention, generalization probes, and maintenance probes.
Throughout the baseline and intervention phases, participants read a passage
aloud and received error correction feedback. During baseline, this was followed by
fluency and literal comprehension question assessments. During intervention, this was
followed by two oral repeated readings of the passage. Then the fluency and literal
comprehension question assessments were administered. Generalization probes followed
approximately 25% of all sessions and consisted of a single reading of a new passage at
the same readability level. Maintenance sessions occurred 2-, 4-, and 6-weeks after the
intervention ended.

vi
The results of this study indicated that repeated readings had a positive effect on
the reading abilities of ELLs with SLD. Participants read more wpm, made fewer epm,
and answered more literal comprehension questions correctly. Additionally, on average,
generalization scores were higher in intervention than in baseline. Maintenance scores
were varied when compared to the last day of intervention, however, with the exception
of the number of hesitations committed per minute maintenance scores were higher than
baseline means.
This study demonstrated that repeated readings improved the reading abilities of
ELLs with SLD and that gains were generalized to untaught passages. Maintenance
probes 2-, 4-, and 6- weeks following intervention indicated that mean reading fluency,
errors per minute, and correct answers to literal comprehensive questions remained above
baseline levels. Future research should investigate the use of repeated readings in ELLs
with SLD at various stages of reading acquisition. Further, future investigations may
examine how repeated readings can be integrated into classroom instruction and
assessments.

vii
TABLE OF CONTENTS
CHAPTER PAGE
I. INTRODUCTION ..................................................................................................1
Purpose of the Study ...............................................................................................6
Statement of the Problem........................................................................................7
Research Questions............................................................................................... 10
Operational Definitions......................................................................................... 11
Summary ............................................................................................................... 17
II. LITERATURE REVIEW ..................................................................................... 20
Characteristics of Students Who Do and Do Not Read Well ............................... 20
English Language Learners and Reading ............................................................. 22
Students with Specific Learning Disabilities and Reading................................... 24
English Language Learners with Specific Learning Disabilities and Reading..... 26
Repeated Readings................................................................................................ 27
English Language Learners and Repeated Readings ............................................ 28
Students with Specific Learning Disabilities and Repeated Readings ................. 30
English Language Learners with Specific Learning Disabilities and
Repeated Readings................................................................................................ 35
Summary ............................................................................................................... 36
III. METHOD ............................................................................................................. 40
Participants............................................................................................................ 40
Setting ................................................................................................................... 45
Materials ............................................................................................................... 45
Dependent Variables............................................................................................. 50
Interobserver Agreement ...................................................................................... 52
Treatment Fidelity................................................................................................. 53
Experimental Design............................................................................................. 55
General Procedures ............................................................................................... 56
Summary ............................................................................................................... 63
IV. RESULTS ............................................................................................................. 66
Treatment Fidelity................................................................................................. 66
Interobserver Agreement ...................................................................................... 67
Reading Fluency ................................................................................................... 67
Number and Types of Errors Per Minute.............................................................. 77
Correct Answers to Literal Comprehension Questions ...................................... 115
Summary ............................................................................................................. 127
VI. DISCUSSION..................................................................................................... 129
Reading Fluency ................................................................................................. 130
Errors Per Minute................................................................................................ 131

viii
Types of Errors Per Minute................................................................................. 133
Correct Answers to Literal Comprehension Questions ...................................... 134
Repeated Readings Summary ............................................................................. 135
Implications for Practice ..................................................................................... 137
Delimitations....................................................................................................... 138
Limitations .......................................................................................................... 139
Suggestions future Research ............................................................................... 140
Summary ............................................................................................................. 142
REFERENCES ............................................................................................................... 145
APPENDICES ................................................................................................................ 151
VITA ............................................................................................................................. 167

ix
LIST OF TABLES
TABLE PAGE
1. Demographic and Analytical Reading Inventory Data...........................................43
2. Individual Means on Reading Fluency ...................................................................70
3. Mean Reading Fluency in Comparison Sessions and Generalization Probes.........71
4. Maintenance on Reading Fluency ..........................................................................72
5. Individual Means on Number of Errors Per Minute ...............................................80
6. Mean Errors Per Minute in Comparison Sessions and Generalization Probes.......82
7. Maintenance on Errors Per Minute .........................................................................83
8. Individual Means for Types of Errors Per Minute..................................................85
9. Mean Types of Errors Per Minute in Comparison Sessions and Generalization
Probes......................................................................................................................89
10. Maintenance Performance on Types of Errors Per Minute ....................................90
11. Individual Means on Correct Answers to Literal Comprehension Questions. .....118
12. Mean Correct Answers to Literal Comprehension Questions in Sessions and
Generalization Probes ...........................................................................................120
13. Maintenance Performance on Correct Answers to Literal Comprehension
Questions...............................................................................................................121

1
CHAPTER I
INTRODUCTION
Being able to read well is associated with both academic and social benefits.
Academically, students who read well read fluently and with comprehension. They are
able to summarize, interpret, and accept or reject the information on the printed page
(Pressley, Gaskins, & Fingeret, 2006). Students who read well are able to read long
passages with ease and complete assignments in a reasonable time (Rasinski, 2000).
These students typically experience success during the school years and are prepared to
attend college or post-secondary programs following graduation (American College
Testing Program, 2006). Socially, students who read well tend to be self-motivated.
Therefore, they get more reading practice outside of the classroom simply because they
find reading to be a pleasurable activity (Rasinski, 2000). Finally, economic success
beyond the school years is associated with reading well in school (Brown & Bogard,
2007; Snow, Burns, & Griffin, 1998).
However, many students do not read well. For these readers, learning how to read
fluently and with comprehension is a challenge. Nationally, there are an estimated 8
million fourth through 12th
-grade students who read below grade level (U.S. Department
of Education, 2005b). Statewide, 31% of Florida’s third-graders read below grade level
(Florida Department of Education, 2008). In 2007, 37% of third-grade students in the
Miami-Dade County Public School district scored below grade level on the reading
portion of the Florida Comprehensive Assessment Test (FCAT) and were considered to
be struggling readers (Florida Department of Education, 2008).

2
There are numerous negative academic and social outcomes correlated with an
inability to read well (Hitchcock, Prater, & Dowrick, 2004). Academically, students who
do not read well cannot complete their assignments, and they are exposed to less
information because they typically cannot read quickly. Students who do not read well
may exhibit disruptive or withdrawn behaviors that distract them from learning activities
(Hitchcock et al., 2004). The negative social outcomes correlated with an inability to read
well include having a negative outlook and low participation in extracurricular school
activities, lagging academically behind other students, and having a higher probability of
dropping out of school (Lazarus & Callahan, 2000). Beyond school, students who do not
read well continue to experience negative social outcomes. They may have limited
employment opportunities, a greater likelihood of living in poverty, and a higher rate of
incarceration (Elbaum, Vaughn, Hughes, & Moody, 2000; Hitchcock et al., 2004).
Students who are English language learners (ELLs) and those identified as having
specific learning disabilities (SLD) are significantly at risk for the negative outcomes
associated with not reading well in English (Bernhard et al., 2006; Osborn et al., 2007).
These two groups of students who struggle with reading face many challenges in school
because reading in English is a prerequisite for all of their other subject areas (Hitchcock
et al., 2004; Osborn et al., 2007). Once they fall behind one academic year in reading,
students who are ELLs and those identified as SLD have a difficult time catching up in
later grades (Hitchcock et al.).
In 2005, there were approximately 5.1 million ELLs nationwide (U.S. Department
of Education, 2005a). ELLs made up 24.2% of students enrolled in Miami-Dade County
Public Schools during the 2006-2007 school year (Florida School Indicators Report,

3
2006-2007). The struggles inherent in learning to read in a second language make ELLs
particularly vulnerable to reading challenges in English and multiple grade retentions
(Pugh, Sandak, Frost, Moore, & Mencl, 2005). Even though ELLs are one of the fastest
growing groups of students in our schools, and one of the largest groups of learners
experiencing reading difficulties (Denton, Anthony, Parker, & Hasbrouck, 2004), little is
known about their reading development in English (Linan-Thompson, Vaughn, Hickman-
Davis, & Kouzekanani, 2003).
What has been learned is that ELLs typically find developing reading skills in
English particularly challenging and an alarming number of these students are reported as
having reading difficulties (Pugh et al., 2005). ELLs have been found to be weak in the
areas of academic language, vocabulary, and in the ability to make inferences and
analyze text in English (Gersten & Baker, 2000). After observing the limited number of
reading studies on ELLs in relation to their increasing numbers in U.S. schools, Gersten
and Baker (2000) concluded that much more research is needed to identify effective
reading practices for this population of learners.
Similar to ELLs, students with SLD also find learning to read fluently and with
comprehension challenging. Typically, students with SLD are identified by a significant
discrepancy between their achievement scores and actual achievement level.
Increasingly, however, the definition of SLD is being expanded to include a student’s
response to individually tailored classroom interventions (Boulineau, Fore, Hagan-
Burke, & Burke, 2004). These students represent half of the students’ nationwide
receiving special education services (Case & Taylor, 2005). Of those identified as having
SLD, approximately 80% have difficulties with reading (Gersten, Fuchs, Williams, &
4
Baker, 2001). Some students with SLD are disfluent readers; meaning that sentences and
words are read slowly and laboriously (Pattillo, Heller, Trefry, & Smith, 2004). Others
may read more fluently, but have not developed corresponding reading comprehension
skills (Hitchcock et al., 2004). The reading difficulties experienced by students with SLD
can lead to reading below grade level, which becomes an increasing problem as these
students fall farther behind their peers.
Even more challenged by reading are ELLs identified as having SLD (Tam,
Heward, & Heng, 2006). In addition to challenges in reading, these students often face
multiple barriers related to language, culture, disabilities, and mastering content areas
(Tam et al., 2006). Approximately 56% of ELLs with disabilities are diagnosed with SLD
(U.S. Department of Education, 2003). ELLs with SLD often exhibit similar
characteristics as native English speakers with SLD. They read below grade level, have
difficulties with comprehension, and some misbehave or withdraw as a result of reading
difficulties (McCardle, Mele-McCarthy, & Leos, 2005). ELLs should only be identified
as having SLD if there is sufficient evidence that the deficiencies are not a result of
learning a second language (Gersten & Woodward, 1994; McCardle et al., 2005).
Research exists that identifies some effective reading strategies for ELLs and
students with SLD. ELLs have been shown to benefit from interventions that include
vocabulary instruction (Fitzgerald, 1995; Gersten & Baker, 2000; Tam et al., 2006),
repeated exposure to English print (Tam et al., 2006), explicit instruction in
comprehension strategies (Denton et al., 2004), and one-on-one instruction with a teacher
(Linan-Thompson et al., 2003). Similarly, students with SLD have been found to benefit
from interventions that include vocabulary instruction (Therrien & Kubina, 2006),

5
repeated readings (Chard, Vaughn, & Tayler, 2002; Nelson, Alber, & Gordy, 2004;
Therrien & Kubina, 2006; Weinstein & Cooke, 1992), and individual attention (Elbaum
et al., 2000). Noting the similarities in effective reading strategies for these two groups of
students, Fitzgerald (1995) suggested that ELLs might benefit from interventions known
to benefit monolingual students with SLD. These interventions may also have a positive
impact on the reading skills of ELLs with SLD.
Research indicates that one intervention that has been shown to be effective in
improving reading fluency and comprehension is repeated readings (e.g., Nelson et al.,
2004; Tam et al., 2006). Repeated readings is an intervention that targets reading fluency
by having the reader repeatedly read a short passage of usually no more than 200 words
until their fluency improves (Samuels, 1979; Stahl & Heubach, 2005; Therrien & Kubina,
2006). The assumption is that once a student is more fluent in reading the passage, more
attention can be focused on comprehension (Samuels, 1979). Repeated readings has been
found to be successful with elementary and secondary students (Begeny, Daly, &
Valleley, 2006; Freeland, Skinner, Jackson, McDaniel, & Smith, 2000), students reading
below grade level (Stoddard, Valcante, Sindelar, O’Shea, & Algozzine, 1993; Tam et al.,
2006), students at or above grade level (Bryant et al., 2000), and students with visual
impairments (Pattillo et al., 2004). However, literature on the effectiveness of repeated
readings on ELLs (Gersten & Baker, 2000; Tam et al., 2006) and students with SLD
(Barley et al., 2002) is limited. Even more limited is research on repeated readings of
ELLs with SLD.

6
Purpose of the Study
Although ELLs with SLD are prevalent in many large urban school districts, there
is an absence of research of strategies for improving their reading abilities (Tam et al.,
2006). Approximately 56% of ELLs with disabilities are identified as having SLD (U.S.
Department of Education, 2003). The population of ELLs with SLD has been projected to
grow, particularly in states with high percentages of annual immigration (Case & Taylor,
2005).
ELLs with SLD struggle to keep up with their English-speaking peers in reading
(Denton et al., 2004). Unfortunately, their limited reading fluency and comprehension is a
stumbling block in every other subject, as they all employ reading as a means to access
information (Rasinski, 2000). Teachers of ELLs with SLD are in need of research to
guide their work with these students (Albus, Thurlow, & Clapper, 2007). The question
remains as to what reading strategies can be used to improve reading fluency and
comprehension so that these students can succeed in the classroom and beyond.
One approach that shows promise for reading improvement for ELLs with SLD is
repeated readings. Yet, limited research examines ELLs with SLD. Prior to this study,
only two studies were found that examined the effects of repeated readings on ELLs. One
study by Linan-Thompson et al. (2003) included participants who were ELLs and
identified as “at risk” of reading disabilities but not identified or diagnosed as having
SLD. These researchers found that participants made significant gains in oral reading
fluency and passage comprehension when pre- and post-test scores were compared
following 58 sessions of supplemental reading instruction that included repeated
readings. The other study by Tam et al. (2006) included 5 participants; two were

7
identified as ELLs with SLD. However, ELLs with SLD were not specifically targeted
for that study. The researchers observed reading improvements following the
implementation of a repeated readings intervention that incorporated error correction.
However, the authors noted that the findings of their study were preliminary, as there
were only 5 participants in the study and the needs of ELLs vary from learner to learner
(Tam et al.).
In sum, the study was guided by the increasing numbers of ELLs with SLD in
schools with reading challenges and the observed lack of research of effective reading
interventions. Further, this study was guided by the positive outcomes observed in
repeated readings research on other types of learners and limited research of this strategy
with ELLs with SLD. Subsequently, the purpose of this study was to investigate the
effects of repeated readings on reading fluency and comprehension of students who are
ELLs with SLD.
Statement of the Problem
This study evaluated the effects of repeated readings on the reading fluency and
comprehension of ELLs with SLD. Specifically, it examined the number of words read
per minute and the number and type of errors per minute following a single reading of a
passage (during baseline probes) and three repeated readings of a passage (during the
intervention phase). The study also evaluated differences in the number of correct
answers to literal comprehension questions during the baseline probes and the
intervention condition. Generalization probes using novel passages at the same level of
difficulty determined if any potential gains discovered in the intervention phase were
generalized to other passages. Passages from the intervention were used to determine if

8
the participants maintained any potential gains 2-, 4-, and 6- weeks after the intervention
ended.
Tam et al. (2006) found that two repeated readings interventions resulted in gains
in fluency and comprehension in 5 participants, two of whom were ELLs with SLD.
During the first intervention that involved reading a passage three times, the oral reading
rate of all the participants showed improvements over their performance during baseline.
During the second intervention, which involved reading the same passage until meeting a
set criterion number of words per minute, 4 of the 5 total participants reached the
predetermined fluency criterion of 100 correct words per minute. The mean number of
comprehension questions increased from an average of 1 answer correct during baseline.
There were an average of 4.1 answers correct during the first intervention and 4.8
answers correct during the second intervention.
This study built on the existing study by Tam et al. (2006) in several ways. First,
it specifically targeted ELLs with SLD for the repeated readings intervention. That is, for
participants to be eligible for the study, they had to be identified as ELLs with SLD by
the school district.
Second, it differed from previous studies in the time and frequency of the
intervention sessions. This study consisted of 10 to 20-minute daily sessions as deemed
optimal by Therrien and Kubina (2006) instead of 35-minute sessions 3 times a week
(Tam et al., 2006) and 6 minute daily sessions (Nelson et al., 2004). This was done to
determine if having a more frequent and intensive intervention such as this study would
lead to more rapid gains. Since many ELLs (Fry, 2007) and students with SLD (Osborn

9
et al., 2007) lag significantly behind their peers in reading, it was deemed useful to
determine if this strategy would lead to rapid gains.
Third, maintenance data were collected and examined. Tam et al. (2006) collected
maintenance data that suggested that a higher level of fluency achieved during the
intervention conditions might help the participants maintain fluency gains after the
interventions ceased. This study yielded information that built on that finding. This study
additionally investigated the types of errors made and the number of literal
comprehension questions answered correctly during maintenance.
Fourth, generalization data were collected and examined differently than they
were in other studies. Tam et al. (2006) conducted generalization probes and found that
an increased reading rate on intervention passages may have contributed to positive
effects on untaught passages. Weinstein and Cooke (1992) found that fluency increased
in unpracticed passages following repeated readings until three observed improvements
occurred in intervention. This study extended their research findings by using researcher
created passages with 80% of the same words as passages used during intervention.
Finally, this study was innovative in that it analyzed the types of errors the
participants made during reading. No known study has examined the types of errors made
by ELLs with SLD during a repeated readings intervention. This information may be
used to compare the errors made by these participants to research that reports on the
reading error patterns made by native English speakers with SLD (e.g., Barton & Huynh,
2003). The types of errors made by ELLs with SLD yielded information that no known
work has specifically examined.

10
Research Questions
This study examined the effects of a repeated readings intervention on the number
of words read aloud per minute, number of errors read aloud per minute, types of errors
read aloud per minute, and answers to literal comprehension questions answered aloud by
ELLs identified as having SLD who are struggling readers in an urban elementary school.
More specifically, the research questions ask, for ELLs with SLD who are struggling
readers at an urban elementary school:
1. Will repeated readings result in a change in reading fluency as measured by the
number of correct words read aloud per minute?
2. Will repeated readings result in a change in the number and types of reading errors
read aloud per minute?
3. Will repeated readings result in a change in the number of literal comprehension
questions answered aloud correctly?
4. Will repeated readings result in generalization of the number of (a) correct words read
aloud per minute, (b) errors and types of errors read aloud per minute, and (c) literal
comprehension questions answered aloud correctly with untaught similar passages?
5. Will repeated readings result in maintenance of the number of (a) correct words read
aloud per minute, (b) errors and types of errors read aloud per minute, and (c) literal
comprehension questions answered aloud correctly 2-, 4-, and 6- weeks after the
intervention?

11
Operational Definitions
In this section, certain terms that are frequently used in this study are defined.
Other terms, which are not frequently used but require definitions, are explained as they
are introduced.
Addition Error
An addition error is a word said aloud by the student that is not printed in the
passage.
Agreement
Agreement occurs when the researcher and independent raters independently
mark the same words and literal comprehension questions as correct or incorrect.
Comprehension
Comprehension was defined as the number of correct answers to literal
comprehension questions pertaining to the reading answered aloud correctly by the
participant.
Correct Words per Minute (CWPM)
Correct words per minute (which was also referred to as fluency in this study) was
defined as the number of words read aloud correctly per minute of reading (self
corrections accepted). A word was counted correct if the student independently
pronounced it correctly aloud without prompting within 3 seconds (Nelson et al., 2004).
Disagreement
Disagreement occurred when the independent rater and researcher did not score
the same word or literal comprehension question as correct during independent ratings.

12
Disfluent Readers
Disfluent readers do not read quickly and accurately. Typical characteristics of
these readers include reading with poor expression and having difficulty with word
recognition, not comprehending what is read, and having little motivation to read (Alber-
Morgan, Ramp, Anderson, & Martin, 2007).
English Language Learners (ELLs)
English language learners refer to students learning English and who are less than
proficient in English than in their first language (Gersten & Baker, 2000).
Error Correction
Error correction is a component of repeated readings (Therrien & Kubina, 2006).
It occurs following a reader error made aloud. It refers to the researcher correctly saying
the whole word that was read aloud incorrectly by the participant (Barbetta, Heward, &
Bradley, 1993). The reader is subsequently asked to repeat the word aloud immediately
following the error. After the repetition of the word, the entire sentence containing that
word is read aloud again by the reader. Once the passage has been read in its entirety, the
words that were initially read incorrectly are repeated aloud again by the reader in
isolation.
Fluency
The number of words read aloud correctly per minute of reading (Nelson et al.,
2004).

13
Fluency Assessment
Fluency, or the number of words read correctly aloud per minute of reading, was
measured in a fluency assessment. This assessment involved reading the passage from the
beginning for 1 minute.
Generalization
Generalization is used most often in the applied behavioral analysis literature to
indicate behavior changes that occur in nontraining conditions (Stokes & Baer, 1977).
That is, when the effects of behavior-change programs are shown across time, people,
settings, and/or related behaviors without direct training in all of those circumstances.
Throughout the study probes were made to test generalization of skills to untaught
passages that are similar to those being used in experimental sessions. Generalization
passages were approximately 100 words in length (with a minimum of 100 and a
maximum of 105 words) and were of the same level as those being used in experimental
sessions according to the basal key as well as the Fry Readability Graph (Fry,
Fountoukidis, & Polk, 1985). Additionally, approximately 80% of the words in the
generalization passage came directly from the passages that had been used in the
experimental sessions.
Hesitation
A hesitations is a type of error that refers to a delay of more than 3 seconds from
the end of one word read aloud to the beginning of the next word. The researcher counted
3 seconds silently and then stated the correct word to the student so that the student could
read on.

14
Interobserver Agreement (IOA)
Interobserver agreement is a method for ensuring reliability in the collection of
data on a target behavior. It involves two or more independent observers observing the
same behavioral episode in order to compare the results.
Literal Comprehension Question
A literal comprehension question is a question that asks the participant to recall
something explicitly stated in the text. These questions were used because they
demonstrated whether or not the participant had a basic understanding of the passage
(Tam et al., 2006).
Literal Comprehension Question Assessment
The researcher asked five literal comprehension questions one at a time in each
condition of the study. The student had 5 seconds to answer each question aloud. Student
responses were compared with the answer key provided by the basal reader for that
reading passage. Responses matching the answer key that were made within 5 seconds
were scored as correct. No response, those not matching the answer key, and/or those
made after 5 seconds of silence were scored as incorrect. The total number of correct
responses were recorded and graphed.
Maintenance
Maintenance is the extent to which the learner continues to perform the target
behavior after a portion or all of the intervention has been terminated (Cooper, Heron, &
Heward, 2007).

15
Mispronunciation
A mispronunciations is a type of error defined as a printed word that is said aloud
incorrectly. For example if the text says “He knows many Latin words” but the student
reads aloud “He knows many Latoon words” (Dictionary.com, 2008).
Multiple Baseline Design Across Subjects
Multiple baseline design across subjects is a single subject research design study
model that employs the use of steady state responding. After steady state responding is
reached under baseline, the intervention is applied to one participant while the rest
continue under baseline. When steady state responding or criterion is reached, the same
intervention is applied to next participant and so on (Cooper et al., 2007).
Multiple Probe Baseline Design
The multiple probe baseline design is a variation of the multiple baseline design.
Like the multiple baseline design, interventions are introduced at different times across
conditions, participants, or behaviors. The difference is that in a multiple baseline design
data are collected continuously during the baseline condition, whereas in the multiple
probe design, data are collected intermittently during a baseline probe condition. The
intermittent probes are desirable to use in studies such as the present study where
collecting continuous baseline data may prove to be reactive, may be impractical or may
be unnecessary because a strong assumption of stability can be made prior to the study
(Cooper et al., 2007).

16
Number of Errors per Minute (EPM)
This is defined as the total number of errors read aloud during 1 minute of
reading. Errors included omissions, additions, mispronunciations, substitutions, and
hesitations of more than 3 seconds from one word read to the next (Tam et al., 2006).
Omission
An omissions is a type of error defined as a printed word in the passage that is not
read aloud by the student.
Repeated Readings
Repeated readings refer to a method used primarily to build reading fluency. It
consists of reading a short passage of no more than 200 words repeatedly aloud until a
satisfactory or predetermined level of fluency is reached (Samuels, 1979). Error
correction is a component of repeated readings (Therrien & Kubina, 2006). Error
correction strengthens the method by insuring that the participant does not repeatedly
practice mistakes.
Specific Learning Disability (SLD)
A specific learning disability (SLD) is a disorder in one or more of the basic
psychological processes involved in understanding or in using language, spoken or
written, which may manifest itself in the imperfect ability to listen, think, speak, write,
spell, or do mathematical calculations (U.S. Department of Education, 2004). SLD is
synonymous with the term learning disabilities and is the term currently used.
Struggling Reader
A struggling reader is a participant reading at least 1 year below grade level in
English.

17
Substitution
A substitutions are a type of error defined as stating a word aloud that is different
than the printed word. For example, the text says “He saw the park” and the participant
reads, “He saw the animal.”
Type of Errors per Minute
Throughout the study, the researcher collected data that documented the reading
errors that the participants made aloud during oral reading of the passages. The errors
were categorized into five types: omissions, additions, mispronunciations, substitutions,
and hesitations.
Summary
Students who read well are able to easily access information both in and beyond
school. On the other hand, students who do not read well find assignments challenging
and are at risk of facing negative consequences both in and outside of school. ELLs and
students with SLD are at risk of having difficulties in reading. ELLs are students who are
less fluent in English than in their first language. Students with SLD have a basic
psychological processing disorder that affects their ability to use language (U.S.
Department of Education, 2004).
ELLs with SLD often find learning to read in English especially challenging (Albus
et al., 2007). These students face multiple challenges when learning to read in English
that include language, culture, disabilities, and mastering content areas (Tam et al., 2006).
ELLs are one of the fastest growing groups of students in U.S. schools (Denton et al.,
2004). As the population of ELLs grows, it is reasonable to believe that the population of
ELLs with SLD in U.S. schools will also rise.

18
While it is known that ELLs with SLD struggle with reading in English, little is
known about developing their reading fluency and comprehension (Linan-Thompson et
al., 2003). However, research has identified some effective strategies for improving
English reading in ELLs and students with SLD as separate groups of learners. These
strategies include vocabulary instruction, repeated exposure to text, and individual
attention (Fitzgerald, 1995; Gersten & Baker, 2000; Tam et al., 2006). Since these
strategies have been found to be appropriate for students who have been identified as
ELLs or as having SLD, this study was undertaken to find if they may be useful in
improving the reading fluency and comprehension in students who are ELLs with SLD.
Repeated readings is a method that incorporates some of the strategies suggested for
ELLs and students with SLD. Repeated readings involves reading a short passage
repeatedly until a satisfactory or predetermined level of fluency is reached (Samuels,
1979). However, there are insufficient data on its success with ELLs (Tam et al., 2006)
and students with SLD (Nelson et al., 2004). Only one known study has examined the use
of repeated readings with participants who were identified as being ELLs with SLD (i.e.,
Tam et al.). That study found that the participants had gains in reading fluency and
comprehension in each of two repeated readings interventions. However, its findings can
only be considered preliminary in the use of repeated readings with this population, as
only two of the participants included were ELLs with SLD.
More research is needed to examine the effects of repeated readings on ELLs with
SLD. There are increasing numbers of ELLs with SLD in U.S. schools with reading
challenges (U.S. Department of Education, 2004). The lack of research on effective
reading interventions for this group of students does not address their needs. Research has
19
demonstrated positive outcomes when repeated readings is employed with other types of
learners (Bryant et al., 2000; Freeland et al., 2000; Pattillo et al., 2004; Stoddard et al.,
1993). However, the research on this method and its use with ELLs with SLD is limited
(i.e., Tam et al., 2006). Subsequently, this study began to fill a gap in the research base
that investigated the effects of repeated readings with students who are identified as ELLs
with SLD.
This study used a multiple probe baseline design across subjects to examine the
effects of repeated readings on reading fluency, reading errors, and reading
comprehension of ELLs with SLD. The research questions addressed the number of
correct words read aloud per minute, the number and types of reading errors read aloud
per minute, and the number of literal comprehension questions answered aloud correctly.
The generalization of the dependent variables on untaught similar passages was
examined. Maintenance data were collected 2-, 4-, and 6-weeks after the intervention
concluded.

20
CHAPTER II
LITERATURE REVIEW
Reading is a skill that allows access to information and opportunity. Some
students, particularly English language learners (ELLs) with specific learning disabilities
(SLD), find learning to read in English challenging (Tam et al., 2006). This study used
repeated readings as an intervention to target reading fluency and comprehension in ELLs
with SLD.
This chapter provides a review of the literature related to this research study. A
general discussion of the characteristics of students who do and do not read well is
presented initially. This is followed by the reading performances in English of ELLs,
students with SLD, and ELLs with SLD. Next, a discussion of effective reading strategies
for these two groups of struggling readers is provided. Finally, there is a thorough
presentation of the research on repeated readings, the reading intervention investigated in
this study.
Characteristics of Students Who Do and Do Not Read Well
Students who read well are those who read fluently and with comprehension
(Rasinski, 2000). These readers can summarize, interpret, and accept or reject the
information on the printed page (Pressley et al., 2006). According to Valencia and
Pearson (1986), students who read well use prior knowledge to help construct meaning
from the text and to draw inferences at the lexical, syntactic, and textual levels.
Furthermore, effective readers provide appropriate responses to questions about text.
They are able to employ various reading strategies to help them understand what they

21
read, to read long passages with ease and, to complete assignments in a reasonable time
(Rasinski, 2000). These readers tend to feel good about their ability to read and are self-
motivated enough to want to read more (Rasinski, 2000). Because they can read well,
they are expected to attain social and economic success beyond the school years (Snow et
al., 1998).
Students who do not read well, conversely, find it challenging to learn how to
read fluently and with comprehension. These students read laboriously and slowly and
dedicate a great deal of energy to decoding the letters on the page, with little attention to
comprehension (Chard, Vaughn, & Tyler, 2002; Pressley et al., 2006). Unfortunately,
these readers are associated with academic failure (Hitchcock et al., 2004). They face
numerous poor academic and social outcomes because of their lack of adequate literacy
skills (Hitchcock et al.). In the classroom, these students cannot perform at the level of
their peers. They often are exposed to less information because of their inability to read
well (Hitchcock et al.). Their frustrations often lead to exhibitions of disruptive or
withdrawn behavior in the classroom to avoid reading-related activities (Hitchcock et al.).
Potential poor social outcomes for students who do not read well include limited
employment opportunities and a greater likelihood of living in poverty (Elbaum et al.,
2000; Hitchcock et al.).
Students significantly at risk of not reading well and experiencing the associated
negative outcomes are ELLs (Bernhard et al., 2006) and those with SLD (Osborn et al.,
2007). Because being able to read well and comprehend material is necessary for success
in all of the subject areas, these two groups of students face many school challenges

22
(Hitchcock et al., 2004; Osborn et al.). Once they fall behind in reading, ELLs and
students with SLD have a difficult time catching up in later grades (Hitchcock et al.).
English Language Learners and Reading
ELLs are students who have been identified as being less than proficient in
English than their first language (Gersten & Baker, 2000). This term encompasses
students who may communicate effectively in social situations, but struggle with
academic English (Gersten & Baker, 2000). In Miami-Dade County Public Schools (M-
DCPS) students who are exposed to a language other than English are administered the
Oral Language Proficiency Scale (Dade County Board of Public Instruction, 1978). The
data gathered from this assessment are reported in the form of an ESOL Level ranging
from I-V, whereas I represents highly limited English language proficiency and V equals
fluency in English (Miami Dade County Public Schools, 2005).
Over the last several decades, the population of ELLs in the U.S. has increased
every year (Case & Taylor, 2005). For example, from 1991 to 2003, this population
increased by 105% (U.S. Department of Education, 2003). By 2015, it is estimated that
30% of the nation’s school population will be the children of immigrants who speak
languages other than English (U.S. Department of Education, 2003). With such a
remarkable increase estimated over a short period of time, their needs to be more research
examining ELLs and their acquisition of English reading skills (Gersten & Baker, 2000).
ELLs are one of the largest groups of learners experiencing English reading
difficulties in U.S. schools (Denton et al., 2004). The National Assessment for
Educational Progress (NAEP) found that nearly three-quarters of fourth-grade ELLs
scored at the lowest level possible for reading in national testing in 2005 (Fry, 2007).

23
This report found that ELLs nationally tended to be concentrated in the lower
achievement levels in English reading and trail their White, native English speaking peers
by a gap of 47 percentage points (Fry, 2007). Nationally, ELLs trail further behind their
peers in reading than in other subject areas.
Because ELLs have not mastered the English language, they typically find it
challenging to acquire reading skills in English (Pugh et al., 2005). Obtaining reading
fluency and accuracy is therefore a daunting task (Brisk & Herrington, 2000). To become
a better reader, amongst other skills, ELLs need to acquire knowledge of English
idiosyncrasies (Brisk & Herrington, 2000) such as the multiple meanings of certain words
and the various sounds a single letter combination can make (Linan-Thompson et al.,
2003). Also, these students must internalize the sounds, rhythms and patterns of the
English language, something that a native reader knows prior to entering school (Brisk &
Herrington, 2000).
Contextual and personal variables make it difficult to list the general characteristics
of ELLs who are struggling with reading (Brisk & Herrington, 2000). ELLs come from
various backgrounds and have varied experiences. Some have had schooling in their
native language and have acquired reading skills that need to be transferred to English
(Pugh et al., 2005). Some have not had consistent schooling and do not read well in any
language. Some ELLs have a background in a language that resembles English in word
structure, word order, or sound, while others do not. These differences in their schooling
and reading backgrounds mean that the reading abilities of ELLs need to be reviewed
individually, and each may face unique challenges in learning how to read in English.
However, all ELLs have a large amount of new information to internalize. Therefore,

24
most ELLs have a slower rate of acquiring reading skills in English than their
monolingual peers (Pugh et al.). Although, little is known about the English reading
development of ELLs (Linan-Thompson et al., 2003), it is known that it can take more
than 7 years for these students to become fluent speakers and readers in a second
language (Krashen & Terrell, 1983).
There have been two research reviews examining reading development in ELLs.
Gersten and Baker (2000) used a rigorous qualitative method, a multivocal synthesis, to
evaluate the results of several intervention and descriptive studies. They found several
specific instructional variables to be effective in working with ELLs such as vocabulary
instruction and cooperative learning strategies. Fitzgerald (1995) found that ELLs use
cognitive processes that are similar to those of native-language readers. Specifically, their
vocabulary knowledge plays an important role in reading and comprehension. They
monitor their own reading and recognize problems to self-correct. Further, Fitzgerald
found that these students use schema and prior knowledge and understand passages that
are more congruent with their experiences better than those that are not. However, while
the same cognitive processes as native English speakers are used, some facets of those
processes may be used more slowly in ELLs. Fitzgerald postulated that the same reading
interventions used with native speakers who struggle with reading might therefore be
successful with ELLs.
Students with Specific Learning Disabilities and Reading
Many students with SLD also find it challenging to learn to read fluently and with
comprehension. The Individuals with Disabilities Education Act (U.S. Department of
Education, 2004) defines SLD as a disorder in one or more of the basic psychological

25
processes involved in understanding or in using language, spoken or written, which may
manifest itself in the imperfect ability to listen, think, speak, write, spell, or do
mathematical calculations (U.S. Department of Education, 2004). Half of the student’s
nationwide receiving special education services are students who are labeled as having
SLD (Case & Taylor, 2005). Of those identified as having SLD, approximately 80% have
difficulties with reading (Gersten et al., 2001). Typically, reading ability is the reason for
the initial referral of these students to special education.
Teachers of students with SLD who struggle with reading report that they tend to
function below their peers in nearly every subject area (Osborn et al., 2007). Some
readers with SLD struggle with basic, automatic word identification and decoding and are
subsequently disfluent, meaning that sentences and words are read slowly and laboriously
(Manset-Williamson & Nelson, 2005; Pattillo et al., 2004). Chard et al. (2002) noted that
students with SLD are most at risk for having poor fluency because too much effort is
spent on decoding and not enough effort is spent on higher-level processes such as
comprehension.
Students with SLD, who struggle with reading, cannot read well enough to
complete assignments in school (Hitchcock et al., 2004; Nathan & Stanovich, 1991).
Because they read fewer words per minute, these students need to devote a greater
amount of time and energy to their assignments than their peers (Rasinski, 2000). This
may lead to frustration. Frustration may lead to these students reading less and choosing
not to read when other activity options are available to them (Rasinski, 2000). Choosing
not to read contributes to the lack of reading practice, which further widens the gap
between these students with SLD and their peers.

26
Chard et al., (2002) conducted a synthesis of research studies on students with
SLD. The results suggested that effective interventions include explicit models of reading
fluency, multiple opportunities to read familiar text repeatedly, and the opportunity to
have some form of corrective feedback. The focus of only one study was reading
comprehension however, most of the studies indicated that there was an increase in
comprehension when participants improved their fluency.
Therrien and Kubina (2006) summarized similar points. They stated that in order
for students with SLD to improve their reading fluency and comprehension, they should
repeatedly read passages with a competent tutor and receive corrective feedback
(Therrien & Kubina, 2006). Additionally they made reference to the time commitment
required in implementing a repeated reading intervention. Their research indicated that in
order to see maximum gains in reading the intervention should last 10 to 20 minutes per
session and should occur between 3 to 5 times per week (Therrien & Kubina, 2006).
English Language Learners with Specific Learning Disabilities and Reading
Students who are at the intersection of these two groups, ELLs with SLD, face
multiple challenges including language, culture, and disabilities (Tam et al., 2006). These
students are developing a bilingual brain while dealing with processing issues that make
learning to read fluently and with comprehension difficult without appropriate supports
(Pugh et al., 2005). Further, it is not always clear whether or not the reading difficulties
are related to the acquisition of English or to SLD.
The National Office of English Language Acquisition estimated that 9% of all
ELLs in the U.S. in kindergarten through 12th
-grade were identified as having disabilities
during the 2001-2002 school year (U.S. Department of Education, 2003). Of those ELLs

27
identified as having disabilities, 56% were identified as having SLD (U.S. Department of
Education, 2003). According to the National Assessment of Educational Progress being
an ELL dramatically increases the probability of a student having reading challenges
(Fry, 2007). Students who are both ELLs and who have SLD require more attention to
assist them in reaching the levels of English reading fluency and comprehension of their
native English speaking peers without disabilities (Albus et al., 2007; Fry, 2007).
Repeated Readings
Repeated readings is a reading intervention that targets fluency and
comprehension (Nelson et al., 2004; Tam et al., 2006; Therrien et al., 2006). It involves
having the reader repeatedly read a short passage of usually no more than 200 words
repeatedly until a satisfactory or predetermined level of fluency is reached (Samuels,
1979; Stahl & Heubach, 2005; Therrien & Kubina, 2006). Fluency refers to the reader’s
ability to read quickly and accurately (Manset-Williamson & Nelson, 2005). Reading
fluency is generally measured by counting the number of words read correctly per minute
Repeated readings grew out of the Automaticity Theory (LaBerge & Samuels,
1974; Samuels & Flor, 1997) which stated that a fluent reader could decode text without
devoting attention to the process of reading, therefore leaving attention free to dedicate to
comprehension of the text (Samuels, 1979). According to this theory, beginning readers
need to focus on letters and sounds, but as they become more fluent readers they can
focus their attention on phrases, sentences, and meaning. Samuels (1979) stated that the
practice provided in repeated readings, makes the decoding necessary for reading
automatic, therefore leading to better comprehension.

28
While there has been a substantial amount of research on repeated readings with
students of varying ages and abilities (Bryant et al., 2000; Freeland et al., 2000; Pattillo et
al., 2004; Stoddard et al., 1993), there exists only limited research regarding its
effectiveness with ELLs (Gersten & Baker, 2000; Tam et al., 2006) and students with
SLD (Barley et al., 2002). A thorough search of the literature revealed only two studies
conducted with ELLs (Linan-Thompson et al., 2003; Tam et al., 2006). A somewhat
broader base of research exists examining repeated readings with students who have SLD
(Begeny et al., 2006; Nelson et al., 2004; Therrien et al., 2006; Weinstein & Cooke,
1992). Further, only one study was found that included 2 participants who were
identified as ELLs with SLD (Tam et al.).
Following is a review of the two studies examining the effects of repeated readings
on ELLs. One of these studies (Tam et al., 2006) included 2 participants who were
identified as ELLs with SLD. This is followed by a review of four studies examining the
effects of repeated readings interventions on students with SLD. Finally, the lack of
known studies that examine repeated readings with ELLs with SLD is discussed.
English Language Learners and Repeated Readings
Fitzgerald (1995) concluded that teachers of ELLs should use sound principles of
reading instruction based on current research with native speakers as well as with ELLs.
Since repeated reading has been examined with native language speakers who are
struggling with reading (e.g., Chard et al., 2002; Nelson et al., 2004) and has been found
to be effective, it seems logical that its effects on ELLs should be investigated. The
limited studies examining this method with ELLs, however, indicate a need to broaden
the research base in this area.

29
Linan-Thompson et al. (2003) conducted a statistical analysis of pre- and post- test
scores with ELLs who participated in an intervention that included repeated readings.
The participants were 26 ELLs in the second grade who were identified by their teachers
as being at risk for reading difficulties. The intervention included repeated readings and
other reading strategies. Specifically, the intervention was 30 minutes long and included
(a) 5 minutes of repeated readings, (b) 5 minutes of phonemic awareness instruction, (c)
10 minutes of instructional level reading, (d) 5 minutes of word study, and (e) 2 to 3
minutes of writing. All the participants made statistically significant gains in oral reading
fluency. All but three students made more than 6 months worth of gains during the 3-
month intervention. The most dramatic gains were made in reading fluency (Linan-
Thompson et al., 2003). The gains in fluency indicated that repeated readings was
valuable to the participants, however, the multi-componential nature of the intervention
made it difficult to determine whether the repeated readings alone accounted for the
gains.
In a study specifically targeting ELLs struggling with reading, Tam et al. (2006)
also found an increase in oral reading fluency following a repeated readings intervention.
They used a multiple baseline across subjects design to evaluate the effects of a repeated
reading intervention program on oral reading rate and comprehension. The participants
were five elementary aged ELLs reading below grade level; two of them were diagnosed
with SLD. The first intervention condition consisted of asking the participants to read the
passage as fast as they could three times. The second intervention condition was identical
except that the same passage was used until the learner reached a predetermined number
of words read correctly per minute. During the first condition, the oral reading rate of all

30
5 participants showed improvements over their performance during baseline. During the
second condition, 4 of the 5 participants reached the predetermined fluency criterion of
100 correct words per minute. The mean number of comprehension questions answered
correctly per session was notably higher during both intervention conditions than during
baseline. Specifically, there was an average of one answer correct during baseline and 4.1
and 4.8 answers correct during the first and second intervention conditions respectively.
In sum, the research in repeated readings is preliminary but demonstrates promise
for ELLs. Linan-Thompson et al. (2003) and Tam et al. (2006) both found an increase in
oral reading fluency in ELLs following the implementation of interventions that included
repeated readings. Tam et al. also found that participants answered more literal
comprehension questions correctly following the repeated readings interventions.
However, the fact that there are only two studies on repeated readings and ELLs
demonstrates that this research is limited, and that less is known about the effectiveness
of this approach with ELLs than of their native English speaking peers.
Students with Specific Learning Disabilities and Repeated Readings
A somewhat broader base of empirical studies exists that examines repeated
readings and students with SLD. Recently, research in this area has focused on different
aspects of the repeated readings process. One aspect is comparing the results of
repeatedly reading a short passage until a criterion reading rate is reached to repeatedly
reading a set number of times or until consecutive improvements are made (Tam et al.,
2006; Weinstein & Cooke, 1992). Another researched aspect is the pairing of repeated
readings with some form of error correction (Begeny et al., 2006; Nelson, et al., 2004;
Therrien et al., 2006). Generally, it is agreed that students should be asked to read

31
passages that will allow them to reach criterion in a reasonable amount of time, and that
error correction should be a natural part of repeated readings so that errors are not
practiced repeatedly (Therrien & Kubina, 2006).
In a classic study, Weinstein and Cooke (1992) examined the effects of two
repeated readings interventions on generalization of fluency. The participants were four
beginning readers in the second and third grades with SLD. They used a single subject
ABACA design in which two interventions were examined. In both interventions, the
participants listened to an audiotape of a passage read at a rate of 100 words per minute.
Then, they were asked to read the passage as quickly and well as they could. The first
intervention was a fixed criterion intervention, in which the participant had to continue
reading until reaching a 90 word per minute criterion. The second intervention was called
the improvements criterion. It involved reading the same passage until three consecutive
improvements were recorded. The researchers recorded if an increase the fluency rate (as
measured by the number of correct words read per minute) resulted following each of the
two interventions.
All 4 participants experienced gains in their mean number of words read per
minute in both interventions as compared to baseline. However, in the fixed criterion
intervention, the students read an average of 62% more words per minute and in the
improvements criterion intervention the students read 52% more words per minute than
in baseline. Generalization data favored the improvements criterion intervention. The
number of correct words per minute in unpracticed stories increased from baseline
following the improvements phase. Correct words per minute decreased from the
preceding baseline on unpracticed stories following the criterion phase. While the study

32
was somewhat limited by the small number of participants (4) and time constraints (some
intervention phases had to be truncated before the participants reached criterion due to
the school schedule), the researchers demonstrated that both repeated readings
interventions proved to be an effective tool in assisting all four students in making gains
in fluency (Weinstein & Cooke, 1992).
More recently, Nelson et al. (2004) found gains in fluency when repeated readings
was implemented with 4 second grade participants with reading difficulties. Three of the
4 participants were identified as having SLD. A multiple-baseline design was used to
examine the effects of two interventions on reading accuracy and fluency: systematic
error correction and systematic error correction paired with repeated readings. In the
systematic error correction phase, participants received feedback for each misread word
during the oral reading of a passage. Then the participant practiced each misread word in
isolation following the reading. During the error correction paired with repeated readings
phase, the error correction procedures mentioned above were followed by three one-
minute timed readings of the passage.
The results of Nelson et al. (2004) demonstrated that with systematic error
correction there were fewer reading errors per minute for all 4 participants. However,
there was only a minimal increase in the number of words read correctly per minute.
Conversely, when repeated readings was paired with systematic error correction all four
participants improved in both reading accuracy and fluency. In this phase, all 4
participants read correctly from 12.6 to 14.5 words more per minute than in the
systematic error correction phase. They also had similar or lower error rates during the
repeated readings paired with error correction phase as compared to the systematic error

33
correction phase. Maintenance data with previously read material demonstrated that the
number of words read per minute increased slightly from baseline for three of the
participants.
Begeny et al., (2006) also compared the effects of repeated readings and an error
correction method. Specifically, the authors employed an alternating treatments design to
determine the effects of four different reading treatments on an 8-year old boy with SLD.
The first treatment, baseline, consisted of a single reading of a passage to assess reading
fluency. In the second treatment, phrase drill error correction, the instructor modeled a
word after it was read incorrectly and prompted the student to repeat the phrase that
contained the misread word. This was followed by a fluency assessment. In the third
treatment, entitled repeated readings, the participant read a passage twice before being
assessed for fluency. In the final treatment, the reward treatment, the participant read a
previously administered passage followed by a fluency assessment and then was
rewarded with a preferred reward if the passage was read faster and with the same or
fewer errors than the previous time the passage was administered.
The results of Begeny et al. (2006) indicated that the repeated readings and phrase
drill treatments resulted in reading gains. During the baseline treatment the mean correct
words read per minute was 36.13. During the repeated readings treatment, there was an
average of 59.63 correct words per minute. The phrase drill treatment had an average of
60 correct words per minute. The results indicated that repeated readings improved oral
reading fluency with an overall increase of 23.5 words read correctly per minute and an
overall decrease of 1.62 reading errors per minute as compared to baseline. Also, it
preliminarily demonstrated that a critical component of repeated readings was the use of

34
an error correction procedure that included the instructor modeling the correct
pronunciation of the word and the student imitating the model. The importance of error
correction was demonstrated by a decrease of three reading errors per minute during the
phrase drill error correction treatment as compared to the baseline treatment.
Similarly, Therrien et al. (2006) incorporated error correction methods in a
repeated readings study. They used a pre/post examination model study to ascertain if
repeated readings combined with a question generation component was effective at
improving the reading fluency and comprehension of fourth- to eighth-grade participants
with SLD or who were struggling readers. Participants were randomly assigned to a
treatment or control group. During treatment, each participant read a passage until a
criterion number of correct words per minute was attained or until the passage was read
four times. The participant was given corrective feedback when a reading error was made
aloud. The participant was then prompted to read and answer questions from a cue card
pertaining to the passage. The entire intervention series was repeated again in the
following session with new material adjusted by the researcher depending on the
participant’s ability to reach the criterion. The control group did not receive the
treatment. Instead, the control group received reading instruction in the classroom while
the treatment group received the treatment in addition to the reading instruction in the
classroom.
The results of the 4-month study demonstrated that participants receiving the
intervention made significant gains in reading fluency and comprehension. From pre- to
post-test they improved their reading fluency by an average of 13 correct words per
minute while the control group improved reading fluency by an average of only 2.28

35
correct words per minute. The treatment group also improved their ability to answer
inferential comprehension questions by an average of two more questions correct on
passages that were reread as compared to passages that were read only once.
As a whole, the research in the use of repeated readings and students with SLD
has resulted in positive outcomes. Weinstein and Cooke (1992) saw increases in reading
fluency in students with SLD. The study by Nelson et al. (2004) demonstrated that the
combined use of repeated readings with error correction resulted in increases in reading
fluency and decreases in error rates as compared to baselines in which a passage was read
once. Begeny et al. (2006) found that significant gains were made by a student who
received an intervention that incorporated repeated readings and corrective feedback.
Therrien et al. (2006) found that struggling readers and students with SLD receiving
repeated readings interventions made increases in oral reading fluency as well as gains in
the number of correctly answered questions about the passages read. These results are
encouraging as these data can be used to support the use and further examination of
repeated readings as an intervention for students with SLD who struggle with reading.
English Language Learners with Specific Learning Disabilities and Repeated Readings
No known studies to date have specifically targeted ELLs with SLD to examine
the effects of repeated readings as compared to a single reading of a passage. However,
one study mentioned previously conducted by Tam et al. (2006) did include 2 participants
who were identified as ELLs with SLD. The researchers found that the participants had
an increase in fluency and comprehension in each of two repeated readings interventions.
One intervention involved reading a passage until a criterion of 100 words per minute
was reached. The other treatment involved reading a passage until three consecutive

36
increases in words per minute were recorded. One of the two ELLs with SLD was
initially identified as a struggling reader reading 2 years below grade level. Through the
course of the study, however, it was found that she could read material that was at a
higher level. The researchers noted that she read material at her grade level for the
remainder of the study following the discovery that she could indeed read better than was
initially assessed (Tam et al.). The student’s ability to read passages on grade level led
the researchers to question whether this student was truly an ELL with SLD who was
struggling with reading. The article does not indicate whether or not the student was
reevaluated. Therefore, although the study had two students who were identified as ELLs
with SLD, there may have only been one who met this criterion.
Preliminarily, the results of Tam et al. (2006) suggest that repeated readings could
be considered as a reading strategy for students who are ELLs with SLD. However, much
more research is needed to raise the level of confidence in this approach as an evidence-
based intervention for ELLs with SLD.
Summary
Reading is a skill that allows access to opportunity. There are several positive
outcomes associated with being able to read well and several negative outcomes
associated with not being able to read well. Positive outcomes include social and
economic success beyond the school years (Snow et al., 1998). Negative outcomes
include limited employment opportunities and a greater likelihood of living in poverty
(Elbaum et al., 2000; Hitchcock et al., 2004).
ELLs (Bernhard et al., 2006) and students with SLD (Osborn et al., 2007) are at
particularly high risk of facing the negative outcomes of not reading well. ELLs are

37
students who have been identified as being less than proficient in English than their first
language (Gersten & Baker, 2000). Students with SLD have a disorder in one or more of
the basic psychological processes involved in understanding or in using language (U.S.
Department of Education, 2004). Students who are ELLs with SLD face multiple
challenges in acquiring reading skills in English and are neglected in the literature on
reading interventions. The strategies that have been shown to be effective in assisting
students who are ELLs or who have SLD are similar and may be successful with ELLs
with SLD (Fitzgerald, 1995).
The method of repeated readings, which came out of the Automaticity Theory of
LaBerge and Samuels (1974), is used to improve reading fluency and comprehension in
struggling readers. Repeated readings involves having the reader repeatedly read a short
passage of usually no more than two hundred words repeatedly until a satisfactory or
predetermined level of fluency is reached (Samuels, 1979; Stahl & Heubach, 2005;
Therrien & Kubina, 2006). While there has been a considerable research on repeated
readings in general, research with ELLs (Gersten & Baker, 2000; Tam et al., 2006) and
students with SLD (Barley et al., 2002) is limited. Even more limited is the research
examining the method of repeated readings with students who are ELLs with SLD (Tam
et al.).
Only a small body of literature has demonstrated the effectiveness of repeated
readings with ELLs (Linan-Thompson et al., 2003; Tam et al., 2006). Linan-Thompson et
al. conducted a statistical analysis of pre- and post- test scores with ELLs who
participated in an intervention that included repeated readings. The most dramatic gains
were made in reading fluency. The gains in fluency indicated that repeated readings was

38
valuable to the participants, however, the multi-component nature of the intervention
made it difficult to determine whether the repeated readings alone accounted for the
gains. Tam et al. also found an increase in oral reading fluency following a repeated
readings intervention. During the second condition, 4 of 5 participants reached the
predetermined fluency criterion of 100 correct words per minute. The mean number of
comprehension questions answered correctly per session was notably higher during both
intervention conditions than during baseline.
A slightly larger body of literature exists that examines repeated readings with
students who with SLD. Chard et al. (2002) conducted a synthesis of research studies on
students with SLD and found that that effective interventions include explicit models of
reading fluency, multiple opportunities to read familiar text repeatedly, and the
opportunity to have corrective feedback. Therrien and Kubina (2006) echoed this when
stating that students with SLD should repeatedly read passages with a competent tutor
and receive corrective feedback. Weinstein and Cooke (1992) and Nelson et al. (2004)
demonstrated that repeated readings interventions proved to be an effective tool in
assisting participants with SLD in making gains in fluency. Repeated readings improved
oral reading fluency with an overall increase of 23.5 words read correctly per minute and
an overall decrease of 1.62 reading errors per minute as compared to baseline in a single
subject study by Begeny et al. (2006). Therrien and Kubina (2006) ascertained that a
repeated reading intervention, which included a question generation component, was
effective at improving the reading fluency and comprehension in fourth- to eighth-grade
participants with SLD or who were struggling readers. Taken together, repeated readings
has been shown to be an effective tool in improving reading in students with SLD.

39
This review clearly demonstrates the need for additional research on the effects of
repeated readings on students who are ELLs with SLD as only one study included two
students who meet this criterion (Tam et al., 2006). Although this population is steadily
increasing in public schools throughout the country (U.S. Department of Education,
2005a), there is a dearth of information to guide educators in assisting ELLs with SLD in
reading acquisition (Tam et al.). There is a need use systematic approaches to determine
effective reading instructional techniques for ELLs (Gersten & Baker, 2000; Linan-
Thompson et al., 2003). Repeated readings may be an effective intervention for
improving English reading in ELLs with SLD.
This study examined the effects of repeated readings on English reading fluency,
accuracy and comprehension of ELLs with SLD who are struggling readers. This was
accomplished by examining the effects of a repeated readings intervention on the number
of words read correctly aloud per minute, the number of errors read aloud per minute, the
types of errors read aloud per minute, and the ability to correctly answer literal
comprehension questions aloud. Also, the study measured generalization and
maintenance of the same reading skills.

40
CHAPTER III
METHOD
This study examined the effects of repeated readings on reading fluency, reading
errors, and reading comprehension of third-, fourth-, and fifth-grade English language
learners (ELLs) with specific learning disabilities (SLD) who are struggling readers. Also
examined were the maintenance and generalization of the skills acquired throughout the
course of the intervention.
This chapter presents information about the study’s participants, setting, and
materials. The dependent variables are identified and explained. This is followed by a
description of the experimental design used in this study. The general procedures section
details the steps taken prior to and during the course of the study. This chapter concludes
with a summary.
Participants
Participants were 4 ELLs with SLD who were struggling readers in the third-,
fourth-, and fifth-grade who were nominated by their teachers for participation in this
study (see Table 1, page 43). Participant names used throughout the study are
pseudonyms. The nominating teachers were special, general, and English for Speakers of
Other Languages (ESOL) teachers who had known the participants for at least 1 year.
Teacher nominations were based on their experiences with the participants and the
participants’ performances in reading tasks in their classes. The teacher nominations were
used as part of the selection procedures as teachers are an invaluable source of
information regarding their students (Abidin & Robinson, 2002), and teacher nomination

41
is considered an ideal method for finding the participants most in need for intervention by
single subject researchers (Cooper et al., 2007; Tam et al., 2006). In addition, written
parental permission (see Appendix A) and a signed participant assent form were required
for each participant to take part in the study (see Appendix B).
The participants functioned at ESOL Levels III, IV, or V. Participants functioning
at Levels I and II were not considered for this study because they are not at a proficiency
level in English in which it is appropriate to assess reading ability in English (Krashen &
Terrell, 1983). Miami-Dade County Public Schools (M-DCPS) initially identifies ELLs
by administering a three question Home Language Survey to parents on the day of
registration (see Appendix C). An answer of “yes” on any questions in the survey
indicates that the student is exposed to a language other than English. At this point,
permission is requested to administer the Oral Language Proficiency Scale (OLPS; Dade
County Board of Public Instruction, 1978) or another age appropriate language
assessment. Data from this assessment then yields the school with an ESOL Level
ranging from I-V where I represents highly limited English language proficiency and V
equals fluency in English (M-DCPS, 2005).
Also, the M-DCPS district identified the participants as having SLD.
Preliminarily, participants with SLD in M-DCPS are identified through teacher, parent, or
specialist recommendation. Then, the district's evaluation procedures provide for the use
of valid tests and evaluation materials, administered and interpreted by trained personnel,
in conformance with instructions provided by the producer of the materials. For a student
to meet the eligibility criterion for SLD the following must be documented: (a) general
education strategies must have been tried and found to be ineffective, (b) there must be a
42
disorder in one or more basic psychological processes, (c) there must be a discrepancy of
one standard deviation or more between an intellectual standard score and achievement
standard score, and (d) there must be learning problems that are not due primarily to other
handicapping conditions (Miami-Dade County Public Schools, 2007).
In addition, participants were identified as struggling readers. In this study,
struggling readers were defined as reading at least 1 year below grade level in English
(Nelson et al., 2004), based on grade level assessments given at the beginning and
midpoint of the school year by the classroom teacher. At the target school, these
assessments were the Diagnostic Reading Assessments (Roswell, Chall, Curtis, &
Kearns, 2005), the Dynamic Indicators of Basic Early Literacy Skills (Good & Kaminski,
2002), and the Woodcock-Johnson III Diagnostic Reading Battery (Woodcock, Mather,
Schrank, 2001). In addition, the Analytical Reading Inventory (ARI; Woods & Moe,
2006), an informal assessment, was given by the researcher prior to the start of the study
to confirm that the participant’s reading level was at least 1 year below their grade level.
The ARI also determined the participants’ instructional reading level. A description of
each participant and a summary table of characteristics in Table 1 (page 43) follows.
Participant 1
Tano (pseudonym) was a 10-year-old Hispanic boy, who had been retained in the
third grade because he had not passed the Florida Comprehensive Assessment Test
(FCAT). He functioned at ESOL level III and he reported speaking Spanish at home. He
met criteria for an Individualized Education Plan (IEP) because of a specific learning
disability and his ARI results indicated that his instructional reading level was second
grade. Tano accessed the curriculum in a general-education classroom with no pull out

43
services. His class was consisted of 12 retained third graders, eight of whom were on
IEPs for varying exceptionalities. Two certified teachers, one general elementary
education and the other special education, taught the class. During the course of the
study, the class received periodic group instruction from an intern who was completing
her associate teaching credits for a nearby university.
Table 1
Demographic and Analytical Reading Inventory Data
Participant* Gender Age Grade Ethnicity ESOL
Level Disability
ARI
Instructional
Reading
Level
Tano M 10 3** Hispanic III SLD 2
Luci F 11 4 Hispanic IV SLD 2
Sandra F 10 3** Hispanic III SLD 1
Gema F 11 5 Hispanic III SLD 1
Note. *All participant names are pseudonyms.
**Indicates a participant who is repeating the grade because of failure to pass the Florida Comprehensive Assessment Test
(FCAT).
Participant 2
Luci (pseudonym) was an 11-year-old Hispanic girl in the fourth grade. She
functioned at ESOL level IV and reported speaking Spanish at home. She met criteria for
an Individualized Education Plan (IEP) due to an SLD, and her ARI results indicated her
instructional reading level was second grade. Luci accessed the curriculum in a general
education class with no pull out services. Her class consisted of 10 general education
students and 13 exceptional education students who were on IEPs for varying

44
exceptionalities. Two certified teachers, one general elementary education and the other
special education, taught the class.
Participant 3
Sandra (pseudonym) was a 10-year-old Hispanic girl, who had been retained in
the third grade because she did not pass the Florida Comprehensive Assessment Test
(FCAT). She functioned at ESOL level III and reported speaking Spanish at home. She
met criteria for an Individualized Education Plan (IEP) due to a SLD and her ARI results
indicated that her instructional reading level was first grade. Sandra accessed the
curriculum in a general-education classroom along with pull out services. She was
educated in a resource room for reading instruction for 1 hours daily. Her class was
made up of 12 retained third graders, eight of whom were on IEPs for varying
exceptionalities. Two certified teachers, one general elementary education and the other
special education, taught the class. During the course of the study, the class also received
periodic group instruction from an intern.
Participant 4
Gema (pseudonym) was an 11-year-old Hispanic girl in the fifth grade. She
functioned at ESOL level III and reported speaking Spanish at home. She met criteria for
an Individualized Education Plan (IEP) due to a SLD and her ARI results indicated that
her instructional reading level was first grade. Gema accessed the curriculum in a general
education classroom with no pull out services. Her class consisted of 12 general
education students and 12 exceptional education students were on IEPs for varying
exceptionalities. The students rotated as a group between four certified general education
teachers who each taught a specific subject area. Additionally, a certified special

45
education teacher rotated with the students in order to offer assistance. Gema participated
in the study during her homeroom class, as her teachers and parents expressed concern
that she would miss instruction in her subject area classes.
Setting
This study took place at an urban public elementary school in the M-DCPS
district. Currently, 38.5%, of the school’s 1,036 students are identified as ELLs (M-
DCPS, 2006). The researcher conducted all one-to-one experimental sessions in a quiet
room in the media center with no one else in the room and with desks that allowed the
researcher and participant to sit next to each other. The participants were pulled out of
their general education classroom for approximately 10 to 20 minutes in order to
participate in the study. The experimental sessions occurred in the morning (9 to 11 AM)
and afternoon (1 to 3 PM). Each student attended one session daily (5 days a week) at
approximately the same time each day for approximately 12 weeks.
Materials
Following is a description of the study’s materials. The materials list includes
several forms (consent, assent, treatment fidelity, IOA, data collection), an informal
reading inventory, a readability graph, reading passages, and literal reading
comprehension questions. Additionally, a digital recording device was used to make
audio recordings of each session including generalization and maintenance testing
sessions.
Parental Consent Form
Parents were provided with a consent form written in both English and Spanish
for their child’s participation in the research study (see Appendix A). The form provided

46
a brief description of the study, information regarding the study’s duration, and the
expectations for parental and student commitments. Researcher and university contact
information were provided on the form.
Participant Assent Form
Students whose parents signed the consent form were read the participant’s assent
to participate in the research study form (see Appendix B). The form provided a brief
description of the study, information regarding the study’s duration, and the expectations
for the researcher and the student. It was written free of jargon and using
developmentally appropriate language for the potential participant. The researcher read
this form to the participant and answered any questions the participant had. Researcher
and university contact information was provided on the form. The participant was given a
copy of the signed form.
Treatment Fidelity Checklist
A treatment fidelity checklist that included the procedures for each phase in the
study was used during each session by the researcher (see Appendix D). The independent
rater verified that the researcher is implemented proper procedure by independently
filling out a treatment fidelity form for 25% of sessions.
Interobserver Agreement (IOA) Forms
Three independent raters completed data collection forms for approximately 25%
of the study’s sessions (see Appendix F). An independent rater completed the IOA form
following the collection of data (see Appendix E). The IOA form was a summary form
that allowed for easy comparison of the data collected on the same session by the

47
researcher and the second observer. The formula used to calculate IOA was printed at the
bottom of the form, allowing IOA for each observation to be calculated.
Data Collection Forms
The data collection forms were used to record participant performance (see
Appendix F) by the researcher and the independent observer. Each form contained a
reading passage of approximately 100 words that was typed in 14-point font and aligned
left. The forms were printed on 8.5” x 11” plain white copy paper with 1” margins on
each side. Below the passages were 2 spaces in which the raters could write the total
correct words read per minute (CWPM) and errors per minute (EPM). Finally, the forms
had the five questions pertaining to the reading passage printed on them with a “yes” or
“no” next to each question to record correct and incorrect answers.
Informal Reading Inventory
The Analytical Reading Inventory (Woods & Moe, 2006) was the informal
reading inventory used in the study. This informal reading assessment examined oral
reading and reading comprehension skills of the participants prior to the start of the
study. The responses were coded for word recognition and categorized as independent
(99-100% accuracy), instructional (91-98% accuracy), or frustration (90% or below). The
comprehension scores were coded as independent (90-100% accuracy), instructional (75-
89% accuracy), or frustration (74% or below). This informal reading inventory was used
to determine the overall instructional reading level of each participant. The passages used
throughout the study were at the instructional reading level of each participant.

48
Fry Readability Graph
The Fry Readability Graph (Fry et al., 1985) was used to verify the grade reading
level of the passages selected from the basal reading series. The graph uses the average
number of sentences (y-axis) and syllables (x-axis) per hundred words. These averages
were plotted and the intersection of the average number of sentences and the average
number of syllables determined the reading level of the passage.
Reading Passages
Approximately 60 passages from the Houghton Mifflin Invitations to Literacy
Series (1998) were chosen for each student at their instructional reading level as indicated
by the ARI score. These passages were randomly assigned to the baseline and
intervention phases. The passage reading levels were verified both by the publisher, as
well as by the readability graph developed by Fry (1985). Passages were retyped to
facilitate the reading of continuous text and to eliminate picture cues (Alber-Morgan et
al., 2007). The passages were approximately 100 words (with a minimum of 100 and a
maximum of 105 words) and were typed using double spacing and 1” margins in 14-point
Times New Roman font on 8.5” x 11” plain white copy paper. The passages were aligned
on the left hand side of the page.
Flashcards of Challenging Words
Each passage contained one to five words deemed as challenging by the basal
reading key. These words were printed in 14 point Times New Roman font on 3” x 5”
plain white flashcards for use in vocabulary instruction. The definitions of these words,
taken directly from the basal series glossary, were printed on the back of these flashcards.
Additionally, a sentence using each challenging word was printed on the back of the card.

49
Literal Comprehension Questions
Each passage had five corresponding literal comprehension questions that
required the student to recall items that were explicitly mentioned in the text. These
questions were adapted from the workbooks and teacher’s editions of the basal reading
series. A district reading curriculum and instruction specialist checked each question and
determined that the answer was found in the text. The questions were typed on a paper
that only the researcher could see during the sessions.
Generalization Passages
The researcher created generalization passages prior to the start of the study.
These passages had approximately 80% of the same words as the reading passages. The
readability of these passages was verified by the Fry Readability Graph (Fry et al., 1985)
to ensure that they were at the appropriate instructional reading level. The passages were
approximately 100 words (with a minimum of 100 and a maximum of 105 words) and
were typed using double spacing and 1” margins in 14 point Times New Roman font on
8.5” x 11” plain white copy paper. The passages were aligned on the left hand side of the
page. Five literal comprehension questions were written for these generalization
passages. A reading curriculum and instruction specialist from the school district verified
that the questions are of the same difficulty level as the questions used in the intervention
passages.
Digital Recording Device
An Olympus digital recorder with a built in timer was used to make a permanent
product of each session. Both the researcher and the independent raters analyzed the
recorded sessions. The recorder had a computer compatible cable that allowed audio files

50
to be archived in the researcher’s computer and sent to the independent raters as e-mail
attachments. This allowed the researcher to score the reading assessments as well as to
have a record that the independent raters used to ensure IOA and treatment fidelity.
Dependent Variables
Each session in this study was recorded and transferred to a digital file. This
allowed for precise measurement of the dependent variables. The dependent variables
were as follows: (a) reading fluency as measured by the number of correct words read
aloud per minute, (b) the number and types of errors read aloud per minute of reading, (c)
number of literal comprehension questions answered correctly aloud, (d) generalization
of gains made to unfamiliar passages, and (e) maintenance of performance after 2-, 4-,
and 6-weeks.
Reading Fluency as Measured by Correct Words per Minute (CWPM)
Reading fluency was defined as the number of words read correctly aloud per
minute of reading. Participant self corrections were scored as correct. A word was
counted as correct if the participant independently pronounced it correctly aloud without
prompting within 3 seconds (Nelson et al., 2004).
Number and Types of Errors per Minute (EPM)
This is the total number of errors read aloud during a 1-minute recording (Tam et
al., 2006). Data on the following error types were collected:
Omission. Defined as a printed word in the passage that was not read aloud by the
participant.
Addition. Defined as a word that was read aloud by the participant but was not
printed in the passage.

51
Mispronunciation. Defined as a printed word that was read aloud incorrectly. For
example if the text said “he knows many Latin words” but the participant read aloud, “He
knows many Lateen words” (Dictionary.com, 2008).
Substitution. Defined as a word that was read aloud different than the printed
word. For example, the text read, “He saw the park.” The participant read, “He saw the
pumpkin.”
Hesitation. Defined as a delay in reading aloud of more than 3 seconds from the
end of one word read aloud to the beginning of the next word read aloud. The researcher
timed the seconds by counting silently. Once the 3 seconds had passed, the researcher
read the word correctly so that the participant could read on.
Literal Comprehension Question Assessment
After completing the passage readings, five literal comprehension questions were
asked by the researcher. The participant had 5 seconds to answer the question. Participant
responses were compared with the answer key provided by the basal reader for that
reading passage. Correct responses were those that match the answer key and that were
stated aloud within 5 seconds after the end of the question. Responses that did not match
the answer key or those begun more than 5 seconds after the end of the question were
scored as incorrect. The total number of correct responses were recorded and graphed.
Generalization
Immediately following approximately 25% of the sessions throughout the study,
generalization probes were taken to test generalization of skills to untaught passages that
were similar to those being used in experimental sessions. Generalization passages were
approximately 100 words (with a minimum of 100 words and a maximum of 105 words)

52
in length and were of the same level as those being used in experimental sessions
according to the Fry Readability Graph (Fry et al., 1985). Additionally, approximately
80% of the words in the generalization passage came directly from the passage that was
used in the experimental session. Generalization probes included a single reading of the
passage without error correction feedback from the researcher. Generalization probes also
included data collection in the form of a fluency assessment and a literal comprehension
question assessment as defined previously.
Maintenance
Maintenance was defined as performance on passage assessments given 2-, 4-,
and 6-weeks after the study concluded. Maintenance probes included a single reading of a
passage without error correction feedback from the researcher. Maintenance probes also
included data collection in the form of a fluency assessment and a literal comprehension
question assessment as defined previously. Passages used during the experimental session
were used during maintenance allowing for a direct comparison of the experimental and
maintenance sessions. Maintenance passages were randomly selected from the passages
used during the first two-thirds of the experimental sessions. This way, the passage
selected was not the most recently taught.
Interobserver Agreement
Two independent raters were trained to listen to the recordings and count the
number of correct words read aloud per minute (CWPM), the number of errors read aloud
per minute (EPM), and the types of errors read aloud per minute. These raters also
listened to the responses to the comprehension questions and scored them as correct or

53
incorrect in accordance with the basal key. The raters were undergraduate students
enrolled in an elementary education program at Florida International University.
Training of the independent raters was provided by the researcher and lasted
approximately 1 hour. The training session consisted of an oral discussion and a written
handout of the procedures for scoring the audio recordings (see Appendix E). Following
this the raters and the researcher independently scored two audio samples that had been
previously scored by an expert in the field (a district reading curriculum and instruction
specialist). The researcher and the raters then compared their scores with the expert and
with each other. Both reviewed the criterion and practiced scoring samples until at least
90% agreement on the sample was reached with the expert. At that point, the independent
raters were considered adequately trained.
Throughout the study, independent raters scored approximately 25% of randomly
selected audio recordings. Interobserver agreement (IOA) data were taken in the baseline,
intervention, generalization and maintenance conditions. Agreements and disagreements
were counted using a word-by-word examination of the data sheets. IOA was calculated
by dividing the number of agreements by the number of agreements plus disagreements
and then multiplying by 100. A minimum mean IOA of 90% was calculated for each
individual participant. IOA did not fall below 90%, making retraining of the researcher
and observers unnecessary.
Treatment Fidelity
The researcher gathered a treatment fidelity measure daily during each session.
Treatment fidelity refers to the extent to which the treatment, or intervention, is carried
out according to what is written in the methods section of the study in question (Cooper

54
et al., 2007). Monitoring treatment fidelity allowed for a record of the researcher’s
consistency. It served as a routine review of the procedures as well as a way to determine
problems in implementation before they became habitual. This measure was taken by
using a checklist to record the daily occurrence and nonoccurrence of the planned
procedures.
The same individuals trained for IOA were trained to collect treatment fidelity
data to help ensure accuracy of the procedural implementation as designed. Training was
provided in a 1-hour session. During the training session, the rater was given a treatment
fidelity checklist (see Appendix D) and asked to listen to an audio recording of the
researcher executing the steps with a student. The rater’s checklist was then compared to
the researcher’s checklist for that session in order to insure that the researcher was
accurately self-assessing her implementation of the written procedure. This procedure
was repeated until the observer and the researcher were in agreement for every step on
the checklist. At this point, the observers were considered properly trained.
After the training session, the observer listened to approximately 25% of
randomly selected sessions. The observer independently scored the occurrence and
nonoccurrence of the planned procedures. The total percentage of occurrence and
nonoccurrence of the planned procedures was recorded. Data were collected during the
baseline, generalization, and intervention conditions. The treatment fidelity forms
completed by the researcher and the independent raters was analyzed for the percentage
of adherence to the planned procedure and reported in the discussion section of this
study.

55
Experimental Design
A multiple probe baseline design across subjects was used to examine the effects of
repeated readings on the number of words read aloud correctly per minute, the numbers
and types of errors read aloud per minute, and the generalization and maintenance of
performance by ELLs with SLD. In this design, once steady state responding is reached
under baseline probes, the intervention is applied to one participant while the other
participants remain in baseline. When steady state is reached in intervention for the first
participant, the same intervention is applied to next participant and so on. In contrast to a
multiple baseline design, in which baseline data are collected throughout the baseline
condition, in a multiple probe baseline design, probes (or periodic measures) are taken
until a few days prior to implementation of the intervention at which time continuous
measures are taken. The probes provide the basis for prediction and determining whether
behavior change has occurred prior to intervention.
The multiple probe baseline design across subjects was used in order to limit the
potential practice effects. Practice effects occur when there is improvement due to the
increased opportunities to emit the target behavior (Cooper et al., 2007), creating an
unwanted confound. In this study, at least four data points were collected during baseline
before the implementation of the intervention. These points demonstrated that the
behavior was unlikely to change without the introduction of the intervention.
In a multiple probe baseline design, data analysis is accomplished through the
visual inspection of graphed data in which performance during the intervention is
compared to performance during baseline. Predictions based on one participant’s
behavior are verified by the performance of the other participants, and replication of

56
effect is dependent on the performance of other participants. Verification is evident if the
data path changes in a predictable manner through a condition change, as from baseline
to intervention for each participant. Replication of this prediction and verification may
occur when the data paths of the other participants follow patterns similar to the first
participant.
A functional relation is identified when baseline behaviors are stable and change
only when the intervention is applied. Convincing relations are demonstrated by clear
differences in responding with a minimal overlap of data paths across conditions.
Experimental control is demonstrated by replicating the effects with another participant
(Cooper et al., 2007).
General Procedures
The following describes the procedures used in this study. The pre-study
procedures section describes the steps taken prior to the start of the study including the
selection of the participants, obtaining parent consent, obtaining participant assent, an
informal assessment of reading and comprehension skills, and second observer selection
and training.
This is followed by a description of how the reading materials were prepared prior
to the start of the sessions. The general study procedures section includes the procedures
that were used both in the baseline and intervention conditions. The generalization and
maintenance sections describe how measures were taken to examine the effects of this
study.

57
Pre-Study Procedures
The pre-study procedures were the steps implemented prior to the beginning of
data collection on the dependent variables. These procedures were as follows:
Selection of participants. The researcher obtained permission from the district and
the principal to visit the school and schedule a meeting for the general education, special
education, and ESOL teachers that work with ELLs at levels III, IV, and V. At this
meeting, the researcher described the study and the criterion for nominating students as
participants. The teachers were asked to nominate ELLs identified as having SLD who
were reading at least one year below grade level in English. The teachers were told that
their nominations must be based on their experiences with the participants and the
participants’ performance in reading tasks in their classes. The researcher scheduled a
time later that week with the teachers and collected 10 names and respective grade levels
of prospective participants.
Parent consent. A consent form in English and Spanish was sent home with the
10 nominated, potential participants. The parents were given 3 days to sign and return the
form or contact the researcher with questions. Parents who declined were removed from
the list of potential participants. Follow up calls were made after 3 days to the parents
who had not responded and to the parents who agreed to allow their child to participate.
Parents who had not responded were called in order to discuss their child’s potential
participation and answer any questions they may have. Parents who had returned the form
giving permission to participate were called in order to discuss the study and to answer
any questions they may have. The researcher, who is bilingual, called both English and
Spanish speaking parents.
58
Participant assent. A form similar to the parent consent was read to the potential
student participants. This occurred during a one-on-one meeting with the researcher. This
form was written in language that was developmentally appropriate for the potential
participants and it discussed the study and the roles of the researcher and participants.
The researcher answered any participant questions. The potential participants were asked
to sign the form assenting to participate in the study and were given a copy of the signed
form.
Informal assessment of reading and comprehension skills. One week prior to
starting the study, the Analytical Reading Inventory (Woods & Moe, 2006) was
individually administered to each participant. Participants read aloud grade level passages
and answered questions while the researcher recorded errors. The oral reading responses
were then coded and categorized as independent (99-100% accuracy), instructional (91-
98% accuracy), or frustration (90% or below). The comprehension scores were coded as
independent (90-100% accuracy), instructional (75-89% accuracy), or frustration (74% or
below). The overall instructional reading scores, which took into consideration the oral
reading and comprehension scores, were used to determine the level of the reading
passages that were used with that participant throughout the study.
Second observer selection and training. Three independent observers were
recruited from an undergraduate elementary education course at Florida International
University. To do this, the researcher requested permission to attend the undergraduate
class and give a brief presentation summarizing the duties of the second observer. A page
with lines for names, e-mail addresses, and telephone numbers of interested candidates
was circulated. The researcher collected the circulated list. The researcher then called and

59
interviewed the interested individuals. This telephone interview helped the researcher
determine if the individual had enough time and dedication to the study. From this effort,
two individuals were selected for training and participation as second observers and two
individuals were selected as alternates.
Reading material preparation. The reading passages were chosen from the
Houghton Mifflin Invitations to Literacy Series (1998) to which there had been no prior
participant exposure. Additionally, they did not have any exposure to this basal during
the course of the study. The researcher chose approximately 60 passages for each student
at his or her independent reading level as indicated by the ARI score. The reading levels
of the materials were verified both by the publisher’s provided key, as well as by the
readability graph developed by Fry (1985).
The researcher retyped the basal reader passages in 14-point Times New Roman
font using double spacing. The passages were approximately 100 words (with a minimum
of 100 words and a maximum of 105 words) and were printed on 8.5” x 11” plain white
copy paper with 1” margins on all four sides and a left alignment. The passages were
randomly assigned to baseline or intervention conditions.
Then, the researcher developed and typed the generalization passages. The Fry
Readability Graph (Fry et al., 1985) was used to ensure that the readability level was the
same as the passages used in the baseline and intervention phases, as well as to ensure
that at lease 80% of the words in the generalization passages were also found in the
baseline and intervention phase passages. The generalization passages each had five
corresponding literal comprehension questions that were written by the researcher and
verified by the district reading curriculum and instruction specialist to ensure that they

60
were of the same level of difficulty as those used during the baseline and experimental
sessions. Maintenance passages were taken randomly from passages used during the
intervention phase.
The room where the sessions took place was prepared prior to the participant’s
arrival. A blank file folder with the passage for the day was waiting at the desk where the
participant was to sit. The researcher also had a blank file with the treatment fidelity
form, the passage of the day, the flashcards of the challenging words, and the
corresponding literal comprehension questions.
Multiple Probe Baseline Condition
In the multiple probe baseline condition, the researcher led each participant in an
introduction to the passage of the day in the form of vocabulary instruction. The
researcher used flashcards to determine if the participant knew the meaning of the
challenging words in the upcoming reading. These words were selected by the basal
reading series, which deems certain words in the passages as challenging. The researcher
taught the words not known to the student. The teaching consisted of the researcher
asking the participant to read the word aloud. If the participant could not do this, the
researcher stated the word and asked the participant to repeat it aloud and use the word in
a sentence. If the participant used the word correctly, the researcher praised the
participant and moved on to the next word. If the participant could not use the word in a
sentence, the researcher read the definition from the back of the card and then asked the
participant to use the word in a sentence aloud. If the participant still could not do this,
the researcher used the word in a sentence that demonstrated its meaning. This lasted
approximately 1 to 3 minutes depending on the number of words the student knew.

61
Next, the participant was asked to read the passage. During this reading, a whole
word error correction strategy was employed (Barbetta et al., 1993). With whole word
error correction, when a participant made a reading error, the researcher immediately read
the word correctly. Following that, the participant repeated the word aloud. After the
repetition of the word, the participant repeated the entire sentence containing that word
aloud. Once the passage was read aloud in its entirety, the words that were initially stated
incorrectly were repeated aloud by the participant again in isolation. The participant then
was asked to read the passage aloud from the beginning for a 1-minute fluency
assessment, which assessed CWPM, EPM, and type of EPM.
After the fluency reading assessment, a literal comprehension question assessment
occurred. This consisted of five literal comprehension questions asked orally by the
researcher. The researcher asked the five questions aloud, one question at a time. The
participant was given 5 seconds to respond to each question aloud. If the participant
responded with the correct answer, the researcher made a short positive statement (such
as “yes” or “correct”). If the participant responded incorrectly, the researcher provided
error correction (e.g., “No, the cow jumped over the moon, not the fence.”). Following
the final question and student response the researcher issued a statement of gratitude
(e.g., “thank you for working hard today”), indicating the end of the session.
Repeated Readings Intervention Condition
The repeated readings intervention condition was identical to the multiple probe
baseline condition for the initial reading. In addition, each session contained repeated
readings (two additional readings) of the passage for a total of three readings. Following
the initial reading of the passage, the researcher asked the participant to read the passage

62
aloud two more times from the beginning. The two additional passage readings did not
include the error correction procedures explained in baseline. Instead, when an error was
emitted, the researcher said the correct word, but did not prompt the student to repeat the
word or the sentence containing the word (Alber-Morgan et al., 2007; Nelson et al., 2004;
Tam et al., 2006). The fluency assessment and literal comprehension question assessment
followed using the same procedure as described in baseline.
Generalization
Generalization probes were administered immediately following approximately
25% of the baseline and intervention sessions. A new passage, at the same readability
level and with 80% of the same words as that day’s session passage were prepared. The
generalization session consisted of the student reading the passage aloud once. This
reading did not include the error correction procedures explained in baseline. Following
the single reading of the passage, the fluency and literal comprehension question
assessments occurred as they did in the other phases.
Maintenance
Maintenance data were collected 2-, 4-, and 6-weeks after the last repeated
readings intervention session. Passages used during the first two-thirds of the repeated
readings intervention sessions were randomly selected for use during maintenance.
Similar to the generalization probes, the participant read the passage once aloud during
maintenance sessions. This reading did not include the error correction procedures
explained in baseline. Following the single reading of the passage, the fluency and literal
comprehension question assessments occurred as they did in the other phases.

63
Summary
This study examined the effects of repeated readings on reading fluency, reading
errors, and responses to literal comprehension questions of third-, fourth-, and fifth-grade
ELLs with SLD who are struggling readers (defined as reading at a level at least one year
below grade level in English). The research questions focused on whether or not the
repeated readings intervention had an effect on the number of CWPM, the number and
types of EPM, and the maintenance and generalization of skills attained during
intervention.
The participants, nominated by their teachers, were four ELLs with SLD who are
struggling readers enrolled at, a large, urban, public elementary school. The dependent
variables were reading fluency as measured by the number of correct words read aloud
per minute and the number and types of errors read aloud per minute. Additionally,
examined was the number of correct answers to literal comprehension questions. The
study also collected data on the generalization and maintenance of the repeated reading
intervention on the dependent variables. IOA and treatment fidelity data were collected.
A single subject, multiple probe baseline design across subjects was used in this
investigation. This design was appropriate because it allowed for baseline collection of
data without too many baseline sessions in an effort to limit practice effects. In this
multiple probe baseline design, steady state responding was reached in continuous
baseline before applying the intervention to the first participant. The remaining
participants were administered intermittent baseline probes until steady state responding
was reached with the first participant in intervention. Prior to intervention on subsequent
participants, a minimum of four days of continuous baseline data were collected. The

64
intervention was then applied to the next participant and so on. Data analysis was done
through visual examination of data graphs and verification occurred when data paths
changed predictably when each participant received the intervention. A functional
relation occurred when baseline behaviors changed only when the intervention was
applied.
Pre-study procedures began with obtaining written permission from the school
district and the school principal and meeting the teachers at the elementary school. The
teachers recommended 10 potential participants. From these recommendations the
researcher selected the students who met the criteria of being ELLs at Levels III, IV, or
V, identified as having SLD and struggling with reading. These students received forms,
followed by telephone calls to obtain parental permission. After parental permission was
obtained and verified, the potential participants and the researcher read and discussed the
participant assent form. Following this, an informal reading assessment was conducted on
each participant. The second observers were selected and trained. The reading materials
were also be prepared, organized, and randomly assigned to either baseline or
intervention conditions prior to the start of the study.
The researcher conducted the study in a quiet room in the school’s media center.
Sessions were conducted one-on-one during 10 to 20 minute scheduled sessions. During
the multiple probe baseline condition the participants received vocabulary instruction and
then they read aloud a passage while receiving corrective feedback. Immediately after
this, fluency and literal comprehension question assessments were given. The repeated
readings intervention condition included the same vocabulary instruction, and initial
passage reading with error correction feedback. Following this, the participants

65
repeatedly read aloud the same passage two additional times without error correction
feedback. Immediately after this, a fluency assessment and literal comprehension
question assessment were given.
Generalization probes were taken immediately following approximately 25% of
the sessions using passages during intervention. Generalization probes consisted of the
participant reading aloud the passage once without error feedback from the researcher.
Next, the participant read aloud for a 1-minute fluency assessment, and answered a five
question literal comprehension assessment. Maintenance probes were done on previously
read passages and followed the same procedures as the generalization probes.
Maintenance data were collected at 2-, 4-, and 6-weeks after the end of the study. All data
were graphed to facilitate visual examination.

66
CHAPTER IV
RESULTS
This chapter presents the findings of a study that used a multiple probe baseline
design across subjects to examine the effects of repeated readings on reading fluency,
reading errors, and reading comprehension of English language learners (ELLs) with
specific learning disabilities (SLD). The study sought to answer the research questions by
measuring the number of correct words read aloud per minute (wpm), the number of
errors read aloud per minute (epm), the types of errors read aloud per minute, and the
number of literal comprehension questions answered correctly. Additionally, this study
examined if the participants generalized any observed gains to new passages with similar
words and maintained any observed gains over a period of 2-, 4-, and 6-weeks following
the final intervention session.
Treatment fidelity and interobserver agreement (IOA) data are presented first.
These data are followed by the results on the each participant’s performance and group
means on the dependent variables. This chapter concludes with a summary of the results.
Treatment Fidelity
The researcher and two trained independent observers collected treatment fidelity
data to help ensure that procedures were followed as designed. The researcher collected
procedural data in every session (100%) across all participants and conditions. The
researcher data indicated that procedures were followed an average of 99.87% of the time
(range 92.59-100) throughout all of the sessions. The independent observers collected
treatment fidelity data on 51 of 204 or 25% of the sessions across all participants and all

67
conditions. The independent observers data indicated that procedures were followed an
average of 99.78% of the time (range 92.59-100).
Interobserver Agreement
Two trained observers collected interobserver agreement data for 25% of all
sessions across all dependent variables. The mean interobserver agreement for fluency
was 98.39% (range 91.42-100). The mean interobserver agreement for number of errors
per minute was 94.87% (range 66.67-100). The mean interobserver agreement for types
of errors per minute was 90.31% (range 50-100). The mean interobserver agreement for
literal comprehension questions answered correctly was 98.97% (range 80-100).
Reading Fluency
This study was conducted, in part, to examine the effects of repeated readings on
the oral reading fluency of ELLs with SLD. Oral reading fluency was measured by
counting the number of words read aloud correctly per minute during a fluency
assessment at the end of each session. Data on reading fluency are presented in the form
of individual daily words per minute performance and individual words per minute means
and ranges.
Generalization scores for fluency are presented in the form of words per minute
means and ranges. The results from the generalization probes are then compared to the
performance means and ranges of the preceding regular sessions. These regular sessions
are referred to as the comparison score. Maintenance probes were administered 2-, 4-,
and 6-weeks following the last intervention session across all conditions and participants.
The probes consisted of a single reading of a passage followed by a fluency and

68
comprehension assessment. The results from the maintenance probes are then compared
to the performance in the last intervention session.
Tano
Figure 1 (page 69) displays Tano’s performance in reading fluency during
baseline, repeated readings, generalization probes, and maintenance probes. During
baseline, Tano’s mean reading fluency was 68.62 wpm (range 57–76). When repeated
readings was introduced, Tano’s mean reading fluency increased to 85.83 wpm (range
54–97). Tano’s reading fluency was highest during the repeated readings intervention,
with a mean increase of 17.21 wpm over baseline (see Table 2, page 70).
Generalization probes were completed following 26.5% of Tano’s sessions (see
Table 3, page 71). During baseline, Tano’s mean reading fluency comparison score was
62.5 wpm (range 57-68). His mean reading fluency score for baseline generalization was
72 wpm (range 70-74). In baseline, his mean generalization score was 9.5 wpm higher
than his comparison probe score.
During intervention, Tano’s mean reading fluency comparison score was 87 wpm
(range 78-96). His mean reading fluency scores for intervention generalization was 81.4
wpm (range 73-88). In intervention, his mean generalization score was 5.6 wpm lower
than his comparison probe score.
During generalization maintenance, Tano’s reading fluency comparison score was
76 wpm. His reading fluency score for maintenance generalization was 84 wpm. In
maintenance, his generalization score was 8 wpm higher than his comparison probe
score.
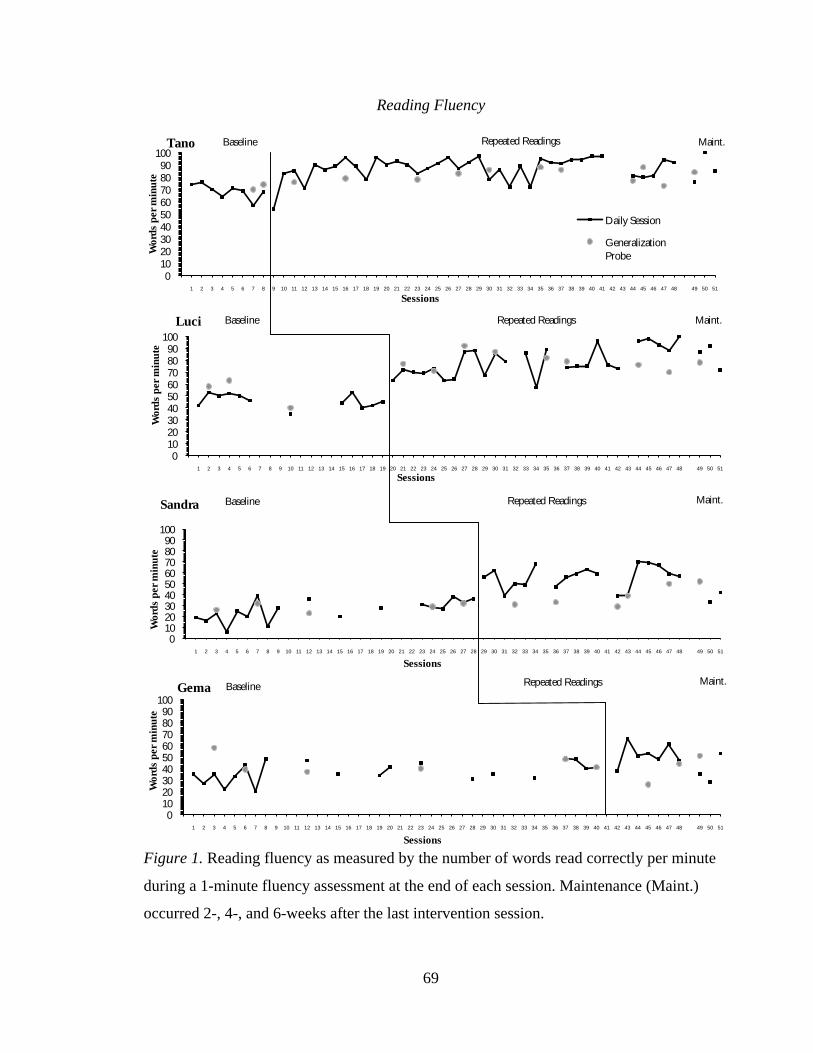
69
Reading Fluency
Sandra
Figure 1. Reading fluency as measured by the number of words read correctly per minute
during a 1-minute fluency assessment at the end of each session. Maintenance (Maint.)
occurred 2-, 4-, and 6-weeks after the last intervention session.
0
10
20
30
40
50
60
70
80
90
100
1 2 3 4 5 6 7 8 9 10 11 12 13 14 15 16 17 18 19 20 21 22 23 24 25 26 27 28 29 30 31 32 33 34 35 36 37 38 39 40 41 42 43 44 45 46 47 48 49 50 51
Wor
ds
per
min
ute
Sessions
Tano
Daily Session
Generalization
Probe
0 10 20 30 40 50 60 70 80 90
100
1 2 3 4 5 6 7 8 9 10 11 12 13 14 15 16 17 18 19 20 21 22 23 24 25 26 27 28 29 30 31 32 33 34 35 36 37 38 39 40 41 42 43 44 45 46 47 48 49 50 51
Wor
ds
per
min
ute
Sessions
Luci
0 10 20 30 40 50 60 70 80 90
100
1 2 3 4 5 6 7 8 9 10 11 12 13 14 15 16 17 18 19 20 21 22 23 24 25 26 27 28 29 30 31 32 33 34 35 36 37 38 39 40 41 42 43 44 45 46 47 48 49 50 51
Wor
ds
per
min
ute
Sessions
0 10 20 30 40 50 60 70 80 90
100
1 2 3 4 5 6 7 8 9 10 11 12 13 14 15 16 17 18 19 20 21 22 23 24 25 26 27 28 29 30 31 32 33 34 35 36 37 38 39 40 41 42 43 44 45 46 47 48 49 50 51
Wor
ds
per
min
ute
Sessions
Gema
Maint. Baseline Repeated Readings
Maint. Baseline
Maint. Baseline Repeated Readings
Repeated Readings
Maint. Baseline Repeated Readings

70
Table 2
Individual Means on Reading Fluency
Participant Baseline Repeated Readings
68.62 85.83 Tano
(57-76) (54-97)
46.09 76.57 Luci
(35-53) (57-100)
25.77
53.85
Sandra
(6-39) (39-70)
37.05
52.0
Gema
(20-49) (38-66)
39.46 75.7 Group
(6-76) (38-100)
Note. Top numbers indicate individual mean of words read per minute. The bottom rows of numbers represent the range of scores.
In comparing baseline, intervention, and maintenance reading fluency
generalization scores, Tano read an average of 9.4 wpm more during intervention
generalization probes than baseline generalization probes. Tano’s reading fluency was
highest on his maintenance generalization probe with 84 wpm.
Table 4 (page 72) displays Tano’s maintenance performance. Tano’s fluency
score on his last day of intervention was 92 wpm. He had maintenance scores of 76, 100,
and 85 wpm respectively. Overall, Tano maintained between 82.61% (week 2 probe) and
108.7% (week 4 probe) of his reading fluency. Tano performed highest on his week 4
maintenance probe.

71
Table 3
Mean Reading Fluency in Comparison Sessions and Generalization Probes
Words Per Minute Participant
Baseline Repeated Readings Maintenance
Comparison
Scores
62.5
(57-68)
87
(78-96)
76 Tano
Generalization
Probes
72
(70-74)
81.4
(73-88)
84
Comparison
Scores
46.67
(35-53)
83.13
(72-96)
87 Luci
Generalization
Probes
53.67
(40-63)
79.25
(70-92)
78
Comparison
Scores
31.8
(23-39)
46.8
(39-59)
53 Sandra
Generalization
Probes
28.4
(26-32)
36.4
(29-50)
52
Comparison
Scores
43.33
(35-49)
50
(47-53)
35 Gema
Generalization
Probes
43.83
(39-58)
35
(26-44)
51
Comparison
Scores
39.76
(23-68)
75.7
(39-96)
62.75
(35-87)
Group
Means
Generalization
Probes
44.38
(26-74)
68
(26-92)
66.25
(51-84)
Note. Comparison scores are taken from that day’s regular session. Generalization probes immediately followed the regular session.
Top numbers indicate mean number of words read per minute. The bottom rows of numbers represent the ranges of scores.
Luci
Figure 1 (page 69) displays Luci’s performance in reading fluency during
baseline, repeated readings, generalization probes, and maintenance probes. During
baseline, Luci’s mean reading fluency was 46.09 wpm (range 35-53). When repeated
readings was introduced, Luci’s mean reading fluency increased to 76.57 wpm (range of

72
57-100). Luci’s reading fluency was highest during the repeated readings intervention,
with a mean increase of 30.48 wpm over baseline (see Table 2, page 70).
Table 4
Maintenance on Reading Fluency
Participant
Last Intervention
Score
Week 2
Probe
Week 4
Probe
Week 6
Probe
Tano 92 76 100 85
82.61% 108.7% 92.39%
Luci 100 87 92 72
87% 92% 72%
Sandra 57 53 33 42
92.98% 57.89% 73.68%
Gema 47 35 28 53
74.47% 59.57% 112.77%
Group Means
74
62.75
63.25
63
84.8% 85.47% 85.14%
Note. Top numbers indicate individual number of words read per minute on the last day of treatment and on 2-, 4- and 6-week
maintenance probes. The bottom row percentages indicate the percentage of reading fluency maintained on 2-, 4- and 6-week
maintenance probes.
Generalization probes were completed following 29.26% of Luci’s sessions (see
Table 3, page 71). During baseline, Luci’s mean reading fluency comparison score was
46.67 wpm (range 35-53). Her mean reading fluency score for baseline generalization
was 53.67 wpm (range 40-63). In baseline, her mean generalization score was 7 wpm
higher than her comparison probe score.
During intervention, Luci’s mean reading fluency comparison score was 83.13
wpm (range 72-96). Her mean reading fluency scores for intervention generalization was

73
79.25 wpm (range 70-92). In intervention, her mean generalization score was 3.88 wpm
lower than her comparison probe score.
During maintenance, Luci’s reading fluency comparison score 87 wpm. Her
reading fluency score for maintenance generalization was 78 wpm. In maintenance, her
generalization score was 9 wpm lower than her comparison probe score.
In comparing baseline, intervention and maintenance reading fluency
generalization scores, Luci read an average of 25.58 wpm more wpm during intervention
generalization probes than baseline generalization probes. Luci’s mean generalization
reading fluency was highest during intervention generalization probes with 79.25 wpm.
Table 4 (page 72) displays Luci’s maintenance performance. Luci’s fluency score
on her last day of intervention was 100 wpm. She had maintenance scores of 87, 92, and
72 wpm respectively. Overall, Luci maintained between 72% (week 6 probe) and 92%
(week 4 probe) of her reading fluency. Luci performed highest on her week 4
maintenance probe.
Sandra
Figure 1 (page 69) displays Sandra’s performance in reading fluency during
baseline, repeated readings, generalization probes and maintenance probes. During
baseline, Sandra’s mean reading fluency was 25.77 wpm (range 6-39). When repeated
readings was introduced, Sandra’s mean reading fluency increased to 53.85 wpm (range
39-70). Sandra’s reading fluency was highest during the repeated readings intervention,
with a mean increase of 28.08 wpm over baseline (see Table 2, page 70).
Generalization probes were completed following 28.21% of Sandra’s sessions
(see Table 2, page 70). During baseline, Sandra’s mean reading fluency comparison score
74
was 31.8 wpm (range 23-39). Her mean reading fluency score for baseline generalization
was 28.4 wpm (range 26-32). In baseline, her mean generalization score was 3.4 wpm
lower than her comparison probe score.
During intervention, Sandra’s mean reading fluency comparison score was 46.8
wpm (range 39-59). Her mean reading fluency scores for intervention generalization was
36.4 wpm (range 29-50). In intervention, her mean generalization score was 10.4 wpm
lower than her comparison probe score.
During maintenance, Sandra’s reading fluency comparison score 53 wpm. Her
reading fluency score for maintenance generalization was 52 wpm. In maintenance, her
generalization score was 1 wpm lower than her comparison probe score.
In comparing baseline, intervention, and maintenance reading fluency
generalization scores, Sandra read an average of 8 more wpm during intervention
generalization probes than baseline generalization probes. Sandra’s reading fluency was
highest on her maintenance generalization probe with 52 wpm.
Table 4 (page 72) displays Sandra’s maintenance performance. Sandra’s fluency
score on her last day of intervention was 57. She had maintenance scores of 53, 33, and
42wpm respectively. Overall, Sandra maintained between 57.89% (week 4 probe) and
92.98% (week 2 probe) of her reading fluency. Sandra performed highest on her week 2
maintenance probe.
Gema
Figure 1 (page 69) displays Gema’s performance in reading fluency during
baseline, repeated readings, generalization probes, and maintenance probes. During
baseline, Gema’s mean reading fluency was 37.05 wpm (range 20-49). When repeated

75
readings was introduced, Gema’s mean reading fluency increased to 52.0 wpm (range 38-
66). Gema’s reading fluency was highest during the repeated readings intervention, with
a mean increase of 14.95 wpm over baseline (see Table 2, page 70).
Generalization probes were completed following 28.57% of Gema’s sessions (see
Table 3, page 71). During baseline, Gema’s mean reading fluency comparison score was
43.33 wpm (range 35-49). Her mean reading fluency score for baseline generalization
was 43.83 wpm (range 39-58). In baseline, her mean generalization score was 0.5 wpm
higher than her comparison probe score.
During intervention, Gema’s mean reading fluency comparison score was 50
wpm (range 47-53). Her mean reading fluency scores for intervention generalization was
35 wpm (range 26-44). In intervention, her mean generalization score was 15 wpm lower
than her comparison probe score.
During maintenance, Gema’s reading fluency comparison score 35 wpm. Her
reading fluency score for maintenance generalization was 51 wpm. In maintenance, her
generalization score was 16 wpm higher than her comparison probe score.
In comparing baseline, intervention, and maintenance reading fluency
generalization scores, Gema read an average of 8.83 fewer wpm during intervention
generalization probes than baseline generalization probes. Sandra’s reading fluency was
highest on her maintenance generalization probe with 51 wpm.
Table 4 (page 72) displays Gema’s maintenance performance. Gema’s fluency
score on her last day of intervention was 47. She had maintenance scores of 35, 28, and
53 wpm respectively. Overall, Gema maintained between 59.57% (week 4 probe) and

76
112.77% (week 6 probe) of her reading fluency. Gema performed highest on her week 6
maintenance probe.
Group Means for Fluency
Table 2 displays group means for fluency during baseline and repeated readings.
During baseline, the mean number of words per minute was 39.46 wpm (range 6-76).
When repeated readings was introduced, the mean number of words per minute increased
to 75.7 (range 38-100). Overall, the mean number of words per minute was highest
during the repeated readings intervention, with 36.11 wpm more than baseline.
Generalization probes were completed following approximately 25% of all of the
sessions across all of the participants (see Table 3, page 71). During baseline, the group’s
mean reading fluency comparison score was 39.76 wpm (range 23-68). Their mean
reading fluency score for baseline generalization was 44.38 wpm (range 26-74). In
baseline, their mean generalization score was 4.62 wpm higher than their comparison
probe score.
During intervention, the group mean reading fluency comparison score was 75.7
wpm (range 39-96). The group mean reading fluency scores for intervention
generalization was 68 wpm (range 26-92). In intervention, the group mean generalization
score was 7.7 wpm lower than the comparison probe score.
During maintenance, the group mean reading fluency comparison score 62.75
wpm. The group mean reading fluency score for maintenance generalization was 66.25
wpm. In maintenance, the group mean generalization score was 3.5 wpm higher than the
comparison probe score.

77
In comparing baseline, intervention, and maintenance reading fluency
generalization scores, the group read a mean of 23.62 wpm more during intervention
generalization probes than baseline generalization probes. The group mean generalization
reading fluency was highest during intervention generalization probes with 68 wpm.
Table 4 (page 72) displays the group maintenance performance. The mean group
score on the last day of intervention was 74 wpm. The group had maintenance mean
scores of 62.75, 63.25, and 63 wpm respectively. Overall, the group maintained between
84.8% (week 2 probe) and 85.47% (week 4 probe) of reading fluency. The group
performed highest on the week 4 maintenance probe.
Number and Types of Errors Per Minute
This study was conducted, in part, to examine the effects of repeated readings on
the number and types of oral reading errors committed by ELLs with SLD. The errors
were counted categorized into five types: omissions, additions, mispronunciations,
substitutions, and hesitations. Data on errors per minute (epm) and type of epm are
presented in the form of individual daily epm committed and individual epm means and
ranges.
Generalization scores for epm are presented in the form of means and ranges. The
results from the generalization probes are then compared to the epm means and ranges of
the preceding regular sessions. These regular sessions are referred to as the comparison
score.
Maintenance scores for epm are presented in the form of epm committed during
each maintenance probe. The results from the maintenance probes are then compared to
epm committed in the last intervention session.

78
Tano
Number of errors per minute. Figure 2 (page 79) displays Tano’s performance in
the number of epm committed during baseline, repeated readings, generalization probes,
and maintenance probes. During baseline, Tano’s mean number of epm was 8.37 epm
(range 4-16). When repeated readings was introduced, Tano’s mean epm decreased to
5.21 epm (range 2-11). Tano’s epm were lowest during the repeated readings
intervention, with a decrease of 3.16 epm from baseline. A summary of individual mean
performance on the number of epm can be found in Table 5 (page 80).
Table 6 (page 82) displays individual mean epm in comparison sessions and in
generalization probes. During baseline the comparison epm score for Tano was 7 epm
(range 7-7). His mean epm score for baseline generalization was 10.5 epm (range 9-12).
In baseline, his mean generalization score was 3.5 epm higher than his comparison probe
score.
During intervention Tano’s mean epm score was 5.7 epm (range 4-8). His mean
epm scores for intervention generalization was 6.4 epm (range 3-11). In intervention, his
mean generalization score was a mean of 0.7 epm higher than his comparison probe
score.
During maintenance, Tano’s epm comparison score was 5 epm. His epm score for
maintenance generalization was 6 epm. In maintenance, his generalization score was 1
epm higher than his comparison probe score.

79
Errors Per Minute
Figure 2. Errors per Minute as measured by the number of words read incorrectly per
minute during a 1-minute fluency assessment at the end of each session. Maintenance
(Maint.) occurred 2-, 4-, and 6-weeks after the last intervention session.
0
5
10
15
20
1 2 3 4 5 6 7 8 9 10 11 12 13 14 15 16 17 18 19 20 21 22 23 24 25 26 27 28 29 30 31 32 33 34 35 36 37 38 39 40 41 42 43 44 45 46 47 48 49 50 51
Err
ors
per
min
ute
Sessions
Tano
Daily Session
Generalization Probe
0
5
10
15
20
1 2 3 4 5 6 7 8 9 10 11 12 13 14 15 16 17 18 19 20 21 22 23 24 25 26 27 28 29 30 31 32 33 34 35 36 37 38 39 40 41 42 43 44 45 46 47 48 49 50 51
Err
ors
per
min
ute
Sessions
Luci
0
5
10
15
20
1 2 3 4 5 6 7 8 9 10 11 12 13 14 15 16 17 18 19 20 21 22 23 24 25 26 27 28 29 30 31 32 33 34 35 36 37 38 39 40 41 42 43 44 45 46 47 48 49 50 51
Err
ors
Per
Min
ute
Sessions
Sandra
0
5
10
15
20
1 2 3 4 5 6 7 8 9 10 11 12 13 14 15 16 17 18 19 20 21 22 23 24 25 26 27 28 29 30 31 32 33 34 35 36 37 38 39 40 41 42 43 44 45 46 47 48 49 50 51
Err
ors
Per
Min
ute
Sessions
Gema
Maint. Repeated Readings
Baseline
Repeated Readings
Repeated Readings
Maint.
Maint. Baseline
Baseline
Maint. Repeated
Readings Baseline

80
Table 5
Individual Means on Number of Errors Per Minute
Participant Baseline Repeated Readings
8.37 5.21 Tano
(4-16) (2-11)
9.54
(7-13)
5.5
(2-10) Luci
9.77
(5-18)
6.27
(3-9) Sandra
8.95
(5-15)
5.29
(1-7) Gema
9.21 5.52 Group
(4-18) (1-11)
Note. Top numbers indicate individual mean of errors per minute at each phase of the intervention. The bottom rows of numbers
represent the range of scores.
In comparing baseline, intervention, and maintenance epm generalization scores,
Tano committed an average of 4.6 fewer epm during intervention generalization probes
than baseline generalization probes. Tano’s epm were lowest on his maintenance
generalization probe with 6 epm.
Table 7 (page 83) displays Tano’s maintenance performance. Maintenance probes
were taken 2-, 4-, and 6-weeks after the last intervention session. Tano’s epm score on his
last day of intervention was 4 epm. He had maintenance scores of 5, 2, and 10 epm
respectively. Overall in maintenance, Tano performed between 2 epm fewer than the last
session (week 4 probe) and 6 epm more than the last session (week 6 probe). Tano
committed the fewest epm on his week 4 maintenance probe (see Figure 3, page 84).

81
Types of errors per minute. Table 8 (page 85) displays Tano’s performance in the
type of epm committed during baseline and repeated readings. His types of epm were as
follows:
Omissions. During baseline Tano committed a mean of 1.14 (range 0-5)
omissions. During intervention Tano committed a mean of 0.65 (range 0-4) omissions.
He committed a mean of 0.49 fewer omissions per minute during intervention than in
baseline.
Additions. During baseline Tano committed a mean of 0.71 (range 0-3) additions.
During intervention Tano committed a mean of 0.24 (range 0-2) additions. He committed
a mean of 0.47 fewer additions per minute during intervention than in baseline.
Substitutions. During baseline Tano committed a mean of 1.71 (range 0-4)
substitutions. During intervention Tano committed a mean of 1.41 (range 0-5)
substitutions. He committed a mean of 0.3 fewer substitutions per minute during
intervention than in baseline.
Mispronunciations. During baseline, Tano’s committed a mean of 5.71 (range 3-
8) mispronunciations. During intervention Tano committed a mean of 3.0 (range 0-6)
mispronunciations. He committed a mean of 2.71 fewer mispronunciations per minute
during intervention than in baseline.
Hesitations. During baseline, Tano’s committed a mean of 0.29 (range 0-1)
hesitations. During intervention Tano committed a mean of 0.14 (range 0-1) hesitations.
He committed a mean of 0.15 fewer hesitations per minute during intervention than in
baseline.

82
Table 6
Mean Errors Per Minute in Comparison Sessions and Generalization Probes
Errors Per Minute Participant
Baseline Repeated Readings Maintenance
Comparison
Scores
7
(7-7)
5.7
(4-8)
5 Tano
Generalization
Probes
10.5
(9-12)
6.4
(3-11)
6
Comparison
Scores
8.67
(7-11)
5.5
(2-10)
6 Luci
Generalization
Probes
7.67
(4-10)
6.25
(4-9)
7
Comparison
Scores
13
(11-15)
6.6
(4-9)
7 Sandra
Generalization
Probes
10.6
(7-14)
7
(6-10)
10
Comparison
Scores
9.17
(5-15)
6.5
(6-7)
2 Gema
Generalization
Probes
9.33
(6-16)
7
(5-9)
5
Group
Means
Comparison
Scores
9.36
(5-15)
5.52
(4-10)
5
(2-7)
Generalization
Probes
9.56
(4-16)
6.52
(3-11)
7
(5-10)
Note. Comparison scores and ranges are above generalization probe scores and ranges for each participant. Top numbers
indicated mean number of errors read per minute. The bottom rows of numbers represent the ranges of scores.

83
Table 7
Maintenance on Errors Per Minute
Participant
Last Intervention
Score
Week 2
Probe
Week 4
Probe
Week 6
Probe
Tano 4 5 2 10
(+1) (-2) (+6)
Luci 6 6 4 3
(0) (-2) (-3)
Sandra 6 7 9 10
(+1) (+3) (+4)
Gema 6 2 6 4
(-4) (0) (-2)
Group 5.5 5 5.25 6.75
(-0.5) (-0.25) (+1.25)
Note. Top numbers indicate individual number of errors per minute on the last day of treatment and on 2-, 4-, and 6-week maintenance
probes. The bottom row of numbers indicate the number of errors per minute more or fewer on 2-, 4- and 6-week maintenance probes
as compared to the last day of intervention.
Table 9 (page 89) displays individual mean types of errors per minute in
comparison sessions and in generalization probes. Tano’s types of errors per minute were
as follows:
Omissions. During baseline the comparison omissions score for Tano was 0.5
(range 0-1). His mean omissions score for baseline generalization was 2.0 (range 1-3). In
baseline, his mean generalization score was 1.5 omissions higher than his comparison
probe score.

84
During intervention Tano’s mean omissions score was 0.4 (range 0-2). His mean
omissions scores for intervention generalization was 0.4 omissions (range 0-2). In
intervention, his mean generalization score was equal to his comparison probe score.
During maintenance, Tano’s omissions comparison score was 0 omissions. His omissions
score for maintenance generalization was 1 omission. In maintenance, his generalization
score was 1 omission higher than his comparison probe score.
Maintenance on Errors Per Minute
Figure 3. Epm on the last intervention session followed by epm in maintenance sessions
2-, 4-, and 6-weeks after the last intervention session.
Additions. During baseline, the comparison additions score for Tano was 0.5
additions (range 0-1). His mean additions score for baseline generalization was 0. In
baseline, his mean generalization score was 0.5 additions lower than his comparison
probe score.
During intervention, Tano’s mean additions score was 0.1 additions (range 0-1).
His mean additions scores for intervention generalization was 0.3 additions (range 0-1).

85
In intervention, his mean generalization score was a mean of 0.2 additions higher than his
comparison probe score.
During maintenance, Tano’s epm comparison score was 1 addition. His additions
score for maintenance generalization was 1 addition. In maintenance, his generalization
score was equal to his comparison probe score.
Table 8
Individual Means for Types of Errors Per Minute

86
Substitutions. During baseline, the comparison substitutions score for Tano was
0.5 substitutions (range 0-1). His mean substitutions score for baseline generalization was
1.5 (range 1-2). In baseline, his mean generalization score was 1 substitution higher than
his comparison probe score.
During intervention, Tano’s mean substitutions score was 2.2 (range 0-6). His
mean substitutions scores for intervention generalization was 1.9 substitutions (range 0-
5). In intervention, his mean generalization score was a mean of 0.3 substitutions higher
than his comparison probe score.
During maintenance, Tano’s substitutions comparison score was 1. His
substitutions score for maintenance generalization was 0 substitutions. In maintenance,
his generalization score was 1 substitution lower than his comparison probe score.
Mispronunciations. During baseline the comparison mispronunciations score for
Tano was 5.5 (range 5-6). His mean mispronunciations score for baseline generalization
was 6.5 (range 5-8). In baseline, his mean generalization score was 1 mispronunciation
lower than his comparison probe score.
During intervention, Tano’s mean mispronunciations score was 3.4 (range 3-6).
His mean mispronunciations score for intervention generalization was 3.1 (range 3-6). In
intervention, his mean generalization score was a mean of 0.3 mispronunciations lower
than his comparison probe score.
During maintenance, Tano’s mispronunciations comparison score was 4. His
mispronunciations score for maintenance generalization was 3. In maintenance, his
generalization score was 1 mispronunciation lower than his comparison probe score.

87
Hesitations. During baseline, the comparison hesitations score for Tano was 0.
His mean hesitations score for baseline generalization was 0.5 hesitations (range 0-1). In
baseline, his mean generalization score was 0.5 hesitations higher than his comparison
probe score.
During intervention, Tano’s mean hesitations score was 0.2 (range 0-1). His mean
hesitations scores for intervention generalization was 0.3 (range 0-2). In intervention, his
mean generalization score was a mean of 0.1 hesitations higher than his comparison
probe score.
During maintenance, Tano’s hesitations comparison score was 0. His hesitations
score for maintenance generalization was 1. In maintenance, his generalization score was
1 hesitation higher than his comparison probe score.
Table 10 (page 90) displays Tano’s maintenance performance. Maintenance
probes were taken 2-, 4-, and 6-weeks after the last intervention session. Tano’s types of
errors per minute on his last day of intervention and subsequent maintenance probes were
as follows:
Omissions. Tano’s last day intervention score was 0 omissions. He had
maintenance scores of 0, 1, and 2 omissions respectively. Overall in maintenance, Tano
performed between the same number of omissions as the last session (week 2 probe) and
2 omissions more than the last session (week 6 probe). Tano committed the fewest
omissions on his week 2 maintenance probe.
Additions. Tano’s last day intervention score was 0 additions. He had
maintenance scores of 1, 1, and 0 additions respectively. Overall in maintenance, Tano
performed between the same number of additions as the last session (week 6 probe) and 1

88
addition more than the last session (weeks 2 and 4 probes). Tano committed the fewest
additions on his week 6 maintenance probe.
Substitutions. Tano’s last day intervention score was 1 substitution. He had
maintenance scores of 1, 0, and 5 substitutions respectively. Overall in maintenance,
Tano performed between 1 substitution fewer than the last session (week 2 probe) and 4
substitutions more than the last session (week 6 probe). Tano committed the fewest
substitutions on his week 2 maintenance probe.
Mispronunciations. Tano’s last day intervention score was 1 mispronunciation.
He had maintenance scores of 4, 0, and 3 mispronunciations respectively. Overall in
maintenance, Tano performed between one fewer mispronunciation than the last session
(week 4 probe) and 4 mispronunciations more than the last session (week 2 probe). Tano
committed the fewest mispronunciations on his week 4 maintenance probe.
Hesitations. Tano’s last day intervention score was 0 hesitations. He had
maintenance scores of 0, 0, and 0 hesitations respectively. Overall in maintenance, Tano
performed equally well in all three maintenance probes.
Luci
Number of errors per minute. Figure 2 (page 79) displays Luci’s performance in
the number of errors committed per minute during baseline, repeated readings,
generalization probes, and maintenance probes. During baseline, Luci’s mean number of
epm was 9.54 (range of 7-13). When repeated readings was introduced, Luci’s mean epm
decreased to 5.5 epm (range 2-10). Overall, Luci’s epm were lowest during the repeated
readings intervention, with a decrease of 4.04 epm from baseline. A summary of
individual mean performance on the number of epm is found in Table 5 (page 80).
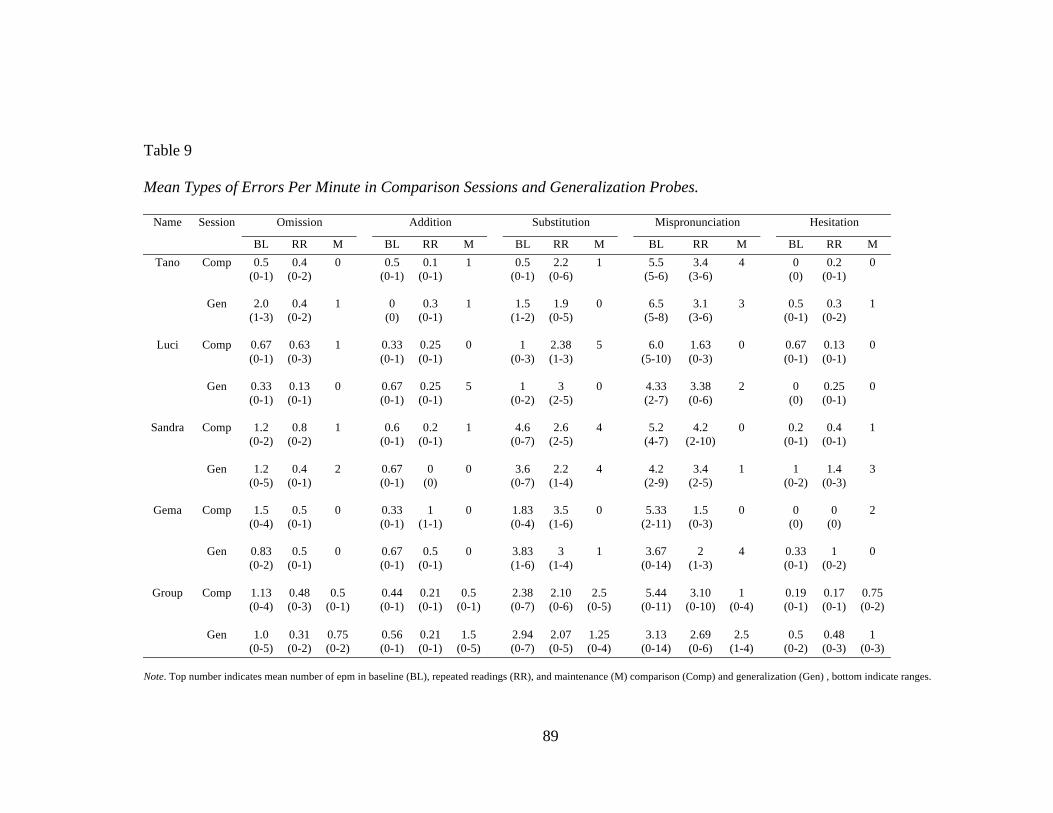
89
Table 9
Mean Types of Errors Per Minute in Comparison Sessions and Generalization Probes.
Omission Addition Substitution Mispronunciation Hesitation Name Session
BL RR M BL RR M BL RR M BL RR M BL RR M
Comp 0.5
(0-1)
0.4
(0-2)
0
0.5
(0-1)
0.1
(0-1)
1 0.5
(0-1)
2.2
(0-6)
1 5.5
(5-6)
3.4
(3-6)
4 0
(0)
0.2
(0-1)
0 Tano
Gen 2.0
(1-3)
0.4
(0-2)
1 0
(0)
0.3
(0-1)
1 1.5
(1-2)
1.9
(0-5)
0 6.5
(5-8)
3.1
(3-6)
3 0.5
(0-1)
0.3
(0-2)
1
Comp 0.67
(0-1)
0.63
(0-3)
1
0.33
(0-1)
0.25
(0-1)
0 1
(0-3)
2.38
(1-3)
5 6.0
(5-10)
1.63
(0-3)
0 0.67
(0-1)
0.13
(0-1)
0 Luci
Gen
0.33
(0-1)
0.13
(0-1)
0
0.67
(0-1)
0.25
(0-1)
5 1
(0-2)
3
(2-5)
0 4.33
(2-7)
3.38
(0-6)
2 0
(0)
0.25
(0-1)
0
Comp 1.2
(0-2)
0.8
(0-2)
1 0.6
(0-1)
0.2
(0-1)
1 4.6
(0-7)
2.6
(2-5)
4 5.2
(4-7)
4.2
(2-10)
0 0.2
(0-1)
0.4
(0-1)
1 Sandra
Gen 1.2
(0-5)
0.4
(0-1)
2
0.67
(0-1)
0
(0)
0 3.6
(0-7)
2.2
(1-4)
4 4.2
(2-9)
3.4
(2-5)
1 1
(0-2)
1.4
(0-3)
3
Comp 1.5
(0-4)
0.5
(0-1)
0
0.33
(0-1)
1
(1-1)
0 1.83
(0-4)
3.5
(1-6)
0 5.33
(2-11)
1.5
(0-3)
0 0
(0)
0
(0)
2 Gema
Gen 0.83
(0-2)
0.5
(0-1)
0
0.67
(0-1)
0.5
(0-1)
0 3.83
(1-6)
3
(1-4)
1 3.67
(0-14)
2
(1-3)
4 0.33
(0-1)
1
(0-2)
0
Comp 1.13
(0-4)
0.48
(0-3)
0.5
(0-1)
0.44
(0-1)
0.21
(0-1)
0.5
(0-1)
2.38
(0-7)
2.10
(0-6)
2.5
(0-5)
5.44
(0-11)
3.10
(0-10)
1
(0-4)
0.19
(0-1)
0.17
(0-1)
0.75
(0-2)
Group
Gen 1.0
(0-5)
0.31
(0-2)
0.75
(0-2)
0.56
(0-1)
0.21
(0-1)
1.5
(0-5)
2.94
(0-7)
2.07
(0-5)
1.25
(0-4)
3.13
(0-14)
2.69
(0-6)
2.5
(1-4)
0.5
(0-2)
0.48
(0-3)
1
(0-3)
Note. Top number indicates mean number of epm in baseline (BL), repeated readings (RR), and maintenance (M) comparison (Comp) and generalization (Gen) , bottom indicate ranges.

90
Table 10
Maintenance Performance Types of Errors Per Minute
Types of Errors Per Minute Participant
Omission Addition Substitution Mispronunciation Hesitation
Last RR 0 0 1 1 0
2-weeks 0
(0)
1
(+1)
1
(0)
4
(+3)
0
(0)
4-weeks 1
(+1)
1
(+1)
0
(-1)
0
(-1)
0
(0)
Tano
6-weeks 2
(+2)
0
(0)
5
(+4)
3
(=2)
0
(0)
Last RR 0 0 4 2 0
2-weeks 1
(+1)
0
(0)
5
(+4)
0
(-2)
0
(0)
4-weeks 1
(+1)
0
(0)
1
(-3)
1
(-1)
0
(0)
Luci
6-weeks 0
(0)
0
(0)
1
(-3)
2
(0)
0
(0)
Last RR 2 0 0 4 0
2-weeks 1
(-1)
1
(+1)
4
(+4)
0
(-4)
1
(+1)
4-weeks 0
(-2)
0
(0)
2
(+2)
2
(-2)
5
(+5)
Sandra
6-weeks 1
(-1)
0
(0)
3
(+3)
5
(+1)
1
(+1)
Last RR 1 1 1 3 0
2-weeks 0
(-1)
0
(-1)
0
(-1)
0
(-3)
2
(+2)
4-weeks 0
(-1)
0
(-1)
1
(0)
3
(0)
2
(+2)
Gema
6-weeks 0
(-1)
0
(-1)
0
(-1)
4
(-1)
0
(0)
Last RR 0.75 0.25 1.5 2.5 0
2-weeks 0.5
(-0.25)
0.5
(+0.25)
2.5
(+1.0)
1.0
(-1.5)
0.75
(+0.75)
4-weeks 0.5
(-0.25)
0.25
(0)
1.0
(-0.5)
1.5
(-1.0)
1.75
(+1.75)
Group
Means
6-weeks 0.75
(0)
0
(-0.25)
2.25
(+0.75)
3.5
(+1.0)
0.25
(+0.25)
Note. Top numbers indicate individual number of epm on the last day of treatment. Bottom numbers indicate the number of epm more
or fewer on 2-, 4-, and 6-week maintenance probes as compared to the last day of intervention.

91
Table 6 (page 82) displays individual mean epm in sessions and in comparison
sessions and generalization probes. During baseline the comparison epm score for Luci
was 8.67 epm (range 7-11). Her mean epm score for baseline generalization was 7.67
epm (range 4-10). In baseline, her mean generalization score was 1epm lower than her
comparison probe score.
During intervention Luci’s mean epm score was 5.5 epm (range 2-10). Her mean
epm scores for intervention generalization was 6.25 epm (range 4-9). In intervention, her
mean generalization score was a mean of 0.75 epm more than her comparison probe
score.
During maintenance, Luci’s epm comparison score was 6 epm. Her epm score for
maintenance generalization was 7 epm. In maintenance, her generalization score was
1epm more than her comparison probe score.
In comparing baseline, intervention and maintenance epm generalization scores,
Luci committed an average of 1.42 fewer epm during intervention generalization probes
than baseline generalization probes. Luci’s epm were lowest on her intervention
generalization probes with a mean of 6.25 epm.
Table 7 (page 83) displays Luci’s maintenance performance. On Luci’s last day
intervention she committed 6 epm. She had maintenance scores of 6, 4, and 3
respectively. Overall in maintenance, Luci performed between 3 epm fewer than the last
session (week 6 probe) and the same number of epm as the last session (week 2 probe).
Luci committed the fewest epm on her week 6 maintenance probe (see Figure 3, page
84).

92
Types of errors per minute. Table 8 (page 85) displays Luci’s performance in the
type of errors committed per minute during baseline and repeated readings. Her types of
epm were as follows:
Omissions. During baseline Luci committed a mean of 0.42 (range 0-1)
omissions. During intervention Luci committed a mean of 0.39 (range 0-3) omissions.
She committed a mean of 0.01 fewer omissions per minute during intervention than in
baseline.
Additions. During baseline Luci committed a mean of 0.25 (range 0-1) additions.
During intervention Luci committed a mean of 0.39 (range 0-2) additions. She committed
a mean of 0.14 more additions per minute during intervention than in baseline.
Substitutions. During baseline, Luci committed a mean of 1.5 (range 0-4)
substitutions. During intervention Luci committed a mean of 2.77 (range 0-9)
substitutions. She committed a mean of 1.27 more substitutions per minute during
intervention than in baseline.
Mispronunciations. During baseline, Luci committed a mean of 6.5 (range 3-11)
mispronunciations. During intervention Luci committed a mean of 1.84 (range 0-4)
mispronunciations. She committed a mean of 4.66 fewer mispronunciations per minute
during intervention than in baseline.
Hesitations. During baseline, Luci committed a mean of 0.58 (range 0-2)
hesitations. During intervention Luci committed a mean of 0.15 (range 0-1) hesitations.
She committed a mean of 0.43 fewer hesitations during intervention than in baseline.

93
Table 9 (page 89) displays individual mean types of errors per minute in
comparison sessions and in generalization probes. Luci’s types of errors per minute were
as follows:
Omissions. During baseline the comparison omissions score for Luci was 0.67
(range 0-1). Her mean omissions score for baseline generalization was 0.33 (range 0-1).
In baseline, her mean generalization score was 0.34 omissions lower than her comparison
probe score.
During intervention Luci’s mean omissions score was 0.63 (range 0-3). Her mean
omissions scores for intervention generalization was 0.13 (range 0-1). In intervention, her
mean generalization score was a mean of 0.5 omissions lower than her comparison probe
score.
During maintenance, Luci’s omission comparison score was 1. Her omissions
score for maintenance generalization was 0. In maintenance, her generalization score was
1 omission lower than her comparison probe score.
Additions. During baseline the comparison mean additions score for Luci was
0.33 additions (range 0-1). Her mean additions score for baseline generalization was 0.67
(range 0-1). In baseline, her mean generalization score was 0.34 additions higher than her
mean comparison probe score.
During intervention Luci’s mean additions score was 0.25 (range 0-1). Her mean
additions scores for intervention generalization was 0.25 (range 0-1). In intervention, her
mean generalization score was equal to her mean comparison probe score.
94
During maintenance, Luci’s mean additions comparison score was 0. Her mean
additions score for maintenance generalization was 5. In maintenance, her mean
generalization score was 5 additions higher than her mean comparison probe score.
Substitutions. During baseline the mean comparison substitutions score for Luci
was 1 (range 0-3). Her mean substitutions score for baseline generalization was 1 (range
0-2). In baseline, her mean generalization score was equal to her comparison probe score.
During intervention Luci’s mean substitutions score was 2.38 (range 1-3). Her
mean substitution scores for intervention generalization was 3.0 (range 2-5). In
intervention, her mean generalization score was 0.62 substitutions higher than her mean
comparison probe score.
During maintenance, Luci’s substitutions comparison score was 5. Her
substitutions score for maintenance generalization was 0. In maintenance, her
generalization score was 5 substitutions lower than her comparison probe score.
Mispronunciations. During baseline the mean comparison mispronunciations
score for Luci was 6 (range 5-10). Her mean mispronunciations score for baseline
generalization was 4.33 (range 2-7). In baseline, her mean generalization score was 1.67
mispronunciations lower than her comparison probe score.
During intervention Luci’s mean mispronunciations score was 1.63 (range 0-3).
Her mean mispronunciation scores for intervention generalization was 3.38 (range 0-6).
In intervention, her mean generalization score was 1.75 mispronunciations higher than
her mean comparison probe score.

95
During maintenance, Luci’s mispronunciation comparison score was 0. Her
mispronunciations score for maintenance generalization was 2. In maintenance, her
generalization score was 2 mispronunciations higher than her comparison probe score.
Hesitations. During baseline the mean comparison hesitations score for Luci was
0.67 (range 0-1). Her mean hesitations score for baseline generalization was 0. In
baseline, her mean generalization score was 0.67 hesitations lower than her comparison
probe score.
During intervention Luci’s mean hesitations score was 0.13 (range 0-1). Her mean
hesitations scores for intervention generalization was 0.25 (range 0-1). In intervention,
her mean generalization score was 0.12 hesitations higher than her mean comparison
probe score.
During maintenance, Luci’s hesitations comparison score was 0. Her hesitations
score for maintenance generalization was 0. In maintenance, her generalization score was
equal to her comparison probe score.
Table 10 (page 90) displays Luci’s maintenance performance. Maintenance
probes were taken 2-, 4-, and 6-weeks after the last intervention session. Luci’s types of
epm on her last day of intervention and subsequent maintenance probes were as follows:
Omissions. Luci’s last day of intervention score was 0 omissions. She had
maintenance scores of 1, 1, and 0 omissions respectively. Overall in maintenance, Luci
performed between 1 omission fewer than the last session (weeks 2 and 4 probes) and the
same number of omissions as the last session (week 6 probe). Luci committed the fewest
omissions on her week 6 maintenance probe.

96
Additions. Luci’s last day intervention score was 0 additions. She had
maintenance scores of 0, 0, and 0 additions respectively. Overall in maintenance, Luci
performed equally well in all three maintenance probes.
Substitutions. Luci’s last day intervention score was 4 substitutions. She had
maintenance scores of 5, 1, and 1 substitutions respectively. Overall in maintenance, Luci
performed between 3 substitutions fewer than the last session (weeks 4 and 6 probes) and
1 substitution more than the last session (week 2 probe). Luci committed the fewest
substitutions on her weeks 4 and 6 maintenance probes.
Mispronunciations. Luci’s last day intervention score was 2 mispronunciations.
She had maintenance scores of 0, 1, and 2 mispronunciations respectively. Overall in
maintenance, Luci performed between the same number of mispronunciations as the last
session (week 6 probe) and 2 mispronunciations fewer than the last session (week 2
probe). Luci committed the fewest mispronunciations on her week 2 maintenance probe.
Hesitations. Luci’s last day intervention score was 0 hesitations. She had
maintenance scores of 0, 0, and 0 hesitations respectively. Overall in maintenance, Luci
performed equally well in all three maintenance probes.
Sandra
Number of errors per minute. Figure 2 (page 79) displays Sandra’s performance
in the number of errors committed per minute during baseline, repeated readings,
generalization probes, and maintenance probes. During baseline, Sandra’s mean number
of epm was 9.77 epm, (range 5-18). When repeated readings was introduced, Sandra’s
mean epm decreased to 6.27 epm (range 3-9). Overall, Sandra’s epm were lowest during
the repeated readings intervention, with a mean decrease of 3.5 epm from baseline. A

97
summary of individual mean performance on the number of errors per minute can be
found in Table 5 (page 80).
Table 6 (page 82) displays individual mean epm in comparison sessions and in
generalization probes. During baseline the comparison epm score for Sandra was 13 epm
(range 11-15). Her mean epm score for baseline generalization was 10.6 epm (range 7-
14). In baseline, her mean generalization score was 2.4 fewer epm than her comparison
probe score.
During intervention Sandra’s mean epm score was 6.6 epm (range 4-9). Her mean
epm scores for intervention generalization was 7 epm (range 6-10). In intervention, her
mean generalization score was 0.4 epm more than her comparison probe score.
During maintenance, Sandra’s epm comparison score was 7 epm. Her epm score
for maintenance generalization was 10 epm. In maintenance, her generalization score was
3 epm more than her comparison probe score.
In comparing baseline, intervention, and maintenance epm generalization scores,
Sandra committed an average of 3.6 fewer epm during intervention generalization probes
than baseline generalization probes. Sandra’s epm were lowest on her intervention
generalization probe with a mean of 7 epm.
Table 7 (page 83) displays Sandra’s maintenance performance. Sandra’s epm
score on her last day of intervention was 6 epm. She had maintenance scores of 7, 9, and
10 epm respectively. Overall in maintenance, Sandra performed between 1 epm more
than the last session (week 2 probe) and 4 epm more than the last session (week 6 probe).
Sandra committed the fewest epm on her week 2 maintenance probe (see Figure 3, page
84).

98
Types of errors per minute. Table 8 (page 85) displays Sandra’s performance in
the type of errors committed per minute during baseline and repeated readings. Her types
of epm were as follows:
Omissions. During baseline Sandra committed a mean of 0.77 (range 0-4)
omissions. During intervention Sandra committed a mean of 0.8 (range 0-2) omissions.
She committed a mean of 0.03 more omissions per minute during intervention than in
baseline.
Additions. During baseline Sandra committed a mean of 0.41 (range 0-2)
additions. During intervention Sandra committed a mean of 0.35 (range 0-2) additions.
She committed a mean of 0.06 fewer additions per minute during intervention than in
baseline.
Substitutions. During baseline Sandra committed a mean of 2.94 (range 0-9)
substitutions. During intervention Sandra committed a mean of 2.2 (range 0-5)
substitutions. She committed a mean of 0.74 fewer substitutions per minute during
intervention than in baseline.
Mispronunciations. During baseline Sandra committed a mean of 5.06 (range 1-
10) mispronunciations. During intervention Sandra committed a mean of 2.65 (range 1-6)
mispronunciations. She committed a mean of 2.41 fewer omissions per minute during
intervention than in baseline.
Hesitations. During baseline Sandra committed a mean of 0.65 (range 0-3)
hesitations. During intervention Sandra committed a mean of 0.45 (range 0-1) hesitations.
She committed a mean of 0.2 fewer omissions per minute during intervention than in
baseline.

99
Table 9 (page 89) displays individual mean types of errors per minute in
comparison sessions and in generalization probes. Sandra’s types of errors per minute
were as follows:
Omissions. During baseline the mean comparison omissions score for Sandra was
1.2 (range 0-2). Her mean omissions score for baseline generalization was 1.2 (range 0-
5). In baseline, her mean generalization score was equal to her mean comparison probe
score.
During intervention Sandra’s mean omissions score was 0.8 (range 0-2). Her
mean omissions scores for intervention generalization was 0.4 (range 0-1). In
intervention, her mean generalization score was 0.4 omissions lower than her mean
comparison probe score.
During maintenance, Sandra’s comparison score was 1 omission. Her omission
score for maintenance generalization was 2. In maintenance, her generalization score was
1 omission higher than her comparison probe score.
Additions. During baseline the mean comparison additions score for Sandra was
0.6 (range 0-1). Her mean additions score for baseline generalization was 0.67 (range 0-
1). In baseline, her mean generalization score was 0.7 additions higher than her mean
comparison probe score.
During intervention Sandra’s mean additions score was 0.2 (range 0-1). Her mean
additions scores for intervention generalization was 0. In intervention, her mean
generalization score was 0.2 additions lower than her mean comparison probe score.

100
During maintenance, Sandra’s comparison score was 1addition. Her additions
score for maintenance generalization was 0. In maintenance, her generalization score was
1 addition lower than her comparison probe score.
Substitutions. During baseline the mean comparison substitutions score for Sandra
was 4.6 (range 0-7). Her mean substitutions score for baseline generalization was 3.6
(range 0-7). In baseline, her mean generalization score was 1.0 substitution lower than
her mean comparison probe score.
During intervention Sandra’s mean substitutions score was 2.6 (range 2-5). Her
mean substitutions scores for intervention generalization was 2.2 (range 1-4). In
intervention, her mean generalization score was 0.4 substitutions lower than her mean
comparison probe score.
During maintenance, Sandra’s comparison score was 4 substitutions. Her
substitutions score for maintenance generalization was 4. In maintenance, her
generalization score was equal to her comparison probe score.
Mispronunciation. During baseline the mean comparison mispronunciations score
for Sandra was 5.2 (range 4-7). Her mean mispronunciations score for baseline
generalization was 4.2 (range 2-9). In baseline, her mean generalization score was 3.5
mispronunciations lower than her mean comparison probe score.
During intervention Sandra’s mean mispronunciations score was 4.2 (range 2-10).
Her mean mispronunciation score for intervention generalization was 3.4 (range 2-5). In
intervention, her mean generalization score was a mean of 0.8 mispronunciations lower
than her comparison probe score.

101
During maintenance, Sandra’s comparison score was 0 mispronunciations. Her
mispronunciations score for maintenance generalization was 1. In maintenance, her
generalization score was 1 mispronunciation higher than her comparison probe score.
Hesitation. During baseline the comparison hesitations score for Sandra was 0.2
(range 0-1). Her mean hesitations score for baseline generalization was 1.0 hesitation
(range 0-2). In baseline, her mean generalization score was 0.8 hesitations higher than her
mean comparison probe score.
During intervention Sandra’s mean hesitations score was 0.4 (range 0-1). Her
mean hesitations scores for intervention generalization was 1.4 (range 0-3). In
intervention, her mean generalization score was 1 hesitation higher than her comparison
probe score.
During maintenance, Sandra’s comparison score was 1 hesitation. Her hesitations
score for maintenance generalization was 3. In maintenance, her generalization score was
2 hesitations higher than her comparison probe score.
Table 10 (page 90) displays Sandra’s maintenance performance. Maintenance
probes were taken 2-, 4-, and 6-weeks after the last intervention session. Sandra’s types
of epm on her last day of intervention and subsequent maintenance probes were as
follows:
Omissions. Sandra’s last day intervention score was 2 omissions. She had
maintenance scores of 1, 0, and 1 omission respectively. Overall in maintenance, Sandra
performed between 1 omission fewer than the last session (weeks 2 and 6 probes) and 2
omissions fewer than the last session (week 4 probe). Sandra committed the fewest
omissions on her week 4 maintenance probe.
102
Additions. Sandra’s last day intervention score was 0 additions. She had
maintenance scores of 1, 0, and 0 additions respectively. Overall in maintenance, Sandra
performed between the same number of additions as the last session (weeks 4 and 6
probes) and 1 addition more than the last session (week 2 probe). Sandra committed the
fewest omissions on her weeks 4 and 6 maintenance probes.
Substitutions. Sandra’s last day intervention score was 0 substitutions. She had
maintenance scores of 4, 2, and 3 substitutions respectively. Overall in maintenance,
Sandra performed between 2 substitutions more than the last session (week 4 probe) and
4 substitutions more than the last session (week 2 probe). Sandra committed the fewest
substitutions on her week 4 maintenance probe.
Mispronunciations. Sandra’s last day intervention score was 4 mispronunciations.
She had maintenance scores of 0, 2, and 5 mispronunciations respectively. Overall in
maintenance, Sandra performed between 4 mispronunciations fewer than the last session
(week 2 probe) and 1 mispronunciation more than the last session (week 6 probe). Sandra
committed the fewest mispronunciations on her week 2 maintenance probe (see figure 7).
Hesitations. Sandra’s last day intervention score was 0 hesitations. She had
maintenance scores of 1, 5, and 1 hesitations respectively. Overall in maintenance,
Sandra performed between 1 hesitation more than the last session (weeks 2 and 6 probes)
and 5 hesitations more than the last session (week 4 probe). Sandra committed the fewest
hesitations on her weeks 2 and 6 maintenance probes.
Gema
Number of errors per minute. Figure 2 (page 79) displays Gema’s performance in
the number of epm committed during baseline, repeated readings, generalization probes,

103
and maintenance probes. During baseline, Gema’s mean number of epm was 8.95 epm
(range 5-15). When repeated readings was introduced, Gema’s mean epm decreased to
5.29 epm (range 1-7). Overall, Gema’s epm were lowest during the repeated readings
intervention, with a decrease of 3.66 epm from baseline. A summary of individual mean
performance on the number of errors per minute can be found in Table 5 (page 80).
Table 6 (page 82) displays individual mean epm in comparison sessions and in
generalization probes. During baseline the mean comparison epm score for Gema was
9.17 epm (range 5-15). Her mean epm score for baseline generalization was 9.33 epm
(range 6-16). In baseline, her mean generalization score was 0.16 epm more than her
comparison probe score.
During intervention Gema’s mean epm score was 6.5 epm (range 6-7). Her mean
epm scores for intervention generalization was 7 epm (range 5-9). In intervention, her
mean generalization score was 0.5 epm more than her comparison probe score.
During maintenance, Gema’s epm comparison score was 2 epm. Her epm score
for maintenance generalization was 5 epm. In maintenance, her generalization score was
3 epm more than her comparison probe score.
In comparing baseline, intervention and maintenance epm generalization scores,
Gema committed a mean of 2.33 fewer epm during intervention generalization probes
than baseline generalization probes. Gema’s epm were lowest on her maintenance
generalization probe with 5 epm.
Table 7 (page 83) displays Gema’s maintenance performance. On Gema’s epm
score on her last day of intervention was 6 epm. She had maintenance scores of 2, 6, and
4 epm respectively. Overall in maintenance, Sandra performed between 4 epm fewer than

104
the last session (week 2 probe) and the same number of epm as the last session (week 4
probe). Gema committed the fewest epm on her week 2 maintenance probe (see Figure 3,
page 84).
Types of errors per minute. Table 8 (page 85) displays Gema’s performance in the
type of errors committed per minute during baseline and repeated readings. Her types of
epm were as follows:
Omissions. During baseline Gema’s committed a mean of 0.38 (range 0-3)
omissions. During intervention Gema committed a mean of 0.17 (range 0-1) omissions.
She committed a mean of 0.21 fewer omissions per minute during intervention than in
baseline.
Additions. During baseline Gema committed a mean of 0.62 (range 0-2) additions.
During intervention Gema committed a mean of 0.83 (range 0-2) additions. She
committed a mean of 0.21 more additions per minute during intervention than in baseline.
Substitutions. During baseline Gema committed a mean of 3.0 (range 1-8)
substitutions. During intervention Gema committed a mean of 1.83 (range 1-6)
substitutions. She committed a mean of 1.17 fewer substitutions per minute during
intervention than in baseline.
Mispronunciations. During baseline Gema committed a mean of 5.0 (range 1-14)
mispronunciations. During intervention Gema committed a mean of 1.5 (range 0-4)
mispronunciations. She committed a mean of 3.5 fewer mispronunciations per minute
during intervention than in baseline.
105
Hesitations. During baseline Gema’s committed a mean of 0.19 (range 0-1)
hesitations. During intervention Gema committed a mean of 0.67 (range 0-3) hesitations.
She committed 0.48 more hesitations during intervention than in baseline.
Table 9 (page 89) displays individual mean types of errors per minute in
comparison sessions and in generalization probes. Gema’s types of epm were as follows:
Omissions. During baseline the comparison omissions score for Gema was 1.5
(range 0-4). Her mean omissions score for baseline generalization was 0.83 (range 0-2).
In baseline, her mean generalization score was 0.67 omissions lower than her comparison
probe score.
During intervention Gema’s mean omissions score was 0.5 (range 0-1). Her mean
omissions scores for intervention generalization was 0.5 (range 0-1). In intervention, her
mean generalization score was equal to her comparison probe score.
During maintenance, Gema’s epm comparison score was 0. Her omissions score
for maintenance generalization was 0. In maintenance, her generalization score equal to
her comparison probe score.
Additions. During baseline, the comparison additions score for Gema was 0.33
(range 0-1). Her mean additions score for baseline generalization was 0.67 (range 0-1). In
baseline, her mean generalization score was 0.34 additions higher than her mean
comparison probe score.
During intervention Gema’s mean additions score was 1 (range 1-1). Her mean
additions score for intervention generalization was 0.5 (range 0-1). In intervention, her
mean generalization score was 0.5 additions higher than her mean comparison probe
score.

106
During maintenance, Gema’s additions comparison score was 0. Her additions
score for maintenance generalization was 0. In maintenance, her generalization score was
equal to her comparison probe score.
Substitutions. During baseline the comparison substitutions score for Gema was
1.83 (range 0-4). Her mean substitutions score for baseline generalization was 3.83
(range 1-6). In baseline, her mean generalization score was 2 substitutions higher than her
mean comparison probe score.
During intervention Gema’s mean substitutions score was 3.5 (range 1-6). Her
mean substitutions scores for intervention generalization was 3.0 (range 1-4). In
intervention, her mean generalization score was 0.5 substitutions lower than her mean
comparison probe score.
During maintenance, Gema’s substitutions comparison score was 0. Her
substitutions score for maintenance generalization was 1. In maintenance, her
generalization score was 1 substitution higher than her comparison probe score.
Mispronunciations. During baseline the mean comparison mispronunciations
score for Gema was 5.33 (range 2-11). Her mean mispronunciations score for baseline
generalization was 3.67 (range 0-14). In baseline, her mean generalization score was 1.66
mispronunciations lower than her mean comparison probe score.
During intervention Gema’s mean mispronunciations score was 1.5 (range 0-3).
Her mean mispronunciations scores for intervention generalization was 2.0 (range 1-3).
In intervention, her mean generalization score was 0.5 mispronunciations higher than her
mean comparison probe score.

107
During maintenance, Gema’s mispronunciations comparison score was 0. Her
mispronunciations score for maintenance generalization was 4. In maintenance, her
generalization score was 4 mispronunciations higher than her comparison probe score.
Hesitation. During baseline the mean comparison hesitations score for Gema was
0. Her mean hesitations score for baseline generalization was 0.33 (range 0-1). In
baseline, her mean generalization score was 0.33 hesitations higher than her mean
comparison probe score.
During intervention, Gema’s mean hesitations score was 0. Her mean hesitations
scores for intervention generalization was 1 (range 0-2). In intervention, her mean
generalization score was 1 hesitation higher than her mean comparison probe score.
During maintenance, Gema’s hesitations comparison score was 2. Her hesitations
score for maintenance generalization was 0. In maintenance, her generalization score was
2 hesitations higher than her comparison probe score.
Table 10 (page 90) displays Gema’s maintenance performance. Gema’s types of
epm on her last day of intervention and subsequent maintenance probes were as follows:
Omissions. Gema’s last day intervention score was 1 omission. She had
maintenance scores of 0, 0, and 0 omissions respectively. Overall in maintenance, Gema
performed equally well on all of her maintenance probes.
Additions. Gema’s last day intervention score was 1 addition. She had
maintenance scores of 0, 0, and 0 additions respectively. Overall in maintenance, Gema
performed equally well on all of her maintenance probes.
Substitutions. Gema’s last day intervention score was 1 substitution. She had
maintenance scores of 0, 1, and 0 substitutions respectively. Overall in maintenance,

108
Gema performed between 1 substitution fewer than the last session (weeks 2 and 6
probes) and an equal number of substitutions as the last session (week 4 probe). Gema
committed the fewest substitutions on weeks 2 and 6 maintenance probes.
Mispronunciations. Gema’s last day intervention score was 3 mispronunciations.
She had maintenance scores of 0, 3, and 4 mispronunciations respectively. Overall in
maintenance, Gema performed between 3 mispronunciations fewer than the last session
(week 2 probe) and 1 mispronunciation more than the last session (week 6 probe). Gema
committed the fewest mispronunciations on her week 2 maintenance probe.
Hesitations. Gema’s last day intervention score was 0 hesitations. She had
maintenance scores of 2, 2, and 0 hesitations respectively. Overall in maintenance, Gema
performed between the same number of hesitations as the last session (week 6 probe) and
2 hesitations more than the last session (weeks 2 and 4 probes). Gema committed the
fewest hesitations on her week 6 maintenance probe.
Group Means for Number and Types of Errors Per Minute
Table 5 (page 80) displays the group means for the number of epm during
baseline and repeated readings. During baseline, the mean number of epm was 9.21
(range 4-18). When repeated readings was introduced, the mean number of errors per
minute decreased to 5.52 (range 1-11). Overall, the mean number of epm was lowest
during the repeated readings intervention, with a mean decrease of 3.69 epm from
baseline.
Table 6 (page 82) displays the group means for epm in comparison sessions and
in generalization probes. During baseline the mean group comparison epm score was 9.36
epm (range 5-15). The mean epm score for baseline generalization was 9.56 epm (range
109
4-16). In baseline, the group mean generalization score was 0.2 epm higher than the
comparison probe score.
During intervention the group mean epm comparison score was 5.52 epm (range
4-10). The mean epm score for intervention generalization was 6.52 epm (range 3-11). In
intervention, the mean group generalization score was 1 epm higher than the comparison
probe score.
During maintenance, the group epm comparison score was 5 (range 2-7). The epm
score for maintenance generalization was 7 (range 5-10). In maintenance, the group mean
generalization score was 2 epm higher than the mean comparison probe score.
In comparing baseline, intervention, and maintenance epm generalization scores,
the group committed a mean of 3.04 more epm during intervention generalization probes
than baseline generalization probes. The group mean epm was lowest on the mean
intervention generalization probes with 6.52 epm.
Table 7 (page 83) displays the group mean maintenance performance scores for
epm. The group mean score on the last day of intervention was 5.5 epm (range 4-6). The
group had mean maintenance scores of 5 (range 2-7), 5.25 (range 2-6), and 6.75 (range 3-
10) epm respectively. Overall in maintenance, the group performed between a mean of
0.5 epm fewer than the last session (week 2 probe) and 1.25 epm more than the last
session (week 6 probe). The group committed the fewest epm on the week 2 maintenance
probe (see Figure 3, page 84).
Table 8 (page 85) displays group means for the type of epm during baseline and
repeated readings. The group means for types of epm were as follows:

110
Omissions. During baseline, the mean number of omissions was 0.68 (range 0-5).
During intervention the mean number of omissions was 0.5 (range0-4). In intervention
there was a mean decrease of 0.18 omissions per minute from baseline.
Additions. During baseline, the mean number of additions was 0.5 (range 0-3).
During intervention the mean number of additions was 0.45 (range 0-2). In intervention
there was a mean decrease of 0.05 additions per minute from baseline.
Substitutions. During baseline, the mean number of substitutions was 2.29 (range
0-9). During intervention the mean number of omissions was 2.05 (range 0-9). In
intervention there was a mean decrease of 0.24 substitutions per minute from baseline.
Mispronunciations. During baseline, the mean number of mispronunciations was
5.57 (range 0-14). During intervention the mean number of mispronunciations was 2.25
(range 0-6). In intervention there was a mean decrease of 3.32 mispronunciations per
minute from baseline.
Hesitations. During baseline, the mean number of hesitations was 0.43 (range 0-
3). During intervention the mean number of hesitations was 0.35 (range 0-3). In
intervention there was a mean decrease of 0.08 hesitations per minute from baseline.
Table 9 (page 89) displays individual mean types of epm in comparison sessions
and in generalization probes. The group mean types of epm were as follows:
Omissions. During baseline the mean comparison omissions score for the group
was 1.13 (range 0-4). The mean omissions score for baseline generalization was 1.0
(range 0-5). In baseline, the mean generalization score was 0.13 omissions lower than the
comparison probe score.

111
During intervention the mean comparison omissions score for the group was 0.48
(range 0-3). The mean omissions scores for intervention generalization were 0.31
omissions (range 0-2). In intervention, the mean generalization score was 0.17 omissions
lower than the comparison probe score.
During maintenance, the group omissions comparison score was 0.5 (range 0-1).
The omissions score for maintenance generalization was 0.75 (range 0-2). In
maintenance, the generalization score was 0.25 omissions higher than the comparison
probe score.
Additions. During baseline, the comparison additions score for the group was 0.44
(range 0-1). The mean additions score for baseline generalization was 0.56 (range 0-1). In
baseline, the mean generalization score was 0.12 additions higher than the comparison
probe score.
During intervention, the group mean additions score was 0.21 (range 0-1). The
mean additions scores for intervention generalization was 0.21 additions (range 0-1). In
intervention, the mean generalization score was equal to the comparison probe score.
During maintenance, the group additions mean comparison score was 0.5 (range
0-1). The mean additions score for maintenance generalization was 1.5 (range 0-5). In
maintenance, the generalization score was 1 addition higher than the comparison probe
score.
Substitutions. During baseline, the comparison mean substitutions score for the
group was 2.38 (range 0-7). The mean substitutions score for baseline generalization was
2.94 (range 0-7). In baseline, the mean generalization score was 0.56 substitutions higher
than their comparison probe score.

112
During intervention, the group mean substitutions score was 2.10 (range 0-6). The
mean substitutions scores for intervention generalization was 2.07 (range 0-5). In
intervention, the mean generalization score was a mean of 0.3 substitutions higher than
the comparison probe score.
During maintenance, the group substitutions comparison score was 2.5 (range 0-
5). The substitutions score for maintenance generalization was 1.25 (range 0-4). In
maintenance, the generalization score was 1.25 substitutions lower than the comparison
probe score.
Mispronunciations. During baseline the comparison mispronunciations score for
the group was 5.44 (range 0-11). The mean mispronunciations score for baseline
generalization was 3.13 (range 0-14). In baseline, the mean generalization score was 2.31
mispronunciations lower than the comparison probe score.
During intervention, the group mean mispronunciations score was 3.10 (range 0-
10). The mean mispronunciations score for intervention generalization was 2.69 (range 0-
6). In intervention, the mean generalization score was 0.41 mispronunciations lower than
the comparison probe score.
During maintenance, the group mean mispronunciation comparison score was 1
(range 0-4). The mispronunciations score for maintenance generalization was 2.5 (range
1-4). In maintenance, the generalization score was 1.5 mispronunciations higher than the
comparison probe score.
Hesitations. During baseline, the mean comparison hesitations score for the group
was 0.19 (range 0-1). The mean hesitations score for baseline generalization was 0.5

113
(range 0-2). In baseline, the mean generalization score was 0.31 hesitations higher than
the comparison probe score.
During intervention, the group mean hesitations score was 0.17 (range 0-1). The
mean hesitations scores for intervention generalization were 0.48 (range 0-3). In
intervention, the mean generalization score was 0.31 hesitations higher than their
comparison probe score.
During maintenance, the group mean hesitations comparison score was 0.75
(range 0-2). The mean hesitation score for maintenance generalization was 1 (0-3). In
maintenance, the generalization score was 0.25 hesitations higher than the comparison
probe score.
Table 10 (page 90) displays the group’s maintenance performance. Maintenance
probes were taken 2-, 4-, and 6-weeks after the last intervention session. The group’s
mean types of epm on their last day of intervention and subsequent maintenance probes
were as follows:
Omissions. The last day of intervention mean score was 0.75 (range 0-2)
omissions. The group had maintenance mean scores of 0.5 (range 0-1), 0.5 (range 0-1),
and 0.75 (range 0-2) omissions respectively. Overall in maintenance, the group
committed between 0.25 fewer omissions than the comparison score (weeks 2 and 4
probes) and the same number of omissions as the comparison score (week 6 probe). The
group made the fewest omissions the weeks 2 and 4 maintenance probes.
Additions. The last day of intervention mean score was 0.25 (range 0-1) additions.
The group had maintenance scores of 0.5 (range 0-1), 0.25 (range 0-1), and 0 additions
respectively. Overall in maintenance, the group performed between 0.25 fewer additions

114
than the comparison score (week 6 probe) and 0.25 additions more than the comparison
score (week 2 probe). The group made the fewest additions in the week 6 maintenance
probe.
Substitutions. The last day of intervention mean score was 1.5 (range 0-4)
substitutions. The group had maintenance scores of 2.5 (range 0-5), 1.0 (range 0-2), and
2.25 (range 0-5) substitutions respectively. Overall in maintenance, the group performed
between 0.5 substitutions fewer than the last session (week 4 probe) and 1 substitution
higher than the last session (week 2 probe). The group committed the fewest substitutions
on the week 4 maintenance probe.
Mispronunciations. The last day intervention mean score was 2.5 (range 1-4)
mispronunciations. The group had maintenance scores of 1.0 (range 0-4), 1.5 (range 0-3),
and 3.5 (range 2-5) mispronunciations respectively. Overall in maintenance, the group
performed between 1.5 mispronunciations fewer than the last session (week 2 probe) and
1 mispronunciation more than the last session (week 6 probe). The group committed the
fewest mispronunciations on the week 2 maintenance probe.
Hesitations. The last day intervention mean score was 0 hesitations. The group
had maintenance scores of 0.75 (range 0-2), 1.75 (range 0-5), and 0.25 (range 0-1)
hesitations respectively. Overall in maintenance, the group performed between 0.25 more
hesitations than the comparison score (week 6 probe) and 1.75 hesitations more than the
last session (week 4 probe). The group committed the fewest hesitations on the week 6
maintenance probe.

115
Correct Answers to Literal Comprehension Questions
This study was conducted, in part, to examine the effects of repeated readings on
the number of literal comprehension questions answered correctly by ELLs with SLD.
The number of correct answers to five literal comprehension questions is presented in the
form of individual daily performance and group means.
Generalization scores for correct literal comprehension questions are presented in
the form of means and ranges. The results from the generalization probes are then
compared to the correct literal comprehension questions means and ranges of the
preceding regular sessions. These regular sessions are referred to as the comparison
score.
Maintenance scores for correct literal comprehension questions are presented in
the form of number of correct literal comprehension questions during each probe. The
results from the maintenance probes are then compared to the number of correct literal
comprehension questions in the last intervention session.
Tano
Figure 4 (page 117) displays Tano’s performance in literal comprehension
questions during baseline, repeated readings, generalization probes, and maintenance
probes. During baseline, Tano’s mean number of correct answers to literal
comprehension questions was 2.25 (range 1-3). When repeated readings was introduced,
Tano’s mean number of correct answers to literal comprehension questions increased to
3.63 (range 3-5). Overall, Tano’s number of correct answers to literal comprehension
questions was highest during the repeated readings intervention, with a mean increase of
1.38 more correct answers over baseline. A summary of individual mean performance on

116
number of correct answers to literal comprehension questions can be found in Table 11
(page 118).
Table 12 (page 120) displays individual means for correct literal comprehension
questions in comparison sessions and generalization probes. During baseline Tano’s
comparison score of correct literal comprehension questions was 2 (range 1-3). His mean
correct literal comprehension questions score for baseline generalization was 3 (range 3-
3). In baseline, his mean generalization score was 1 correct literal comprehension
question higher than his comparison probe score.
During intervention Tano’s mean correct literal comprehension questions score
was 3.4 (range 2-5). His mean correct literal comprehension questions scores for
intervention generalization was 3.6 (range 2-5). In intervention, his mean generalization
score was 0.2 correct literal comprehension questions higher than his comparison probe
score.
During maintenance, Tano’s correct literal comprehension questions comparison
score was 3. His correct literal comprehension questions score for maintenance
generalization was 2. In maintenance, his generalization score was 1 correct literal
comprehension questions lower than his comparison probe score.
In comparing baseline, intervention and maintenance correct literal
comprehension questions generalization scores, Tano had an average of 0.6 more correct
literal comprehension questions during intervention generalization probes than baseline
generalization probes. Tano’s correct literal comprehension questions were highest on his
intervention generalization with a mean score of 3.6.
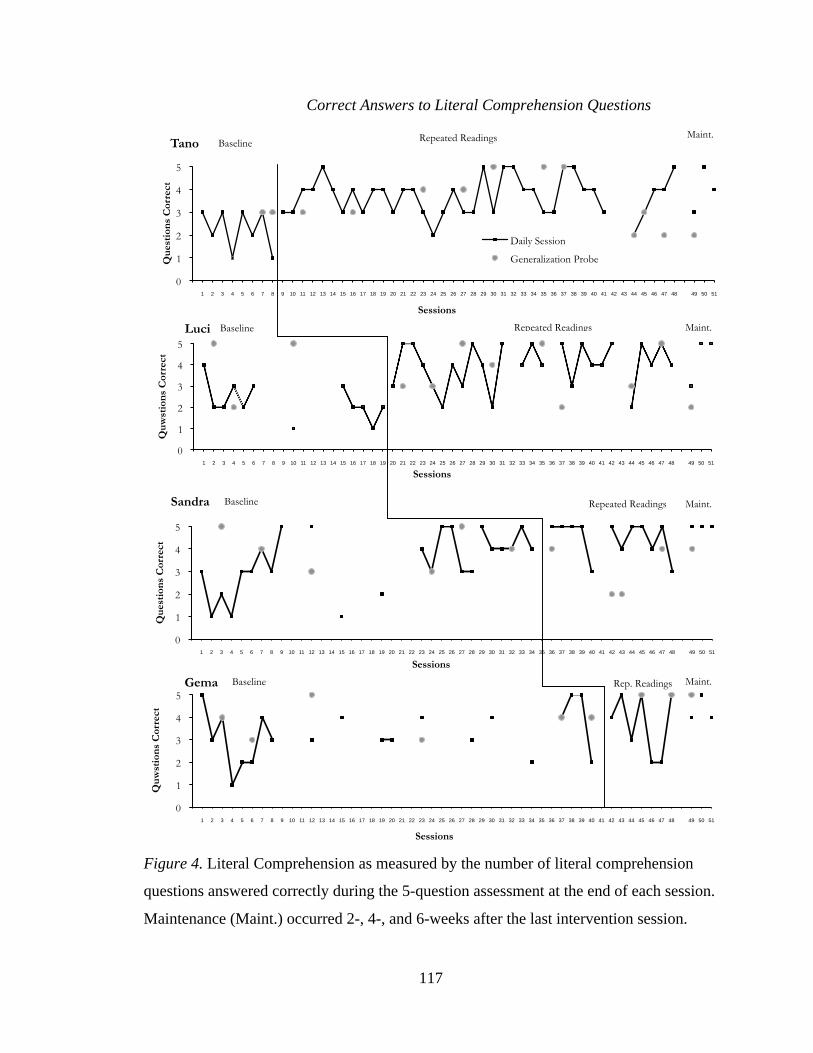
117
Correct Answers to Literal Comprehension Questions
Figure 4. Literal Comprehension as measured by the number of literal comprehension
questions answered correctly during the 5-question assessment at the end of each session.
Maintenance (Maint.) occurred 2-, 4-, and 6-weeks after the last intervention session.
0
1
2
3
4
5
1 2 3 4 5 6 7 8 9 10 11 12 13 14 15 16 17 18 19 20 21 22 23 24 25 26 27 28 29 30 31 32 33 34 35 36 37 38 39 40 41 42 43 44 45 46 47 48 49 50 51
Qu
esti
ons
Cor
rect
Sessions
Tano
Daily Session
Generalization Probe
0
1
2
3
4
5
1 2 3 4 5 6 7 8 9 10 11 12 13 14 15 16 17 18 19 20 21 22 23 24 25 26 27 28 29 30 31 32 33 34 35 36 37 38 39 40 41 42 43 44 45 46 47 48 49 50 51
Qu
wst
ion
s C
orre
ct
Sessions
Luci
0
1
2
3
4
5
1 2 3 4 5 6 7 8 9 10 11 12 13 14 15 16 17 18 19 20 21 22 23 24 25 26 27 28 29 30 31 32 33 34 35 36 37 38 39 40 41 42 43 44 45 46 47 48 49 50 51
Qu
esti
ons
Cor
rect
Sessions
Sandra
0
1
2
3
4
5
1 2 3 4 5 6 7 8 9 10 11 12 13 14 15 16 17 18 19 20 21 22 23 24 25 26 27 28 29 30 31 32 33 34 35 36 37 38 39 40 41 42 43 44 45 46 47 48 49 50 51
Qu
wst
ion
s C
orre
ct
Sessions
Gema Rep. Readings
Maint.
Repeated Readings
Maint. Baseline
Baseline
Maint.
Maint. Repeated Readings Baseline
Repeated Readings
Baseline

118
Table 11
Individual Means on Correct Answers to Literal Comprehension Questions
Participant Baseline Repeated Readings
2.25 3.63 Tano
(1-3) (3-5)
2.25 4.0 Luci
(1-4) (2-5)
3.11 4.44 Sandra
(1-5) (3-5)
3.3 3.71 Gema
(1-5) (2-5)
2.88 3.94 Group
Means (1-5) (2-5)
Note. Top numbers indicate individual mean of correct literal comprehension questions at each phase of the intervention. The bottom
rows of numbers represent the range of scores.
Table 13 (page 121) displays Tano’s maintenance performance. Maintenance
probes were taken 2-, 4-, and 6-weeks after the last intervention session. Tano’s score on
his last day of intervention was 3 correct answers to literal comprehension questions. He
had maintenance scores of 3, 5, and 4 respectively. Overall in maintenance, Tano
maintained between the same score as his comparison score of 3 (week 2 probe) and 2
more questions answered correctly with a score of 5 (week 4 probe). Tano performed
highest on his week 4 maintenance probe.
Luci
Figure 4 (page 117) displays Luci’s performance in literal comprehension
questions during baseline, repeated readings, and generalization probes. During baseline,
Luci’s mean number of correct answers to literal comprehension questions was 2.25

119
(range1-4). When repeated readings was introduced, Luci’s mean number of correct
answers to literal comprehension questions increased to 4.0 (range 2-5). Overall, Luci’s
number of correct answers to literal comprehension questions was highest during the
repeated readings intervention, with an increase of 1.75 more correct answers over
baseline. A summary of individual mean performance on number of correct answers to
literal comprehension questions can be found in Table 11 (page 118).
Table 12 (page 120) displays individual means for correct literal comprehension
questions in comparison sessions and generalization probes. During baseline the
comparison score of correct literal comprehension questions for Luci was 2 (range 1-3).
Her mean correct literal comprehension questions score for baseline generalization was 4
(range 2-5). In baseline, her mean generalization score was 2 correct literal
comprehension questions higher than her comparison probe score.
During intervention Luci’s mean correct literal comprehension questions score
was 3.62 (range 2-5). Her mean correct literal comprehension questions scores for
intervention generalization was 3.75 (range 2-5). In intervention, her mean generalization
score was 0.13 correct literal comprehension questions higher than her comparison probe
score.
During maintenance, Luci’s correct literal comprehension questions comparison
score was 3. Her correct literal comprehension questions score for maintenance
generalization was 2. In maintenance, her generalization score was 1 correct literal
comprehension questions higher than her comparison probe score.

120
Table 12
Mean Correct Answers to Literal Comprehension Questions in Comparison Sessions and
in Generalization Probes.
Mean Correct Literal Comprehension Questions Participant
Baseline Repeated Readings Maintenance
Comparison
Scores
2
(1-3)
3.4
(2-5)
3 Tano
Generalization
Probes
3
(3-3)
3.6
(2-5)
2
Comparison
Scores
2
(1-3)
3.62
(2-5)
3 Luci
Generalization
Probes
4
(2-5)
3.75
(2-5)
2
Comparison
Scores
3.4
(2-5)
4.6
(4-5)
5 Sandra
Generalization
Probes
4
(3-5)
3.2
(2-5)
4
Comparison
Scores
3.17
(2-4)
5
(5-5)
4 Gema
Generalization
Probes
3.83
(3-5)
5
(5-5)
5
Comparison
Scores
3.19
(1-5)
3.61
(2-5)
3.75
(3-5)
Group
Means
Generalization
Probes
3.63
(2-5)
3.83
(2-5)
3.25
(2-5)
Note. Comparison scores are taken from the regular sessions preceding the generalization probes. Top numbers indicated mean
number of Literal Comprehension Questions answered correctly. The bottom rows of numbers represent the ranges of scores.
In comparing baseline, intervention and maintenance correct literal
comprehension questions generalization scores, Luci had an average of 0.25 fewer
correct literal comprehension questions during intervention generalization probes than

121
baseline generalization probes. Luci’s correct literal comprehension questions were
highest on her baseline generalization probes with a mean score of 4.
Table 13
Maintenance Performance on Correct Answers to Literal Comprehension Questions
Participant
Last Intervention
Score
Week 2
Probe
Week 4
Probe
Week 6
Probe
Tano 3 3 5 4
(0) (+2) (+1)
Luci 4 3 4 5
(-1) (0) (+1)
Sandra 3 5 5 4
(+2) (+2) (+1)
Gema 5 4 5 4
(-1) (0) (-1)
4 3.75 4.75 4.25 Group Means
(-0.25) (+0.75) (+0.25)
Note. Top numbers indicate individual number of correct literal comprehension questions on the last day of treatment and on 2-, 4-,
and 6-week maintenance probes. The bottom row percentages indicate the percentage of correct literal comprehension questions
maintained on 2-, 4-, and 6-week maintenance probes.
Table 13 (page 121) displays Luci’s maintenance performance. Maintenance
probes were taken 2-, 4-, and 6-weeks after the last intervention session. Luci’s score on
her last day of intervention was 4 correct answers to literal comprehension questions. She
had maintenance scores of 3, 4, and 5 respectively. Overall in maintenance, Luci
maintained between 1 question less than her comparison score with a score of 3 (week 2
probe) and 1 more questions answered correctly with a score of 5 (week 6 probe). Luci
performed highest on her week 6 maintenance probe.

122
Sandra
Figure 4 (page 117) displays Sandra’s performance in literal comprehension
questions during baseline, repeated readings, generalization probes and maintenance
probes. During baseline, Sandra’s mean number of correct answers to literal
comprehension questions was 3.11 (range 1-5). When repeated readings was introduced,
Sandra’s mean number of correct answers to literal comprehension questions increased to
4.44 (range 3-5). Overall, Sandra’s number of correct answers to literal comprehension
questions was highest during the repeated readings intervention, with an increase of 1.33
more correct answers over baseline. A summary of individual mean performance on
number of correct answers to literal comprehension questions can be found in Table 11
(page 118).
Table 12 (page 120) displays individual means for correct literal comprehension
questions in comparison sessions and generalization probes. During baseline the
comparison score of correct literal comprehension questions for Sandra was 3.4 (range 2-
5). Her mean correct literal comprehension questions score for baseline generalization
was 4 (range 3-5). In baseline, her mean generalization score was 0.6 correct literal
comprehension questions higher than her comparison probe score.
During intervention Sandra’s mean correct literal comprehension questions score
was 4.6 (range 4-5). Her mean correct literal comprehension questions scores for
intervention generalization was 3.2 (range 2-5). In intervention, her mean generalization
score was 1.4 correct literal comprehension questions lower than her comparison probe
score.

123
During maintenance, Sandra’s correct literal comprehension questions
comparison score 5. Her correct literal comprehension questions score for maintenance
generalization was 4. In maintenance, her generalization score was 1 correct literal
comprehension question lower than her comparison probe score.
In comparing baseline, intervention, and maintenance correct literal
comprehension questions generalization scores, Sandra had an average of 0.8 fewer
correct literal comprehension questions during intervention generalization probes than
baseline generalization probes. Sandra’s correct literal comprehension questions were
highest on her baseline and maintenance generalization probes with scores of 4 on both.
Table 13 (page 121) displays Sandra’s maintenance performance. Maintenance
probes were taken 2-, 4-, and 6-weeks after the last intervention session. Sandra’s score
on her last day of intervention was 3 correct answers to literal comprehension questions.
She had maintenance scores of 5, 5, and 4, respectively. Overall in maintenance, Sandra
maintained between the 1 more than her comparison score with a score of 4 (week 6
probe) and 2 more questions answered correctly with scores of 5 (weeks 2 and 4 probes).
Sandra performed highest on her weeks 2 and 4 maintenance probes.
Gema
Figure 4 (page 117) displays Gema’s performance in literal comprehension
questions during baseline, repeated readings, generalization probes and maintenance
probes. During baseline, Gema’s mean number of correct answers to literal
comprehension questions was 3.3 (range 1-5). When repeated readings was introduced,
Gema’s mean number of correct answers to literal comprehension questions increased to
3.71 (range 2-5). Overall, Gema’s number of correct answers to literal comprehension

124
questions was highest during the repeated readings intervention, with an increase of 0.41
more correct answers over baseline. A summary of individual mean performance on
number of correct answers to literal comprehension questions can be found in Table 11
(page 118).
Table 12 (page 120) displays individual means for correct literal comprehension
questions in generalization probes. During baseline the comparison score of correct literal
comprehension questions for Gema was 3.17 (range 2-4). Her mean correct literal
comprehension questions score for baseline generalization was 3.83 (range 3-5). In
baseline, her mean generalization score was 0.66 correct literal comprehension questions
higher than her comparison probe score.
During intervention Gema’s mean correct literal comprehension questions score
was 5 (range 5-5). Her mean correct literal comprehension questions scores for
intervention generalization was 5 (range 5-5). In intervention, her mean generalization
score equal to her comparison probe score.
During maintenance, Gema’s correct literal comprehension questions comparison
score was 4. Her correct literal comprehension questions score for maintenance
generalization was 5. In maintenance, her generalization score was 1 correct literal
comprehension question higher than her comparison probe score.
In comparing baseline, intervention and maintenance correct literal
comprehension questions generalization scores, Gema had an average of 1.17 more
correct literal comprehension questions during intervention generalization probes than
baseline generalization probes. Gema’s correct literal comprehension questions were

125
highest on her intervention and maintenance generalization probes with a score of 5 on
both.
Table 13 (page 121) displays Gema’s maintenance performance. Maintenance
probes were taken 2-, 4-, and 6-weeks after the last intervention session. Gema’s last day
intervention score was 5 correct answers to literal comprehension questions. She had
maintenance scores of 4, 5, and 4 respectively. Overall in maintenance, Gema maintained
between one less than her comparison score with a score of 4 (weeks 2 and6 probes) and
the same number of questions answered correctly with a score of 5 (week 4 probe). Gema
performed highest on her week 4 maintenance probe.
Group Means for Correct Answers to Literal Comprehension Questions
Table 11 (page 118) displays group performance means in literal comprehension
questions during baseline and repeated readings. During baseline, the mean number of
correct answers to literal comprehension questions was 2.88 (range 1-5). When repeated
readings was introduced, the mean number of correct answers to literal comprehension
questions increased to 3.94 (range 2-5). Overall, the mean number of correct answers to
literal comprehension questions was highest during the repeated readings intervention,
with a mean increase of 1.21 more correct answers over baseline.
Table 12 (page 120) displays group means for correct literal comprehension
questions in comparison sessions and generalization probes. During baseline the
comparison score of correct literal comprehension questions for the group was 3.19
(range 1-5). The mean correct literal comprehension questions score for baseline
generalization was 3.63 (range 2-5). In baseline, the mean generalization score was 0.44
correct literal comprehension questions higher than their comparison probe score.

126
During intervention the group mean correct literal comprehension questions score
was 3.61 (range 2-5). The mean correct literal comprehension questions scores for
intervention generalization was 3.83 (range 2-5). In intervention, their mean
generalization score was 0.22 correct literal comprehension questions higher than the
comparison probe score.
During maintenance, the group mean correct literal comprehension questions
comparison score was 3.75 (range 3-5). The correct literal comprehension questions score
for maintenance generalization was 3.25 (range 2-5). In maintenance, the generalization
score was 0.50 correct literal comprehension questions lower than their comparison probe
score.
In comparing baseline, intervention and maintenance correct literal
comprehension questions generalization scores, the group had an average of 0.2 more
correct literal comprehension questions during intervention generalization probes than
baseline generalization probes. The group’s correct literal comprehension questions were
highest on their intervention generalization with a mean score of 3.83 (range 2-5).
Table 13 (page 121) displays the group’s maintenance performance. Maintenance
probes were taken 2-, 4-, and 6-weeks after the last intervention session. The group’s last
day mean intervention score was 4 correct answers to literal comprehension questions.
The group had mean maintenance scores of 3.75, 4.75, and 4.25 respectively. Overall in
maintenance, the group maintained between 0.25 fewer correct answers than their
comparison score of 4 (week 2 probe) and 0.75 more questions answered correctly with a
score of 4.75 (week 4 probe). The group performed highest on their week 4 maintenance
probes.

127
Summary
The results of this study indicate that the participants improved their reading
fluency, decreased the number of errors committed aloud, committed fewer of the five
types of errors, and improved their ability to answer literal comprehension questions
when using repeated readings to read passages of approximately 100 words as compared
to baseline.
Generalization data were mixed for the different dependent variables, however,
generalization means for intervention and maintenance consistently remained higher than
baseline generalization means. For fluency, generalization wpm scores were higher than
comparison probe scores in baseline and maintenance. For epm, generalization scores
indicated slightly more epm in generalization than comparison scores across baseline,
intervention, and maintenance conditions. For types of epm, more additions and
hesitations were committed during generalization probes thank comparison probes in
baseline, intervention, and maintenance. Additionally, there were more omissions and
mispronunciation errors in generalization probes following maintenance sessions. There
were fewer omissions, substitutions, and mispronunciations in generalization probes as
compared to comparison scores following baseline and intervention sessions. For correct
answers to literal comprehension questions, generalization probes were slightly higher in
baseline and intervention than comparison scores. However, in maintenance, the mean
generalization probe was slightly lower than the comparison score taken on the last day
of intervention.
Maintenance data for the different dependent variables demonstrated that the
maintenance means remained above baseline mean levels. When compared to baseline,

128
participants read more words per minute in maintenance probes. Additionally,
participants committed fewer errors in maintenance probes than in baseline. Participants,
on average, committed fewer omissions, fewer additions, fewer substitutions, and fewer
mispronunciations in maintenance probes than in baseline. However, they committed
more hesitations in maintenance than in baseline. Participants on average answered more
literal comprehension questions correctly in maintenance than in baseline.

129
CHAPTER V
DISCUSSION
This chapter provides a discussion on the results of this study. A brief study
overview is followed by a summary of the results with respect to relevant literature in
repeated readings. The study’s delimitations, limitations, implications for practice, and
suggestions for future research are also included.
This study examined the effects of repeated readings on the reading skills of four,
third-, fourth-, and fifth-grade English language learners (ELLs) with specific learning
disabilities (SLD). Data were collected and analyzed on a total of 58 baseline probes, 89
intervention sessions, 45 generalization sessions, and 12 maintenance reading sessions
across 4 participants and four dependent variables: reading fluency (words read aloud
correctly per minute; wpm), number of errors read aloud per minute (epm), types of
errors read aloud per minute, and the number of correctly answered literal comprehension
questions. Generalization probes were taken following 28.3% of all sessions.
Maintenance probes were taken 2-, 4-, and 6-weeks after the end of the study.
Although outcomes varied for individual participants, overall the results
demonstrated that repeated readings had a positive impact on participant reading skills as
measured by the dependent variables. Participant generalization scores were higher in
intervention than in baseline. Additionally, with the exception of the number of
hesitations committed per minute of reading, maintenance probes on the dependent
variables indicated that participant scores remained above baseline levels. A detailed

130
analysis of the results for each dependent variable, along with comparisons to previous
research follows.
Reading Fluency
With variation, all four participants read more words per minute during the
repeated readings intervention than during baseline. Tano, Luci, Sandra, and Gema read a
mean of 17.21, 30.48, 28.08, and 14.95 more wpm respectively in intervention than in
baseline.
These results support the work of Nelson et al. (2004), whose study demonstrated
that repeated readings assisted students with disabilities to read more fluently. In the
Nelson et al. study, participants read a mean of 19.67 more wpm when repeated readings
was introduced in an error correction treatment. In this study, participants read more wpm
when repeated readings were introduced, with a mean of 22.68 more wpm. Similarly,
Tam et al., (2006) found that repeated readings had a positive effect on reading fluency in
ELLs reading below grade level, with participants reading a mean of up to 37.8 more
wpm than baseline when they repeatedly read the same passage up to a previously
determined criterion.
When comparing generalization probes to comparison probes (the data point
taken the same days as the generalization probes), participant generalization scores
tended to be slightly higher than comparison scores in baseline and slightly lower than
comparison scores in intervention. However, with the exception of one data point,
participant generalization scores were higher in intervention than in baseline.
Maintenance scores showed high variability among all four participants. All four,
however, maintained more than 57% of their gains in intervention. When compared to

131
baseline, participants read a mean of 62.63% more wpm in maintenance sessions. Tano
and Luci had the highest maintenance scores. Tano and Gema, in their weeks 4 and 6
probes respectively both read slightly more wpm than in their last intervention sessions.
This variation may be due to an interest in the passage topic that day (Clark, 1995). It
may also be indicative of additional reading practice in the weeks following intervention.
In summary, the results suggest that for ELLs with SLD, repeated readings can
result in an increase reading fluency. While the method led to higher wpm in intervention
and generalization as compared to baseline, the percentage of generalization dropped
when the passages were read repeatedly. The results of this study also suggest that
repeated readings leads to some maintenance in reading fluency gains once the method is
not employed. Tam et al. (2006), also found that the higher level of fluency gained in
repeated readings interventions may have led to maintenance in fluency gains. In
contrast, Nelson et al. (2004) found that for three out of four participants, maintenance
scores were only slightly higher than baseline wpm scores.
Errors Per Minute
Participants committed fewer reading errors during the repeated readings
intervention than during baseline. The impact of the intervention, however, varied. All
four participants made fewer errors per minute when the repeated readings was
employed. Tano, Luci, Sandra, and Gema made a mean of 3.16, 4.04, 3.50, and 3.66
fewer errors per minute respectively in intervention than in baseline.
Generalization probes indicated that the number of participant errors remained
similar in comparison and generalization probes throughout the study. This indicates that
there was generalization from baseline to intervention in epm.

132
Maintenance scores showed variability among all four participants. Two
participants committed the same or fewer errors than on their last intervention session in
all three maintenance sessions. There was no other discernable pattern in the number of
errors committed on the last day of intervention in comparison with the number of errors
committed in maintenance probes. However, when compared to baseline, participants
read a mean of 61.56% fewer epm in maintenance. This is in contrast to Nelson et al.,
(2004), who found that epm were only slightly lower than baseline for all four
participants when previously read materials were used in the final condition of the study.
Given that overall there was a decrease in errors per minute with repeated
readings, the data suggest that this method has a positive effect on the number of errors
committed by ELLs with SLD. These results support the work of Nelson et al. (2004),
whose study demonstrated that repeated readings helped students with disabilities read
with fewer errors. Additionally, one previous study found that repeated readings had a
positive effect on errors per minute in ELLs reading below grade level (Tam et al., 2006).
The results of the study by Tam et al. (2006) and the current study found that the number
of epm decreased from baseline when repeated readings was implemented.
In summary, the results suggest that for ELLs with SLD, repeated readings should
be considered a strategy to decrease reading errors. The results of this study suggest that
when compared to baseline, repeated readings leads to maintenance in error reduction.
While repeated readings leads to lower error rates in intervention and generalization,
generalization in the area of epm needs to be further examined. Subsequently, the results
of this study should be viewed as preliminary.

133
Types of Errors Per Minute
Participants committed fewer reading errors during the repeated readings
intervention, however, the impact of the intervention on the types of errors committed per
minute varied. In this study, five types of errors were identified: omissions, additions,
substitutions, mispronunciations, and hesitations. The most affected reduction in errors
across all four participants from baseline to intervention occurred in the category of
mispronunciations. Tano, Luci, Sandra, and Gema decreased their number of
mispronunciations per minute by 2.71, 4.66, 2.41, and 3.5 respectively from baseline to
intervention. One participant (Tano) committed fewer of each type of error in
intervention as compared to baseline.
In comparing generalization probes to comparison scores there is a great deal of
variance (see Table 9, page 89). In the category of omissions, all four participants
committed the same number of omissions or fewer in intervention generalization probes
than comparison scores. In contrast, in the category of hesitations, all four participants
committed more hesitations in intervention generalization probes than in comparison
scores.
Maintenance scores showed high variability among all four participants. Only two
participants (Tano and Luci) demonstrated any consistency in maintenance of the
reduction in the types of errors committed per minute. Tano committed no hesitations in
his last session and remained consistent in all of his maintenance probes. Luci committed
no additions or hesitations in her last session and remained consistent in all of her
maintenance probes. However, on average maintenance scores indicated a reduction in
omissions, additions, substitutions, and mispronunciation when compared to baseline.

134
Taken cautiously, the results of this study indicate that for these four participants,
repeated readings led to a decrease in the number of mispronunciation errors committed
per minute. These results were not evident in generalization probes. While many studies
that have implemented a repeated readings intervention have clearly defined what
constituted an error, these studies did not record the number of each type of error
committed by participants (e.g., Alber-Morgan et al., 2007; Tam et al., 2006). No other
study was found that examined the effects of repeated readings on the types of errors
committed per minute. Subsequently, the results of this study should be viewed as
preliminary.
Correct Answers to Literal Comprehension Questions
Repeated readings led to an improvement in the number of literal comprehension
questions answered correctly for all four participants. Out of a total of five questions
asked, Tano, Luci, Sandra, and Gema answered a mean of 1.38, 1.78, 1.33, and 0.41 more
literal comprehension questions respectively during intervention than in baseline.
Results from generalization probes were varied. Only two participants had higher
generalization scores than comparison scores in baseline and in intervention. The
variation in generalization scores, as well as the fact that one participant answered all of
her questions correctly following several sessions may mean that more literal
comprehension questions are necessary in order to be able to draw further conclusions
about the effects of repeated reading on the number of correct literal comprehension
questions answered correctly.
Maintenance scores showed variability among all four participants. In
maintenance, two participants had maintenance scores that were the same or higher than

135
the comparison scores taken on the last day of intervention. The other two participants,
had maintenance scores that were the same or lower than their comparison scores.
Maintenance means were on average 47.06% above baseline means.
Given that overall performance improved in literal comprehension questions, the
data suggest that repeated readings has a positive effect on the ability of ELLs with SLD
to answer literal comprehension questions correctly. Similarly, Alber-Morgan et al.,
(2007) witnessed an immediate increase in the number of literal comprehension questions
answered correctly by three out of four students with behavior problems after
implementing a repeated readings intervention. Tam et al. (2006) asked four participants
literal comprehension questions during generalization probes and found that an increased
reading rate in participants following a repeated readings intervention may lead to an
increase in comprehension in taught and untaught passages.
In summary, the results suggest that for ELLs with SLD, repeated readings may
increase reading comprehension as measured by literal comprehension questions.
However, few studies have examined the effects of a repeated readings intervention on
the participants’ ability to answer literal comprehension questions, therefore these results
should be interpreted cautiously and viewed as preliminary.
Repeated Readings Summary
Overall, the results of this study lend further support to the limited research which
demonstrated that repeated readings has a positive impact on the reading abilities of
ELLs with SLD (Tam et al., 2006). In this study, when repeated readings was
implemented, participants read more words per minute, made fewer errors per minute,
and answered more literal comprehension questions correctly. Additionally, participants

136
committed fewer mispronunciation errors with repeated readings as compared to
baseline. Inconsequential results on the number of omissions, additions, substitutions, and
hesitations from baseline to intervention were observed. Generalization probes in
intervention were higher than generalization probes in baseline. Maintenance scores were
variable, however they were consistently stronger than baseline means.
The results of this study support the work of Tam et al., (2006) who suggests that
a structured reading intervention incorporating repeated readings has a positive effect on
reading fluency and comprehension on ELLs who are struggling readers. As no previous
research was found that specifically targeted ELLs with SLD, subsequently, no
connections to previous research can be made. The results of this study, however,
preliminarily suggest that repeated readings has a positive effect on the reading abilities
of ELLs with SLD.
This study extends the literature on the effects of repeated readings on ELLs with
SLD. Prior to this study, only one study was found that included participants who were
ELLs with SLD (Tam et al., 2006). Additionally, this limited research was conducted
with only two of the four participants being labeled as ELLs with SLD struggling with
reaing and one of those two was actually found to be reading at grade level during the
course of the study. This study added to the literature by providing an analysis of the
types of errors participants made in every phase of the study. Previous research had
defined what constituted an error but had not reported on the different types of errors
participants were making. This study extends the literature in that it was conducted in a
large urban school district with Hispanic students whereas previous studies were
conducted in a rural school district with students who were not identified as ELLs

137
(Nelson et al., 2004) and with ELLs from varying ethnic backgrounds (Tam et al., 2007).
This study also extended the literature in that it examined the effects of repeated readings
on participants’ ability to answer literal comprehension questions correctly. Many
previous research studies only explored the effects of repeated readings on fluency and
few have examined its effects on comprehension (Alber-Morgan et al., 2007; Tam et al.,
2006).
Implications for Practice
The results of this study have important implications for classroom practice. The
methods used in this study are effective in improving reading and can be a valuable
supplemental reading instruction for teachers to employ with their students who are ELLs
with SLD. Additionally, it is cost efficient and easy to implement. Teachers may
implement this method one on one or with a small group of students, or they may train
paraprofessionals, volunteers, or competent students to do it (Alber-Morgan et al., 2007).
Parents can also be taught to repeatedly read short passages with their children at home.
The results of this study may also have implications for how instructional reading
time is used. This study used 10-20 minute reading sessions in which gains in fluency
were noted as soon as repeated readings were introduced. Teachers may want to assign
shorter passages to ELLs with SLD to allow for repeated readings during class time.
Additionally, teachers may encourage students to repeatedly read a passage before
attempting reading assessments and may therefore extend time for those assessments if
possible.
Previous research has shown that ELLs and students with SLD benefit from
interventions that include vocabulary instruction (Fitzgerald, 1995; Gersten & Baker,

138
2000; Tam et al., 2006), repeated readings (Chard et al., 2002; Nelson et al., 2004;
Therrien & Kubina, 2006; Weinstein & Cooke, 1992), and individual attention (Elbaum
et al., 2000). The current study used an intervention method that encompassed those
elements resulting in improved reading fluency, reduced reading errors, and an
improvement in the overall number of comprehension questions answered correctly in
four ELLs with SLD. These results further stress the need for structured research based
interventions to be used with students who are struggling with reading in general, and
ELLs with SLD in particular.
Only one previous study collected generalization and maintenance data in
conjunction with a repeated readings intervention. Tam et al. (2006) collected
comprehension data during generality probes, however, the probes did not require the
participants to read aloud, therefore, fluency was not measured. This study added to those
findings by collecting generalization data on all of the dependent variable measured in
the study. Tam et al. also collected maintenance data following the conclusion of their
study. Similar to the present study, Tam et al. found that the fluency reached in
intervention might lead to greater fluency once the intervention is withdrawn. The present
study’s findings further stress the need to examine the effects that repeated readings have
on the maintenance and generalization of reading gains in ELLs with SLD.
Delimitations
The sample size used in single subject design research is small by the nature of
the design and therefore limits the generalization of its findings. In order to determine the
effects of repeated readings on the reading skills of ELLs with SLD direct and systematic
replications are needed. For example, this study included only third-, fourth-, and fifth-

139
grade, Hispanic ELLs labeled as SLD. Therefore the results cannot be generalized to non-
Hispanic participants at other grade levels, or with other abilities or disabilities.
The present study was delimited to passages that were previously prepared from a
basal reading series. If the student did not connect to the reading passage, it is possible
that his or her participation was negatively impacted. While they were of the same
readability level, the passages had a variety of topics and were written by various authors.
This being said, no participant expressed a preference or distaste of any passage.
An additional delimitation was that participants in this study were participating
during the course of a normal school day. Participants were pulled from their classrooms
during a period in their schedule when they were participating in silent reading with the
exception of one student who was participating during homeroom. Although each student
had his or her session at the same time every day, sessions sometimes occurred at
moments when the students either wanted to or did not want to leave the classroom.
Though notes were recorded whenever a student verbalized feelings of wanting to go or
not go to the session, data were not collected on this. This may have had effects on the
participants’ performances.
Limitations
Several study limitations should be noted. Though participants met with the
researcher prior to the start of the study, both the researcher and the scenario of receiving
additional reading practice during the day were novel to all four participants. Given this,
it may have taken some time for the participants to get comfortable with the researcher.
Also, the additional adult attention allotted by the intervention may have impacted the
results. Time constraints (along with a review of the data) needed to be taken into

140
consideration in determining when to implement some of the phases. Specifically, Gema
only had 7 days of intervention sessions. Had time not been an issue, Gema’s intervention
phase may have been extended until more stability was observed. While Gema’s limited
exposure to the intervention may be a limitation to the study, her prolonged baseline
phase actually demonstrates the strength of the intervention. Gema’s performance in
baseline remained steady, even as she was receiving reading instruction in the classroom.
She made gains in fluency once the intervention was introduced just as the other
participants who had a shorter baseline phase.
Another limitation of this study is that previous and daily reading instruction may
have impacted participants’ performance. The participants in this study received daily
reading instruction in three separate settings from six different teachers. Though the
teachers followed a designated curriculum, the content and quality of the teaching was
not observed. Control and/or an analysis of the reading instruction participants received
during the study may have impacted the effects of the interventions, however relatively
stable baseline data gave the researcher confidence in the intervention’s effectiveness. It
would have been useful to have classroom daily reading instruction data to further
interpret the results.
Suggestions for Future Research
The results of this study suggest several areas for future research. The
demographic characteristics of the participants that took part in this study were restricted
to third-, fourth-, and fifth-grade, Hispanic ELLs who were labeled as having an SLD.
Participants with other demographic characteristics should be considered in future
research such as non-Hispanic ELLs, native English speakers, students differing in

141
abilities and disabilities, and students at different grade levels. Additionally, future
research can examine how many repeated readings are optimal for ELLs with SLD and
whether reading to a set number of words per minute leads to higher reading gains.
Future research should monitor the reading instruction taking place in the
classroom during the study to determine if it impacts the effects of repeated readings.
Further investigation should also investigate the effects of repeated readings alone and/or
in combination with other research based practices such as having students read with a
competent peer tutor (Chard et al., 2002), or having students track their own progress
(Tam et al., 2007). Additionally, different forms of error correction can be employed with
repeated readings such as phrase drill error correction (Begeny et al., 2006) or systematic
error correction (Nelson et al., 2004).
Although outcomes have varied for individual participants, data demonstrate that
repeated readings have had a positive impact on participant reading skills as measured by
the dependent variables. The results suggest that for ELLs with SLD, repeated readings
increased reading fluency, decreased the number of errors, and increased the number of
correct literal comprehension questions related to the reading.
This study examined the use of repeated readings and students who were ELLs
with SLD; however, there is a need for additional research. No known previous study has
specifically targeted ELLs with SLD who are struggling readers using the methods in this
study. The sample size is small by the nature of the design and therefore limits the
generalization of its findings. Additional research may focus on ELLs with SLD from
non-Hispanic backgrounds. Although this study targeted students reading at least 1 year
below grade level, future studies could examine ELLs with SLD at various stages of

142
reading acquisition and various stages of their English language acquisition. Additionally,
more research is needed in the area of repeated readings and the number of readings that
is optimal for ELLs with SLD.
Summary
The results of this study suggest that repeated readings has a positive impact on
the reading abilities of ELLs with SLD. Reading fluency, number of errors read aloud per
minute, and literal comprehension question results demonstrated that participants read
more words, made fewer errors, and obtained higher literal comprehension question
scores when repeated readings was employed. Additionally, participants made fewer
mispronunciation errors once repeated readings were introduced.
Participants read passages in their instructional reading level one time during
baseline and three times repeatedly in intervention. The sessions were recorded and
recordings were analyzed across four dependent variables: reading fluency (words read
aloud correctly per minute), number of errors read aloud per minute, types of errors read
aloud per minute, and the number of correctly answered literal comprehension questions.
Generalization probes were taken and compared to comparison scores. Maintenance
probes were taken 2-, 4-, and 6-weeks after the end of the study.
Reading fluency results showed that participants in read more words per minute
when repeated readings were introduced. Additionally, generalization wpm scores in
intervention and maintenance wpm scores remained higher than baseline wpm scores.
Results in epm indicate that participants made fewer errors when repeated
readings was introduced. The generalization probes indicated that error rates did not

143
return to baseline levels on similar untaught passages. Maintenance data in epm was
varied but epm means remained lower than mean baseline levels.
Results in types of epm indicate that participants made fewer mispronunciation
errors when repeated readings was introduced. The generalization probes in types of epm
was varied; no discernable pattern could be detected. In maintenance, participants
committed on average fewer omission errors, addition errors, substitution errors, and
mispronunciation errors than in baseline.
The results in correct answers to literal comprehension questions showed that
participants answered more literal comprehension questions correctly when repeated
readings were introduced. Generalization data were varied, and may have been affected
by the fact that only five questions were asked per passage, creating a ceiling effect.
Maintenance scores were varied, however participant scores remained above baseline
means.
The overall results of this study suggest that repeated readings could assist ELLs
with SLD who are struggling with reading in English with improving their reading skills.
This study adds to the limited research on ELLs with SLD by demonstrating the effects
of repeated readings on this population, as well as, by conducting an analysis of the types
of errors these students committed when reading aloud. Additionally, it examined
generalization and maintenance data, which has not been measured in most repeated
readings research. This study lends further support for the use of a structured
supplemental reading instruction program employing repeated readings with ELLs with
SLD who are struggling with reading in English.

144
Since this study explored the effects of repeated readings on third-, fourth-, and
fifth-grade Hispanic ELLs in ESOL levels III, IV, and V, with SLD, results cannot be
generalized beyond this population. Future research should explore its efficacy with
diverse participant populations. Furthermore, future research can investigate the effects of
repeated readings on ELLs with SLD at different stages of reading acquisition. This study
determined that repeated readings can have positive effects on the reading skills of ELLs
with SLD and therefore should be considered as a tool to assist these students in
improving their reading abilities.

145
REFERENCES
Abidin, R. R., & Robinson, L. L. (2002). Stress, biases, or professionalism: What drives
teachers' referral judgments of students with challenging behaviors? Journal of
Emotional and Behavioral Disorders, 10, 204-212.
Alber-Morgan, S. R., Ramp, E. M., Anderson, L. L., & Martin, C. M. (2007). Effects of
repeated readings, error correction, and performance feedback on the fluency and
comprehension of middle school students with behavior problems. The Journal of
Special Education, 41, 17-30.
Albus, D., Thurlow, M., & Clapper, A. (2007). Standards-based instructional strategies
for English language learners with disabilities. (ERIC Document Reproduction
Service No. ED499409)
American College Testing Program. (2006). Ready for college and ready for work: Same
or different? Retrieved February 1, 2008, from http://www.act.org/research/
policymakers/reports/workready.html
Barbetta, P. M., Heward, W. L., & Bradley, D.M. (1993). Relative effects of whole-word
and phonetic-prompt error correction on the acquisition and maintenance of sight
words by students with developmental disabilities. Journal of Applied Behavior
Analysis, 26, 99-110.
Barley, Z., Lauer, P. A., Arens, S. A., Apthorp, H. A., Englert, K. S., Snow, D., et al.
(2002). Helping at-risk students meet standards: A synthesis of evidence-based
classroom practices. Aurora, CO: Mid-Continent Research for Education and
Learning.
Barton, K. E., & Huynh, H. (2003). Patterns of errors made by students with disabilities
on a reading test with oral reading administration. Educational and Psychological
Measurement, 63, 602-614.
Begeny, J. C., Daly, E. J., III, & Valleley, R. J. (2006). Improving oral reading fluency
through response opportunities: A comparison of phrase drill error correction with
repeated readings. Journal of Behavioral Education, 15(4), 229-235.
Bernhard, J. K., Cummins, J., Campoy, F. I., Ada, A. F., Winsler, A., & Bleiker, C.
(2006). Identity texts and literacy development among preschool English
language learners: Enhancing learning opportunities for children at risk for
learning disabilities. Teachers College Record, 108, 2380-2405.
146
Boulineau, T., Fore, C., Hagan-Burke, S., & Burke, M.D. (2004). Use of story-mapping
to increase the story-grammar text comprehension of elementary students with
learning disabilities. Learning Disability Quarterly, 27, 105.
Brisk, M.E. & Harrington, M.M. (2000). Literacy and bilingualism: A handbook for all
teachers. Mahwah, NJ: Lawrence Elbaum Associates Publishing.
Brown, B. V., & Bogard, K. (2007). Pre-kindergarten to 3rd grade (PK-3) school-based
resources and third grade outcomes. Retrieved February 1, 2008, from
http://www.childtrendsdatabank.org/PDF/PKtoThree.pdf
Bryant, D.P., Vaughn, S., Linan-Thompson, S., Ugel, N., Hamff, A., & Hougen, M.
(2000). Reading outcomes for students with and without reading disabilities in
general education middle-school content area classes. Learning Disability
Quarterly, 23, 238-252.
Case, R. E., & Taylor, S.S. (2005). Language difference or learning disability? Answers
from a linguistic perspective. The Clearing House, 78, 127.
Chard, D. J., Vaughn, S., & Tyler, B. (2002). A synthesis of research on effective
interventions for building reading fluency with elementary students with learning
disabilities. Journal of Learning Disabilities, 35, 386-406.
Clark, C.H. (1995). Teaching students about reading: A fluency example. Reading
Horizons 35, 250-266.
Cooper, J., Heron, T., & Heward, W. (2007). Applied behavior analysis (2nd
ed.). Upper
Saddle River, NJ: Pearson/Merrill-Prentice Hall.
Dade County Board of Public Instruction. (1978). Oral language proficiency scale.
(ERIC Document Reproduction Service No. ED179566)
Denton, C. A., Anthony, J. L., Parker, R., & Hasbrouck, J.E. (2004). Effects of two
tutoring programs on the English reading development of Spanish-English
bilingual students. The Elementary School Journal, 104, 289.
Dictionary.com. (2008). Retrieved March 14, 2008, from http://dictionary.reference.com/
search?r=2&q=Mispronunciation
Elbaum, B., Vaughn, S., Hughes, M. T., & Moody, S. W. (2000). How effective are one-
to-one tutoring programs in reading for elementary students at risk for reading
failure? A meta-analysis of the intervention research. Journal of Educational
Psychology, 92, 605-619.

147
Florida Department of Education. (2006-2007). Florida School Indicators Report.
Retrieved February 1, 2008, from http://data.fldoe.org/fsir/default.cfm
Florida Department of Education. (2008). Florida comprehensive assessment test:
Student performance results demographic report, 2000-2007. Retrieved February
1, 2008, from http://www.fcatresults.com/demog/
Fitzgerald, J. (1995). English-as-a-second-language learners' cognitive reading processes:
A review of research in the United States. Review of Educational Research, 65,
145-190.
Freeland, J. T., Skinner, C. H., Jackson, B., McDaniel, C. E., & Smith, S. (2000).
Measuring and increasing silent reading comprehension rates: Empirically
validating a repeated readings intervention. Psychology in the Schools, 37, 415-
429.
Fry, E., Fountoukidis, D., & Polk, J. (1985). The new reading teacher’s book of lists (2nd
ed.). Englewood Cliffs, NJ: Prentice-Hall.
Fry, R. (2007). How far behind in math and reading are English language learners.
Retrieved February 1, 2008, from http://pewhispanic.org/reports/
report.php?ReportID=76
Gersten, R., & Baker, S. (2000). What we know about effective instructional practices for
English-language learners. Exceptional Children, 66, 454-470.
Gersten, R., Fuchs, L. S., Williams, J.P., & Baker, S. (2001). Teaching reading
comprehension strategies to students with learning disabilities: A review of
research. Review of Educational Research, 71, 279-320.
Gersten, R., & Woodward, J. (1994). The language-minority student and special
education: Issues, trends, and paradoxes. Exceptional Children, 60, 310-322.
Good, R. H., & Kaminski, R. A. (Eds.). (2002). Dynamic indicators of basic early
literacy skills: DIBELS (6th ed.). Eugene, OR: Institute for Development of
Educational Achievement.
Hitchcock, C. H., Prater, M. A., & Dowrick, P. W. (2004). Reading comprehension and
fluency: Examining the effects of tutoring and video self-modeling on first-grade
students with reading difficulties. Learning Disability Quarterly, 27, 89-103.
Krashen, S. D., & Terrell, T. D. (1983). The natural approach: Language acquisition in
the classroom. (ERIC Document Reproduction Service No. ED230069)

148
LaBerge, D. & Samuels, S. J. (1974). Toward a theory of automatic information
processing in reading. Cognitive Psychology, 6, 293-323.
Lazarus, D., & Callahan, T. (2000). Attitudes toward reading expressed by elementary
school students diagnosed with learning disabilities. Reading Psychology, 21,
271-282.
Linan-Thompson, S., Vaughn, S., Hickman-Davis, P., & Kouzekanani, K. (2003).
Effectiveness of supplemental reading instruction for second-grade English
language learners with reading difficulties. Elementary School Journal, 103, 221-
238.
Manset-Williamson, G., & Nelson, J. M. (2005). Balanced, strategic reading instruction
for upper-elementary and middle school students with reading disabilities: A
comparative study of two approaches. Learning Disability Quarterly, 28, 59-74.
McCardle, P., Mele-McCarthy, J., & Leos, K. (2005). English language learners and
learning disabilities: Research agenda and implications for practice. Learning
Disabilities Research & Practice, 20, 68-78.
Miami-Dade County Public Schools. (2005). Guide to completing an individual LEP
student plan: Elementary. Retrieved March 14, 2008, from
http://bilingual.dadeschools.net/BEWL/pdf/Individual_LEP_Plan.pdf
Miami-Dade County Public Schools (2006). 2006-07 District and School Profiles.
Retrieved March 14, 2008, from http://oada.dadeschools.net/DSProfiles/
0607Profiles.asp
Miami-Dade County Public Schools (2007). Policies and procedures for the provision of
specially designed instruction and related services for exceptional students.
Retrieved March 14, 2008, from http://ehandbooks.dadeschools.net/policies/
149.pdf
Nathan, R. G., & Stanovich, K. E. (1991). The causes and consequences of differences in
reading fluency. Theory into Practice, 30, 176-184.
Nelson, J. S., Alber, S. R., & Gordy, A. (2004). Effects of systematic error correction and
repeated readings on the reading accuracy and proficiency of second-graders with
disabilities. Education & Treatment of Children, 27, 186-198.
Osborn, J., Freeman, A., Burley, M., Wilson, R., Jones, E., & Rychener, S. (2007). Effect
of tutoring on reading achievement for students with cognitive disabilities,
specific learning disabilities, and students receiving Title I services. Education &
Training in Developmental Disabilities, 42, 467-474.

149
Pattillo, S. T., Heller, K. W., & Smith, M. (2004). The impact of a modified repeated-
reading strategy paired with optical character recognition on the reading rates of
students with visual impairments. Journal of Visual Impairment and Blindness,
98, 28-46.
Pressley, M., Gaskins, I., & Fingeret, L. (2006). Instruction and development of reading
fluency in struggling readers. In S.J. Samuels & A.E. Farstrup (Eds.), What
research has to say about fluency instruction (pp.47-69). Newark, DE:
International Reading Association.
Pugh, K. R., Sandak, R., Frost, S. J., Moore, D., & Mencl, W. E. (2005). Examining
reading development and reading disability in English language learners:
Potential contributions from functional neuroimaging. Learning Disabilities
Research and Practice, 20, 24-30.
Rasinski, T. V. (2000). Speed does matter in reading. Reading Teacher, 54, 146-151.
Roswell, F.G., Chall, J.S., Curtis, M.E., & Kearns, G. (2005). Diagnostic assessment of
reading. Rolling Meadows, IL: Riverside Publishing.
Samuels, S. J. (1979). The method of repeated readings. The Reading Teacher, 32, 403-
408.
Samuels, S. J., & Flor, R. F. (1997). The importance of automaticity for developing
expertise in reading. Reading and Writing Quarterly, 13, 107-121.
Snow, C. E., Burns, M. S., & Griffin, P (Eds.). (1998). Preventing reading difficulties in
young children. Washington, DC: National Academy Press.
Stahl, S. A., & Heubach, K. M. (2005). Fluency-oriented reading instruction. Journal of
Literacy Research, 37, 25-60.
Stoddard, K., Valcante, G., Sindelar, P. T., O'Shea, L., & Algozzine, B. (1993).
Increasing reading rate and comprehension: The effects of repeated readings,
sentence segmentation, and intonation training. Reading Research and
Instruction, 32, 53-65.
Stokes, T. F., & Baer, D. M. (1977). An implicit technology of generalization. Journal of
Applied Behavior Analysis, 10, 349-367.
Tam, K. Y., Heward, W. L., & Heng, M. A. (2006). A reading instruction intervention
program for English-language learners who are struggling readers. The Journal of
Special Education, 40, 79-93.

150
Therrien, W. J., & Kubina, R. M. (2006). Developing reading fluency with repeated
reading. Intervention in School & Clinic, 41, 156-160.
Therrien, W. J., Wickstrom, K., & Jones, K. (2006). Effect of a combined repeated
reading and question generation intervention on reading achievement. Learning
Disabilities Research & Practice, 21, 89-97.
U.S. Department of Education (2003). National symposium on learning disabilities in
English language learners. Retrieved February 13, 2008, from
http://www.ncela.gwu.edu/oela/2003symposium_proceedings.pdf
U.S. Department of Education. (2004). IDEA regulations: Identification of specific
learning disabilities. Retrieved February 13, 2008, from http://idea.ed.gov/
explore/view/p/%2Croot%2Cdynamic%2CTopicalBrief%2C23%2C
U.S. Department of Education. (2005a). Biennial report to Congress. Retrieved February
13, 2008, from http://ies.ed.gov/doc/biennialrpt05.doc
U.S. Department of Education. (2005b). Institute of Education Sciences, National Center
for Education Statistics, Long term trends: Reading. Retrieved February 13, 2008,
from http://nces.ed.gov/nationsreportcard/ltt/results2004
Valencia, S. W., & Pearson, P. D. (1986). Reading assessment: Time for a change. The
Reading Teacher, 40, 726-732.
Weinstein, G., & Cooke, N. L. (1992). The effects of two repeated reading interventions
on generalization of fluency. Learning Disability Quarterly, 15, 21-28.
Woodcock, R.W., Mather, N., & Shrank, K.S. (2001). Woodcock-Johnson III diagnostic
reading battery (3rd
ed.). Rolling Meadows, IL: Riverside Publishing.
Woods, M., & Moe, A. (2006). Analytical reading inventory (8th ed.). Upper Saddle
River, NJ: Prentice Hall.

151
APPENDIX A
PARENT/GUARDIAN CONSENT FORM

152
CONSENT TO PARTICIPATE IN A RESEARCH STUDY
Your child, __________, is being considered for participation in a research study. The investigator of this
study is Katrina Gonzalez Landa and she is a student at Florida International University (FIU). The study
will involve students who are English Language Learners who are identified as having Specific Learning
Disabilities who are reading below grade level. Your child’s participation will require 20 minutes of his or
her regular tutoring time.
If you permit your child to be a part of the study, we will integrate the activities into the first 20 minutes of
his or her regularly scheduled tutoring time. The research method is similar to what is done during a regular
tutoring session. It involves reading a short passage and answering questions about the passage. The
exception will be that the researcher will be collecting data on how many words per minute your child
reads and how many questions he or she answers correctly at the end of each 20 minute session. The
researcher does not expect any harm to your child by being in the study. If he or she becomes frustrated or
upset at any point in the study he or she may ask to take a break. You may withdraw your child from the
study at any time if you feel in any way uncomfortable. There is no cost to you for your child’s
participation in the study. This study will provide him or her with additional reading assistance.
The data collected will be identified by a random letter only and not your child’s name. All of the
information is private and will not be shared with anyone unless required by law. The data will be
presented in a graph like table. Your child may ask questions at any time. If you choose not to allow your
child to participate no one will be upset with you.
If you would like more information about the research, you may contact Katrina G. Landa at (305) 778-
3771. You may also contact the faculty advisor at FIU, Dr. Patricia Barbetta at (305) 348-2552. If you
would like to ask someone about being a subject in this study you may contact Dr. Patricia Price, the
Chairperson of the FIU Institutional Review Board at 305-348-2618 or 305-348-2494.
Thank you for your time.
Katrina Gonzalez Landa
Florida International University
If you have had all of your questions answered to your liking and you would like to be in the study, sign
below. Your signature indicates that you will allow/deny your child participate in the in the study.
I give permission for __________________________ to participate in this study. (Print Child’s Name)
______________________________________ __________________ Signature of Parent/Guardian Date
I do not give permission for __________________________ to participate in this study. (Print Child’s Name)
______________________________________ __________________ Signature of Parent/Guardian Date

153
CONSENTIMIENTO PARA TOMAR PARTE EN UN ESTUDIO DE INVESTIGACION
Su hijo(a), ____________, ha sido tomado(a) en consideracion para participar en un estudio de
investigacion. La investigadora de este estudio es Katrina G. Landa, quien es una estudiante al nivel
doctoral en la Universidad Internacional de la Florida (FIU). El enfoque del estudio es de estudiantes
bilingues que leen por debajo de sus respectivos grados escolares. La participación de su hijo(a) abarcara
20 minutos diarios que estan incluidos en sus sesiones regulares de ensenanza suplementaria.
Si usted permite que su hijo(a) participe en este estudio, integraremos las actividades del estudio en los
primeros 20 minutos de sus clases suplementarias. El método de investigación incluye una lectura corta y
preguntas acerca del tema repasado durante la lectura. La unica diferencia implementa supervicion por la
investigadora cuya tarea será reunir data acerca del numero de palabras leidas por minuto por su hijo(a) y el
numero de preguntas contestadas correctamente a la conclusion de cada sesion. La investigadora de este
estudio no espera que ningun dano resulte contra su hijo(a) durante el transcurso del estudio Si su hijo(a) se
encuentra incomodo(a) durante el lapso del estudio, el/ella podra disculparse de su participacion hasta que
el/ella determine apropiado resumir su actividad. Usted puede retirar a su hijo(a) del estudio en cualquier
momento si usted lo determina apropiado por cualquier razon. La participacion de su hijo(a) en este estudio
resultara en ningun costo de su parte. Este estudio esta disenado con el proposito de proveer ayuda
adicional en la lectura de su hijo(a).
La identidad de su hijo(a) se mantendra estrictamente confidencial y solamente representada por una letra
asignado en este estudio de investigacion. Toda la información es completamente privada y no será
compartida con terceras personas al menos que sea requerido por la ley. Los datos adquiridos en el estudio
serán presentados en una forma gráfica y cientifica. Si por alguna razon usted decide no dejar la
participacion de su hijo(a) en este estudio de investigacion, tenga en cuenta que no habra ningun tipo de
consecuencias negativas o perjudicaciones para su hijo(a).
Si ha usted le gustaria más información acerca de este estudio de investigación, puede llamar a Katrina
Gonzalez Landa al (305) 778-3771, o a la Dra. Patricia Barbetta al (305) 348-2552, a su conveniencia. Si a
usted le gustaria adquirir mas informacion acerca de este estudio incluyendo la participacion de su hijo(a)
puede comunicarse con la directora de los estudios sancionados por el Institutional Review Board (IRB), la
Dra. Patricia Price, al (305) 348-2618 o al (305) 348-2494.
Gracias por su atencion.
Katrina Gonzalez Landa, Florida International University
Si usted se encuentra satisfecho(a) con el contenido de este concentimineto y todas sus preguntas han sido
adecuadamente contestadas y esta de acuerdo en la participacion de su hijo(a) en este estudio de
investigacion por favor tome el tiempo de firmar en la linea de abajo. Su firma tambien indica que usted
permitirá a su hijo(a) en participar en el estudio.
Yo doy permiso para __________________________ que participle en el estudio. (Imprimir nombre del niño/a)
______________________________________ __________________ Firma del Padre/Tutor Fecha
Yo NO doy permiso para __________________________ que participle en el estudio. (Imprimir nombre del niño/a)
______________________________________ __________________ Firma del Padre/Tutor Fecha

154
APPENDIX B
PARTICIPANT ASSENT FORM

155
ASSENT TO PARTICIPATE IN A RESEARCH STUDY
Title: Effects of Repeated Readings on Reading Abilities of English Language Learners
with Specific Learning Disabilities.
My name is Katrina Gonzalez Landa and I am a student at Florida International
University (FIU). You and some of your classmates are being asked to participate in a
research study. This study will look at whether reading something one time or three times
helps you to read it faster and understand it better. Being part of this study will give you a
chance to practice your reading with me as your tutor.
Your parent/guardian must give you permission to take part in the study. If you do take
part, you will be meeting with me for 10 to 20 minutes a day. We will meet in school.
1. You will read a short passage one time or three times.
2. You will answer questions about the passage.
3. I will record the reading and questions.
4. I will listen to the recordings. This will help me count how many words you have
read and how many questions you are answering correctly.
There is no charge for being a part of this study. Reading the passages will not harm you
in any way. If you get tired or upset, you may ask for a break. I only want you to do your
best. Taking part in this study will not help or hurt your grades. You or your parent can
ask to stop taking part in the study at any time.
None of the information I collect will have your name on it. Only I will know which ones
are your scores. I will write about them in my research paper using a letter (such as
student “A”). If you choose not to take part no one will be upset with you.
If you have any questions you can ask anytime. You and your parents may contact me at
(305) 778-3771. You may also contact my teacher at FIU, Dr. Patricia Barbetta at (305)
348-2552. If you or your parent feels that you are not being treated fairly in this study,
you may contact Dr. Patricia Price, the Chairperson of the FIU Institutional Review
Board at 305-348-2618 or 305-348-2494.
If you would like to be in the study, sign below. You will get a copy of this form.
_____________________________ _________________________
Sign Here Date
_____________________________ _________________________
Investigator: Katrina G. Landa Date

156
APPENDIX C
HOME LANGUAGE SURVEY

157
Home Language Survey

158
APPENDIX D
TREATMENT FIDELITY FORM

159
Treatment Fidelity Form
Participant Identification Number: ____________________________
Observer Filling Out This Form: ___________________________
Date of Session: ______ Time: _________
Phase of Study: (Check One)
_____ Baseline _____ Maintenance
_____ Intervention _____ Generalization
Date Of Completion Of This Form: _______ Time: _________
Passage #: _____ Passage Topic: ________________________
Directions: Check off whether the researcher performs the following tasks.
Implemented
Description of Procedure
N/
A
Yes No
1. The researcher asks the participant: “Can you read the word on the
card?”
2. (If participant cannot read the word) The researcher states the word
3. The researcher asks the participant “Can you use the word in a
sentence?”
4. If the participant can use the word in a sentence, the researcher says
“correct.”
5. After stating that the participant is correct the researcher moves on to the
next word.
6. (If the participant cannot use the word in a sentence) The researcher
reads the definition from the back of the card.
7. The researcher asks the participant to use the word in a sentence.
8. (If the participant cannot use the word in a sentence) The researcher uses
the word in a sentence.
9. The researcher tells the participant to read the passage.
10. During this initial reading, when the participant makes an error, the
researcher immediately states the word correctly.

160
11. The researcher prompts the participant to repeat the word aloud.
12. (After the participant repeats the word) The researcher prompts the
participant to repeat the sentence containing the word.
13. Following the initial reading of the passage, the researcher prompts the
participant to read each word read incorrectly in isolation.
14. The researcher prompts the participant to read the passage a second time
from the beginning (Intervention Only).
15. The researcher prompts the participant to read the passage a third time
from the beginning (Intervention Only).
16. The researcher prompts the participant to read the passage again from the
beginning for one minute for the fluency assessment.
17. (After the fluency assessment) The researcher asks the participant the
first literal comprehension question.
18. The researcher gives the participant five seconds to respond.
19. (If Question is answered correctly) Researcher says “Yes.”
(If Question is NOT answered correctly) Researcher says “No,” and
states the correct answer.
20. The researcher asks the participant the second literal comprehension
question.
21. The researcher gives the participant five seconds to respond.
22. (If Question is answered correctly) Researcher says “Yes.”
(If Question is NOT answered correctly) Researcher says “No,” and
states the correct answer.
23. The researcher asks the participant the third literal comprehension
question.
24. The researcher gives the participant five seconds to respond.
25. (If Question is answered correctly) Researcher says “Yes.”
(If Question is NOT answered correctly) Researcher says “No,” and
states the correct answer.
26. The researcher asks the participant the fourth literal comprehension
question.
27. The researcher gives the participant five seconds to respond.
28. (If Question is answered correctly) Researcher says “Yes.”
(If Question is NOT answered correctly) Researcher says “No,” and
states the correct answer.

161
29. The researcher asks the participant the fifth literal comprehension
question.
30. The researcher gives the participant five seconds to respond.
31. (If Question is answered correctly) Researcher says “Yes.”
(If Question is NOT answered correctly) Researcher says “No,” and
states the correct answer.
32. The researcher issues a closing statement in which she commends the
participant for working hard during the session.
Additional Comments:
_______________________________________________________________________
_______________________________________________________________________
_______________________________________________________________________
_______________________________________________________________________
_______________________________________________________________________

162
APPENDIX E
INTEROBSERVER AGREEMENT FORM

163
Inter-Observer Agreement (IOA) Form
Participant Identification Letter: ____________________________
Passage #: ___ Passage Topic: ____________ Session Date: ____________
Directions: This sheet compares the data collected by the researcher with the data
collected by the second observer. Using the data sheets independently completed
by the researcher and the observer, do a word for word comparison of their marks
in each of the following three categories.
Fluency Assessment
# of words agreed: ____________
# of words disagreed: __________
# Agreements ___ ÷ # Agreements ___+ # Disagreements ____ 100 = ____ % IOA
Errors Per Minute
# of errors agreed: ____________
# of errors disagreed: __________
# Agreements ___ ÷ # Agreements ___+ # Disagreements ____ 100 = ____ % IOA
Types of Errors
# of errors agreed: ____________
# of errors disagreed: __________
# Agreements ___ ÷ # Agreements ___+ # Disagreements ____ 100 = ____ % IOA
Literal Comprehension Question Assessment
# of questions agreed: ____________
# of questions disagreed: __________
# Agreements ___ ÷ # Agreements ___+ # Disagreements ____ 100 = ____ % IOA
TOTAL
Number of Agreements: _________
Number of Disagreements: _______
# Agreements ___ ÷ # Agreements ___+ # Disagreements ____ 100 = ____ % IOA

164
APPENDIX F
DATA COLLECTION FORM

165
Data Collection Form
Participant Identification Letter: ____
Person Completing This Form (Check One):
_____ Researcher _____ Second Observer, Name: ____________________
Session Date: ________________ Time: _________
Study Phase: (Check One)
_____ Baseline _____ Maintenance
_____ Intervention _____ Generalization
Date of Completion of This Form: ________________ Time: _________
Types of Errors
Directions: Directly on the passage below mark each error in reading with a slash (/).
Above each slash, use the following abbreviations to identify the type of error. Place a
slash with the word STOP above it in order to identify where the student stopped reading
at one minute.
O- Omission
A- Addition
M- Mispronunciation
S- Substitution
H- Hesitation more than 5 sec
Passage #: _____ Passage Topic: ______________________________
TYPE PASSAGE HERE
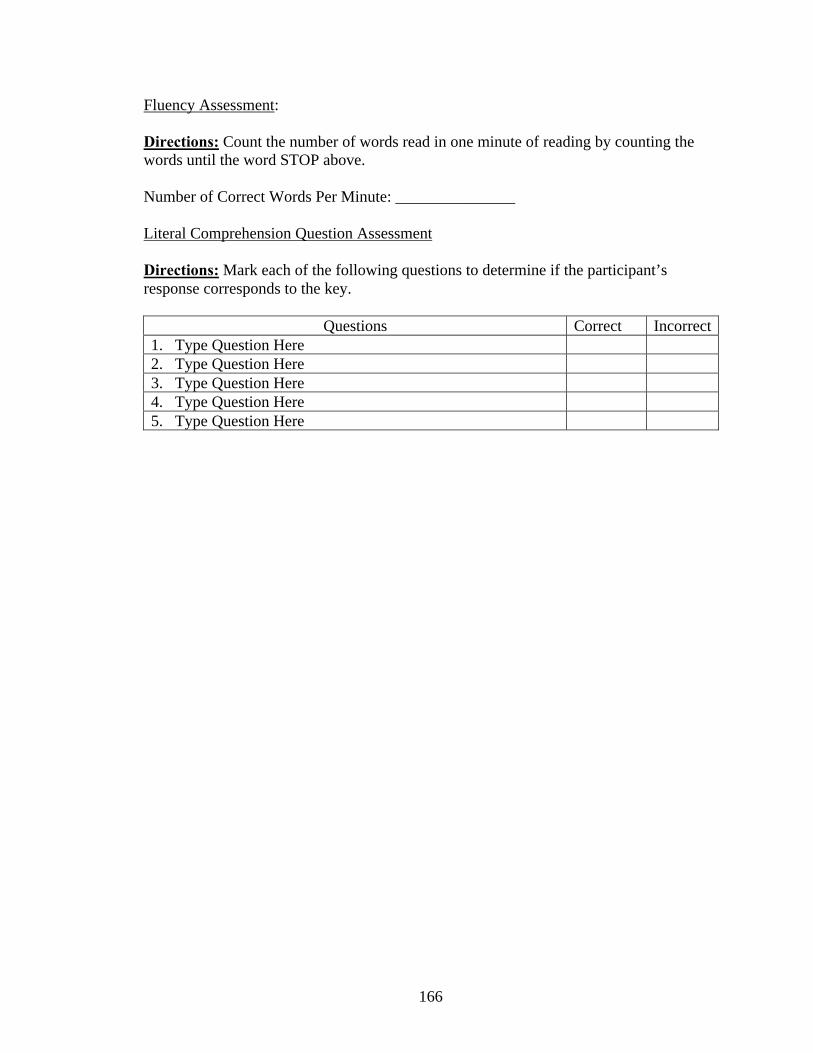
166
Fluency Assessment:
Directions: Count the number of words read in one minute of reading by counting the
words until the word STOP above.
Number of Correct Words Per Minute: _______________
Literal Comprehension Question Assessment
Directions: Mark each of the following questions to determine if the participant’s
response corresponds to the key.
Questions Correct Incorrect
1. Type Question Here
2. Type Question Here
3. Type Question Here
4. Type Question Here
5. Type Question Here

167
VITA
KATRINA G. LANDA
2000 B.S., Special Education and Psychology
University of Miami
Coral Gables, Florida
2000 Graduate Assistant
Office of Academic Development and Disability
Services
University of Miami
Coral Gables, Florida
2000-2002 Social Studies Teacher of Children with Specific
Learning Disabilities
The Atlantis Academy
Miami, Florida
2002 M.S., Early Childhood Special Education and TESOL
University of Miami
Coral Gables, Florida
2002-2005 Pre-kindergarten Special Education Teacher
Ludlam Elementary School
South Miami, Florida
2005-2007 Educational Specialist
Miami-Dade County Public Schools
Miami, Florida
2009 Graduate Assistant College of Education
Florida International University
Miami, Florida
PUBLICATIONS AND PRESENTATIONS
Nevin, A. et al. (2004). Reviews of Single Subject Research Designs: Applications to
Special Education and School Psychology. ERIC Document Reproduction
Service No. ED489930
Landa, K. (2004, February). Summary and Critique of a Single Subject Withdrawal
Design. Paper presented to Florida International University Graduate Course,
EDP 7058, Miami, Florida.

168
Landa, K. & Nevin, A. (2006, April). Pairing Repeated Reading and Systematic Error
Correction: Effects in 18 Year Old Students on a Small Caribbean Island. Paper
presented at the Florida International University College of Education Research
Symposium, Miami, Florida.
Landa, K. (2006, February). Pairing Repeated Reading and Systematic Error Correction:
Effects in 18 Year Old Students on a Small Caribbean Island. Paper Presented to
Florida International University Graduate Course, EDP 7058, Miami, Florida.
Canal, R. & Landa, K. (2006, September). Developing, Writing, Administering,
Analyzing, and Evaluating Effectiveness of a Community Survey for Program
Evaluation. Paper presented at the Florida Adult and Community Educators of
Florida Conference, Sanibel Harbor Resort, Ft. Myers, Florida.
Unzueta, C., Landa, K., Leon, E. Tavel, R., Flores, D. (2007, March). Using Inspiration
to Promote a UDL Classroom. Workshop presented at Howard D. McMillan
Middle School, Miami, Florida.
Landa, K. & Barbetta, P.M. (2008, October). Using Repeated Readings with English
Language Learners with Specific Learning Disabilities. Paper presented at the
Florida Council for Exceptional Students, Sarasota Bay, Florida.
Landa, K. & Barbetta, P.M. (2009, April). Effects of Repeated Readings on English
Language Learners with Specific Learning Disabilities. Paper presented at the
Florida International University College of Education Research Symposium,
Miami, Florida.
CURRENT MEMBERSHIPS
Golden Key Graduate Honor Society
Alpha Epsilon Lambda Graduate Honor Society
Council for Exceptional Children
AWARDS
Doctoral Evidence Acquisition Fellowship Recipient (2008). Florida International
University, Miami, Florida.
Barnes and Noble Best Student/Professor Paper Recipient (2009), 8th
Annual Florida
International University College of Education Research Conference, Miami,
Florida.