Embed Size (px)
Citation preview
Wear 368-369 (2016) 132–145
Contents lists available at ScienceDirect
Wear
http://d0043-16
n CorrE-m
journal homepage: www.elsevier.com/locate/wear
Effects of rock water content on CERCHAR Abrasivity Index
M.Z. Abu Bakar a,n, Y. Majeed b, J. Rostami c
a Geological Engineering Department, University of Engineering and Technology, Lahore, Pakistanb Mining Engineering Department, University of Engineering and Technology, Lahore, Pakistanc Department of Mining Engineering, Colorado School of Mines, Golden, CO, USA
a r t i c l e i n f o
Article history:Received 25 April 2016Received in revised form3 September 2016Accepted 6 September 2016Available online 9 September 2016
Keywords:CERCHAR Abrasivity Index (CAI)Quartz content (QC)Equivalent quartz content (EQC)Schimazek's F-valueRock abrasivity index (RAI)Uniaxial compressive strength (UCS)
x.doi.org/10.1016/j.wear.2016.09.00748/& 2016 Elsevier B.V. All rights reserved.
esponding author.ail address: [email protected] (M.Z.
a b s t r a c t
Cerchar Abrasivity Index (CAI) has been commonly used to represent rock abrasion for estimation of toolwear in rock excavation applications. This test is a simple and effective measure of rock abrasion butoperating parameters can impact its results. This paper focuses on the influence of water saturation onCAI values based on laboratory testing of 33 sedimentary rock units collected from different regions ofPakistan. The tests include CAI measurements as well as engineering rock properties on both dry andsaturated rocks. It was found that overall 79% of CERCHAR abrasivity index values measured on saturatedrock surfaces “CAIsat” were less than the CERCHAR abrasivity index values measured on dry rock surfaces“CAIdry”. Meanwhile, 52% of CAIsat values showed significant reduction from CAIdry values in the statis-tical analysis of CAI results with significance level of 15% (α¼0.15). Regression analysis was used tocorrelate CAIsat values with CAIdry, normally measured in CERCHAR testing. The proposed formula can beused to estimate CAIsat from result of laboratory testing where CAI reported is often CAIdry. This couldlead into more accurate estimation of tool wear and related adjustments when CAI is used for estimationof tool wear when excavation is done under wet conditions. Multiple regression was also used toestablish a predictive model of CAIsat with petrographical, wear indices and geotechnical rock propertiesof saturated rock samples. In addition, the validity of correlations of CAI with rock properties that arealready published was evaluated.
& 2016 Elsevier B.V. All rights reserved.
1. Introduction
Production of minerals in the mining industry, construction ofunderground and surface structures increasingly involves the use ofvarious types of mechanical excavators such as tunnel boringmachines (TBM), Roadheaders, roadmilling machines, or similarequipment. In most of these cases the host rock is moist and in somecases is fully saturated with water. Moreover, in specialized applica-tions including off-shore drilling, construction of harbor, dredging ofhard formations, and construction of structures underneath bodies ofwater, rock excavation is generally carried out in saturated rock. Allthe excavators used for such applications employ bits or other cuttingtools to excavate rocks both in dry and saturated environments,which in turn affect the bit wear rate, bit life, cutting forces, andspecific energy. Laboratory testing of rock samples for estimation ofperformance and production rate of these excavators is usuallyconducted on air dried rock samples. This can result in over/underestimation of cutting forces and rock abrasivity, and in turn affectsoverall technical/operational feasibility of the proposed systems and
Abu Bakar).
economics of the project. A quick review of the literature on rockbehavior (abrasiveness, cutting forces, specific energy and strengthetc.) clearly indicates that rock behavior changes at various moisturecontents and perhaps under saturated conditions these changes canimpact the production rate and tool consumption of any excavationmachine [1].
The influence of water saturation on the physical and mechan-ical properties of rocks has been a subject of many earlier investi-gations. Table 1 is a summary of the previous studies on effect ofwater saturation on UCS and BTS values where majority of caseshave shown considerable decrease in the compressive and tensilestrengths of saturated rocks in comparison to the air dried samples.However, Brace and Martin [2] report increase in the rock strengthwith water saturation under increased strain rate.
Among the existing mechanical methods of rock abrasivitymeasurement (pin on disc test, core abrasion test, modified taberabrasion test, steel cube test, LCPC test and NTNU/SINTEF abrasiontest) the CERCHAR test has achieved great acceptance in the rockexcavation industry. The CERCHAR abrasivity index test wasdeveloped at Laboratoire du Centre d’Etudes et Recherches desCharbonages de France (CERCHAR) in 1970s for abrasivity mea-surements in coal mining industry and later on was progressivelyadopted for abrasivity testing in the tunneling industry [17,18].
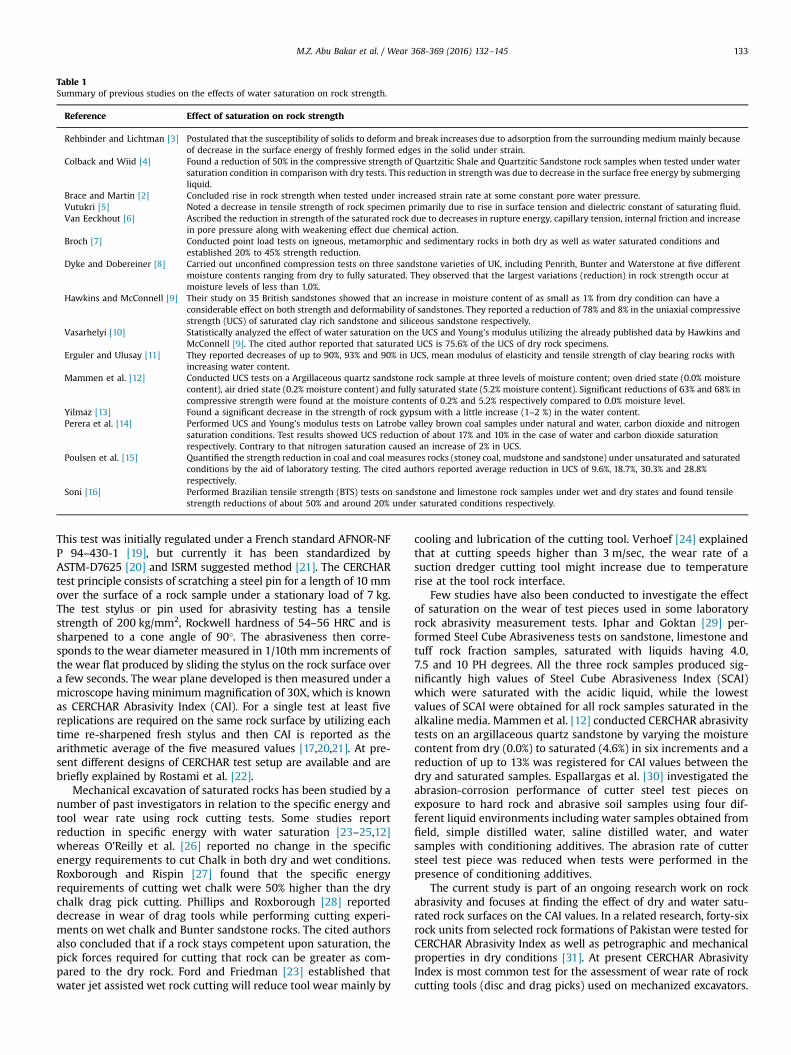
Table 1Summary of previous studies on the effects of water saturation on rock strength.
Reference Effect of saturation on rock strength
Rehbinder and Lichtman [3] Postulated that the susceptibility of solids to deform and break increases due to adsorption from the surrounding medium mainly becauseof decrease in the surface energy of freshly formed edges in the solid under strain.
Colback and Wiid [4] Found a reduction of 50% in the compressive strength of Quartzitic Shale and Quartzitic Sandstone rock samples when tested under watersaturation condition in comparison with dry tests. This reduction in strength was due to decrease in the surface free energy by submergingliquid.
Brace and Martin [2] Concluded rise in rock strength when tested under increased strain rate at some constant pore water pressure.Vutukri [5] Noted a decrease in tensile strength of rock specimen primarily due to rise in surface tension and dielectric constant of saturating fluid.Van Eeckhout [6] Ascribed the reduction in strength of the saturated rock due to decreases in rupture energy, capillary tension, internal friction and increase
in pore pressure along with weakening effect due chemical action.Broch [7] Conducted point load tests on igneous, metamorphic and sedimentary rocks in both dry as well as water saturated conditions and
established 20% to 45% strength reduction.Dyke and Dobereiner [8] Carried out unconfined compression tests on three sandstone varieties of UK, including Penrith, Bunter and Waterstone at five different
moisture contents ranging from dry to fully saturated. They observed that the largest variations (reduction) in rock strength occur atmoisture levels of less than 1.0%.
Hawkins and McConnell [9] Their study on 35 British sandstones showed that an increase in moisture content of as small as 1% from dry condition can have aconsiderable effect on both strength and deformability of sandstones. They reported a reduction of 78% and 8% in the uniaxial compressivestrength (UCS) of saturated clay rich sandstone and siliceous sandstone respectively.
Vasarhelyi [10] Statistically analyzed the effect of water saturation on the UCS and Young’s modulus utilizing the already published data by Hawkins andMcConnell [9]. The cited author reported that saturated UCS is 75.6% of the UCS of dry rock specimens.
Erguler and Ulusay [11] They reported decreases of up to 90%, 93% and 90% in UCS, mean modulus of elasticity and tensile strength of clay bearing rocks withincreasing water content.
Mammen et al. [12] Conducted UCS tests on a Argillaceous quartz sandstone rock sample at three levels of moisture content; oven dried state (0.0% moisturecontent), air dried state (0.2% moisture content) and fully saturated state (5.2% moisture content). Significant reductions of 63% and 68% incompressive strength were found at the moisture contents of 0.2% and 5.2% respectively compared to 0.0% moisture level.
Yilmaz [13] Found a significant decrease in the strength of rock gypsum with a little increase (1–2 %) in the water content.Perera et al. [14] Performed UCS and Young’s modulus tests on Latrobe valley brown coal samples under natural and water, carbon dioxide and nitrogen
saturation conditions. Test results showed UCS reduction of about 17% and 10% in the case of water and carbon dioxide saturationrespectively. Contrary to that nitrogen saturation caused an increase of 2% in UCS.
Poulsen et al. [15] Quantified the strength reduction in coal and coal measures rocks (stoney coal, mudstone and sandstone) under unsaturated and saturatedconditions by the aid of laboratory testing. The cited authors reported average reduction in UCS of 9.6%, 18.7%, 30.3% and 28.8%respectively.
Soni [16] Performed Brazilian tensile strength (BTS) tests on sandstone and limestone rock samples under wet and dry states and found tensilestrength reductions of about 50% and around 20% under saturated conditions respectively.
M.Z. Abu Bakar et al. / Wear 368-369 (2016) 132–145 133
This test was initially regulated under a French standard AFNOR-NFP 94–430-1 [19], but currently it has been standardized byASTM-D7625 [20] and ISRM suggested method [21]. The CERCHARtest principle consists of scratching a steel pin for a length of 10 mmover the surface of a rock sample under a stationary load of 7 kg.The test stylus or pin used for abrasivity testing has a tensilestrength of 200 kg/mm2, Rockwell hardness of 54–56 HRC and issharpened to a cone angle of 90°. The abrasiveness then corre-sponds to the wear diameter measured in 1/10th mm increments ofthe wear flat produced by sliding the stylus on the rock surface overa few seconds. The wear plane developed is then measured under amicroscope having minimummagnification of 30X, which is knownas CERCHAR Abrasivity Index (CAI). For a single test at least fivereplications are required on the same rock surface by utilizing eachtime re-sharpened fresh stylus and then CAI is reported as thearithmetic average of the five measured values [17,20,21]. At pre-sent different designs of CERCHAR test setup are available and arebriefly explained by Rostami et al. [22].
Mechanical excavation of saturated rocks has been studied by anumber of past investigators in relation to the specific energy andtool wear rate using rock cutting tests. Some studies reportreduction in specific energy with water saturation [23–25,12]whereas O’Reilly et al. [26] reported no change in the specificenergy requirements to cut Chalk in both dry and wet conditions.Roxborough and Rispin [27] found that the specific energyrequirements of cutting wet chalk were 50% higher than the drychalk drag pick cutting. Phillips and Roxborough [28] reporteddecrease in wear of drag tools while performing cutting experi-ments on wet chalk and Bunter sandstone rocks. The cited authorsalso concluded that if a rock stays competent upon saturation, thepick forces required for cutting that rock can be greater as com-pared to the dry rock. Ford and Friedman [23] established thatwater jet assisted wet rock cutting will reduce tool wear mainly by
cooling and lubrication of the cutting tool. Verhoef [24] explainedthat at cutting speeds higher than 3 m/sec, the wear rate of asuction dredger cutting tool might increase due to temperaturerise at the tool rock interface.
Few studies have also been conducted to investigate the effectof saturation on the wear of test pieces used in some laboratoryrock abrasivity measurement tests. Iphar and Goktan [29] per-formed Steel Cube Abrasiveness tests on sandstone, limestone andtuff rock fraction samples, saturated with liquids having 4.0,7.5 and 10 PH degrees. All the three rock samples produced sig-nificantly high values of Steel Cube Abrasiveness Index (SCAI)which were saturated with the acidic liquid, while the lowestvalues of SCAI were obtained for all rock samples saturated in thealkaline media. Mammen et al. [12] conducted CERCHAR abrasivitytests on an argillaceous quartz sandstone by varying the moisturecontent from dry (0.0%) to saturated (4.6%) in six increments and areduction of up to 13% was registered for CAI values between thedry and saturated samples. Espallargas et al. [30] investigated theabrasion-corrosion performance of cutter steel test pieces onexposure to hard rock and abrasive soil samples using four dif-ferent liquid environments including water samples obtained fromfield, simple distilled water, saline distilled water, and watersamples with conditioning additives. The abrasion rate of cuttersteel test piece was reduced when tests were performed in thepresence of conditioning additives.
The current study is part of an ongoing research work on rockabrasivity and focuses at finding the effect of dry and water satu-rated rock surfaces on the CAI values. In a related research, forty-sixrock units from selected rock formations of Pakistan were tested forCERCHAR Abrasivity Index as well as petrographic and mechanicalproperties in dry conditions [31]. At present CERCHAR AbrasivityIndex is most common test for the assessment of wear rate of rockcutting tools (disc and drag picks) used on mechanized excavators.
M.Z. Abu Bakar et al. / Wear 368-369 (2016) 132–145134
During excavation process these mechanical excavators usuallyencounter saturated rock formations, which may affect tool wearrate due to the differing behavior of saturated rocks towards abra-siveness. Therefore, any abrasivity evaluation based on entirely airdried rocks can affect the machine performance and eventually theoverall economy of rock excavation operations.
2. Rock samples used in the experimental program
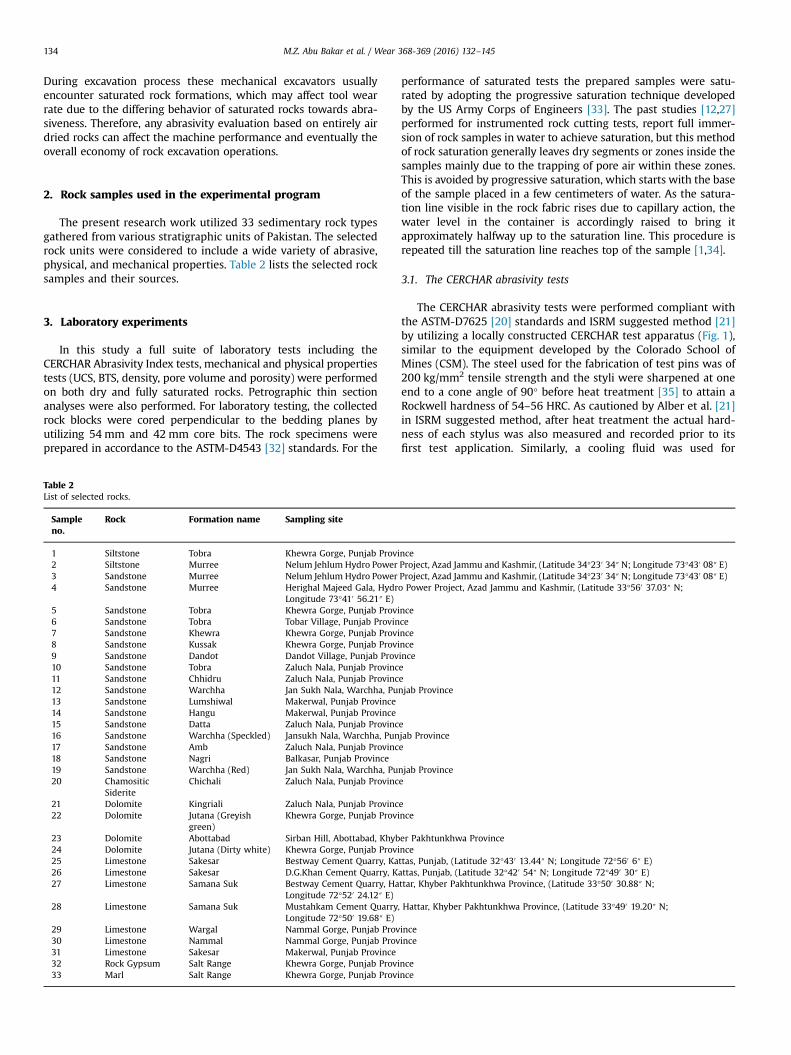
The present research work utilized 33 sedimentary rock typesgathered from various stratigraphic units of Pakistan. The selectedrock units were considered to include a wide variety of abrasive,physical, and mechanical properties. Table 2 lists the selected rocksamples and their sources.
3. Laboratory experiments
In this study a full suite of laboratory tests including theCERCHAR Abrasivity Index tests, mechanical and physical propertiestests (UCS, BTS, density, pore volume and porosity) were performedon both dry and fully saturated rocks. Petrographic thin sectionanalyses were also performed. For laboratory testing, the collectedrock blocks were cored perpendicular to the bedding planes byutilizing 54 mm and 42 mm core bits. The rock specimens wereprepared in accordance to the ASTM-D4543 [32] standards. For the
Table 2List of selected rocks.
Sampleno.
Rock Formation name Sampling site
1 Siltstone Tobra Khewra Gorge, Punjab Provi2 Siltstone Murree Nelum Jehlum Hydro Power3 Sandstone Murree Nelum Jehlum Hydro Power4 Sandstone Murree Herighal Majeed Gala, Hydr
Longitude 73°410 56.21″ E)5 Sandstone Tobra Khewra Gorge, Punjab Provi6 Sandstone Tobra Tobar Village, Punjab Provin7 Sandstone Khewra Khewra Gorge, Punjab Provi8 Sandstone Kussak Khewra Gorge, Punjab Provi9 Sandstone Dandot Dandot Village, Punjab Prov10 Sandstone Tobra Zaluch Nala, Punjab Provinc11 Sandstone Chhidru Zaluch Nala, Punjab Provinc12 Sandstone Warchha Jan Sukh Nala, Warchha, Pu13 Sandstone Lumshiwal Makerwal, Punjab Province14 Sandstone Hangu Makerwal, Punjab Province15 Sandstone Datta Zaluch Nala, Punjab Provinc16 Sandstone Warchha (Speckled) Jansukh Nala, Warchha, Pun17 Sandstone Amb Zaluch Nala, Punjab Provinc18 Sandstone Nagri Balkasar, Punjab Province19 Sandstone Warchha (Red) Jan Sukh Nala, Warchha, Pu20 Chamositic
SideriteChichali Zaluch Nala, Punjab Provinc
21 Dolomite Kingriali Zaluch Nala, Punjab Provinc22 Dolomite Jutana (Greyish
green)Khewra Gorge, Punjab Provi
23 Dolomite Abottabad Sirban Hill, Abottabad, Khyb24 Dolomite Jutana (Dirty white) Khewra Gorge, Punjab Provi25 Limestone Sakesar Bestway Cement Quarry, Ka26 Limestone Sakesar D.G.Khan Cement Quarry, K27 Limestone Samana Suk Bestway Cement Quarry, Ha
Longitude 72°520 24.12″ E)28 Limestone Samana Suk Mustahkam Cement Quarry,
Longitude 72°500 19.68″ E)29 Limestone Wargal Nammal Gorge, Punjab Prov30 Limestone Nammal Nammal Gorge, Punjab Prov31 Limestone Sakesar Makerwal, Punjab Province32 Rock Gypsum Salt Range Khewra Gorge, Punjab Provi33 Marl Salt Range Khewra Gorge, Punjab Provi
performance of saturated tests the prepared samples were satu-rated by adopting the progressive saturation technique developedby the US Army Corps of Engineers [33]. The past studies [12,27]performed for instrumented rock cutting tests, report full immer-sion of rock samples in water to achieve saturation, but this methodof rock saturation generally leaves dry segments or zones inside thesamples mainly due to the trapping of pore air within these zones.This is avoided by progressive saturation, which starts with the baseof the sample placed in a few centimeters of water. As the satura-tion line visible in the rock fabric rises due to capillary action, thewater level in the container is accordingly raised to bring itapproximately halfway up to the saturation line. This procedure isrepeated till the saturation line reaches top of the sample [1,34].
3.1. The CERCHAR abrasivity tests
The CERCHAR abrasivity tests were performed compliant withthe ASTM-D7625 [20] standards and ISRM suggested method [21]by utilizing a locally constructed CERCHAR test apparatus (Fig. 1),similar to the equipment developed by the Colorado School ofMines (CSM). The steel used for the fabrication of test pins was of200 kg/mm2 tensile strength and the styli were sharpened at oneend to a cone angle of 90° before heat treatment [35] to attain aRockwell hardness of 54–56 HRC. As cautioned by Alber et al. [21]in ISRM suggested method, after heat treatment the actual hard-ness of each stylus was also measured and recorded prior to itsfirst test application. Similarly, a cooling fluid was used for
nceProject, Azad Jammu and Kashmir, (Latitude 34°230 34″ N; Longitude 73°430 08″ E)Project, Azad Jammu and Kashmir, (Latitude 34°230 34″ N; Longitude 73°430 08″ E)o Power Project, Azad Jammu and Kashmir, (Latitude 33°560 37.03″ N;
ncecencenceinceeenjab Province
ejab Provincee
njab Provincee
ence
er Pakhtunkhwa Provincencettas, Punjab, (Latitude 32°430 13.44″ N; Longitude 72°560 6″ E)attas, Punjab, (Latitude 32°420 54″ N; Longitude 72°490 30″ E)ttar, Khyber Pakhtunkhwa Province, (Latitude 33°500 30.88″ N;
Hattar, Khyber Pakhtunkhwa Province, (Latitude 33°490 19.20″ N;
inceince
ncence
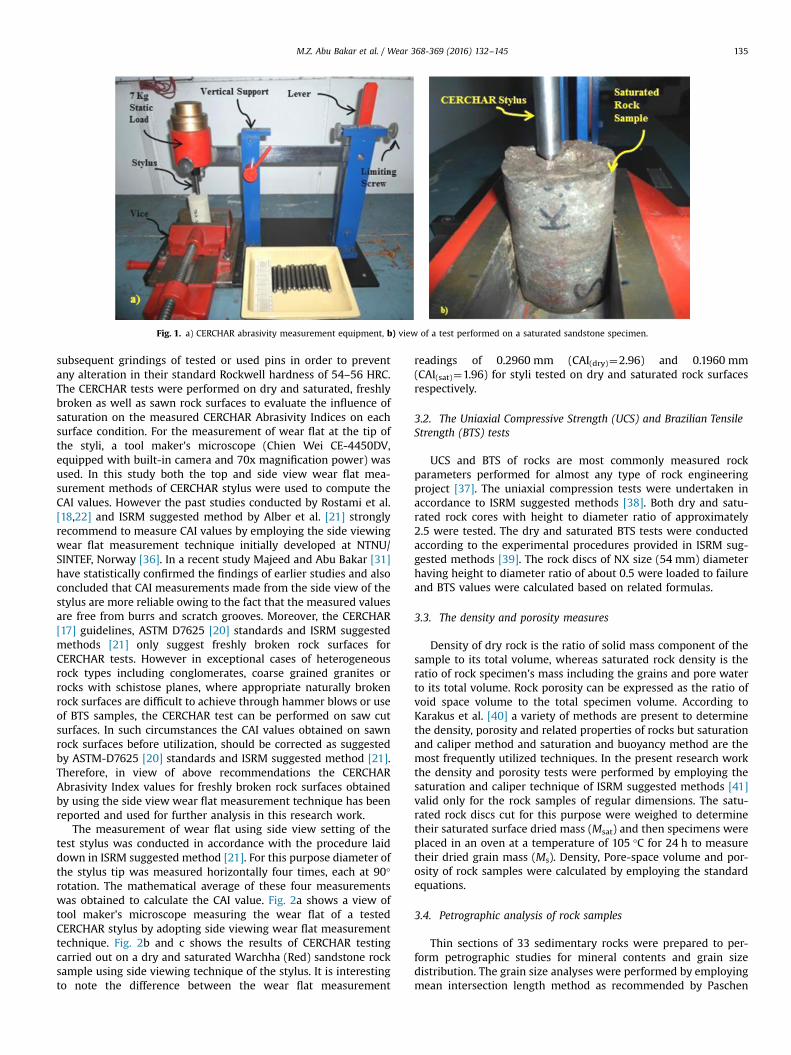
Fig. 1. a) CERCHAR abrasivity measurement equipment, b) view of a test performed on a saturated sandstone specimen.
M.Z. Abu Bakar et al. / Wear 368-369 (2016) 132–145 135
subsequent grindings of tested or used pins in order to preventany alteration in their standard Rockwell hardness of 54–56 HRC.The CERCHAR tests were performed on dry and saturated, freshlybroken as well as sawn rock surfaces to evaluate the influence ofsaturation on the measured CERCHAR Abrasivity Indices on eachsurface condition. For the measurement of wear flat at the tip ofthe styli, a tool maker's microscope (Chien Wei CE-4450DV,equipped with built-in camera and 70x magnification power) wasused. In this study both the top and side view wear flat mea-surement methods of CERCHAR stylus were used to compute theCAI values. However the past studies conducted by Rostami et al.[18,22] and ISRM suggested method by Alber et al. [21] stronglyrecommend to measure CAI values by employing the side viewingwear flat measurement technique initially developed at NTNU/SINTEF, Norway [36]. In a recent study Majeed and Abu Bakar [31]have statistically confirmed the findings of earlier studies and alsoconcluded that CAI measurements made from the side view of thestylus are more reliable owing to the fact that the measured valuesare free from burrs and scratch grooves. Moreover, the CERCHAR[17] guidelines, ASTM D7625 [20] standards and ISRM suggestedmethods [21] only suggest freshly broken rock surfaces forCERCHAR tests. However in exceptional cases of heterogeneousrock types including conglomerates, coarse grained granites orrocks with schistose planes, where appropriate naturally brokenrock surfaces are difficult to achieve through hammer blows or useof BTS samples, the CERCHAR test can be performed on saw cutsurfaces. In such circumstances the CAI values obtained on sawnrock surfaces before utilization, should be corrected as suggestedby ASTM-D7625 [20] standards and ISRM suggested method [21].Therefore, in view of above recommendations the CERCHARAbrasivity Index values for freshly broken rock surfaces obtainedby using the side view wear flat measurement technique has beenreported and used for further analysis in this research work.
The measurement of wear flat using side view setting of thetest stylus was conducted in accordance with the procedure laiddown in ISRM suggested method [21]. For this purpose diameter ofthe stylus tip was measured horizontally four times, each at 90°rotation. The mathematical average of these four measurementswas obtained to calculate the CAI value. Fig. 2a shows a view oftool maker's microscope measuring the wear flat of a testedCERCHAR stylus by adopting side viewing wear flat measurementtechnique. Fig. 2b and c shows the results of CERCHAR testingcarried out on a dry and saturated Warchha (Red) sandstone rocksample using side viewing technique of the stylus. It is interestingto note the difference between the wear flat measurement
readings of 0.2960 mm (CAI(dry)¼2.96) and 0.1960 mm(CAI(sat)¼1.96) for styli tested on dry and saturated rock surfacesrespectively.
3.2. The Uniaxial Compressive Strength (UCS) and Brazilian TensileStrength (BTS) tests
UCS and BTS of rocks are most commonly measured rockparameters performed for almost any type of rock engineeringproject [37]. The uniaxial compression tests were undertaken inaccordance to ISRM suggested methods [38]. Both dry and satu-rated rock cores with height to diameter ratio of approximately2.5 were tested. The dry and saturated BTS tests were conductedaccording to the experimental procedures provided in ISRM sug-gested methods [39]. The rock discs of NX size (54 mm) diameterhaving height to diameter ratio of about 0.5 were loaded to failureand BTS values were calculated based on related formulas.
3.3. The density and porosity measures
Density of dry rock is the ratio of solid mass component of thesample to its total volume, whereas saturated rock density is theratio of rock specimen's mass including the grains and pore waterto its total volume. Rock porosity can be expressed as the ratio ofvoid space volume to the total specimen volume. According toKarakus et al. [40] a variety of methods are present to determinethe density, porosity and related properties of rocks but saturationand caliper method and saturation and buoyancy method are themost frequently utilized techniques. In the present research workthe density and porosity tests were performed by employing thesaturation and caliper technique of ISRM suggested methods [41]valid only for the rock samples of regular dimensions. The satu-rated rock discs cut for this purpose were weighed to determinetheir saturated surface dried mass (Msat) and then specimens wereplaced in an oven at a temperature of 105 °C for 24 h to measuretheir dried grain mass (Ms). Density, Pore-space volume and por-osity of rock samples were calculated by employing the standardequations.
3.4. Petrographic analysis of rock samples
Thin sections of 33 sedimentary rocks were prepared to per-form petrographic studies for mineral contents and grain sizedistribution. The grain size analyses were performed by employingmean intersection length method as recommended by Paschen
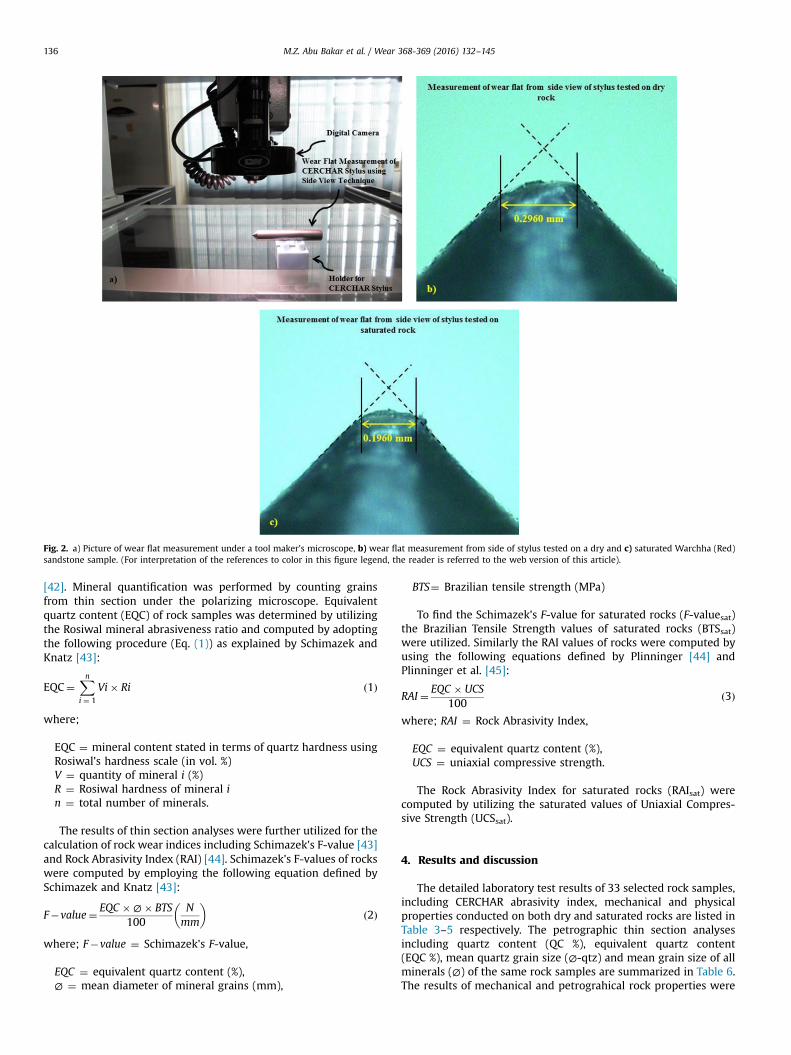
Fig. 2. a) Picture of wear flat measurement under a tool maker's microscope, b) wear flat measurement from side of stylus tested on a dry and c) saturated Warchha (Red)sandstone sample. (For interpretation of the references to color in this figure legend, the reader is referred to the web version of this article).
M.Z. Abu Bakar et al. / Wear 368-369 (2016) 132–145136
[42]. Mineral quantification was performed by counting grainsfrom thin section under the polarizing microscope. Equivalentquartz content (EQC) of rock samples was determined by utilizingthe Rosiwal mineral abrasiveness ratio and computed by adoptingthe following procedure (Eq. (1)) as explained by Schimazek andKnatz [43]:
EQC¼Xni ¼ 1
Vi� Ri ð1Þ
where;
EQC ¼ mineral content stated in terms of quartz hardness usingRosiwal's hardness scale (in vol. %)V ¼ quantity of mineral i (%)R ¼ Rosiwal hardness of mineral in ¼ total number of minerals.
The results of thin section analyses were further utilized for thecalculation of rock wear indices including Schimazek's F-value [43]and Rock Abrasivity Index (RAI) [44]. Schimazek's F-values of rockswere computed by employing the following equation defined bySchimazek and Knatz [43]:
F�value¼ EQC �∅� BTS100
Nmm
� �ð2Þ
where; F�value ¼ Schimazek's F-value,
EQC ¼ equivalent quartz content (%),∅ ¼ mean diameter of mineral grains (mm),
BTS¼ Brazilian tensile strength (MPa)
To find the Schimazek's F-value for saturated rocks (F-valuesat)the Brazilian Tensile Strength values of saturated rocks (BTSsat)were utilized. Similarly the RAI values of rocks were computed byusing the following equations defined by Plinninger [44] andPlinninger et al. [45]:
RAI¼ EQC � UCS100
ð3Þ
where; RAI ¼ Rock Abrasivity Index,
EQC ¼ equivalent quartz content (%),UCS ¼ uniaxial compressive strength.
The Rock Abrasivity Index for saturated rocks (RAIsat) werecomputed by utilizing the saturated values of Uniaxial Compres-sive Strength (UCSsat).
4. Results and discussion
The detailed laboratory test results of 33 selected rock samples,including CERCHAR abrasivity index, mechanical and physicalproperties conducted on both dry and saturated rocks are listed inTable 3–5 respectively. The petrographic thin section analysesincluding quartz content (QC %), equivalent quartz content(EQC %), mean quartz grain size (∅-qtz) and mean grain size of allminerals (∅) of the same rock samples are summarized in Table 6.The results of mechanical and petrograhical rock properties were
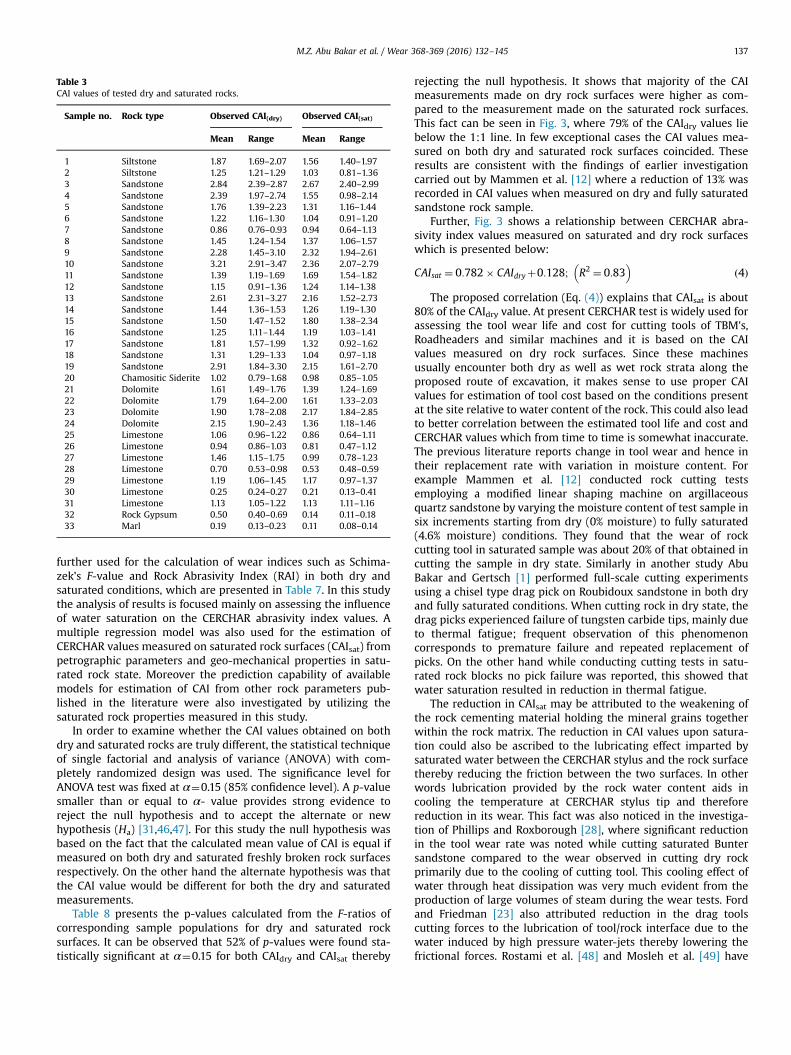
Table 3CAI values of tested dry and saturated rocks.
Sample no. Rock type Observed CAI(dry) Observed CAI(sat)
Mean Range Mean Range
1 Siltstone 1.87 1.69–2.07 1.56 1.40–1.972 Siltstone 1.25 1.21–1.29 1.03 0.81–1.363 Sandstone 2.84 2.39–2.87 2.67 2.40–2.994 Sandstone 2.39 1.97–2.74 1.55 0.98–2.145 Sandstone 1.76 1.39–2.23 1.31 1.16–1.446 Sandstone 1.22 1.16–1.30 1.04 0.91–1.207 Sandstone 0.86 0.76–0.93 0.94 0.64–1.138 Sandstone 1.45 1.24–1.54 1.37 1.06–1.579 Sandstone 2.28 1.45–3.10 2.32 1.94–2.6110 Sandstone 3.21 2.91–3.47 2.36 2.07–2.7911 Sandstone 1.39 1.19–1.69 1.69 1.54–1.8212 Sandstone 1.15 0.91–1.36 1.24 1.14–1.3813 Sandstone 2.61 2.31–3.27 2.16 1.52–2.7314 Sandstone 1.44 1.36–1.53 1.26 1.19–1.3015 Sandstone 1.50 1.47–1.52 1.80 1.38–2.3416 Sandstone 1.25 1.11–1.44 1.19 1.03–1.4117 Sandstone 1.81 1.57–1.99 1.32 0.92–1.6218 Sandstone 1.31 1.29–1.33 1.04 0.97–1.1819 Sandstone 2.91 1.84–3.30 2.15 1.61–2.7020 Chamositic Siderite 1.02 0.79–1.68 0.98 0.85–1.0521 Dolomite 1.61 1.49–1.76 1.39 1.24–1.6922 Dolomite 1.79 1.64–2.00 1.61 1.33–2.0323 Dolomite 1.90 1.78–2.08 2.17 1.84–2.8524 Dolomite 2.15 1.90–2.43 1.36 1.18–1.4625 Limestone 1.06 0.96–1.22 0.86 0.64–1.1126 Limestone 0.94 0.86–1.03 0.81 0.47–1.1227 Limestone 1.46 1.15–1.75 0.99 0.78–1.2328 Limestone 0.70 0.53–0.98 0.53 0.48–0.5929 Limestone 1.19 1.06–1.45 1.17 0.97–1.3730 Limestone 0.25 0.24–0.27 0.21 0.13–0.4131 Limestone 1.13 1.05–1.22 1.13 1.11–1.1632 Rock Gypsum 0.50 0.40–0.69 0.14 0.11–0.1833 Marl 0.19 0.13–0.23 0.11 0.08–0.14
M.Z. Abu Bakar et al. / Wear 368-369 (2016) 132–145 137
further used for the calculation of wear indices such as Schima-zek's F-value and Rock Abrasivity Index (RAI) in both dry andsaturated conditions, which are presented in Table 7. In this studythe analysis of results is focused mainly on assessing the influenceof water saturation on the CERCHAR abrasivity index values. Amultiple regression model was also used for the estimation ofCERCHAR values measured on saturated rock surfaces (CAIsat) frompetrographic parameters and geo-mechanical properties in satu-rated rock state. Moreover the prediction capability of availablemodels for estimation of CAI from other rock parameters pub-lished in the literature were also investigated by utilizing thesaturated rock properties measured in this study.
In order to examine whether the CAI values obtained on bothdry and saturated rocks are truly different, the statistical techniqueof single factorial and analysis of variance (ANOVA) with com-pletely randomized design was used. The significance level forANOVA test was fixed at α¼0.15 (85% confidence level). A p-valuesmaller than or equal to α- value provides strong evidence toreject the null hypothesis and to accept the alternate or newhypothesis (Ha) [31,46,47]. For this study the null hypothesis wasbased on the fact that the calculated mean value of CAI is equal ifmeasured on both dry and saturated freshly broken rock surfacesrespectively. On the other hand the alternate hypothesis was thatthe CAI value would be different for both the dry and saturatedmeasurements.
Table 8 presents the p-values calculated from the F-ratios ofcorresponding sample populations for dry and saturated rocksurfaces. It can be observed that 52% of p-values were found sta-tistically significant at α¼0.15 for both CAIdry and CAIsat thereby
rejecting the null hypothesis. It shows that majority of the CAImeasurements made on dry rock surfaces were higher as com-pared to the measurement made on the saturated rock surfaces.This fact can be seen in Fig. 3, where 79% of the CAIdry values liebelow the 1:1 line. In few exceptional cases the CAI values mea-sured on both dry and saturated rock surfaces coincided. Theseresults are consistent with the findings of earlier investigationcarried out by Mammen et al. [12] where a reduction of 13% wasrecorded in CAI values when measured on dry and fully saturatedsandstone rock sample.
Further, Fig. 3 shows a relationship between CERCHAR abra-sivity index values measured on saturated and dry rock surfaceswhich is presented below:
CAIsat ¼ 0:782� CAIdryþ0:128; R2 ¼ 0:83� �
ð4Þ
The proposed correlation (Eq. (4)) explains that CAIsat is about80% of the CAIdry value. At present CERCHAR test is widely used forassessing the tool wear life and cost for cutting tools of TBM's,Roadheaders and similar machines and it is based on the CAIvalues measured on dry rock surfaces. Since these machinesusually encounter both dry as well as wet rock strata along theproposed route of excavation, it makes sense to use proper CAIvalues for estimation of tool cost based on the conditions presentat the site relative to water content of the rock. This could also leadto better correlation between the estimated tool life and cost andCERCHAR values which from time to time is somewhat inaccurate.The previous literature reports change in tool wear and hence intheir replacement rate with variation in moisture content. Forexample Mammen et al. [12] conducted rock cutting testsemploying a modified linear shaping machine on argillaceousquartz sandstone by varying the moisture content of test sample insix increments starting from dry (0% moisture) to fully saturated(4.6% moisture) conditions. They found that the wear of rockcutting tool in saturated sample was about 20% of that obtained incutting the sample in dry state. Similarly in another study AbuBakar and Gertsch [1] performed full-scale cutting experimentsusing a chisel type drag pick on Roubidoux sandstone in both dryand fully saturated conditions. When cutting rock in dry state, thedrag picks experienced failure of tungsten carbide tips, mainly dueto thermal fatigue; frequent observation of this phenomenoncorresponds to premature failure and repeated replacement ofpicks. On the other hand while conducting cutting tests in satu-rated rock blocks no pick failure was reported, this showed thatwater saturation resulted in reduction in thermal fatigue.
The reduction in CAIsat may be attributed to the weakening ofthe rock cementing material holding the mineral grains togetherwithin the rock matrix. The reduction in CAI values upon satura-tion could also be ascribed to the lubricating effect imparted bysaturated water between the CERCHAR stylus and the rock surfacethereby reducing the friction between the two surfaces. In otherwords lubrication provided by the rock water content aids incooling the temperature at CERCHAR stylus tip and thereforereduction in its wear. This fact was also noticed in the investiga-tion of Phillips and Roxborough [28], where significant reductionin the tool wear rate was noted while cutting saturated Buntersandstone compared to the wear observed in cutting dry rockprimarily due to the cooling of cutting tool. This cooling effect ofwater through heat dissipation was very much evident from theproduction of large volumes of steam during the wear tests. Fordand Friedman [23] also attributed reduction in the drag toolscutting forces to the lubrication of tool/rock interface due to thewater induced by high pressure water-jets thereby lowering thefrictional forces. Rostami et al. [48] and Mosleh et al. [49] have
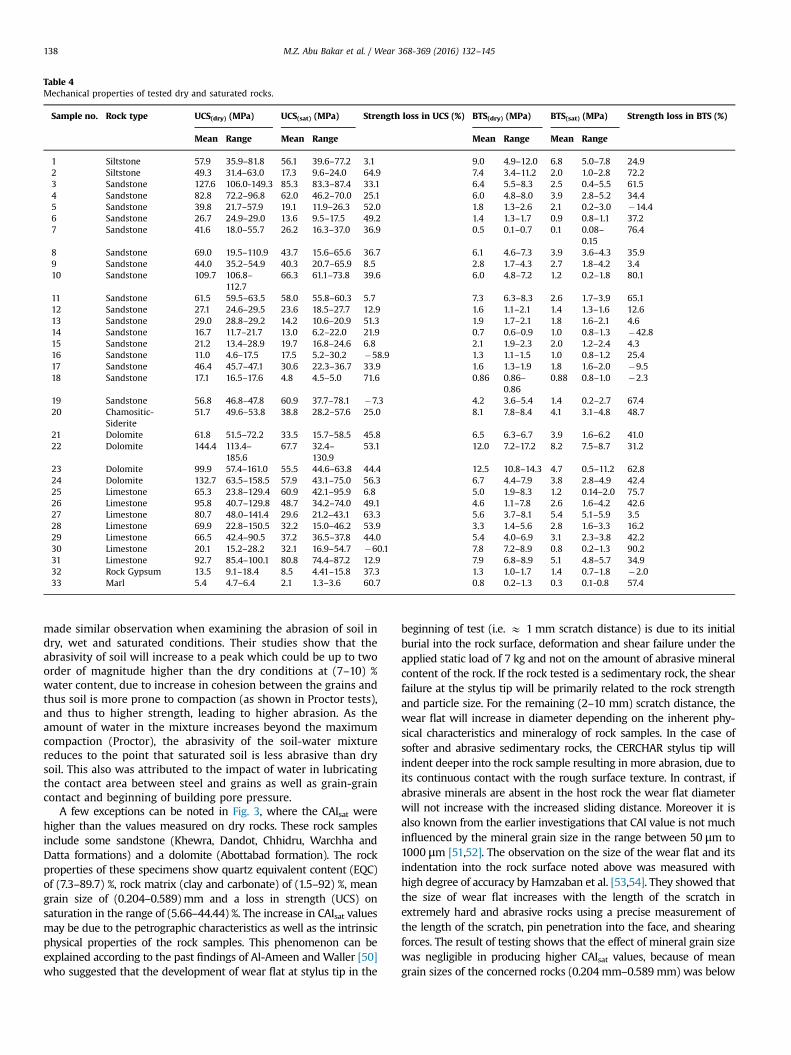
Table 4Mechanical properties of tested dry and saturated rocks.
Sample no. Rock type UCS(dry) (MPa) UCS(sat) (MPa) Strength loss in UCS (%) BTS(dry) (MPa) BTS(sat) (MPa) Strength loss in BTS (%)
Mean Range Mean Range Mean Range Mean Range
1 Siltstone 57.9 35.9–81.8 56.1 39.6–77.2 3.1 9.0 4.9–12.0 6.8 5.0–7.8 24.92 Siltstone 49.3 31.4–63.0 17.3 9.6–24.0 64.9 7.4 3.4–11.2 2.0 1.0–2.8 72.23 Sandstone 127.6 106.0-149.3 85.3 83.3–87.4 33.1 6.4 5.5–8.3 2.5 0.4–5.5 61.54 Sandstone 82.8 72.2–96.8 62.0 46.2–70.0 25.1 6.0 4.8–8.0 3.9 2.8–5.2 34.45 Sandstone 39.8 21.7–57.9 19.1 11.9–26.3 52.0 1.8 1.3–2.6 2.1 0.2–3.0 �14.46 Sandstone 26.7 24.9–29.0 13.6 9.5–17.5 49.2 1.4 1.3–1.7 0.9 0.8–1.1 37.27 Sandstone 41.6 18.0–55.7 26.2 16.3–37.0 36.9 0.5 0.1–0.7 0.1 0.08–
0.1576.4
8 Sandstone 69.0 19.5–110.9 43.7 15.6–65.6 36.7 6.1 4.6–7.3 3.9 3.6–4.3 35.99 Sandstone 44.0 35.2–54.9 40.3 20.7–65.9 8.5 2.8 1.7–4.3 2.7 1.8–4.2 3.410 Sandstone 109.7 106.8–
112.766.3 61.1–73.8 39.6 6.0 4.8–7.2 1.2 0.2–1.8 80.1
11 Sandstone 61.5 59.5–63.5 58.0 55.8–60.3 5.7 7.3 6.3–8.3 2.6 1.7–3.9 65.112 Sandstone 27.1 24.6–29.5 23.6 18.5–27.7 12.9 1.6 1.1–2.1 1.4 1.3–1.6 12.613 Sandstone 29.0 28.8–29.2 14.2 10.6–20.9 51.3 1.9 1.7–2.1 1.8 1.6–2.1 4.614 Sandstone 16.7 11.7–21.7 13.0 6.2–22.0 21.9 0.7 0.6–0.9 1.0 0.8–1.3 �42.815 Sandstone 21.2 13.4–28.9 19.7 16.8–24.6 6.8 2.1 1.9–2.3 2.0 1.2–2.4 4.316 Sandstone 11.0 4.6–17.5 17.5 5.2–30.2 �58.9 1.3 1.1–1.5 1.0 0.8–1.2 25.417 Sandstone 46.4 45.7–47.1 30.6 22.3–36.7 33.9 1.6 1.3–1.9 1.8 1.6–2.0 �9.518 Sandstone 17.1 16.5–17.6 4.8 4.5–5.0 71.6 0.86 0.86–
0.860.88 0.8–1.0 �2.3
19 Sandstone 56.8 46.8–47.8 60.9 37.7–78.1 �7.3 4.2 3.6–5.4 1.4 0.2–2.7 67.420 Chamositic-
Siderite51.7 49.6–53.8 38.8 28.2–57.6 25.0 8.1 7.8–8.4 4.1 3.1–4.8 48.7
21 Dolomite 61.8 51.5–72.2 33.5 15.7–58.5 45.8 6.5 6.3–6.7 3.9 1.6–6.2 41.022 Dolomite 144.4 113.4–
185.667.7 32.4–
130.953.1 12.0 7.2–17.2 8.2 7.5–8.7 31.2
23 Dolomite 99.9 57.4–161.0 55.5 44.6–63.8 44.4 12.5 10.8–14.3 4.7 0.5–11.2 62.824 Dolomite 132.7 63.5–158.5 57.9 43.1–75.0 56.3 6.7 4.4–7.9 3.8 2.8–4.9 42.425 Limestone 65.3 23.8–129.4 60.9 42.1–95.9 6.8 5.0 1.9–8.3 1.2 0.14–2.0 75.726 Limestone 95.8 40.7–129.8 48.7 34.2–74.0 49.1 4.6 1.1–7.8 2.6 1.6–4.2 42.627 Limestone 80.7 48.0–141.4 29.6 21.2–43.1 63.3 5.6 3.7–8.1 5.4 5.1–5.9 3.528 Limestone 69.9 22.8–150.5 32.2 15.0–46.2 53.9 3.3 1.4–5.6 2.8 1.6–3.3 16.229 Limestone 66.5 42.4–90.5 37.2 36.5–37.8 44.0 5.4 4.0–6.9 3.1 2.3–3.8 42.230 Limestone 20.1 15.2–28.2 32.1 16.9–54.7 �60.1 7.8 7.2–8.9 0.8 0.2–1.3 90.231 Limestone 92.7 85.4–100.1 80.8 74.4–87.2 12.9 7.9 6.8–8.9 5.1 4.8–5.7 34.932 Rock Gypsum 13.5 9.1–18.4 8.5 4.41–15.8 37.3 1.3 1.0–1.7 1.4 0.7–1.8 �2.033 Marl 5.4 4.7–6.4 2.1 1.3–3.6 60.7 0.8 0.2–1.3 0.3 0.1-0.8 57.4
M.Z. Abu Bakar et al. / Wear 368-369 (2016) 132–145138
made similar observation when examining the abrasion of soil indry, wet and saturated conditions. Their studies show that theabrasivity of soil will increase to a peak which could be up to twoorder of magnitude higher than the dry conditions at (7–10) %water content, due to increase in cohesion between the grains andthus soil is more prone to compaction (as shown in Proctor tests),and thus to higher strength, leading to higher abrasion. As theamount of water in the mixture increases beyond the maximumcompaction (Proctor), the abrasivity of the soil-water mixturereduces to the point that saturated soil is less abrasive than drysoil. This also was attributed to the impact of water in lubricatingthe contact area between steel and grains as well as grain-graincontact and beginning of building pore pressure.
A few exceptions can be noted in Fig. 3, where the CAIsat werehigher than the values measured on dry rocks. These rock samplesinclude some sandstone (Khewra, Dandot, Chhidru, Warchha andDatta formations) and a dolomite (Abottabad formation). The rockproperties of these specimens show quartz equivalent content (EQC)of (7.3–89.7) %, rock matrix (clay and carbonate) of (1.5–92) %, meangrain size of (0.204–0.589) mm and a loss in strength (UCS) onsaturation in the range of (5.66–44.44) %. The increase in CAIsat valuesmay be due to the petrographic characteristics as well as the intrinsicphysical properties of the rock samples. This phenomenon can beexplained according to the past findings of Al-Ameen andWaller [50]who suggested that the development of wear flat at stylus tip in the
beginning of test (i.e. E 1 mm scratch distance) is due to its initialburial into the rock surface, deformation and shear failure under theapplied static load of 7 kg and not on the amount of abrasive mineralcontent of the rock. If the rock tested is a sedimentary rock, the shearfailure at the stylus tip will be primarily related to the rock strengthand particle size. For the remaining (2–10 mm) scratch distance, thewear flat will increase in diameter depending on the inherent phy-sical characteristics and mineralogy of rock samples. In the case ofsofter and abrasive sedimentary rocks, the CERCHAR stylus tip willindent deeper into the rock sample resulting in more abrasion, due toits continuous contact with the rough surface texture. In contrast, ifabrasive minerals are absent in the host rock the wear flat diameterwill not increase with the increased sliding distance. Moreover it isalso known from the earlier investigations that CAI value is not muchinfluenced by the mineral grain size in the range between 50 μm to1000 μm [51,52]. The observation on the size of the wear flat and itsindentation into the rock surface noted above was measured withhigh degree of accuracy by Hamzaban et al. [53,54]. They showed thatthe size of wear flat increases with the length of the scratch inextremely hard and abrasive rocks using a precise measurement ofthe length of the scratch, pin penetration into the face, and shearingforces. The result of testing shows that the effect of mineral grain sizewas negligible in producing higher CAIsat values, because of meangrain sizes of the concerned rocks (0.204mm–0.589 mm) was below
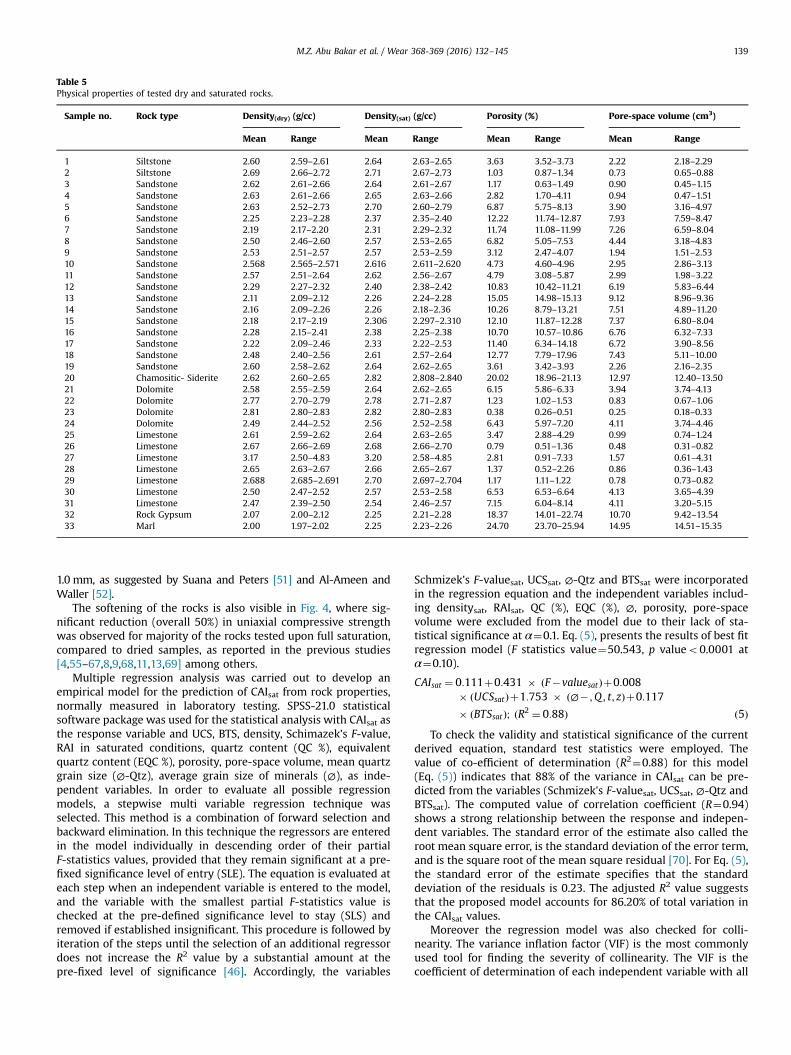
Table 5Physical properties of tested dry and saturated rocks.
Sample no. Rock type Density(dry) (g/cc) Density(sat) (g/cc) Porosity (%) Pore-space volume (cm3)
Mean Range Mean Range Mean Range Mean Range
1 Siltstone 2.60 2.59–2.61 2.64 2.63–2.65 3.63 3.52–3.73 2.22 2.18–2.292 Siltstone 2.69 2.66–2.72 2.71 2.67–2.73 1.03 0.87–1.34 0.73 0.65–0.883 Sandstone 2.62 2.61–2.66 2.64 2.61–2.67 1.17 0.63–1.49 0.90 0.45–1.154 Sandstone 2.63 2.61–2.66 2.65 2.63–2.66 2.82 1.70–4.11 0.94 0.47–1.515 Sandstone 2.63 2.52–2.73 2.70 2.60–2.79 6.87 5.75–8.13 3.90 3.16–4.976 Sandstone 2.25 2.23–2.28 2.37 2.35–2.40 12.22 11.74–12.87 7.93 7.59–8.477 Sandstone 2.19 2.17–2.20 2.31 2.29–2.32 11.74 11.08–11.99 7.26 6.59–8.048 Sandstone 2.50 2.46–2.60 2.57 2.53–2.65 6.82 5.05–7.53 4.44 3.18–4.839 Sandstone 2.53 2.51–2.57 2.57 2.53–2.59 3.12 2.47–4.07 1.94 1.51–2.5310 Sandstone 2.568 2.565–2.571 2.616 2.611–2.620 4.73 4.60–4.96 2.95 2.86–3.1311 Sandstone 2.57 2.51–2.64 2.62 2.56–2.67 4.79 3.08–5.87 2.99 1.98–3.2212 Sandstone 2.29 2.27–2.32 2.40 2.38–2.42 10.83 10.42–11.21 6.19 5.83–6.4413 Sandstone 2.11 2.09–2.12 2.26 2.24–2.28 15.05 14.98–15.13 9.12 8.96–9.3614 Sandstone 2.16 2.09–2.26 2.26 2.18–2.36 10.26 8.79–13.21 7.51 4.89–11.2015 Sandstone 2.18 2.17–2.19 2.306 2.297–2.310 12.10 11.87–12.28 7.37 6.80–8.0416 Sandstone 2.28 2.15–2.41 2.38 2.25–2.38 10.70 10.57–10.86 6.76 6.32–7.3317 Sandstone 2.22 2.09–2.46 2.33 2.22–2.53 11.40 6.34–14.18 6.72 3.90–8.5618 Sandstone 2.48 2.40–2.56 2.61 2.57–2.64 12.77 7.79–17.96 7.43 5.11–10.0019 Sandstone 2.60 2.58–2.62 2.64 2.62–2.65 3.61 3.42–3.93 2.26 2.16–2.3520 Chamositic- Siderite 2.62 2.60–2.65 2.82 2.808–2.840 20.02 18.96–21.13 12.97 12.40–13.5021 Dolomite 2.58 2.55–2.59 2.64 2.62–2.65 6.15 5.86–6.33 3.94 3.74–4.1322 Dolomite 2.77 2.70–2.79 2.78 2.71–2.87 1.23 1.02–1.53 0.83 0.67–1.0623 Dolomite 2.81 2.80–2.83 2.82 2.80–2.83 0.38 0.26–0.51 0.25 0.18–0.3324 Dolomite 2.49 2.44–2.52 2.56 2.52–2.58 6.43 5.97–7.20 4.11 3.74–4.4625 Limestone 2.61 2.59–2.62 2.64 2.63–2.65 3.47 2.88–4.29 0.99 0.74–1.2426 Limestone 2.67 2.66–2.69 2.68 2.66–2.70 0.79 0.51–1.36 0.48 0.31–0.8227 Limestone 3.17 2.50–4.83 3.20 2.58–4.85 2.81 0.91–7.33 1.57 0.61–4.3128 Limestone 2.65 2.63–2.67 2.66 2.65–2.67 1.37 0.52–2.26 0.86 0.36–1.4329 Limestone 2.688 2.685–2.691 2.70 2.697–2.704 1.17 1.11–1.22 0.78 0.73–0.8230 Limestone 2.50 2.47–2.52 2.57 2.53–2.58 6.53 6.53–6.64 4.13 3.65–4.3931 Limestone 2.47 2.39–2.50 2.54 2.46–2.57 7.15 6.04–8.14 4.11 3.20–5.1532 Rock Gypsum 2.07 2.00–2.12 2.25 2.21–2.28 18.37 14.01–22.74 10.70 9.42–13.5433 Marl 2.00 1.97–2.02 2.25 2.23–2.26 24.70 23.70–25.94 14.95 14.51–15.35
M.Z. Abu Bakar et al. / Wear 368-369 (2016) 132–145 139
1.0 mm, as suggested by Suana and Peters [51] and Al-Ameen andWaller [52].
The softening of the rocks is also visible in Fig. 4, where sig-nificant reduction (overall 50%) in uniaxial compressive strengthwas observed for majority of the rocks tested upon full saturation,compared to dried samples, as reported in the previous studies[4,55–67,8,9,68,11,13,69] among others.
Multiple regression analysis was carried out to develop anempirical model for the prediction of CAIsat from rock properties,normally measured in laboratory testing. SPSS-21.0 statisticalsoftware package was used for the statistical analysis with CAIsat asthe response variable and UCS, BTS, density, Schimazek's F-value,RAI in saturated conditions, quartz content (QC %), equivalentquartz content (EQC %), porosity, pore-space volume, mean quartzgrain size (∅-Qtz), average grain size of minerals (∅), as inde-pendent variables. In order to evaluate all possible regressionmodels, a stepwise multi variable regression technique wasselected. This method is a combination of forward selection andbackward elimination. In this technique the regressors are enteredin the model individually in descending order of their partialF-statistics values, provided that they remain significant at a pre-fixed significance level of entry (SLE). The equation is evaluated ateach step when an independent variable is entered to the model,and the variable with the smallest partial F-statistics value ischecked at the pre-defined significance level to stay (SLS) andremoved if established insignificant. This procedure is followed byiteration of the steps until the selection of an additional regressordoes not increase the R2 value by a substantial amount at thepre-fixed level of significance [46]. Accordingly, the variables
Schmizek's F-valuesat, UCSsat, ∅-Qtz and BTSsat were incorporatedin the regression equation and the independent variables includ-ing densitysat, RAIsat, QC (%), EQC (%), ∅, porosity, pore-spacevolume were excluded from the model due to their lack of sta-tistical significance at α¼0.1. Eq. (5), presents the results of best fitregression model (F statistics value¼50.543, p valueo0.0001 atα¼0.10).
CAIsat ¼ 0:111þ0:431 � F�valuesatð Þþ0:008� UCSsatð Þþ1:753 � ∅� ;Q ; t; zð Þþ0:117
� BTSsatð Þ; ðR2 ¼ 0:88Þ ð5ÞTo check the validity and statistical significance of the current
derived equation, standard test statistics were employed. Thevalue of co-efficient of determination (R2¼0.88) for this model(Eq. (5)) indicates that 88% of the variance in CAIsat can be pre-dicted from the variables (Schmizek's F-valuesat, UCSsat, ∅-Qtz andBTSsat). The computed value of correlation coefficient (R¼0.94)shows a strong relationship between the response and indepen-dent variables. The standard error of the estimate also called theroot mean square error, is the standard deviation of the error term,and is the square root of the mean square residual [70]. For Eq. (5),the standard error of the estimate specifies that the standarddeviation of the residuals is 0.23. The adjusted R2 value suggeststhat the proposed model accounts for 86.20% of total variation inthe CAIsat values.
Moreover the regression model was also checked for colli-nearity. The variance inflation factor (VIF) is the most commonlyused tool for finding the severity of collinearity. The VIF is thecoefficient of determination of each independent variable with all
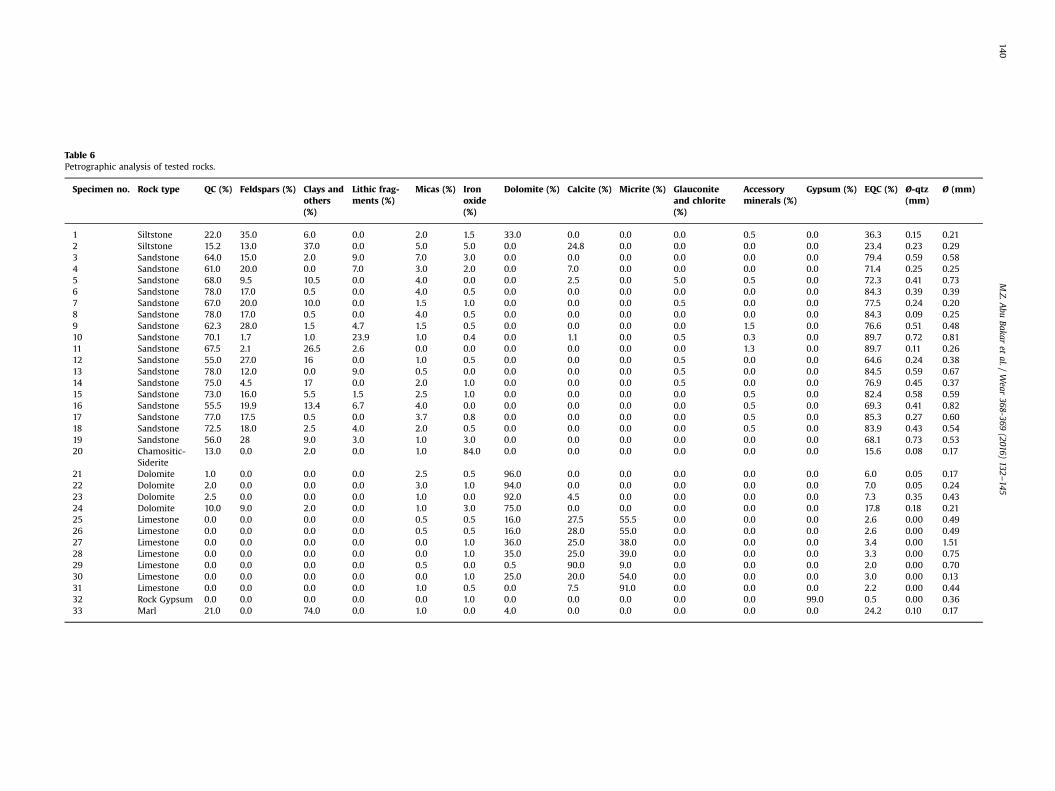
Table 6Petrographic analysis of tested rocks.
Specimen no. Rock type QC (%) Feldspars (%) Clays andothers(%)
Lithic frag-ments (%)
Micas (%) Ironoxide(%)
Dolomite (%) Calcite (%) Micrite (%) Glauconiteand chlorite(%)
Accessoryminerals (%)
Gypsum (%) EQC (%) Ø-qtz(mm)
Ø (mm)
1 Siltstone 22.0 35.0 6.0 0.0 2.0 1.5 33.0 0.0 0.0 0.0 0.5 0.0 36.3 0.15 0.212 Siltstone 15.2 13.0 37.0 0.0 5.0 5.0 0.0 24.8 0.0 0.0 0.0 0.0 23.4 0.23 0.293 Sandstone 64.0 15.0 2.0 9.0 7.0 3.0 0.0 0.0 0.0 0.0 0.0 0.0 79.4 0.59 0.584 Sandstone 61.0 20.0 0.0 7.0 3.0 2.0 0.0 7.0 0.0 0.0 0.0 0.0 71.4 0.25 0.255 Sandstone 68.0 9.5 10.5 0.0 4.0 0.0 0.0 2.5 0.0 5.0 0.5 0.0 72.3 0.41 0.736 Sandstone 78.0 17.0 0.5 0.0 4.0 0.5 0.0 0.0 0.0 0.0 0.0 0.0 84.3 0.39 0.397 Sandstone 67.0 20.0 10.0 0.0 1.5 1.0 0.0 0.0 0.0 0.5 0.0 0.0 77.5 0.24 0.208 Sandstone 78.0 17.0 0.5 0.0 4.0 0.5 0.0 0.0 0.0 0.0 0.0 0.0 84.3 0.09 0.259 Sandstone 62.3 28.0 1.5 4.7 1.5 0.5 0.0 0.0 0.0 0.0 1.5 0.0 76.6 0.51 0.4810 Sandstone 70.1 1.7 1.0 23.9 1.0 0.4 0.0 1.1 0.0 0.5 0.3 0.0 89.7 0.72 0.8111 Sandstone 67.5 2.1 26.5 2.6 0.0 0.0 0.0 0.0 0.0 0.0 1.3 0.0 89.7 0.11 0.2612 Sandstone 55.0 27.0 16 0.0 1.0 0.5 0.0 0.0 0.0 0.5 0.0 0.0 64.6 0.24 0.3813 Sandstone 78.0 12.0 0.0 9.0 0.5 0.0 0.0 0.0 0.0 0.5 0.0 0.0 84.5 0.59 0.6714 Sandstone 75.0 4.5 17 0.0 2.0 1.0 0.0 0.0 0.0 0.5 0.0 0.0 76.9 0.45 0.3715 Sandstone 73.0 16.0 5.5 1.5 2.5 1.0 0.0 0.0 0.0 0.0 0.5 0.0 82.4 0.58 0.5916 Sandstone 55.5 19.9 13.4 6.7 4.0 0.0 0.0 0.0 0.0 0.0 0.5 0.0 69.3 0.41 0.8217 Sandstone 77.0 17.5 0.5 0.0 3.7 0.8 0.0 0.0 0.0 0.0 0.5 0.0 85.3 0.27 0.6018 Sandstone 72.5 18.0 2.5 4.0 2.0 0.5 0.0 0.0 0.0 0.0 0.5 0.0 83.9 0.43 0.5419 Sandstone 56.0 28 9.0 3.0 1.0 3.0 0.0 0.0 0.0 0.0 0.0 0.0 68.1 0.73 0.5320 Chamositic-
Siderite13.0 0.0 2.0 0.0 1.0 84.0 0.0 0.0 0.0 0.0 0.0 0.0 15.6 0.08 0.17
21 Dolomite 1.0 0.0 0.0 0.0 2.5 0.5 96.0 0.0 0.0 0.0 0.0 0.0 6.0 0.05 0.1722 Dolomite 2.0 0.0 0.0 0.0 3.0 1.0 94.0 0.0 0.0 0.0 0.0 0.0 7.0 0.05 0.2423 Dolomite 2.5 0.0 0.0 0.0 1.0 0.0 92.0 4.5 0.0 0.0 0.0 0.0 7.3 0.35 0.4324 Dolomite 10.0 9.0 2.0 0.0 1.0 3.0 75.0 0.0 0.0 0.0 0.0 0.0 17.8 0.18 0.2125 Limestone 0.0 0.0 0.0 0.0 0.5 0.5 16.0 27.5 55.5 0.0 0.0 0.0 2.6 0.00 0.4926 Limestone 0.0 0.0 0.0 0.0 0.5 0.5 16.0 28.0 55.0 0.0 0.0 0.0 2.6 0.00 0.4927 Limestone 0.0 0.0 0.0 0.0 0.0 1.0 36.0 25.0 38.0 0.0 0.0 0.0 3.4 0.00 1.5128 Limestone 0.0 0.0 0.0 0.0 0.0 1.0 35.0 25.0 39.0 0.0 0.0 0.0 3.3 0.00 0.7529 Limestone 0.0 0.0 0.0 0.0 0.5 0.0 0.5 90.0 9.0 0.0 0.0 0.0 2.0 0.00 0.7030 Limestone 0.0 0.0 0.0 0.0 0.0 1.0 25.0 20.0 54.0 0.0 0.0 0.0 3.0 0.00 0.1331 Limestone 0.0 0.0 0.0 0.0 1.0 0.5 0.0 7.5 91.0 0.0 0.0 0.0 2.2 0.00 0.4432 Rock Gypsum 0.0 0.0 0.0 0.0 0.0 1.0 0.0 0.0 0.0 0.0 0.0 99.0 0.5 0.00 0.3633 Marl 21.0 0.0 74.0 0.0 1.0 0.0 4.0 0.0 0.0 0.0 0.0 0.0 24.2 0.10 0.17
M.Z.A
buBakar
etal./
Wear
368-369(2016)
132–145
140
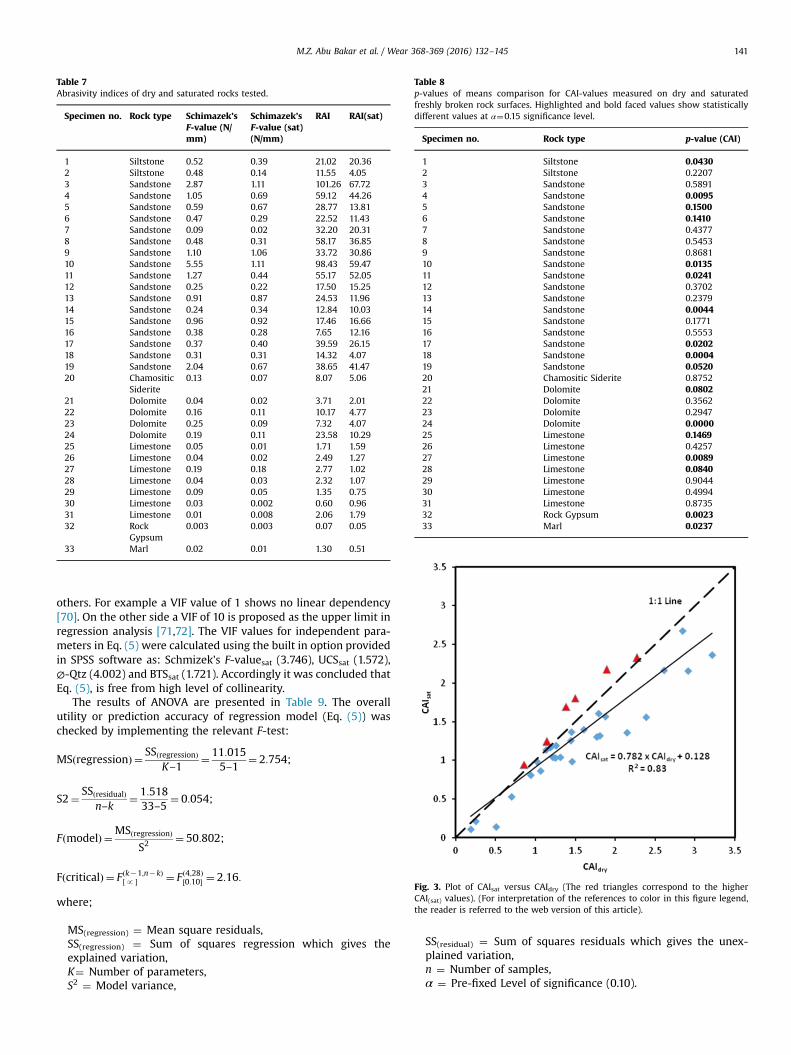
Table 7Abrasivity indices of dry and saturated rocks tested.
Specimen no. Rock type Schimazek’sF-value (N/mm)
Schimazek’sF-value (sat)(N/mm)
RAI RAI(sat)
1 Siltstone 0.52 0.39 21.02 20.362 Siltstone 0.48 0.14 11.55 4.053 Sandstone 2.87 1.11 101.26 67.724 Sandstone 1.05 0.69 59.12 44.265 Sandstone 0.59 0.67 28.77 13.816 Sandstone 0.47 0.29 22.52 11.437 Sandstone 0.09 0.02 32.20 20.318 Sandstone 0.48 0.31 58.17 36.859 Sandstone 1.10 1.06 33.72 30.8610 Sandstone 5.55 1.11 98.43 59.4711 Sandstone 1.27 0.44 55.17 52.0512 Sandstone 0.25 0.22 17.50 15.2513 Sandstone 0.91 0.87 24.53 11.9614 Sandstone 0.24 0.34 12.84 10.0315 Sandstone 0.96 0.92 17.46 16.6616 Sandstone 0.38 0.28 7.65 12.1617 Sandstone 0.37 0.40 39.59 26.1518 Sandstone 0.31 0.31 14.32 4.0719 Sandstone 2.04 0.67 38.65 41.4720 Chamositic
Siderite0.13 0.07 8.07 5.06
21 Dolomite 0.04 0.02 3.71 2.0122 Dolomite 0.16 0.11 10.17 4.7723 Dolomite 0.25 0.09 7.32 4.0724 Dolomite 0.19 0.11 23.58 10.2925 Limestone 0.05 0.01 1.71 1.5926 Limestone 0.04 0.02 2.49 1.2727 Limestone 0.19 0.18 2.77 1.0228 Limestone 0.04 0.03 2.32 1.0729 Limestone 0.09 0.05 1.35 0.7530 Limestone 0.03 0.002 0.60 0.9631 Limestone 0.01 0.008 2.06 1.7932 Rock
Gypsum0.003 0.003 0.07 0.05
33 Marl 0.02 0.01 1.30 0.51
Table 8p-values of means comparison for CAI-values measured on dry and saturatedfreshly broken rock surfaces. Highlighted and bold faced values show statisticallydifferent values at α¼0.15 significance level.
Specimen no. Rock type p-value (CAI)
1 Siltstone 0.04302 Siltstone 0.22073 Sandstone 0.58914 Sandstone 0.00955 Sandstone 0.15006 Sandstone 0.14107 Sandstone 0.43778 Sandstone 0.54539 Sandstone 0.868110 Sandstone 0.013511 Sandstone 0.024112 Sandstone 0.370213 Sandstone 0.237914 Sandstone 0.004415 Sandstone 0.177116 Sandstone 0.555317 Sandstone 0.020218 Sandstone 0.000419 Sandstone 0.052020 Chamositic Siderite 0.875221 Dolomite 0.080222 Dolomite 0.356223 Dolomite 0.294724 Dolomite 0.000025 Limestone 0.146926 Limestone 0.425727 Limestone 0.008928 Limestone 0.084029 Limestone 0.904430 Limestone 0.499431 Limestone 0.873532 Rock Gypsum 0.002333 Marl 0.0237
Fig. 3. Plot of CAIsat versus CAIdry (The red triangles correspond to the higherCAI(sat) values). (For interpretation of the references to color in this figure legend,the reader is referred to the web version of this article).
M.Z. Abu Bakar et al. / Wear 368-369 (2016) 132–145 141
others. For example a VIF value of 1 shows no linear dependency[70]. On the other side a VIF of 10 is proposed as the upper limit inregression analysis [71,72]. The VIF values for independent para-meters in Eq. (5) were calculated using the built in option providedin SPSS software as: Schmizek's F-valuesat (3.746), UCSsat (1.572),∅-Qtz (4.002) and BTSsat (1.721). Accordingly it was concluded thatEq. (5), is free from high level of collinearity.
The results of ANOVA are presented in Table 9. The overallutility or prediction accuracy of regression model (Eq. (5)) waschecked by implementing the relevant F-test:
MSðregressionÞ ¼ SS regressionð ÞK–1
¼ 11:0155–1
¼ 2:754;
S2¼ SSðresidualÞn–k
¼ 1:51833–5
¼ 0:054;
FðmodelÞ ¼MSðregressionÞS2
¼ 50:802;
FðcriticalÞ ¼ F ðk�1;n�kÞ½p � ¼ F ð4;28Þ½0:10� ¼ 2:16:
where;
MS(regression) ¼ Mean square residuals,SS(regression) ¼ Sum of squares regression which gives theexplained variation,K¼ Number of parameters,S2 ¼ Model variance,
SS(residual) ¼ Sum of squares residuals which gives the unex-plained variation,n ¼ Number of samples,α ¼ Pre-fixed Level of significance (0.10).
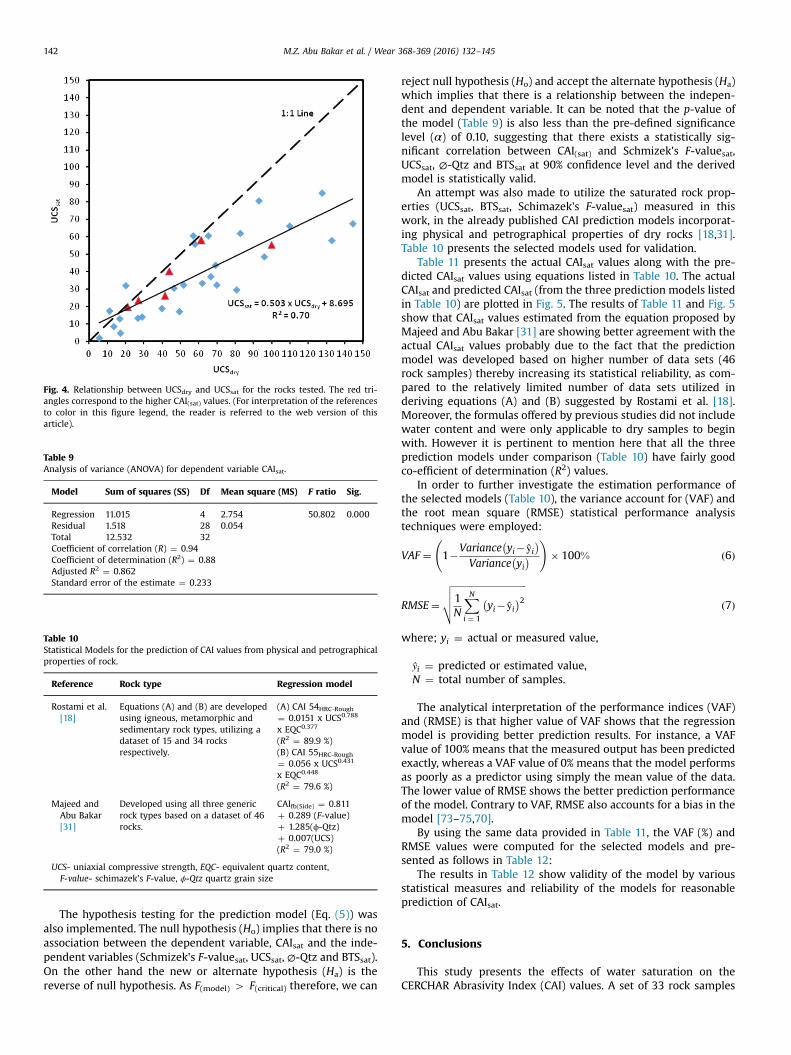
Fig. 4. Relationship between UCSdry and UCSsat for the rocks tested. The red tri-angles correspond to the higher CAI(sat) values. (For interpretation of the referencesto color in this figure legend, the reader is referred to the web version of thisarticle).
Table 9Analysis of variance (ANOVA) for dependent variable CAIsat.
Model Sum of squares (SS) Df Mean square (MS) F ratio Sig.
Regression 11.015 4 2.754 50.802 0.000Residual 1.518 28 0.054Total 12.532 32Coefficient of correlation (R) ¼ 0.94Coefficient of determination (R2) ¼ 0.88Adjusted R2 ¼ 0.862Standard error of the estimate ¼ 0.233
Table 10Statistical Models for the prediction of CAI values from physical and petrographicalproperties of rock.
Reference Rock type Regression model
Rostami et al.[18]
Equations (A) and (B) are developedusing igneous, metamorphic andsedimentary rock types, utilizing adataset of 15 and 34 rocksrespectively.
(A) CAI 54HRC-Rough¼ 0.0151 x UCS0.788
x EQC0.377
(R2 ¼ 89.9 %)(B) CAI 55HRC-Rough¼ 0.056 x UCS0.431
x EQC0.448
(R2 ¼ 79.6 %)
Majeed andAbu Bakar[31]
Developed using all three genericrock types based on a dataset of 46rocks.
CAIfb(Side) ¼ 0.811þ 0.289 (F-value)þ 1.285(ϕ-Qtz)þ 0.007(UCS)(R2 ¼ 79.0 %)
UCS- uniaxial compressive strength, EQC- equivalent quartz content,F-value- schimazek’s F-value, ϕ-Qtz quartz grain size
M.Z. Abu Bakar et al. / Wear 368-369 (2016) 132–145142
The hypothesis testing for the prediction model (Eq. (5)) wasalso implemented. The null hypothesis (Ho) implies that there is noassociation between the dependent variable, CAIsat and the inde-pendent variables (Schmizek's F-valuesat, UCSsat, ∅-Qtz and BTSsat).On the other hand the new or alternate hypothesis (Ha) is thereverse of null hypothesis. As F(model) 4 F(critical) therefore, we can
reject null hypothesis (Ho) and accept the alternate hypothesis (Ha)which implies that there is a relationship between the indepen-dent and dependent variable. It can be noted that the p-value ofthe model (Table 9) is also less than the pre-defined significancelevel (α) of 0.10, suggesting that there exists a statistically sig-nificant correlation between CAI(sat) and Schmizek's F-valuesat,UCSsat, ∅-Qtz and BTSsat at 90% confidence level and the derivedmodel is statistically valid.
An attempt was also made to utilize the saturated rock prop-erties (UCSsat, BTSsat, Schimazek's F-valuesat) measured in thiswork, in the already published CAI prediction models incorporat-ing physical and petrographical properties of dry rocks [18,31].Table 10 presents the selected models used for validation.
Table 11 presents the actual CAIsat values along with the pre-dicted CAIsat values using equations listed in Table 10. The actualCAIsat and predicted CAIsat (from the three prediction models listedin Table 10) are plotted in Fig. 5. The results of Table 11 and Fig. 5show that CAIsat values estimated from the equation proposed byMajeed and Abu Bakar [31] are showing better agreement with theactual CAIsat values probably due to the fact that the predictionmodel was developed based on higher number of data sets (46rock samples) thereby increasing its statistical reliability, as com-pared to the relatively limited number of data sets utilized inderiving equations (A) and (B) suggested by Rostami et al. [18].Moreover, the formulas offered by previous studies did not includewater content and were only applicable to dry samples to beginwith. However it is pertinent to mention here that all the threeprediction models under comparison (Table 10) have fairly goodco-efficient of determination (R2) values.
In order to further investigate the estimation performance ofthe selected models (Table 10), the variance account for (VAF) andthe root mean square (RMSE) statistical performance analysistechniques were employed:
VAF ¼ 1�Variance yi�ŷi� �
Variance yi� �
!� 100% ð6Þ
RMSE¼
ffiffiffiffiffiffiffiffiffiffiffiffiffiffiffiffiffiffiffiffiffiffiffiffiffiffiffiffiffiffiffiffi1N
XNi ¼ 1
yi�ŷi� �2
vuut ð7Þ
where; yi ¼ actual or measured value,
ŷi ¼ predicted or estimated value,N ¼ total number of samples.
The analytical interpretation of the performance indices (VAF)and (RMSE) is that higher value of VAF shows that the regressionmodel is providing better prediction results. For instance, a VAFvalue of 100% means that the measured output has been predictedexactly, whereas a VAF value of 0% means that the model performsas poorly as a predictor using simply the mean value of the data.The lower value of RMSE shows the better prediction performanceof the model. Contrary to VAF, RMSE also accounts for a bias in themodel [73–75,70].
By using the same data provided in Table 11, the VAF (%) andRMSE values were computed for the selected models and pre-sented as follows in Table 12:
The results in Table 12 show validity of the model by variousstatistical measures and reliability of the models for reasonableprediction of CAIsat.
5. Conclusions
This study presents the effects of water saturation on theCERCHAR Abrasivity Index (CAI) values. A set of 33 rock samples
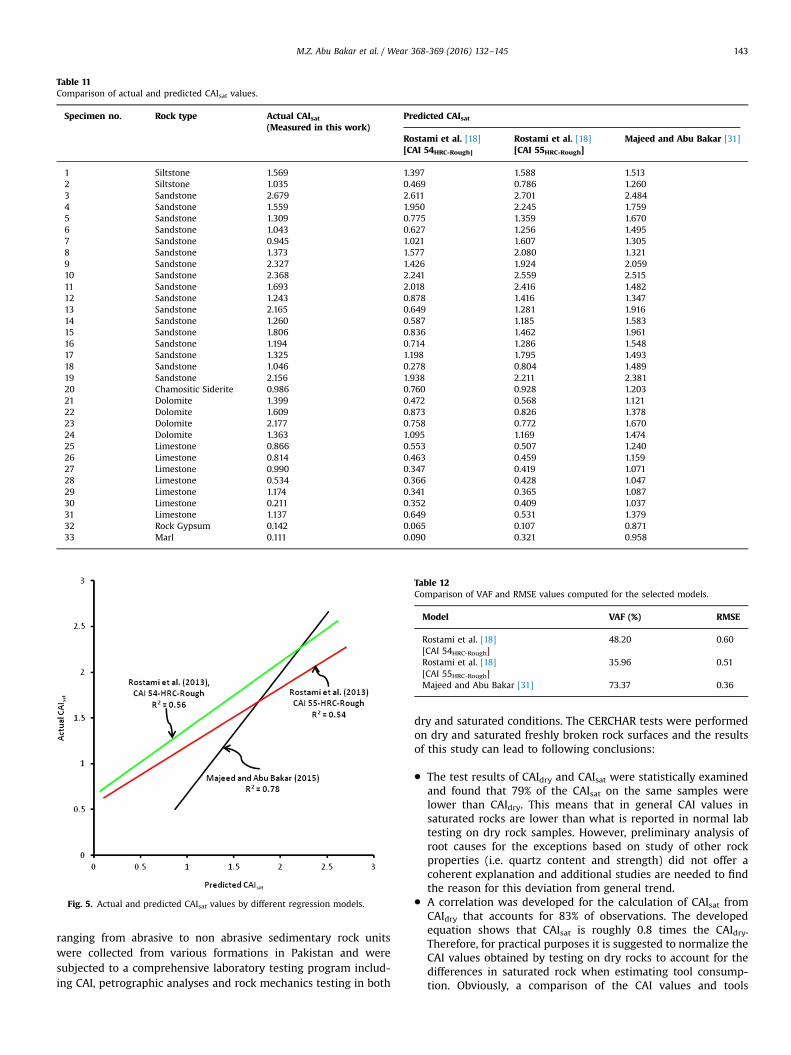
Table 12Comparison of VAF and RMSE values computed for the selected models.
Model VAF (%) RMSE
Rostami et al. [18] 48.20 0.60[CAI 54HRC-Rough]Rostami et al. [18] 35.96 0.51[CAI 55HRC-Rough]Majeed and Abu Bakar [31] 73.37 0.36
Table 11Comparison of actual and predicted CAIsat values.
Specimen no. Rock type Actual CAIsat(Measured in this work)
Predicted CAIsat
Rostami et al. [18][CAI 54HRC-Rough]
Rostami et al. [18][CAI 55HRC-Rough]
Majeed and Abu Bakar [31]
1 Siltstone 1.569 1.397 1.588 1.5132 Siltstone 1.035 0.469 0.786 1.2603 Sandstone 2.679 2.611 2.701 2.4844 Sandstone 1.559 1.950 2.245 1.7595 Sandstone 1.309 0.775 1.359 1.6706 Sandstone 1.043 0.627 1.256 1.4957 Sandstone 0.945 1.021 1.607 1.3058 Sandstone 1.373 1.577 2.080 1.3219 Sandstone 2.327 1.426 1.924 2.05910 Sandstone 2.368 2.241 2.559 2.51511 Sandstone 1.693 2.018 2.416 1.48212 Sandstone 1.243 0.878 1.416 1.34713 Sandstone 2.165 0.649 1.281 1.91614 Sandstone 1.260 0.587 1.185 1.58315 Sandstone 1.806 0.836 1.462 1.96116 Sandstone 1.194 0.714 1.286 1.54817 Sandstone 1.325 1.198 1.795 1.49318 Sandstone 1.046 0.278 0.804 1.48919 Sandstone 2.156 1.938 2.211 2.38120 Chamositic Siderite 0.986 0.760 0.928 1.20321 Dolomite 1.399 0.472 0.568 1.12122 Dolomite 1.609 0.873 0.826 1.37823 Dolomite 2.177 0.758 0.772 1.67024 Dolomite 1.363 1.095 1.169 1.47425 Limestone 0.866 0.553 0.507 1.24026 Limestone 0.814 0.463 0.459 1.15927 Limestone 0.990 0.347 0.419 1.07128 Limestone 0.534 0.366 0.428 1.04729 Limestone 1.174 0.341 0.365 1.08730 Limestone 0.211 0.352 0.409 1.03731 Limestone 1.137 0.649 0.531 1.37932 Rock Gypsum 0.142 0.065 0.107 0.87133 Marl 0.111 0.090 0.321 0.958
Fig. 5. Actual and predicted CAIsat values by different regression models.
M.Z. Abu Bakar et al. / Wear 368-369 (2016) 132–145 143
ranging from abrasive to non abrasive sedimentary rock unitswere collected from various formations in Pakistan and weresubjected to a comprehensive laboratory testing program includ-ing CAI, petrographic analyses and rock mechanics testing in both
dry and saturated conditions. The CERCHAR tests were performedon dry and saturated freshly broken rock surfaces and the resultsof this study can lead to following conclusions:
� The test results of CAIdry and CAIsat were statistically examinedand found that 79% of the CAIsat on the same samples werelower than CAIdry. This means that in general CAI values insaturated rocks are lower than what is reported in normal labtesting on dry rock samples. However, preliminary analysis ofroot causes for the exceptions based on study of other rockproperties (i.e. quartz content and strength) did not offer acoherent explanation and additional studies are needed to findthe reason for this deviation from general trend.
� A correlation was developed for the calculation of CAIsat fromCAIdry that accounts for 83% of observations. The developedequation shows that CAIsat is roughly 0.8 times the CAIdry.Therefore, for practical purposes it is suggested to normalize theCAI values obtained by testing on dry rocks to account for thedifferences in saturated rock when estimating tool consump-tion. Obviously, a comparison of the CAI values and tools
M.Z. Abu Bakar et al. / Wear 368-369 (2016) 132–145144
consumption in dry and saturated conditions is needed tovalidate this recommendation.
� A multiple linear regression model was also proposed for theprediction of CAIsat from the petrographical (Ø-Qtz) and geo-mechanical properties (F-valuesat, UCSsat and BTSsat) of satu-rated rocks. This empirical model accounts for 88% of totalvariation in the dependant variable (CAIsat) and can beemployed for the estimation of CERCHAR abrasivity index in thesaturated rock conditions from routine rock mechanics testingparameters.
� Finally the utility of existing correlations proposed by Rostamiet al. [18] and Majeed and Abu Bakar [31] for the estimation ofCAIsat was checked statistically (in terms of performance indicessuch as VAF and RMSE) using the dataset generated in thiswork. The performance comparison of these prediction modelsillustrate that the correlation equation developed by Majeedand Abu Bakar [31] is statistically more significant.
References
[1] M.Z. Abu Bakar, L.S. Gertsch, Evaluation of saturation effects on drag pickcutting of a brittle sandstone from full scale linear cutting tests, Tunn. Undergr.Space Technol. 34 (2013) 124–134.
[2] W.F. Brace, R.J. Martin, A test of the law of effective stress for crystalline rocksof low porosity, Int. J. Rock Mech. Min. Sci. 5 (1968) 415–426.
[3] P. Rehbinder, V. Lichtman, Effect of surface active media on strains and rupturein solids, in: Proceedings of the 2nd International Congress on Surface Activity,1957, pp. 563–582.
[4] P.S.B. Colback, B.L. Wiid, The influence of moisture content on the compressivestrength of rocks, in: Proceedings of the 3rd Rock Mechanics Symposium,Toronto, Canada, 1965, pp. 65–83.
[5] V.S. Vutukuri, The effect of liquids on the tensile strength of limestone, Int. J.Rock Mech. Min. Sci. Geo-mech. 11 (1974) 27–29.
[6] E.M. Van Eeckhout, The mechanisms of strength reduction due to moisture incoal mine shales, Int. J. Rock Mech. Min. Sci. Geomech. 13 (1976) 61–67.
[7] E. Broch, Changes in rock strength caused by water, in: Proceedings of 4thCongress of International Society for Rock Mechanics, Montreux, Switzerland,1, 1979, pp. 71–75.
[8] C.G. Dyke, L. Dobereiner, Evaluating the strength and deformability of sand-stones, Q. J. Eng. Geol. 24 (1991) 123–134.
[9] A.B. Hawkins, B.J. McConnell, Sensitivity of sandstone strength and deform-ability to changes in moisture content, Q. J. Eng. Geol. 25 (1992) 115–130.
[10] B. Vasarhelyi, Some observations regarding the strength and deformability ofsandstones in dry and saturated conditions, Bull. Eng. Geol. Environ. 62 (2003)245–249.
[11] Z.A. Erguler, R. Ulusay, Water induced variations in mechanical properties ofclay bearing rocks, Int. J. Rock Mech. Min. Sci. 46 (2009) 355–370.
[12] J. Mammen, S. Saydam, P. Hagan, A Study on the Effect of Moisture Content onRock Cutting Performance, in Aziz, N (ed), Coal 2009: Coal Operators' Con-ference, University of Wollongong & the Australasian Institute of Mining andMetallurgy (2009) 340–347.
[13] I. Yilmaz, Influence of water content on the strength and deformability ofgypsum, Int. J. Rock Mech. Min. Sci. 47 (2010) 342–347.
[14] M.S.A. Perera, P.G. Ranjith, M. Peter, Effects of saturation medium and pressureon strength parameters of Latrobe Valley brown coal: Carbon dioxide, waterand nitrogen saturations, Energy 36 (2011) 6941–6947.
[15] B.A. Poulsen, B. Shen, D.J. Williams, C. Huddlestone-Holmes, N. Erarslan, J. Qin,Strength reduction on saturation of coal and coal measures rocks withimplications for coal pillar strength, Int. J. Rock Mech. Min. Sci. 71 (2014)41–52.
[16] D.K. Soni, Effect of saturation and deformation rate on split tensile strength forvarious sedimentary rocks International conference Data Mining, Civil andMechanical Engineering, Bali, Indonesia (2015), p. 53–55.
[17] Centre d’Etudes et des Recherches des Charbonages de France-CERCHAR, TheCERCHAR abrasiveness index, Verneuil, 1986.
[18] J. Rostami, A.R. Ghasemi, E.A. Gharahbagh, C. Dogruoz, F. Dahl, Study ofdominant factors affecting Cerchar Abrasivity Index, Rock Mech. Rock Eng.(2013), http://dx.doi.org/10.1007/s00603-013-0487-3.
[19] N.F. P94-430-1, Determination du pouvoir abrasive d’une roche- Partie 1: Essaide rayure avec une pointe, AFNOR Association Francaise de Normalisation,Paris, 2000.
[20] ASTM, Standard test method for laboratory determination of abrasiveness ofrock using the CERCHAR method, American Society for Testing and Materials,West Conshohocken, United States (2010), p. 1–6 10–1520/D7625-10.
[21] M. Alber, O. Yarali, F. Dahl, A. Bruland, H. Kasling, T.N. Michalakopoulos,M. Cardu, P. Hagan, H. Aydm, A. Ozarslan, ISRM suggested method for deter-mining the abrasivity of rock by the CERCHAR abrasivity test, Rock Mech. RockEng. 47 (2014) 261–266.
[22] J. Rostami, L. Ozdemir, A. Bruland, F. Dahl, Review of issues related to Cercharabrasivity testing and their implications on Geotechnical investigations andcutter cost estimates, Proc. RETC (2005) 738–751.
[23] L.M. Ford, M. Friedman, Optimization of rock-cutting tools used in coal mining,in: Proceedings of the 24th U.S. Symposium on Rock Mechanics, Texas, 1983,pp. 725–732.
[24] P.N.W. Verhoef. Wear of rock cutting tools (Implications for the site investi-gation of rock dredging projects), 1997, A.A. Balkema.
[25] B. Tiryaki, A.C. Dikmen, Effects of rock properties on specific cutting energy inlinear cutting of sandstones by picks, Rock Mech. Rock Eng. 39 (2) (2006)89–120.
[26] M.P. O’Reilly, S.G. Tough, N.D. Pirrie, H.J. Hignett, F.F. Roxborough, in: J.S. Davis(Ed.), Tunnelling trials in chalk, 67, Proceedings of the Institution of CivilEngineers, London, UK, 1979, pp. 255–283.
[27] F.F. Roxborough, A. Rispin, The mechanical cutting characteristics of the lowerchalk, Tunn. Tunn. 4 (1973) 5–67.
[28] H.R. Phillips, F.F. Roxborough, The influence of tool material on the wear rateof rock cutting picks, in: Proceedings of the 34th Annual Conference of Aus-tralian Institute of Metals, Brisbane, 1981, pp. 52–56.
[29] M. Iphar, R.M. Goktan, The effect of liquids on mechanical strength andabrasiveness of rocks, Eng. And Arch. Fac. Osmangazi Univ. 17 (1) (2003) 1–15.
[30] N. Espallargas, P.D. Jakobsen, L. Langmaack, F.J. Macias, Influence of corrosionon the abrasion of cutter steel used in TBM tunneling, Rock Mech. Rock Eng.(2014), http://dx.doi.org/10.1007/s00603-014-0552-6.
[31] Y. Majeed, M.Z. Abu Bakar, Statistical evaluation of CERCHAR Abrasivity Index(CAI) measurement methods and dependence on petrographic and mechan-ical properties of selected rocks of Pakistan, Bull. Eng. Geol. Environ. (2015),http://dx.doi.org/10.1007/s10064-015-0799-5.
[32] ASTM, Standard practices for preparing rock core as cylindrical test specimensand verifying conformance to dimensional and shape tolerances, AmericanSociety for Testing and Materials, West Conshohocken, United States, 2008.
[33] US Army Corps of Engineers, ⟨http://gsl.erdc.usace.army.mil/SL/MTC/handbook/RT/RTH/116-95.pdf⟩, accessed July 9, 2012.
[34] M.Z. Abu Bakar, L.S. Gertsch, Saturation effects on disc cutting of sandstone, in:Prpceedings of the American Rock Mechanics Association, 45th US RockMechanics/Geomechanics Symposium, San Francisco, CA., 254, 2011, pp. 1–9.
[35] G. West, Rock abrasiveness testing for tunneling, Int. J. Rock Mech. Min. Sci. 26(1989) 151–160.
[36] A. Bruland. Hard rock tunnel boring, PhD. Dissertation, Norwegian Universityof Sciences and Technology of Trondheim (NTNU) Vol. 3, Advance rate andcutter wear, Report No. 1B-98, 2000.
[37] S. Yagiz, Assessment of brittleness using rock strength and density with punchpenetration test, Tunn. Undergr. Space Technol. 24 (2009) 66–74.
[38] ISRM, Suggested methods for determining the uniaxial compressive strengthand deformability of rock materials, Int. J. Rocks Mech. Min. Sci. Geomech. 16(1979) 135–140.
[39] ISRM, Suggested methods for determining tensile strength of rock materials,Int. J. Rocks Mech. Min. Sci. Geomech. 15 (1978) 99–103.
[40] M. Karakus, M. Kumral, O. Kilic, Predicting elastic properties of intact rocksfrom index tests using multiple regression modeling, Int. J. Rocks Mech. Min.Sci. Geomech. 42 (2005) 323–330.
[41] ISRM, Suggested methods for determining water content, porosity, density,absorption and related properties and swelling and slake-durability indexproperties, Int. J. Rocks Mech. Min. Sci. Geomech. 16 (1979) 141–156.
[42] D. Paschen, Petrographic and geomechanical characterization of Ruhr areacarboniferous rocks for the determination of their wear behavior PhD dis-sertation, Technische Unversitat Claustahl 202 (1980).
[43] J. Schimazek, H. Knatz, Der einfluss des gesteinsaufbaus auf die schnitt-geschwindigkeit und den meisselverschlers von stricken vortriebs maschinen,Glückauf 106 (1970) 274–278.
[44] R.J. Plinninger, Klassifizierung und Prognose von Werkzeugverschleiß beikonventionellen Gebirgslösungsverfahren im Festgestein. Münchner Geolo-gische Hefte, Reihe B – Angewandte, Geologie 17 (2002) 147.
[45] R.J. Plinninger, H. Kasling, K. Thuro, Wear prediction in hard rock excavationusing the CERCHAR Abrasiveness Index (CAI), in: Proceeding of the EUROCKand 53rd Geomechanics Colloquium, Schubert, 2004, pp. 599–604.
[46] V.A. Samaranayake, Statistical data analysis STAT-353 course, Missouri Uni-versity of Science and Technology, Rolla, MO, USA, 2009.
[47] M.Z. Abu Bakar, L.S. Gertsch, Radial pick cutting performance in dry andsaturated sandstone, Soc. Min. Metall. Explor. 332 (2012) 396–405.
[48] J. Rostami, E.A. Gharahbagh, A.M. Palomino, M. Mosleh, Development of soilabrasivity testing for soft ground tunneling using shield machines, Tunn.Undergr. Space Technol. 28 (2012) 245–256.
[49] M. Mosleh, E.A. Gharahbagh, J. Rostami, Effects of relative hardness andmoisture on tool wear in soil excavation operations, Wear 302 (2013)1555–1559.
[50] S.I. Al-Ameen, M.D. Waller, The influence of rock strength and abrasivemineral content on the Cerchar Abrasivity Index, Eng. Geol. 36 (1994)293–301.
[51] M. Suana, T. Peters, The cerchar abrasivity index and its relation to rockmineralogy and petrography, Rock Mech. 15 (1982) 1–7.
[52] S.I. Al-Ameen, M.D. Waller, Petrographic analysis for assessing the abrasive-ness of coal measures rocks, Dep. Min. Resour. Eng. Mag. 44 (1992) 29–34.
[53] M.T. Hamzaban, H. Memarian, J. Rostami, Continuous monitoring of pin tipwear and penetration into rock surface using a new CERCHAR abrasivitytesting device, Rock Mech. Rock Eng. 47 (2014) 689–701.
M.Z. Abu Bakar et al. / Wear 368-369 (2016) 132–145 145
[54] M.T. Hamzaban, H. Memarian, J. Rostami, H.G. Monfared, Study of rock-pininteraction in CERCHAR abrasivity test, Int. J. Rock Mech. Min. Scienc.e 72(2014) 100–108.
[55] B.L. Wiid, The influence of moisture content on the pre-rupture fracturing oftwo rock types, in: Proceedings of the 2nd Congress of the InternationalSociety of Rock Mechanics, Belgrade, 3, 1970, pp. 239–245.
[56] M. Kitaowa, G. Endo, K. Hoshino, Influence of moisture on the mechanicalproperties of soft rock, in: Proceedings of the 5th National Symposium onRock Mechanics, Japan, 1977.
[57] F.G. Bell, The physical and mechanical properties of the Fell sandstones,Northumberland, England, Eng. Geol. 12 (1978) 1–29.
[58] F.P. Hassani, B.N. Whittaker, M.J. Scoble, Strength characteristics of rocksassociated with open cast coal mining in the UK, in: Proceedings of the 20th U.S. Symposium on Rock Mechanics, Austin, 1979, pp. 347–356.
[59] R. Ferreira, L.C.C. Monteiro, J.E. Peres, F.A. de A. Prado Jr., Analise de algunsfatores que infleum na Resistencia a compressao do arenito Bauru, in: Pro-ceedings of the 3rd Brazilian Congress of Engineering Geology (ABGE), Ita-pema, 3, 1981, pp. 89–102.
[60] S.D. Priest, S. Selvakumar, The failure characteristics of selected British rocks AReport to the Transport and Research Laboratory, Department of Environmentand Transport, Imperial College, London, 1982.
[61] A. Koshima, R.G.Q. Frota, M.H. Lorano, J.C.B. de, F. Hoshisk, Comportamento epropriedades geomechanicas do arenito Bauru, Simposio Geotecnico SobreBacio Alto Parana, 2b, ABGE-ABMS-CBMR, Sanpaulo (1983), p. 173–189.
[62] P.J.N. Pells, M.J. Ferry, Needless stringency in sample preparation standards forlaboratory testing of weak rocks, in: Proceedings of the 5th Congress of theInternational Society of Rock Mechanics, Melbourne, 1983, pp. 203–207.
[63] L. Dobereiner PhD. Thesis, Engineering geology of weak sandstones, ImperialCollege, London, 1984.
[64] C.G. Dyke, The pre-peak deformation characteristics of sandstone at varyingmoisture contents M.Sc. Thesis, Imperial College, London, 1984.
[65] K.L. Gunsallus, F.H. Kulhawy, A comparative evaluation of rock strengthmeasures, Int. J. Rock Mech. Min. Sci. Geomech. Abstr. 21 (1984) 233–248.
[66] A. Denis, J.L. Durville, E. Massieu, R. Thorin, Problemes poses par un calcairetres poreux dans I’etude de la stabilite d’une carrier souterraine, in: Pro-ceedings of the 5th Congress of the International Association of EngineeringGeology, Buenos Aires, 1986, pp. 549–557.
[67] D.F. Howarth, The effect of pre-existing microcavities on mechanical rockperformance in sedimentary and crystalline rocks, Int. J. Rock Mech. Min. Sci.Geomech. Abstr. 24 (1987) 223–233.
[68] P.J.N. Pells, Substance and mass properties for the design of engineeringstructures in the Hawkesbury sandstone, Aust. Geomech. 39 (2004) 1–21.
[69] Y. Hui, J. Xueliang, L. Na, Experimental study on mechanical property ofperidotite under water-rock interaction, EJGE 19 (2014) 1179–1188.
[70] N.G. Yilmaz, M. Yurdakul, R.M. Goktan, Prediction of radial bit cutting force inhigh-strength rocks using multiple linear regression analysis, Int. J. RockMech. Min. Sci. 44 (2007) 962–970.
[71] P. Kennedy, A guide to econometrics, 6th Edition, Willey Blackwell, Oxford,2008.
[72] J.F. Hair, W.C. Black, B.J. Babin, R.E. Anderson, Multivariate data analysis, 7thEdition, Prentice Hall, Newyork, 2009.
[73] G.M. Alvarez, R. Babuska, Fuzzy model for the prediction of unconfinedcompressive strength of rock samples, I. J. Rock Mech. Min. Sci. 36 (1999)339–349.
[74] C. Gokceoglu, A fuzzy triangular chart to predict the uniaxial compressivestrength of Ankara agglomerates from their petrographic composition, Eng.Geol. 66 (2002) 39–51.
[75] C. Gokceoglu, K. Zorlu, A fuzzy model to predict the uniaxial compressivestrength and the modulus of elasticity of a problematic rock, Eng. Appl. Artif.Intell. 17 (2004) 61–72.