Embed Size (px)
Citation preview
Effects of SCR injection system parameters on UWS atomizationand mixing characteristics at low exhaust temperature
HEKUN JIA* , ZEYUAN ZHOU, BIFENG YIN, ZHIYUAN LIU and SHUAI WEN
School of Automobile and Traffic Engineering, Jiangsu University, Zhenjiang 212013, China
e-mail: [email protected]; [email protected]; [email protected]; [email protected];
MS received 25 December 2020; revised 13 July 2021; accepted 13 September 2021
Abstract. Several models involving spray atomization, wall impingement, evaporation and urea pyrolysis
were built through a commercial code to study the influence of parameters of Urea Selective Catalytic Reduction
(Urea –SCR) injection system on critical performances at low exhaust temperatures. The spray development,
NH3 concentration distribution and wall film thickness have been studied. Results suggest that the wall
impingement of the Urea Water Solution (UWS) is more at the temperature of 180�C than at 430�C. Lowertemperatures tend to hinder evaporation and pyrolysis. NH3 concentration is uneven at low temperatures and the
fuel film generated on the wall is also incomplete. Low temperatures could help injection system with a tilting
nozzle raise its injection pressure and accelerate the evaporation and pyrolysis of the droplets. The distribution
of spray impingement, however, is narrower and the fuel film thickness on the wall is increased. Smaller
injection angle made it easier to expel gas stream and the droplets would then follow the direction of the gas
stream. The droplets distribution is therefore more uniform and the spray wall-impingement reduced.
Keywords. Diesel engine; SCR; atomization; mixing characteristics; uniformity.
1. Introduction
Diesel engines are widely used in transportation and con-
struction machines because of high fuel efficiency and long
durability. However, emissions of the diesel engine such as
NOX and smoke should be considered as well because they
are detrimental to the environment.
It is difficult to reduce NOX and smoke simultaneously
simply through in-engine purification. A promising choice
except the in-engine purification to help reduce emissions is
Selective Catalytic Reduction (SCR), which has been
proved as an effective way of solution (Koebel et al [1],Han et al [2] and Johnson [3]).
Researchers (Dong et al [4]) studied the performance of
SCR systems with different injection parameters under
medium and high loads. The results suggested that low-
quality atomization could reduce the life of SCR system
and NOx conversion efficiency. Shi et al [5] found that the
wall impingement could be avoided when injection pres-
sure was appropriate. Lower injection pressures reduced the
mixing distance, and the axial concentration of UWS dro-
plet would be more uniform.
Jeong et al [6] studied parameter effects on the unifor-
mity of ammonia concentration distribution and the maxi-
mum ammonia conversion efficiency in varied load
conditions. The parameters involved injection angle,
injection position, and number of holes on the injector. The
results showed that the ammonia conversion efficiency was
the best when the injection was vertical to exhaust gas
stream. The difference between the uniformity of the 6-hole
nozzle and 8-hole nozzle is small and the local evaporation
ratio on the monolith face from both nozzles reached
almost 95%.
Hua et al [7] used a CFD code to simulate the spray
atomization and evaporation of UWS. The simulation was
conducted without air-assisted urea injection system. The
atomization characteristics was optimized to improve NOx
conversion efficiency. Kawauchi et al [8] studied the
evaporation and pyrolysis of UWS. The results suggested
that smaller size droplets can effectively promote the
evaporation and pyrolysis process of UWS as well as the
conversion efficiency from UWS to NH3. Wang et al [9]studied the evaporation of UWS at temperatures ranging
from 373K to 873K and found that evaporation has a link
with ambient temperatures. The behaviors were quite
complicated at high temperatures, which involved bubble
formation, distortion, and partial rupture after a linear D2-
law period. These behaviors were weakened as tempera-
tures decreased. Grout et al [10] found that increasing the
gas flow rate and temperatures would slow the formation of
the liquid film. Postrioti et al [11] studied the characteristicsof UWS spray at different temperatures and the results*For correspondence
Sådhanå (2021) 46:238 � Indian Academy of Sciences
https://doi.org/10.1007/s12046-021-01745-7Sadhana(0123456789().,-volV)FT3](0123456789().,-volV)
showed that gas flow had an important effect on
atomization.
Previous studies by Sadashiva et al [12], Lee [13] and Oh[14] suggested that parameters such as the injection pres-
sure, injection angle and position of the SCR injection
system had an important effect on urea atomization and
uniformity of ammonia concentration distribution. Addi-
tionally, works of Sadashiva et al [12] suggested UWS
atomization would affect the ammonia generation rate and
the subsequent reactions. The atomization was strongly
affected by the exhaust gas temperatures. However, these
studies mainly focused on the working condition when the
load was medium or high, and the exhaust temperatures
were at a high level (673 K–773 K). The low-speed low-
load conditions are common in WLTC (World Harmonized
Transient Cycle), in which exhaust temperatures are lower
and performance of the SCR system is different. The per-
formance of the injection system at lower temperatures
remains for further researches. Meanwhile, Tutuianu [15]
suggested a method to let catalytic work well at lower
temperatures (373*473 K).
In this paper, a numerical simulation on the UWS spray
atomization mixing process of Urea-SCR system at low
temperature was performed.
The influence of exhaust gas temperature, injection
pressure, and injection angle on the droplet distribution
pattern and the uniformity of ammonia concentration dis-
tribution was analyzed.
A commercial code (AVL FIRE) was used to numeri-
cally analyze the UWS spray atomization.
2. SCR System numercial simulation
2.1 Geometric model and mesh generation
In this paper, a diesel engine (Model 4G33T) was used to
provide exhaust parameters from real conditions, preparing
for numerical simulation. The main parameters of the diesel
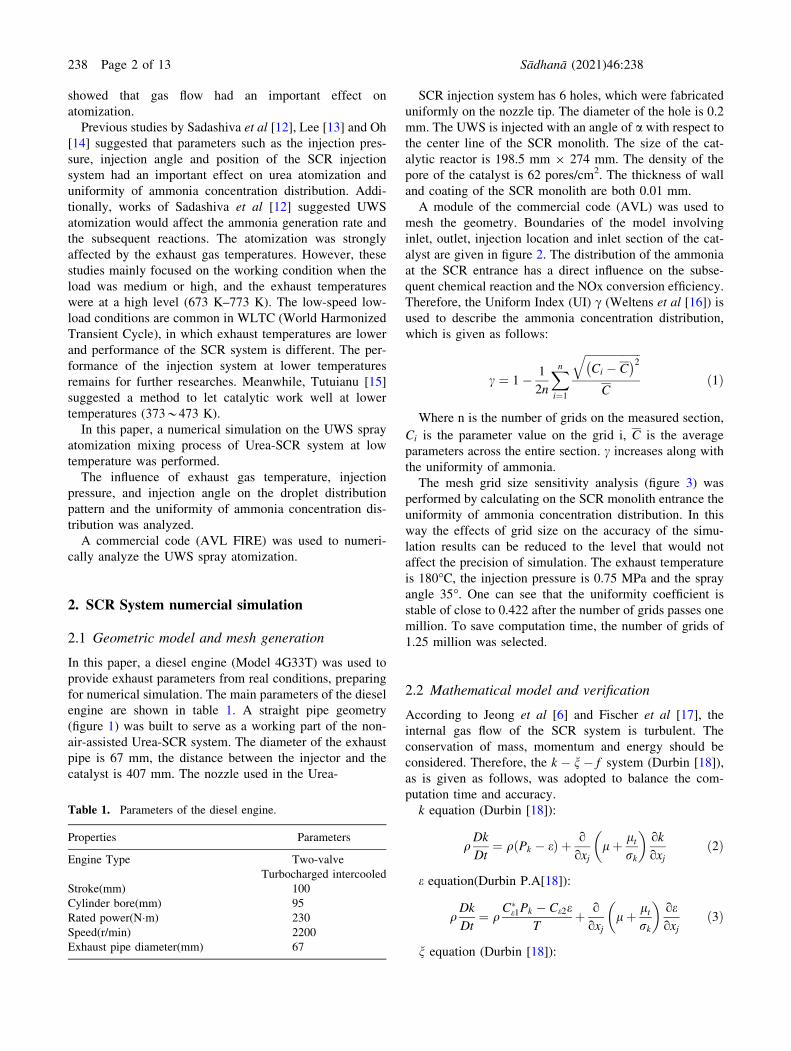
engine are shown in table 1. A straight pipe geometry
(figure 1) was built to serve as a working part of the non-
air-assisted Urea-SCR system. The diameter of the exhaust
pipe is 67 mm, the distance between the injector and the
catalyst is 407 mm. The nozzle used in the Urea-
SCR injection system has 6 holes, which were fabricated
uniformly on the nozzle tip. The diameter of the hole is 0.2
mm. The UWS is injected with an angle of a with respect to
the center line of the SCR monolith. The size of the cat-
alytic reactor is 198.5 mm 9 274 mm. The density of the
pore of the catalyst is 62 pores/cm2. The thickness of wall
and coating of the SCR monolith are both 0.01 mm.
A module of the commercial code (AVL) was used to
mesh the geometry. Boundaries of the model involving
inlet, outlet, injection location and inlet section of the cat-
alyst are given in figure 2. The distribution of the ammonia
at the SCR entrance has a direct influence on the subse-
quent chemical reaction and the NOx conversion efficiency.
Therefore, the Uniform Index (UI) c (Weltens et al [16]) isused to describe the ammonia concentration distribution,
which is given as follows:
c ¼ 1� 1
2n
Xni¼1
ffiffiffiffiffiffiffiffiffiffiffiffiffiffiffiffiffiffiffiffiCi � C� �2q
Cð1Þ
Where n is the number of grids on the measured section,
Ci is the parameter value on the grid i, C is the average
parameters across the entire section. c increases along with
the uniformity of ammonia.
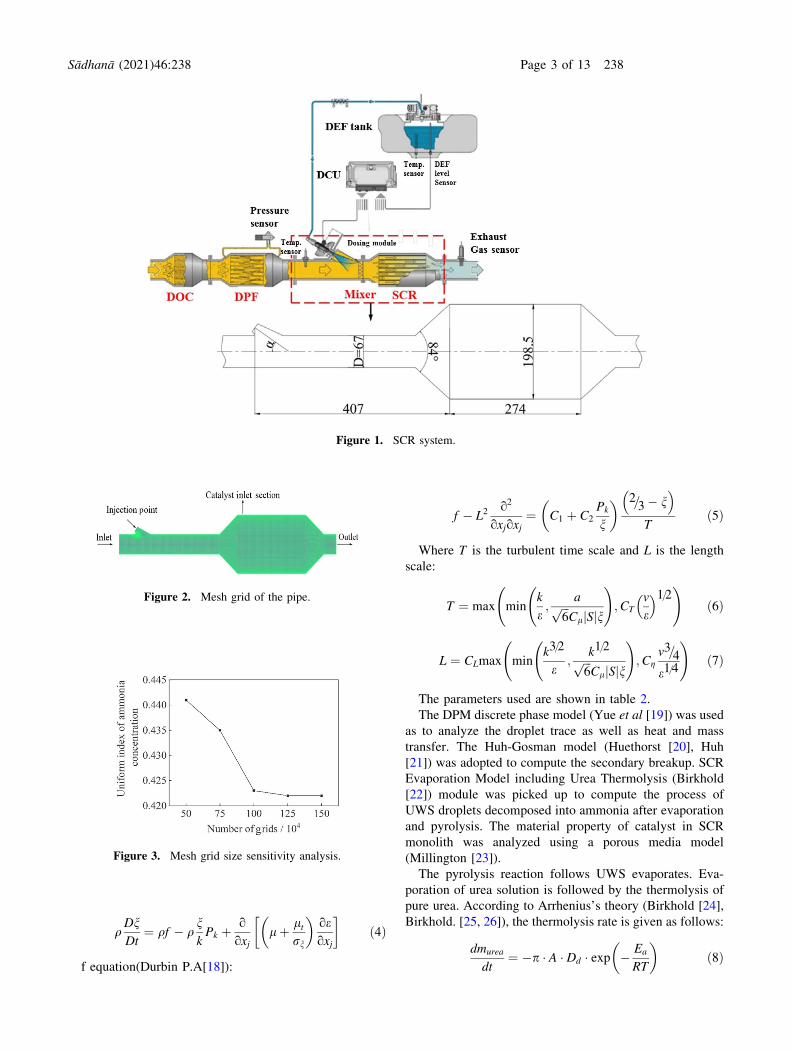
The mesh grid size sensitivity analysis (figure 3) was
performed by calculating on the SCR monolith entrance the
uniformity of ammonia concentration distribution. In this
way the effects of grid size on the accuracy of the simu-
lation results can be reduced to the level that would not
affect the precision of simulation. The exhaust temperature
is 180�C, the injection pressure is 0.75 MPa and the spray
angle 35�. One can see that the uniformity coefficient is
stable of close to 0.422 after the number of grids passes one
million. To save computation time, the number of grids of
1.25 million was selected.
2.2 Mathematical model and verification
According to Jeong et al [6] and Fischer et al [17], theinternal gas flow of the SCR system is turbulent. The
conservation of mass, momentum and energy should be
considered. Therefore, the k � n� f system (Durbin [18]),
as is given as follows, was adopted to balance the com-
putation time and accuracy.
k equation (Durbin [18]):
qDk
Dt¼ q Pk � eð Þ þ o
oxjlþ lt
rk
� �okoxj
ð2Þ
e equation(Durbin P.A[18]):
qDk
Dt¼ q
C�e1Pk � Ce2e
Tþ ooxj
lþ ltrk
� �oeoxj
ð3Þ
n equation (Durbin [18]):
Table 1. Parameters of the diesel engine.
Properties Parameters
Engine Type Two-valve
Turbocharged intercooled
Stroke(mm) 100
Cylinder bore(mm) 95
Rated power(N�m) 230
Speed(r/min) 2200
Exhaust pipe diameter(mm) 67
238 Page 2 of 13 Sådhanå (2021) 46:238
qDnDt
¼ qf � qnkPk þ o
oxjlþ lt
rn
� �oeoxj
� �ð4Þ
f equation(Durbin P.A[18]):
f � L2o2
oxjoxj¼ C1 þ C2
Pk
n
� � 2=3� n
Tð5Þ
Where T is the turbulent time scale and L is the length
scale:
T ¼ max mink
e;
affiffiffi6
pCl Sj jn
!;CT
v
e
1=2 !ð6Þ
L ¼ CLmax mink3=2
e;
k1=2ffiffiffi6
pCl Sj jn
!;Cg
v3=4
e1=4
!ð7Þ
The parameters used are shown in table 2.
The DPM discrete phase model (Yue et al [19]) was usedas to analyze the droplet trace as well as heat and mass
transfer. The Huh-Gosman model (Huethorst [20], Huh
[21]) was adopted to compute the secondary breakup. SCR
Evaporation Model including Urea Thermolysis (Birkhold
[22]) module was picked up to compute the process of
UWS droplets decomposed into ammonia after evaporation
and pyrolysis. The material property of catalyst in SCR
monolith was analyzed using a porous media model
(Millington [23]).
The pyrolysis reaction follows UWS evaporates. Eva-
poration of urea solution is followed by the thermolysis of
pure urea. According to Arrhenius’s theory (Birkhold [24],
Birkhold. [25, 26]), the thermolysis rate is given as follows:
dmurea
dt¼ �p � A � Dd � exp � Ea
RT
� �ð8Þ
Figure 1. SCR system.
Figure 2. Mesh grid of the pipe.
Figure 3. Mesh grid size sensitivity analysis.
Sådhanå (2021) 46:238 Page 3 of 13 238

Where A is 0.4 kg/ms and Ea is 69000 J/mol.
The impingement of the droplets and the formation of
liquid film were analyzed using the wall film model
(O’Rourke [27]). The evaporation was also considered in
this model. The diameter and velocity of the droplet after
the impingement as well as the mass of liquid film on the
wall were analyzed using the Kuhnke model (Kalb [28]).
This model takes into account simultaneously the K factor
and wall temperature Tw. The interaction between the spray
and the wall was also analyzed. The equation for the cal-
culation of the diameter of droplets is given as follows:
D32 ¼Pk
i¼1 nid3iPk
i¼1 nid2i
ð9Þ
Where ni is the number of the particle with a diameter di.The working process of the catalyst was analyzed using a
porous media model, which cuts the calculation domain
into individual pore channel. The energy and mass equation
were calculated in such individual channel. Transport
equation for the gas flow is given as follows (Kaviani [29],
Verein [30]):
eg �oqg � wk;g
ot¼ �eg �
oqg � wk;g � mgoz
þ eg
� ooz
qg � Deff � owk;g
oz
� �þMk;g �
Xli
vi;k
� ri cLk ; Ts� �
ð10Þ
eg � oot qg �XKk
wk;g � hk !
¼
� eg � ooz qg �XKk
wk;g � hk � mg !
þ eg � ooz kg � oTgoz
� �
þXKk
eg � ooz qg � Deff � owk;g
oz� hk
� �
þ GSA � kh � Ts � Tg� ��XI
i
�hi � ri cLk ; Ts� �
ð11Þwhere wk;g is the mass fraction of the component k, Deff
is the effective diffusion coefficient, ri is the molar reaction
rate on the catalyst surface.
Gas phase energy equation is given as follows (Kaviani
[29], Verein [30]):
Where Tg is the gas temperature, hk is the total enthalpy
of the component k, kg is the thermal conductivity of the
gas, kh is the heat transfer coefficient between the gas and
the solid wall, GSA is the channel surface area per unit
volume, Dhi is the reaction heat, Ts is the solid wall of the
catalyst temperature.
In order to certify the accuracy of the spray model (AVL
[31]), a UWS spray test system was built. It involved a
strong light source, a digital ICCD camera, a constant
volume bomb, an UWS injection system, a signal control
device and a set of information acquisition system. The
geometry of holes for the urea spray injection used in the
test are fabricated according to the three-dimensional
geometry used in the simulation to ensure conformability.
The spray pattern was photographed using backlight
method. The spray cone angle and the spray penetration can
be calculated in the after-treatment of the spray pattern
images. Experimental data would be compared and ana-
lyzed together with the data from the numerical computa-
tion. Parameters of the test are shown in table 3.
The simulation result of the spray angle and the spray
penetration was compared with the experimental data in
figure 4. One can see the result of the simulation which
shows good agreement with experimental data. The biggest
difference between the experimental data and simulation
result in figure 4(a) is only 4.5%, in figure 4(b) it is 1.2%.
The spray pattern from the model is compared with
experimental image in figure 5. The images of the experi-
mental data and simulation result show good agreement.
Therefore, the computation model was robust enough to
predict urea injection, and the aim of the study was to study
the advantages of spray atomization.
2.3 Boundary conditions and calculation method
A diesel engine with low load and low speed was used to
provide boundary conditions. The exhaust temperature was
Table 2. Parameters of k � n� f model.
Ce1 Ce2 C1 C2 rk re rn Cl CT Cg
1.4 � 1þ 0:012ð Þ=n 1.9 0.4 0.65 1 1.3 1.2 6.0 0.36 85
Table 3. Experimental parameters.
Boundary conditions Parameters
Injection pressure (MPa) 0.75
Backpressure (MPa) 0.1
Bulk temperature (K) 300
Injection duration (ms) 5
238 Page 4 of 13 Sådhanå (2021) 46:238

180�C and the exhaust flow rate was 250 kg/h. The char-
acteristic length was 10% of the inlet diameter, the turbu-
lent energy was 5% of the square of inlet average speed,
and the outlet pressure was 0.1 MPa. The UWS nozzle has
6 holes, which are uniformly set on a circle of 1.2 mm in
diameter on the injector. The diameter of the nozzle hole is
0.2 mm. Urea solution of 32.5% was used. The simulation
period is 0.35 s. The injection started at 0.1s and the
duration is 5 ms.
3. Result and discussion
3.1 Spray development and ammoniaconcentration distribution at varied exhausttemperatures
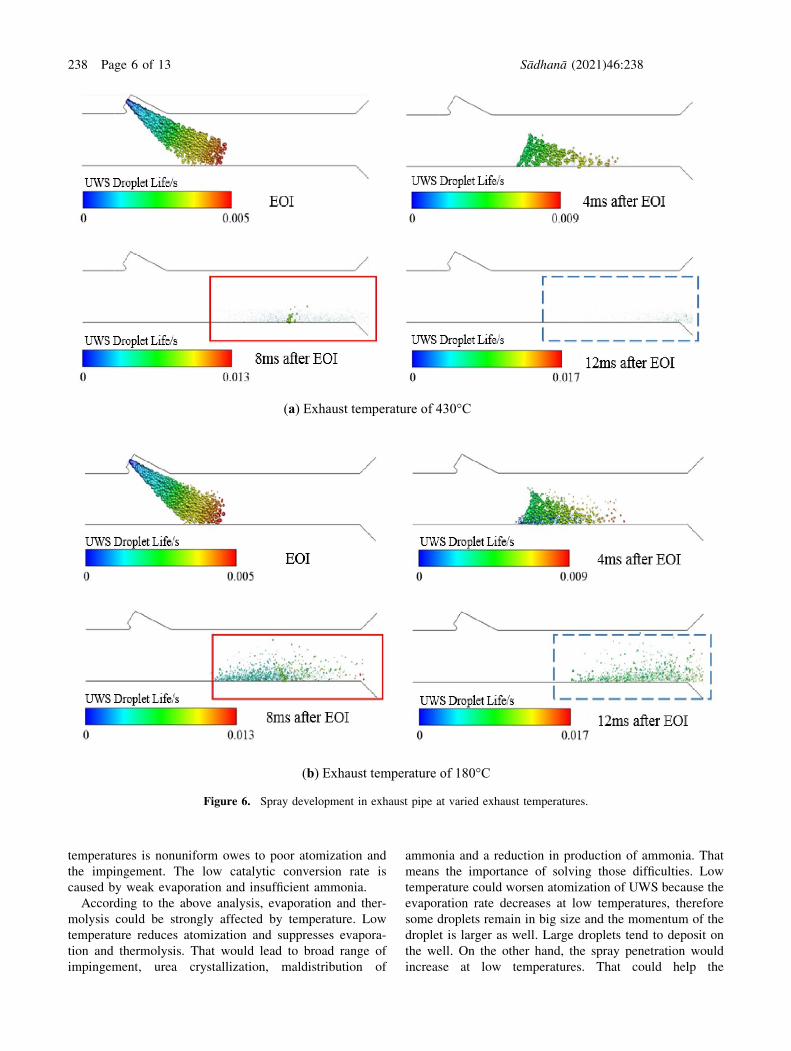
Figure 6 shows the spray pattern at high and low temper-
ature, respectively. It can be seen that at the phase of the
end of the injection (EOI), the impingement within the pipe
occurred. The injection pressure is 0.75 MPa and the
injection angle is 35�. The spray atomization quality is bad.
The droplet is large. The specific surface area is small,
which is not conducive to the evaporation of the droplets.
Meanwhile, the momentum of a single droplet is large and
it is difficult for an individual droplet to follow the exhaust
gas flow. The direction of the drop movement changed little
and impingement emerged.
The droplet patterns have changed to 4 ms after EOI at
both calculation temperatures. The atomization quality is
not good and the UWS droplet is large. Droplets continue
moving in the spray direction, many of them would hit the
wall. The low temperature contributes to increasing the
deposition and splashing. Then liquid film forms on the
wall and urea tends to deposit. High temperatures help
droplets evaporate rapidly. The rebound of the droplets is
also boosted (Li et al [32]). Higher wall temperatures boost
the heat transfer between the droplet and the wall, and the
evaporation rate increases swiftly. The upward momentum
produced by evaporation increase the power of rebound.
Smaller droplets tend to rebound more severely owing to
equivalent amount of momentum. The increase in the
ambient flow rate driven by energy from heat transfer leads
to the droplet easier to break up. The decomposition of urea
is also accelerated. Therefore, the number of droplets is
reduced and the formation of liquid film on the wall is also
hindered.
The influence of temperature on spray pattern is obvious
8 ms and 12 ms after the EOI. The temperature of the gas
flow and the wall surface are high so that heat transfer is
boosted. Strong heat transfer accelerates evaporation and
thermolysis. The number of droplets then decreases and
more ammonia is generated. Weak evaporation and
upstream atomization let the droplets be concentrated on a
lower layer of the exhaust pipe at low temperature. The
attachment of UWS particles on the wall makes the droplets
easy to deposit in liquid film and the conversion from urea
to ammonia is also blocked. The consequent ammonia gas
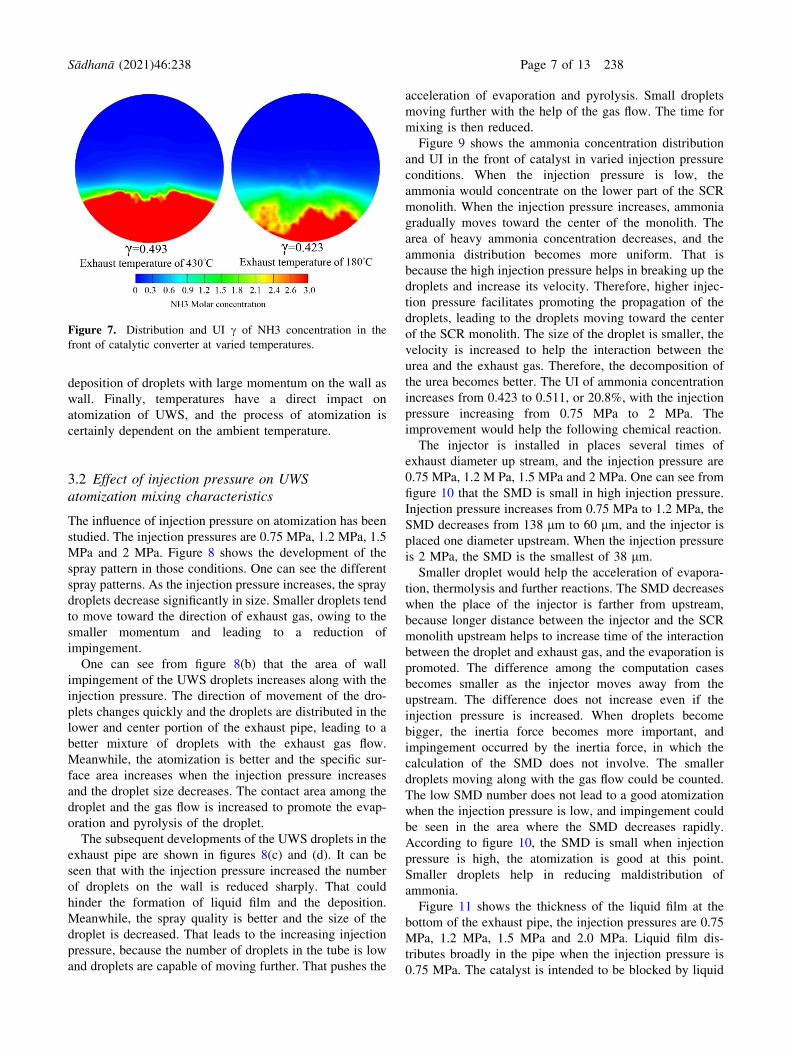
is low in concentration and in maldistribution. The con-
centration of NH3 on the front of the catalyst at high and
low temperatures are shown in figure 7. It can be seen that
the UI of ammonia distribution is more concentrated at high
temperature than at low temperature. The lack of a mixer
made the ammonia distribution a little nonuniform at high
temperature. The high concentration region is broader at
high temperatures, indicating that more ammonia is gen-
erated. That the ammonia concentration distribution at low
(a) Spray penetration
(b) Spray angle
Figure 4. Data from the simulation and the experiment.
(a) 2ms ASOI (b) 5ms ASOI
Figure 5. Images of spray from the experiment and the
simulation.
Sådhanå (2021) 46:238 Page 5 of 13 238
temperatures is nonuniform owes to poor atomization and
the impingement. The low catalytic conversion rate is
caused by weak evaporation and insufficient ammonia.
According to the above analysis, evaporation and ther-
molysis could be strongly affected by temperature. Low
temperature reduces atomization and suppresses evapora-
tion and thermolysis. That would lead to broad range of
impingement, urea crystallization, maldistribution of
ammonia and a reduction in production of ammonia. That
means the importance of solving those difficulties. Low
temperature could worsen atomization of UWS because the
evaporation rate decreases at low temperatures, therefore
some droplets remain in big size and the momentum of the
droplet is larger as well. Large droplets tend to deposit on
the well. On the other hand, the spray penetration would
increase at low temperatures. That could help the
(a) Exhaust temperature of 430°C
(b) Exhaust temperature of 180°C
Figure 6. Spray development in exhaust pipe at varied exhaust temperatures.
238 Page 6 of 13 Sådhanå (2021) 46:238
deposition of droplets with large momentum on the wall as
wall. Finally, temperatures have a direct impact on
atomization of UWS, and the process of atomization is
certainly dependent on the ambient temperature.
3.2 Effect of injection pressure on UWSatomization mixing characteristics
The influence of injection pressure on atomization has been
studied. The injection pressures are 0.75 MPa, 1.2 MPa, 1.5
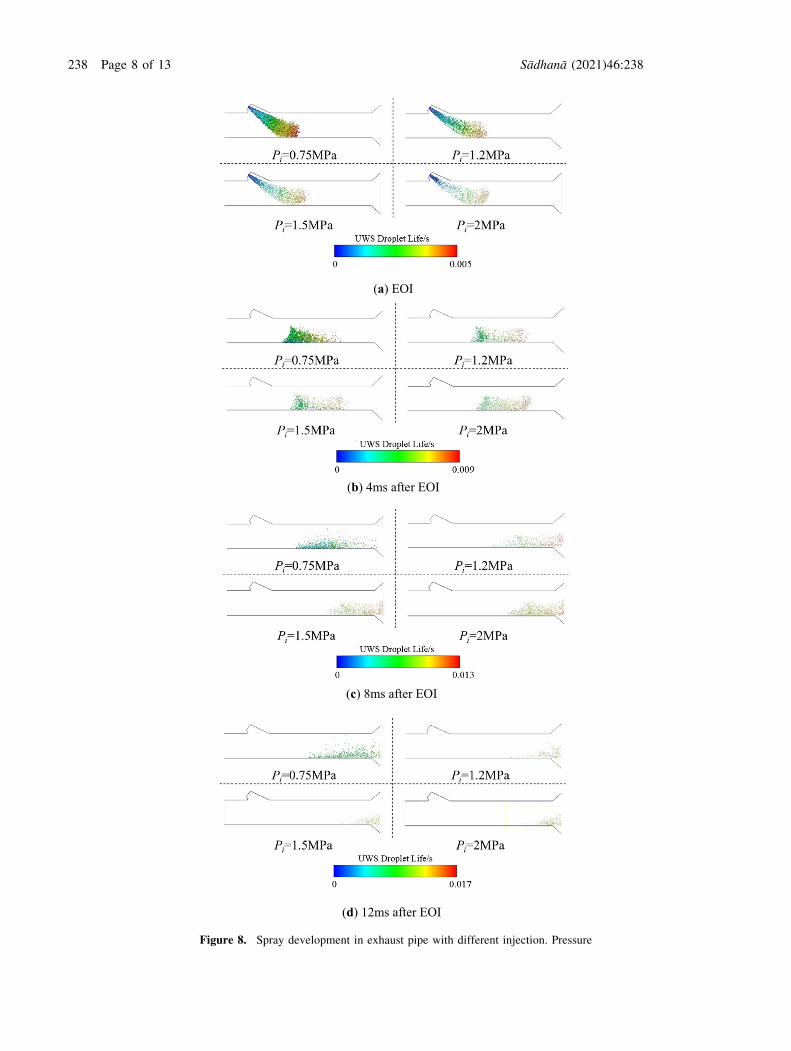
MPa and 2 MPa. Figure 8 shows the development of the
spray pattern in those conditions. One can see the different
spray patterns. As the injection pressure increases, the spray
droplets decrease significantly in size. Smaller droplets tend
to move toward the direction of exhaust gas, owing to the
smaller momentum and leading to a reduction of
impingement.
One can see from figure 8(b) that the area of wall
impingement of the UWS droplets increases along with the
injection pressure. The direction of movement of the dro-
plets changes quickly and the droplets are distributed in the
lower and center portion of the exhaust pipe, leading to a
better mixture of droplets with the exhaust gas flow.
Meanwhile, the atomization is better and the specific sur-
face area increases when the injection pressure increases
and the droplet size decreases. The contact area among the
droplet and the gas flow is increased to promote the evap-
oration and pyrolysis of the droplet.
The subsequent developments of the UWS droplets in the
exhaust pipe are shown in figures 8(c) and (d). It can be
seen that with the injection pressure increased the number
of droplets on the wall is reduced sharply. That could
hinder the formation of liquid film and the deposition.
Meanwhile, the spray quality is better and the size of the
droplet is decreased. That leads to the increasing injection
pressure, because the number of droplets in the tube is low
and droplets are capable of moving further. That pushes the
acceleration of evaporation and pyrolysis. Small droplets
moving further with the help of the gas flow. The time for
mixing is then reduced.
Figure 9 shows the ammonia concentration distribution
and UI in the front of catalyst in varied injection pressure
conditions. When the injection pressure is low, the
ammonia would concentrate on the lower part of the SCR
monolith. When the injection pressure increases, ammonia
gradually moves toward the center of the monolith. The
area of heavy ammonia concentration decreases, and the
ammonia distribution becomes more uniform. That is
because the high injection pressure helps in breaking up the
droplets and increase its velocity. Therefore, higher injec-
tion pressure facilitates promoting the propagation of the
droplets, leading to the droplets moving toward the center
of the SCR monolith. The size of the droplet is smaller, the
velocity is increased to help the interaction between the
urea and the exhaust gas. Therefore, the decomposition of
the urea becomes better. The UI of ammonia concentration
increases from 0.423 to 0.511, or 20.8%, with the injection
pressure increasing from 0.75 MPa to 2 MPa. The
improvement would help the following chemical reaction.
The injector is installed in places several times of
exhaust diameter up stream, and the injection pressure are
0.75 MPa, 1.2 M Pa, 1.5 MPa and 2 MPa. One can see from
figure 10 that the SMD is small in high injection pressure.
Injection pressure increases from 0.75 MPa to 1.2 MPa, the
SMD decreases from 138 lm to 60 lm, and the injector is
placed one diameter upstream. When the injection pressure
is 2 MPa, the SMD is the smallest of 38 lm.
Smaller droplet would help the acceleration of evapora-
tion, thermolysis and further reactions. The SMD decreases
when the place of the injector is farther from upstream,
because longer distance between the injector and the SCR
monolith upstream helps to increase time of the interaction
between the droplet and exhaust gas, and the evaporation is
promoted. The difference among the computation cases
becomes smaller as the injector moves away from the
upstream. The difference does not increase even if the
injection pressure is increased. When droplets become
bigger, the inertia force becomes more important, and
impingement occurred by the inertia force, in which the
calculation of the SMD does not involve. The smaller
droplets moving along with the gas flow could be counted.
The low SMD number does not lead to a good atomization
when the injection pressure is low, and impingement could
be seen in the area where the SMD decreases rapidly.
According to figure 10, the SMD is small when injection
pressure is high, the atomization is good at this point.
Smaller droplets help in reducing maldistribution of
ammonia.
Figure 11 shows the thickness of the liquid film at the
bottom of the exhaust pipe, the injection pressures are 0.75
MPa, 1.2 MPa, 1.5 MPa and 2.0 MPa. Liquid film dis-
tributes broadly in the pipe when the injection pressure is
0.75 MPa. The catalyst is intended to be blocked by liquid
Figure 7. Distribution and UI c of NH3 concentration in the
front of catalytic converter at varied temperatures.
Sådhanå (2021) 46:238 Page 7 of 13 238
(a) EOI
(b) 4ms after EOI
(c) 8ms after EOI
(d) 12ms after EOI
Figure 8. Spray development in exhaust pipe with different injection. Pressure
238 Page 8 of 13 Sådhanå (2021) 46:238

film deposition. When the injection pressure increases, the
area of liquid film decreases, so does the maximum liquid
film thickness. That is because the UWS atomization is
good and spray momentum is large when the injection
pressure is high. Lifting the injection pressure could help
improve atomization and increase the momentum of dro-
plets. Smaller droplets can reduce the prospect of
impingement as well. Big droplets tend to splash when they
hit the wall, leading to the reduction of the amount of liquid
film. The liquid film would not deposit broadly in high
injection pressure when the distribution of the film is small
and sparse. Meanwhile, the evaporation and thermolysis of
UWS becomes better, and the liquid film is decomposed
swiftly with rising exhaust temperature, and the pipe is then
less likely to be blocked.
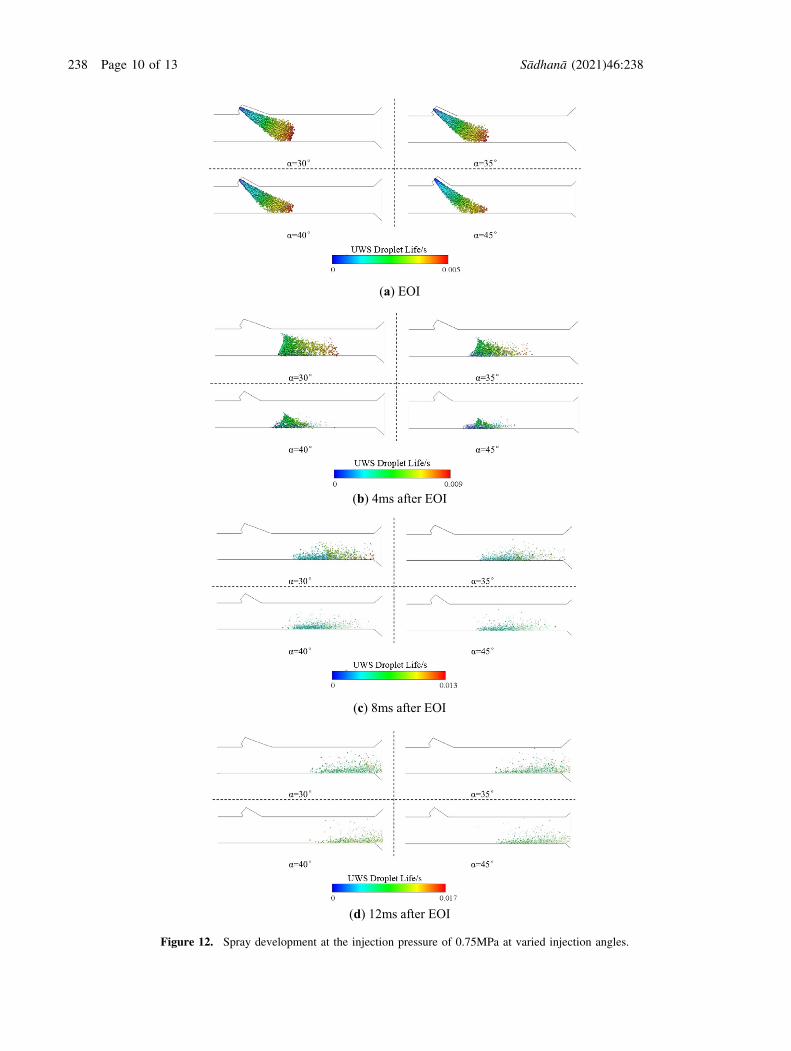
3.3 Effect of injection angle on UWS atomizationmixing characteristics
The injection angles have been set as 30�, 35�, 40�, and 45�,respectively, and the injection pressure is 0.75 MPa. in
those conditions, the atomization of UWS droplets is
studied. Figure 13 shows spray pattern with varied injection
angle. The spray is compressed by its own momentum and
the airflow in the process of injection. With the increase of
injection angle, spray angle decreases. The heat transfer
among droplets and the gas flow would be blocked when
large numbers of droplets gather together. While spray is
injected nearly perpendicular to the wall, it will hit the wall
directly. The liquid film tends to form at low temperatures.
The spray tends to move in the direction of the gas flow as
the injection angle is reduced to the level that injection
direction is close to the direction of the movement of the
gas flow.
Figure 9. Distribution and UI c of NH3 concentration.
Figure 10. SMD of varied cross sections.
Figure 11. Film thickness of exhaust pipe with different
injection pressure.
Sådhanå (2021) 46:238 Page 9 of 13 238
(a) EOI
(b) 4ms after EOI
(c) 8ms after EOI
(d) 12ms after EOI
Figure 12. Spray development at the injection pressure of 0.75MPa at varied injection angles.
238 Page 10 of 13 Sådhanå (2021) 46:238

The droplets are therefore being given a larger space to
develop and the spray angle is increased as well. Mean-
while, the formation of liquid film is also impeded, as large
numbers of big droplets are produced in the beginning, the
impingement is alleviated. One can see from figures 12 and
13 that the number of droplets is large, and the distribution
is broad, indicating that reducing the injection angle can
benefit the atomization. Meanwhile, it can be observed
from figure 13 that urea index decreased from 0.439 to
0.419, or 4.6%, when a increases from 30� to 45�. Theconcentration becomes more uniform as well. However, the
area of ammonia distribution decreases. The ammonia
decomposed from urea increases, owing to the increase in
the area of high concentration as the injection angle
decreases.
More ammonia is produced at low temperatures as the
urea solution evaporates slowly. The amount of liquid film
generated at low temperatures also decreases. Therefore,
smaller injection angle can help to improve the perfor-
mance of the SCR catalyst at low temperatures.
Figure 14 shows the SMD from inlet expansion to SCR
monolith face for varied injector locations when the
injection pressure is 0.75 MPa. Section aD and bD are the
circular sections nearest to the nozzle. The SMD from aD
and 1D are not among those counted at the injection
angle of 30�, as the shape of the nozzle varies at varied
injection angles. The mixing characteristics may not be
calculated precisely according to SMD, especially at a
large injection angle. The atomization is not good owing
to that more impingement could be expected in the low
injection pressure. The location where the impingement
emerges or liquid film is generated is calculated
according to the trend of SMD. The SMD decreases
rapidly at an injection angle of 30�at the location
between bD and 2.5D where the impingement emerges.
That location moved toward before the section 1.5D near
Figure 13. Distribution and uniform index c of NH3
concentration.
Figure 14. SMD of varied cross sections at varied injection
angles.
Figure 15. Liquid film thickness.
Sådhanå (2021) 46:238 Page 11 of 13 238
the nozzle as injection angle increased. Meanwhile, the
evaporation and thermolysis could be weakened at low
temperatures if droplets move from 2.5D to 5D. Changes
of SMD at varied injection angle could be seen as well.
Figure 15 shows the thickness of liquid film from inlet
expansion to SCR monolith face for varied injector
locations when the injection pressure is 0.75 MPa. The
liquid would concentrate toward where impingement
occurred as the injection angle increases. The larger
injection angle makes the spray tend to be more per-
pendicular to the monolith. The impingement and the
resulting generation of liquid film are reduced as the
space of the development for spray grows when the
injection angle is decreased.
4. Conclusion
The development process of UWS spray at varied temper-
atures was studied in this paper. Temperatures would
mainly affect evaporation and thermolysis of UWS. The
impingement is significant, and the evaporation and the
pyrolysis are impeded at lower temperatures.
Low temperatures would hinder the evaporation and
thermolysis, meanwhile the impingement also emerges.
The evaporation of droplets and the thermolysis of urea
could be accelerated with the help of low temperature of
180�C. The injection pressure is increased to let droplets
smaller. As a result, the specific surface area increases. The
distribution of the spray has been improved and the
impingement reduced, owing to the effect of the gas flow
when the injection pressure is high.
Reducing the injection angle could make the develop-
ment of the spray more complete and help the spray to
move in the direction of the gas flow. The generation of
liquid film would be hindered as the spray angle is
increased and the impingement reduced.
Acknowledgements
This work was supported by the Natural Science Founda-
tion of Jiangsu Province [BK20201166]; The Priority
Academic Program Development of Jiangsu Higher Edu-
cation Institutions [PAPD]; The Transformation Foundation
of scientific and technological achievements in Jiangsu
Province [BA2016096].
References
[1] Koebel M, Elsener M and Kleemann M 2000 Urea-SCR: A
Promising Technique to Reduce NOX Emissions from
Automotive Diesel Engines. Catalysis Today 59(3): 335–345
[2] Han J, Kim E, Lee T, Kim J, Ahn N and Han HS 2011 Urea-
SCR Catalysts with Improved Low Temperature Activity.
SAE Technical Paper:1315-1321[3] Johnson T V 2000 Vehicular Emissions in Review. SAE
International Journal of Engines 7(3): 1207–1227[4] Dong H, Shuai S and Wang J 2008 Effect of Urea Thermal
Decomposition on Diesel NOx-SCR Aftertreatment Systems.
SAE Technical Paper:1544[5] Shi X, Deng J and Wu Z 2013 Effect of Injection Parameter
on Spray Characteristics of Urea-SCR System. SAE Inter-national Journal of Engines 6(2): 873–881
[6] Jeong S J, Lee S J, Kim W S and Lee C B 2005 Simulation on
the Optimum Shape and Location of Urea Injector for Urea-
SCR System of Heavy-duty Diesel Engine to Prevent NH3
Slip. Powertrain & Fluid Systems Conference:1824-1828[7] Hua L, Zhao Y G, Hu J, Tao T and Shuai S J 2012
Comparison Between Air-Assisted and Airless Urea Spray
for Diesel SCR System by PDA and CFD. SAE TechnicalPaper:1081
[8] Kawauchi S and Takagi M 2011 Study of Spray Distribution
and Evaporation and Thermolysis Process of Reductant in
Urea SCR. Journal of the Marine Engineering Society inJapan 46(4): 620–625
[9] Wang T J, Baek S W, Lee S Y and Kang D H 2009
Experimental Investigation on Evaporation of Urea-Water-
Solution Droplet for SCR Applications. AIChE Journal55(12): 3267–3276
[10] Grout S, Blaisot J B, Pajot K and Osbat G 2013 Experimental
Investigation on the Injection of a Urea-Water Solution in
Hot Air Stream for the SCR Application: Evaporation and
Spray/Wall Interaction. Fuel 106(11): 166–177[11] Lucio P, Gabriele B, Carmine U, Mark M and Francesco B
2015 A Methodology to Investigate the Behaviour of Urea-
Water Sprays in High Temperature Air Flow for SCR De-
NOx Applications. Fuel 150: 548–557[12] Kapilan N, Nayak N S, Hindasageri V P and Sadashiva S 2017
An Experimental and Numerical Study on Effects of Exhaust
Gas Temperature and FlowRate onDeposit Formation inUrea-
Selective Catalytic Reduction (SCR) System of Modern
Automobiles. Applied Thermal Engineering 111: 1211–1231[13] Lee C 2018 Numerical and Experimental Investigation of
Evaporation and Mixture Uniformity of Urea-Water Solution
in Selective Catalytic Reduction System. TransportationResearch Part D: Transport and Environment 60: 210–224
[14] Oh J and Lee K 2014 Spray Characteristics of a Urea
Solution Injector and Optimal Mixer Location to Improve
Droplet Uniformity and NOX Conversion Efficiency for
Selective Catalytic Reduction. Fuel 119: 90–97[15] Tutuianu M,Bonnel P, Haniu T, Pavlovic J and Ichikawa N
2015 Development of the World-wide harmonized Light
duty Test Cycle (WLTC) and a possible pathway for its
introduction in the European legislation. TransportationResearch Part D-transport and Environment:61-75
[16] Weltens H, Bressler H, Terres F Neumaier H and Rammoser
D 1993 Optimization of catalytic converter gas flow distribu-
tion by CFD prediction. SAE Technical Paper:930780[17] Fischer S, Bitto R, Lauer T, Kreen C and Pessl G 2012
Impact of the Turbulence Model and Numerical Approach on
the Prediction of the Ammonia Homogenization in an
Automotive SCR System. SAE International Journal ofEngines 5(3): 1443–1458
238 Page 12 of 13 Sådhanå (2021) 46:238
[18] Durbin P A 1991 Near-wall turbulence closure modelling
without ‘‘damping functions.’’ Theor. Comput. Fluid Dyn. 3:1–13
[19] Yue P, Feng J J, Liu C and Shen J 2004 A Diffuse-interface
Method for Simulating Two-phase Flows of Complex Fluids.
J. Fluid Mech. 515: 293–317[20] Huethorst J A M and Marra J 1991 Motion of Marangoni-
contracted Water Drops across Inclined Hydrophilic Sur-
faces. Langmuir 7: 2756–2763[21] Huh K Y and Gosman A D 1991 A Phenomenological Model
of Diesel Spray Atomization. In: Proceedings of theInternational Conference on Multiphase Flows:24-27
[22] Birkhold F 2007 Selektive katalytische reduktion von
stickoxiden in kraftfahrzeugen: Untersuchung der ein-
spritzung von harnstoffwasserlosung. Shaker:20-23[23] Millington R J and Quirk J M 1961 Permeability of Porous
Solids. Trans. Faraday Soc. 57: 1200–1207[24] Birkhold F 2007 Selektive katalytische reduktion von
stickoxiden in kraftfahrzeugen: Untersuchung der ein-
spritzung von harnstoffwasserlosung. Shaker:50-59[25] Birkhold F, Meingast U, Wassermann P and Deutschmann O
2006 Analysis of the Injection of Urea-water-solution for
automotive SCR DeNOx-Systems: Modeling of Two-phase
Flow and Spray/Wall0Interaction. SAE TechnicalPaper:0643
[26] Birkhold F, Meingast U, Wassermann P and Deutschmann O
2007 Modeling and simulation of the injection of urea-water-
solution for automotive SCR DeNOx-systems. AppliedCatalyst B Environmental 70: 119–127
[27] O’Rourke P J and Amsden A A 2000 A Spray/Wall
Interaction Submodel for the KIVA-3 Wall Film Model.
SAE Technical Paper:0271[28] Kalb T 2001 Experimentelle Untersuchungen zum benach-
barten Tropfenaufprall auf feste Wande. Karlsruhe Instituteof Technology:36-49
[29] Kaviani M 1991 Principles of Heat Transfer in Porous
Media. Mechanical Engineering Series:25-34[30] VDI-Warmeatlas 1994 Berechnungsblatter fur den
Warmeubergang. Siebte, erweiterte Auflage, VDI-Ver-lag:89-93
[31] Spray Module 2014 AVL documentation. AVL FIRE:236-248
[32] LiX,QinY, JingW,Tong J,LewenZhanZ,Zheng J andChenT
2016 Effects of Wall Temperature and Oil Film on the Process
of aGasolineSprayAfterWall Impingement. Journal of TianjinUniversity (Science and Technology) 49(11): 1196–1202
Sådhanå (2021) 46:238 Page 13 of 13 238