Embed Size (px)
Citation preview

Effects of sheep grazing on abundance and predators of field vole
(Microtus agrestis) in upland Britain
Philip Wheeler *
The University of Manchester, School of Biological Sciences, Oxford road, Manchester, M13 9PT, UK
Received 19 October 2006; received in revised form 21 March 2007; accepted 12 April 2007
Available online 1 June 2007
Abstract
A technique using fresh feeding signs as an index of density was validated and used to survey the effects of sheep grazing on vole
population densities in four upland habitats in the northern Peak District National Park, UK. In grazed areas Molinia caerulea grasslands
supported most voles, Nardus stricta grasslands supported fewer and Eriophorum vaginatum and Calluna vulgaris-dominated areas supported
least. There were highly significant negative relationships between vole sign density and sheep numbers in these habitats. Where sheep were
excluded, these same habitats had between three and nine times higher sign densities, corresponding to between 1.5 and 2.5 times greater field
vole densities. Population estimates of voles and predators such as short-eared owl approximately doubled under reduced grazing. Reducing
sheep numbers in upland areas may therefore be critical in encouraging the recovery of predatory birds in the uplands.
# 2007 Elsevier B.V. All rights reserved.
Keywords: Microtus agrestis; Grazing; Moorland; Field signs; Vole predators
www.elsevier.com/locate/agee
Agriculture, Ecosystems and Environment 123 (2008) 49–55
1. Introduction
The field vole (Microtus agrestis) is thought to be
Britain’s most common mammal with a pre-breeding
population estimated at 75 million individuals, most of
them living in the uplands (Harris et al., 1995), though little
is known of their ecology there. Both density and breeding
success of several species of predators have been shown to
be strongly related to field vole abundance (e.g., weasel
Mustela nivalis (Tapper, 1979), hen harrier Circus cyaneus
(Redpath et al., 2002), kestrel Falco tinnunculus (Thirgood
et al., 2003; Village, 1982), tawny owl Strix aluco (Petty and
Fawkes, 1997), short-eared owl Asio flammeus (Thirgood
et al., 2003; Village, 1987), long-eared owl Asio otus
(Sundell et al., 2004)). Recent changes in land use in Britain
have resulted in an increase in the relative importance of
* Present address: The University of Hull, Scarborough Campus, Filey
road, Scarborough, YO11 3AZ, UK. Tel.: +44 1723 357281;
fax: +44 1723 357268.
E-mail address: [email protected].
0167-8809/$ – see front matter # 2007 Elsevier B.V. All rights reserved.
doi:10.1016/j.agee.2007.04.003
field voles as a prey source for a number of predatory species
(Love et al., 2000).
In British uplands, habitat preferences and effects of
common land management strategies on vole populations are
little known. Suitability of habitats for field voles is governed
by two main factors: food availability and cover (Hansson,
1977); field voles show significant food preferences in British
uplands (Wheeler, 2005) and sheep grazing limits food
availability for field voles in Norwegian mountain pastures
(Steen et al., 2005), while sheep and cattle grazing in Scottish
upland grasslands decreases vole abundance (Evans et al.,
2006). It has been shown previously that voles select some
habitats based more on cover depth than food availability
(Hansson, 1997; Lin and Batzli, 2001), though at low cover
levels, food availability becomes the main selection factor.
Grazing can affect plant composition and cover depth
substantially, but the effects of this on field vole populations
remain largely unstudied at wide scales despite being highly
relevant to wider conservation efforts in upland areas.
Here, I develop and validate a method for rapid
assessment of field vole population density in uplands

P. Wheeler / Agriculture, Ecosystems and Environment 123 (2008) 49–5550
based on feeding signs. This is used to survey field voles
across a wide area of British uplands in order to investigate
the distribution of the species with relation to habitat and
land management practices and understand the likely effects
of extensifying sheep grazing on field voles and their
predators.
2. Method
The study was carried out in the North Peak Envir-
onmentally Sensitive Area (ESA) of the Peak District
National Park in Northern England in the years 2000 and
2001. The area consists of grasslands dominated by Nardus
stricta and Molinia caerulea, (the former much more
extensive than the latter) and by dwarf shrub heaths of
Calluna vulgaris and a mixture of Eriophorum vaginatum,
Vaccinium myrtillus and Empetrum nigrum.
Time and logistical constraints preclude the use of live
trapping in wide-ranging studies of small mammals in
inaccessible areas, and in such situations, sign surveys are
the only practical technique. Field voles leave grass
clippings, piles of droppings and runways throughout their
ranges. In order to assess the reliability of field signs as
indicators of vole density in British uplands, signs were
searched for in twenty sites, five in each of the four main
North Peak ESA habitats (Molinia and Nardus grasslands,
Calluna moorland and Eriophorum blanket bog). Here,
genus names of these dominant plants are used to describe
habitat types, while full binomial names are used when
referring to individual species. Signs were assessed by
restricted random sampling of a 50 � 50 m area (i.e., quarter
ha) at each site. A 1 m2 quadrat was searched for fresh or old
droppings, grass clippings and runs in each 10 m2 of the
sample area, giving twenty-five records at each site. The
number of quadrats with each vole sign was multiplied by
four to produce a per hectare vole sign index (VSI) for that
sign. Each of the 20 sites surveyed for field signs was then
trapped with snap traps for three nights. At each site, 20 traps
were set unbaited in field vole runs at 15 m intervals across
the site. Traps were checked and reset every 24 h over three
nights. Trapping was carried out in summer and autumn
2000 and 2001. The number of animals caught per 100 trap
nights was used as a vole-trapping index (VTI). Falsely
triggered traps were discounted. VTI was compared to VSI
using general linear models (GLM) with numbers trapped
square root transformed for each of the field signs to assess
relationships between the two.
Voles were also live-trapped at a single site in order to
estimate density and correlate this with VSI. Forty-nine
Longworth small mammal traps (Chitty and Kempson,
1949) were placed at a grassland site within the wider study
area at 10 m intervals in a 60 � 60 m grid. Traps were baited
with wheat and blowfly pupae and lined with straw bedding
to prevent mortality of rodents and shrews. The site was
trapped for 5 nights every 6 weeks for 18 months. Traps were
checked twice daily at 12 h intervals or at dawn and dusk in
winter months. Field voles were marked individually by fur
clipping (Gurnell and Flowerdew, 1982). The first three
nights were classified as the marking period and the final two
nights, the recapture period; a high proportion of marked
individuals (60–80%) were recaptured. Live trapping index
(LTI) was then calculated using the Lincoln–Petersen
method divided by the trapping area (calculated as the
total trapping grid area plus a border equivalent to the mean
dispersal distance of recaptured individuals) in hectares. The
Lincoln–Petersen method was deemed suitable for estimat-
ing population size in this study as population estimates
were calculated over short time periods where major sex-
biased dispersal was unlikely (Kendall, 1999). VSI and LTI
were compared using linear regression.
Vole abundance was investigated at the landscape scale
by searching 48 sites during late summer and autumn, twelve
in each of the four habitats, for field vole signs and VSI was
calculated as above. Cover of plant species in each quadrat
was assessed and height of vegetation was measured using
the drop-disc method (Stewart et al., 2001). Abundance in
broad habitat types was assessed by comparing VSI for each
of the four habitats. The percentage cover of the seven main
plant species (C. vulgaris, N. stricta, V. myrtillus, E. nigrum,
M. caerulea, E. vaginatum and Deschampsia flexuosa) was
compared to VSI for each of the 48 sites using a GLM
controlled for habitat. Values of percentage cover for each
plant species were arcsine-transformed before analysis to
normalise them and allow analysis with standard parametric
tests (Sokal and Rohlf, 1995). Sixteen sites, four in each
habitat, were surveyed in the winter as well as summer to
compare VSI between seasons. Individual sites were located
at least half a kilometer apart to ensure spatial independence.
2.1. Effect of sheep grazing
The effect of level of sheep grazing on field vole density
was investigated by counting the number of sheep seen while
walking a 500 m transect at 27 sites surveyed in the summer
and autumn of 2001, where field sign surveys were also
carried out. Simple stocking rates were not used as sheep
tend to distribute themselves unequally across moorland,
grazing the better sites and avoiding areas of poor vegetation
(Clarke et al., 1995). Sheep numbers were then compared to
the VSI at each site with a GLM controlled for habitat type.
Sign surveys were also carried out in sheep exclosures,
which were either new plantations or areas of moorland
fenced specifically to prevent sheep grazing under the ESA
scheme (Anderson et al., 1997). Each exclosure was surveyed
along with a patch of equivalent habitat outside the exclosure.
Four exclosures of each of the four habitat types were
surveyed. Differences were analysed using two-way ANOVA.
Differences in VSI were converted to pre-breeding vole
population density using the relationship between VSI and
LTI and the ratio between summer (breeding season, when
most data were collected) and winter (pre-breeding season)

P. Wheeler / Agriculture, Ecosystems and Environment 123 (2008) 49–55 51
VSI for each habitat. The area of each habitat was calculated
from a Phase 1 habitat map of the North Peak ESA. Vole
densities in each of the four habitats studied were calculated
and used to estimate vole population size in the North Peak
area under scenarios of current grazing levels and under a
major reduction in grazing.
Dyczkowski and Yalden (1998) estimated field vole
consumption by a range of British predators and showed
that likely productivity matched likely consumption. Their
figures were used to estimate the field vole predator
community that could be supported by the North Peak field
vole population under current grazing levels and reduced
grazing. Some of these predators, such as short-eared owls
are rare in the ESA and nationally, so a local increase in their
population would be a considerable conservation success.
Annual vole consumption per individual predator and the
proportion of voles consumed by each was calculated from
Dyczkowski and Yalden (1998)’s estimates. Vole produc-
tivity was estimated by averaging typical productivity
from southern lowland Britain and Sweden presented in
Dyczkowski and Yalden (1998). The estimated number of
predators in the region was then calculated by dividing
the total voles consumed per predator by the annual vole
consumption of each.
3. Results
VTI was significantly correlated with the number of
survey quadrats with fresh clippings (GLM of square root
no. caught against field signs controlled for Habitat, n = 20,
R2 = 0.71, p < 0.01), fresh droppings (n = 20, R2 = 0.29,
p = 0.02), old droppings (n = 20, R2 = 0.27, p = 0.02) and
runways (n = 20, R2 = 0.30, p = 0.01), but not old clippings
(n = 20, R2 = 0.01, p = 0.78). Since the closest relationship
was with fresh clippings, this was selected as the most
reliable indicator of field vole density and was selected to
calculate the VSI (Fig. 1). The relationship between VSI and
Fig. 1. Relationship between vole sign index (VSI) based on fresh clippings
and vole trapping index (VTI) across four habitats, R2 = 0.71, p < 0.001.
Molinia closed circles, Eriophorum open circles, Nardus closed triangles,
Calluna open triangles.
VTI was described by the regression equation:
VTI ¼ 0:32� VSI� 0:69
A test for the interaction effect between habitat and
number of fresh clippings on voles caught was not
significant (GLM n = 20, F = 0.47, p = 0.74), implying that
the same relationship between fresh clippings counted and
voles present holds for all four habitats, therefore validating
this technique for estimating vole densities in all the upland
habitats. VSI based on fresh grass clippings was also
closely correlated with the live trapping index (LTI;
R2 = 0.58, p = 0.01) and the relationship described by the
equation:
LTI ¼ 0:37� VSIþ 7:21
The relationship between VSI and both VTI and LTI had
very similar slopes, differing mainly in the constant. Last-
night capture success was low for snap-trapped sites (0.3
captures per trap night overall, corresponding to 12.3% of
the total number of voles trapped) indicating that most of the
population had been sampled. Given the practical difficulties
of live trapping in remote upland areas, snap-trapping was
therefore regarded as a suitable indicator of population
density in these areas.
3.1. Vole abundance
There were significant differences in VSI between
habitats (Fig. 2; ANOVA, n = 48, p < 0.01). Molinia sites
had higher VSI than the other three habitats. Mean VSI in
Nardus grasslands was two-thirds that of Molinia, with
Eriophorum and Calluna sites fewer again.
There was no significant relationship between the
presence of any of the seven main plant species in a site
and VSI (GLM controlled for habitat; M. caerulea F = 0.09,
p = 0.77, N. stricta F = 0.06, p = 0.81, D. flexuosa F = 0.15,
p = 0.70, E. vaginatum F = 0.92, p = 0.36, C. vulgaris
F = 0.21, p = 0.66, V. myrtillus F = 1.15, p = 0.31, E.nigrum
Fig. 2. Mean vole sign index (�SE) and ratio of winter: summer VSI at sites
surveyed in winter (dark grey) and summer (light grey). P values are paired
sample t-test n = 4 pairs in each habitat.

P. Wheeler / Agriculture, Ecosystems and Environment 123 (2008) 49–5552
Fig. 3. Decline in vole sign index (VSI) with increasing numbers of sheep
seen on a 500 m transect adjacent to the survey site. Symbols as in Fig. 1.
F = 1.63, p = 0.23). Mean depth of cover at each site was
compared to VSI, controlling for habitat and again no
significant relationship was found (GLM, n = 48, F = 0.94,
p = 0.35).
There were significantly more field signs in summer than
in winter in all habitats (Fig. 2, ANOVA, n = 16, F = 7.68
p < 0.01), though the interaction term was not significant
( p = 0.53). Thus, while winter VSI was significantly and
substantially lower than in summer, the order of habitat
preference was essentially the same.
3.2. Effect of sheep grazing
VSI showed a significant negative relationship with
numbers of sheep seen when all habitats were combined
(Fig. 3; GLM controlled for habitat, n = 28, R2 = 0.75,
Table 1
Mean (SE) depth of cover and vole sign index (VSI) inside (ungrazed) and outs
Habitat Cover depth (cm)
Ungrazed Grazed % chan
Molinia 28 (3.6) 27 (2.6) 3.6
Eriophorum 23 (1.6) 18 (3.5) 21.7
Nardus 26 (3.5) 18 (1.9) 30.8
Calluna 31 (5.8) 26 (1.9) 16.1
Percentage change shows the decrease in each measure with grazing. Based on
Table 2
Extent of habitats in the North Peak ESA and associated field vole pre-breeding pop
sheep grazing (‘Grazed’) and the removal of sheep grazing (‘Ungrazed’)
Habitat Extent (ha) Vole density ha�1
Ungrazed Gra
Molinia 3220 19.8 (�2.5) 10.2
Eriophorum 14309 5.5 (�3.4) 2.7
Nardus 7869 18.3 (�2.5) 7.7
Calluna 13561 9.2 (�2.0) 6.2
Total 13.3 (�2.6) 6.6
F = 20.150, p < 0.01). The habitats individually did not
show the same trends: Molinia sites had a significant
negative relationship (n = 9, F = 8.53, p = 0.02), Erio-
phorum and Nardus approached significance at the 5%
level (n = 5, F = 9.70, p = 0.05 and n = 8, F = 4.60,
p = 0.08, respectively), but Calluna sites showed no
significant relationship (n = 6, F = 0.99, p = 0.38).
Depth of cover was significantly greater in ungrazed than
grazed areas (Table 1, two-way ANOVA, n = 16, F = 2.76,
p = 0.04) though there was no significant interaction
between grazing and habitat (F = 0.40, p = 0.75); i.e.,
grazing does not affect cover depth differently in different
habitats.
There were highly significant differences between VSI in
grazed and ungrazed sites for each habitat (Table 1; two way
ANOVA controlled for Habitat, F = 8.83, p = 0.01). The
most marked difference was in Eriophorum sites, where
grazing reduced VSI by almost 90%. VSI decreased with
grazing in Molinia sites by roughly 66%, in Nardus sites by
75% and in Calluna sites by over 70%.
There was no significant difference between the arcsine-
transformed percentages cover of five of the seven common
plant species inside and outside exclosures (Table 2).
However, E. nigrum was significantly more prevalent
outside exclosures (paired sample t-test n = 16, t = 2.11,
p < 0.01) and D. flexuosa (n = 16, t = 3.50, p = 0.01) was
significantly more prevalent inside exclosures. There were
increases in minor constituents of habitats between grazed
and ungrazed sites. Those that are likely to be of importance
to field voles are Festuca ovina and particularly Agrostis
spp., which have been shown to be favoured in the diet
(Hansson, 1971; Wheeler, 2002, 2005). There was a
significant overall increase in Agrostis spp. in ungrazed,
ide (grazed) exclosures in four main habitats in the North Peak ESA
VSI
ge Ungrazed Grazed % change
71 (2.5) 23 (1.9) 67.6
42 (3.5) 5 (1.9) 88.1
71 (2.5) 18 (6.6) 74.6
18 (2.0) 5 (1.9) 72.2
20 pairs of sites in each habitat type.
ulation densities (� standard error) and sizes under scenarios of widespread
Vole population size (1000s of voles)
zed Ungrazed Grazed Change
(�1.9) 63.9 32.8 31.1
(�2.4) 78.8 38.9 39.9
(�2.9) 144.2 60.3 83.9
(�1.2) 125.3 84.0 41.3
(�2.1) 412.3 216.0 196.3
P. Wheeler / Agriculture, Ecosystems and Environment 123 (2008) 49–55 53
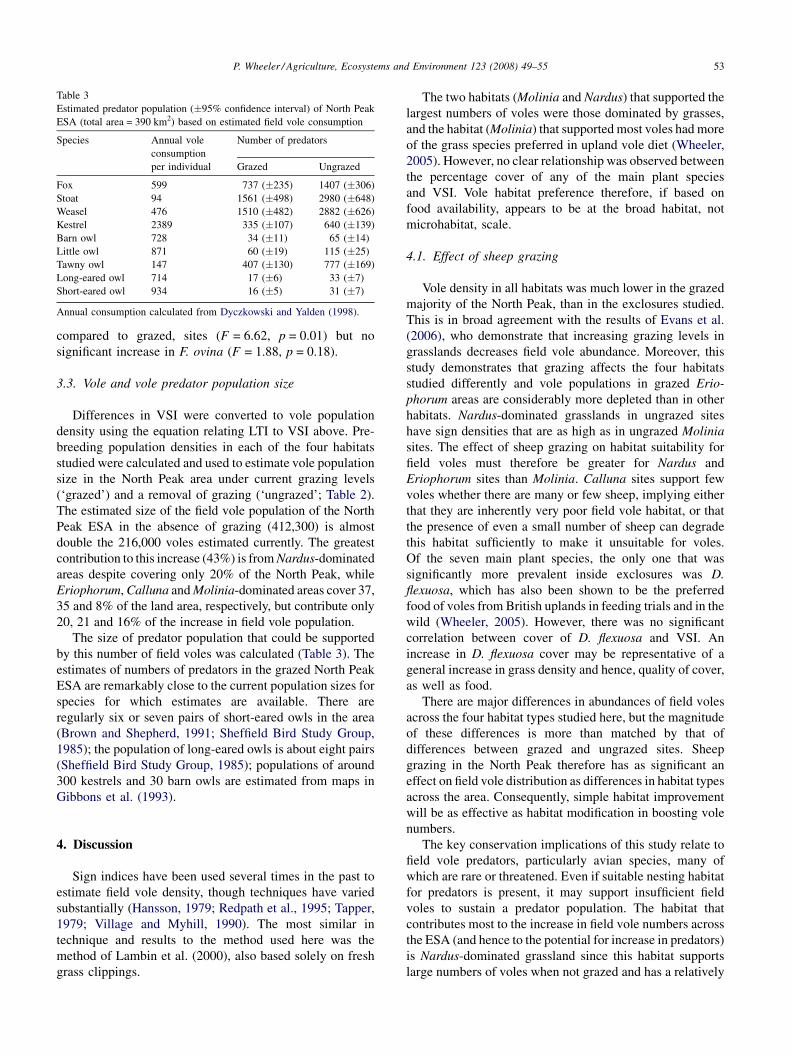
Table 3
Estimated predator population (�95% confidence interval) of North Peak
ESA (total area = 390 km2) based on estimated field vole consumption
Species Annual vole
consumption
per individual
Number of predators
Grazed Ungrazed
Fox 599 737 (�235) 1407 (�306)
Stoat 94 1561 (�498) 2980 (�648)
Weasel 476 1510 (�482) 2882 (�626)
Kestrel 2389 335 (�107) 640 (�139)
Barn owl 728 34 (�11) 65 (�14)
Little owl 871 60 (�19) 115 (�25)
Tawny owl 147 407 (�130) 777 (�169)
Long-eared owl 714 17 (�6) 33 (�7)
Short-eared owl 934 16 (�5) 31 (�7)
Annual consumption calculated from Dyczkowski and Yalden (1998).
compared to grazed, sites (F = 6.62, p = 0.01) but no
significant increase in F. ovina (F = 1.88, p = 0.18).
3.3. Vole and vole predator population size
Differences in VSI were converted to vole population
density using the equation relating LTI to VSI above. Pre-
breeding population densities in each of the four habitats
studied were calculated and used to estimate vole population
size in the North Peak area under current grazing levels
(‘grazed’) and a removal of grazing (‘ungrazed’; Table 2).
The estimated size of the field vole population of the North
Peak ESA in the absence of grazing (412,300) is almost
double the 216,000 voles estimated currently. The greatest
contribution to this increase (43%) is from Nardus-dominated
areas despite covering only 20% of the North Peak, while
Eriophorum, Calluna and Molinia-dominated areas cover 37,
35 and 8% of the land area, respectively, but contribute only
20, 21 and 16% of the increase in field vole population.
The size of predator population that could be supported
by this number of field voles was calculated (Table 3). The
estimates of numbers of predators in the grazed North Peak
ESA are remarkably close to the current population sizes for
species for which estimates are available. There are
regularly six or seven pairs of short-eared owls in the area
(Brown and Shepherd, 1991; Sheffield Bird Study Group,
1985); the population of long-eared owls is about eight pairs
(Sheffield Bird Study Group, 1985); populations of around
300 kestrels and 30 barn owls are estimated from maps in
Gibbons et al. (1993).
4. Discussion
Sign indices have been used several times in the past to
estimate field vole density, though techniques have varied
substantially (Hansson, 1979; Redpath et al., 1995; Tapper,
1979; Village and Myhill, 1990). The most similar in
technique and results to the method used here was the
method of Lambin et al. (2000), also based solely on fresh
grass clippings.
The two habitats (Molinia and Nardus) that supported the
largest numbers of voles were those dominated by grasses,
and the habitat (Molinia) that supported most voles had more
of the grass species preferred in upland vole diet (Wheeler,
2005). However, no clear relationship was observed between
the percentage cover of any of the main plant species
and VSI. Vole habitat preference therefore, if based on
food availability, appears to be at the broad habitat, not
microhabitat, scale.
4.1. Effect of sheep grazing
Vole density in all habitats was much lower in the grazed
majority of the North Peak, than in the exclosures studied.
This is in broad agreement with the results of Evans et al.
(2006), who demonstrate that increasing grazing levels in
grasslands decreases field vole abundance. Moreover, this
study demonstrates that grazing affects the four habitats
studied differently and vole populations in grazed Erio-
phorum areas are considerably more depleted than in other
habitats. Nardus-dominated grasslands in ungrazed sites
have sign densities that are as high as in ungrazed Molinia
sites. The effect of sheep grazing on habitat suitability for
field voles must therefore be greater for Nardus and
Eriophorum sites than Molinia. Calluna sites support few
voles whether there are many or few sheep, implying either
that they are inherently very poor field vole habitat, or that
the presence of even a small number of sheep can degrade
this habitat sufficiently to make it unsuitable for voles.
Of the seven main plant species, the only one that was
significantly more prevalent inside exclosures was D.
flexuosa, which has also been shown to be the preferred
food of voles from British uplands in feeding trials and in the
wild (Wheeler, 2005). However, there was no significant
correlation between cover of D. flexuosa and VSI. An
increase in D. flexuosa cover may be representative of a
general increase in grass density and hence, quality of cover,
as well as food.
There are major differences in abundances of field voles
across the four habitat types studied here, but the magnitude
of these differences is more than matched by that of
differences between grazed and ungrazed sites. Sheep
grazing in the North Peak therefore has as significant an
effect on field vole distribution as differences in habitat types
across the area. Consequently, simple habitat improvement
will be as effective as habitat modification in boosting vole
numbers.
The key conservation implications of this study relate to
field vole predators, particularly avian species, many of
which are rare or threatened. Even if suitable nesting habitat
for predators is present, it may support insufficient field
voles to sustain a predator population. The habitat that
contributes most to the increase in field vole numbers across
the ESA (and hence to the potential for increase in predators)
is Nardus-dominated grassland since this habitat supports
large numbers of voles when not grazed and has a relatively

P. Wheeler / Agriculture, Ecosystems and Environment 123 (2008) 49–5554
high ratio of winter to summer vole density. Extensifying
grazing on Nardus grasslands in the North Peak ESA
therefore would appear to be key to boosting field vole
numbers.
Estimates of predator populations in the North Peak ESA
show that reducing grazing would double population sizes of
key species such as the short-eared and long-eared owls
(Asio flammeus and A. otus). There would also be significant
increases in more common bird species, such as kestrels and
mammals, such as stoats and weasels, that have undergone
declines over recent decades (Gibbons et al., 1993; Harris
et al., 1995). Low vole densities in the North Peak may
explain why there is only one recent breeding record of the
hen harrier, Circus cyaneus a species that selects moorland
nesting sites in areas of high field vole density (Redpath
et al., 2002), despite the presence of over 135 km2 of
apparently suitable heather moorland. Removing sheep from
moorland is beneficial to much biodiversity (Anderson and
Yalden, 1981; Dennis, 2003; Fuller and Gough, 1999;
Hewson, 1982; Hill et al., 1992), and so, promoting suitable
vole habitat by reducing grazing ought to satisfy a range of
conservation concerns. However, an increase in predator
numbers would potentially cause declines in other species,
particularly ground-nesting birds.
If upland habitats are to be managed to promote the
conservation of vole predators, the effects of sheep
grazing on field voles must be taken into account.
Certainly removing sheep from moorland or reducing their
numbers will increase vole densities and boost predator
numbers.
Acknowledgements
This work was supported by the Samuel Gratrix Trust. I
would like to thank Derek Yalden, James Pearce-Higgins,
Magnus Johnson and two anonymous referees for comments
on earlier versions of the manuscript.
References
Anderson, P., Tallis, J.H., Yalden, D.W., 1997. Restoring Moorlands. The
Moorland Management Project Phase 3 Report, Bakewell, Derbyshire.
Anderson, P., Yalden, D.W., 1981. Increased sheep numbers and the loss of
heather moorland in the Peak District, England. Biol. Conserv. 30, 195–
213.
Brown, A.F., Shepherd, K.B., 1991. Breeding Birds of the South Pennine
Moors. Rep. No. 7. Joint Nature Conservancy Committe, Peterborough.
Chitty, D., Kempson, D.A., 1949. Prebaiting small mammals and a new
design of live trap. Ecology 30, 536–542.
Clarke, J.L., Welch, D., Gordon, I.J., 1995. The influence of vegetation
pattern on the grazing of heather moorland by red deer and sheep. I. The
location of animals on grass/heather mosaics. J. Appl. Ecol. 32, 166–
176.
Dennis, P., 2003. Sensitivity of upland arthropod diversity to livestock
grazing, vegetation structure and landform. Food, Agric. Environ. 1,
301–307.
Dyczkowski, J., Yalden, D.W., 1998. An estimate of the impact of predators
on the British Field Vole (Microtus agrestis) population. Mammal Rev.
28, 165–184.
Evans, D.M., Redpath, S.M., Elston, D.A., Evans, S.A., Mitchell, R.J.,
Dennis, P., 2006. To graze or not to graze? Sheep, voles, forestry and
nature conservation in the British uplands. J. Appl. Ecol. 43, 499–
505.
Fuller, R.J., Gough, S.J., 1999. Changes in sheep numbers in Britain:
implications for bird populations. Biol. Conserv. 91, 73–89.
Gibbons, D.W., Reid, J.B., Chapman, R.A., 1993. The New Atlas of
Breeding Birds in Britain and Ireland: 1988–1991. T and AD Poyser,
London.
Gurnell, J., Flowerdew, J.R., 1982. Live Trapping Small Mammals. The
Mammal Society, Reading.
Hansson, L., 1971. Habitat, food and population dynamics of the field vole
Microtus agrestis in south Sweden. Viltrevy 8, 267–378.
Hansson, L., 1977. Spatial dynamics of field voles Microtus agrestis in
heterogeneous landscapes. Oikos 29, 539–544.
Hansson, L., 1979. Field signs as indicators of vole abundance. J. Appl.
Ecol. 16, 339–347.
Hansson, L., 1997. Population growth and habitat distribution in cyclic
small rodents: to expand or to change? Oecologia 112, 345–350.
Harris, S., Morris, P., Wray, S., Yalden, D., 1995. A Review of British
Mammals: Population Estimates and Conservation Status of British
Mammals Other Than Cetaceans. JNCC, Peterborough.
Hewson, R., 1982. The effect upon field vole (Microtus agrestis) habitat of
removing sheep from moorland in west Scotland. J. Zool. Lond. 197,
304–307.
Hill, M.O., Evans, D.F., Bell, S.A., 1992. Long-term effects of excluding
sheep from hill pastures in north Wales. J. Ecol. 80, 1–13.
Kendall, W.L., 1999. Robustness of closed capture-recapture methods to
violations of the closure assumption. Ecology 80, 2517–2525.
Lin, Y.-T.K., Batzli, G.O., 2001. The influence of habitat quality on
dispersal, demography and population dynamics of voles. Ecol. Monogr.
71, 245–275.
Love, R.A., Webbon, C., Glue, D.E., Harris, S., 2000. Changes in the food of
British Barn Owls (Tyto alba) between 1974 and 1997. Mammal Rev.
30, 107–129.
Petty, S.J., Fawkes, W.L., 1997. Clutch size variation in tawny owls (Strix
aluco) from adjacent valley systems: can this be used as a surrogate to
investigate temporal and spatial variations in vole density. In: Duncan,
J.R., Johnson, D.H., Nicholls, T.H. (Eds.), Biology and Conservation of
Owls of the Northern Hemisphere. USDA Forest Service, North Central
Forest Research Station, pp. 315–324.
Redpath, C.J., Thirgood, S.J., Redpath, S.M., 1995. Evaluation of methods
to estimate field vole Microtus agrestis abundance in upland habitats. J.
Zool. Lond. 237, 49–55.
Redpath, S.M., Thirgood, S.J., Clarke, R., 2002. Field Vole Microtus
agrestis abundance and Hen Harrier Circus cyaneus diet and breeding
in Scotland. Ibis 144, E33–E38.
Sheffield Bird Study Group, 1985. Birds of the Sheffield Area Including the
North-East Peak District Sheffield City Libraries, Sheffield.
Sokal, R.R., Rohlf, F.J., 1995. Biometry: The Principles and Practice of
Statistics in Biological Research, third ed. W.H. Freeman, New York.
Steen, H., Mysterud, A., Austrheim, G., 2005. Sheep grazing and rodent
populations: evidence of negative interactions from a landscape scale
experiment. Oecologia 143, 347–364.
Stewart, K.E.J., Bourn, N.A.D., Thomas, J.A., 2001. An evaluation of three
quick methods commonly used to assess sward height in ecology. J.
Appl. Ecol. 38, 1148–1154.
Sundell, J., Huitu, O., Henttonen, H., Kaikusalo, A., Korpimaki, E.,
Pietiainen, H., Saurola, P., Hanski, I., 2004. Large-scale spatial
dynamics of vole populations in Finland revealed by the breeding
success of vole-eating avian predators. J. Anim. Ecol. 73, 167–
178.
Tapper, S., 1979. The effect of fluctuating vole numbers on a population of
weasels on farmland. J. Anim. Ecol. 48, 603–617.

P. Wheeler / Agriculture, Ecosystems and Environment 123 (2008) 49–55 55
Thirgood, S.J., Redpath, S.M., Graham, I.M., 2003. What determines the
foraging distribution of raptors on heather moorland? Oikos 100, 15–
24.
Village, A., 1982. The home range and density of kestrels in relation to vole
abundance. J. Anim. Ecol. 51, 413–428.
Village, A., 1987. Numbers, territory size and turnover of short-eared owls
Asio flammeus in relation to vole abundance. Ornis Scand. 18, 198–204.
Village, A., Myhill, D., 1990. Estimating small mammal abundance for
predator studies: snap-trapping versus sign indices. J. Zool. Lond. 222,
681–689.
Wheeler, P.M., 2002. The Distribution of Mammals Across the Upland
Landscape. PhD., University of Manchester, Manchester.
Wheeler, P.M., 2005. The diet of field voles at low population density in
upland Britain. Acta Theriol. 50, 483–492.