Embed Size (px)
Citation preview
Effects of Spacing on Sugar Beets in 30 Inch and 14-26 Inch Rows
F J HILLS
Receivedfor publication November 11972
Most sugar beets in California are grown on raised planting beds to facilitate furrow irrigation The most common row arrangements are single rows centered on beds 30 inches apart or two rows 14 inches apart centered on beds that are 40 inches from center to center The latter arrangement results in an alternating row spacing of 14-26 inches (Figure 1) Increasing numbers of growers are planting to a stand Because of hazards to emergence the grower plants as many seeds as possible consistent with a plan to establish a stand that will not require thinning It is common to find stands where plants average 4 inches and closer within the row Such dense stands produce commershycially acceptable crops but critica l comparisons show that stands spaced from 8 to 12 inches produce 2 to 4 tons more roots per acre (unpublished data)
a b Figure l-Sugar beet row spacings on raised planting beds to provide
furrows for irrigation a) 30 inch rows b) 14-26 inch rows
There have been man y studies on the effects of plant population on sugar beet production Early work was reviewed by Coons (l in 1946 In a recent review Hull and Jagga rd (3) point out tnat greatest sugar yields are given by populations of 26000 to 34000 plants per acre but that variations of several thousand per acre generally have only small effects on yield In 1968 Robinson and Worker (7) conshyfirmed earlier studies that a 12 inch square spacing (43500 plantsacre) yielded maximum sucrose Twenty-four inch square spacing yielded about 7 less sucrose but a 3 inch spacing resulted in 50 Joss Nelson (6) in Arizona showed 6 loss in sucrose yield from plants spaced 5 inches in 12-28 inch rows but only 2 loss from 5 inch spacing in 30 inch rows
I Extension Agronomist Department or Agronomy amp Ran ge Science University of Ca lifornia Davis Ca lifornia 956 16
Numbers in parentheses refer to literature cited
30 1 VOL 17 No4 OCTOBER 1973
The present experiment cond ucted at Davis California in 197 J was done to assess the effects of close in-row spacings for the row spacshyings used in California to guide producers in final stand establishment
Materials and Methods
The experimental treatments consisted of a factorial combination o f two row spacings (30 inch and 14-26 inch) two dates of harvest (7-8 September and 17-18 Octobe r) planned to give mean root yields of approximately 20 and 30 tons per acre and nine in-row spacings (15 2 3 5 7 9 J I 13 and 15 plants per 3 feet of row) The experishymental design was a split-split plot with main plots as row spacings sub plots dates of ha rvest and sub-sub plots in-row spacings The design allowed the main effect of in-row spacing and a ll interactions of in-row spacing with row width and harvest date to be determined with considerable precision but gave less precision for the main effects of row width and h arvest date
Seed of cultivar US H 9B currently the most extensively used diploid h ybrid in California was sown on 28 May with a Stanhay planter at I inch and furrow irrigated for germination Emergence exceeded 80 and was virtually complete by 7 June Spacings were established 14-16 June when seedlin gs were in the two leaf stage by placing a 3- foot markn along a row and leavin g the required number of plants per 3 feet spaced as evenly as possible Post thinning cou nts indicated that the desired spacings were achieved The fir st three columns of Table 1 indicate the final spacing in inches betwee n plants plants per 3 fe et of row and plants per acre Within a row spacing population density increased in equal increments from 3 to 15 plants3 feet of row which allowed easy calcula tion of quadratic functions to fit yield s plotted against d ensity (4)
At each harvest 30 fee t o f the ce nter two rows of each sub-sub plot were du g by ha nd Tops were weighed and one-quarte r of each of ten tops composited to determine percent dry matter Roots were separated into marketable (2 inches or more in diameter) and nonshymarketable individuals and then counted and weighed The average diameter of marketable beets was determined by measur ing ten randomly selected beets per plot Two root samples from eight to sixty beets per sample depending upon roo t size were taken from each plot for tare and sucrose analysis Residual pulp from the two samples of each plot was comp osited to determine percent root dry matter Coefshyficient s o f variability for spacing and interactions involving spacing were 3h 60 and 59 respectively for percent sucrose root and sucrose yield
In determining the ratio of su crose to non-sucrose dry matter in marketable roots Cr a ble 1) non-sucrose dry matter was calculated as (tons fresh rootsacre) (root dry matter) 10- 2
- (gross sucroseacre)
0 -gt0
h)
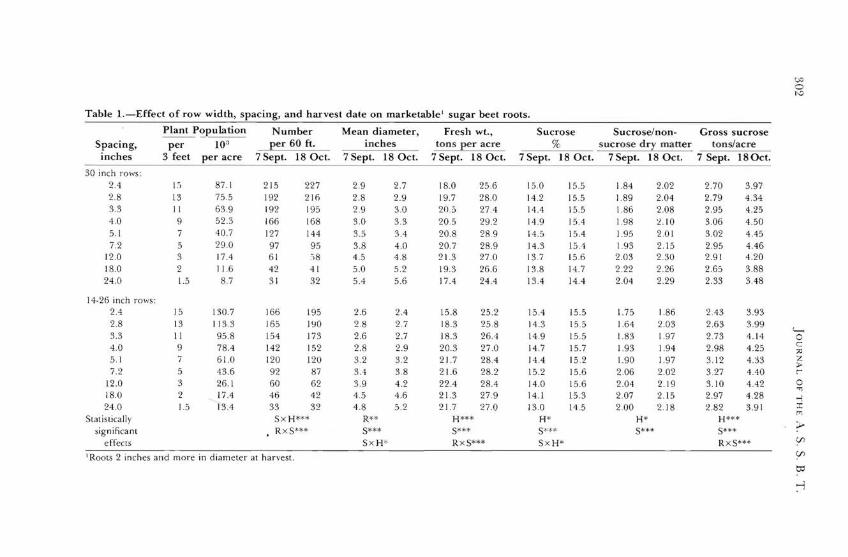
Table I-Effect of row width spacing and harvest date on marketable sugar beet roots
Plant P~pulation Number Mean diameter Fresh wt Sucrose Sucrosenon- Gross sucrose Spacing per 10 per 60 ft inches tons Ier acre sucrose dr~ matter tonsacre
inches 3 feet per acre 7 Sept 18 Oct 7 Sept 18 Oct 7 Sept 18 Oct 7 Sept 18 Oct 7 Sept 18 Oct 7 Sept 18 Oct
30 inch rows 2 4 I 87 1 2 15 227 28 13 75 5 192 2 16 33 I 639 192 195 4 0 9 523 166 168 5 1 7 407 127 144 72 5 290 97 95
120 3 174 6 1 8 180 2 116 42 4 1 240 15 87 3 1 32
29 27 28 29 29 30 30 33 35 34 38 4 0 45 48 50 52 54 56
180 256 197 280 205 274 205 292 208 289 207 289 2 13 270 193 266 174 244
150 155 14 2 155 144 155 149 154 145 154 143 15A 137 156 138 147 134 144
184 202 189 204 1 86 208 198 ~IO
195 20 1 193 215 203 230 222 226 204 229
270 397 279 434 295 425 306 450 302 445 295 446 29 1 420 265 388 233 348
14-26 inch ros 24 15 1307 166 195 28 13 11 33 165 l YO 33 11 958 154 173 40 9 784 142 152 51 7 610 120 120 72 5 436 92 87
120 3 261 60 62 180 2 174 46 42 240 15 134 33 32
Stat istica lly Sx H significant RxS
e ffects
Roots 2 inches and more in d iameter at har vest
26 24 28 2 7 26 27 28 29 32 32 34 38 39 42 45 46 48 52
R S SxH
158 252 183 258 183 264 203 270 2 17 284 2 16 282 224 284 213 279 217 270
H S RxS
154 155 14 3 155 149 15 5 14 7 157 144 15 2 152 156 14 0 156 14 1 153 130 14 5
H Smiddot Sx H
175 186 164 203 183 197 193 194 190 197 206 202 204 2 19 2 07 215 2 00 2 18
H S
243 393 263 399 273 4 14 298 425 3 12 433 327 440 3 10 442 297 4 28 282 39 1
H S RxS
--lt 0 c z shyr 0 r ~
()
()
to
~
303 VOL 17 No4 O CTOBER 1973
Results and Discussion
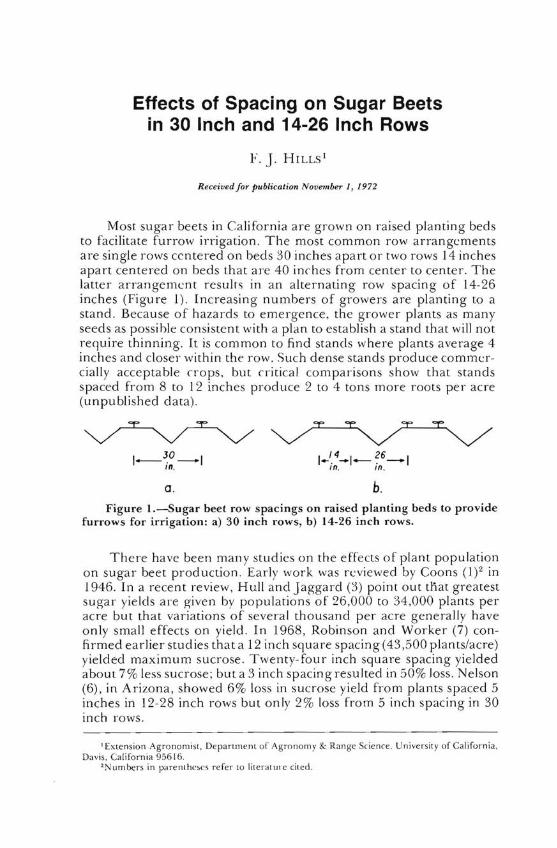
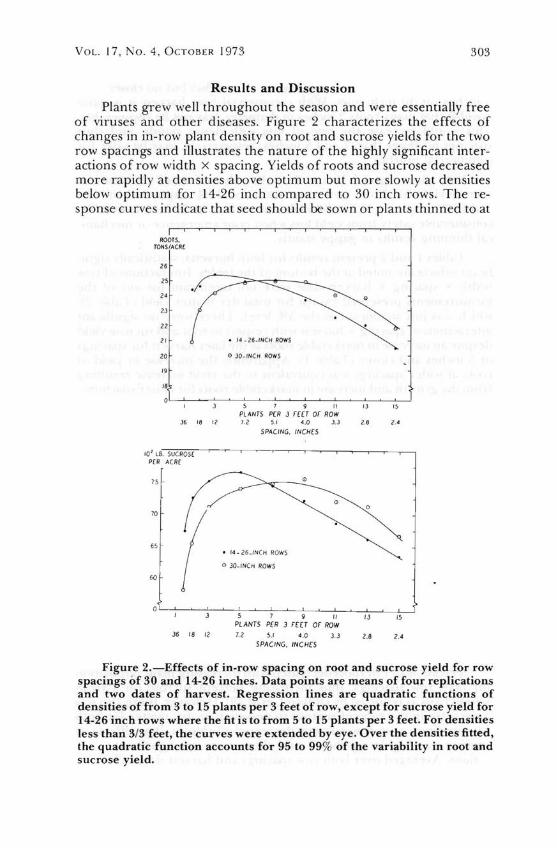
Plants grew well throughout the season and were essentially free of viruses and other diseases Figure 2 characterizes the effects of changes in in-row plant density on root and sucrose yields for the two row spacings and illustrates the nature of the highly significant intershyactions of row width X spacing Yields of roots and sucrose decreased more rapidly at densities above optimum but more slowly at densities below optimum for 14-26 inch compared to 30 inch rows The reshysponse curves indicate that seed should be sown or plants thinned to at
ROOTS TONSACRE
26
25
2
23
22
21 bull 14 _ 26 _INCH ROwS
20 o 30_ INCH ROW S
19
18
5 7 9 II 13 15 PLANTS peR 3 FepoundT OF ROW
36 12 72 51 0 J3 28 2 SPACING INCHe s
10 2 LB SUCROSE PHI ACR[
075
0 0
70
65 bull 14 - 26 _INC M ROwS
o 3D_INCH ROwS
60
0 L-~~~--~~5--~~7--~~9--~~1I--~~3--~~15~
PLANTS PER 3 FEU OF ROW 36 18 12 72 51 40 33 28 24
SPACING INCHES
Figure 2-Effects of in-row spacing on root and sucrose yield for row spacings of 30 and 14-26 inches Data points are means of four replications and two dates of harvest Regression lines are quadratic functions of densities of from 3 to 15 plants per 3 feet of row except for sucrose yield for 14-26 inch rows where the fit is to from 5 to 15 plants per 3 feet For densities less than 33 feet the curves were extended by eye Over the densities fitted the quadratic function accounts for 95 to 99 of the variability in root and sucrose yield
304 jOCRAL OF THE A S S B T
least 6 inches when the row spacing is 14-26 inches but no closer than 4 inches on 30 inch rows With commercial beet harvest it is quite possible that many roots 2 inches in diameter may not be recoverable This would increase the rate of loss with dense stands and thus spacings no closer than 7 and 5 inches respectively may be safer for commercial practice
With plants spaced 18 and 24 inches the estimated reduction in sucrose yield for 14-26 inch rows was 5 and 12 respectively but 13 and 23 respectively for 30 inch rows Thus 14-26 inch rows offer considerable safety from yield loss when poor emergence or mechanishycal thinning results in gappy stands
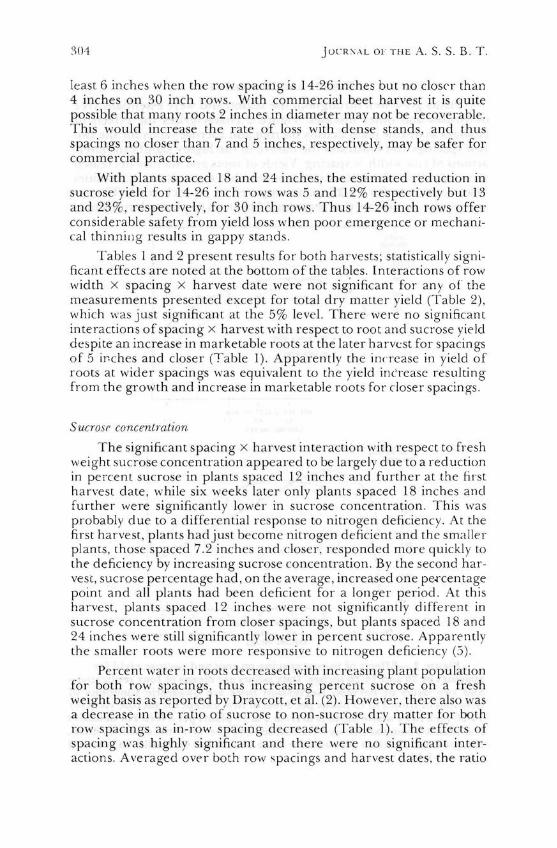
Tables 1 and 2 present results for both harvests statistically signishyficant effects are noted at the bottom of the tables Interactions of row width X spacing x harvest date were not significant for any of the measurements presented except for total dry matter yield (Table 2) which was just significant at the 5 leve l There were no significant interactions of spacing x harvest with respect to root and sucrose yield despite an increase in marketable roots at the later harvest for spacings of 5 irches and closer (Table I) Apparently the increase in yield of roots at wider spacings was equivalent to the yield increase resulting from the growth and increase in marketable roots for closer spacings
5ucros concentration
The significant spacing x harvest interaction with respect to fresh weight sucrose concentration appeared to be largely due to a red uction in pecent sucrose in plants spaced 12 inches and further at the first harvest date while six weeks later only plants spaced 18 inches and further were significantly lower in sucrose concentration This was probably due to a differential response to nitrogen deficiency At the first harvest plants hadjust become nitrogen deficie nt and the smaller plants those spaced 72 inches and closer responded more quickly to the deficiency by increasing sucrose concentration By the second harshyvest sucrose perce ntage had on the average increased one percentage point and all plants had been deficient for a longer period At this harvest plants spaced 12 inches were not significantly different in sucrose concentration from closer spacings but plants spaced 18 and 24 inches were still significantly lower in percent sucrose Apparently the smaller roots were more responsive to nitrogen deficiency (5)
Pe rcent water in roots decreased with in creasing plant population for both row spacings thus increasing percen t sucrose on a fresh weight basis as reported by Draycott et al (2) However the re also was a decrease in the ratio of sucrose to non-sucrose dry matter for both row spacings as in-row spacing decreased (Table I) T he effects of spacing was highly significant and there were no significant intershyactions Averaged over both row spacings and harvest dates the ratio
~Table 2-Effect of row width spacing and date ofharvest on number and yield of non-marke table roots and dry matter yield ofall tops and =roots
Non-marketable roots -1
Spacing Plants
per
Number per 60 ft
Fresh wt tonsac re
All tops dry wt2 tonsac re
Total dry wt tonsacre
Ratio Dry roots dry tops2
Z l
inches 3 ft 7 Sept 18 O ct 7 Sept 180ct 7 Sept 18 Oct 7 Sept 18 Oct 7 Sept 18 Oct 30 inch rows 0
24 15 51 40 13 15 259 228 707 845 178 27 1 (
28 33
13 II
36 13
26 12
10 04
09 05
247 234
24 1 2 27
696 697
903 865
1 81 197
277 288
c 7-l
40 9 8 6 02 02 20 1 226 664 896 234 298 5 1 7 5 2 01 00 188 20 1 646 869 245 340 0
-1 72 5 2 2 00 00 178 19 1 627 846 255 342 uo
120 3 1 1 00 00 159 LSI 594 755 277 400 180 2 0 0 00 00 128 145 5 13 707 304 387 240 15 0 0 00 00 11 3 123 460 627 308 4 17
14-26 inch rows 24 15 97 78 19 27 264 268 7 15 9 35 175 250 28 13 60 49 14 16 282 269 754 902 169 236 33 11 39 35 10 15 336 264 694 922 20 1 252 40 9 24 15 0 04 267 223 737 877 178 295 5 1 7 10 8 02 02 2 31 225 71 6 883 2 13 293 72 5 4 0 0 00 194 188 682 846 255 35 1
120 3 1 I 00 00 186 184 650 83 1 256 36 1 180 2 I 0 00 00 147 166 588 793 30 1 383 240 1 5 0 0 00 00 146 150 570 722 291 393
Slatistically R R R R R sig nificant 5 S 5 H H
effects bull RxS RxS S S RxSx H
1 ROOLS less than 2 inches in d iamClc r at harvest 2From marketable and no n-markefable roots uo
v 0
306 JOClCAL OF THE A S S B T
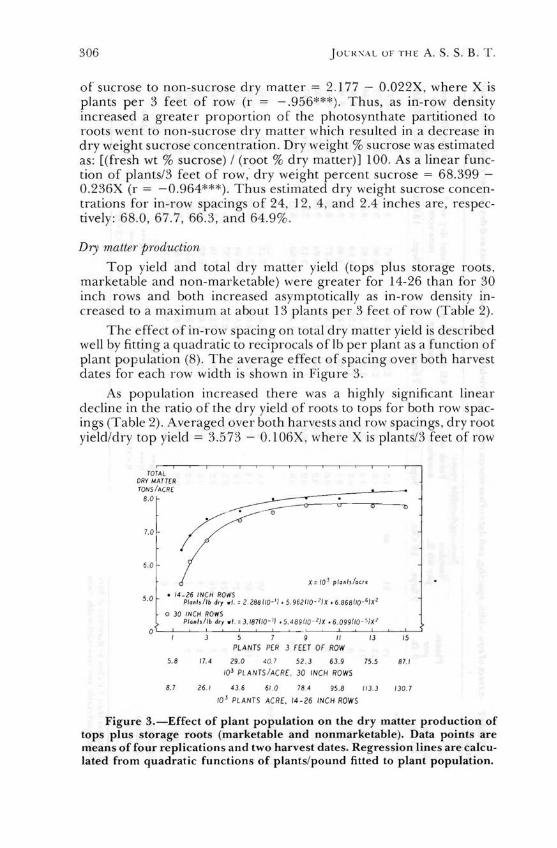
of sucrose to non-sucrose dry matter = 2177 - 0022X where X is plants per 3 feet of row (r = - 956) Thus as in-row density increased a greater proportion of the photosynthate partitioned to roots went to non-sucrose dry matter which resulted in a decrease in dry weight sucrose concentration Dry weight sucrose was estimated as [(fresh wt sucrose) (root dry matter)] 100 As a linear funcshytion of plants3 feet of row dry weight percent sucrose = 68399 shy0 236X (r = -0 964) Thus estimated dry weight sucrose concenshytrations for in-row spacings of 24 12 4 and 24 inches are respecshytively 680 677 663 and 649
Dry matter production
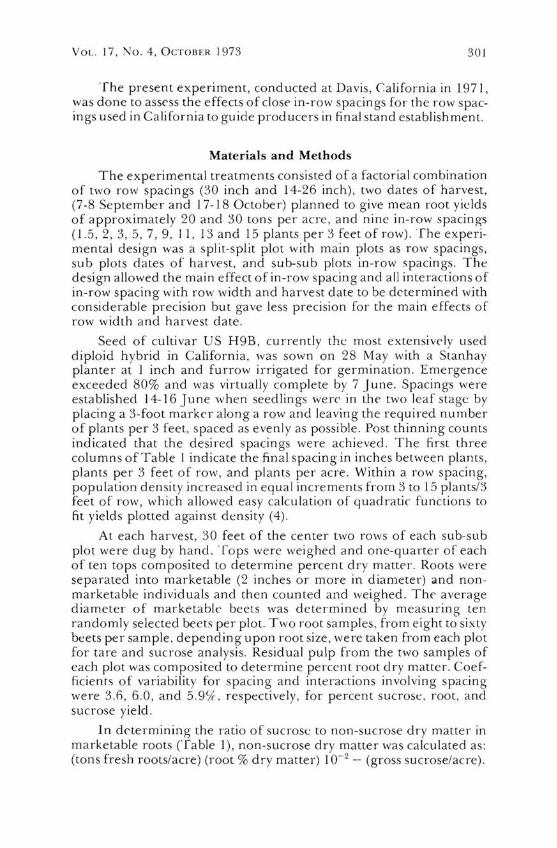
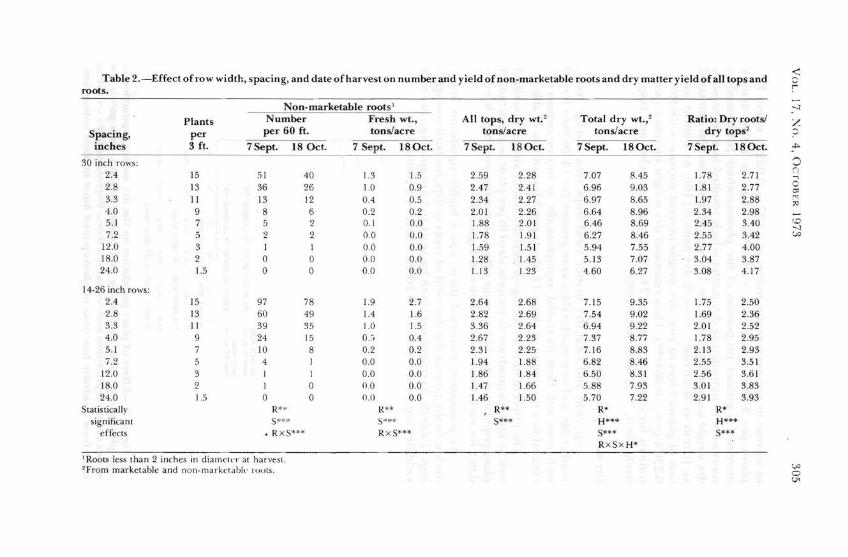
Top yield and total dry matter yield (tops plus storage roots marketable and non-marketable) were greater for 14-26 than for 30 inch rows and both increased asymptotically as in-row density inshycreased to a maximum at about 13 plants per 3 feet of row (Table 2)
The effect of in-row spacing on total dry matter yield is described well by fitting a quadratic to reciprocals of lb per plant as a function of plant population (8) The average effect of spacing over both harvest dates for each row width is shown in Figu re 3
As population increased there was a highly significant linear decline in the ratio of the dry yield of roots to tops for both row spacshyings (Table 2) Averaged over both harvests and row spacings dry root yielddry top yield = 3573 - 0106X where X is plants3 feet of row
TOTA L DRy AT TER TONS ACRE
80 o
7 0
60
bull 14-26 INCH ROWS50 PI lib 1 2288 1i0- bull 5 9621i0 - x bull 68681i0-X
o 30 INCH ROWS Plallisib dry wi =387110 - 1) +S489(O - Z)X +6099(1O- 5)X 1
5 7 9 II 13 15 PLANTS PER 3 F[U OF ROW
58 17 4 290 407 52 3 639 755 871
10 PLANTS ACRE 30 INCH ROWS
87 261 436 61 0 784 958 1133 1307
10 PLANTS ACRE 14-26 INCH ROWS
Figure 3-Effect of plant population on the dry matter production of tops plus storage roots (marketable and nonmarketable) Data points are means of four replications and two harvest dates Regression lines are calcushylated from quadratic functions of plantspound fitted to plant population
307 VOL 17 No4-OCTOBER 1973
(r = - 980 ) Thus as population increased an increasing proporshytion of photosynthate was partitioned to tops This effect in addition to the greate r proportion of non-su crose dry matter in roots as popushyla tion increased resulted in an increasin gly smaller proportion of photosynth ate going to sucrose yield
Summary and Conclusions
An experiment was cond ucted at Davis California in 1971 to assay the effects of in-row spacings on sugar beets grown in row widths of 30 and 14-26 inches at two dates of harvest Root and sucrose yield reshysponses were characteri7ed by quadratic functions of plant density Root and sucrose yie lds declined at different rates for the two row widths at in-row densities higher and lmver than optimum Yields d ecreased more rapidly at high in-row densities but more slowly at low in-row densities for 14-26 compared to 30 inch rows Near maximum yields occurred for 14-26 inch rows at spacings of from 6 to 12 inches and on 30 inch rows at spacings o f fro m 4 to 10 inches
Increases in fresh weight sucrose concentration a t high in-row densities are attributed to decreases in tissue water but increases in non-sucrose dry matter also occur so that dry weight sucrose concen shytration decreases at high in-row densities
Total dry matter yield increased asymptotically for both row widths as in-row density increased but the ratio of roots to tops deshyclined As population increases an increasing proportion of photosynshythate appears to be partitioned to tops and a greater proportion of the photosynthate goin g to roots is partitioned to non-sucrose dry matter th an to sucrose
Acknow1edgements
Appreciation is extended to Randolph Holme Diane Hills Gary Peterson and Rod ney Marble for their careful work in the a rduous task of successfull y establishing the plant spac in gs reported in this experiment Thanks also to Dr T M Little for co nsultatioh in the design and analysis of the experiment
This study was aided by fin anc ial assistance from the California Beet Growers Association and the sugar processors of California
Literature Cited
(I) COONS C H 1948 Space re lations hi ps as affecting yield and quality o f sugar beets Proc Am Soc Sugar Beet Techno 5252-268
(2) DRAY COTT A P M J D t RRANT and P J LAST 1971 Effects of cu ltural practices and fe rtilizers on Sligar beet quality J lnt lnst Sugar Beet Res 5(3) 169- 185
(3) H rLL R and K W JACCARD 197 1 Recent developments in the estabshylishment of sugar-bee t stands Field Crop bstracts 24(3)381-390
~08 JOURNAL OF THE A S S B 1
(4) LITTLE T M 1963 Correlation and regression a supplement to Experimental Methods for Exte nsion Workers Un iv of Calif Agric Extension Service pp 62
(5) LOOMIS R S and A ULRICH 1962 Responses of sugarbeets to nitrogen deficiency as influenced by plant competition Cro p Sci 237-40
(6) NELSON] M 1969 Effect of row width plant spacing nitroge n rate and time of harvest on yield and sucrose content of sugarbeets J Am Soc Sugar Beet Techno 15(6)509-5 16
(7) ROBI NSO N F E and GEORGE F WORKER JR 1969 Plant density and yield of sugar beets in an arid environment Agron ] 61441-443
(8) WILLEY R W and S B H EATH 1969 The quantative re la tionships between plant population and crop yield Adva nces in Agronomy 21281-321
30 1 VOL 17 No4 OCTOBER 1973
The present experiment cond ucted at Davis California in 197 J was done to assess the effects of close in-row spacings for the row spacshyings used in California to guide producers in final stand establishment
Materials and Methods
The experimental treatments consisted of a factorial combination o f two row spacings (30 inch and 14-26 inch) two dates of harvest (7-8 September and 17-18 Octobe r) planned to give mean root yields of approximately 20 and 30 tons per acre and nine in-row spacings (15 2 3 5 7 9 J I 13 and 15 plants per 3 feet of row) The experishymental design was a split-split plot with main plots as row spacings sub plots dates of ha rvest and sub-sub plots in-row spacings The design allowed the main effect of in-row spacing and a ll interactions of in-row spacing with row width and harvest date to be determined with considerable precision but gave less precision for the main effects of row width and h arvest date
Seed of cultivar US H 9B currently the most extensively used diploid h ybrid in California was sown on 28 May with a Stanhay planter at I inch and furrow irrigated for germination Emergence exceeded 80 and was virtually complete by 7 June Spacings were established 14-16 June when seedlin gs were in the two leaf stage by placing a 3- foot markn along a row and leavin g the required number of plants per 3 feet spaced as evenly as possible Post thinning cou nts indicated that the desired spacings were achieved The fir st three columns of Table 1 indicate the final spacing in inches betwee n plants plants per 3 fe et of row and plants per acre Within a row spacing population density increased in equal increments from 3 to 15 plants3 feet of row which allowed easy calcula tion of quadratic functions to fit yield s plotted against d ensity (4)
At each harvest 30 fee t o f the ce nter two rows of each sub-sub plot were du g by ha nd Tops were weighed and one-quarte r of each of ten tops composited to determine percent dry matter Roots were separated into marketable (2 inches or more in diameter) and nonshymarketable individuals and then counted and weighed The average diameter of marketable beets was determined by measur ing ten randomly selected beets per plot Two root samples from eight to sixty beets per sample depending upon roo t size were taken from each plot for tare and sucrose analysis Residual pulp from the two samples of each plot was comp osited to determine percent root dry matter Coefshyficient s o f variability for spacing and interactions involving spacing were 3h 60 and 59 respectively for percent sucrose root and sucrose yield
In determining the ratio of su crose to non-sucrose dry matter in marketable roots Cr a ble 1) non-sucrose dry matter was calculated as (tons fresh rootsacre) (root dry matter) 10- 2
- (gross sucroseacre)
0 -gt0
h)
Table I-Effect of row width spacing and harvest date on marketable sugar beet roots
Plant P~pulation Number Mean diameter Fresh wt Sucrose Sucrosenon- Gross sucrose Spacing per 10 per 60 ft inches tons Ier acre sucrose dr~ matter tonsacre
inches 3 feet per acre 7 Sept 18 Oct 7 Sept 18 Oct 7 Sept 18 Oct 7 Sept 18 Oct 7 Sept 18 Oct 7 Sept 18 Oct
30 inch rows 2 4 I 87 1 2 15 227 28 13 75 5 192 2 16 33 I 639 192 195 4 0 9 523 166 168 5 1 7 407 127 144 72 5 290 97 95
120 3 174 6 1 8 180 2 116 42 4 1 240 15 87 3 1 32
29 27 28 29 29 30 30 33 35 34 38 4 0 45 48 50 52 54 56
180 256 197 280 205 274 205 292 208 289 207 289 2 13 270 193 266 174 244
150 155 14 2 155 144 155 149 154 145 154 143 15A 137 156 138 147 134 144
184 202 189 204 1 86 208 198 ~IO
195 20 1 193 215 203 230 222 226 204 229
270 397 279 434 295 425 306 450 302 445 295 446 29 1 420 265 388 233 348
14-26 inch ros 24 15 1307 166 195 28 13 11 33 165 l YO 33 11 958 154 173 40 9 784 142 152 51 7 610 120 120 72 5 436 92 87
120 3 261 60 62 180 2 174 46 42 240 15 134 33 32
Stat istica lly Sx H significant RxS
e ffects
Roots 2 inches and more in d iameter at har vest
26 24 28 2 7 26 27 28 29 32 32 34 38 39 42 45 46 48 52
R S SxH
158 252 183 258 183 264 203 270 2 17 284 2 16 282 224 284 213 279 217 270
H S RxS
154 155 14 3 155 149 15 5 14 7 157 144 15 2 152 156 14 0 156 14 1 153 130 14 5
H Smiddot Sx H
175 186 164 203 183 197 193 194 190 197 206 202 204 2 19 2 07 215 2 00 2 18
H S
243 393 263 399 273 4 14 298 425 3 12 433 327 440 3 10 442 297 4 28 282 39 1
H S RxS
--lt 0 c z shyr 0 r ~
()
()
to
~
303 VOL 17 No4 O CTOBER 1973
Results and Discussion
Plants grew well throughout the season and were essentially free of viruses and other diseases Figure 2 characterizes the effects of changes in in-row plant density on root and sucrose yields for the two row spacings and illustrates the nature of the highly significant intershyactions of row width X spacing Yields of roots and sucrose decreased more rapidly at densities above optimum but more slowly at densities below optimum for 14-26 inch compared to 30 inch rows The reshysponse curves indicate that seed should be sown or plants thinned to at
ROOTS TONSACRE
26
25
2
23
22
21 bull 14 _ 26 _INCH ROwS
20 o 30_ INCH ROW S
19
18
5 7 9 II 13 15 PLANTS peR 3 FepoundT OF ROW
36 12 72 51 0 J3 28 2 SPACING INCHe s
10 2 LB SUCROSE PHI ACR[
075
0 0
70
65 bull 14 - 26 _INC M ROwS
o 3D_INCH ROwS
60
0 L-~~~--~~5--~~7--~~9--~~1I--~~3--~~15~
PLANTS PER 3 FEU OF ROW 36 18 12 72 51 40 33 28 24
SPACING INCHES
Figure 2-Effects of in-row spacing on root and sucrose yield for row spacings of 30 and 14-26 inches Data points are means of four replications and two dates of harvest Regression lines are quadratic functions of densities of from 3 to 15 plants per 3 feet of row except for sucrose yield for 14-26 inch rows where the fit is to from 5 to 15 plants per 3 feet For densities less than 33 feet the curves were extended by eye Over the densities fitted the quadratic function accounts for 95 to 99 of the variability in root and sucrose yield
304 jOCRAL OF THE A S S B T
least 6 inches when the row spacing is 14-26 inches but no closer than 4 inches on 30 inch rows With commercial beet harvest it is quite possible that many roots 2 inches in diameter may not be recoverable This would increase the rate of loss with dense stands and thus spacings no closer than 7 and 5 inches respectively may be safer for commercial practice
With plants spaced 18 and 24 inches the estimated reduction in sucrose yield for 14-26 inch rows was 5 and 12 respectively but 13 and 23 respectively for 30 inch rows Thus 14-26 inch rows offer considerable safety from yield loss when poor emergence or mechanishycal thinning results in gappy stands
Tables 1 and 2 present results for both harvests statistically signishyficant effects are noted at the bottom of the tables Interactions of row width X spacing x harvest date were not significant for any of the measurements presented except for total dry matter yield (Table 2) which was just significant at the 5 leve l There were no significant interactions of spacing x harvest with respect to root and sucrose yield despite an increase in marketable roots at the later harvest for spacings of 5 irches and closer (Table I) Apparently the increase in yield of roots at wider spacings was equivalent to the yield increase resulting from the growth and increase in marketable roots for closer spacings
5ucros concentration
The significant spacing x harvest interaction with respect to fresh weight sucrose concentration appeared to be largely due to a red uction in pecent sucrose in plants spaced 12 inches and further at the first harvest date while six weeks later only plants spaced 18 inches and further were significantly lower in sucrose concentration This was probably due to a differential response to nitrogen deficiency At the first harvest plants hadjust become nitrogen deficie nt and the smaller plants those spaced 72 inches and closer responded more quickly to the deficiency by increasing sucrose concentration By the second harshyvest sucrose perce ntage had on the average increased one percentage point and all plants had been deficient for a longer period At this harvest plants spaced 12 inches were not significantly different in sucrose concentration from closer spacings but plants spaced 18 and 24 inches were still significantly lower in percent sucrose Apparently the smaller roots were more responsive to nitrogen deficiency (5)
Pe rcent water in roots decreased with in creasing plant population for both row spacings thus increasing percen t sucrose on a fresh weight basis as reported by Draycott et al (2) However the re also was a decrease in the ratio of sucrose to non-sucrose dry matter for both row spacings as in-row spacing decreased (Table I) T he effects of spacing was highly significant and there were no significant intershyactions Averaged over both row spacings and harvest dates the ratio
~Table 2-Effect of row width spacing and date ofharvest on number and yield of non-marke table roots and dry matter yield ofall tops and =roots
Non-marketable roots -1
Spacing Plants
per
Number per 60 ft
Fresh wt tonsac re
All tops dry wt2 tonsac re
Total dry wt tonsacre
Ratio Dry roots dry tops2
Z l
inches 3 ft 7 Sept 18 O ct 7 Sept 180ct 7 Sept 18 Oct 7 Sept 18 Oct 7 Sept 18 Oct 30 inch rows 0
24 15 51 40 13 15 259 228 707 845 178 27 1 (
28 33
13 II
36 13
26 12
10 04
09 05
247 234
24 1 2 27
696 697
903 865
1 81 197
277 288
c 7-l
40 9 8 6 02 02 20 1 226 664 896 234 298 5 1 7 5 2 01 00 188 20 1 646 869 245 340 0
-1 72 5 2 2 00 00 178 19 1 627 846 255 342 uo
120 3 1 1 00 00 159 LSI 594 755 277 400 180 2 0 0 00 00 128 145 5 13 707 304 387 240 15 0 0 00 00 11 3 123 460 627 308 4 17
14-26 inch rows 24 15 97 78 19 27 264 268 7 15 9 35 175 250 28 13 60 49 14 16 282 269 754 902 169 236 33 11 39 35 10 15 336 264 694 922 20 1 252 40 9 24 15 0 04 267 223 737 877 178 295 5 1 7 10 8 02 02 2 31 225 71 6 883 2 13 293 72 5 4 0 0 00 194 188 682 846 255 35 1
120 3 1 I 00 00 186 184 650 83 1 256 36 1 180 2 I 0 00 00 147 166 588 793 30 1 383 240 1 5 0 0 00 00 146 150 570 722 291 393
Slatistically R R R R R sig nificant 5 S 5 H H
effects bull RxS RxS S S RxSx H
1 ROOLS less than 2 inches in d iamClc r at harvest 2From marketable and no n-markefable roots uo
v 0
306 JOClCAL OF THE A S S B T
of sucrose to non-sucrose dry matter = 2177 - 0022X where X is plants per 3 feet of row (r = - 956) Thus as in-row density increased a greater proportion of the photosynthate partitioned to roots went to non-sucrose dry matter which resulted in a decrease in dry weight sucrose concentration Dry weight sucrose was estimated as [(fresh wt sucrose) (root dry matter)] 100 As a linear funcshytion of plants3 feet of row dry weight percent sucrose = 68399 shy0 236X (r = -0 964) Thus estimated dry weight sucrose concenshytrations for in-row spacings of 24 12 4 and 24 inches are respecshytively 680 677 663 and 649
Dry matter production
Top yield and total dry matter yield (tops plus storage roots marketable and non-marketable) were greater for 14-26 than for 30 inch rows and both increased asymptotically as in-row density inshycreased to a maximum at about 13 plants per 3 feet of row (Table 2)
The effect of in-row spacing on total dry matter yield is described well by fitting a quadratic to reciprocals of lb per plant as a function of plant population (8) The average effect of spacing over both harvest dates for each row width is shown in Figu re 3
As population increased there was a highly significant linear decline in the ratio of the dry yield of roots to tops for both row spacshyings (Table 2) Averaged over both harvests and row spacings dry root yielddry top yield = 3573 - 0106X where X is plants3 feet of row
TOTA L DRy AT TER TONS ACRE
80 o
7 0
60
bull 14-26 INCH ROWS50 PI lib 1 2288 1i0- bull 5 9621i0 - x bull 68681i0-X
o 30 INCH ROWS Plallisib dry wi =387110 - 1) +S489(O - Z)X +6099(1O- 5)X 1
5 7 9 II 13 15 PLANTS PER 3 F[U OF ROW
58 17 4 290 407 52 3 639 755 871
10 PLANTS ACRE 30 INCH ROWS
87 261 436 61 0 784 958 1133 1307
10 PLANTS ACRE 14-26 INCH ROWS
Figure 3-Effect of plant population on the dry matter production of tops plus storage roots (marketable and nonmarketable) Data points are means of four replications and two harvest dates Regression lines are calcushylated from quadratic functions of plantspound fitted to plant population
307 VOL 17 No4-OCTOBER 1973
(r = - 980 ) Thus as population increased an increasing proporshytion of photosynthate was partitioned to tops This effect in addition to the greate r proportion of non-su crose dry matter in roots as popushyla tion increased resulted in an increasin gly smaller proportion of photosynth ate going to sucrose yield
Summary and Conclusions
An experiment was cond ucted at Davis California in 1971 to assay the effects of in-row spacings on sugar beets grown in row widths of 30 and 14-26 inches at two dates of harvest Root and sucrose yield reshysponses were characteri7ed by quadratic functions of plant density Root and sucrose yie lds declined at different rates for the two row widths at in-row densities higher and lmver than optimum Yields d ecreased more rapidly at high in-row densities but more slowly at low in-row densities for 14-26 compared to 30 inch rows Near maximum yields occurred for 14-26 inch rows at spacings of from 6 to 12 inches and on 30 inch rows at spacings o f fro m 4 to 10 inches
Increases in fresh weight sucrose concentration a t high in-row densities are attributed to decreases in tissue water but increases in non-sucrose dry matter also occur so that dry weight sucrose concen shytration decreases at high in-row densities
Total dry matter yield increased asymptotically for both row widths as in-row density increased but the ratio of roots to tops deshyclined As population increases an increasing proportion of photosynshythate appears to be partitioned to tops and a greater proportion of the photosynthate goin g to roots is partitioned to non-sucrose dry matter th an to sucrose
Acknow1edgements
Appreciation is extended to Randolph Holme Diane Hills Gary Peterson and Rod ney Marble for their careful work in the a rduous task of successfull y establishing the plant spac in gs reported in this experiment Thanks also to Dr T M Little for co nsultatioh in the design and analysis of the experiment
This study was aided by fin anc ial assistance from the California Beet Growers Association and the sugar processors of California
Literature Cited
(I) COONS C H 1948 Space re lations hi ps as affecting yield and quality o f sugar beets Proc Am Soc Sugar Beet Techno 5252-268
(2) DRAY COTT A P M J D t RRANT and P J LAST 1971 Effects of cu ltural practices and fe rtilizers on Sligar beet quality J lnt lnst Sugar Beet Res 5(3) 169- 185
(3) H rLL R and K W JACCARD 197 1 Recent developments in the estabshylishment of sugar-bee t stands Field Crop bstracts 24(3)381-390
~08 JOURNAL OF THE A S S B 1
(4) LITTLE T M 1963 Correlation and regression a supplement to Experimental Methods for Exte nsion Workers Un iv of Calif Agric Extension Service pp 62
(5) LOOMIS R S and A ULRICH 1962 Responses of sugarbeets to nitrogen deficiency as influenced by plant competition Cro p Sci 237-40
(6) NELSON] M 1969 Effect of row width plant spacing nitroge n rate and time of harvest on yield and sucrose content of sugarbeets J Am Soc Sugar Beet Techno 15(6)509-5 16
(7) ROBI NSO N F E and GEORGE F WORKER JR 1969 Plant density and yield of sugar beets in an arid environment Agron ] 61441-443
(8) WILLEY R W and S B H EATH 1969 The quantative re la tionships between plant population and crop yield Adva nces in Agronomy 21281-321