Embed Size (px)
Citation preview
EFFECTS OF STORAGE CONTAINER COLOR AND
SHADING ON WATER TEMPERATURE
A Thesis
by
JAMES BRENT CLAYTON
Submitted to the Office of Graduate Studies of
Texas A&M University
in partial fulfillment of the requirements for the degree of
MASTER OF SCIENCE
May 2011
Major Subject: Water Management and Hydrological Science
ii
EFFECTS OF STORAGE CONTAINER COLOR
AND SHADING ON WATER TEMPERATURE
A Thesis
by
JAMES BRENT CLAYTON
Submitted to the Office of Graduate Studies of
Texas A&M University
in partial fulfillment of the requirements for the degree of
MASTER OF SCIENCE
Approved by:
Chair of Committee, R. Karthikeyan
Committee Members, Bruce Lesikar
Don Wilkerson
Fouad Jaber
Intercollegiate Faculty Chair, Ronald Kaiser
May 2011
Major Subject: Water Management and Hydrological Science
iii
ABSTRACT
Effects of Storage Container Color and Shading on Water Temperature.
(May 2011)
James Brent Clayton, B.S., Virginia Tech
Chair of Advisory Committee: Dr. R. Karthikeyan
Rainwater harvesting (RWH) is a method of capturing rainfall from a catchment surface
and storing it for later use. Though it has been around for thousands of years, its popularity and
use has been increasing in recent years and water quality within RWH systems has become a
concern. Water temperature is a parameter of water quality and storage container color and
shading affect this temperature. Four different colors and three different shadings were applied to
twelve rainwater storage barrels. Water temperature of these barrels was measured over twenty
weeks during a Texas summer. During the initial ANOVA model, it was determined that the
color and shade variables had an interaction and thus both together had an effect on the water
temperature. Though the individual treatment variables could not be analyzed and compared
statistically, the trends showed that light colors and higher shading caused lower water
temperatures in the storage containers. Also, the color had more pronounced effect than shading
on water temperature inside the barrels.
iv
ACKNOWLEDGMENTS
This graduate school journey would not have been possible without the assistance and
support of several people. My utmost level of gratitude towards these friends, family, colleagues,
and advisors could not be expressed in this small page. But for the sake of the editors, here is my
best condensed version:
First, I would like to thank my first committee chair and advisor, Dr. Bruce Lesikar for
giving me the opportunity to do research and work with him at Texas A&M. He also encouraged
me to pursue a research topic that I had a passion for, which made the entire process not only
enjoyable but personally purposeful.
I would next like to thank Dr. Karthikeyan for adopting me as my second committee
chair at the beginning of my second year. He provided a smooth transition of leadership and
assisted me tirelessly in every final step of the thesis process.
I give additional thanks to my other committee members, Dr. Don Wilkerson and Dr.
Fouad Jaber, for their support, excellent critical reviews, and good humor. Thanks to Dr. Patti
Smith for substituting for Dr. Lesikar during my defense. I would also like to thank Dr. Val Silvy
and Dr. Ron Kaiser of the Water Program for their help and guidance through the process.
My research and thesis would not have been possible without the help of my co-workers,
Justin Mechell and Ryan Gerlich, who gave me assistance whenever I needed it on planning,
designing, constructing, analyzing, and writing about my research. Thanks to both.
I give tremendous thanks to my family all over the country. To my parents in New Jersey,
I give thanks for their support. And of course, I save the best for last. I give thanks to my dearest
Megan, whose unyielding support and compassionate motivation gave me the strength to
complete this journey with the greatest of ease.
v
TABLE OF CONTENTS
Page
ABSTRACT .............................................................................................................................. iii
ACKNOWLEDGMENTS ........................................................................................................ iv
TABLE OF CONTENTS .......................................................................................................... v
LIST OF FIGURES .................................................................................................................. vi
LIST OF TABLES .................................................................................................................... vii
1. INTRODUCTION .............................................................................................................. 1
2. LITERATURE REVIEW ................................................................................................... 5
3. MATERIALS AND METHODS ........................................................................................ 11
3.1 Storage Containers ............................................................................................... 11
3.2 Shade Structures................................................................................................... 11
3.3 Experimental Design ............................................................................................ 13
3.4 Instrumentation for Data Collection .................................................................... 14
3.5 Data Collection Methods ..................................................................................... 16
3.6 Data Analysis ....................................................................................................... 17
4. RESULTS AND DISCUSSION ......................................................................................... 19
4.1 Preliminary Experiment Results .......................................................................... 19
4.2 ANOVA of All Variables .................................................................................... 19
4.3 Effect of Container Color on Water Temperature ............................................... 21
4.4 Effect of Container Shading on Water Temperature ........................................... 23
4.5 Effect of Color and Shade on RWH Systems ...................................................... 25
4.6 Consequences of Color and Shade on RWH Systems ......................................... 27
5. CONCLUSIONS AND FUTURE RESEARCH ................................................................ 30
REFERENCES ......................................................................................................................... 32
VITA ....................................................................................................................................... 36

vi
LIST OF FIGURES
FIGURE Page
1 Shade structure for one set of storage containers ....................................................... 12
2 The research setup showing three blocks of shade treatments, each
with four color treatments. The three blocks are (left to right):
0% shade, 30% shade, and 63% shade ...................................................................... 13
3 Placement of the temperature probe in relation to the top of the
storage container (barrel) ........................................................................................... 14
4 The data logger, which is in the center of the middle storage
container block ........................................................................................................... 16
5 Mean water temperature inside storage containers painted with
different colors kept at varying shade conditions ...................................................... 22
6 Mean water temperature inside storage containers covered with
different shades kept at varying colors ...................................................................... 24
7 Average daily water temperature inside different colored storage
containers kept at different shades ............................................................................. 27
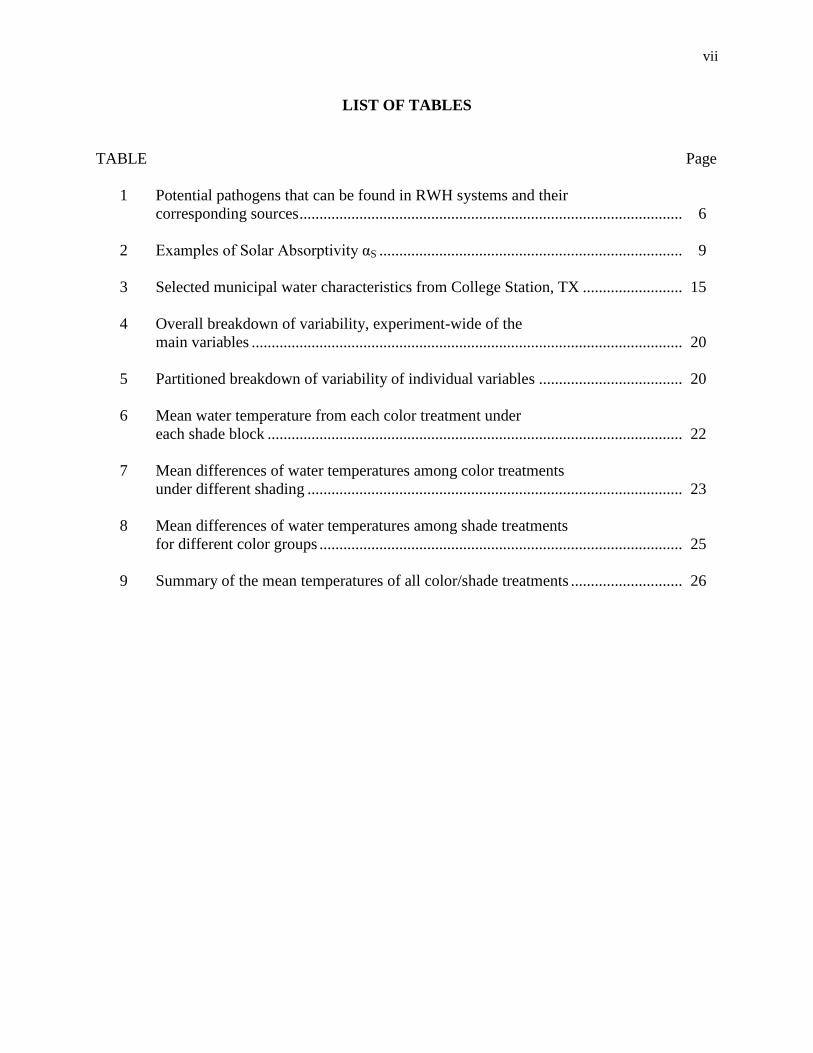
vii
LIST OF TABLES
TABLE Page
1 Potential pathogens that can be found in RWH systems and their
corresponding sources ................................................................................................ 6
2 Examples of Solar Absorptivity αS ............................................................................ 9
3 Selected municipal water characteristics from College Station, TX ......................... 15
4 Overall breakdown of variability, experiment-wide of the
main variables ............................................................................................................ 20
5 Partitioned breakdown of variability of individual variables .................................... 20
6 Mean water temperature from each color treatment under
each shade block ........................................................................................................ 22
7 Mean differences of water temperatures among color treatments
under different shading .............................................................................................. 23
8 Mean differences of water temperatures among shade treatments
for different color groups ........................................................................................... 25
9 Summary of the mean temperatures of all color/shade treatments ............................ 26
1
1. INTRODUCTION
Water is an essential part of everyday life. On the most basic level, it provides the
necessary molecule to complete the life cycles of photosynthesis and respiration. It provides the
liquid medium that helps keep cells of every organism together, while giving that organism
flexibility and structure. Water is the universal solvent, carrying oxygen, nutrients, and other
important chemicals needed by organisms. Water moderates the earth’s temperature, allowing
life to thrive in what would otherwise be an extreme environment. It also provides habitat for
countless aquatic organisms (Mauser, 2009).
Because the world’s water resources vary dramatically across space and time, the current
water situation is neither constant nor uniform. Though water crises are often perceived to be a
result of drought and climate change, many of the water shortages occur in places as a result of
human development (World Water Assessment Programme, 2009). As per capita increases in
developing nations, population and water consumption increase (World Water Assessment
Programme, 2009). As a result, many water stressed regions are the ones with growing and
developing nations. Currently, 1.2 billion people live in areas of water scarcity (International
Water Management Insititute, 2007). Examples of countries that currently face water barriers
include growing areas in Israel and Egypt. They have water availabilities of 370 m2/person/year
and 40 m2/person/year, respectively (Nagarajan, 2006). And such water stress leaves many
without the basic access to clean drinking water and/or sanitation.
This thesis follows the style of Applied Engineering in Agriculture: American Society of
Agricultural and Biological Engineers.
2
In addition to the current poor conditions in many places, the forecasts for future water
availability do not appear to be promising either. This is due to both population pressures and
climate change. The Food and Agriculture Organization (FAO) projects that in 2025, 1.8 billion
people will live in water scarcity while two thirds of the world will be water stressed (FAO,
2010). In a report by the United Nations, an additional 3 billion people will be added to the Earth
by 2050, 90% of whom will be located in developing nations (United Nations, 2007). Many of
these countries are in locations where the current population does not have access to clean water,
placing additional pressure on water availability. Such changes in population can also be seen on
a local level.
In the State of Texas, water shortages may result in the future due to growing population
and dwindling water supplies. The population of Texas is expected to grow from 21 million in
2000 to 46 million in 2060, and the demand for water will increase from 21 million km3 per year
in 2000 to 26.6 million km3 per year in 2060 (TWDB, 2007). All the while, the available water
supplies in Texas will decrease 18% in the next 50 years (TWDB, 2007). The Texas Water
Development Board (TWDB) creates water plans every five year to avoid this projected shortage
of supply. They estimate that if the plan current plan is not implemented, 85% percent of Texas
won’t have water available during times of drought (TWDB, 2007).
Access to additional water is one strategy that can improve water availability both in
Texas and around the world. One method of obtaining additional water is via rainwater
harvesting. Rainwater harvesting (RWH) is simply when one collects rainwater from a roof or
other catchment surface and direct into a storage area for later use. It is an ancient practice with
archeological evidence showing remnants of cisterns in Israel from 4000 years ago (Gould and
Nissen-Petersen, 1999). It reduces demand on other water sources (such as municipal water) and
3
allows the water to be slowly released back into the environment, reducing stormwater runoff
(Foraste and Hirschman, 2010). Rainwater harvesting offers a potential relief to several countries
that are threatened with water scarcity.
Though it has been practiced for generations, RWH is new for many who have previously
used municipal or groundwater for their water supply. With the growing popularity and use of
RWH systems, more people are installing tanks, cisterns, and rain barrels as a means to store
water, especially in the American Southwest (Lye, 1992). Rainwater harvesting systems put the
users in charge of their supply and so they are also responsible for water quality.
Water quality of RWH systems is perhaps the most controversial and contentious topic
and reason for many to be reluctant in adopting the practice. Water quality, as defined by the
United States Geological Survey, is “a measure of the suitability of water for a particular use
based on selected physical, chemical, and biological characteristics” (USGS, 2001). In RWH
systems, the primary concerns of users are from chemical and microbial and viral contamination
(Mechell, et al., 2010).
Rainwater contamination can occur at any phase of the RWH process: contamination by
airborne pollutants during rainfall events, on the roof catchment surface, in the conveyance
system, in the storage container, within the distribution system, and from the point-of-use source
(Gould and Nissen-Petersen, 1999). However, the primary contamination occurs on the roof
catchment surface, which for many systems is the roof of a building (Gould and Nissen-Petersen,
1999). Once contaminated, the water quality remains poor or can even degrade over time as it
remains in storage and is subsequently delivered to the point-of use (Gould and Nissen-Petersen,
1999, Grayman et al., 2004). Several factors, including water mixing (Grayman, et al., 2004),
4
sunlight penetration (Gould and Nissen-Petersen, 1999), and water temperature (Spellman and
Drinan, 2000), determine the water quality during storage.
This research aimed to analyze the temperature factor of water quality in a rainwater
harvesting system. The level of water quality desired is that used for drinking water. The overall
goal was to determine the effect of the water storage container (barrel) color and its shading on
the temperature of the water inside that container. Specific objectives were to:
o Evaluate how storage container color affects water temperature.
o Evaluate how various levels of storage container shading affects water
temperature.
It was hypothesized that the lightest colored storage containers and highest level of shade would
result in the lowest water temperatures during hot summer months.
5
2. LITERATURE REVIEW
During RWH, water is usually conveyed from a roof to a storage container, through
gutters and downspouts. This water, if not pretreated, can be contaminated as it enters the
container (Gould and Nissen-Petersen, 1999). Once in the storage container, the quality of water
can deteriorate over time, which can include the growth of microorganisms (Grayman and
Kirmeyer, 2000). The temperature of the water plays an important role in maintaining the quality
of stored water.
Water temperature is a physical property that affects its designated use, treatment, and
quality. From a water quality perspective, the temperature of water has three major impacts: it
changes the amount of dissolved oxygen; it affects the rate of biological activity; and it changes
the rate of gas transfer into water (Spellman and Drinan, 2000). The temperature itself has no
health impact on humans, but certain temperatures may promote the growth of waterborne
pathogens (Spellman and Drinan, 2000).
Microorganisms that can cause disease in humans from a RWH system fall into three
categories: parasites, bacteria, and viruses (Table 1) (Texas Commision on Environmental
Quality, 2007). Water temperature has an impact on the growth of these microorganisms. The
temperature that is ideal for growth depends on the type of microorganism. Although E. coli and
Salmonella are common pathogens found in water, research on their growth in water is lacking.
6
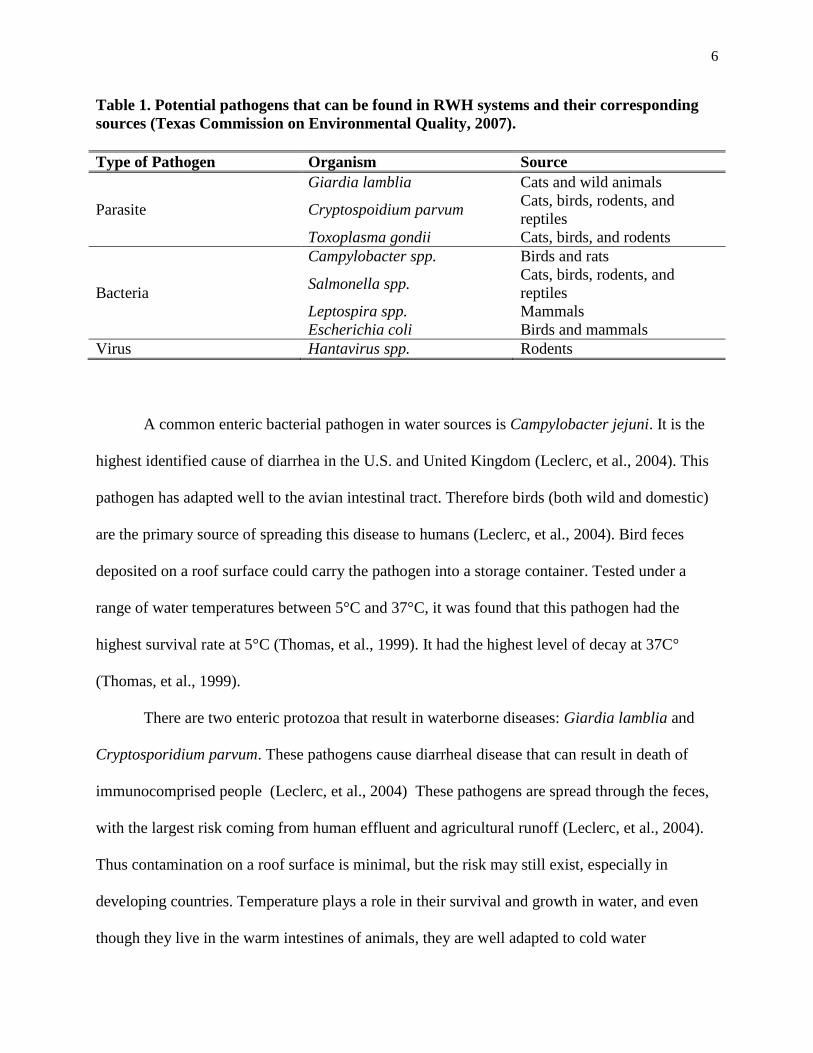
Table 1. Potential pathogens that can be found in RWH systems and their corresponding
sources (Texas Commission on Environmental Quality, 2007).
Type of Pathogen Organism Source
Parasite
Giardia lamblia Cats and wild animals
Cryptospoidium parvum Cats, birds, rodents, and
reptiles
Toxoplasma gondii Cats, birds, and rodents
Bacteria
Campylobacter spp. Birds and rats
Salmonella spp. Cats, birds, rodents, and
reptiles
Leptospira spp. Mammals
Escherichia coli Birds and mammals
Virus Hantavirus spp. Rodents
A common enteric bacterial pathogen in water sources is Campylobacter jejuni. It is the
highest identified cause of diarrhea in the U.S. and United Kingdom (Leclerc, et al., 2004). This
pathogen has adapted well to the avian intestinal tract. Therefore birds (both wild and domestic)
are the primary source of spreading this disease to humans (Leclerc, et al., 2004). Bird feces
deposited on a roof surface could carry the pathogen into a storage container. Tested under a
range of water temperatures between 5°C and 37°C, it was found that this pathogen had the
highest survival rate at 5°C (Thomas, et al., 1999). It had the highest level of decay at 37C°
(Thomas, et al., 1999).
There are two enteric protozoa that result in waterborne diseases: Giardia lamblia and
Cryptosporidium parvum. These pathogens cause diarrheal disease that can result in death of
immunocomprised people (Leclerc, et al., 2004) These pathogens are spread through the feces,
with the largest risk coming from human effluent and agricultural runoff (Leclerc, et al., 2004).
Thus contamination on a roof surface is minimal, but the risk may still exist, especially in
developing countries. Temperature plays a role in their survival and growth in water, and even
though they live in the warm intestines of animals, they are well adapted to cold water
7
temperatures. Samples taken in surface waters show Giardia cysts had the highest number of
positives in winter months when water temperatures were below 5°C (Hibler and Hancock,
1990). Under laboratory conditions, the number of Cryptosporidium oocysts decreased once
temperatures rose above 15°C (King, et al., 2005).
Some pathogens are not a result of fecal contamination on a roof surface. These
pathogens may thrive in drinking water storage with very little organic matter; they are referred
to as opportunistic pathogens (Leclerc, et al., 2004). One such pathogen belongs to the genus
Legionella. There are 19 species that cause human disease (Muder and Yu, 2002) and infections
lead to either legionellosis or Legionnaires disease. The pathogen is found in natural water
supplies in low numbers and can be found in supplies of drinking water (States, et al., 1990). In
aquatic environments, L. pneumophila has a growth range between 20°C and 50°C while having
maximum growth at 30°C to 40°C (Lee and West, 1991).
In addition to the development of microorganisms, temperature also can affect the
efficiency of water treatment, which is critical in a RWH system for potable use (Spellman and
Drinan, 2000). As temperatures decreases, the viscosity of water increases until it reaches 4°C,
which slows the rate of sedimentation and mixing (Viraraghavan and Mathavan, 1988). This
means treatment methods such as coagulation and flocculation would require more chemicals
(Spellman, 2009). On the other extreme, as temperatures increase, the rate at which gases
dissolve decreases. This means that in warm water temperatures, more chlorine would be
required to have a similar treatment impact as cooler water (Spellman, 2009). Before water is
treated in a RWH system, it is usually held in a storage container, where the temperature of water
can be affected by multiple factors.
8
Several factors can affect the water temperature inside a storage container before the
rainwater enters the container and while the rainwater is stored in the container. The factors that
affect the water temperature before the water enters the containers include air temperature and
roof temperature (Spellman and Drinan, 2000). Once in the storage container, these factors
include soil temperature, air temperature, and solar radiation. The impact that solar radiation has
on the water temperature inside a storage container depends on the container material, its
reflectiveness, and external shading. Each of these factors affect heat transfer.
Heat transfer can occur due to conduction, convection, and thermal radiation (Incropera,
et al., 2007). Conduction occurs across a medium through molecular activity and convection
occurs due to a temperature difference and gradient (Incropera, et al., 2007). Though both of
these modes have an effect on the water temperature inside the storage container, the focus of
this research was on thermal radiation, which occurs when energy is transferred by
electromagnetic wave or photons (Incropera, et al., 2007). When radiation comes into contact
with a surface, thermal energy is emitted to the surroundings. The emissive power (E) of a
surface is the rate of energy released by it and is determined by the black body radiation
equation, (Equation 1),
(1)
where ε is a unitless measure of emissivity of the surface, σ is the Stefan-Boltzmann constant
(5.67 × 10⁻⁸
W/m2K
4), and TS is the absolute temperature of the surface (K). The emissivity is the
radiative property of a particular surface and varies from zero to one. Surfaces able to emit
thermal energy most efficiently have a value closer to 0 (Incropera, et al., 2007).
9
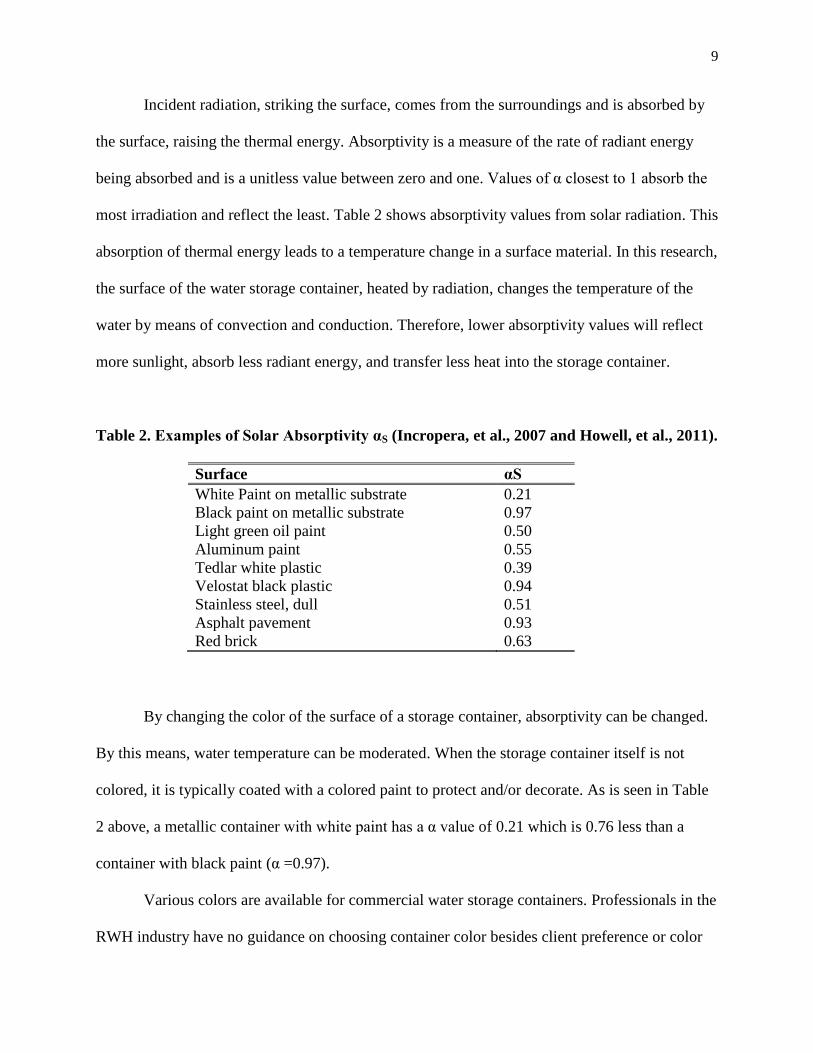
Incident radiation, striking the surface, comes from the surroundings and is absorbed by
the surface, raising the thermal energy. Absorptivity is a measure of the rate of radiant energy
being absorbed and is a unitless value between zero and one. Values of α closest to 1 absorb the
most irradiation and reflect the least. Table 2 shows absorptivity values from solar radiation. This
absorption of thermal energy leads to a temperature change in a surface material. In this research,
the surface of the water storage container, heated by radiation, changes the temperature of the
water by means of convection and conduction. Therefore, lower absorptivity values will reflect
more sunlight, absorb less radiant energy, and transfer less heat into the storage container.
Table 2. Examples of Solar Absorptivity αS (Incropera, et al., 2007 and Howell, et al., 2011).
Surface αS
White Paint on metallic substrate 0.21
Black paint on metallic substrate 0.97
Light green oil paint 0.50
Aluminum paint 0.55
Tedlar white plastic 0.39
Velostat black plastic 0.94
Stainless steel, dull 0.51
Asphalt pavement 0.93
Red brick 0.63
By changing the color of the surface of a storage container, absorptivity can be changed.
By this means, water temperature can be moderated. When the storage container itself is not
colored, it is typically coated with a colored paint to protect and/or decorate. As is seen in Table
2 above, a metallic container with white paint has a α value of 0.21 which is 0.76 less than a
container with black paint (α =0.97).
Various colors are available for commercial water storage containers. Professionals in the
RWH industry have no guidance on choosing container color besides client preference or color
10
availability. Users of RWH systems are concerned about water temperature with their storage
container. However, there are few if any studies on how the color of RWH storage containers
affects the internal water temperature.
In addition to surface color, the shading around a storage container can also have an effect on
water temperature. After a thorough literature review, there are no reported studies on the effects
of shading and water temperature.
11
3. MATERIALS AND METHODS
To achieve the goal of the research, water temperature within the containers were
measured to show how it was impacted by different colored storage containers and various
shading.
3.1 Storage Containers
The RWH storage containers used for the research were 208 L (55 gallon) capacity high
density polyethylene blue plastic containers with sealed lids. They were 89 cm (61 inches) tall
and had a 35 cm (24 in) diameter. There are two threaded openings on the top of each container.
There were 12 storage containers in the experiment that were divided into three groups of
four. Each shade block (full sun (0% shade), 30% shade, and 63% shade) had storage containers
painted with four different colors. These colors were blue, black, green, and white. The colors
represent common colors used in rainwater harvesting systems for storage containers.
Before painting, 1.9 cm (¾ inch) hose bibs were installed at 10 cm (4 inches) from the
bottom on each barrel to allow for easier drainage at the end of the research. They were sealed
with a waterproof marine adhesive caulking to ensure no water leaks. Before painting, the barrel
surfaces were first cleaned with water and paint thinner, which is a solvent cleaner. Each color
(blue, black, green, and white) was spray painted on three entire barrel surfaces. The spray paint
used was Rust-Oleum® Paint for Plastic, a spray paint specifically formulated for plastic.
3.2 Shade Structures
To provide two groups of storage containers with the necessary shading, two shade
structures were constructed next to the Hobgood building (#1508) in Texas A&M campus. The
12
third set of storage containers were kept under full sun and did not have a shade structure. These
structures were constructed with 2.5 cm (1 inch) schedule 40 PVC piping. The straight pieces of
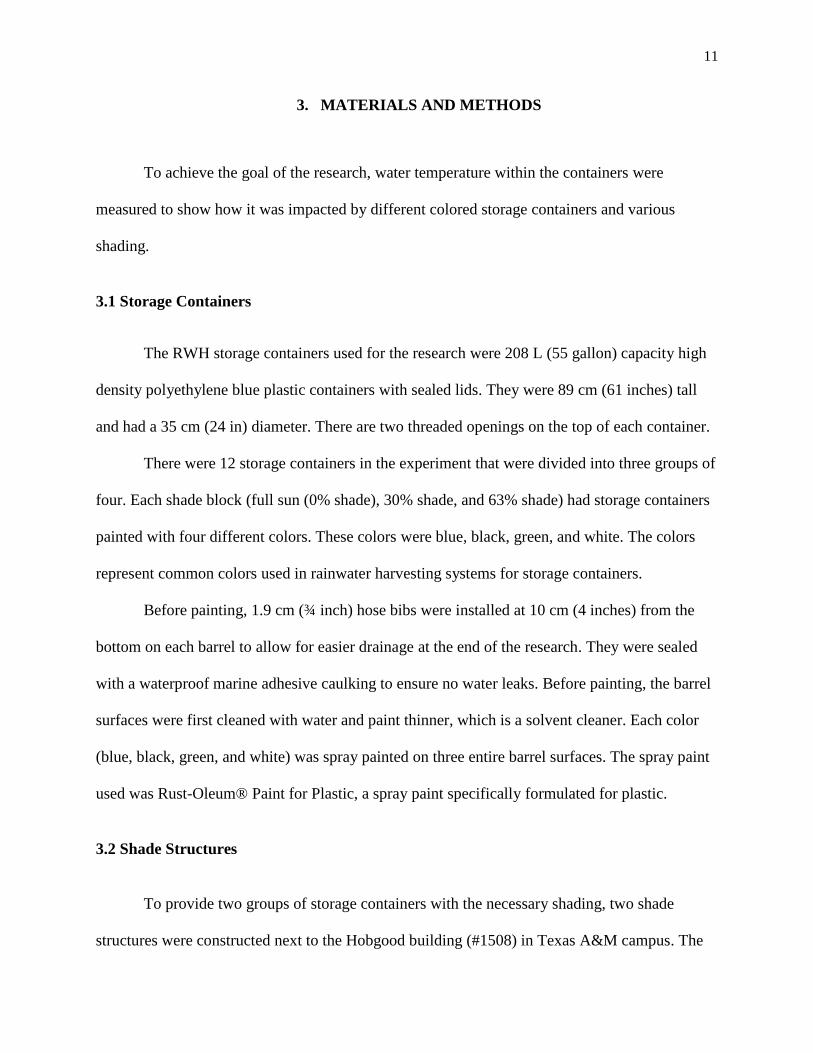
PVC pipes were connected with fittings to create the framed structure (Figure 1). Each
connection between fitting and straight PVC pipe was secured with PVC primer and glue to
ensure stability. The dimensions of both structures are 5.5 m (18 feet, 6 inches) by 1.8 m (6 feet,
4 inches) by 1.5 m (5 feet, 5 inches). Because the shade cloth used in this experiment can impede
air circulation, which may raise air temperature within the structure (Yates, 1989), a 0.35 m (14
inch) gap was made around the top of the structure. In addition, one entire long side of each
structure was left open to allow for air circulation.
Figure 1. Shade structure for one set of storage containers.
To provide the actual shading, woven horticultural shade cloth was used. This shade cloth
was custom ordered to fit the structures. To represent different shading scenarios, two levels of
shade cloth were used. In this research, the two shade cloth values used were 30% and 63%. The
30% shade cloth allows more sunray penetration than the 63% shade cloth. Both shade cloths
13
were wrapped around three sides of their respective structures, with the 35 cm (14 inch) air gap.
A section of cloth was also attached to the top (roof) of the structure. The cloth was attached to
the frame of the structure using plastic wire ties, connected from metal grommets on the shade
cloth to the PVC pipe. The two shade structures were placed in the location of two groups of
storage containers, while the third group remained in full sun.
3.3 Experimental Design
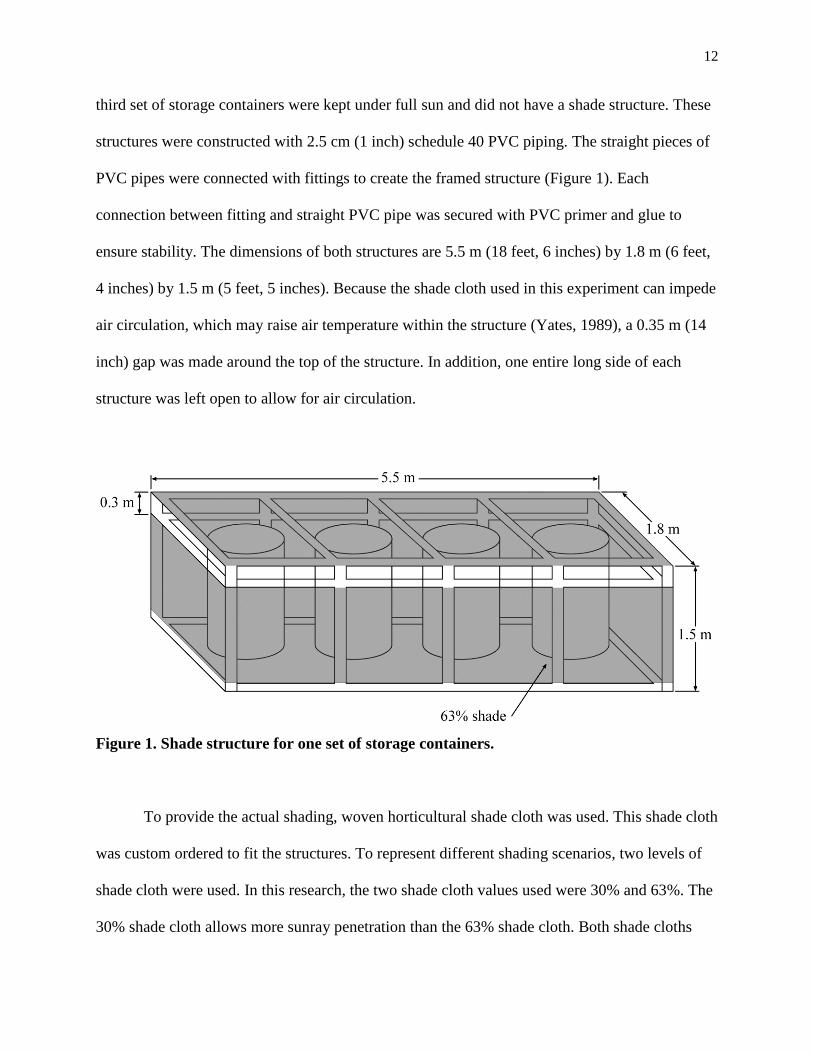
The three groups of storage containers: 0% shade, 30 % shade, and 63% shade were
placed into three blocks. The four colored storage containers were randomly placed in each block
(Figure 2). The two blocks with shading were placed under their respective shade structures,
while the 0% shade block was placed under full sun. Each shade block was spaced 2.4 m (8 feet)
from each other, center to center. Within each block, the storage containers were placed 0.6 m (2
feet) apart. They were all placed directly on the soil surface, standing upright, with all of the hose
bibs facing the same direction. Although the soil surface may have a heating effect on the water,
the containers were all placed on the same surface.
Figure 2. The research setup showing three blocks of shade treatments, each with four
color treatments. The three blocks are (left to right): 0% shade, 30% shade, and 63%
shade.
14
3.4 Instrumentation for Data Collection
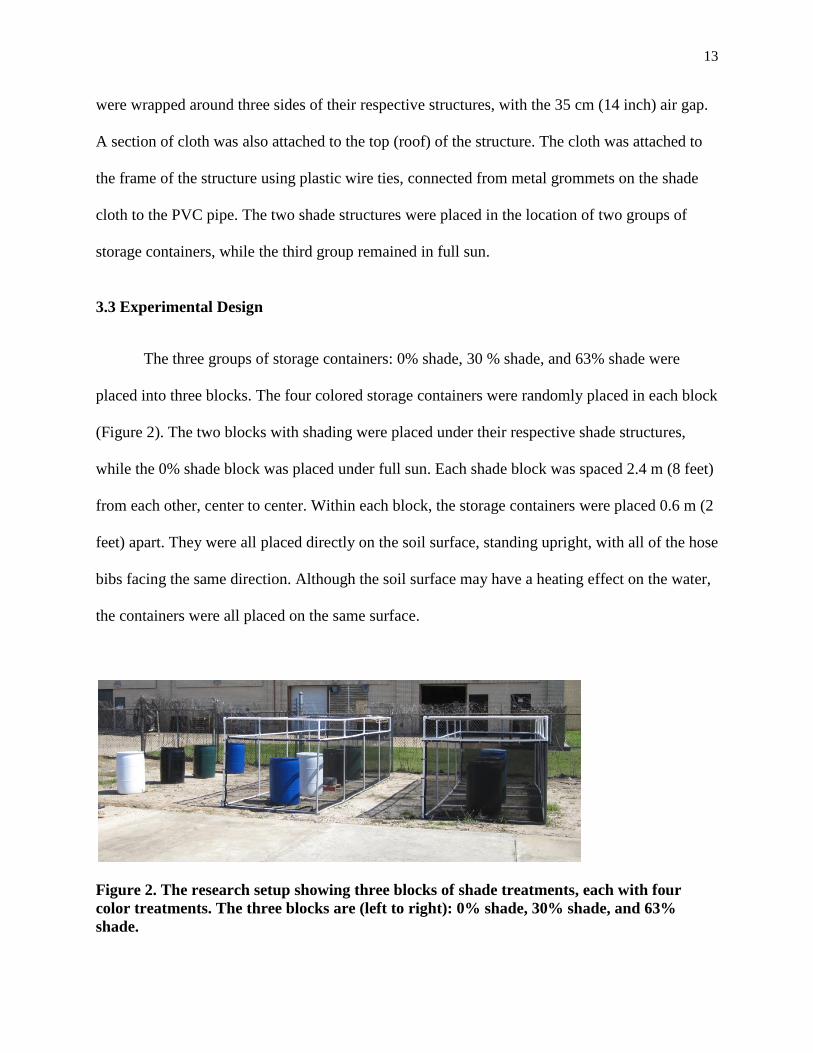
To measure the water temperature inside the barrels, Omega® type T thermocouples
were used. These 30.5 cm (12 inch) long probes were inserted into each storage container. Since
the storage containers had a diameter of 35 cm (24 inches), this allowed the temperature to be
measured from the center of the storage container (Figure 3). Holes were drilled into the side of
the storage containers, 10 cm (4 in.) from the top. Based on results from the preliminary
experiments, it was determined that the top of the container would provide the most solar effect
on water temperature. Once installed, the probes were sealed with marine adhesive to prevent
water from leaking around the probe. Once the sealant was properly cured, each storage
container was filled to the threaded openings with municipal tap water from College Station.
Physical and chemical properties of water are summarized in Table 3.
Figure 3. Placement of the temperature probe in relation to the top of the storage container
(barrel).
15
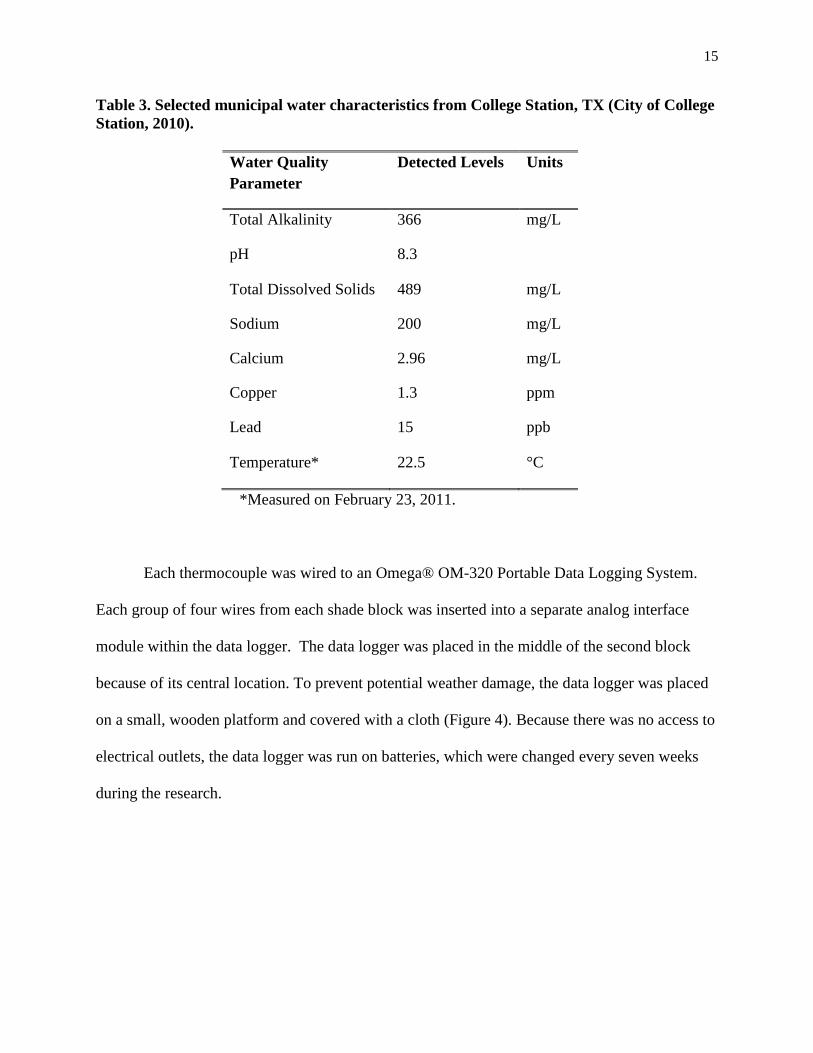
Table 3. Selected municipal water characteristics from College Station, TX (City of College
Station, 2010).
Water Quality
Parameter
Detected Levels Units
Total Alkalinity 366 mg/L
pH 8.3
Total Dissolved Solids 489 mg/L
Sodium 200 mg/L
Calcium 2.96 mg/L
Copper 1.3 ppm
Lead 15 ppb
Temperature* 22.5 °C
*Measured on February 23, 2011.
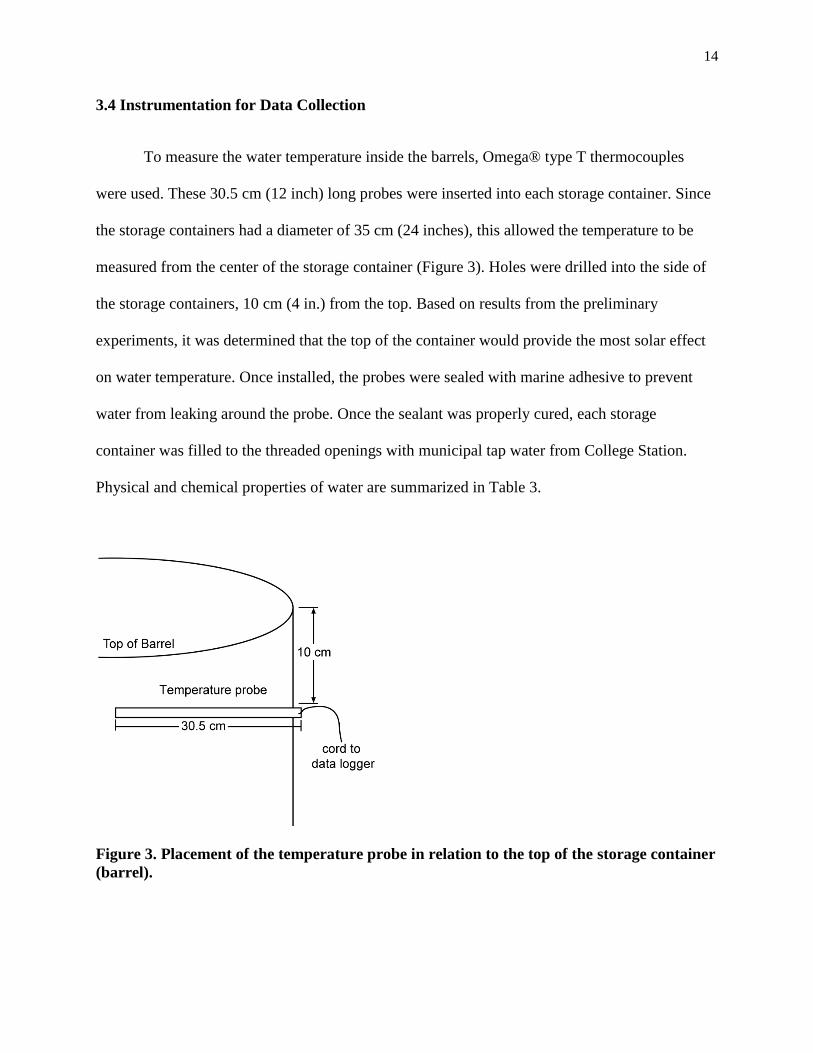
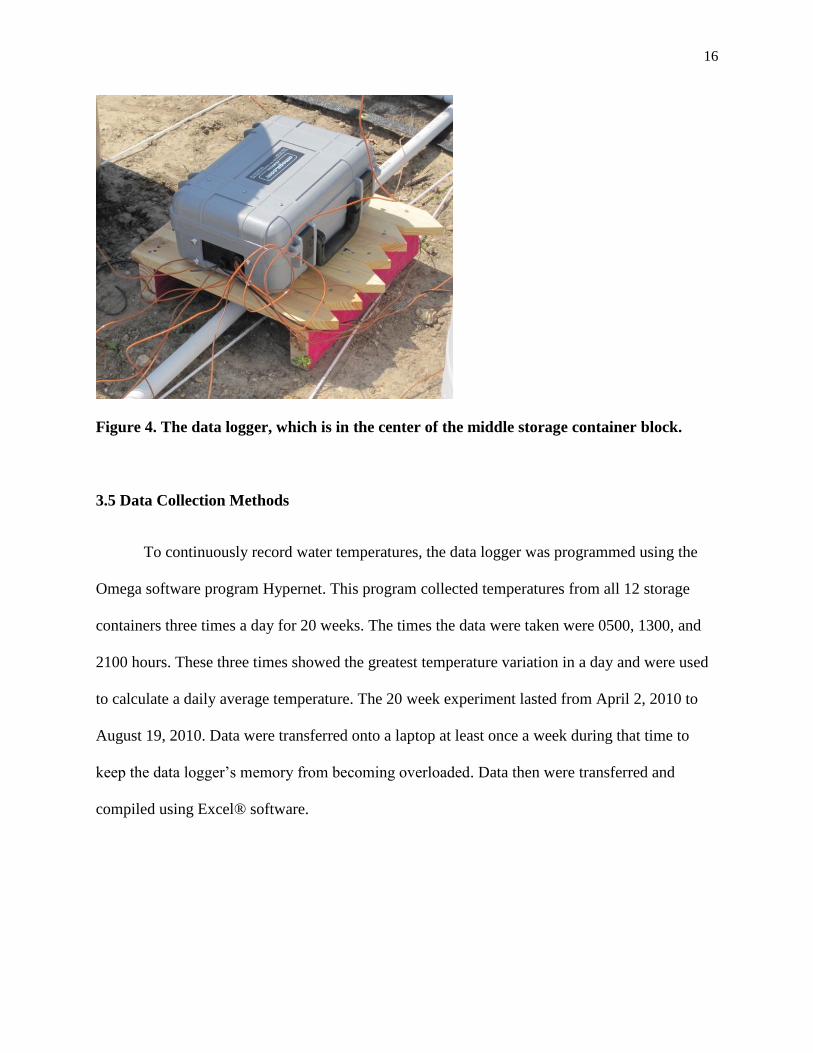
Each thermocouple was wired to an Omega® OM-320 Portable Data Logging System.
Each group of four wires from each shade block was inserted into a separate analog interface
module within the data logger. The data logger was placed in the middle of the second block
because of its central location. To prevent potential weather damage, the data logger was placed
on a small, wooden platform and covered with a cloth (Figure 4). Because there was no access to
electrical outlets, the data logger was run on batteries, which were changed every seven weeks
during the research.
16
Figure 4. The data logger, which is in the center of the middle storage container block.
3.5 Data Collection Methods
To continuously record water temperatures, the data logger was programmed using the
Omega software program Hypernet. This program collected temperatures from all 12 storage
containers three times a day for 20 weeks. The times the data were taken were 0500, 1300, and
2100 hours. These three times showed the greatest temperature variation in a day and were used
to calculate a daily average temperature. The 20 week experiment lasted from April 2, 2010 to
August 19, 2010. Data were transferred onto a laptop at least once a week during that time to
keep the data logger’s memory from becoming overloaded. Data then were transferred and
compiled using Excel® software.
17
3.6 Data Analysis
Before analyzing the effects of individual colors and shades on water temperature, an
analysis of variance (ANOVA) was conducted with the main variables in the research. The
dependent variable in this model was the water temperature and independent variables were
color, shade and week. This analysis calculated whether any one independent variable had a
statistically significant effect on the dependent variable of water temperature. The week variable
was used in the analysis to verify that the time of year had an effect on water temperature. The
“week” variable included the 20 weeks of experiment from April 2 to August 19, 2010.
An ANOVA was then conducted using a partitioned breakdown of variability. This
included the main effects and interactions as individual independent variables. The main effects
were color, shade, and week. This analysis determined which specific main effects had a
statistically significant effect on water temperature. The cross treatments were analyzed to
determine if there was any interaction among variables. The cross treatments performed were
color × week, color × shade, week × shade, and color × week × shade. Having an interaction
among variables indicated that, without having replication in the experiment, the individual main
variables could not be analyzed with statistical significance. This analysis produced degrees of
freedom, the sum of squares, the mean square, the F ratio, and the p-value.
To analyze the individual color and shade treatments’ effects on water temperature, the
means were compared using their differences. To analyze color treatments, the data from each
shade block were separated from the other blocks. The average values of the four color
treatments in each shade block were then compared, using their differences. This included every
combination of differences. For four color treatments, this resulted to six combinations of
differences. This was done in the 0% shade, 30% shade, and 63% shade blocks.
18
To analyze the shade treatments, the data from each color treatment were separated from
the other color treatments. The average values of the three shade treatments in each color group
were then compared, using their differences. This included every combination of differences. For
the three shade treatments, this resulted to three combinations of differences. This was done for
following color groups: blue, black, green, and white.
Next, the color and shade treatments were combined and all 12 treatments were
compared. This showed the interaction effect of the treatments on the water temperature. The
average values of the 12 treatments were compared, using their differences. This involved
comparing all of the combinations of differences, which were unordered, without replacement.
This analysis resulted in 66 combinations.
19
4. RESULTS AND DISCUSSION
4.1 Preliminary Experiment Results
A preliminary experiment was set up for two purposes: to determine the intensity of the
temperature gradient within a storage container; and determine if shading has an impact on water
temperature. Calculating the temperature gradient helped determine where there was the most
effect from the sun. This location would be used in the primary research to measure temperature.
Determining shading’s impact on water temperature meant that it could be used as a treatment in
further experiments.
The results from the preliminary experiment showed that the top of the storage container
had the most effect from solar radiation. This would be the location used for the temperature
probe. Also, because there were clear differences in temperatures between the shade treatments,
the main experiment included the three levels of shading.
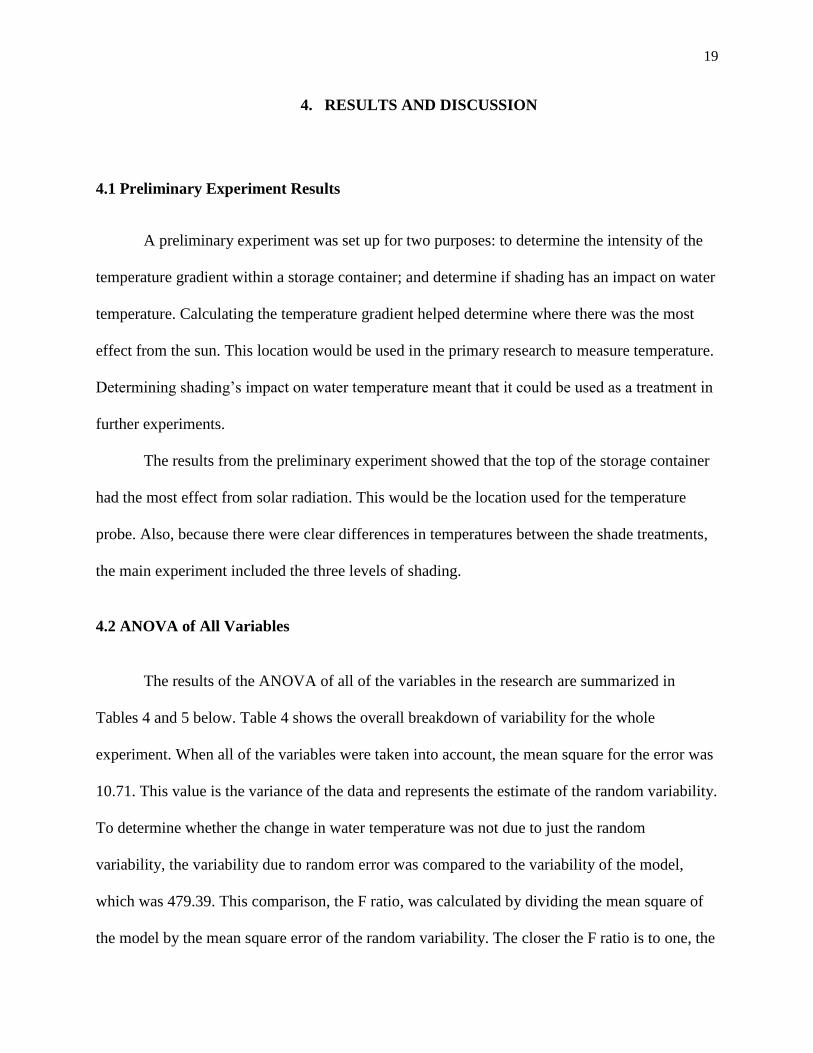
4.2 ANOVA of All Variables
The results of the ANOVA of all of the variables in the research are summarized in
Tables 4 and 5 below. Table 4 shows the overall breakdown of variability for the whole
experiment. When all of the variables were taken into account, the mean square for the error was
10.71. This value is the variance of the data and represents the estimate of the random variability.
To determine whether the change in water temperature was not due to just the random
variability, the variability due to random error was compared to the variability of the model,
which was 479.39. This comparison, the F ratio, was calculated by dividing the mean square of
the model by the mean square error of the random variability. The closer the F ratio is to one, the
20
greater the effect of random variability had on the dependent variables. In this research, the F
ratio was 44.76. To make sure that this value is not statistically close to one, it was looked up in
an F table, which lists p-values. The p-value (labeled as “Prob >F” in Tables) value is the
probability that the effects on the dependent variable were due to random variability. Because
this p-value was nearly zero, at least one treatment variable had an effect on water temperature.
Table 4. Overall breakdown of variability, experiment-wide of the main variables.
Source DF Sum of Squares Mean Square F Ratio
Model 239 114567.33 479.36 44.76
Error 4800 51401.65 10.71 Prob > F
C. Total 5039 165968.99 0.0000
Table 5. Partitioned breakdown of variability of individual variables.
Source DF Sum of Squares Mean Square F Ratio Prob > F
Color 3 8779.94 2926.65 273.30 <0.0001
Shade 2 4813.26 2406.63 224.74 <0.0001
Week 19 100248.00 5276.21 492.70 0.0000
Color×Week 57 181.66 3.19 0.30 1.0000
Color×Shade 6 450.95 75.16 7.02 <0.0001
Color×Shade×Week 114 51.81 0.45 0.04 1.0000
Week×Shade 38 41.72 1.10 0.10 1.0000
The partitioned breakdown of variability is shown above in Table 5.The interactions of
treatments that did not have a significant impact on water temperature were color × week, week
× shade, and week × shade × color. Each of these interactions had a p-value of 1. Because these
interactions did not have a significant effect on temperature, they did not need to be analyzed.
In this partitioned ANOVA, the color, shade, and week variables each had a significant effect on
water temperature with p-values of 0.0001, 0.0001, and 0, respectively. There was also a
21
significant effect on the water temperature by the interaction of color × shade, with a p-value of
0.0001.
In this experiment, there was only one block of each shade treatment. Because the storage
containers used were large and expensive, replication of those blocks could not be achieved.
Because of this, any statistically significant cross treatment would prevent the main effects from
being analyzed statistically. In this ANOVA, the color and shade interaction had a statistically
significant effect on temperature. The color and shade variables interacted and varied together to
affect water temperature. However , even though the color and shade treatment variables could
not be statistically analyzed, they were analyzed for trends in this research. In future research,
replication may be done to this experiment in order to be able to statistically analyze each
independent variable.
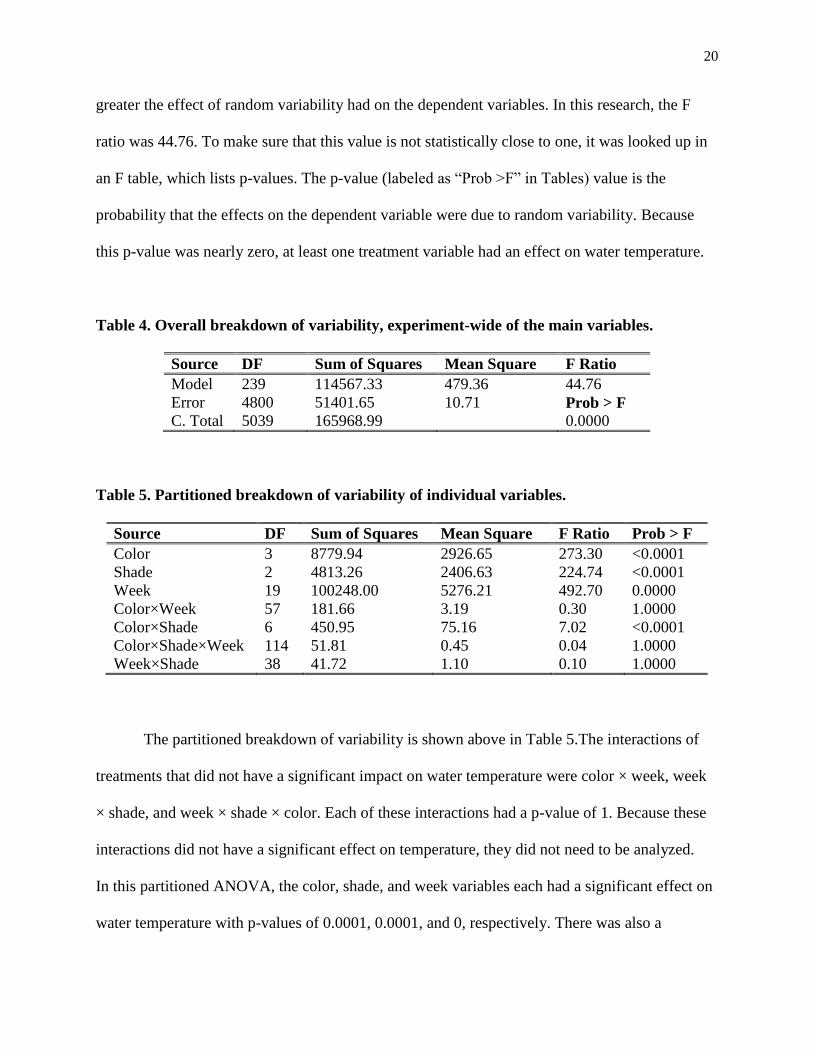
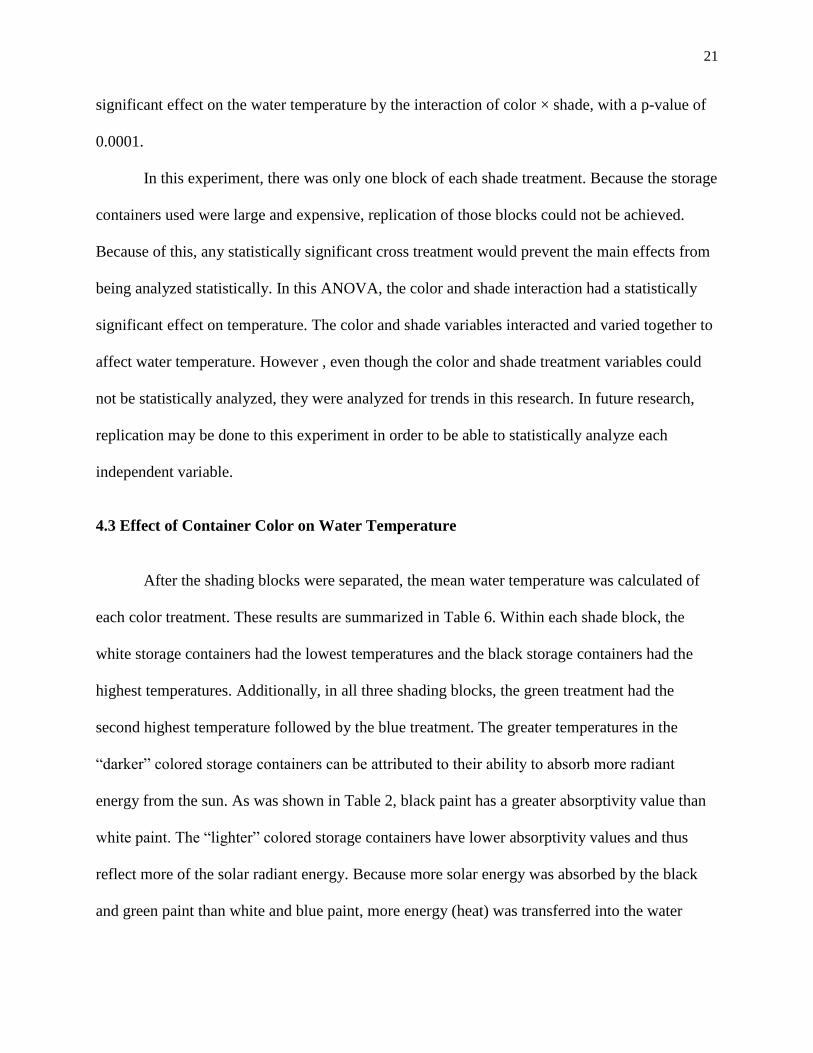
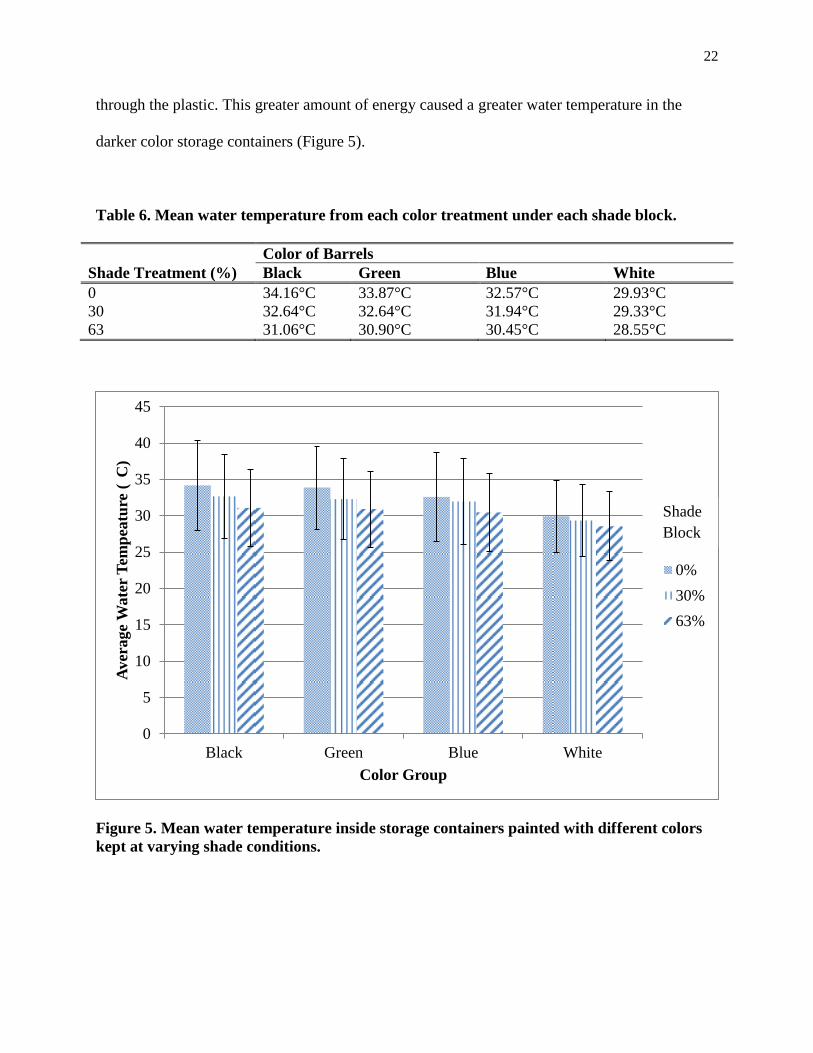
4.3 Effect of Container Color on Water Temperature
After the shading blocks were separated, the mean water temperature was calculated of
each color treatment. These results are summarized in Table 6. Within each shade block, the
white storage containers had the lowest temperatures and the black storage containers had the
highest temperatures. Additionally, in all three shading blocks, the green treatment had the
second highest temperature followed by the blue treatment. The greater temperatures in the
“darker” colored storage containers can be attributed to their ability to absorb more radiant
energy from the sun. As was shown in Table 2, black paint has a greater absorptivity value than
white paint. The “lighter” colored storage containers have lower absorptivity values and thus
reflect more of the solar radiant energy. Because more solar energy was absorbed by the black
and green paint than white and blue paint, more energy (heat) was transferred into the water
22
through the plastic. This greater amount of energy caused a greater water temperature in the
darker color storage containers (Figure 5).
Table 6. Mean water temperature from each color treatment under each shade block.
Color of Barrels
Shade Treatment (%) Black Green Blue White
0 34.16°C 33.87°C 32.57°C 29.93°C
30 32.64°C 32.64°C 31.94°C 29.33°C
63 31.06°C 30.90°C 30.45°C 28.55°C
Figure 5. Mean water temperature inside storage containers painted with different colors
kept at varying shade conditions.
0
5
10
15
20
25
30
35
40
45
Black Green Blue White
Aver
age
Wate
r T
emp
eatu
re (
C
)
Color Group
0%
30%
63%
Shade
Block
23
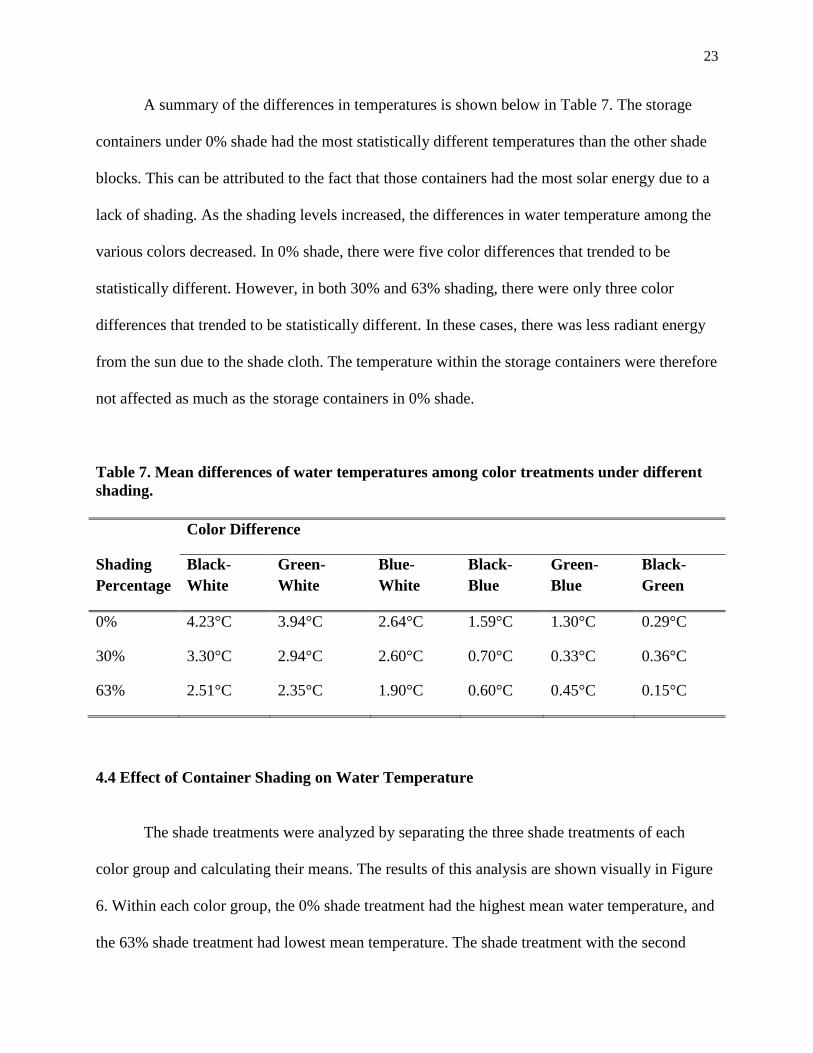
A summary of the differences in temperatures is shown below in Table 7. The storage
containers under 0% shade had the most statistically different temperatures than the other shade
blocks. This can be attributed to the fact that those containers had the most solar energy due to a
lack of shading. As the shading levels increased, the differences in water temperature among the
various colors decreased. In 0% shade, there were five color differences that trended to be
statistically different. However, in both 30% and 63% shading, there were only three color
differences that trended to be statistically different. In these cases, there was less radiant energy
from the sun due to the shade cloth. The temperature within the storage containers were therefore
not affected as much as the storage containers in 0% shade.
Table 7. Mean differences of water temperatures among color treatments under different
shading.
Color Difference
Shading
Percentage
Black-
White
Green-
White
Blue-
White
Black-
Blue
Green-
Blue
Black-
Green
0% 4.23°C 3.94°C 2.64°C 1.59°C 1.30°C 0.29°C
30% 3.30°C 2.94°C 2.60°C 0.70°C 0.33°C 0.36°C
63% 2.51°C 2.35°C 1.90°C 0.60°C 0.45°C 0.15°C
4.4 Effect of Container Shading on Water Temperature
The shade treatments were analyzed by separating the three shade treatments of each
color group and calculating their means. The results of this analysis are shown visually in Figure
6. Within each color group, the 0% shade treatment had the highest mean water temperature, and
the 63% shade treatment had lowest mean temperature. The shade treatment with the second
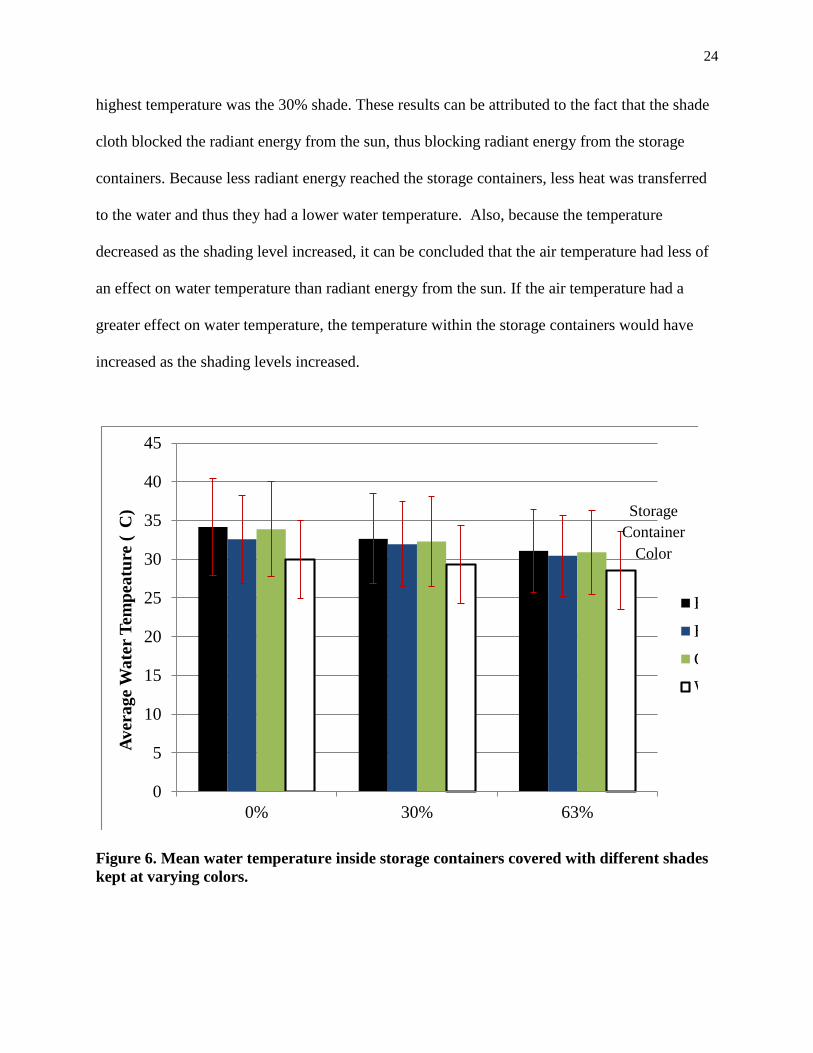
24
highest temperature was the 30% shade. These results can be attributed to the fact that the shade
cloth blocked the radiant energy from the sun, thus blocking radiant energy from the storage
containers. Because less radiant energy reached the storage containers, less heat was transferred
to the water and thus they had a lower water temperature. Also, because the temperature
decreased as the shading level increased, it can be concluded that the air temperature had less of
an effect on water temperature than radiant energy from the sun. If the air temperature had a
greater effect on water temperature, the temperature within the storage containers would have
increased as the shading levels increased.
0
5
10
15
20
25
30
35
40
45
0% 30% 63%
Aver
age
Wate
r T
emp
eatu
re (
C
)
Shade Treatment
Black
Blue
Green
White
Figure 6. Mean water temperature inside storage containers covered with different shades
kept at varying colors.
Storage
Container
Color
25
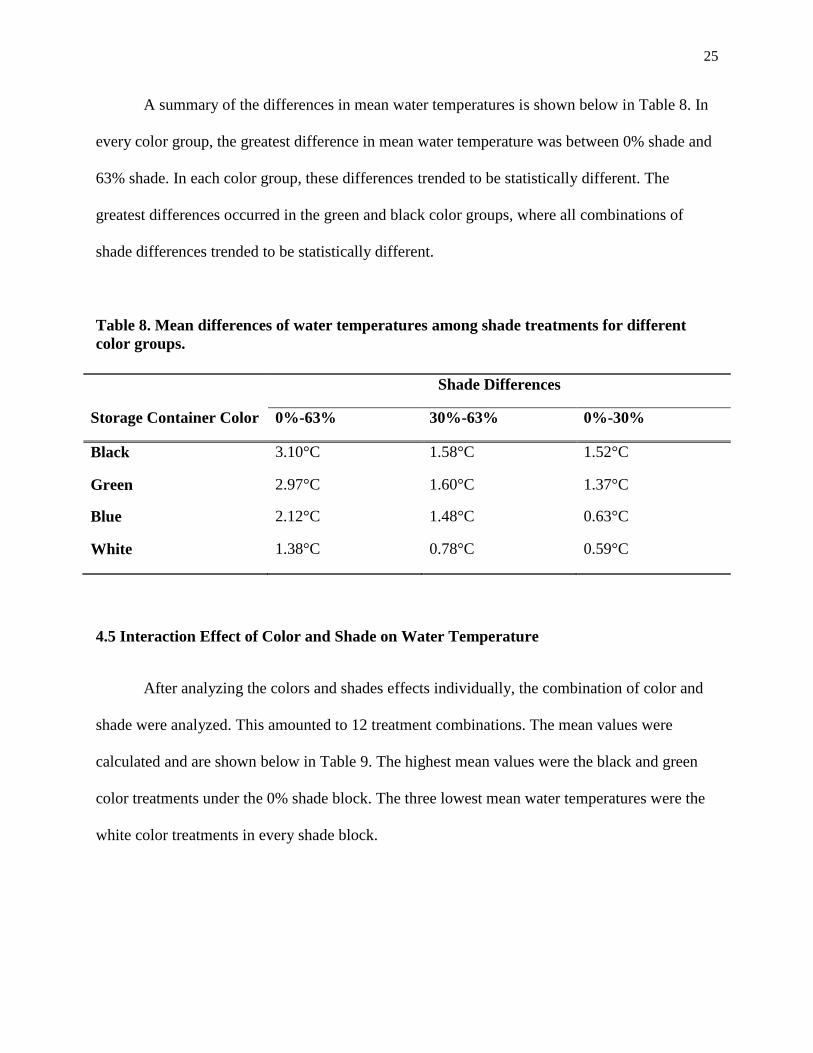
A summary of the differences in mean water temperatures is shown below in Table 8. In
every color group, the greatest difference in mean water temperature was between 0% shade and
63% shade. In each color group, these differences trended to be statistically different. The
greatest differences occurred in the green and black color groups, where all combinations of
shade differences trended to be statistically different.
Table 8. Mean differences of water temperatures among shade treatments for different
color groups.
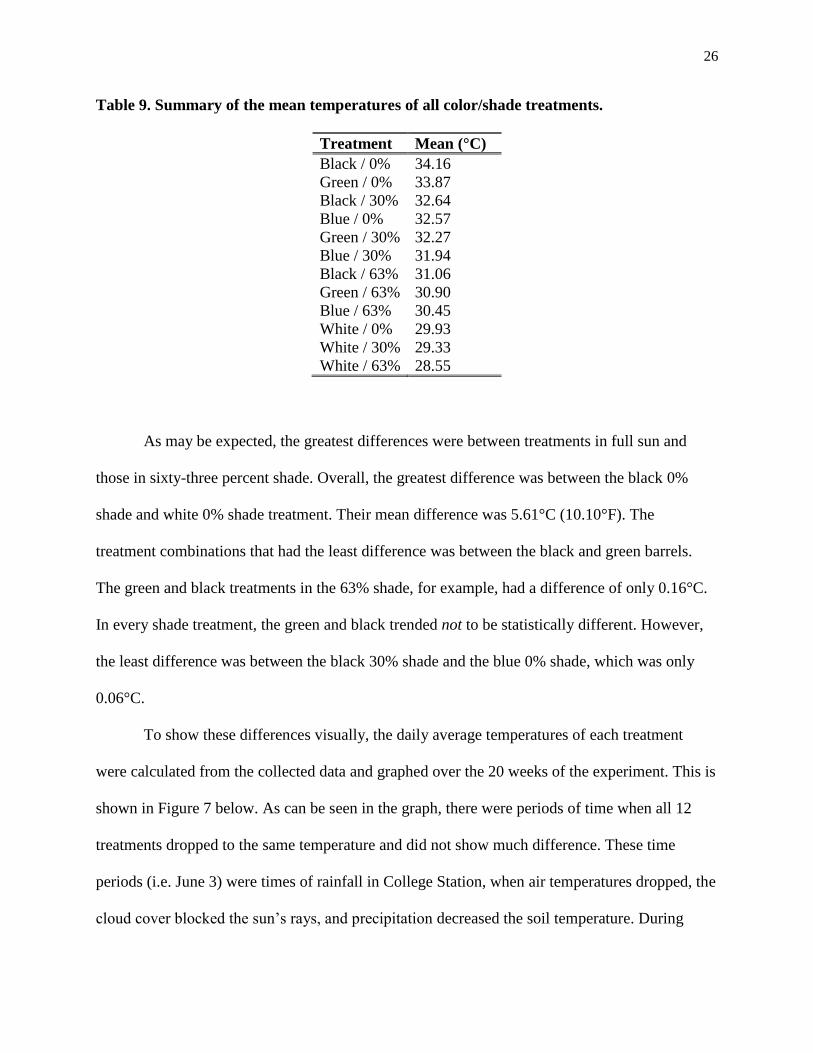
4.5 Interaction Effect of Color and Shade on Water Temperature
After analyzing the colors and shades effects individually, the combination of color and
shade were analyzed. This amounted to 12 treatment combinations. The mean values were
calculated and are shown below in Table 9. The highest mean values were the black and green
color treatments under the 0% shade block. The three lowest mean water temperatures were the
white color treatments in every shade block.
Shade Differences
Storage Container Color 0%-63% 30%-63% 0%-30%
Black 3.10°C 1.58°C 1.52°C
Green 2.97°C 1.60°C 1.37°C
Blue 2.12°C 1.48°C 0.63°C
White 1.38°C 0.78°C 0.59°C
26
Table 9. Summary of the mean temperatures of all color/shade treatments.
Treatment Mean (°C)
Black / 0% 34.16
Green / 0% 33.87
Black / 30% 32.64
Blue / 0% 32.57
Green / 30% 32.27
Blue / 30% 31.94
Black / 63% 31.06
Green / 63% 30.90
Blue / 63% 30.45
White / 0% 29.93
White / 30% 29.33
White / 63% 28.55
As may be expected, the greatest differences were between treatments in full sun and
those in sixty-three percent shade. Overall, the greatest difference was between the black 0%
shade and white 0% shade treatment. Their mean difference was 5.61°C (10.10°F). The
treatment combinations that had the least difference was between the black and green barrels.
The green and black treatments in the 63% shade, for example, had a difference of only 0.16°C.
In every shade treatment, the green and black trended not to be statistically different. However,
the least difference was between the black 30% shade and the blue 0% shade, which was only
0.06°C.
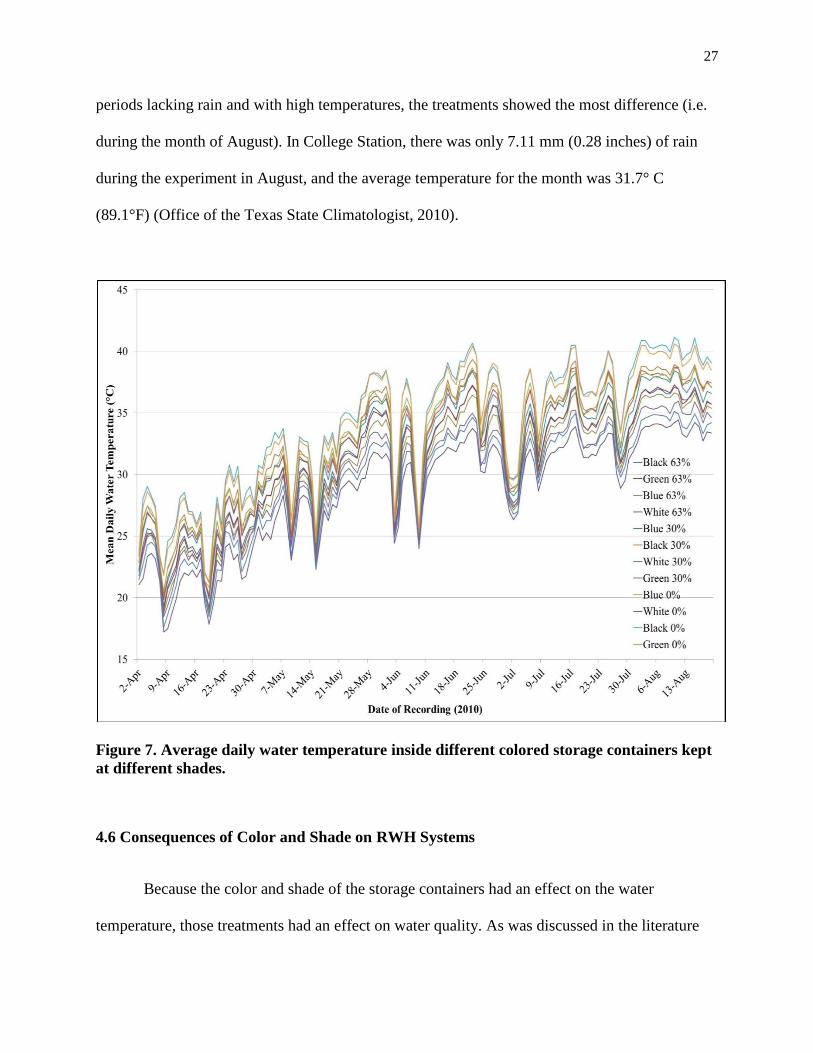
To show these differences visually, the daily average temperatures of each treatment
were calculated from the collected data and graphed over the 20 weeks of the experiment. This is
shown in Figure 7 below. As can be seen in the graph, there were periods of time when all 12
treatments dropped to the same temperature and did not show much difference. These time
periods (i.e. June 3) were times of rainfall in College Station, when air temperatures dropped, the
cloud cover blocked the sun’s rays, and precipitation decreased the soil temperature. During
27
periods lacking rain and with high temperatures, the treatments showed the most difference (i.e.
during the month of August). In College Station, there was only 7.11 mm (0.28 inches) of rain
during the experiment in August, and the average temperature for the month was 31.7° C
(89.1°F) (Office of the Texas State Climatologist, 2010).
Figure 7. Average daily water temperature inside different colored storage containers kept
at different shades.
4.6 Consequences of Color and Shade on RWH Systems
Because the color and shade of the storage containers had an effect on the water
temperature, those treatments had an effect on water quality. As was discussed in the literature
28
review, the desired “quality” of water depends on its intended use. For example, it may be
permissible to use water with some bacteria in it for irrigation. However, for drinking water, it is
recommended that there be no bacteria (TWDB, 2006). It is evident that growth of different
bacteria varies with different temperatures. So, a RWH installer should focus on water
disinfection treatment options. If the installer can choose an efficient water treatment at a given
temperature range, then he or she can easily disinfect water suitable for drinking.
Efficiency of water disinfection methods such as chlorination and UV treatment can be
affected by water tempeatures. Chlorination uses chlorine to kill microorganisms and can be used
in a dry, liquid, or gas form (Mechell, et al., 2010). When used in the gas state, chlorine, like
other gases, becomes less soluble in water as the temperature increases. According to Whitney
and Vivian (1941), the solubility of chlorine decreases by 13-14% for every 5°C increase in
water temperature. In higher water temperatures, more chlorine gas would be needed for
treatment than in cooler water. In this research, the greatest average water temperature difference
was 5.61°C (white / 67% shade and black / 0% shade). Therefore, having a lighter colored
storage container or high level of shading in a RWH system would keep water temperatures
lower and consequently reduce the amount of chlorine needed for treatment.
In the 0% shade block, the difference between the black and white color treatments was
4.23°C. For RWH installers looking for the coolest water temperature in hot summer months,
storage containers with a white colored coating, regardless of shade, would be ideal. An installer
and/or owner of the system must keep in mind that this research was done on opaque storage
containers with a paint coating. Storage containers that are made up of a white plastic may not be
opaque and could let sunlight in, potentially causing water quality issues.
29
Although the differences in water temperatures between shade blocks were not as
dramatic as between color treatments, the differences are still important for the rainwater
harvesting industry. The difference in temperatures between the 63% shade and 0% shade of the
black storage containers was 3.10°C. When shade is available, someone installing a RWH
system should utilize it to decrease summertime water temperatures. In this research horticultural
shade cloth was used to provide shade. But, due to economics and aesthetics, most RWH systems
would most likely utilize shading from a building or natural shading from vegetation. While
vegetative cover may be good for lowering water temperature, care should be taken to prevent
other contamination from dry leaves, debris, and bird droppings, which would ultimately affect
water quality.
30
5. CONCLUSIONS AND FUTURE RESEARCH
The overall goal of this research was to determine the effect of the color of a water
storage container and its shading on the temperature of the water inside the storage container.
Although there was an interaction between the shade and color, the results were still analyzed to
identify trends in the data and be able to provide useful information to the rainwater harvesting
industry.
While analyzing the results between the color and shade treatments, the color had the
more significant effect on water temperature. As it was hypothesized, the lighter color storage
containers had the lowest average water temperatures during the summer months. Storage
containers painted with white color had the lowest water temperatures and those with black color
painted had the highest. Overall, the trend was that in every shade block the containers with
painted white color had water temperatures lower than the containers painted with other colors.
In real world applications, there are always interactions between storage container color
and shading; so, analyzing the interaction of the two variables was important. In this research,
there was a statistically significant interaction between the color and shade variables. Both varied
together to have an effect on water temperature. As may have been expected, the interactions of
darker colored containers kept at less shading had increased water temperatures. Lighter colored
treatments kept at more shade had the lowest water temperatures. So, RWH installers requiring
the lowest water temperatures should utilize lighter colored storage containers with some
shading. One interesting observation from the research was that the white storage container in
the 0% shade still had a lower water temperature than the black storage container in 63% shade.
This highlights the importance of color over shading. A RWH system would have the lowest
water temperatures if the storage container was painted white, regardless of shading. Most of the
31
commercial water storage containers are opaque black. The most economical and viable option
to lower the water temperature in those storage containers would be coating them with the white
paint rather than keeping them under shade.
In future research, the experiments could be designed to have replication, so that the
shade and color treatments could be analyzed statistically, even with their interaction. Instead of
having three shade blocks with four color treatments in each, the experimental design could have
nine shade blocks. Here shade percentage would have three blocks to create replication. Each
block would still have four color treatments.
In this research, the lowest water temperature in hot, summer months is considered
“ideal.” This research was done in the spring and summer months of April through August, and it
was anticipated that the storage containers would have cooler water when the effects of the
radiant energy were less. In the winter months, results of the research may be different. Further
research should be conducted to determine the effect of radiant energy on storage container water
temperature in the winter months.
In the future, additional colors should be analyzed to determine their effect on water
storage temperature. Also, this research was done using a paint coating for surface color. In the
future, containers with a colored material (i.e. plastic) should be analyzed to determine if the
actual material’s color creates more of an effect than its coating. In addition to storage container
color, other material, such as metal, and coverings, such as wooden panels, should be used to
determine their effect on water temperature.
32
REFERENCES
City of College Station. 2010. Water Quality Report 2009 Calendar Year. Available at
http://www.cstx.gov/index.aspx?page=822. Accessed 2 April 2011.
Food and Agriculture Organization (FAO). 2010. Hot Issues: Water Scarcity. FAO Water Unit.
Available at http://www.fao.org/nr/water/issues/scarcity.html. Accessed 9 June 2010.
Foraste, J. A., and Hirschman, D. 2010. A methodology for using rainwater harvesting as a
stormwater management BMP. Low Impact Development 2010: Redefining Water in the
City. San Fransico: ASCE. pp. 31-44.
Gould, J., and Nissen-Petersen, E. 1999. Rainwater Catchment Systems for Domestic Rain:
Design Construction and Implementation. London: Intermediate Technology Publications.
Grayman, W. M., and Kirmeyer, G. J. 2000. Quality of Water in Storage. In Water Distribution
Systems Handbook, ed. L. W. Mays. New York: McGraw-Hill.
Grayman, W. M., Rossma, L. A., Deininger, R. A., Smith, C. D., Arnold, C. N., and Smith, J. F.
2004. Mixing and aging of water in distribution storage facilities. American Water Works
Association Journal 96(9): 70-79.
Hibler, C. P., & Hancock, C. M. 1990. Waterborne Giardiasis. In Drinking Water Mircobiology,
ed. G. A. McFeters. New York: Springer-Verlag.
Howell, J.R., Siegel, R., and Menguc, M. P. 2011. Thermal Radiation Heat Transfer, Fifth
Edition. Boca Raton, FL: CRC Press.
Incropera, F. P., Dewitt, D. P., Bergman, T. L., and Lavine, A. S. 2007. Introduction to Heat
Transfer. Hoboken, NJ: John Wiley & Sons.
33
International Water Management Insititute. 2007. Water for Food, Water for Life: A
Comprehensive Assessment of Water Management in Agriculture. London: Earthscan, and
Colombo: International Water Management Institute.
King, B. J., Keegan, A. R., Monis, P. T., and Saint, C. P. 2005. Environmental temperature
controls Cryptosporidium oocyst metaboic rate and associated retention of infectivity.
Applied and Environment Microbiology 71(7): 3848-3857.
Leclerc, H., Schwartzbrod, L., and Dei-Cas, E. 2004. Microbial agents associated with
waterborne disease. In Microbial Waterborne Pathogens, eds. T. E. Cloete, J. Rose, L. H.
Nel, & T. Ford. London: IWA Publishing.
Lee, J. V., and West, A. A. 1991. Survival and growth of Legionella species in the environment.
Journal of Applied Bacteriology 20: 121S-129S.
Lye, D. 1992. Microbiology of rainwater catchment cistern systems: a review. Journal of
Environmental Science and Health A27(8): 2123-2166.
Mauser, W. 2009. Water Resources: Efficient, Sustainable and Equitable Use. London: Haus
Publishing Ltd.
Mechell, J., Kniffen, B., Lesikar, B., Kingman, D., Jaber, F., Alexander, R., and and Clayton, B.
2010. Rainwater Harvesting: System Planning. Publication B-6240. College Station, TX:
Texas AgriLife Extension Service.
Muder, R. R., and Yu, V. L. 2002. Infection due to Legionella species other than L.
pneumophila. Clinical Infectious Diseases 35(8): 990-998.
Nagarajan, R. 2006. Water: Conservation, Use and Management for Semi-Arid Region. New
Delhi: Capital Publishing Company.
34
Office of the Texas State Climatologist. 2010. College Station Monthly Summaries. Department
of Atmospheric Sciences, Texas A&M University. Available at http://atmo.tamu.edu/osc/cll/.
Accessed 20 March 2011.
Spellman, F. R. 2009. Handbook of Water and Wastewater Treatment Plant Operations. Boca
Raton, FL: CRC Press.
Spellman, F. R., and Drinan, J. 2000. The Drinking Water Handbook. Lancaster, PA: Technomic
Publishing Co., Inc.
States, S. J., Wadowsky, R. M., Kuchta, J. M., Wolford, R. S., Conely, L. F., and Yee, R. B.
1990. Legionella in drinking water. In Drinking Water Microbiology, ed. G. McFeters. New
York: Springer-Verlag.
Texas Commission on Environmental Quality. 2007. Harvesting, Storing, and Treating
Rainwater for Domestic Indoor Use . Austin, TX: TCEQ.
Texas Water Development Board (TWDB). 2006. Rainwater Harvesting Potential and
Guidelines for Texas. Austin: Texas Water Development Board.
Texas Water Development Board (TWDB). 2007. Water for Texas 2007, Volume 1. Austin:
Texas Water Development Board.
Thomas, C., Hill, D. J., and Mabey, M. 1999. Evaluation of the effect of temperature and
nutrients on the survival on Campylobacter spp. in water microcosms. Journal of Applied
Microbiology 86(6): 1024-1032.
United Nations. 2007. World Population Prospects: 2006 Revision. New York: Population
Division, Department of Economic and Social Affairs, United Nations.
United States Geological Survey (USGS). 2001. A Primer on Water Quality. Publication FS-
027-01 . U.S. Department of the Interior.
35
Viraraghavan, T., and Mathavan, G. N. 1988. Effects of low temperature on physicochemical
processes in water quality control. Journal of Cold Regions Engineering 2(3): 101-110.
Whitney, R. and Vivian, J. E. 1941. Solubility of chlorine in water. Industrial and Engineering
Chemistry 33(6): 741–744.
World Water Assessment Programme. 2009. The United Water Development Report 3: Water in
a Changing World. Paris: UNESCO.
Yates, D. 1989. Shade factors of a range of shadecloth materials. Acta Horticulturae 257: 201-
217.
36
VITA
Name: James Brent Clayton
Address: Dept. of Biological and Agricultural Engineering
MS 2117 TAMU
College Station, TX, 77843
Email Address: [email protected]
Education: B.S., Horticulture, Virginia Tech, 2007
M.S., Water Management and Hydrological Science, Texas A&M University,
2011
Experience: Texas AgriLife Extension Service July 2009-Present
Extension Assistant
Evaluate various innovative and alternative rainwater harvesting
systems through literature review and demonstration in the field.
Develop and deliver educational material addressing stormwater
management, rainwater harvesting, and implementation of watershed
management plans. Program delivery includes conducting
presentations at local county meetings, field days, and regional, state,
and national conferences.
Perform activities related to literature searches and development of
equipment drawings for use in printed materials and prepare written
reports.
Design and conduct research on issues related to rainwater harvesting.
Virginia Cooperative Extension April 2008-July 2009
Extension Agent
Served as the only extension agent with a specialty of horticulture in
the seven-county region
Provided current, research-based information to citizens when needed
Determined community needs and designed, implemented, and
evaluated programs to address those needs
Created lawn maintenance programs
Assisted in “Rainbarrel Workshops” with the Clean Virginia
Waterways of Longwood University and farm tours that demonstrated
best management practices (BMPs) to reduce non-point source
pollution.