Embed Size (px)
Citation preview
University of Naples Federico II
Faculty of Agriculture
Joint international Ph.D. Italy - Chile in
Environmental Resources Sciences
XXIII Cycle (2007-2010)
Effects of sustanaible soil management
on soil quality
Ph.D. Dissertation
by Riccardo Scotti
TUTOR:
Prof. Maria A. Rao
COORDINATOR:
Prof. Maria A. Rao


“Ci sono soltanto due possibili conclusioni:
Se il risultato conferma le ipotesi, allora hai appena fatto una misura.
Se il risultato è contrario alle ipotesi, allora hai fatto una scoperta”
Enrico Fermi
“There is still a difference between something and nothing,
but it is purely geometrical and there is nothing behind the geometry”
Martin Gardner
All‟unica persona che attraverso il suo impegno
ed il suo lavoro ha reso possibile tutto questo.

INDEX
Chapter 1 Introduction .................................................................................. 1
1.1 Agricultural soil managements ............................................................................... 2
1.1.1 Intensive agriculture....................................................................................... 2 1.1.2 Sustainable agriculture ................................................................................... 6
1.1.2.1 Selection of site, species and variety ........................................................ 7 1.1.2.2 Diversity ................................................................................................... 8 1.1.2.3 Efficient use of inputs ............................................................................... 9
1.1.2.4 Practices of soil management ................................................................ 10
1.2 Compost ................................................................................................................ 11 1.2.1 Effects of compost on soil............................................................................ 12 1.2.2 Compost as amendment ............................................................................... 15
1.3 Soil quality ............................................................................................................ 17
1.4 Soil quality indicators ........................................................................................... 19 1.4.1 Soil physical and chemical properties.......................................................... 22 1.4.2 Soil biological and biochemical properties .................................................. 23
1.4.3 Soil quality indexes ...................................................................................... 23
1.5 Soil organic matter ................................................................................................ 26
1.6 Soil enzymes ......................................................................................................... 30 1.6.1 Functions carried out by soil enzymes ......................................................... 33
1.6.2 Factors affecting enzyme activities in soil ................................................... 35 1.6.2.1 Natural factors ....................................................................................... 35
1.6.2.2 Anthropic factors .................................................................................... 39
1.6.3 Enzymatic activities as bioindicators ........................................................... 45
1.7 References ............................................................................................................. 48
Chapter 2 Aim .............................................................................................. 69
Chapter 3 Assessing soil quality of intensive farms in
an important agriculture region of Southern Italy................ 71
3.1. Introduction ........................................................................................................... 71
3.2 Materials and Methods .......................................................................................... 74 3.2.1 Study site description and selection of farms .............................................. 74 3.2.2 Soil history assessment ................................................................................ 75
3.2.3 Soil sampling and analyses .......................................................................... 76
3.2.4 Physical and chemical analyses ................................................................... 76 3.2.5 Enzymatic activities ..................................................................................... 77 3.2.6 Soil quality index ......................................................................................... 77
3.2.7 Statistical analysis ........................................................................................ 78
3.3 Results and Discussion ......................................................................................... 79
3.3.1 Effect of management regimes on soil physical and chemical properties ... 79 3.3.2 Effect of management regime on enzymatic activities ................................ 88 3.3.3 Relationship between soil physical,
chemical and biochemical parameters ......................................................... 98
3.3.4 Analysis of principal components .............................................................. 101
3.4 Conclusions ......................................................................................................... 102
3.5 References ........................................................................................................... 103
Chapter 4 Organic amendments to improve
soil quality under intensive farming ..................................... 109
4.1 Introduction ......................................................................................................... 109
4.2 Material and Methods ......................................................................................... 113 4.2.1 Description of the study site and experimental design .............................. 113
4.2.2 Organic amendments ................................................................................. 113 4.2.3 Soil chemical and biochemical properties ................................................. 115 4.2.4 Yield crops ................................................................................................. 115
4.2.5 Statistical analysis ...................................................................................... 115
4.3 Results and Discussion ....................................................................................... 117 4.3.1 Soil chemical properties of studied farm soils ........................................... 117 4.3.2 Effect of organic amendments on soil chemical properties ....................... 118
4.3.3 Effect of organic amendments on enzymatic activities ............................. 134 4.3.4 Effect of organic amendments on crop production .................................... 144
4.3.5 Principal component analysis of soil properties affected
by organic amendments ............................................................................. 148
4.4 Conclusions ......................................................................................................... 152
4.5 References ........................................................................................................... 154
Chapter 5 Long-term effects of organic amendments
on soil organic matter ............................................................. 161
5.1 Introduction ......................................................................................................... 161
5.2 Materials and Methods ........................................................................................ 166 5.2.1 Description of the study site and sampling ................................................ 166 5.2.2 Organic amendments ................................................................................. 166
5.2.3 Extraction of organic matter ...................................................................... 167 5.2.4 Elemental analyses ..................................................................................... 167 5.2.5 FT-IR analyses ........................................................................................... 168 5.2.6 Fast Field Cycling (FFC) NMR relaxometry ............................................. 168 5.2.7 CPMAS
13C NMR spectroscopy ................................................................ 169
5.3 Results and Discussion ....................................................................................... 170
5.3.1 Yields and elemental content of organic fractions in amended soils ......... 170
5.3.2 FT-IR Spectroscopy ................................................................................... 174 5.3.3 13
C CPMAS-NMR Spectroscopy ............................................................... 177 5.3.4 Longitudinal relaxation time distribution
by Fast Field Cycling (FFC) NMR relaxometry setup .............................. 181
5.4 Conclusions ......................................................................................................... 184
5.5 References ........................................................................................................... 185
Chapter 6 Effects of organic fertilizers ondevelopment
of arbuscular mycorrhizal fungi indigenous in lettuce ....... 195
6.1 Introduction ......................................................................................................... 195
6.2 Materials and Methods ........................................................................................ 198 6.2.1 Description of study ................................................................................... 198 6.2.2 Plant analyses ............................................................................................. 199 6.2.3 Rhizosphere soil analysis ........................................................................... 199 6.2.4 Statistical analysis ...................................................................................... 199
6.3 Results and Discussion ....................................................................................... 201 6.3.1 Effect of organic fertilization on lettuces growth ...................................... 201 6.3.2 Effect of organic fertilization on indigenous mycorrhizas ........................ 203
6.4 Conclusions ......................................................................................................... 208
6.5 References ........................................................................................................... 209
Chapter 7 General conclusions ................................................................. 217
Acknowledgements ...................................................................................... 221

1
Chapter 1
Introduction
The continuous growth of global food needs, the necessity to maintain low food
prices, the reduction of tillable lands, the need to till also areas clearly unfavourable
has resulted in decisive increase of agriculture intensive type. Nevertheless, the
intensification of agriculture and the introduction of some irresponsible agricultural
practices have caused severe damage to the environment such as degradation of soils
due to the depletion of organic matter (OM), pollution of water by the massive use of
chemical fertilizers and pesticides, reduction of biodiversity, etc. (Tilman et al.,
2002).
One of the most worrying aspects of intensive agriculture is the gradual loss of OM in
soil. Currently, in agricultural soils the cycle of OM is clearly unbalanced towards
consumption and mineralization of organic carbon, thus penalizing OM accumulation
and humification. However, the balance between accumulation and consumption of
OM, which is essential to not compromise the conditions of soil fertility, must be
maintained in an agricultural system.
The condition is alarming and without a strategy to restore the content of OM the
desertification of arable land could result. Fortunately, the community agricultural
policy has become more sensitive to this problem even under the pressure of the
public opinion, indeed it is promoting alternatives to conventional agriculture such as
organic, eco-friendly and biodynamic farming, and more respectful of environmental
not renewable resources. For example in Campania region, Italy, policies have been
promoted concerning the development and maintenance of OM levels in soils, with
the aim to encourage farmers to adopt management techniques for the conservation of
soil organic matrix by using of organic amendments, like compost.
Traditionally, the use of amendments, such as manure and other materials, in
agriculture is finalized to improve the OM content in the agro-ecosystem. The aim is
to ensure, through the reintegration of humic components progressively mineralized:
Chapter 1 .
2
a) the conservation of natural fertility in terms of as workability, porosity, aeration,
drainage; b) chemical fertility, in terms of as trophic environment suitable for plants,
and c) biological fertility, in terms of as the variety and intensity of biogeochemical
processes occurring in soil.
1.1 Agricultural soil managements
Soil management concerns all operations, practices and treatments used to protect an
agricultural soil and to enhance its performance.
Modern agriculture now feeds 6,000 million people. Global cereal production has
doubled in the past 40 years (Fig. 1.1a), mainly from the increased yields resulting
from greater inputs of fertilizer, water and pesticides, new crop strains, and other
technologies of the „Green Revolution‟ (FAO, 2001; Tilman et al., 2001).
This has increased the global food supply per capita (FAO, 2001), reducing hunger,
improving nutrition (and thus the ability of people to better reach their mental and
physical potential) and sparing natural ecosystems from conversion to agriculture
(Waggoner, 1995).
During the last century, intensive agriculture has been the most common soil
agricultural management, even if, in the last decades, with the growing environmental
awareness in the people, sustainable agriculture rapidly extended.
1.1.1 Intensive agriculture
Intensive agricultural practices determine the level of food production and, to a great
extent, the state of the global environment. Agriculturalists are the chief managers of
terrestrial „useable‟ lands, which can be broadly define as all land that is not desert,
tundra, rock or boreal. About half of global usable land is already in pastoral or
intensive agriculture (Tilman et al., 2001). In addition, intensive agriculture adds
globally significant and environmentally detrimental amounts of nitrogen and
phosphorus to terrestrial ecosystems (Vitousek et al., 1997; Carpenter, 1998) at rates

Introduction
3
that may triple if past practices are used to achieve another doubling in food
production (Cassman and Pingali, 1995; Cassman, 1999).
Figure 1.1 Agricultural trends over the past 40 years. a) Total global cereal production. b) Total
global use of nitrogen and phosphorus fertilizers and area of global irrigated land. c) Total global
pesticide production and global pesticide imports (summed across all countries). (Adapted from
Tilman et al., 2002).
Intensive agricultural practices can reduce the ability of ecosystems to provide goods
and services. For example, high applications of fertilizers and pesticides (Fig. 1.1b
and c) can increase nutrients and toxins in groundwater and surface waters, increasing
health and water purification costs (Tilman et al., 2002).

Chapter 1 .
4
Intensive agricultural practices, moreover can contribute to eutrophication of aquatic
habitats thus determining further costs increased fertilization, irrigation, and energy
to maintain productivity of the degraded soils (Cassman, 1999). Practices that change
species composition or reduce biodiversity in non-agricultural systems, may also
diminish goods and services, because the ability of ecosystems to provide some
services depends on both number and type of species in an ecosystem (Hector et al.,
1999; Loreau et al., 2001).
The main environmental impacts of intensive agriculture come from the conversion
of natural ecosystems to agriculture, from agricultural nutrients that pollute aquatic
and terrestrial habitats and groundwater, and from pesticides, especially
bioaccumulating or persistent agricultural organic pollutants. Agricultural nutrients
enter other ecosystems through leaching, volatilization. Pesticides can also harm
human health, as well as pathogens, including antibiotic-resistant pathogens
associated with certain animal production practices.
About the use of mineral fertilizers and pesticides, intensive high-yield agriculture is
dependent on their addition. In some regions of the world, crop production is still
constrained by too little application of fertilizers (Pinstrup-Andersen and Pandya-
Lorch, 1996). Without the use of synthetic fertilizers, world food production could
not have increased at the rate it did and more natural ecosystems would have been
converted to agriculture. Between 1960 and 1995, global use of nitrogen fertilizer
increased seven fold, and phosphorus use increased (WHO, 1990; Waggoner, 1995)
3.5 fold (Fig. 1.1b); both are expected to increase another three fold up to 2050 unless
there is a substantial increase in fertilizer efficiency (Cassman and Pingali, 1995;
Tilman et al., 2001).
This excessive fertilization can cause eutrophication, loss of diversity, dominance by
weedy species and increased nitrate leaching or NOx fluxes (Vitousek et al., 1997).
Finally, nitrose inputs to agricultural systems contribute to emissions of the
greenhouse gas nitrous oxide. Rice paddy agriculture and livestock production are the
Introduction
5
most important anthropogenic sources of the greenhouse gas methane (Prather et al.,
2001).
Improvements in the control of weedy competitors of crops, crop diseases and
pathogens, and herbivores could significantly increase yields. Three cereals — wheat,
rice and corn — provide 60% of human food. These crops, derived from once-rare
weedy species, have become the three most abundant plants on Earth (Tilman et al.,
2002). A central conclusion of epidemiology is that both the number of diseases and
the disease incidence should increase proportional to host abundance, and this
disconcerting possibility illustrates the potential instability of a global strategy of
food production in which just three crops account for a so high proportion of
production. The relative scarcity of outbreaks of diseases on these crops is a
testament to plant breeding and cultivation practices (Tilman et al., 2002).
Another serious problem of intensive agriculture is frequently tillage. Tillage, for the
production of annual crops, is the major problem in agriculture, causing soil erosion
and loss of soil quality (ATTRA, 2004). Ever since mankind started agriculture,
erosion of topsoil has been the single largest threat to a soil‟s productivity and,
consequently, to farm profitability. This is still true today. In the U.S., the average
acre of cropland is eroding at a rate of 7 tons per year (Edward and Burrows, 1988).
To sustain agriculture means to sustain soil resources, because that is the source of a
farmer‟s livelihood. The major productivity costs to the farm associated with soil
erosion come from the replacement of lost nutrients and reduced water holding
ability, accounting for 50 to 75% of productivity loss (Edward and Burrows, 1988).
Soil that is removed by erosion typically contains about three times more nutrients
than the soil left behind and is 1.5 to 5 times richer in OM (Edward and Burrows,
1988). This OM loss not only results in reduced water holding capacity and degraded
soil aggregation (Fig. 1.2), but also in loss of plant nutrients, which must be replaced
with mineral fertilizations (ATTRA, 2004).
Chapter 1 .
6
Figure 1.2 Raindrops falling on bare ground initiate erosion. (Adapted from Preston, 1998).
1.1.2 Sustainable agriculture
Sustainable agriculture is a philosophy: it is a system of farming. It empowers the
farmer to work with natural processes to conserve resources such as soil, air and
water, whilst minimising waste and environmental impact (Mason, 2003).
Sustainable agriculture is defined as the whole practices that meet current and future
societal needs for food and fibre, for ecosystem services, and for healthy lives, and
that do so by maximizing the net benefit to society when all costs and benefits of the
practices are considered (Tilman et al., 2002).
Additionally, the development of sustainable agriculture must accompany advances
in the sustainability of energy use, manufacturing, transportation and other economic
sectors that also have significant environmental impacts.
Sustainable production practices involve a variety of approaches. Specific strategies
must take into account topography, soil characteristics, climate, pests, local
availability of inputs, and the individual grower's goals. Despite the site-specific and
individual nature of sustainable agriculture, several general principles can be applied
to help growers to select appropriate management practices:
selection of site, species and varieties;
diversity;
Introduction
7
efficient use of inputs;
practices of soil management.
1.1.2.1 Selection of site, species and variety
Site, species and varieties must be well suited to conditions existing in the farm.
Preventive strategies can reduce inputs and help to establish a sustainable production
system. When possible, pest-resistant crops which are tolerant to existing soil or site
conditions should be selected. When site selection is an option, factors such as soil
type and depth, previous crop history, and location (e.g. climate, topography) should
be taken into account before planting.
For these reasons, a previous monitoring of the crop area is fundamental. Monitoring
data can provide feedback to assess the effectiveness of natural resource policies,
determine the success of land management systems, and diagnose the general health
of lands.
Monitoring represent just one component of several physical, chemical and biological
basic informations, necessary for natural soil resource management (Fig. 1.3). On the
other hand, monitoring programs must be considered with the mutually beneficial
activities of mapping and modelling, and all of them should, then, be set within the
context of environmental history - the latter provides an understanding of rates of
change on much longer time scales (decades, centuries and millennia). Singularly,
each activity fails to provide appropriate information for land management and
planning. In combination, they provide a powerful and synergistic means for
transforming the quality of land management.
When a monitoring of soil quality has to be performed for a relatively unknown
situation, several properties must be measured. Usually, a minimum data set (MDS)
of soil properties or indicators are selected in order to be responsive, affordable,
interpretable, internationally accepted, and ecologically significant (Doran and Parkin
1994).

Chapter 1 .
8
Figure 1.3 Mapping, monitoring and modelling as complementary activities for natural resource
management in the context of the environmental history of events and processes for a given
landscape.
Criteria for including particular soil properties in the MDS depend on their relevance
to the soil under examination. The choice can be made from international literature,
and preliminary studies are needed to validate the selected MDS and to standardize
the sampling method. According to the concept of soil quality, soil attributes that
influence the capacity of soil to perform crop production or environmental functions
and are sensitive to change in land use, management, or conservation practices must
be included in MDS and evaluated simultaneously, using statistical procedures that
account for correlation among soil attributes (Andreoni and Gianfreda, 2007).
1.1.2.2 Diversity
Diversified farms are usually more economically and ecologically resilient. While
monoculture farming has advantages in terms of efficiency and ease of management,
the loss of crops in any one year could put a farm out of business and/or seriously
disrupt the stability of a community dependent on that crop. By growing a variety of
Introduction
9
crops, farmers spread economic risks and are less susceptible to the radical price
fluctuations, associated with changes in supply and demand.
Properly managed, diversity can also buffer a farm in a biological sense. For
example, in annual cropping systems, crop rotation can be used to suppress weeds,
pathogens and insect pests. Also, cover crops can have stabilizing effects on the agro
ecosystem by holding soil and nutrients in place, conserving soil moisture with
mowed or standing dead mulches, and by increasing the water infiltration rate and
soil water holding capacity. Cover crops in orchards and vineyards can buffer the
system against pest infestations by increasing beneficial arthropod populations and
can therefore reduce the need for chemical inputs. Using a variety of cover crops is
also important in order to protect against the failure of a particular species to grow
and to attract and sustain a wide range of beneficial arthropods.
Optimum diversity may be obtained by integrating both crops and livestock in the
same farming operation. This was the common practice for centuries until the mid-
1900s, when technology, government policy and economics compelled farms to
become more specialized. Mixed crop and livestock operations have several
advantages. First, growing row crops only on more level land and pasture or forages
on steeper slopes will reduce soil erosion. Second, pasture and forage crops in
rotation enhance soil quality and reduce erosion; livestock manure, in turn,
contributes to soil fertility. Third, livestock can buffer the negative impacts of low
rainfall periods by consuming crop residues that in "plant only" systems would have
been considered crop failures. Finally, feeding and marketing are flexible in animal
production systems. This can help to cushion farmers against trade and price
fluctuations and, in conjunction with cropping operations, make more efficient use of
farm labour.
1.1.2.3 Efficient use of inputs
Many inputs and practices used by conventional farmers are also used in sustainable
agriculture. Sustainable farmers, however, maximize reliance on natural, renewable,
Chapter 1 .
10
and on-farm inputs. Equally important are the environmental, social, and economic
impacts of a particular strategy. Converting to sustainable practices does not mean
simple input substitution. Frequently, it substitutes enhanced management and
scientific knowledge for conventional inputs, especially chemical inputs that harm the
environment in farms and in rural communities. The goal is to develop efficient,
biological systems which do not need high levels of material inputs.
Growers frequently ask if synthetic chemicals are appropriate in a sustainable
farming system. Sustainable approaches are those that are the least toxic and least
energy intensive, and yet maintain productivity and profitability. Preventive strategies
and other alternatives should be employed before using chemical inputs from any
source. However, there may be situations where the use of synthetic chemicals would
be more "sustainable" than a strictly nonchemical approach or an approach using
toxic "organic" chemicals. For example, one grape grower switched from tillage to a
few applications of a broad spectrum of contact herbicides in the vine row. This
approach may use less energy and may compact the soil less than numerous passes
with a cultivator or mower.
1.1.2.4 Practices of soil management
A common philosophy among sustainable agriculture practitioners is that a "healthy"
soil is a key component of sustainability; that is a healthy soil will produce healthy
crop plants that have optimum vigor and are less susceptible to pests. While many
crops have key pests that attack even the healthiest plants, proper soil, water and
nutrient management can help prevent some pest problems brought on by crop stress
or nutrient imbalance. Furthermore, crop management systems that impair soil
quality often result in greater inputs of water, nutrients, pesticides, and/or energy for
tillage to maintain yields.
In sustainable systems, the soil is viewed as a fragile and living medium that must be
protected and nurtured to ensure its long-term productivity and stability. Methods to
protect and enhance the productivity of soil include use of cover crops, compost
Introduction
11
and/or manures, reduction of tillage, avoiding traffic on wet soils, and maintenance
soil cover with plants and/or mulches. Conditions in most Italian soils (warm,
irrigated, and tilled) do not favour the build up of OM. Regular additions of OM or
the use of cover crops can increase soil aggregate stability, soil tilth, and diversity of
soil microbial life. The main method to apply OM to agricultural soil is the use of
organic amendments, such as compost.
1.2 Compost
Although most has been discussed about wastes, little is still known the opportunities
that may result from a correct evaluation of the residual resources. Composting is an
ancient theme and actual at the same time. More generally, to address and resolve the
problem, it is of help to give to urban solid wastes the status of resource, and try to
enter them again in the production cycle. This is true when the compost is used in
anaerobic digestion to produce biogas, or the use of compost as an amendment is
taken in account.
Of the total organic wastes, delivered to composting plant, as much as 73% appears
to be composed of the urban waste that are commonly identified as the "wet and
green." The remainder is made up of sludge (17%) and other organic wastes of agro
industrial origin (10%). Compost is the product obtained by composting the organic
fraction of municipal wastes in according with appropriate technical standards, aimed
at defining the content and uses compatible with environmental protection and health,
and in particular to define the degree of quality (Art. 6 letter q, D.L. February 5,
1997, No. 22, Law Ronchi). It can have a granular appearance, moisture of about
30%, reaction around neutrality (pH values ranging between 6 and 8.5) and good
stability, maintained without corrective actions. Due to these properties it can be
packaged and stored for a long time.
Compost is ultimately an odourless, stable product, more or less rich in humus,
capable to improve soil fertility in respect of environmental and human health
standards.
Chapter 1 .
12
Its use allows the implementation of a sustainable farming model, which achieves a
balance between withdrawal and return of organic material to the biosphere.
Agricultural soils can benefit from adequate and systematic organic amendments by
use of compost, to meet the continuous depletion of OM due to intensive farming and
non-optimal use of mineral fertilizers, herbicides and pesticides.
To obtain a product with the desired characteristics, it is necessary to mix the
different substrates in appropriate ratio to ensure optimal C/N ratio and the presence
of nutrients and metabolic activity for the growth of microorganisms. Indeed, sources
of compost are of different origin (agricultural, urban, industrial) and do not always
have the optimal characteristics for an efficient processing. For example, if the
starting matrix is rich in nitrogen and water, bulking agents (such as straw, paper,
etc.) are added. These materials, which provide carbon, mitigate the excess of
moisture, provide structure to the overlapping creating interstitial spaces between the
particles of the substrate, and are essential for gas exchange.
1.2.1 Effects of compost on soil
In nature, compost, as organic material, undergoes a process of decomposition which
is the result of enzymatic reactions, highly dependent on the composition and
complexity of the material. The process makes compost more or less likely to become
a source of energy and nutrients for the microorganisms through metabolic pathways
of respiration and fermentation.
During this process, minerals, mainly nitrogen, phosphorus, calcium, potassium and
magnesium, are released into the soil. In addition, organic molecules, if not
completely degraded, can be used as such for new synthesis, or further degraded by
other soil organisms.
The release of nitrogen is particularly important being this element essential for plant
growth. This is often limited by the lack of availability of soil nitrogen forms, to
plants (ammonia and nitrate nitrogen). In the organic substances, when released into
Introduction
13
the soil, nitrogen can undergo mineralization or immobilization as needed for
biosynthesis of microorganisms (Choi and Chang, 2005).
Amlinger et al. (2003) identified the percentage of nitrogen release from composted
amendment: up to 8% of the total in the first 2 years and 3-5% of the total from the
third year onwards.
Tabaglio et al. (2008) carried out a study of four years on the influence of the input of
composted amendments and manures on soil physical and chemical characteristics by
distributing the same quantity of OM (10 t ha-1
). They observed higher concentrations
of nitrates in the thesis treated with manure. This confirms that the process of manure
maturation, usually conducted in static piles, is not always adequate to produce a
degree of organic nitrogen with the same efficiency of a controlled aerobic process.
Compost should be considered either as a direct source of nitrogen or a source of
OM, stimulating soil microbial activity. It can change the balance of mineralization-
immobilization processes in the soil occurring between the nitrogen supplied with
fertilizer and the nitrogen already present in soil OM.
A study on the combined effect of compost and mineral fertilizers showed that the
interaction of mineral fertilizers and organic manure determined mainly an increase
of immobilization of mineral nitrogen, following the stimulation of microbial activity
by organic substances (Crippa and Zaccheo, 1995). OM limits immediately the
efficiency of nitrogen fertilizers, but it can also reduces the losses of nitrogen, that are
always conspicuous. It follows therefore that the application of OM along with
nitrogen fertilizers can be an aid in maintaining the nitrogen fertilizer, ensuring its
continued availability to succeeding crops. In fact biomass is a source of potentially
available nitrogen in the short term, as humic substances may constitute a reservoir of
slowly transferable nitrogen.
Compost can, in the short term, favour an increase in aggregate stability to water
(associated with a larger diameter of aggregates), proportionally to the organic carbon
content of soil (Leroy et al., 2008), especially in the absence of tillage (Whalen,
2003).
Chapter 1 .
14
Compost of different origin and production can lead to different variations of the
aggregates stability. For instance, compost produced by processes of rapid
composting can improve stability by increasing the water repellence of aggregates,
induced by increased microbial activity. Amendments with greater maturity,
however, may increase stability by improving the cohesion between soil particles into
aggregates, due to the diffusion of OM within them. The more mature products can
improve the stability by increasing the OM humified into aggregates, which are more
difficult to degrade (Annabi et al., 2007).
In addition, the use of compost can also help in the short term to increase the
proportion of larger macroaggregates (> 2 mm), probably because of the stabilization
of smaller macroaggregates. This effect can be greater than that measured with
manure (Wortman and Shapiro, 2008).
Compost, because of its influence on the aggregates stability, on the carbon content
and on the main mineral nutrients, seems to have an effect on soil humus, particularly
on the concentration of humic carbon and on humic fractions which can be extracted.
Compost appears to be able not only to improve the composition of soil humic
substances by increasing humic acids (Weber et al., 2007), but also to increase, in the
short term, the humified carbon content, by increasing the ratio of humified (given by
the set of humic and fulvic acids, and humin) and non-humified carbon (Adani et al.,
2007).
Furthermore compost, through a continuous supply of OM to the soil, is able to
promote an increase of the degradation rate of native humic acids in (Kawasaki et al.,
2008).
Compost, promoting the whole biological activity of soil, can also contribute to
prevent colonization of pathogens by mechanisms of antibiosis and competition by
saprophytic organisms present in it (Elsgaard et al., 2001). In this regard, in literature
is reported a positive effect of compost on developed arbuscular mycorrhizal fungi
(AMF). AMF of the Phylum Glomeromycota (Schüssler et al., 2001) are the most
important in agriculture because they form a symbiotic association with many crop
Introduction
15
species. AMF favour their host principally by increasing uptake of relatively
immobile phosphate ions, (Sanders and Tinker, 1971; Koide, 1991; George et al.,
1995; Smith and Read, 1997). In return, the fungi receive carbon from the host plant.
Other benefits to the host that have been identified include increased uptake of
macronutrients other than phosphorus. Indeed, uptake of nitrogen, potassium and
magnesium has also been measured (Smith and Read, 1997; Clark and Zeto, 2000;
Hodge et al., 2001) as well as increased uptake of some micronutrients (Faber et al.,
1990; Kothari et al., 1991a; Azaizeh et al., 1995).
1.2.2 Compost as amendment
In the Mediterranean countries the lack of OM due to the use of land for production
purposes implies the need to raise large amounts of organic materials of different
origin. Among these materials, compost is an amendment, easily available in
sufficient quantities and with relatively low prices.
The quality of compost produced in Italy has improved during the time, reaching
optimal agro-environmental levels, due to the better selection of scraps (accurate
differentiation, selection of appropriate arrays) and the abandonment of the use of
compost from undifferentiated wastes (Centemero and Corti, 2000). Compost, when
added to the soil, becomes a growth factor for crops and source of production of new
OM (Gallardo-Lara and Nogales, 1987). In addition, compost improves biodiversity
and activity of microbial populations in soil, thus influencing their structure, nutrient
cycling and many other physical, chemical and biological properties (Albiac et al.
2000).
Chemical characterization of compost is generally based on the value for cropping
and on the heavy metals content. Regarding the value for cropping it is necessary to
measure the content of N, P, K, and microelements (Cu, Zn, Mn, Fe, Co, Mo).
Instead, for the heavy metals content, many countries have introduced various laws
relating to the specifications of compost (Soumaré et al., 2003). The quality of a
compost is defined by several characteristics such as moisture, OM, carbon content,
Chapter 1 .
16
concentration and composition of humus, nitrogen, phosphorus and potassium levels,
heavy metals content, salinity, cation exchange capacity, water holding capacity,
porosity and density of the mass, pathogens presence, degree of maturity and
stability. However, the most important parameters to ensure the protection of public
health, soil and environment in general, are those relating to pathogens, inorganic and
organic compounds potentially toxic, and stability.
The degree of stability of a compost and its nitrogen content are particularly
important for its use in farming. The stability of compost is not defined only by the
C/N ratio, but also by its microbial activity through the respiration index.
It is possible to have a “good quality” compost by using appropriate starting materials
and by operating with proper techniques and an adequate treatment plant equipment.
The quality of the starting matrix is decisive to have a great quality compost.
The production and use of compost derived from organic wastes seems to be able to
provide a joint solution to two problems: firstly, the need to give priority to those
forms of wastes, covering the recovery of materials and energy, and to minimize
environmental impact; secondly, the need to supply organic fertilizers to soil to
compensate for the shortage of OM, maintaining the fertility of agricultural soil, and
preserving the environmental equilibrium (Felipò, 1996; Ozores-Hampton et al.,
1998). These principles are clearly confirmed by the recent EU legislation, at national
and regional level, together with the need to reduce drastically the amount of organic
wastes for disposal in a landfill, separating the organic fraction of waste already
being collected and reclaimed.
In commerce, it is possible to find three types of commercial composts usable as
amendments for agriculture:
• composted green amendment, a product obtained through a process of
transformation and stabilization of controlled wastes, consisting of wastes from the
maintenance of ornamental plants, crop residues and other wastes of plant origin
with the exception of algae and other marine plants;
Introduction
17
• composted mixed amendments, a product obtained through a process of
transformation and stabilization of controlled wastes, that can be made from the
organic fraction of municipal solid waste from recycling, from animal wastes,
including manure, waste-processing and agro-industrial activities, wood and
natural untreated textiles, sewage and sludge, and also from all matrices required
for the composted green amendment;
• amendment composted peat, a product obtained by blending of peat, at least 50%,
with green composted amendments and/or mixed.
The disappearance of small farms and the subsequent concentration in restricted areas
of production, as well as the development of an agricultural model
based on monoculture and intensive agriculture, have led to a deficit of OM of
numerous farmlands. The need for high levels of OM in the Italian soils, emerges
very clearly in all sectors and in all areas of high agricultural vocation. More than
50% of cultivated soils are classified as low in OM, with variation from area to area
depending on local realities (Bonanomi et al., 2010). In this context, the use of
compost in agriculture helps to ensure that organic wastes, resulting from the
different human activities, return to the ground, while maintaining, at the same time,
adequate levels of fertility that can not be achieved with the exclusive use of
chemical fertilizers (Ciccotti et al., 1988). In his direct agricultural use, compost
should be essentially a fertilizer. Its main agronomic value is given by the budget of
OM humus contained, while the presence of nutrients is limited (Scagliarini, 1999).
1.3 Soil quality
An important aim of modern agriculture is the preservation of the environmental and
natural resources in the long-term.
The quality of the environment can be assessed by the quality of its main tasks, such
as air, water and soil. Soil quality is usually defined as the capacity of soil to interact
with the ecosystem in order to maintain the biological productivity, the quality of
Chapter 1 .
18
other environmental compartments, thus promoting the health of plants and animals,
including humans (Doran and Parkin , 1994).
Curiously, the impulse to define and assess soil quality has not departed from the
scientific community, but from civil society concerned about the health of the
environment. Soil quality may deteriorate quickly due to bad land management,
stabilize with time under proper management, vary slightly because of the weather
and growing conditions, and improve in the long time for the supply of OM.
The assessment of soil quality has many implications, such as the attitude of soil to a
specific use, and the assessment of the human activities and management practices
carried out on it. To ensure a correct approach, it is firstly necessary to make the
distinction between intrinsic and dynamic quality (Karlen et al., 2001). The first
depends on the intrinsic characteristics of a soil, defined as those that are not
modifiable in the short term. The dynamic quality is rather determined by all
properties that change in the short term. For example, when a study aims to assess the
impact on soil quality of specific farming techniques or different methods of
cultivation, the intrinsic properties of soil must be considered. Therefore, it is not
useful to evaluate the texture, cation exchange capacity and pH, which are mostly
determined by the characteristics of the parent rock and the pedogenic processes that
formed that land. It is be appropriate, instead, to focus the attention on the organic
components of land, assessing the amount (total content of a soil) and quality
(properties and relative importance of different fractions) or the properties of its vital
components (meso and microorganisms).
Two concepts are useful to assess changes in soil quality: the resistance to
degradation, and the resilience, that is the ability of a soil to recover its functional and
structural integrity after an external disturbance (Griffith et al, 2001).
Soil quality can be assessed by estimating changes in its characteristics as defined by
indicators capable of being synthesized in harmonious, complex and interrelated
phenomena.
Introduction
19
1.4 Soil quality indicators
Soil quality and soil health are very often used interchangeably (Doran and Safley,
1997). Doran et al. (1996) gave a definition of soil health very similar to that
previously proposed for “soil quality”. Indeed these authors defined “soil health” as
'the continued capacity of soil to function as a vital living system, within natural or
managed ecosystem boundaries to sustain biological productivity, maintain
environmental quality, and promote plant, animal and human health (Doran and
Parkin, 1994).
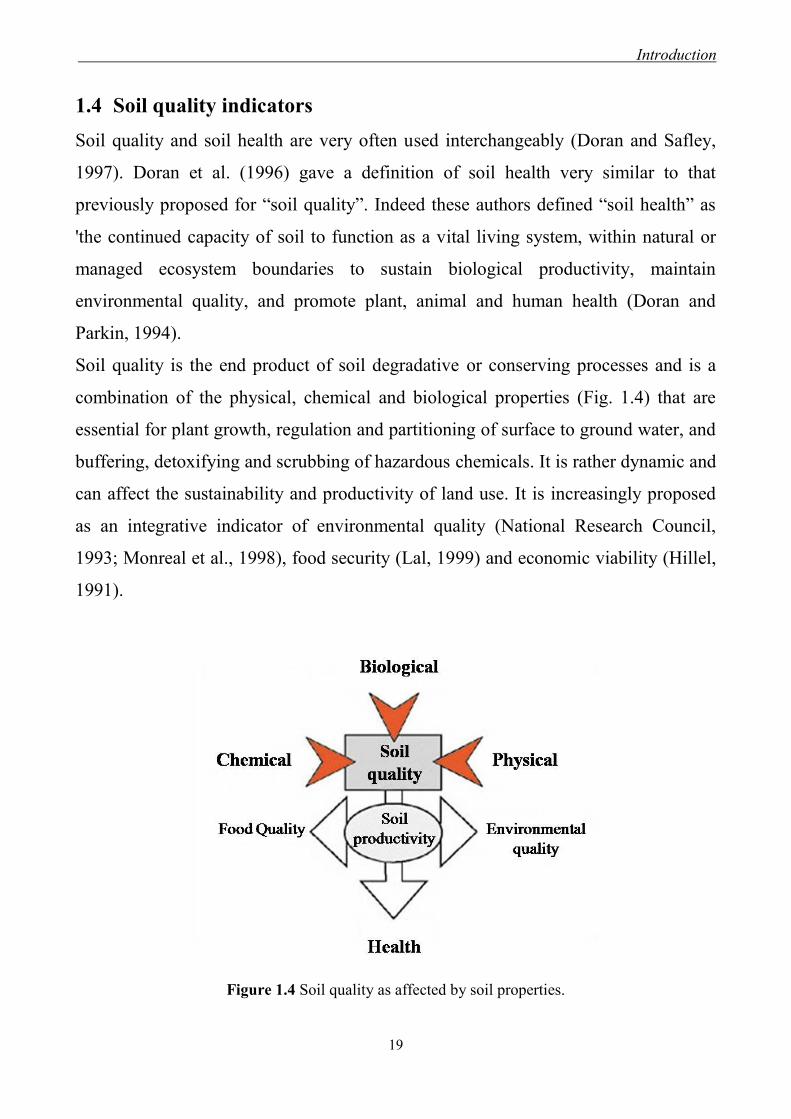
Soil quality is the end product of soil degradative or conserving processes and is a
combination of the physical, chemical and biological properties (Fig. 1.4) that are
essential for plant growth, regulation and partitioning of surface to ground water, and
buffering, detoxifying and scrubbing of hazardous chemicals. It is rather dynamic and
can affect the sustainability and productivity of land use. It is increasingly proposed
as an integrative indicator of environmental quality (National Research Council,
1993; Monreal et al., 1998), food security (Lal, 1999) and economic viability (Hillel,
1991).
Figure 1.4 Soil quality as affected by soil properties.
Chapter 1 .
20
Basic soil quality indicators should: a) well correlate with ecosystem functions such
as C and N cycling (Visser and Parkinson, 1992); b) integrate soil physical, chemical,
and biological properties and processes, and serve as basic inputs, needed for the
estimation of soil properties or functions which are more difficult to measure directly;
c) be measurable by as many users as possible and not limited to a select group of
research scientists; d) be applicable to field conditions, i.e. they should describe the
major ecological processes in soil and ensure that measurements reflect conditions as
they exist in the field under a given management system; e) be sensitive to variations
in management and climate; and f) be components of existing soil data bases where
possible (Doran and Parkin, 1994). Quantifying these variables through long-term
monitoring may lead to an understanding about the effects of land management
practices and natural or human-caused disturbances on the soil component of
ecosystems (Knoepp et al., 2000).
It is often difficult to separate soil functions into chemical, physical, and biological
processes because of the dynamic, interactive nature of these processes (Schoenholtz
et al., 2000). Because of these interactions, soil indices are extremely variable.
Many soil chemical properties directly influence microbiological processes (e.g. via
nutrient and carbon supply), and these processes, together with soil physical-chemical
processes, determine the capacity of soils to hold and supply nutrients cycles
(including carbon), and the movement and availability of water. Therefore, soil
chemical indicators are used mostly in the context of nutrient relations and may also
be referred to as “indices of nutrient supply” (Powers et al., 1998) (Table 1.1).
By contrast, biological and biochemical properties (Table 1.1), including soil
respiration, microbial biomass and the activities of soil enzymes, are most useful for
detecting the deterioration of soil quality (Visser and Parkinson, 1992) because of
their importance in cycling of OM and regulating active nutrient pools in soils
(Caravaca and Roldán, 2003).
The identification of biological indicators of soil quality is important because soil
quality is strongly influenced by microorganism mediated processes (nutrient cycling,
Introduction
21
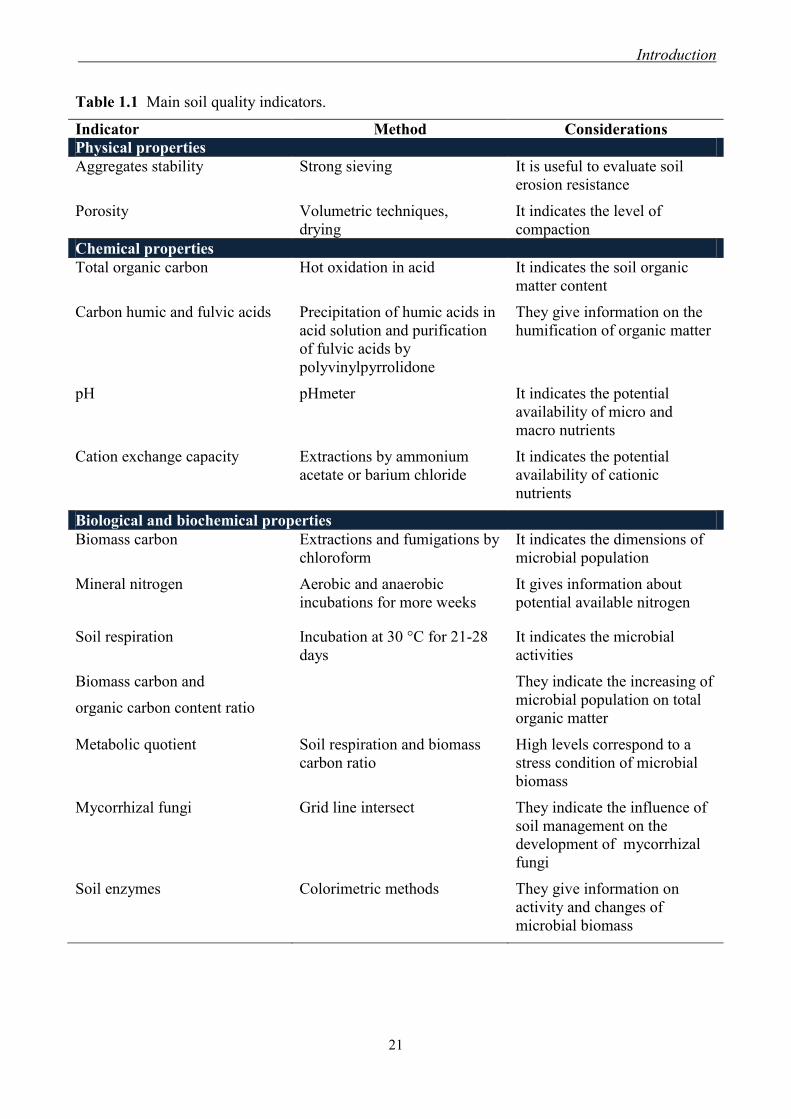
Table 1.1 Main soil quality indicators.
Indicator Method Considerations
Physical properties
Aggregates stability Strong sieving It is useful to evaluate soil
erosion resistance
Porosity Volumetric techniques,
drying
It indicates the level of
compaction
Chemical properties
Total organic carbon Hot oxidation in acid It indicates the soil organic
matter content
Carbon humic and fulvic acids Precipitation of humic acids in
acid solution and purification
of fulvic acids by
polyvinylpyrrolidone
They give information on the
humification of organic matter
pH pHmeter It indicates the potential
availability of micro and
macro nutrients
Cation exchange capacity Extractions by ammonium
acetate or barium chloride
It indicates the potential
availability of cationic
nutrients
Biological and biochemical properties
Biomass carbon Extractions and fumigations by
chloroform
It indicates the dimensions of
microbial population
Mineral nitrogen
Aerobic and anaerobic
incubations for more weeks
It gives information about
potential available nitrogen
Soil respiration Incubation at 30 °C for 21-28
days
It indicates the microbial
activities
Biomass carbon and
organic carbon content ratio
They indicate the increasing of
microbial population on total
organic matter
Metabolic quotient Soil respiration and biomass
carbon ratio
High levels correspond to a
stress condition of microbial
biomass
Mycorrhizal fungi Grid line intersect They indicate the influence of
soil management on the
development of mycorrhizal
fungi
Soil enzymes Colorimetric methods They give information on
activity and changes of
microbial biomass
Chapter 1 .
22
nutrient capacity, aggregate stability), whereby the key is to identifying those
components that rapidly respond to changes in soil quality (Doran and Parkin, 1994).
Nevertheless, there is the problem of knowing which indicator responds to a specific
soil treatment or contaminant.
Therefore, the use of multiple biological and biochemical properties is often
suggested (Ros et al., 2006). General biochemical properties such as microbial
biomass carbon (Brookes, 1995), or ecophysiological quotients such as qCO2 and qD
(Anderson and Domsch, 1993), as well as specific biochemical properties such as
hydrolytic soil enzymes related to C, N and P cycles (Nannipieri et al., 1990) are
suggested.
One limitation in using biological assays for soil quality indication is the lack of
standard methodologies. Considerable variation exists among assay procedures used
by various researchers, making actual activity comparison between sites difficult. It
was thus emphasized that if bioassays have to be used as soil quality indicators, soil
sample pre-treatment, assay procedures and units of measurement must be
standardized (Dick, 1994).
1.4.1 Soil physical and chemical properties
Many soil physical properties as they depend on the nature of parent material and
pedogenic processes, have to be considered inherent. Others, however, are influenced
by non-living OM content and the activity of living fraction. This second group of
properties, having a living nature, can be used to assess soil quality. This category
includes the stability of aggregates, which reflects the ability of soil to ensure the
physical stability and resistance against erosion and compaction, and the porosity,
which determines the "fitness for habitation" of soil to the microorganisms and
influences the balance of chemical and biochemical processes, affecting the
relationship between the gas and the liquid phases (Table 1.1).
Introduction
23
Chemical properties of soils give information on the quantity of available nutrients in
complexed and free form, and, consequently, the adaptability of land to support and
promote the growth of plant and microorganisms (Table 1.1).
Since many chemical properties are influenced by soil OM (regulation of the
availability of nutrients for plants and microorganisms, exchange capacity, pH,
buffering capacity, adsorption of organic and inorganic xenobiotics), the assessment
of its total content and its fractions always constitutes a landmark in the study of soil
quality (Table 1.1).
1.4.2 Soil biological and biochemical properties
Soil biological and biochemical properties react more quickly to agricultural practices
and, in general, to any kind of alteration affecting soil.
Microorganisms (mainly bacteria and fungi) govern the processes of digestion and
nutrient cycling through decomposition of OM. Total organic carbon and microbial
biomass are key factors in assessing soil quality and are correlated (Elliott, 1997) by
the "microbial quotient (ratio of microbial biomass C and total organic C), considered
an indicator of both biological activity and accumulation of organic carbon in soil
(Elliott, 1994). The respiration of a soil as a measure of the amount of CO2 produced
from the oxidation of OM, is an indicator of microbial mineralization process.
In addition, soil nitrogen content is correlated to its availability to crops and
microbial components, and to the risks of air pollution and water.
Soil enzymes are considered good indicators of soil quality, because they are
involved in nutrient cycling and decomposition of OM, and respond quickly to any
form of change occurring in the system (Table 1.1).
1.4.3 Soil quality indexes
A large number of physical, chemical and biochemical properties, that influence
biogeochemical processes and their spatial and temporal variations, contribute to
define soil quality. Consequently, individual soil properties may fail to give an
Chapter 1 .
24
appropriate estimation of soil quality. Moreover, since a number of these properties
are difficult to measure, it is useful to condense the information in a numerical value,
an index. To define a soil quality indexes it is important: i) the choice of the quality
criteria, to which the index values refer; ii) the selection of reliable properties,
sensitive to changes in management practices and environmental stresses, to build up
the index; and iii) the application of a proper numerical analysis to the development
of the index (Puglisi et al., 2006).
A very important step in using soil quality to assess management practices is the
availability of tools which producers or managers can use to interpret the technical
soil measures and provide guidance for their management. These tools can take the
form of an interpretive guide or a computer program that calculates an index using
measured soil properties. So, the calculated index can be used to identify the
problems present in the study areas and evaluate management practices over time
(Wienhold et al., 2004).
A lot of studies have been done on soil quality indicators at point to regional scales
(Karlen et al., 1999; Liebig and Doran, 1999; Brejda et al., 2000 a,b,c; Gomez et al.,
1996) developed an on-farm index for assessing sustainability based on productivity,
profitability, stability, and social acceptability. This measurement used soil processes
(crop yield and frequency of crop failure) or properties (soil depth, organic C) as
indicators and identified threshold values that are based on local conditions to
generate an index of sustainability. This example is only one of several approaches
that have been used to perform an index which uses soil quality as an indicator for
sustainability (Karlen et al., 1998; Hussain et al., 1999; Jaenicke and Lengnick, 1999;
Wander and Bollero, 1999; Andrews et al., 2002a,b; Andrews and Carroll, 2001).
To compare soil quality indicators among sites or among treatments it is useful to
normalize the values of indicators using scoring curves. These are mathematical
equations developed to describe the relationship between an indicator value and a
specific soil process. Indicator selection for a particular process or function can be
Introduction
25
done using expert opinion or a statistical procedure such as principle component
analysis (Andrews et al., 2002b).
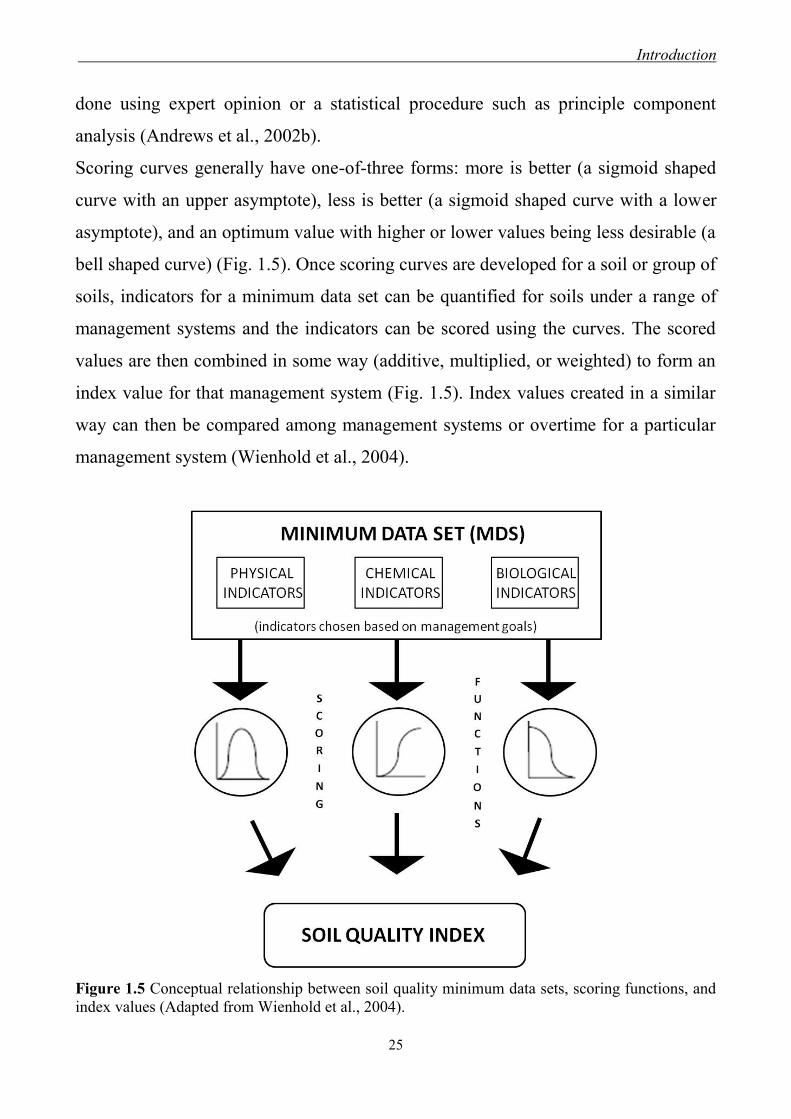
Scoring curves generally have one-of-three forms: more is better (a sigmoid shaped
curve with an upper asymptote), less is better (a sigmoid shaped curve with a lower
asymptote), and an optimum value with higher or lower values being less desirable (a
bell shaped curve) (Fig. 1.5). Once scoring curves are developed for a soil or group of
soils, indicators for a minimum data set can be quantified for soils under a range of
management systems and the indicators can be scored using the curves. The scored
values are then combined in some way (additive, multiplied, or weighted) to form an
index value for that management system (Fig. 1.5). Index values created in a similar
way can then be compared among management systems or overtime for a particular
management system (Wienhold et al., 2004).
Figure 1.5 Conceptual relationship between soil quality minimum data sets, scoring functions, and
index values (Adapted from Wienhold et al., 2004).
Chapter 1 .
26
1.5 Soil organic matter
The importance of OM in soil has been overshadowed in the last years due to the
wide availability of synthetic fertilizers, the introduction of monoculture systems, and
large number of tillages. For a long time it was believed that the introduction in agro-
ecosystems of technical factors of production could provide fertile conditions to
ensure optimum productivity in terms of quantity and satisfactory quality, although
remaining constant over time. Today, however, the belief that fertility is restored only
with the help of technical means has been abandoned. OM is one of the main factors
of soil fertility; it has significant influence on all aspects of life in soil, on its
evolution and on the organisms living there.
It has a crucial role in soil structure due to its contributes to the aggregation of
mineral particles, promoting a correct balance among the components of soil, air,
water and solid phase, which is essential for the containment measures for erosion,
compaction and crusting (Fig. 1.6).
In agriculture, a significant content of OM in soil determines the most efficient
response to tillage as well as contributes to improve the culture conditions for crops.
OM is the source of energy for all soil microorganisms. These are very important for
their role in the demolition and transformation of organic materials and, indirectly, in
the cycle of nutrients, useful for the growth of crops.
OM explicates a defensive action against plants for several reasons: the balanced
intake of nutrients that strengthen the plant; the diversification and multiplication of
soil microorganisms that depend on the quality and quantity of OM added to the soil;
the capability of performing actions against the colonization and specialization of
pathogen strains (Vizioli, 1997). The contribution of OM to plant nutrition is direct,
as a sink of nutrients, and indirectly, by multiple actions, such as availability and
solubility of elements and functions of plant root absorption.
As carbon is the most important element for living organisms, OM is the main source
of CO2 in nature. OM is, then, an abundant reserve of all the nutrients that may be
fully assimilated by plants.

Introduction
27
Figure 1.6 Interactions of clay-organic matter complex with the others soil components, such as
roots, decomposting plant cells, microorganisms.
The drastic increase in atmospheric CO2 concentration, mainly due to change of land
use since the industrial revolution, necessitates identification of strategies for
offsetting the threat of global climate change (Lal, 2004).
Afforestation of agricultural land has been recognized to be an effective tool to
mitigate elevated atmospheric CO2 concentration (IPCC, 2000; Lal, 2005; Laganière
et al., 2010). A change in land use from agriculture to forestry can enable the
development of a larger biomass with a longer rotation and sequester C in growing
biomass (Vesterdal et al. 2002). However, compared with C sequestered in biomass,
C sequestered in soils is difficult to be quantified (Teklay and Chang, 2006) and may
Chapter 1 .
28
vary with many factors such as previous land use, tree species planted, soil
properties, preplanting disturbance, stand age, climate zone and methodological
approaches (Richter et al., 1999; Guo and Gifford, 2002; Paul et al., 2002; Vesterdal
et al., 2002; Peichl and Arain, 2006; Morris et al., 2007; Ritter, 2007; Hu et al., 2008;
Berthrong et al., 2009; Laganière et al., 2010). As carbon stored in soils accounts for
over two-thirds of the C in forest ecosystems (Dixon et al., 1994) and is more stable
than that stored in living plant biomass (Vesterdal et al., 2002; Chen et al., 2005;
Laganière et al., 2010), a better knowledge of dynamics of soil organic carbon (SOC)
stock following afforestation of agricultural land is needed.
High CO2 levels in the atmosphere determine serious atmospheric changes, while the
increase of soil OM stocks in agroecosystems could potentially help mitigate the
atmospheric changes by increasing soil C sequestration, while simultaneously
improving soil productivity (Nissen and Wander, 2003). Increased sequestration in an
annual crop system would be mainly achieved through stabilization of increased plant
inputs in soil OM (Lal, 2004; Six et al., 2002). There is gathering evidence that
increased inputs will not always result in soil OM accrual, and that the influence of
elevated [CO2] on soil organic carbon stocks varies as a consequence of plant type
and soil nutrient status. According to van Groenigen et al. (2006), increases in soil
OM levels are restricted when soil nitrogen (N) supply is limiting. When nutrients are
limiting, plant-microbe competition for N can accelerate soil OM decay and
ultimately degrade soils even if as plant growth increases under elevated [CO2]
(Barron-Gafford et al., 2005).
Equally important, is the OM capability of improving the cation exchange capacity
(CEC). In fact, OM is characterized by several functional groups, and phenolic acids,
which can hold and then slowly release nutritional reserves, readily assimilated by
plants. About the availability of elements, it cannot be neglected the chelating action
explicated by OM with the reversible sequestration of some elements by organic
molecules, useful to overcome the risks associated with lack of antagonism or
reaction of the soil.
Introduction
29
An important example of protection by OM, useful for cultivation, is the link-bridge
between iron and aluminium, created by organic substances with phosphates. In
phosphorus deficiency, plants increase the concentration of chelating agents in their
exudates. These latter remove the metals from OM and make up bridges with
phosphates which go into soil solution, thus becoming available.
The microbial activity is strongly influenced by the presence of OM in soils. The
concomitant presence of microorganisms and OM explicates a positive action against
the solubilization of some poorly soluble, mineral elements.
An usual case in many soils of central Italy, characterized by alkaline pH and
presence of calcium, is the lack of availability of important elements such as
phosphorus and potassium. The reaction between carbon dioxide, produced by
respiration of microorganisms that attack the OM, with soil water and limestone
shifts the balance toward calcium carbonate, which is made less stable. A greater
amount of OM in soil increases the microbial activity, and then the production of
carbon dioxide thus shifting to right the reaction and favouring the solubility of some
nutrients. By contrast, a smaller amount of OM leads to less microbial activity and
more likely to the insolubility of some elements.
Another important contribution of OM derives from humic acids. They are the main
and rich components of soil OM and their contribution to the functions of OM is
essential. Consequently, the amount, the characteristics, and especially, the quality of
humic acids are considered as important indicators of the of soil OM quality.
Humic acids explicate an hormone-like action, more commonly known as bio-
stimulating action. Basically, these actions can relate to the influence of:
1. humic acids on enzymatic activities and therefore, once again, on the
availability of nutrients, as many macromolecules could not be treated if they
were not rapidly hydrolysed by enzymes present in OM;
2. OM on all the physiological activities of plants such as germination, rooting,
root growth, etc..
Chapter 1 .
30
Equally important is the ability of humic acids to hold water. Humic substances in
fact, hold water up to 20 times their weight, are capable to stabilize the soil pH by
controlling the delicate balance of chemical and biological agents, and have the
ability to interact with pesticides and xenobiotic substances thus influencing their
bioactivity, persistence, and biodegradability.
Because of OM important functions, it is clear that its decrease can have a significant
impact on the fertility and quality of soil (Costantini, 1995). Therefore, it is essential
to maintain an adequate level of OM through the use of organic amendments such as
manure (Bastian and Ryan, 1986).
For these reasons, the understanding of the mechanisms involved in the interaction
between OM and the other chemicals in the environment is of great importance.
Therefore, a better knowledge of the chemical and physicochemical properties of
OM, and in particular of humic acids, will contribute to understand the mechanisms
that control an optimum supply of nutrients for crops, as well as many soil physical
and chemical characteristics as affected by the organic amendment application.
The key methods to study soil OM, and its humic fractions, are based on the
characterization of its elemental and functional composition by spectroscopic
techniques. They are modern non-destructive analytical methods. Only small sample
amounts are required for the analysis. Most of them are experimental, simple and do
not require special manipulative skills. Main techniques are: ultraviolet-visible
absorption spectroscopy, fluorescence spectroscopy, Fourier transform infrared (FT-
IR) spectroscopy, nuclear magnetic resonance (NMR) spectroscopy.
1.6 Soil enzymes
Nutrient cycling in soils involves biochemical, chemical and physico-chemical
reactions, with biochemical processes being mediated by microorganisms, plant
roots, and soil animals. It is well known that all biochemical reactions are catalysed
by enzymes, which are proteins that act as catalysts without undergoing permanent
alteration and causing chemical reactions to proceed at faster rates. In addition, they
Introduction
31
are specific for the types of chemical reactions in which they participate (Tabatabai,
1994).
Burns (1982) classified soil enzymes according to their location in soil (Fig. 1.7).
Three main enzyme categories (termed biotic enzymes) are associated with viable
proliferating cells. They are located: i) intracellularly in cell cytoplasm, ii) in the
periplasmic space, and iii) at the outer cell surfaces. Enzymes in the soil solution are
generally short-lived because they are readily inactivated by physical adsorption,
denaturation or degradation (Burns, 1986).
The remaining categories are broadly characterized as abiontic (Skujinš, 1976).
Abiontic enzymes are those exclusive of live cells that include enzymes excreted by
living cells during cell growth and division from extant or lysed cells but whose
original functional location was on or within the cell. Additionally, abiontic enzymes
can exist as stabilized enzymes in two locations: adsorbed to internal or external clay
surfaces, and complexed with humic colloids through adsorption, entrapment, or
copolymerization during humic matter genesis (Boyd and Mortland, 1990).
Enzymes associated with humic substances and, to a lesser extent, with clay
particulates are protected against thermal denaturation, proteolysis, dehydration or
decomposition. They are part of a persistent extracellular enzyme pool that is
independent of the existing microbiota (Burns, 1982; Sarkar and Burns, 1984; Miller
and Dick, 1995). The humic-enzyme fractions retain the original properties of the
enzymes (Busto and Perez-Mateos, 1995) as stable enzyme-organic matter complexes
and they were found to allow diffusion of substrates to the active enzyme site (Burns,
1982). Therefore, soil can be considered as a sink and source of indigenous and
persistent enzymatic capacity, which is independent of current or recent microbial
and plant activity (Galstian, 1974; Burns, 1986; Lähdesmäki and Piispanen, 1992;
Busto and Perez-Mateos, 1995). Moreover, the enzymatic activity of a soil is
conditioned by land use history, since enzymes are produced by living organisms
which contribute to the biological soil formation.

Chapter 1 .
32
Figure 1.7 Soil enzymes location. (i) Intracellular enzymes, (ii) periplasmic enzymes, (iii) enzymes
attached to outer surface of cell membranes, (iv) enzymes released during cell growth and division,
(v) enzymes within non-proliferating cells (spores, cysts, seeds, endospores), (vi) enzymes attached
to dead cells and cell debris, (vii) enzymes leaking from intact cells or released from lysed cells
(viii), enzymes temporarily associated in enzyme-substrate complexes, (ix) enzymes adsorbed to
surfaces of clay minerals, (x) enzymes complexed with humic colloids (according to Burns, 1982
and Nannipieri, 1994).
The activity and stability of enzymes in soil is regulated by pH (Frankenberger and
Johanson, 1983; Trasar-Cepeda and Gil-Sotres, 1987; Dick et al., 1988), microbial
biomass (Häussling and Marschner, 1989; Saffigna et al., 1989; Carter, 1991;
Srivastava and Singh, 1991), vegetation (Juma and Tabatabai, 1978; Harrison, 1983;
Perucci et al., 1984; Helal and Sauerbeck, 1987; Tarafdar and Jungk, 1987), soil and
crop management practices (Perucci and Scarponi, 1985; Beck, 1990; Martens et al.,
1992; Kandeler and Eder, 1993), soil OM (Juma and Tabatabai, 1978; Chhonkar and
Tarafdar, 1984; Sparling et al., 1986), and soil moisture content (Harrison, 1983;
West et al., 1988a,b).
Introduction
33
Enzyme activities are important indicators of soil biological activity because they are
involved in the dynamics of soil nutrient cycling and energy transfer. Indeed, they
reflect the intensity and direction of biochemical processes in the soil matrix. Hence,
their activity indicates the biological capacity of a soil to carry out the biochemical
processes which are important to maintaining the soil fertility (Galstian, 1974; Dkhar
and Mishra, 1983; Burns, 1986; Garcia et al., 1994), as soil fertility depends not only
on the nutrient status and availability but also on the turnover of N, P and other
nutrients (Lopez-Hernandez et al., 1989).
Actually, enzymatic processes are closely associated with soil fertility as they
mediate the conversion of unavailable forms of nutrients to forms that are readily
assimilable by plants and microbial biomass (Sarathchandra et al., 1984; Dick et al.,
1988; Sarkar et al., 1989; Dick, 1992; Martens et al., 1992; Sinsabaugh, 1994). Soil
enzymes also participate in the decomposition and synthesis of organic substances
and are important for the formation of recalcitrant organic molecules (Galstian, 1974;
Martens et al., 1992).
As enzymes do not react readily to environmental changes respect to soil microbial
biomass, their activity is a more stable indicator of biological processes (Galstian,
1974).
1.6.1 Functions carried out by soil enzymes
Soil enzymes perform many functions which can be summarized as follows (Fig.
1.8):
• a key role in the process of decomposition of OM,
• catalysis of many reactions necessary for life processes of microorganisms,
• contribution to the stabilization of soil structure,
• make nutrients available for plants that appear to be immobilized in the soil,
• degradation of substrates too large or insoluble, making them available to the
microorganisms that would otherwise not be able to use them.
In soil, most common enzyme activities belong essentially to four classes:

Chapter 1 .
34
• oxidoreductases,
• lyases,
• hydrolases,
• transferases.
Among them, hydrolases and oxidoreductases are the most common. Hydrolytic
enzymes, such as polysaccharidases and proteinases, responsible of the degradation
of carbohydrates and proteins, respectively play an important role in ensuring the
presence of monomeric products essential to the biological cycles of carbon and
nitrogen.
Figure 1.8 The soil as a bioreactor: a “hard-core” of interacting properties from microbial,
biochemical and physico-chemical domains as a function of time and soil depth (Adapted from Aon
and Colaneri, 2001).
Similarly, phosphatases and sulphatases, that hydrolyze organic phosphates and
sulphur compounds, respectively, producing inorganic phosphorus and sulphur, carry
Introduction
35
out essential biochemical functions, because they provide to plants and
microorganisms both phosphorus and sulfur in available forms. Dehydrogenases,
mainly intracellular enzymes, may give some information on the biological activity
of soil microbial populations. Glycosidases are widely distributed in nature and their
work reflects the effects of soil management. The enzyme β-glucosidase catalyzes the
hydrolysis of cellobiose to glucose (last step of the catabolic way of cellulose) and is
therefore important for the carbon cycle and the "quality" of soil in general. Invertase,
another hydrolytic enzyme, is involved in the cleavage of sucrose into glucose and
fructose and its presence in a soil is placed in relation to microbial activity, that‟s
why activity was proposed as an index of fertility.
1.6.2 Factors affecting enzyme activities in soil
There are many causes that may alter the enzymatic activity of soil (Gianfreda and
Bollag, 1996). Some of them are linked to natural variations in soil, while others are
due to human activity and practices of soil management. Therefore, they can be
grouped in natural and anthropic factors.
1.6.2.1 Natural factors
Seasonal changes
Several studies were carried out on the correlation between seasonal variations and
the activity of enzymes in soil. These studies showed that during the warmer seasons
(spring, summer) microbial populations are at their maximum development. Since the
main source of soil enzymes is represented precisely by microorganisms, it follows
that also the levels of enzyme activities are usually higher during the same period. An
example is arylsulphatase that showed a peak of activity in summer (Niemi et al.,
2005). Similarly, the activity of dehydrogenase is higher in spring due to increased
bacterial and fungal proliferation, while urease showed two peaks of activity during
Chapter 1 .
36
the months of May and September and a reduction in the month of June (Kumar et
al., 1992).
Humidity and salinity
Another factor that influences the soil enzyme activities is humidity. Some authors
have shown that the activity of dehydrogenase increases with the level of humidity
(Gianfreda and Bollag, 1996), while enzymes such as urease and phosphatase express
their maximum activity level in the optimal conditions of humidity values at 60%
capacity field. The same phosphatase and arylsulphatase show an exponential
reduction of their activity when the soil reaches moisture level of dry soil (Hyvönen
and Persson, 1990).
Excess of salts in soil causes a high osmotic pressure of soil solution that alters the
development of crops and microorganisms and enzyme activities. It is not, however,
possible to generalize because enzymes show different behaviours with regard to
salinity. For example, urease and phosphatase activities decrease with increasing
salinity due to changes in the osmotic potential of soil (Iftikhar and Khan, 1988).
Distribution of the profile
Soil is divided into horizons with different physical, chemical and biological
characteristics. These differences are reflected in different enzyme activity levels of
soils. In fact, several studies have demonstrated that dehydrogenase, urease and
phosphatase are, usually, higher in the organic horizon or in the first few centimeters
of soil and decrease with depth (Taylor, 2001). This finding can be simply explained
by the strong link between the organic component and the enzymatic activity, thus
determining a gradual decrease of microbial population with depth.
Niemi et al. (2005) found, for example, that the activity of β-glucosidase and β-
xylosidase subside strongly with increasing depth, as well as α-glucosidase activity,
even if with less impact. Bergstrom and Monreal (1998) and Bergstrom et al. (1998,
2000) found that arylsulphatase activity decreased with increasing depth and water

Introduction
37
content. In other studies it was observed that urease activity was higher in samples of
the surface layers than deeper.
Soil physical and chemical properties
There are several soil physical and chemical properties that influence the enzyme
activities, in particular pH, particle size, total organic C and N.
The enzymes most affected by soil physical and chemical conditions are involved in
nutrient cycling (C, N, P).
The enzymes have maximum activity at a defined pH optimum (Gianfreda and
Bollag, 1996), because at different pHs the structure of the active site of the enzyme
changes and this decreases or inhibits the catalytic activity. For example,
phosphatases are strongly correlated to soil pH so much that they can be
distinguished in acidic and alkaline phosphatases. In acidic soils, phosphatase activity
is expressed as acid phosphatase, while in alkaline soils alkaline phosphatases
prevails. The liming increases the activity of many enzymes in the long-term
indicating a positive correlation between enzyme activities (except acid phosphatase)
and the soil pH (Ekenler and Tabatabai, 2003b).
Regard to texture, sandy soils have a less numerous and diversity of microbial
biomass and enzyme activities than loam soils having a good structure, good porosity
and good OM content.
In addition, microbial population and enzyme activities showed a strong sensitivity to
the concentration of organic carbon (Powlson et al., 1987, Bergstrom et al., 1998).
Aon and Colanieri (2001) found a quite strong correlation (r=0.68) between
dehydrogenase activity and percentage of organic carbon. Urease activity increases
with decreasing the C/N ratio, and is negatively correlated with the percentage of
organic carbon, but positively with the amount of total nitrogen, while β-glucosidase
strongly influenced by the content of total nitrogen, shows no correlation with
organic carbon.
Chapter 1 .
38
Clay minerals
When the enzymes, from any source, arrive to the soil solution, they are readily
immobilized on mineral and/or organic colloids. Adsorption is achieved through
various kinds of interactions such as electrostatic interactions, hydrogen bonds, Van
der Waals forces. It usually involves changes in enzyme activity that is reduced or
inhibited. This implies that the catalytic activity of the adsorbed enzyme is
conditioned not only by the rate constants of the enzyme itself and the concentrations
of the substrate, but also by the probability of contact between enzyme and substrate
that it is minimized. In addition, the active site can be hidden due to the
immobilization of protein molecules on colloidal particles, and this somehow reduces
the efficiency of the enzyme. Another consequence of adsorption on clay minerals, or
in general of immobilization on soil colloids, is generally a shift of optimal pH at
which occurs the maximum catalytic activity of the enzyme (Demanèche et al.,
2009).
Despite these problems, adsorbed enzymes have a range of benefits including a high
resistance to microbial degradation and stability to heat denaturation.
Humic components
Soil extracellular enzymes are firmly bound to soil humic substances and they form
complexes called "humo-enzymatic”. The humo-enzymatic complexes are very
important because they are an essential reserve of matter and energy of soil. In fact,
being immobilized on the humic fraction, they are active even when conditions are
prohibitive for the microorganisms. These humo-enzymatic complexes, called geo-
enzyme or stable nucleus, have been extracted and purified from different soil types
of the Mediterranean area (Nannipieri, 1994) and have been proposed as the latest
biological defences of the soil exposed to a process of irreversible degradation
(desertification).
The component of humic soil with biological activity can be considered an optimal
indicator of the level of land degradation. It is related to soil resilience, and can
Introduction
39
indicate the ability of soil to be recovered. The humo-enzymatic complexes can be
considered a "recorder" in the history of the earth: they shall reflect the past, the
presence of humic complexes, and the present, the catalytic activity for the role they
play and their importance in nutrient cycling (Masciandaro et al., 1998). They
represent a "transition point" between the chemical and microbiological soil
(Ceccanti et al., 1997).
Biomass
Although plants and animals contribute significantly to the enzymatic activity of soil,
enzymes of microbial origin are considered the most important so that microbial
activity is considered an index of fertility.
Some authors have attempted to determine only the contribution of bacteria and fungi
to the whole enzyme activity of soil. It was observed, for example, that urease and
phosphatase activities are related to bacterial, but not to fungal biomass (Nannipieri et
al., 1979). There is also a positive correlation between dehydrogenase and fungal
populations and between urease activity and bacterial population, but this correlation
is valid only at low altitudes (Kumar et al., 1992). These relationships are dependent
on seasonal changes, type of vegetation cover and crop cultivation, the latter
indirectly affecting enzyme activity because of their direct action on microbial
population.
1.6.2.2 Anthropic factors
Human activities cause constant changes to the soil and thus to all enzymatic
activities that are present in it. The human factors, interacting with the natural factors,
can significantly influence the activity of enzymes.
Acid rains
Acid rains are called the "plague invisible" of the industrial era and are considered
one of the most serious environmental problems of our time. This phenomenon is
Chapter 1 .
40
caused mainly by the rising of atmospheric gaseous components such as sulfur
dioxide (SO2) and sulfur trioxide (SO3), carbon monoxide (CO), nitrogen dioxide
(NO2) and carbon dioxide (CO2) from industrial activities and combustion. These
gases can be transformed in a few days in acid rains by various reactions such as acid
combination with water (H2O) or with the hydroxyl radical OH¯. These acids are then
transported by rain on the earth's surface, thus increasing the concentration of
hydrogen ions in soil.
Acid rains cause acidification of soil reducing the presence and availability of
nutrients for plants. In addition, the lowering of soil pH mobilizes aluminum (usually
enclosed in the silicate crystal lattice of soil), so it goes into the soil solution with
severe poisoning (and consequent economic losses) to crops and to soil
microorganisms. The deterioration caused by acid rains disturbs the soil enzymatic
activity as it increases the solubility of some metals (Ni, Fe, Zn), and consequently
reduces the stability of the protein or increases the solubility and ionization of
substrates and enzyme cofactors. The degree of alteration of enzymatic activity by
acid rains depends on the time of soil exposure to such precipitation; for example,
brief exposure for dehydrogenase, urease and phosphatase does not appear lead to
detectable changes, which are instead observed for longer exposures (Bitton and
Boylan, 1985).
Fires
In literature, few and discordant are the data on the effect of fires on the activities of
enzymes in soil. Skujins (1967) reports a total inactivation of enzymes in soils
affected by fire and the request for a period of about 10 years to regain enzymatic
activity values comparable to those present before the fire. Rutigliano et al. (1995)
describe a reduced activity of dehydrogenase, phosphatase and sulphatase in soils
covered by superficial and deep fires even after 8 years from the fire event.
Arianoutsou-Faraggitaki and Margaris (1982), by contrast, found no differences of
dehydrogenase activity between burned and not burned soils. Boerner et al. (2000)
Introduction
41
showed a reduced activity of acid phosphatase and chitinase in forest soils of
southern Ohio by fire but not for phenoloxidase, that, on the contrary, increased its
activity in the burned soil.
The passage of fire in an ecosystem influences the distribution and activity of
populations of microorganisms in soil and consequently soil enzyme activity. The
magnitude of fire effect depends on both the affected organisms and the fire intensity.
In fact, very intense fires may temporarily sterilize the soil, while little intense fires
may change only slightly its biological activity (Renbuss et al., 1973).
Soil management
Soil can be easily disturbed by inappropriate farming managements. The use of
pesticides, monoculture, continuous tillage are all factors that lead to the loss of soil
fertility and quality, which reflects negatively on the balance of vegetation and
consequently on the microbial and enzymatic activities.
Despite the many information on enzymatic activities of the different soil
managements, the results obtained are often disputed (Dick, 1992; Gil-Sotres et al.,
2005). Many researchers have pointed out that tillage determs an increase of
enzymatic activities in agricultural soils due to the exposure of new surfaces as soil
aggregates are broken up (Dick, 1984; Khan, 1996; Latif et al., 1992; McGill et al.,
1986), whereas other researchers have reported a decrease in enzymatic activities due
to the decrease in OM content as a consequence of the tillage (Carter, 1986; Dick,
1994; Jensen et al., 1996).
The use of mineral fertilizers and organic amendments has also been reported to have
contrary effects in these soils. In according to the literature use of organic
amendments increases the biochemical activity of soil due to the addition of organic
materials and microorganisms (Dick et al., 1988; Jenkinson, 1990; Kandeler et al.,
1999), whereas others state that the activity decreases, particularly when poor quality
manure is used (Garcìa et al., 1992; Perucci et al., 1984; Schipper and Sparling,
2000). Regarding inorganic fertilizers, although it is considered that the presence of
Chapter 1 .
42
readily available inorganic nutrients inhibits enzymes synthesis in soil (Dick, 1992;
Olander and Vitousek, 2000), some authors consider that the same presence may
increase the biochemical activity of a soil by stimulating plant growth and the
secretion of enzymes by roots (Lynch and Panting, 1980).
Thus, grass cutting determines an increase of soil biochemical activity due to the
resulting increase of dead roots amount (Holland, 1995; Mawdsley and Bardgett,
1997), or may decrease this activity due to the decrease in root exudates (Northup et
al., 1999), or may have no effect at all on soil biochemical properties (Kuzyakov et
al., 2002; Wardle and Barker, 1997). Similar contradictory effects have been reported
on the use of grazing animals. Thus, some authors have showed that grazing may
determine an increase of the microbial activity due to the presence of the animals‟
excreta (Haynes and Williams, 1999; Zacheis et al., 2002), and others that it may
cause a decrease in microbial activity, normally caused to the degradation of the soil
structure by trampling (Conant et al., 2001; Cao et al., 2004).
The only management that doesn't produce contradictory effects is the use of OM. As
reported above soil OM is one of the important soil properties that may considerably
influence the activities of soil enzymes (Gianfreda and Bollag, 1996). Therefore,
solid organic amendments could enhance soil enzyme activities by increasing soil
OM and thus the microbial biomass (Crecchio et al., 2004; Acosta-Martinez and
Harmel, 2006). The quality of soil OM can affect the composition and relative
abundance of soil enzymes (Shi et al., 2006). For example, catalase activities of soils
are based on the rates of release of oxygen from added hydrogen peroxide or on the
recoveries of hydrogen peroxide (Wang and Lu, 2006). Zhao et al., (2009) showed
that application of straw generated higher activity of invertase and catalase than
manure treatment, which means higher redox-cycling in straw treatment.
Lagomarsino et al. (2009) demonstrated that not all studied enzymes (acid
phosphatase, arylsulphatase, dehydrogenase and -glucosidase) are valid indicators
of changes under organic management. For instance, acid phosphatase and
arylsulphatase activities did not respond to the different management, although other

Introduction
43
studies reported significant changes of acid phosphatase (Pascual et al., 1999;
Monokrousos et al., 2006). Arylsulphatase did not show significant variations also in
the study of Mijangos et al. (2006). Dehydrogenase activity appeared to be a sensitive
indicator of the impact of organic management in the studies of Mijangos et al.
(2006) and Marinari et al. (2006). Conversely, -glucosidase activity resulted to be
suitable indicator of changes in C cycling.
Pesticides
Pesticides have a role in the current agriculture, being used to protect crops from
pests (especially insects and mites) and pathogens (bacteria, fungi, viruses), to control
the growth of weeds, and to ensure the achievement of high standards of quality of
agricultural products.
Pesticides are, however, composed by toxic substances, and their improper use may
determine risks and dangers to human and animal health. Their use has been largely
confirmed to have an impact on physical and chemical properties and on
microorganism of soils.
Pesticides arrive to the soil through direct application on the vegetation and indirect
applications in the form of industrial wastes, municipal, or accidental release. Once
introduced into the environment, pesticides are subjected to abiotic degradation
processes (photolytic or chemical) and to biotic or biological processes. The
photolytic degradation generally occurs when the pesticide molecule is irradiated by
sunlight, chemical degradation occurs when the molecule is chemically unstable in
the environment in which it is located, while the biotic degradation, defined by the
term "biodegradation", is due to changes made by living organisms.
Typically, pesticides are used in optimal doses to not causing serious damage to
microorganisms and to not alter the enzymatic activity (Schaffer, 1994), but if used in
high doses they inhibit enzymatic activity. The negative effects are due to both a
direct interaction pesticide-enzyme and also to an indirect action on edaphic
microorganisms.
Chapter 1 .
44
A study was carried out on phosphatase and dehydrogenase activity in a soil amended
with compost or dissolved OM and then contaminated with different concentrations
of pentachlorophenol (PCP, used in the past time in agriculture). Results showed that
soil enzymatic activities responded differently to various concentrations of PCP
(Scelza et al., 2008). The effects of pesticides on enzyme activities, in fact, depend
not only on the type of enzyme and soil but also on the type and concentration of
pesticide.
Fertilizers
In general, it is clear that biochemical and biological properties of soil may be
affected by fertilization, whether organic or mineral, showing a close correlation
between the kind of amendments and properties of soil (Marinari et al., 2001).
The activities of β-glucosidase and protease were significantly influenced by repeated
applications of inorganic nitrogen, and were stimulated by application of organic
manure (Fauci and Dick, 1994). Dick et al. (1988) found that increasing the
percentage of fertilizers based on ammonia a decrease of amidase and urease
activities (both enzymes involved in nitrogen cycle) occurred. In contrast, the activity
of other enzymes not directly involved in the nitrogen cycle, such as, for example,
arylsulphatase and β-glucosidase, were not influenced. This mechanism was
explained by assuming that these enzymes are inhibited by ammonia.
The supply of phosphorus-based fertilizers depressed phosphatase activity in both
agricultural (Mathur and Rayment, 1977, Spiers and McGill, 1979) and forestry
(Clarholm, 1993) systems. This negative action is probably linked to the type of soil
as shown by Mathur and Rayment (1977). Indeed, in soils with low OM content, P
fertilization increased phosphatase activity, while in soils with a high OM content
fertilization did not cause any modification of that activity. Inhibition of phosphatase
activity was correlated by Chunderova and Zubets (1969) to high levels of PO4-2
in
the soil solution. Phosphates may inhibit the synthesis of microbial phosphatase.
Introduction
45
Moreover, orthophosphate behaves as competitive inhibitor of acid and alkaline
phosphatase (Juma and Tabatabai, 1978).
The current problem of conventional agriculture is the continuous depletion of OM
due to intensive farming and non-optimal use of mineral fertilizers, herbicides and
pesticides. To overcome this problem, approaches using organic manure were tried.
The use of OM produced from municipal solid wastes may lead to both positive and
negative effects, depending on its composition and used doses. (Marcote et al., 2001,
Lakhdar et al., 2010). In general, an increase in all biological properties of soil is
observed after the use of OM as fertilizer (Albiac et al., 2000). The use of compost
also leads to a better development of the whole microflora, and beneficial fungi such
as mycorrhizae, resulting in beneficial effects on crops (Perner et al., 2007).
Heavy metals
Heavy metals can reach the soil through the distribution of pesticides (copper,
arsenic), mineral fertilizers (many phosphate fertilizers are rich in arsenic, cadmium
and chromium), organic fertilizers (leather, roasted, etc, contain up to 3% of
chromium, as well as by products of the tanning industry), slurry (for the presence of
copper and zinc), but especially sewage sludge or compost. Once into the soil, heavy
metals may have an impact on the biotic soil constituents and enzyme activities. The
negative effects of heavy metals on soil enzymatic activities have been widely
demonstrated (Deng and Tabatabai, 1995) and the pressing issue of the continuous
enrichment of heavy metals in soils has led to exploit the potential of enzyme
activities as biochemical indicators of the quality and pollution of the soil (Alef and
Nannipieri, 1995).
1.6.3 Enzymatic activities as bioindicators
Biochemical properties of soil are an useful tool to monitor changes of microbial
biomass in soil. As already said, biochemical properties can be used as "early
indicators" of disturbances that degrade soil as they are more sensitive to changes
Chapter 1 .
46
induced by anthropic and environmental activities than chemical and physical
properties of soil as OM content (Dick, 1994). In general, biomonitoring is
continuous, inexpensive and not complicated.
Soil enzymes can be considered as “good” biological indicators of the health status of
a soil as they can perform excellent detections of conditions prevailing in soil (Dick
et al., 1988; Ceccanti and Garcia, 1994; Masciandaro et al., 1998). Indeed, they
respond quickly to physical, chemical and biological changes, are analytically simple
inexpensive, measurable, easy to understand, reliable, reproducible and scientifically
valid.
Enzymes have high specificity of recognition of their substrates, and may be able to
detect the toxicity of a mixture of pollutants whose individual concentrations are
below levels alarm. Therefore, they are important "soil sensors" and provide guidance
on the metabolic state of microbial population and soil chemical and physical
conditions. (Trasar-Cepeda et al., 2000). As a consequence, enzymatic activities
represent a suitable tool to evaluate the influence of management techniques and land
use on functional biodiversity.
Garcia et al. (1994) showed that dehydrogenase activity behaves as a good indicator
of the microbial activity of soils in semi-arid areas. In areas subject to degradation
processes, dehydrogenase activity is usually very low. In the last 20 years,
biochemical properties (hydrolytic activity of enzymes and microbial indices) were
used in many studies as indicators of soil quality in degraded environments or subject
to pollution due to the presence of hydrocarbons or heavy metals. Being biomarkers
they are also very sensitive to seasonal variables, they can be used in the comparison
of study areas subject to the same climatic conditions or in the regular monitoring of
changes induced by techniques of land management by considering a sufficiently
long period.
The limitation of these biomarkers is the lack of universal threshold values that
identify the condition of normality in a complex system like soil. This is the
consequence of the absence of standardized, universally accepted methods for the
Introduction
47
measurement of soil enzymatic activities. These limitations do not allow the
immediate identification of a disturbance seen as deviation from "normal" and the
identification of soil control is indispensable.
Chapter 1 .
48
1.7 References
Acosta-Martinez V., Harmel R.D., 2006. Soil microbial communities and enzyme
activities under various poultry litter application rates. Journal of Environmental
Quality 35:1309-1318.
Adani F., Genevini P., Ricca G., Tambone F. and E. Montoneri., 2007. Modification
of soil humic matter after 4 years of compost application. Waste Management
27:319-324.
Albiach R., Canet R., Pomares F., Ingelmo F., 2000. Microbial biomass content and
enzymatic activities after the application of organic amendments to a horticultural
soil. Bioresource Technology 75:43-48.
Alef K. and Nannipieri P., 1995. Methods in applied soil microbiology and
biochemistry. 1995 Elsevier Ltd. ISBN: 978-0-12-513840-6.
Amlinger F., Gotz B., Dreher P., Geszti J., Weissteiner C., 2003. Nitrogen in
biowaste and waste compost: dynamics of mobilization and availability a review.
European Journal of soil Biology 39:107-116.
Anderson T.H. and Domsch K.H., 1993. The metabolic quotient CO2 (qCO2) as a
specific activity parameter to assess the effects of environmental conditions, such
as pH, on the microbial biomass of forest soils. Soil Biology and Biochemistry 25:
393-395.
Andreoni V. and Gianfreda L., 2007. Bioremediation and monitoring of aromatic-
polluted habitats. Appl Microbiol Biotechnol 76:287-308.
Andrews S.S., Carroll C.R., 2001. Designing a decision tool for sustainable
agroecosystem management: soil quality assessment of a poultry litter
management case study. Ecological Applications 11:1573-1585.
Andrews S.S., Mitchell J.P., Mancinelli R., Karlen D.L., Hartz T.K., Horwath W.R.,
Pettygrove G.S., Scow K.M., Munk D.S., 2002a. On-farm assessment of soil
quality in California‟s central valley. Agronomy Journal 94:12-22.

Introduction
49
Andrews S.S., Karlen D.L., Mitchell J.P., 2002b, A comparison of soil quality
indexing methods for vegetable production systems in northern California.
Agriculture, Ecosystems and Environment 90:25-45.
Annabi M., S. Houot F. Francou M. Poitrenaud and Le Bissonnais Y., 2007. Soil
aggregate stability improvement with urban composts of different maturities. Soil
Science Society of America Journal 71:413-423.
Aon M.A., Colanieri A.C., 2001. Temporal and spatial evolution of enzymatic
activities and physico-chemical properties in an agricultural soil. Applied Soil
Ecology 18: 255-270.
Arianoutsou-Faraggitaki M., Margaris N.S., 1982. Decomposer and the fire cycle in
a phryganic (East Mediterranean) ecosystem. Microbiology of Ecology 8: 91-98.
ATTRA, National Sustainable Agriculture Information Service, Sustainable Soil
Management (Soil Systems Guide) by Preston Sullivan 2004
Azaizeh H.A., Marschner H., Römheld V.,Wittenmayer L., 1995. Effects of a
vesicular-arbuscular mycorrhizal fungus and other soil microorganisms on growth,
mineral nutrient acquisition and root exudation of soil grown maize plants.
Mycorrhiza 5:321-327.
Barron-Gafford G., Martens D., Grieve K., Biel K., Kudeyarov V., McLain J.E.T.,
Lipson D., Murthy R., 2005. Growth of eastern cottonwoods (Populus deltoides) in
elevated [CO2] stimulates stand-level respiration and rhizodeposition of
carbohydrates, accelerates soil nutrient depletion, yet stimulates above- and
belowground biomass production. Global Change Biology 11:1220-1233.
Bastian R.K., Ryan J.A., 1986. Design and management of successful land
application system. Utilization, Treatment and Disposal of Waste on Land. Soil
Science Society of America (Ed.), Inc, Madison, WI 217-234.
Beck T., 1990. Der Einfluß langjähriger Bewirtschaftungsweise auf
bodenmikrobiologische Eigenschaften. Kali-Briefe 20:17-29.
Bergstrom D.W., Monreal C.M., King D.J., 1998. Sensivity of soil enzyme activities
to conservation practices. Soil Science Society of America Journal 62:1286-1295.
Chapter 1 .
50
Bergstrom D.W., Monreal C.M., Millette, J.A., King D.J., 1998. Spatial dependence
of soil enzyme activities along a slope. Soil Science Society of America Journal
62:1302-1308.
Bergstrom D.W., Monreal C.M., Tomlin A.D., Miller J.J., 2000. Interpretation of soil
enzyme activities in a comparison of tillage practices along a topographic and
textural gradient. Canadian Journal Soil Science 80: 71-79.
Berthrong S.T., Jobbágy E.G., Jackson R.B., 2009. A global metaanalysis of soil
exchangeable cations, pH, carbon, and nitrogen with afforestation. Ecological
Applications 19:2228-2241.
Bitton G., Boylan R.A., 1985. Effect of acid precipitation on soil microbial activity.
Soil core studies. Journal of Environmental Quality 14:66-69.
Boerner R.E.J., Decker, K.L.M., Sutherland E.K., 2000. Prescribed burning effects on
soil enzyme activity in a southern Ohio hardwood: a landscape-scale analysis. Soil
Biology and Biochemistry 32:899-908.
Bonanomi G., Antignani V., Capodilupo M., Cozzolino L., D‟Ascoli R., Marzioli R.,
Puopolo G., Rao M.A., Rutigliano F.A., Scotti R., Zoina A., 2010. Assessing soil
quality under intensive cultivation and tree orchards in Southern Italy. Applied Soil
Ecology Accepted.
Boyd S.A. and Mortland M.M., 1990. Enzyme interactions with clays and clay-
organic matter complexes. In: Bollag J.M. and Stotzky G. (Eds.), Soil
Biochemistry. Marcel Dekker, Inc., New York, 6:1-28.
Brejda J.J., Karlen D.L., Smith J.L., Allan D.L., 2000a. Identification of regional soil
quality factors and indicators: II. Northern Mississippi Loess Hills and Palouse
Prairie. Soil Science Society of America Journal 64:2125-2135.
Brejda J.J., Moorman T.B., Karlen D.L., Dao T.H., 2000b. Identification of regional
soil quality factors and indicators: I. Central and Southern High Plains. Soil
Science Society of America Journal 64:2115-2124.
Introduction
51
Brejda J.J., Moorman T.B., Smith J.L., Karlen D.L., Allan D.L., Dao, T.H., 2000c.
Distribution and variability of surface soil properties at a regional scale. Soil
Science Society of America Journal 64:974-982.
Brookes P.C., 1995. The use of microbial parameters in monitoring soil pollution by
heavy metals. Biology and Fertility of Soils 19:269-279.
Burns R.G., 1982. Enzyme activity in soil: location and a possible role in microbial
activity. Soil Biology and Biochemistry 14:423-427.
Burns R.G., 1986. Interaction of enzymes with soil mineral and organic colloids. In:
Huang P.M. and Schnitzer M. (Eds.) Interactions of soil minerals and natural
organics and microbes. SSSA Special Publication No. 17, Madison, Wisconsin,
USA, 17: 429-451.
Busto M.D. and Perez-Mateos M., 1995. Extraction of humic--glucosidase fractions
from soil. Biology and Fertility of Soils 20:77-82.
Cao G., Tang Y., Mo Y., Wang Y., Li Y., Zhao X., 2004. Grazing intensity alters soil
respiration in an alpine meadow of the Tibetan plateau. Soil Biology and
Biochemistry 36:237-243.
Caravaca F. and Roldán A., 2003. Assessing changes in physical and biological
properties in a soil contaminated by oil sludges under semiarid Mediterranean
conditions. Geoderma 117:53-61.
Carpenter S.R., Caraco N.F., Correll D.L., Howarth R.W., Sharpley A.N. and Smith
V.H., 1998. Nonpoint pollution of surface waters with phosphorus and nitrogen.
Ecological Applications 8:559-568.
Carter M.R., 1991. The influence of tillage on the proportion of organic carbon and
nitrogen in the microbial biomass of medium-textured soils in a humid climate.
Biology and Fertility of Soils 11:135-139.
Carter M.R., 1986. Microbial biomass as an index for tillage-induced changes in soil
microbial properties. Soil and Tillage Research 7:29-40.
Cassman K.G. and Pingali P.L., 1995. Intensification of irrigated rice systems:
learning from the past to meet future challenges. GeoJournal 35:299-305.
Chapter 1 .
52
Cassman K.G., 1999. Ecological intensification of cereal production systems: yield
potential, soil quality, and precision agriculture. Proceedings of the National
Academy of SciencesUSA 96:5952-5959.
Ceccanti B. and Garcia C., 1994. Coupled chemical and biochemical methodologies
to characterize a composting process and the humic substances. In: Humic
Substances in the Global Environment and Implications on Human Health, ed. N.
Senesi and T.M. Miano pp.1279-1285. Elsevier, New York.
Ceccanti B, Garcia C., Nogales R., Benitez E. and Masciandaro G., 1997. Attività e
ruolo delle sostanze umiche nell' ambiente: aspetti chimico strutturali e biochimici.
Dal suolo alla pianta dalla pianta al suolo. Le sostanze umiche come base della
sostenibilità. Il convegno nazionale del capitolo italiano dell' IHSS.pp.1-9.
Centemero M. and Corti C., 2000. Caratteristiche tecniche del compost per
un‟agricoltura sostenibile. L’Informatore Agrario 6:23-39.
Chen X., Hutley L.B., Eamus D., 2005. Soil organic carbon content at a range of
north Australian tropical savana with contrasting site histories. Plant and Soil
268:161-171.
Chhonkar P.K. and Tarafdar J.C., 1984. Accumulation of phosphatases in soils.
Journal of the Indian Society of Soil Science 32:266-272.
Choi W.J. and Chang S.X., 2005. Nitrogen dynamic in co-composted drilling wastes:
Effect of compost quality and N fertilization. Soil Biology and Biochemistry
37:2297-2305.
Chunderova A.I. and Zubets T., 1969. Phosphatase activity in dernopodzolic soils.
Pochvovedeniye 11:47-53.
Ciccotti A.M., De Clauser R., Zorzi G., Cristoforetti A., Silvestri S., Jodice R.,
Gasperi F., Pinamonti F., 1988. Trasformazione in compost di residui di natura
diversa. Aspetti biochimici e microbiologici nel corso del processo. Esperienze e
ricerche XVIII. Anno 1988: pp. 75-120.
Introduction
53
Clarholm M., 1993. Microbial biomass P, labile P, and acid phosphatase activity in
the humus layer of a spruce forest, after repeated addition of fertilizers. Biology
and Fertility of Soils 16:287-292.
Clark R.B. and Zeto S.K., 2000. Mineral acquisition by arbuscular mycorrhizal
plants. Journal of Plant Nutrition 23:867-902.
Conant R.T., Paustian K., Elliot E.T., 2001. Grassland management and conversion
into grasslands: effects on soil carbon. Ecological Applications 11:343-355.
Costantini E., 1995. Sostanza organica: conti e bilanci. Agricoltura biologica, suppl.
al Notiziario ERSA n. 5, IX-X/95.
Crecchio C., Curci M., Pizzigallo M.D.R., Ricciuti P., 2004. Effects of municipal
solid waste compost amendments on soil enzyme activities and bacterial genetic
diversity. Soil Biology and Biochemistry 36:1595-1605.
Crippa L. and Zaccheo P. 1995. Effect of composting on short-term transformations
in soil of 15N-labelled plant residues. Soil Biology and Biochemistry 27:247-250.
Demanèche S., Chapel J.P., Monrozier L.J., Quiquampoix H., 2009. Dissimilar pH-
dependent adsorption features of bovine serum albumin and -chymotrypsin on
mica probed by AFM. Colloids and Surfaces B: Biointerfaces 70:226-231.
Deng S., Tabatabai M.A., 1995. "Cellulase activity of soils: effects of trace
elements". Soil Biology and Biochemistry 27:977-979.
Dick W.A., 1984. Influence of long-term tillage and crop rotation combinations on
soil enzyme activities. Soil Science Society of America Journal 48:569- 574.
Dick R.P., 1992. A review: Long-term effects of agricultural systems on soil
biochemical and microbial parameters. Agriculture Ecosystems and Environment
40:25-36.
Dick R.P., 1994. Soil enzyme activities as indicators of soil quality. In: Doran J.W.,
Coleman D.C., Bezdicek D.F., Stewart B.A. (Eds.) Defining Soil Quality for a
Sustainable Environment. Soil Science Society of America Special Publication No.
35, Madison, Winsconsin, pp. 107-124.
Chapter 1 .
54
Dick R.P., Rasmussen P.E., Kerle E.A., 1988. Influence of long-term residue
management on soil enzyme activities in relation to soil chemical properties of a
wheat fallow system. Biology and Fertility of Soils, 6:159-164.
Dixon R.K., Brown S., Houghton R.A., Solomon A.M., Trexler M.C., Wisniewski J.,
1994. Carbon pools and flux of global forest ecosystems. Science 263:185-190
Dkhar M.S. and Mishra R.R., 1983. Dehydrogenase and urease activities of maize
(Zea mays L.) field soils. Plant and Soil 70:327-333.
Doran J.W. and Safley M., 1997. Defining and assessing soil health and sustainable
productivity. In: Pankhurst C., Doube B.M., Gupta V. (Eds.) Biological Indicators
of Soil Health. CAB International, Wallingford, pp. 1-28.
Doran J.W. and Parkin T.B., 1994. Defining and assessing soil quality. In: Defining
Soil Quality or a Sustainable Environment. Doran J.W., Coleman D.C., Bezdicek
D.F. and Stewart B.A. (Eds.), SSSA Inc Madison, USA.
Doran J.W., Sarrantonio M., Liebig M.A., 1996. Soil health and sustainability. In:
Sparks D.L. (Ed.) Advances in Agronomy. Academic Press, New York, 56:1-54.
Edwards C.A., and Burrows I., 1988. The potential of earthworm composts as plant
growth media. Earthworms in Waste and Environmental Management p. 211-219.
Ekenler M., Tabatabai M.A., 2003b. Responses of phosphatases and arylsulfatase in
soil to liming and tillage systems. Journalof Plant Nutrition and Soil Science
166:281-290.
Elliot E. T., 1997. Rationale for developing bioindicators of soil heath. In Biological
Indicators of Soil Health, Pankhurst C. E., Doube B. M., Gupta V. V. S. R. (Eds)
CAB International, wellington, pp. 49-78.
Elsgaard L., Petersen S.O., Debosz K., 2001. Effect and risk assessment of linear
alkylbenzenesulfonate (LAS) in agricultural soil. 2. Effect on soil microbiology as
influenced by sewage sludge and incubation time. Environmental Toxicology and
Chemistry, 20:1664-1672.
Faber B.A., Zasoski R.J., Burau R.G., Uriu K., 1990. Zinc uptake by corn as affected
by vesicular-arbuscular mycorrhizae. Plant and Soil 129:121-130.
Introduction
55
Fauci M.F. and Dick, R.P., 1994. Soil microbial dynamics: short- and long-term
effects of organic and inorganic nitrogen. Soil Science Society of America Journal
58:801-806.
Felipò M.T., 1996. Compost as source of organic matter in Mediterranean soils. Pp
402-412. In: de Bertoldi, M; Sequi, P, Lemmes, B; Papi, T (eds.), The science of
composting. Vol 2. Blackie Academic and Professional, UK.
Food and Agriculture Organization of the United Nations (FAO), 2001. FAO
Statistical Databases <http://apps.fao.org/>.
Frankenberger W.T. and Johanson J.B., 1983. Influence of crude oil and refined
petroleum products on soil dehydrogenase activity. Journal of Environmental
Quality 11:602-607.
Gallardo-Lara F. and Nogales R., 1987. Effect of the application of town refuse
compost on the soil-plant system: a review. Biological Wastes, 19:35-62.
Galstian, A.S. 1974. Enzymatic activity of soils. Geoderma 12:43-48.
Garcìa C., Hernàndez T., Costa F., Ceccanti B., Ciardi C., 1992. Changes in ATP
content, enzyme activity and inorganic nitrogen species during composting of
organic wastes. Canadian Journal of Soil Science 72:243-253.
Garcia C., Hernandez T., Costa F., 1994. Microbial activity in soils under
Mediterranean environmental conditions. Soil Biology and Biochemistry 26:1185-
1191.
George E., Marschner H., Jakobsen I., 1995. Role of arbuscular mycorrhizal fungi in
uptake of phosphorus and nitrogen from soil. Critical Reviews in
Biotechnology15:257-270.
Gianfreda L., Bollag J-M., 1996. Influence of natural and anthropogenic factor on
enzyme activity in soil. In: Stotzky G., Bollag J-M (Eds.). Soil Biochemistry, vol.
9. Marcel Dekker, New York, pp. 123-194.
Gil-Sotres F., Trasar-Cepeda C., Leirós M.C., Seoane S., 2005. Different approaches
to evaluating soil quality using biochemical properties. Soil Biology and
Biochemistry 37:877-887.
Chapter 1 .
56
Gomez A.A., Swete Kelly D.E., Syers J.K., Coughlan K.J. 1996 Measuring
sustainability of agricultural systems at the farm level. In Doran JW, Jones AJ, eds.
Methods for Assessing Soil Quality. Spec. Publ. No. 49. Madison, WI: Soil
Science Society of America Journal, pp. 401-409.
Griffith B.S., Bonkowski M., Roy J., Ritz K., 2001. Functional stability, substrate
utilisation and biological indicators of soils following environmental impacts.
Applied Soil Ecology 16:49-61.
Guo L.B., Gifford R.M., 2002. Soil carbon stocks and land use change: a meta
analysis. Global Change Biology 8:345-360
Harrison A.F., 1983. Relationship between intensity of phosphatase activity and
physico-chemical properties in woodland soils. Soil Biology and Biochemistry 15:
93-99.
Häussling M. and Marschner H., 1989. Organic and inorganic soil phosphates and
acid phosphatase activity in the rhizosphere of 80-year-old Norway spruce (Picea
abies (L.) Karst.) trees. Biology and Fertility of Soils 8:128-133.
Haynes R.J., Williams P.H., 1999. Influence of stock camping behaviour on the soil
microbiological and biochemical properties of grazed pastoral soils. Biology and
Fertility of Soils 28:253-258.
Hector A.B. et al., 1999. Plant diversity and productivity experiments in European
grasslands. Science 286:1123-1127.
Helal H.M. and Sauerbeck D., 1987. Phosphatase-Aktivität von Pflanzenwurzeln und
Böden in Abhängigkeit von der P-Versorgung. VDLUFA 23:195-201.
Hyvönen R. and Persson T., 1990. Effects of acidification and liming on feeding
groups of nematodes in coniferous forest soils. Biology and Fertility of Soils9:205-
210.
Hillel D., 1991. Out of the Earth: Civilization and the Life of the Soil. University of
California Press, Berkeley, CA, pp. 321.

Introduction
57
Hodge A., Campbell C.D., Fitter A.H., 2001. An arbuscular mycorrhizal fungus
accelerates decomposition and acquires nitrogen directly from organic material.
Nature 413:297-299.
Holland J.N., 1995. Effects of above-ground herbivory on soil microbial biomass in
conventional and no-tillage agroecosystems. Applied Soil Ecology 2:275-279.
Hu Y.L., Zeng D.H., Fan Z.P., Chen G..S, Zhao Q., Pepper D., 2008. Changes in
ecosystem carbon stocks following grassland afforestation of semiarid sandy soil
in the southeastern Keerqin Sandy Lands, China. Journal of Arid
Environments72:2193-2200.
Hussain I., Olson K.R., Wander M.M., Karlen D.L. 1999 Adaptation of soil quality
indices and application to three tillage systems in southern Illinois. Soil and Tillage
Research 50:237-249.
Iftikhar A., Khan, 1988. Studies on enzymes activity in normal and saline soils. Pak.
Journal of Agricultural Research 9:505-508.
IPCC (2000) Land use, Land-use change, and forestry. Cambridge University Press,
Cambridge
Jaenicke E.C., Lengnick L.L., 1999. A soil-quality index and its relationship to
efficiency and productivity growth measures: two decompositions. American
Journal of Agricultural Economics 81:881-893.
Jenkinson D.S., 1990. The turnover of organic carbon in the soil. Philosophical
Transactions of the Royal Society of London B 329:361-368.
Jensen L.S., McQueen D.J., Sheperd T.G., 1996. Effects of soil compaction on N-
mineralization and microbial-C and -N.I. Field measurements. Soil and Tillage
Research 38:175-188.
Juma N.G. and Tabatabai M.A., 1978. Distribution of phosphomonoesterases in
soils. Soil Science 126:101-108.
Kandeler E. and Eder G., 1993. Effect of cattle slurry in grassland on microbial
biomass and on activities of various enzymes. Biology and Fertility of Soils
16:249-254.
Chapter 1 .
58
Kandeler, E., Stemmer, M., Klimanek, E.M., 1999. Response of soil microbial
biomass, urease and xylanase within particle size fraction to long-term soil
management. Soil Biology and Biochemistry 31:261-273.
Karlen D.L., Andrews S.S., Doran J.W., 2001 “Soil quality : current concepts and
applications" in Advances in Agronomy 74:1-39.
Karlen D.L., Gardner J.C., Rosek M.J., 1998. A soil quality framework for evaluating
the impact of CRP. Journal of Production Agriculture 11:56-60.
Karlen D.L., Rosek M.J., Gardner J.C., Allan D.L., Alms M.J., Bezdicek D.F., Flock
M., Huggins D.R., Miller B.S., Staben M.L., 1999. Conservation reserve program
effects on soil quality indicators. Journal of Soil and Water Conservation54:439-
444.
Kawasaki S., Maie N., Kitamura S., and Watanabe A., 2008. Effect of organic
amendment on amount and chemical characteristics of humic acids in upland field
soils. European Journal of Soil Science 59:1027-1037.
Khan A.R., 1996. Influence of tillage on soil aeration. Journal of Agronomy and
Crop Science 177:253-259.
Knoepp J.D., Coleman D.C., Crossley D.A. Jr., Clark J.S., 2000. Biological indices
of soil quality: an ecosystem case study of their use. Forest Ecology and
Management 138:357-368.
Koide R., 1991. Nutrient supply, nutrient demand and plant-response to mycorrhizal
infection. New Phytologist 117:365-386. Smith, S.E., Read, D.J., 1997.
Mycorrhizal Symbiosis, second edn. Academic Press, London.
Kothari S.K., Marschner H., Römheld V., 1991a. Contribution of the VA mycorrhizal
hyphae in acquisition of phosphorus and zinc by maize grown in calcareous soil.
Plant and Soil 131:177-185.
Kumar J.D., Sharma G.D., Mishra R.R., 1992. Soil microbial population number and
enzyme activities in relation to altitude and forest degradation. Soil Biology and
Biochemystry 24:761-767.
Introduction
59
Kuzyakov Y., Biryukova O.V., Kuznetzova T.V., Mölter, K., Kandeler E., Stahr K.,
2002. Carbon partitioning in plant and soil, carbon dioxide fluxes and enzyme
activities as affected by cutting ryegrass. Biology and Fertility of Soils 35:348-358.
Laganière J., Angers D.A., Paré D., 2010. Carbon accumulation in agricultural soils
after afforestation: a meta-analysis. Global Change Biology 16:439-453.
Lagomarsino A., Moscatelli M.C., Di Tizio A., Mancinelli R., Grego S., Marinari S.
2009. Soil biochemical indicators as a tool to assess the short-term impact of
agricultural management on changes in organic C in a Mediterranean environment.
Ecological Indicators 9:518-527.
Lähdesmäki P. and Piispanen R., 1992. Soil enzymology: role of protective colloid
systems in the preservation of exoenzyme activities in soil. Soil Biology and
Biochemistry 24:1173-1177.
Lakhdar A., Scelza R., Scotti R., Rao M.A., Jedidi N., Gianfreda L., Abdally C.,
2010. The effect of compost and sewage sludge on soil biologic activities in salt
affected soil. Journal of Soil Science and Plant Nutrition 10:40-47.
Lal R., 1999. Soil quality and food security: the global perspective. In: Lal R. (Ed.)
Soil Quality and Soil Erosion. CRC Press, Boca Raton, FL, pp. 3-16.
Lal R., 2004. Soil carbon sequestration to mitigate climate change. Geoderma 123:1-
22.
Lal R., 2005. Forest soils and carbon sequestration. Forest Ecology and Management
220:242-258.
Latif M.A., Mehuys G.R., Mackenzie A.F., Alli I., Faris M.A., 1992. Effects of
legumes on soil physical quality in a maize crop. Plant and Soil 140:15-23.
Leroy B.L.M., H. Herath S., Sleutel S., De Neve D., Gabriel D., Reheul and M.
Moens, 2008. The quality of exogenous organic matter: short-term effects on soil
physical properties and soil organic matter fractions. Soil Use and Management
24:139-147.
Liebig M.A., Doran J.W., 1999. Impact of organic production practices on soil
quality indicators. Journal of Environmental Quality 28:1601-1609.
Chapter 1 .
60
Lopez-Hernandez D., Nino M., Nannipieri P., Fardeau J.C., 1989. Phosphatase
activity in Nasutitermes ephratae termite nests. Biology and Fertility of Soils
7:134-137.
Loreau M. S. et al., 2001. Biodiversity and ecosystem functioning: current
knowledge and future challenges. Science 294:804-808.
Lynch J.M., Panting L.M., 1980. Cultivation and the soil biomass. Soil Biology and
Biochemistry 12:29-33.
Marcote I., Hernandez T., Garcia C., Polo A., 2001. Influence of one or two
successive annual application of organic fertilisers on the enzyme activity of a soil
under barley cultivation. Bioresource Technology 79:147-154.
Marinari S., Masciandaro G., Ceccanti B., Greco S., 2001. Influence of organic and
mineral fertilisers on soil biological physical properties. Bioresource Technology
72:9-17.
Marinari S., Mancinelli R., Campiglia E., Grego S., 2006. Chemical and biological
indicators of soil quality in organic and conventional farming systems in Central
Italy. Ecological Indicators 6:701-711.
Martens D.A., Johanson J.B., Frankeberger W.T. Jr, 1992. Production, and
persistence of soil enzymes with repeated additions of organic residues. Soil
Science 153:53-61.
Masciandaro G., Ceccanti B., Gallardo-Lancho J.F., 1998. Organic matter properties
in cultivated versus set-aside arable soils. Agriculture, Ecosystems and
Environment 67:267-274.
Mason J., 2003 Sustainable agriculture second edition National library of Australia
Cataloguing ISBN 0 643 06876 7.
Mathur S.P., Rayment A.F., 1977. Influence of trace element fertilization on the
decomposition rate and phosphatase activity of a mesic fibrisol. Canadian Journal
of Soil Science 57:397-408.
Introduction
61
Mawdsley, J.L., Bardgett, R.D., 1997. Continuous defoliation of perennial ryegrass
(Lolium perenne) and white clover (Trifolium repens) and associated changes in
the microbial population of an upland grassland soil. Biology and Fertility of Soils
27:969-975.
McGill W.B., Cannon K.R., Robertson J.A., Cook F.D., 1986. Dynamics of soil
microbial biomass and water-soluble organic C in Breton L after 50 years of
cropping to two rotations. Canadian Journal of Soil Science 66:1-19.
Mijangos I., Pérez R., Albizu I., Garbisu C., 2006. Effects of fertilization and tillage
on soil biological parameters. Enzyme and Microbial Technology 40:100-106.
Miller M. and Dick R.P., 1995. Thermal stability and activities of soil enzymes as
influenced by crop rotations. Soil Biology and Biochemistry 27:1161-1166.
Monokrousos N., Papatheodorou E.M., Diamantopoulos J.D., Stamou G.P., 2006.
Soil quality variables in organically and conventionally cultivated field sites. Soil
Biology and Biochemistry 38:1282-1289.
Monreal C.M., Dinel H., Schnitzer M., Gamble D.S., Biederbeck V.O., 1998. Impact
of carbon sequestration on functional indicators of soil quality as influenced by
management in sustainable agriculture. In: Lal R., Kimble J.M., Follett R.F.,
Stewart B.A. (Eds.) Soil Processes and the Carbon Cycle. CRC Press, Boca Raton,
FL, pp. 435-457.
Morris S.J., Bohm S., Haile-Mariam S., Paul E.A., 2007. Evaluation of carbon
accrual in afforested agricultural soils. Global Change Biology 13:1145-1156.
Nannipieri P., 1994. The potential use of soil enzymes as indicators of soil
productivity, sustainability, and pollution. In: Pankhurst C.E., Doube B.M., Gupta
V.V.S.R., Grace P.R. (Eds.) Soil Biota: Management in Sustainable Farming
Systems. CSIRO Information Services, Victoria, Australia, pp. 238-244.
Nannipieri P., Grego S., Ceccanti B., 1990. Ecological significance of the biological
activity in soil. In: Bollag J.M. and Stotzky G. (Eds.) Soil Biochemistry. Dekker,
New York, Vol. 6: 293-355.
Chapter 1 .
62
Nannipieri P., Pedrazzini F., Arcara P.G., Piovanelli G., 1979. Changes in amino
acids, enzyme activities and biomasses during soil microbial growth. Soil Science
127: 26-34.
National Research Council, 1993. Soil and Water Quality: an Agenda for Agriculture.
National Academy Press, Washington, DC, pp. 516.
Niemi R.M., Vepsäläinen M, Wallenius K, Simpanen S, Alakukku L., Pietola L.,
2005. Temporal and soil depth- related variation in soil enzyme activities and in
root growth of red clover (Trifolium pratense) and timothy (Phleum pratense) in
the field. Applied Soil Ecology 30:113-125.
Nissen T.M. and Wander M.M., 2003. Management and soil-quality effects on
fertilizer-use efficiency and leaching. Soil Science Society of America Journal
67:1524-1532.
Northup B.K., Brown J.R., Holt J.A., 1999. Grazing impacts on the spatial
distribution of soil microbial biomass around tussock grasses in a tropical
grassland. Applied Soil Ecology 13:259-270.
Olander L.P. and Vitousek P.M., 2000. Regulation of soil phosphatase and chitinase
activity by N and P availability. Biogeochemistry 49:175-190.
Ozores-Hampton M., Obreza T.A., Hochmuth G., 1998. Using composted wastes on
Florida vegetable crops. Horticulture Technology 8:130-137.
Pascual J.A., Garcìa C., Hernandez T., 1999. Lasting microbiological and
biochemical effects of the addition of municipal solid waste to an arid soil. Biology
and Fertility of Soils 30:1-6.
Paul K.I., Polglase P.J., Nyakuengama J.G., Khama P.K., 2002. Change in soil
carbon following afforestation. Forest Ecology and Management 168:241-257.
Peichl M. and Arain M.A., 2006. Above- and belowground ecosystem biomass and
carbon pools an age-sequence of temperate pine plantation forests. Agricultural
and Forest Meteorology140:51-63.
Introduction
63
Perner H., Schwarz D., Bruns C., Mader P., George E., 2007. Effect arbuscular
mycorrhizal colonization and two levels of compost supplì on nutrient uptake and
flowering of pelargonium plants. Mycorrhiza 17:469-474.
Perucci P., Scarponi L., Businelli M., 1984. Enzyme activities in a clay-loam soil
amended with various crop residues. Plant and Soil 81:345-351.
Perucci P. and Scarponi L., 1985. Effect of different treatments with crop residues on
soil phosphatase activity. Biology and Fertility of Soils 1:111-115.
Pinstrup-Andersen, P. and Pandya-Lorch, R. Food for all in 2020—can the world be
fed withoutdamaging the environment. Environmental Conservation 23:226-234.
Powers R.F., Tiarks A.E., Boyle J.R., 1998. Assessing soil quality: practicable
standards for sustainable forest productivity in the United States. In: Adams M.B.,
Ramakrishna K., Davidson E.A. (Eds.) The Contribution of Soil Science to the
Development and Implementation of Criterial and Indicators of Sustainable Forest
Management. Soil Science Society of America, Special Publication No. 53, ASA,
Madison, WI, pp. 53-80.
Powlson D.S., Brookes P.C., Christensen B.T., 1987. Measurement of soil microbial
biomass provides an early indication of change in total soil organic matter due to
straw incorporation. Soil Biology and Biochemystry 19:159-164.
Prather M. D. et al. in Climate Change 2001: The Scientific Basis (Contribution of
Working Group I to the Third Assessment Report of the Intergovernmental Panel
on Climate Change) (eds Houghton, J. T. et al.) 239-287 (Cambridge University
Press, Cambridge, 2001).
Preston G.S., 1998. Early Warning Monitoring Guide for Croplands. Center for
Holistic Management, Albuquerque, NM. p.p. 22.
Puglisi E., Del Rea A.A.M., Rao M.A., Gianfreda L., 2006. Development and
validation of numerical indexes integrating enzyme activities of soils. Soil Biology
and Biochemestry 38:1673-1681.
Renbuss M., Chilvers G.A. and Pryer L.D. 1973 Microbiology of an ashbed.
Proceedings of Linnean Society NS W 97:302-310.

Chapter 1 .
64
Richter D.D., Markewitz D., Trumbore S.E., Wells C.G., 1999. Rapid accumulation
and turnover of soil carbon in a reestablishing forest. Nature 400:56-58.
Ritter E., 2007. Carbon, nitrogen and phosphorus in volcanic soils following
afforestation with native birch (Betula pubescens) and introduced larch (Larix
sibirica) in Iceland. Plant and Soil 295:239-251.
Ros M., Pascual J.A., Garcia C., Hernandez M.T., Insam H., 2006. Hydrolase
activities, microbial biomass and bacterial community in a soil after long-term
amendment with different composts. Soil Biology and Biochemistry 38:3443-3452.
Rutigliano F.A., Virzo De Santo A., Alfani A., Esposito A., 1995. Attività metabolica
di suoli campani in funzione degli incendi. S. It. E. Atti 16:535-538.
Saffigna P.G., Powlson D.S., Brookes P.C., Thomas G.A., 1989. Influence of
sorghum residues and tillage on soil organic matter and soil microbial biomass in
an Australian Vertisol. Soil Biology and Biochemistry 21:759-765.
Sanders F.E., Tinker P.B., 1971. Mechanism of absorption of phosphate from soil by
Endogone mycorrhizas. Nature 233:278-279.
Sarathchandra S.U., Perrott K.W., Upsdell M.P., 1984. Microbiological and
biochemical characteristics of a range of New Zealand soils under established
pasture. Soil Biology and Biochemistry 16:177-183.
Sarkar J.M. and Burns R.G., 1984. Synthesis and properties of -glucosidase-
phenolic copolymers as analogues of soil humic-enzyme complexes. Soil Biology
and Biochemistry 16:619-625.
Sarkar J.M., Leonowicz P., Bollag J.M., 1989. Immobilization of enzymes on clays
and soils. Soil Biology and Biochemistry 21:223-230.
Scagliarini S., 1999. Le funzioni del compost nel terreno. Il Divulgatore Anno XXII.
Centro Agricoltura Ambiente.
Scelza R., Rao M. A., Gianfreda L., 2008. Response of an agricultural soil to
pentachlorophenol (PCP) and the addition of compost or dissolved organic matter.
In Soil Biology and Biochemistry 40:2163-2169.
Introduction
65
Schaffer A., 1994. Pesticide effects on enzyme activities in the soil ecosystem. Pp
273-340. In: Bollag J-M., Stotzky G. (Eds), Soil Biochemistry, Vol. 8. Marcel
Dekker, New York.
Schipper, L.A. and Sparling, G.P., 2000. Performance of soil condition indicators
across taxonomic groups and land uses. Soil Science Society of America Journal
64:300-311.
Schoenholtz S.H., Van Miegroet H., Burger J.A., 2000. A review of chemical and
physical properties as indicators of forest soil quality: challenges and
opportunities. Forest Ecology and Management 138:335-356.
Schüssler A., Schwarzott D., Walker C., 2001. A new fungal phylum, the
Glomeromycota: phylogeny and evolution. Mycological Research 105:1413-1421.
Shi W., Dell E., Bowman D., Iyyemperumal, K., 2006. Soil enzyme activities and
organic matter composition in a turfgrass chronosequence. Plant and Soil 288:285-
296.
Sinsabaugh R.L., 1994. Enzymic analysis of microbial pattern and process. Biology
and Fertility of Soils 17:69-74.
Six J., Conant R.T., Paul E.A., Paustian K., 2002. Stabilization mechanisms of soil
organic matter: implications for C saturation of soils. Plant and Soil 241:155-176.
Skujinš J., 1967. Enzymes in soil. In: A.D. McLoren and G.H. Peterson (Eds.). Soil
Biochemistry, Vol.1. Marcel Dekker, New York, pp. 371-414.
Skujinš J., 1976. Extracellular enzymes in soil. CRC Critical Reviews in
Microbiology 4:383-421.
Smith S.E. and Read D.J., 1997. Mycorrhizal symbiosis. 2nd edn. Academic Press,
London, p.p. 605.
Soumaré M. , Tack F.M.G., Verloo M.G., 2003. Characterization of Malian and
Belgian solid waste composts with respect to fertility and suitability for land
application. Waste Management, 23:517-522.
Chapter 1 .
66
Sparling G.P., Speir T.W., Whale K.N., 1986. Changes in microbial biomass C, ATP
content, soil phosphomonoesterase and phosphodiesterase activity following air-
drying of soils. Soil Biology and Biochemistry 18:363-370.
Spiers G.A., McGill W.B., 1979. Effect of phosphorus addition and energy supply on
acid phosphatase production and activity in soils. Soil Biology and Biochemistry
11:3-8.
Srivastava S.C. and Singh J.S., 1991. Microbial C, N, and P in dry tropical forest
soils: effects of alternate land-uses and nutrient flux. Soil Biology and
Biochemistry 23:117-124.
Tabaglio V., Gavazzi C., Menta C., 2008, Physico-chemical indicators and
microarthropod communities as influenced by no-till, conventional tillage and
nitrogen fertilisation after four years of continuous maize. Soil and Tillage
Research 105:135-142.
Tabatabai M.A., 1994. Soil enzymes. In: R. W. Weaver, S. Angle, Bottomley P.
(Eds.) Methods of Soil Analysis, Part 2: Microbiological and Biochemical
Properties. Soil Science Society of America, Madison, pp. 775-883.
Tarafdar J.C. and Jungk A., 1987. Phosphatase activity in the rhizosphere and its
relation to the depletion of soil organic phosphorus. Biology and Fertility of Soils
3:199-204.
Taylor J.P., Wilson M., Mills S., Burns R.G., 2002. Comparison of microbial
numbers and enzymatic activities in surface soils and subsoils using various
techniques. Soil Biology Biochemistry 34:387-401.
Teklay T. and Chang S.X., 2006. Temporal changes in soil carbon and nitrogen
storage in a hybrid poplar chronosequence in northern Alberta. Geoderma
144:613-619.
Tilman, D., Fargione J., Wolff B., D'Antonio C., Dobson A., Howarth R., Schindler
D., Schlesinger W.H., Simberloff D., Swackhamer D., 2001. Forecasting
agriculturally driven global environmental change. Science 292:281-284.
Introduction
67
Tilman D., Cassman K.G., Matson P.A., Naylor R. and Polasky S., 2001.
Agricultural sustainability and intensive production practices. Nature 418:671-677.
Trasar-Cepeda M.C. and Gil-Sotres F., 1987. Phosphatase activity in acid high
organic matter soils in Galicia (NW Spain). Soil Biology and Biochemistry 19:281-
287.
Trasar-Cepeda C., Leiros M.C., Seoane S., Gil Sotres F. 2000. Limitation of soil
enzyme as indicators of soil pollution. Soil Biology and Biochemistry 32:1867-
1875.
van Groenigen KJ, Six J, Hungate BA, de Graaff MA, van Breemen N, van Kessel C
(2006) Element interactions limit soil carbon storage. Proceedings of the National
Academy of Sciences U S A 103:6571-6574.
Vesterdal L., Ritter E., Gundersen P., 2002. Change in soil organic carbon following
afforestation of former arable land. Forest Ecology and Management 169:137-147.
Visser S. and Parkinson D., 1992. Soil biological criteria as indicators of soil quality:
soil microorganisms. American Journal of Alternative Agriculture 7:33-37.
Vitousek, P.M., Mooney, H.A., Lubchenco J., and Melillo J.M., 1997. Human
domination of earth‟s ecosystems. Science 277:494-499.
Vizioli V., 1997. La fertilizzazione organica in agricoltura biologica. Mediterraneo,
4:70-77.
Waggoner P.E., 1995. How much land can ten billion people spare for nature? Does
technology make a difference? Technology in Society17:17-34.
Wander M.M. and Bollero G.A., 1999. Soil quality assessment of tillage impacts in
Illinois. Soil Science Society of America Journal 63:961-971.
Wang X.C., Lu Q., 2006. Beta-glucosidase activity in paddy soils of the Taihu lake
region. China Pedosphere 16:118-124.
Wardle D.A., Barker G.M., 1997. Competition and herbivory in establishing
grassland communities: Implications for plant biomass, species diversity and soil
microbial activity. Oikos 80:470-480.
Chapter 1 .
68
Weber J., Karczewska A., Drozd J., Licznar M., Licznar S., Jamroz E., Kocowicz, A.,
2007. Agricultural and ecological aspects of a sandy soil as affected by the
application of municipal solid waste composts. Soil Biology and Biochemistry
1294-1302.
West A.W., Sparling G.P., Speir T.W., Wood J.M., 1988a. Dynamics of microbial C,
N-flush and ATP, and enzyme activities of gradually dried soils from a
climosequence. Australian Journal of Soil Research 26:519-530.
West A.W., Sparling G.P., Speir T.W., Wood J.M., 1988b. Comparison of microbial
C, N-flush and ATP, and certain enzyme activities of different textured soils
subject to gradual drying. Australian Journal of Soil Research 26:217-229.
Whalen J.K., Hu Q.C., Liu A.G., 2003. Compost applications increase water-stable
aggregates in conventional and no-tillage systems. Soil Science Society of America
Journal 67:1842-1847.
Wienhold B.J., Andrews S.S. and Karlen D.L., 2004. Soil quality: a review of the
science and experiences in the USA. Environmental Geochemistry and Health 26:
89-95.
World Health Organization (WHO). Public health impacts of pesticides used in
agriculture (WHO in collaboration with the United Nations Environment
Programme, Geneva, 1990).
Wortmann C.S., and Shapiro C.A., 2008. The effects of manure application on soil
aggregation. Nutrient Cycling in Agroecosystems 80:173-180.
Zacheis A., Ruess R.W., Hupp J.W., 2002. Nitrogen dynamics in an Alaskan salt
marsh following spring use by geese. Oecologia 130:600-608.
Zhao Y., Wang P., Li J., Chene Y., Yingf X., Liud S., 2009. The effects of two
organic manures on soil properties and crop yields on a temperate calcareous soil
under a wheat-maize cropping system. European Journal of Agronomy 31:36-42.

69
Chapter 2
Aim
The loss of organic matter in soils under intensive farming managements is one of the
major concerns of the modern agriculture. Globalization and changes in technology,
population growth and market demand have often intensified agricultural production.
Based on projections for growth of the world‟s population, the current productivity of
agriculture should be double by 2025 to meet the world‟s food needs.
Wide spread adoption of innovative technology is the key to continuing the increase
in agricultural productivity. Profit-maximizing conventional agriculture, which has
become increasingly intensified, not only has led to farm overproductions but has
also dramatically increased soil degradation and environmental pollution by inducing
erosion and poisoning water with agricultural chemicals.
The higher rates of plant uptake are compensated by increasing chemical fertilizers
use, but matched by reductions in applications of organic amendments. Changes in
soil physical and chemical properties, such as changing quality and quantity of
organic matter also play a role in declining yields.
As currently practiced, however, intensive agriculture is degrading the soil resource
base, posing a threat to its sustainability. Sustainable agriculture does not mean a
return to either the low yields or poor farmers that characterized the 19th century.
Rather, sustainability builds on current agricultural achievements, adopting a
sophisticated approach that can maintain high yields and farm profits without
undermining the resources on which agriculture depends.
The present study was based on the hypothesis that the long-term soil cultivation
under intensive management, in particular under greenhouse, could affect negatively
soil fertility, in physical, chemical and biological terms. Among all, a reduction in
organic carbon content, and, consequently, a decrease in microbial activity were
expected. On the other hand, sustainable managements can protect and enhance the
productivity of soil by using cover crops, compost and/or manures, reducing tillage,
Chapter 2 .
70
etc.. The lost soil fertility could be restore by ensuring a valid organic matter
replenishment, but, as widely reported in literature, the recovery in soil fertility was
shortly achieved and just as shortly lost, reaching the starting conditions. That could
be ascribed to intensive farming as well as the prevailing labile fraction in compost
generally used as amendments, and the environmental conditions favouring
mineralization process.
The present study had the following purposes:
1. To assess soil quality in intensive farms sited in a Southern Italy region
markedly devoted to under greenhouse crops that used no organic amendments
for a long time.
2. To evaluate the effect of low mineralization rate organic amendments,
containing wood scrapes besides compost, on the soil fertility of two farms
selected among all previously monitored.
3. To characterize the organic matter of variously amended soils by conventional
and innovative spectroscopic analyses.
4. To evaluate the effect of organic amendments on the development of
indigenous micorrhiza (AMF) and on lettuce crops in a Chilean soil.
71
Chapter 3
Assessing soil quality of intensive farms
in an important agriculture region of Southern Italy1
3.1. Introduction
As defined by Doran and Parkin (1994) (see Chapter 1) soil quality is a complex and
multifaceted concept encompassing many properties and processes as the structural
stability of aggregates (Abiven et al., 2009), the water retention capacity (Loveland
and Webb, 2003), the capability of nutrient cycling (Tiessen et al., 1994), the ability
to store organic carbon (Martens et al., 2003) and to naturally suppress soilborne
plant pathogens (Janvier et al., 2007).
Soil quality is the outcome of interactions among physical, chemical and biological
characteristics, and its proper assessment requires the determination of a large
number of parameters (Bloem et al., 2006a; Marzaioli et al., 2010). In this context,
soil enzymes and microbial-based processes are now considered particularly
important because they usually respond more rapidly than chemical and physical
parameters to environmental changes and stresses such as heavy metal pollution
(Schloter et al., 2003; Gianfreda and Ruggiero, 2006). In fact, soil microbes are
useful indicators of soil quality because they are involved in organic matter (OM)
decomposition, nutrient cycling, maintenance of soil structure, and suppressiveness to
plant pathogens.
In the last decades a significant decrease in primary productivity has been observed
worldwide as a consequence of soil erosion, overgrazing, salinity and/or sodicity
_________________________________
1A version of this Chapter has been published as:
Bonanomi G., D‟Ascoli R., Antignani V., Capodilupo M., Cozzolino L., Marzioli R., Puopolo G.,
Rutigliano F.A., Scelza R., Scotti R., Rao M.A., Zoina A., 2010. Assessing soil quality under
intensive cultivation and tree orchards in Southern Italy. Applied Soil Ecology 2010 Accepted
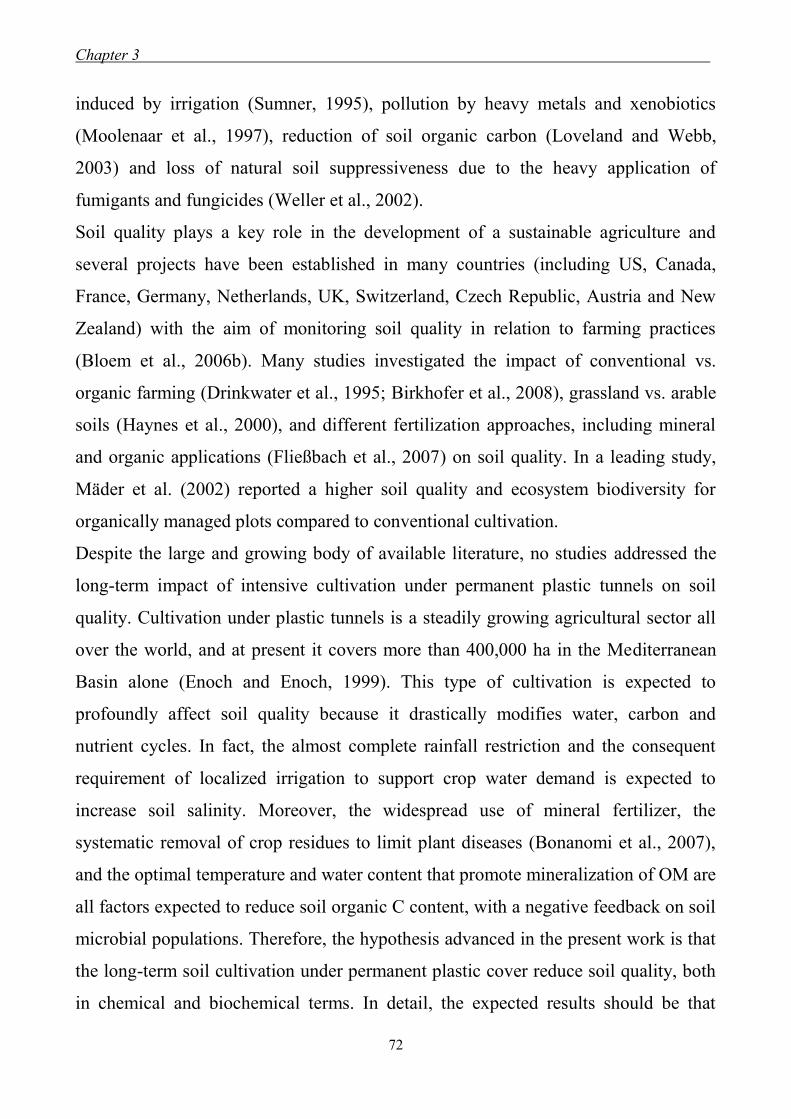
Chapter 3 .
72
induced by irrigation (Sumner, 1995), pollution by heavy metals and xenobiotics
(Moolenaar et al., 1997), reduction of soil organic carbon (Loveland and Webb,
2003) and loss of natural soil suppressiveness due to the heavy application of
fumigants and fungicides (Weller et al., 2002).
Soil quality plays a key role in the development of a sustainable agriculture and
several projects have been established in many countries (including US, Canada,
France, Germany, Netherlands, UK, Switzerland, Czech Republic, Austria and New
Zealand) with the aim of monitoring soil quality in relation to farming practices
(Bloem et al., 2006b). Many studies investigated the impact of conventional vs.
organic farming (Drinkwater et al., 1995; Birkhofer et al., 2008), grassland vs. arable
soils (Haynes et al., 2000), and different fertilization approaches, including mineral
and organic applications (Fließbach et al., 2007) on soil quality. In a leading study,
Mäder et al. (2002) reported a higher soil quality and ecosystem biodiversity for
organically managed plots compared to conventional cultivation.
Despite the large and growing body of available literature, no studies addressed the
long-term impact of intensive cultivation under permanent plastic tunnels on soil
quality. Cultivation under plastic tunnels is a steadily growing agricultural sector all
over the world, and at present it covers more than 400,000 ha in the Mediterranean
Basin alone (Enoch and Enoch, 1999). This type of cultivation is expected to
profoundly affect soil quality because it drastically modifies water, carbon and
nutrient cycles. In fact, the almost complete rainfall restriction and the consequent
requirement of localized irrigation to support crop water demand is expected to
increase soil salinity. Moreover, the widespread use of mineral fertilizer, the
systematic removal of crop residues to limit plant diseases (Bonanomi et al., 2007),
and the optimal temperature and water content that promote mineralization of OM are
all factors expected to reduce soil organic C content, with a negative feedback on soil
microbial populations. Therefore, the hypothesis advanced in the present work is that
the long-term soil cultivation under permanent plastic cover reduce soil quality, both
in chemical and biochemical terms. In detail, the expected results should be that

Assessing of soil quality of intensive farms
73
under intensive cultivation: i) a reduction in organic C content, and, consequently, a
decrease in microbial activity, such as enzymatic activities; ii) an increase in soil
salinity; iii) no effect on some basic chemical and physical parameters as pH,
limestone content, and soil texture.
This study addressed this hypothesis with a multidisciplinary approach. To achieve
this purpose two different soil management regimes, were compared: high-input
management regime (HIMR), characterized by intensive cultivation under permanent
plastic tunnels; and ii) low-input management regime (LIMR), constituted by tree
orchards. Since soil quality cannot be summarized by a single property or process, its
assessment necessarily requires measurement of a large number of parameters.
Therefore, the main soil properties were measured (including physical, chemical and
biochemical ones) to assess soil quality in five different sampling areas cultivated
both under HIMR and LIMR.
The present work was carried out within the framework “Monitoraggio e recupero
della Fertilità dei suoli in sistemi agricoli intensivi” a research project funded by
CCIAA of Salerno (Italy) in collaboration with the research groups of Prof. Astolfo
Zoina, Dipartimento di Arboricoltura, Botanica e Patologia Vegetale, Università degli
Studi di Napoli Federico II, and Dr. Rosaria D‟Ascoli, Dipartimento di Scienze
Ambientali, Seconda Università di Napoli.
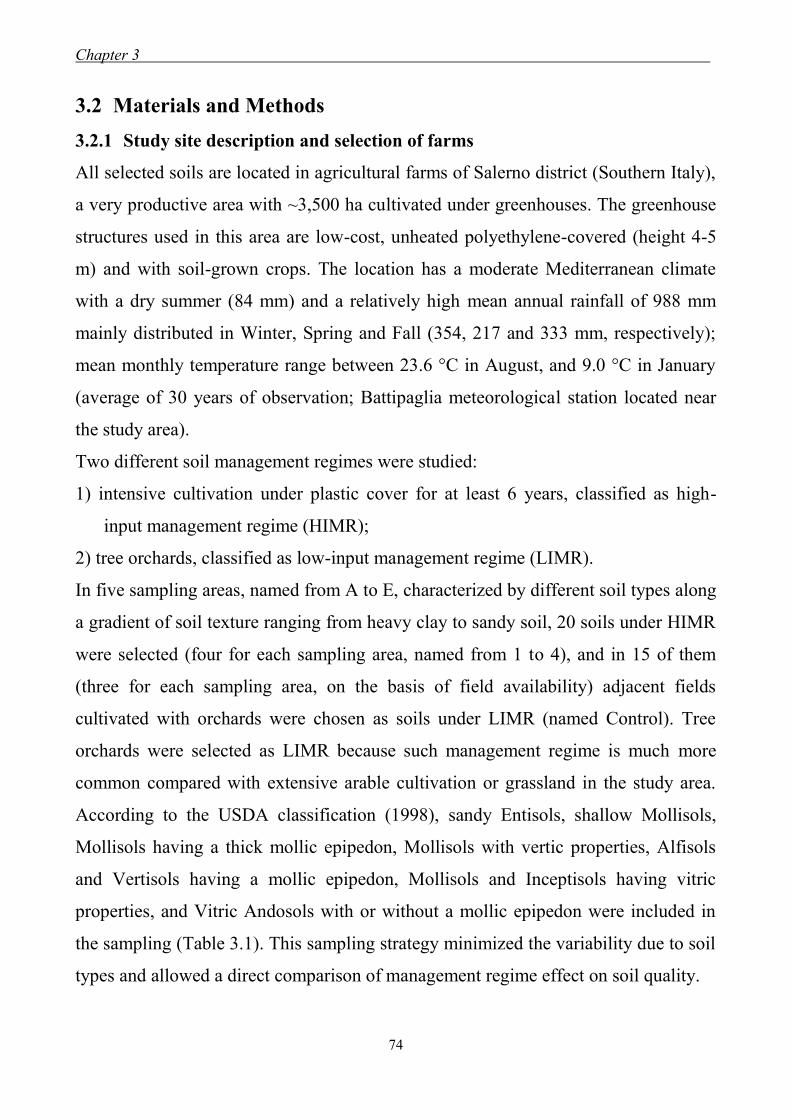
Chapter 3 .
74
3.2 Materials and Methods
3.2.1 Study site description and selection of farms
All selected soils are located in agricultural farms of Salerno district (Southern Italy),
a very productive area with ~3,500 ha cultivated under greenhouses. The greenhouse
structures used in this area are low-cost, unheated polyethylene-covered (height 4-5
m) and with soil-grown crops. The location has a moderate Mediterranean climate
with a dry summer (84 mm) and a relatively high mean annual rainfall of 988 mm
mainly distributed in Winter, Spring and Fall (354, 217 and 333 mm, respectively);
mean monthly temperature range between 23.6 °C in August, and 9.0 °C in January
(average of 30 years of observation; Battipaglia meteorological station located near
the study area).
Two different soil management regimes were studied:
1) intensive cultivation under plastic cover for at least 6 years, classified as high-
input management regime (HIMR);
2) tree orchards, classified as low-input management regime (LIMR).
In five sampling areas, named from A to E, characterized by different soil types along
a gradient of soil texture ranging from heavy clay to sandy soil, 20 soils under HIMR
were selected (four for each sampling area, named from 1 to 4), and in 15 of them
(three for each sampling area, on the basis of field availability) adjacent fields
cultivated with orchards were chosen as soils under LIMR (named Control). Tree
orchards were selected as LIMR because such management regime is much more
common compared with extensive arable cultivation or grassland in the study area.
According to the USDA classification (1998), sandy Entisols, shallow Mollisols,
Mollisols having a thick mollic epipedon, Mollisols with vertic properties, Alfisols
and Vertisols having a mollic epipedon, Mollisols and Inceptisols having vitric
properties, and Vitric Andosols with or without a mollic epipedon were included in
the sampling (Table 3.1). This sampling strategy minimized the variability due to soil
types and allowed a direct comparison of management regime effect on soil quality.
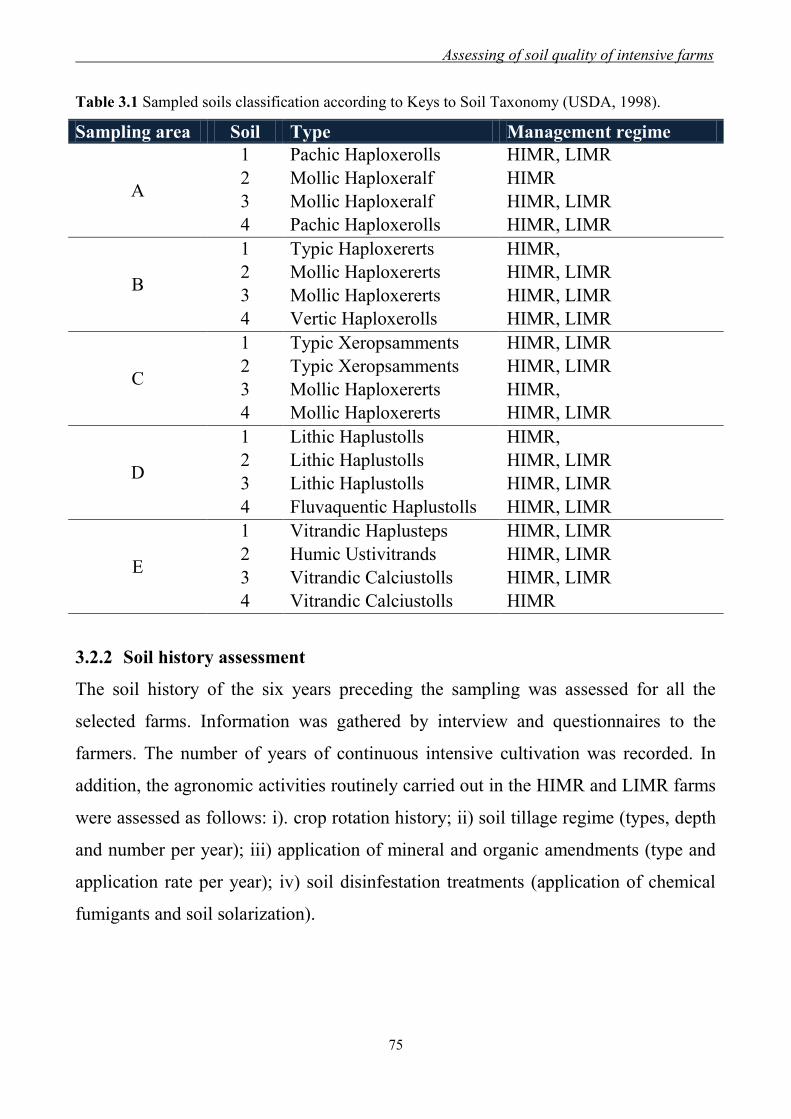
Assessing of soil quality of intensive farms
75
Table 3.1 Sampled soils classification according to Keys to Soil Taxonomy (USDA, 1998).
Sampling area Soil Type Management regime
A
1 Pachic Haploxerolls HIMR, LIMR
2 Mollic Haploxeralf HIMR
3 Mollic Haploxeralf HIMR, LIMR
4 Pachic Haploxerolls HIMR, LIMR
B
1 Typic Haploxererts HIMR,
2 Mollic Haploxererts HIMR, LIMR
3 Mollic Haploxererts HIMR, LIMR
4 Vertic Haploxerolls HIMR, LIMR
C
1 Typic Xeropsamments HIMR, LIMR
2 Typic Xeropsamments HIMR, LIMR
3 Mollic Haploxererts HIMR,
4 Mollic Haploxererts HIMR, LIMR
D
1 Lithic Haplustolls HIMR,
2 Lithic Haplustolls HIMR, LIMR
3 Lithic Haplustolls HIMR, LIMR
4 Fluvaquentic Haplustolls HIMR, LIMR
E
1 Vitrandic Haplusteps HIMR, LIMR
2 Humic Ustivitrands HIMR, LIMR
3 Vitrandic Calciustolls HIMR, LIMR
4 Vitrandic Calciustolls HIMR
3.2.2 Soil history assessment
The soil history of the six years preceding the sampling was assessed for all the
selected farms. Information was gathered by interview and questionnaires to the
farmers. The number of years of continuous intensive cultivation was recorded. In
addition, the agronomic activities routinely carried out in the HIMR and LIMR farms
were assessed as follows: i). crop rotation history; ii) soil tillage regime (types, depth
and number per year); iii) application of mineral and organic amendments (type and
application rate per year); iv) soil disinfestation treatments (application of chemical
fumigants and soil solarization).
Chapter 3 .
76
3.2.3 Soil sampling and analyses
In each HIMR farm three plastic tunnels were considered, and in each of them five
soil sub-samples were collected following a W scheme (four sampling plots near to
corners and one sampling plot in the centre of the tunnel) and pooling together, in
order to have three composite soil sample for each farm. In each selected LIMR farm,
a single composite soil sample was collected alone, because in the chosen farms only
one orchard of small size (comparable with a single plastic tunnel) was available. In
order to have a composite soil sample representing the variability of the field, the
sample was obtained pooling together soil collected in five different plots, following
a W scheme, under the trees row devoid of grass strips. Consequently, a total of 75
composite soil samples were collected for analyses (60 from HIMR and 15 from
LIMR farms, respectively).
Soil samples (~2 kg) were collected from the topsoil (0-20 cm) in the Spring 2008
(April-May), considered the best time for soil collection (Bloem et al., 2006a).
Samples were packed in polyethylene bags, transferred to laboratory quickly and
sieved at 2 mm mesh. The biochemical analyses were carried out on fresh soils stored
at +4 °C until time of measurements (within 10 days). Texture and chemical analyses
were carried out on soil dried at room temperature until constant weight was reached.
3.2.4 Physical and chemical analyses
Physical and chemical properties of soils were determined by standard methods
(Sparks, 1996). Particle size distribution analysis was carried out by the pipette
method; pH and electrical conductivity were measured in 1:2.5 soil:water suspensions
and 1:5 soil:water extracts, respectively; total carbonates (limestone) were
determined by the Dietrich-Fruehling calcimeter method (Loeppert and Suarez,
1996); organic C content was assayed (on 1 g of pulverized soil) by chromic acid
titration method; total N was determined (on 30 mg pulverized soil) by flash
combustion with a CNS Elemental Analyser (Thermo FlashEA 1112); available
phosphate was measured by bicarbonate extraction; cation exchange capacity was

Assessing of soil quality of intensive farms
77
measured after soil treatment with a barium chloride and triethanolamine solution at
pH 8.2; and exchangeable bases (Ca2+
, Mg2+
, K+, Na
+) were assayed by flame atomic
absorption spectrometry.
Organic C content and total nitrogen analyses were performed by Dr. Rosaria
D‟Ascoli at the Department of Environmental Sciences, Second University of Naples.
3.2.5 Enzymatic activities
The activity of the following enzymes was measured: dehydrogenase, arylsulphatase,
phosphatase, -glucosidase and urease. Dehydrogenase (DHY, E.C. 1.1.) activity was
measured with buffered tetrazolium salts solution, according to Trevors (1984).
Arylsulphatase (ARYL, E.C. 3.1.6.1), phosphatase (PHO, E.C. 3.1.3.2) and -
glucosidase (GLU, E.C. 3.2.1.21) activities were determined using p-nitrophenyl
sulphate (p-NPS), p-nitrophenyl phosphate (p-NPP) or p-nitrophenyl--D-
glucopyranoside (p-NG) as the substrates, respectively. Specific buffers and pHs and
reaction stop procedures were used as reported in Gianfreda et al. (2005).
Concentrations of p-nitrophenol (p-NP) were determined at 405 nm after addition of
NaOH and CaCl2 for PHO and ARYL, and Tris/NaOH buffer (pH 10.0) and CaCl2
for GLU. Urease activity (UR, E.C. 3.5.1.5) was assayed as described by Kandeler
and Gerber (1988) using urea as substrate. One unit of enzyme activity was defined
as moles of product released at 30 °C h-1
by 1 g of dried soil. Triplicates were
performed for each activity assay.
3.2.6 Soil quality index
The AI 3 soil index (Puglisi et al. 2006) was useful to better discriminate between
HIMR and LIMR soils. The AI 3 index, based on enzymatic activities, was able to
discriminate between altered and unaltered soils, under a wide range of conditions,
namely irrigation with brackish water, heavy metal contamination (Leirós et al.,
1999; Hinojosa et al., 2004), intensive agricultural exploitation (Leirós et al., 1999;
Caravaca et al., 2002). The index was developed from datasets of three enzyme
Chapter 3 .
78
activities (-glucosidase, phosphatase and urease) and the raw canonical coefficients
are:
AI 3 = 7.87 -glucosidase - 8.22 phosphatase - 0.49 urease
3.2.7 Statistical analysis
The relationships between soil physical, chemical and biochemical properties were
assessed by using Pearson correlation coefficients.
Analysis of variance (ANOVA-one way with replication) was used to evaluate the
effect of different soil management regimes. The significance between means with P
<0.01 was determined using the Duncan test.
Principal component analysis (PCA) and all statistical analysis were performed by
JMP 8 (SAS Institute, 2008).
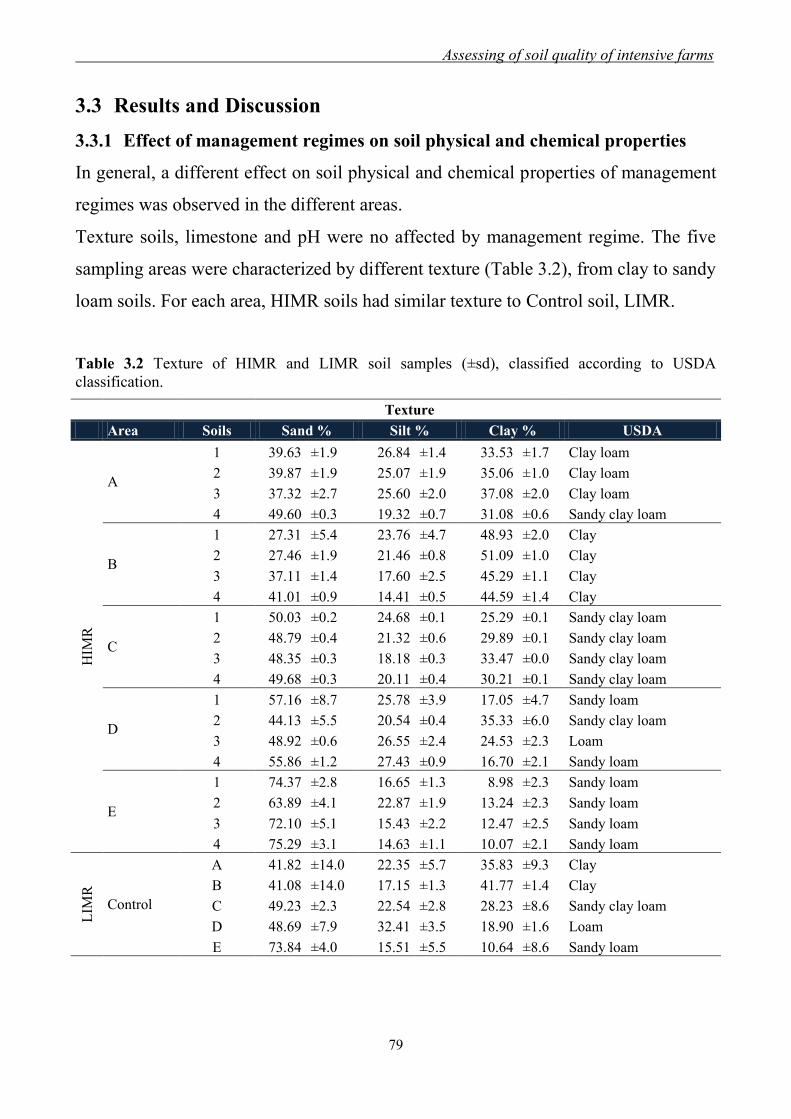
Assessing of soil quality of intensive farms
79
3.3 Results and Discussion
3.3.1 Effect of management regimes on soil physical and chemical properties
In general, a different effect on soil physical and chemical properties of management
regimes was observed in the different areas.
Texture soils, limestone and pH were no affected by management regime. The five
sampling areas were characterized by different texture (Table 3.2), from clay to sandy
loam soils. For each area, HIMR soils had similar texture to Control soil, LIMR.
Table 3.2 Texture of HIMR and LIMR soil samples (±sd), classified according to USDA
classification.
Texture
Area Soils Sand % Silt % Clay % USDA
HIM
R
A
1 39.63 ±1.9 26.84 ±1.4 33.53 ±1.7 Clay loam
2 39.87 ±1.9 25.07 ±1.9 35.06 ±1.0 Clay loam
3 37.32 ±2.7 25.60 ±2.0 37.08 ±2.0 Clay loam
4 49.60 ±0.3 19.32 ±0.7 31.08 ±0.6 Sandy clay loam
B
1 27.31 ±5.4 23.76 ±4.7 48.93 ±2.0 Clay
2 27.46 ±1.9 21.46 ±0.8 51.09 ±1.0 Clay
3 37.11 ±1.4 17.60 ±2.5 45.29 ±1.1 Clay
4 41.01 ±0.9 14.41 ±0.5 44.59 ±1.4 Clay
C
1 50.03 ±0.2 24.68 ±0.1 25.29 ±0.1 Sandy clay loam
2 48.79 ±0.4 21.32 ±0.6 29.89 ±0.1 Sandy clay loam
3 48.35 ±0.3 18.18 ±0.3 33.47 ±0.0 Sandy clay loam
4 49.68 ±0.3 20.11 ±0.4 30.21 ±0.1 Sandy clay loam
D
1 57.16 ±8.7 25.78 ±3.9 17.05 ±4.7 Sandy loam
2 44.13 ±5.5 20.54 ±0.4 35.33 ±6.0 Sandy clay loam
3 48.92 ±0.6 26.55 ±2.4 24.53 ±2.3 Loam
4 55.86 ±1.2 27.43 ±0.9 16.70 ±2.1 Sandy loam
E
1 74.37 ±2.8 16.65 ±1.3 8.98 ±2.3 Sandy loam
2 63.89 ±4.1 22.87 ±1.9 13.24 ±2.3 Sandy loam
3 72.10 ±5.1 15.43 ±2.2 12.47 ±2.5 Sandy loam
4 75.29 ±3.1 14.63 ±1.1 10.07 ±2.1 Sandy loam
LIM
R
Control
A 41.82 ±14.0 22.35 ±5.7 35.83 ±9.3 Clay
B 41.08 ±14.0 17.15 ±1.3 41.77 ±1.4 Clay
C 49.23 ±2.3 22.54 ±2.8 28.23 ±8.6 Sandy clay loam
D 48.69 ±7.9 32.41 ±3.5 18.90 ±1.6 Loam
E 73.84 ±4.0 15.51 ±5.5 10.64 ±8.6 Sandy loam

Chapter 3 .
80
All soils sampled in different areas showed sub-alkaline pH values ranging from 7.59
to 8.34, except soils 4E, Control E, and 3C having pH 6.50, 7.20, 7.21, respectively
(Fig. 3.1). No differences between HIMR and LIMR were observed.
Figure 3.1 pH values determined of all soil samples.
Limestone content which generally depends on the geopedologic characteristics of
soils was not affected by management regime (Fig. 3.2). The values were very
different among soil samples and areas. Soils from area A can be considered
uncalcaric, while only same soils from areas C and D were over 200 g kg-1
of lime,
the limit to define a very calcaric soil. In soils 4D, the most calcaric soil, more than
500 g kg-1
of limestone was measured. All others fell into category weakly calcaric
soils (Fig. 3.2).
0
2
4
6
8
10
12
1 A 2 A 3 A 4 A 1 B 2 B 3 B 4 B 1 C 2 C 3 C 4 C 1 D 2 D 3 D 4 D 1 E 2 E 3 E 4 E A B C D E
Area A Area B Area C Area D Area E Control
HIMR LIMR
pH
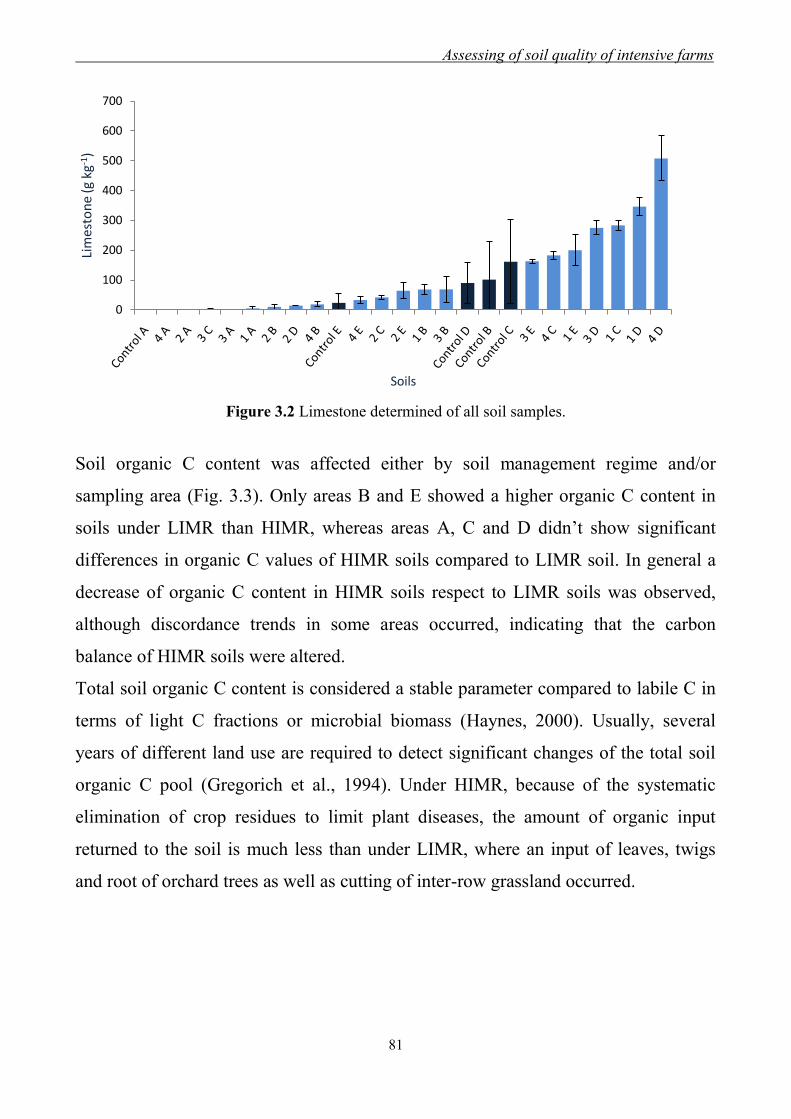
Assessing of soil quality of intensive farms
81
Figure 3.2 Limestone determined of all soil samples.
Soil organic C content was affected either by soil management regime and/or
sampling area (Fig. 3.3). Only areas B and E showed a higher organic C content in
soils under LIMR than HIMR, whereas areas A, C and D didn‟t show significant
differences in organic C values of HIMR soils compared to LIMR soil. In general a
decrease of organic C content in HIMR soils respect to LIMR soils was observed,
although discordance trends in some areas occurred, indicating that the carbon
balance of HIMR soils were altered.
Total soil organic C content is considered a stable parameter compared to labile C in
terms of light C fractions or microbial biomass (Haynes, 2000). Usually, several
years of different land use are required to detect significant changes of the total soil
organic C pool (Gregorich et al., 1994). Under HIMR, because of the systematic
elimination of crop residues to limit plant diseases, the amount of organic input
returned to the soil is much less than under LIMR, where an input of leaves, twigs
and root of orchard trees as well as cutting of inter-row grassland occurred.
0
100
200
300
400
500
600
700Li
mes
ton
e (g
kg-1
)
Soils
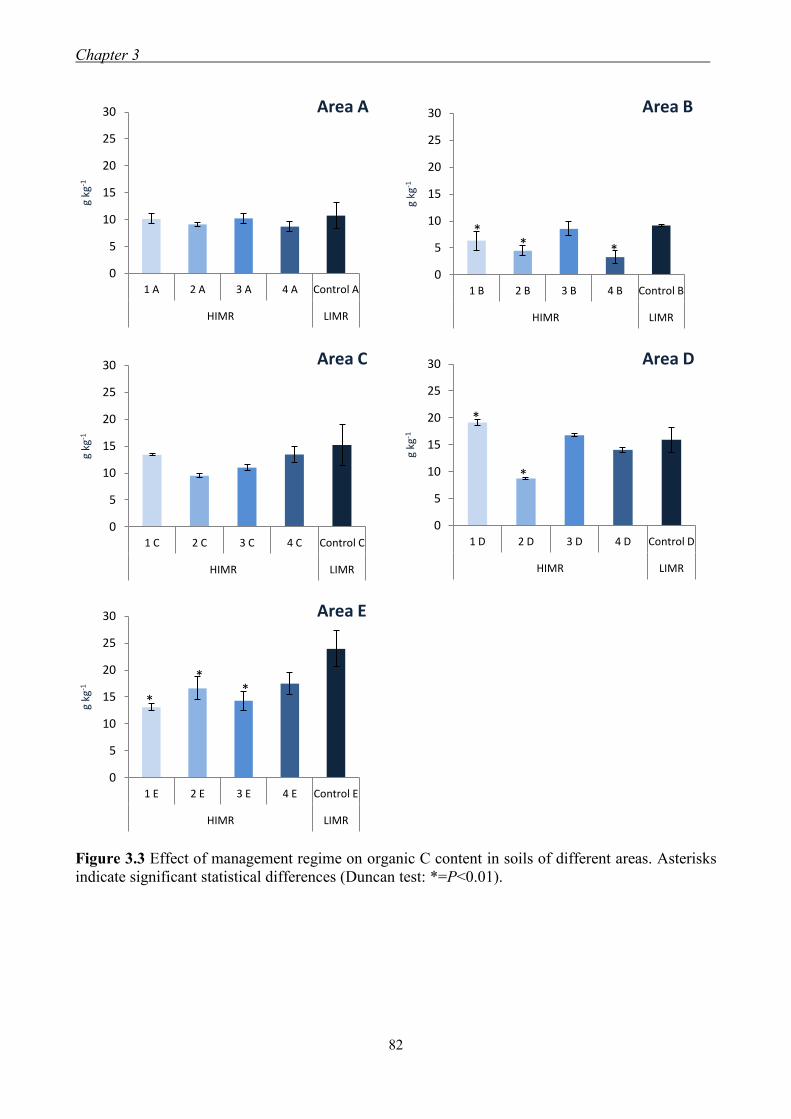
Chapter 3 .
82
Figure 3.3 Effect of management regime on organic C content in soils of different areas. Asterisks
indicate significant statistical differences (Duncan test: *=P<0.01).
0
5
10
15
20
25
30
1 A 2 A 3 A 4 A Control A
HIMR LIMR
g kg
-1
Area A
0
5
10
15
20
25
30
1 B 2 B 3 B 4 B Control B
HIMR LIMR
g kg
-1
Area B
** *
0
5
10
15
20
25
30
1 C 2 C 3 C 4 C Control C
HIMR LIMR
g kg
-1
Area C
0
5
10
15
20
25
30
1 D 2 D 3 D 4 D Control D
HIMR LIMR
g kg
-1
Area D
*
*
0
5
10
15
20
25
30
1 E 2 E 3 E 4 E Control E
HIMR LIMR
g kg
-1
Area E
*
**
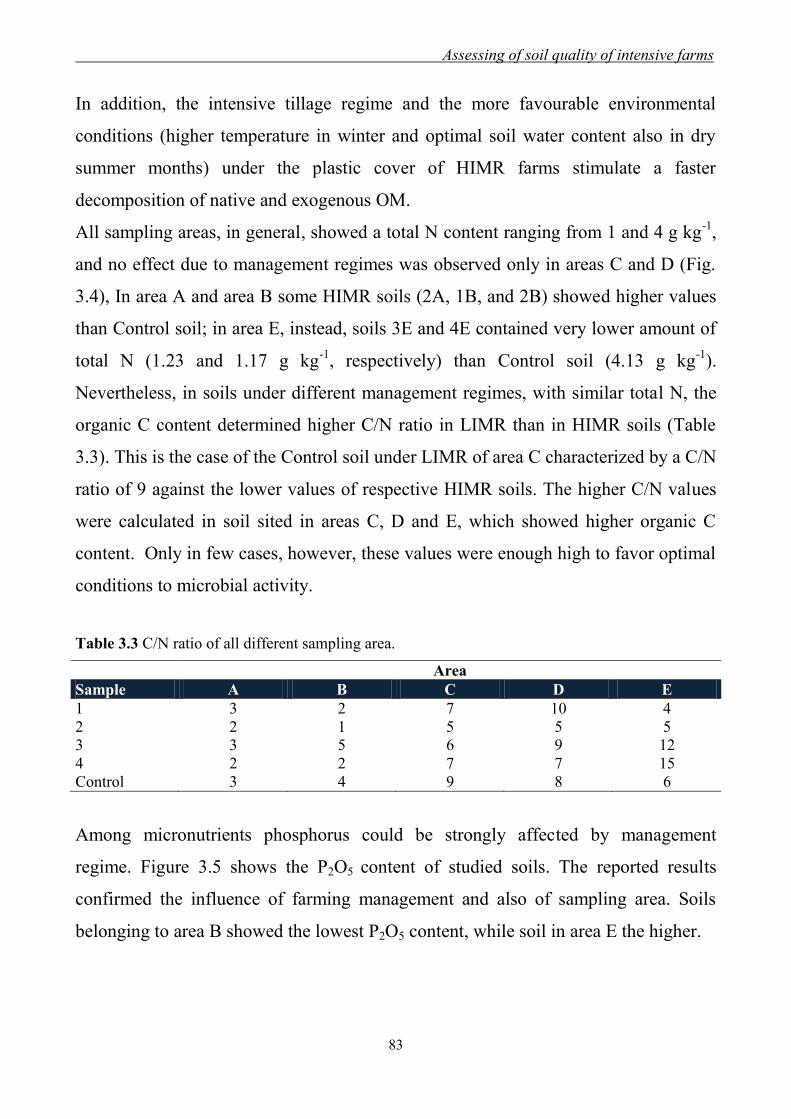
Assessing of soil quality of intensive farms
83
In addition, the intensive tillage regime and the more favourable environmental
conditions (higher temperature in winter and optimal soil water content also in dry
summer months) under the plastic cover of HIMR farms stimulate a faster
decomposition of native and exogenous OM.
All sampling areas, in general, showed a total N content ranging from 1 and 4 g kg-1
,
and no effect due to management regimes was observed only in areas C and D (Fig.
3.4), In area A and area B some HIMR soils (2A, 1B, and 2B) showed higher values
than Control soil; in area E, instead, soils 3E and 4E contained very lower amount of
total N (1.23 and 1.17 g kg-1
, respectively) than Control soil (4.13 g kg-1
).
Nevertheless, in soils under different management regimes, with similar total N, the
organic C content determined higher C/N ratio in LIMR than in HIMR soils (Table
3.3). This is the case of the Control soil under LIMR of area C characterized by a C/N
ratio of 9 against the lower values of respective HIMR soils. The higher C/N values
were calculated in soil sited in areas C, D and E, which showed higher organic C
content. Only in few cases, however, these values were enough high to favor optimal
conditions to microbial activity.
Table 3.3 C/N ratio of all different sampling area.
Area
Sample A B C D E
1 3 2 7 10 4
2 2 1 5 5 5
3 3 5 6 9 12
4 2 2 7 7 15
Control 3 4 9 8 6
Among micronutrients phosphorus could be strongly affected by management
regime. Figure 3.5 shows the P2O5 content of studied soils. The reported results
confirmed the influence of farming management and also of sampling area. Soils
belonging to area B showed the lowest P2O5 content, while soil in area E the higher.
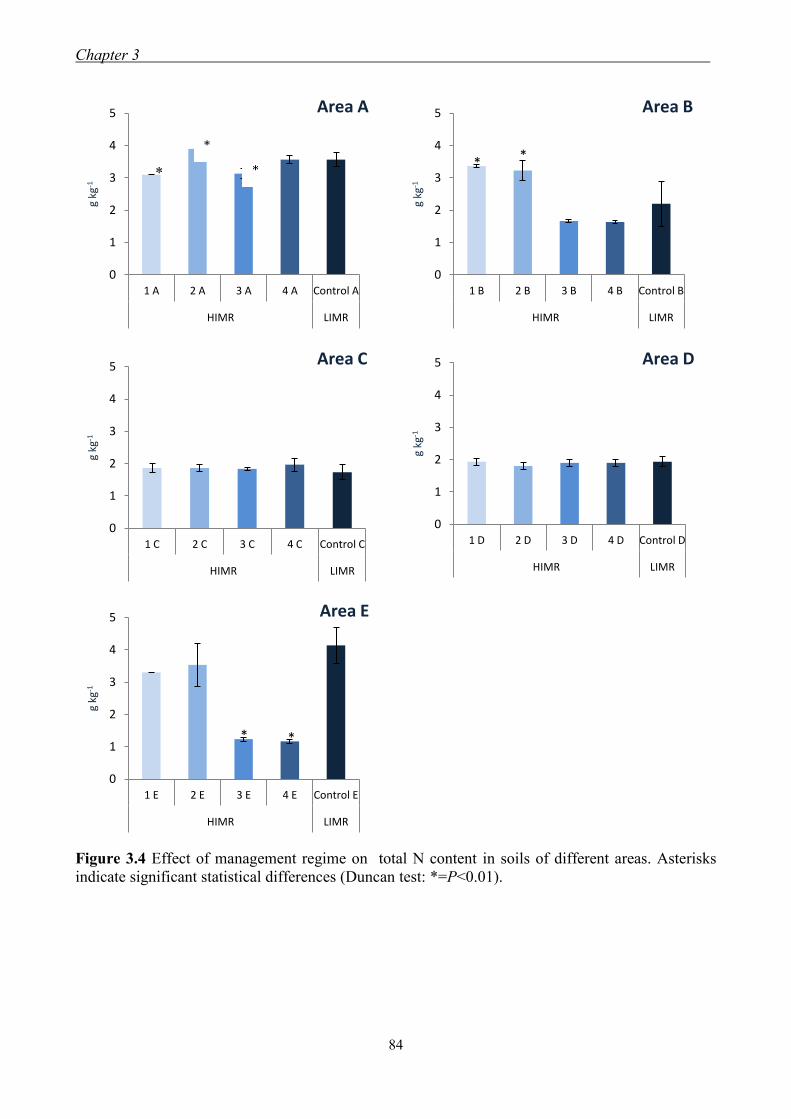
Chapter 3 .
84
Figure 3.4 Effect of management regime on total N content in soils of different areas. Asterisks
indicate significant statistical differences (Duncan test: *=P<0.01).
0
1
2
3
4
5
1 A 2 A 3 A 4 A Control A
HIMR LIMR
g kg
-1
Area A
0
1
2
3
4
5
1 B 2 B 3 B 4 B Control B
HIMR LIMR
g kg
-1
Area B
**
0
1
2
3
4
5
1 C 2 C 3 C 4 C Control C
HIMR LIMR
g kg
-1
Area C
0
1
2
3
4
5
1 D 2 D 3 D 4 D Control D
HIMR LIMR
g kg
-1
Area D
0
1
2
3
4
5
1 E 2 E 3 E 4 E Control E
HIMR LIMR
g kg
-1
Area E
* *
*
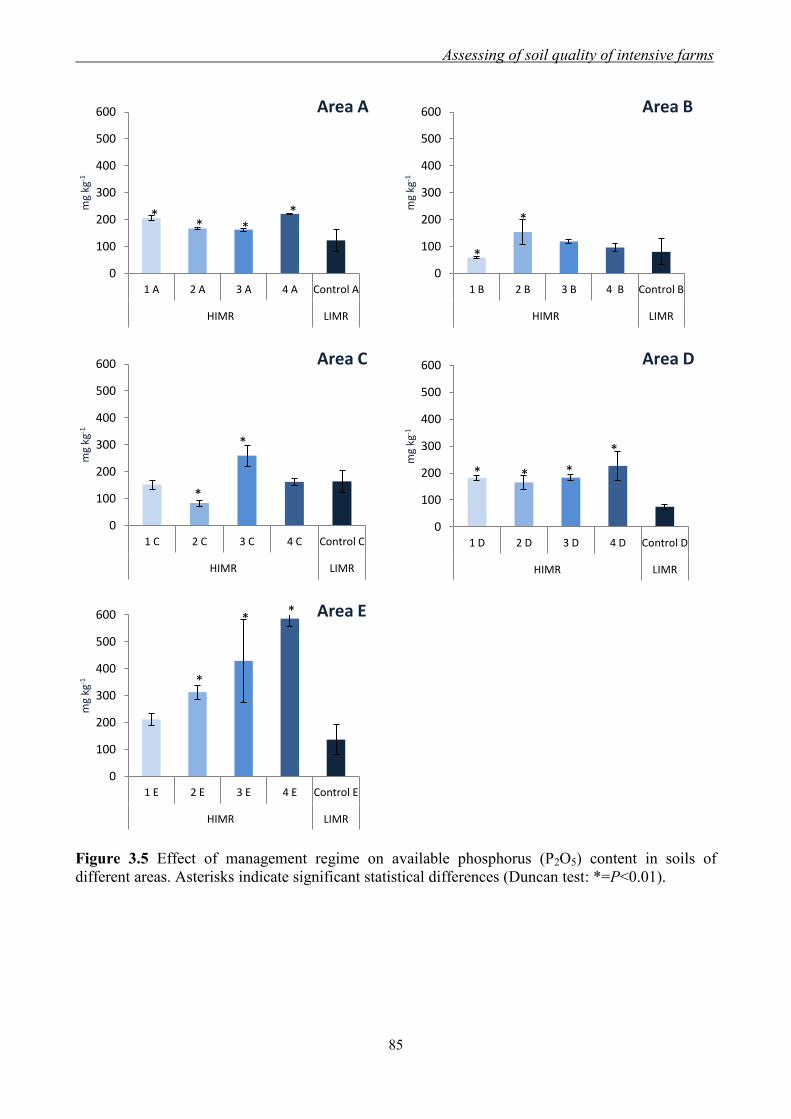
Assessing of soil quality of intensive farms
85
Figure 3.5 Effect of management regime on available phosphorus (P2O5) content in soils of
different areas. Asterisks indicate significant statistical differences (Duncan test: *=P<0.01).
0
100
200
300
400
500
600
1 A 2 A 3 A 4 A Control A
HIMR LIMR
mg
kg-1
Area A
** *
*
0
100
200
300
400
500
600
1 B 2 B 3 B 4 B Control B
HIMR LIMR
mg
kg-1
Area B
*
*
0
100
200
300
400
500
600
1 C 2 C 3 C 4 C Control C
HIMR LIMR
mg
kg-1
Area C
*
*
0
100
200
300
400
500
600
1 D 2 D 3 D 4 D Control D
HIMR LIMR
mg
kg-1
Area D
* * *
*
0
100
200
300
400
500
600
1 E 2 E 3 E 4 E Control E
HIMR LIMR
mg
kg-1
Area E
*
**

Chapter 3 .
86
These differences, related to belonging areas, could be due to different cropping
uptake and different mineral fertilizations in past years. An effect of management
regime on P2O5 content was also considered. In all sampling areas, LIMR soils
showed lower available phosphorus than HIMR soils. The more reduced doses of
mineral phosphate given to tree orchards than those used in soils under intensive
farming can be responsible for those results.
Cation exchange capacity (CEC) and exchangeable Ca2+
, Mg2+
and K+ were not
affected by soil management, but some differences of soil texture and organic carbon
content were observed among sampling areas (Tables 3.2 and 3.4; Fig. 3.3). Soil
richer in clay fraction showed higher CEC and exchangeable base values than soils
characterized by sandy or sandy loam characteristics.
Finally, exchangeable Na+
(Table 3.4), and electrical conductivity (EC) were
influenced by management regime (Fig. 3.6). HIMR determined a drastic increase of
electrical conductivity and exchangeable Na+ content compared to LIMR. EC values
increased up to nearly 3000 S cm-1
in soil 4E, ten-fold more than the respective
Control (Fig. 3.6) and exchangeable Na+ was two/three fold compared to LIMR soils
(Table 3.4).
It is well-know that only management regime affects EC and Na+ content, indicating
that some ecological factors linked to HIMR cause an increase of such parameters.
Salinity and/or sodicity are widespread problems in irrigated areas characterized by
low rainfall level and high evapo-transpiration demand that determines salt
accumulation at the soil surface (Sumner et al., 1995).
The increase of soil electrical conductivity could be due to the almost total rainfall
restriction under the plastic film, especially when HIMR is prolonged for many years,
and/or to the use of poor quality irrigation water (Rietz and Haynes, 2003). The last
factor, however, could be ruled out because of the high quality of the water used for
irrigation in our study area.
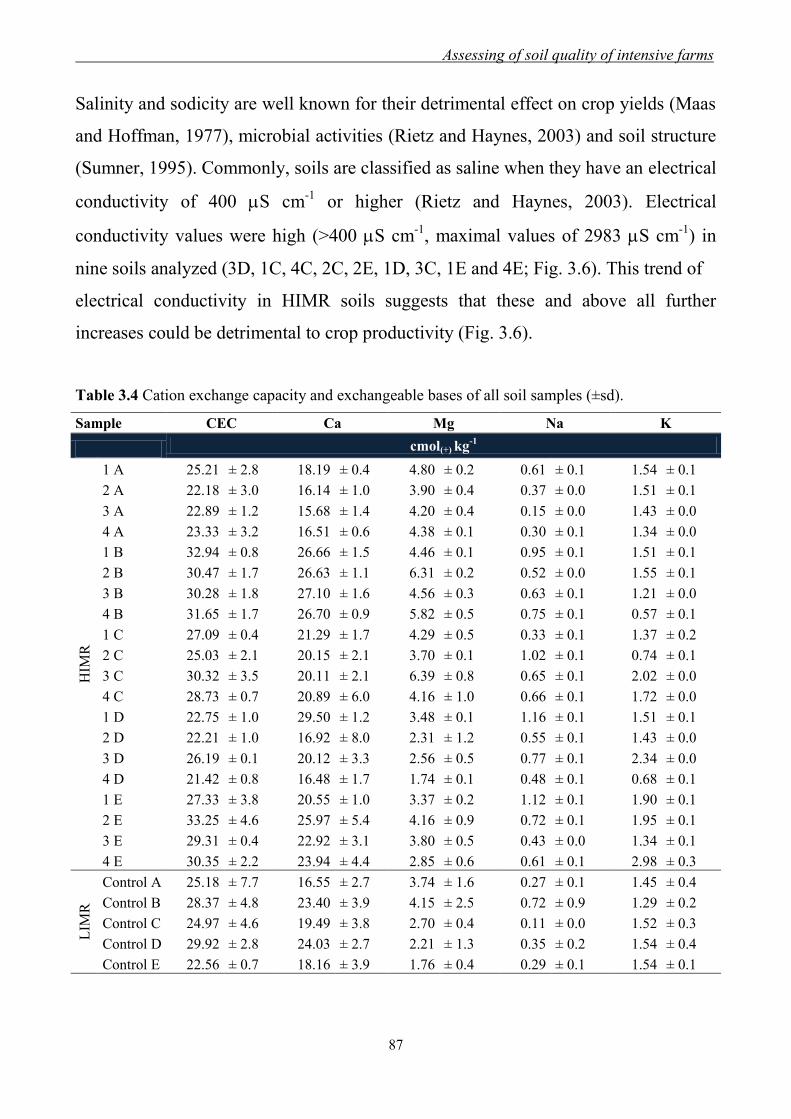
Assessing of soil quality of intensive farms
87
Salinity and sodicity are well known for their detrimental effect on crop yields (Maas
and Hoffman, 1977), microbial activities (Rietz and Haynes, 2003) and soil structure
(Sumner, 1995). Commonly, soils are classified as saline when they have an electrical
conductivity of 400 S cm-1
or higher (Rietz and Haynes, 2003). Electrical
conductivity values were high (>400 S cm-1
, maximal values of 2983 S cm-1
) in
nine soils analyzed (3D, 1C, 4C, 2C, 2E, 1D, 3C, 1E and 4E; Fig. 3.6). This trend of
electrical conductivity in HIMR soils suggests that these and above all further
increases could be detrimental to crop productivity (Fig. 3.6).
Table 3.4 Cation exchange capacity and exchangeable bases of all soil samples (±sd).
Sample CEC Ca Mg Na K
cmol(+) kg
-1
HIM
R
1 A 25.21 ± 2.8 18.19 ± 0.4 4.80 ± 0.2 0.61 ± 0.1 1.54 ± 0.1
2 A 22.18 ± 3.0 16.14 ± 1.0 3.90 ± 0.4 0.37 ± 0.0 1.51 ± 0.1
3 A 22.89 ± 1.2 15.68 ± 1.4 4.20 ± 0.4 0.15 ± 0.0 1.43 ± 0.0
4 A 23.33 ± 3.2 16.51 ± 0.6 4.38 ± 0.1 0.30 ± 0.1 1.34 ± 0.0
1 B 32.94 ± 0.8 26.66 ± 1.5 4.46 ± 0.1 0.95 ± 0.1 1.51 ± 0.1
2 B 30.47 ± 1.7 26.63 ± 1.1 6.31 ± 0.2 0.52 ± 0.0 1.55 ± 0.1
3 B 30.28 ± 1.8 27.10 ± 1.6 4.56 ± 0.3 0.63 ± 0.1 1.21 ± 0.0
4 B 31.65 ± 1.7 26.70 ± 0.9 5.82 ± 0.5 0.75 ± 0.1 0.57 ± 0.1
1 C 27.09 ± 0.4 21.29 ± 1.7 4.29 ± 0.5 0.33 ± 0.1 1.37 ± 0.2
2 C 25.03 ± 2.1 20.15 ± 2.1 3.70 ± 0.1 1.02 ± 0.1 0.74 ± 0.1
3 C 30.32 ± 3.5 20.11 ± 2.1 6.39 ± 0.8 0.65 ± 0.1 2.02 ± 0.0
4 C 28.73 ± 0.7 20.89 ± 6.0 4.16 ± 1.0 0.66 ± 0.1 1.72 ± 0.0
1 D 22.75 ± 1.0 29.50 ± 1.2 3.48 ± 0.1 1.16 ± 0.1 1.51 ± 0.1
2 D 22.21 ± 1.0 16.92 ± 8.0 2.31 ± 1.2 0.55 ± 0.1 1.43 ± 0.0
3 D 26.19 ± 0.1 20.12 ± 3.3 2.56 ± 0.5 0.77 ± 0.1 2.34 ± 0.0
4 D 21.42 ± 0.8 16.48 ± 1.7 1.74 ± 0.1 0.48 ± 0.1 0.68 ± 0.1
1 E 27.33 ± 3.8 20.55 ± 1.0 3.37 ± 0.2 1.12 ± 0.1 1.90 ± 0.1
2 E 33.25 ± 4.6 25.97 ± 5.4 4.16 ± 0.9 0.72 ± 0.1 1.95 ± 0.1
3 E 29.31 ± 0.4 22.92 ± 3.1 3.80 ± 0.5 0.43 ± 0.0 1.34 ± 0.1
4 E 30.35 ± 2.2 23.94 ± 4.4 2.85 ± 0.6 0.61 ± 0.1 2.98 ± 0.3
LIM
R
Control A 25.18 ± 7.7 16.55 ± 2.7 3.74 ± 1.6 0.27 ± 0.1 1.45 ± 0.4
Control B 28.37 ± 4.8 23.40 ± 3.9 4.15 ± 2.5 0.72 ± 0.9 1.29 ± 0.2
Control C 24.97 ± 4.6 19.49 ± 3.8 2.70 ± 0.4 0.11 ± 0.0 1.52 ± 0.3
Control D 29.92 ± 2.8 24.03 ± 2.7 2.21 ± 1.3 0.35 ± 0.2 1.54 ± 0.4
Control E 22.56 ± 0.7 18.16 ± 3.9 1.76 ± 0.4 0.29 ± 0.1 1.54 ± 0.1
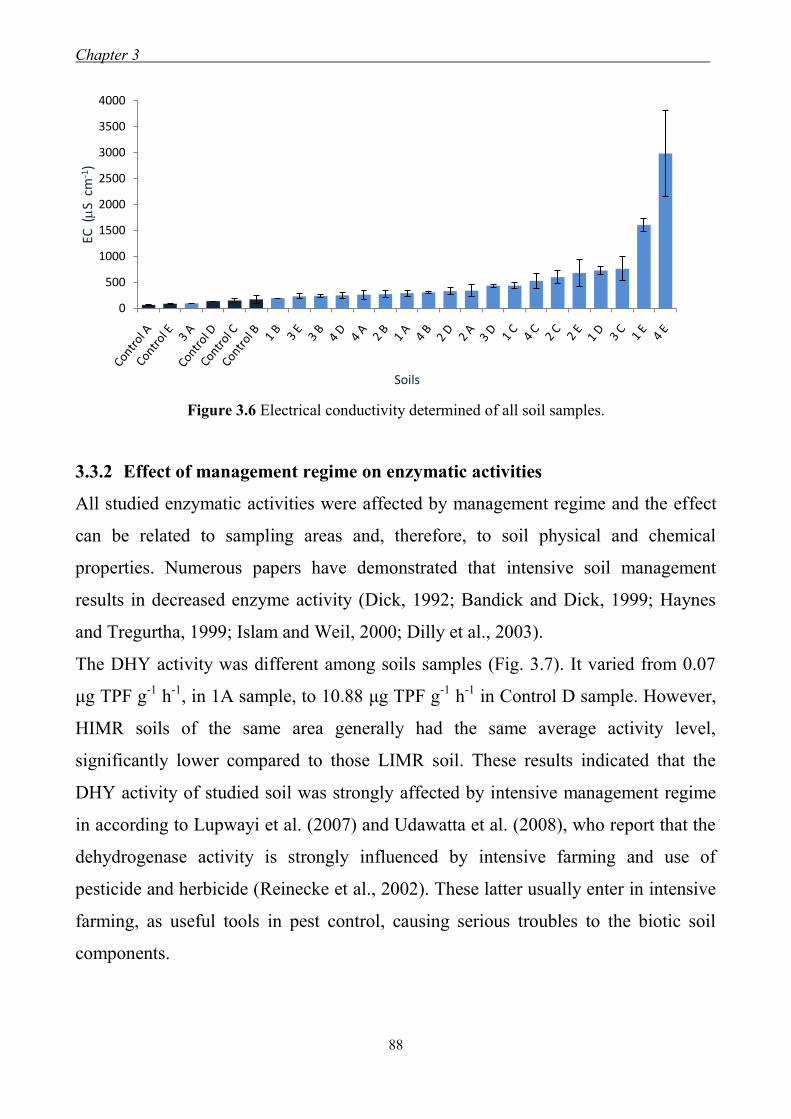
Chapter 3 .
88
Figure 3.6 Electrical conductivity determined of all soil samples.
3.3.2 Effect of management regime on enzymatic activities
All studied enzymatic activities were affected by management regime and the effect
can be related to sampling areas and, therefore, to soil physical and chemical
properties. Numerous papers have demonstrated that intensive soil management
results in decreased enzyme activity (Dick, 1992; Bandick and Dick, 1999; Haynes
and Tregurtha, 1999; Islam and Weil, 2000; Dilly et al., 2003).
The DHY activity was different among soils samples (Fig. 3.7). It varied from 0.07
μg TPF g-1
h-1
, in 1A sample, to 10.88 μg TPF g-1
h-1
in Control D sample. However,
HIMR soils of the same area generally had the same average activity level,
significantly lower compared to those LIMR soil. These results indicated that the
DHY activity of studied soil was strongly affected by intensive management regime
in according to Lupwayi et al. (2007) and Udawatta et al. (2008), who report that the
dehydrogenase activity is strongly influenced by intensive farming and use of
pesticide and herbicide (Reinecke et al., 2002). These latter usually enter in intensive
farming, as useful tools in pest control, causing serious troubles to the biotic soil
components.
0
500
1000
1500
2000
2500
3000
3500
4000EC
(
S c
m-1
)
Soils
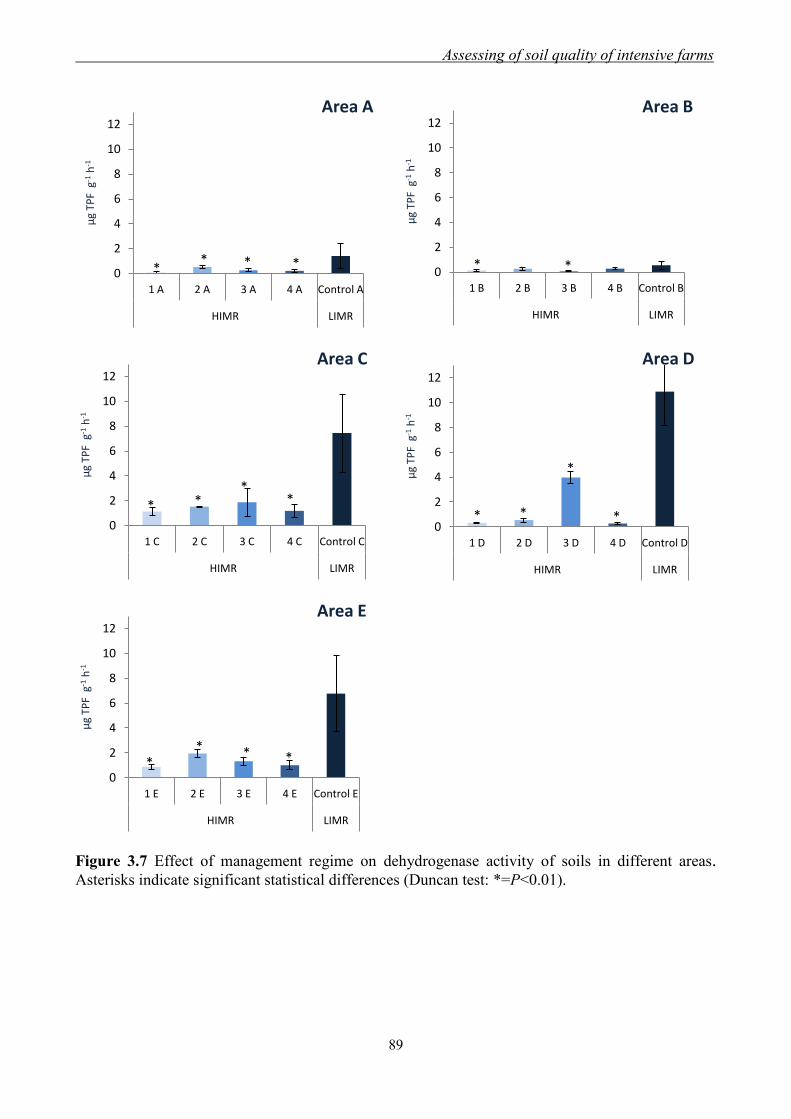
Assessing of soil quality of intensive farms
89
Figure 3.7 Effect of management regime on dehydrogenase activity of soils in different areas. Asterisks indicate significant statistical differences (Duncan test: *=P<0.01).
0
2
4
6
8
10
12
1 A 2 A 3 A 4 A Control A
HIMR LIMR
μg
TPF
g-1
h-1
Area A
** * *
0
2
4
6
8
10
12
1 B 2 B 3 B 4 B Control B
HIMR LIMR
μg
TPF
g-1
h-1
Area B
* *
0
2
4
6
8
10
12
1 C 2 C 3 C 4 C Control C
HIMR LIMR
μg
TPF
g-1
h-1
Area C
* **
*
0
2
4
6
8
10
12
1 D 2 D 3 D 4 D Control D
HIMR LIMR
μg
TPF
g-1
h-1
Area D
* *
*
*
0
2
4
6
8
10
12
1 E 2 E 3 E 4 E Control E
HIMR LIMR
μg
TPF
g-1
h-1
Area E
** * *

Chapter 3 .
90
Dehydrogenase activity provides information on soil chemical processes, nutrient
mineralization rates, and organic C accumulation. This enzyme is related to OM
oxidation since it catalyzes the aerobic respiration process occurring in the electron
transport chain (Ross, 1971). DHY activity depends on the metabolic state of soil
microorganism, although its use as indicator of soil microbial activity has been
criticized because these enzymes are affected by numerous factors (soil type, pH,
etc.) (Nannipieri et al., 1990; Beyer et al., 1992).
Also GLU activity was strongly affected by management regime (Fig. 3.8). In all
sampling areas, LIMR soils showed significantly higher GLU activity levels than
HIMR soils, with values ranging from 0.44 to 1.22 μmol p-NP g-1
h-1
. In all HIMR
samples values varied from 0.13 μmol p-NP g-1
h-1
(1D) to 0.33 μmol p-NP g-1
h-1
(3D), except 2B sample having a higher activity (0.73 μmol p-NP g-1
h-1
). -
Glucosidase catalyses the hydrolysis of -glucosides in soils and is one of enzyme
involved the decomposition of the plant residues. GLU activity reflects the state of
OM and the processes occurring therein. Moreover it has been used as sensitive
indicator of soil farming managements (Ndiaye et al., 2000; De la Horra et al., 2003;
Lagomarsino et al., 2009) as well as for the development of complex indices (Puglisi
et al., 2006).
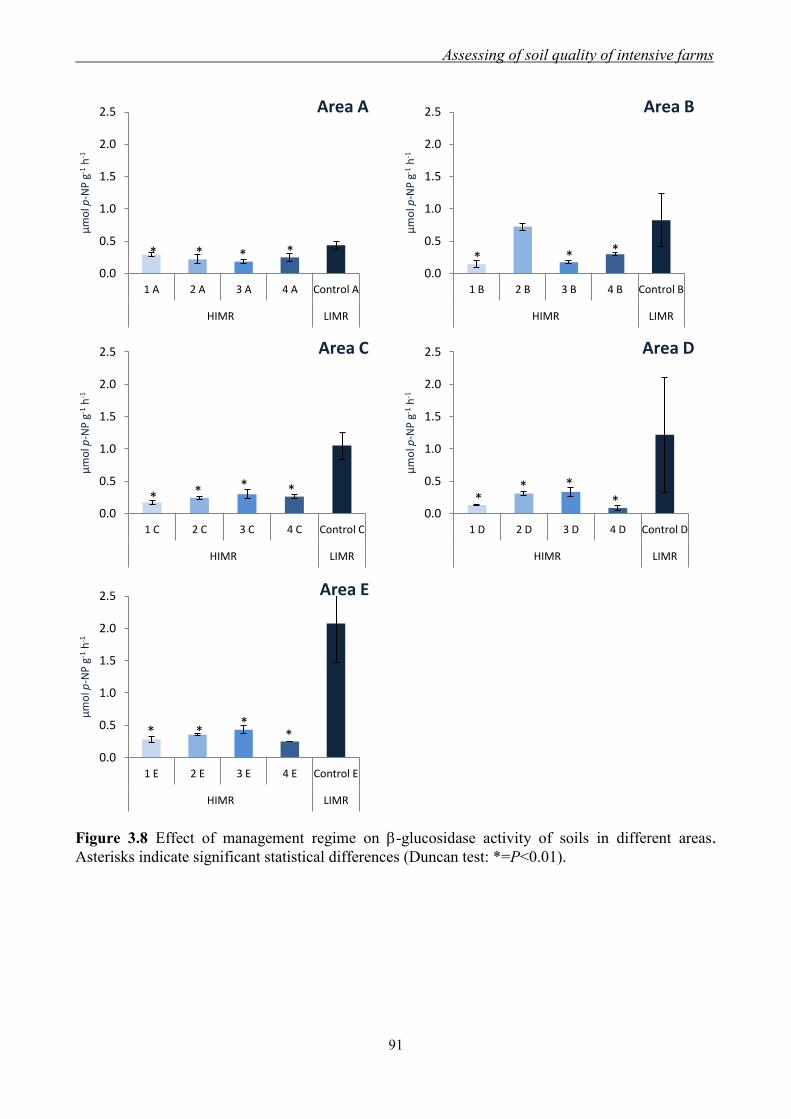
Assessing of soil quality of intensive farms
91
Figure 3.8 Effect of management regime on -glucosidase activity of soils in different areas. Asterisks indicate significant statistical differences (Duncan test: *=P<0.01).
0.0
0.5
1.0
1.5
2.0
2.5
1 A 2 A 3 A 4 A Control A
HIMR LIMR
μm
ol p
-NP
g-1
h-1
Area A
* * * *
0.0
0.5
1.0
1.5
2.0
2.5
1 B 2 B 3 B 4 B Control B
HIMR LIMR
μm
ol p-N
P g
-1h
-1
Area B
* * *
0.0
0.5
1.0
1.5
2.0
2.5
1 C 2 C 3 C 4 C Control C
HIMR LIMR
μm
ol p
-NP
g-1
h-1
Area C
* * * *
0.0
0.5
1.0
1.5
2.0
2.5
1 D 2 D 3 D 4 D Control D
HIMR LIMR
μm
ol p
-NP
g-1
h-1
Area D
** *
*
0.0
0.5
1.0
1.5
2.0
2.5
1 E 2 E 3 E 4 E Control E
HIMR LIMR
μm
ol p
-NP
g-1
h-1
Area E
* **
*
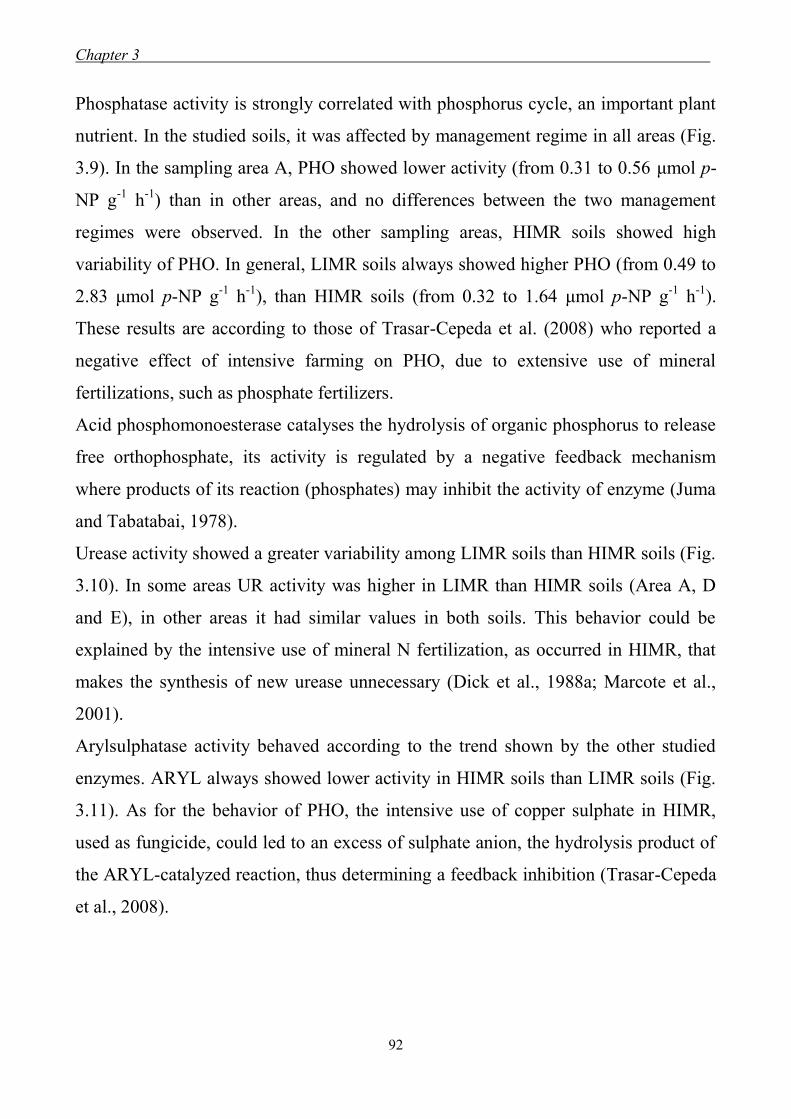
Chapter 3 .
92
Phosphatase activity is strongly correlated with phosphorus cycle, an important plant
nutrient. In the studied soils, it was affected by management regime in all areas (Fig.
3.9). In the sampling area A, PHO showed lower activity (from 0.31 to 0.56 μmol p-
NP g-1
h-1
) than in other areas, and no differences between the two management
regimes were observed. In the other sampling areas, HIMR soils showed high
variability of PHO. In general, LIMR soils always showed higher PHO (from 0.49 to
2.83 μmol p-NP g-1
h-1
), than HIMR soils (from 0.32 to 1.64 μmol p-NP g-1
h-1
).
These results are according to those of Trasar-Cepeda et al. (2008) who reported a
negative effect of intensive farming on PHO, due to extensive use of mineral
fertilizations, such as phosphate fertilizers.
Acid phosphomonoesterase catalyses the hydrolysis of organic phosphorus to release
free orthophosphate, its activity is regulated by a negative feedback mechanism
where products of its reaction (phosphates) may inhibit the activity of enzyme (Juma
and Tabatabai, 1978).
Urease activity showed a greater variability among LIMR soils than HIMR soils (Fig.
3.10). In some areas UR activity was higher in LIMR than HIMR soils (Area A, D
and E), in other areas it had similar values in both soils. This behavior could be
explained by the intensive use of mineral N fertilization, as occurred in HIMR, that
makes the synthesis of new urease unnecessary (Dick et al., 1988a; Marcote et al.,
2001).
Arylsulphatase activity behaved according to the trend shown by the other studied
enzymes. ARYL always showed lower activity in HIMR soils than LIMR soils (Fig.
3.11). As for the behavior of PHO, the intensive use of copper sulphate in HIMR,
used as fungicide, could led to an excess of sulphate anion, the hydrolysis product of
the ARYL-catalyzed reaction, thus determining a feedback inhibition (Trasar-Cepeda
et al., 2008).
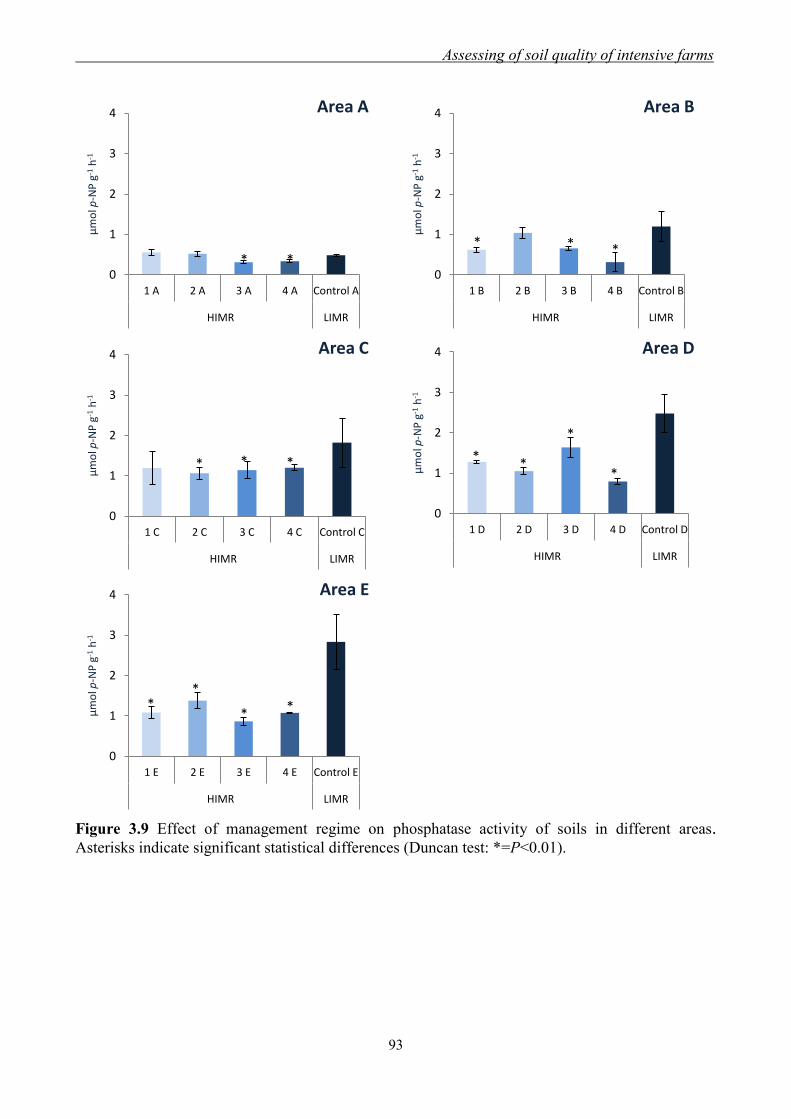
Assessing of soil quality of intensive farms
93
Figure 3.9 Effect of management regime on phosphatase activity of soils in different areas. Asterisks indicate significant statistical differences (Duncan test: *=P<0.01).
0
1
2
3
4
1 A 2 A 3 A 4 A Control A
HIMR LIMR
μm
ol p
-NP
g-1
h-1
Area A
* *0
1
2
3
4
1 B 2 B 3 B 4 B Control B
HIMR LIMR
μm
ol p-N
P g
-1h
-1
Area B
* * *
0
1
2
3
4
1 C 2 C 3 C 4 C Control C
HIMR LIMR
μm
ol p
-NP
g-1
h-1
Area C
* * *
0
1
2
3
4
1 D 2 D 3 D 4 D Control D
HIMR LIMR
μm
ol p
-NP
g-1
h-1
Area D
**
*
*
0
1
2
3
4
1 E 2 E 3 E 4 E Control E
HIMR LIMR
μm
ol p
-NP
g-1
h-1
Area E
**
**
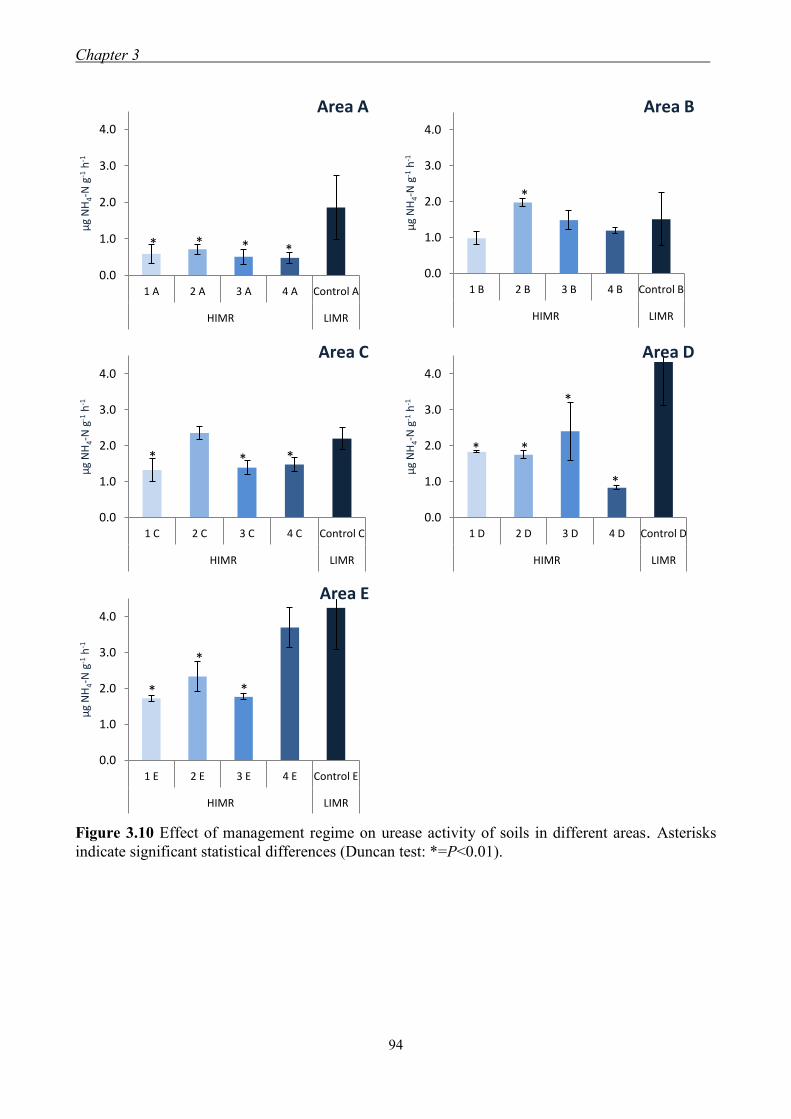
Chapter 3 .
94
Figure 3.10 Effect of management regime on urease activity of soils in different areas. Asterisks
indicate significant statistical differences (Duncan test: *=P<0.01).
0.0
1.0
2.0
3.0
4.0
1 A 2 A 3 A 4 A Control A
HIMR LIMR
μg
NH
4-N
g-1
h-1
Area A
* * * *
0.0
1.0
2.0
3.0
4.0
1 B 2 B 3 B 4 B Control B
HIMR LIMR
μg
NH
4-N
g-1
h-1
Area B
*
0.0
1.0
2.0
3.0
4.0
1 C 2 C 3 C 4 C Control C
HIMR LIMR
μg
NH
4-N
g-1
h-1
Area C
* * *
0.0
1.0
2.0
3.0
4.0
1 D 2 D 3 D 4 D Control D
HIMR LIMR
μg
NH
4-N
g-1
h-1
Area D
* *
*
*
0.0
1.0
2.0
3.0
4.0
1 E 2 E 3 E 4 E Control E
HIMR LIMR
μg
NH
4-N
g-1
h-1
Area E
*
*
*
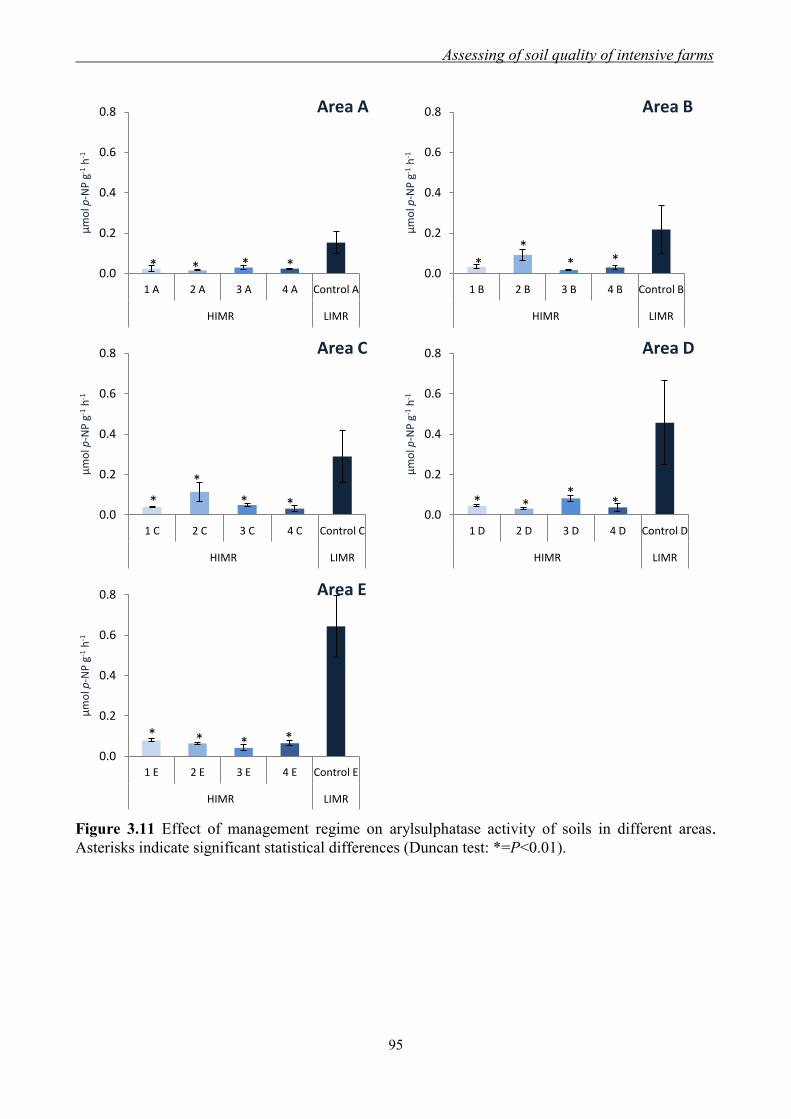
Assessing of soil quality of intensive farms
95
Figure 3.11 Effect of management regime on arylsulphatase activity of soils in different areas. Asterisks indicate significant statistical differences (Duncan test: *=P<0.01).
0.0
0.2
0.4
0.6
0.8
1 A 2 A 3 A 4 A Control A
HIMR LIMR
μm
ol p
-NP
g-1
h-1
Area A
* * * *0.0
0.2
0.4
0.6
0.8
1 B 2 B 3 B 4 B Control B
HIMR LIMR
μm
ol p
-NP
g-1
h-1
Area B
**
* *
0.0
0.2
0.4
0.6
0.8
1 C 2 C 3 C 4 C Control C
HIMR LIMR
μm
ol p
-NP
g-1
h-1
Area C
*
*
* *0.0
0.2
0.4
0.6
0.8
1 D 2 D 3 D 4 D Control D
HIMR LIMR
μm
ol p
-NP
g-1
h-1
Area D
* **
*
0.0
0.2
0.4
0.6
0.8
1 E 2 E 3 E 4 E Control E
HIMR LIMR
μm
ol p
-NP
g-1
h-1
Area E
* * * *

Chapter 3 .
96
To better understand how enzymatic activities could be valid indicators of soil
quality, an index developed by Puglisi et al. (2006) was used. Authors developed
three indices (AI 1, AI 2, and AI 3) able to discriminate altered and not altered soils.
Several enzymatic activities were considered and each of them was taken in account
with different weight. A wide research in literature allowed to Puglisi et al. (2006) to
validate the three indices, initially calculated from own experimental data.
The AI 3 index based on three enzyme activities (GLU, PHO and UR) was able to
identify altered soils among large soil series. Lower values of this index indicate less
altered soils; higher values indicate more altered soils. In the present work, this index
allowed to discriminate between LIMR soils and soils under intensive agricultural
management (HIMR). AI 3 index was -6 for HIMR soils and -7 for LIMR soils. (Fig.
3.12) thus highlighting an alteration of HIMR soils compared to LIMR soils.
Figure 3.12 Scores of soil index AI3, applied to mean values of enzymatic activities of all HIMR
and LIMR soils.
The effect of different management regimes may appear more evident by an overall
view of all studied physical, chemical and biochemical parameters. Figure 3.13
summarizes the effect of different management regimes on soil characteristics.
Values are expressed as deviation to respective Control (LIMR) in percentage of
mean values in all HIMR soils. It is clear that management regimes had a significant
effect on organic C content: it decreased by 24% in the HIMR compared to LIMR
farms (11.4 vs. 14.9 g kg-1
, respectively) (Fig. 3.13). In contrast, electrical
-7.5
-7.0
-6.5
-6.0
-5.5
-5.0
HIMR LIMR
Sco
re

Assessing of soil quality of intensive farms
97
conductivity, exchangeable Na+ and P2O5 increased by 370% (579 vs. 123 S cm
-1),
86% (147 vs. 79 cmol(+) kg
-1) and 78% (206 vs. 115 mg kg
-1), respectively in HIMR
compared to LIMR soils (Fig. 3.13). Exchangeable Mg2+
was slightly higher in
HIMR than in LIMR soils (Fig. 3.13). Also all enzymatic activities were significantly
affected by management regime. Dehydrogenase, arylsulphatase, β-glucosidase,
phosphatase and urease were reduced by 84% (0.89 vs. 5.41 µg TPF g-1
h-1
), 87%
(0.04 vs. 0.35 µg p-NF g-1
h-1
), 76% (0.27 vs. 1.12 µg p-NF g-1
h-1
), 49% (0.90 vs.
1.76 µg p-NF g-1
h-1
) and 46% (1.54 vs. 2.83 µg NH4-N g-1
h-1
) in the HIMR
compared to the LIMR, respectively (Fig. 3.13).
Figure 3.13 Effect of soil management on physical, chemical and biochemical properties. Values
are expressed as percentage decrease or increase in HIMR compared to LIMR (=0) soils, used as
Control. Asterisks indicate significant statistical differences (Duncan test: ***=P<0.001;
**=P<0.01; *=P<0.05; ns=not significant).
All reported results showed a great variability in biochemical properties among
farms and areas, due to differences in physical-chemical soil properties and to
different farm history. Clear evidence was that LIMR, not subjected to intensive
farming, generally showed higher enzymatic activities compared to HIMR, indicating
a negative effect of intensive agriculture practices on biochemical properties of
studied soils. This result is consistent with the findings of many studies that reported
-100
-50
0
50
100
150
200
250
300
350
400
AR
YL
DH
Y
GLU
PH
O
UR
Org
anic
C
CEC
Tota
l N C/N
San
d
Silt
pH
Po
tass
ium
Cal
ciu
m
Cla
y
Mag
ne
siu
m
Lim
est
on
e
Ph
osp
ho
rus
Sod
ium EC
%
*nsns
ns ns ns**
ns*** ***
***
*** *** ****** ***
ns
nsnsns
Chapter 3 .
98
a decline of enzymatic activities in cultivated soils when compared to the
corresponding uncultivated or less-disturbed soils (Drinkwater et al., 1995; Gianfreda
et al., 2005; Acosta-Martínez et al., 2008).
3.3.3 Relationship between soil physical, chemical and biochemical parameters
The whole cross-correlation matrix, being composed of 20 parameters and indices,
produced 190 Pearson correlation coefficients (Table 3.5). The most relevant results
are described below.
Soil organic C content strongly correlated negatively with clay and positively with
sand content. Moreover, it showed a strong negative correlation with exchangeable
Mg2+
. When all HIMR farms were considered, a weak positive correlation was found
between their organic C and limestone contents. Soil electrical conductivity reported
significant correlations with potassium and phosphorus content, but not with the
biological soil functions, as enzymatic activities. In our study all enzymatic activities
showed strongly positive correlations with soil organic C content (P<0.01), except
for -glucosidase (P<0.05). Their values higher in LIMR than HIMR soils indicate
that even a slight increase of organic carbon can promote enzymes protection and
induce significant changes of biochemical activity and demonstrating the efficacy of
this enzyme to value different agricultural managements. However, other soil factors
also significantly affect enzymatic activities.
Rietz and Haynes (2003) found strong negative correlations between soil electrical
conductivity and enzymatic activities (hydrolysis of fluoresceine diacetate, β-
glucosidase, alkaline phosphatase and arylsulphatase). In our study the weak, but not
significant, negative correlation between enzymatic activities and both electrical
conductivity and Na+ content could be explained by the narrower range of soil
salinity values measured in our farms compared to those reported by Rietz and
Haynes (2003).
The consistent negative correlations between enzymatic activities and clay content
and exchangeable Mg2+
could be accounted for by the high affinity of protein
Assessing of soil quality of intensive farms
99
molecules for clay surfaces. This could strongly reduce their catalytic activity
because of induced conformational changes, inter-layering phenomena, and inhibition
effects (Gianfreda and Ruggiero, 2006). In general the lower enzymatic activities in
the HIMR soils indicate a reduced microbial activity and, probably, a lower
capability to cleave organic P, S and to degrade OM compared to LIMR soils.
Moreover, the consistent decline of enzymatic activities across the soil texture
gradient indicates that such parameters provide sensitive indicators of the impact of
intensive cultivation on soil quality.
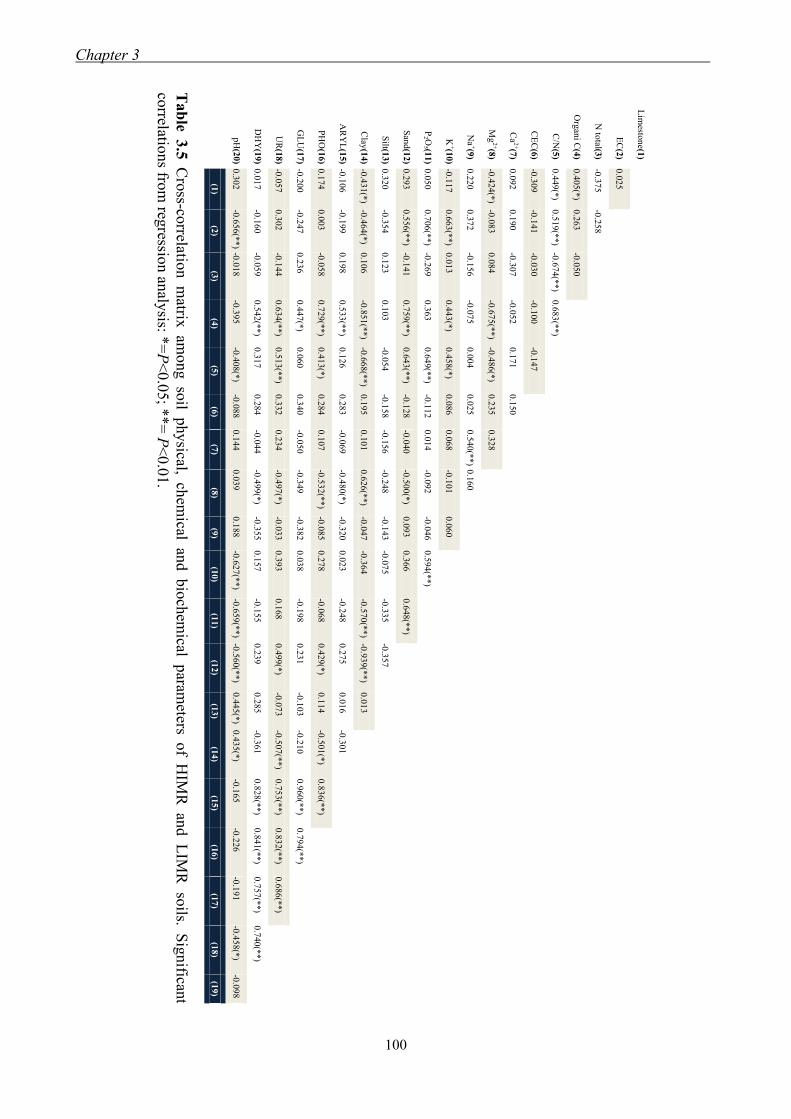
Chapter 3 .
100
Tab
le 3.5
C
ross-co
rrelation m
atrix am
ong so
il physical,
chem
ical an
d bio
chem
ical p
arameters
of
HIM
R an
d L
IMR
so
ils. S
ignifican
t
correlatio
ns fro
m reg
ression an
alysis: *
=P
<0.0
5; *
*=
P<
0.0
1.
pH
DH
Y
UR
GL
U
PH
O
AR
YL
Clay
Silt
San
d
P2 O
5
K+
Na
+
Mg
2+
Ca
2+
CE
C
C/N
Org
ani C
N to
tal
EC
Lim
estone (2
0)
(19)
(18)
(17)
(16)
(15)
(14)
(13)
(12)
(11)
(10)
(9)
(8)
(7)
(6)
(5)
(4)
(3)
(2)
(1)
(1)
0.3
02
0.0
17
-0.0
57
-0.2
00
0.1
74
-0.1
06
-0.4
31(*
)
0.3
20
0.2
93
0.0
50
-0.1
17
0.2
20
-0.4
24(*
)
0.0
92
-0.3
09
0.4
49(*
)
0.4
05(*
)
-0.3
75
0.0
25
(2)
-0.6
56(*
*)
-0.1
60
0.3
02
-0.2
47
0.0
03
-0.1
99
-0.4
64(*
)
-0.3
54
0.5
56(*
*)
0.7
06(*
*)
0.6
63(*
*)
0.3
72
-0.0
83
0.1
90
-0.1
41
0.5
19(*
*)
0.2
63
-0.2
58
(3)
-0.0
18
-0.0
59
-0.1
44
0.2
36
-0.0
58
0.1
98
0.1
06
0.1
23
-0.1
41
-0.2
69
0.0
13
-0.1
56
0.0
84
-0.3
07
-0.0
30
-0.6
74(*
*)
-0.0
50
(4)
-0.3
95
0.5
42(*
*)
0.6
34(*
*)
0.4
47(*
)
0.7
29(*
*)
0.5
33(*
*)
-0.8
51(*
*)
0.1
03
0.7
59(*
*)
0.3
63
0.4
43(*
)
-0.0
75
-0.6
75(*
*)
-0.0
52
-0.1
00
0.6
83(*
*)
(5)
-0.4
08(*
)
0.3
17
0.5
13(*
*)
0.0
60
0.4
13(*
)
0.1
26
-0.6
68(*
*)
-0.0
54
0.6
43(*
*)
0.6
49(*
*)
0.4
58(*
)
0.0
04
-0.4
86(*
)
0.1
71
-0.1
47
(6)
-0.0
88
0.2
84
0.3
32
0.3
40
0.2
84
0.2
83
0.1
95
-0.1
58
-0.1
28
-0.1
12
0.0
86
0.0
25
0.2
35
0.1
50
(7)
0.1
44
-0.0
44
0.2
34
-0.0
50
0.1
07
-0.0
69
0.1
01
-0.1
56
-0.0
40
0.0
14
0.0
68
0.5
40
(**
)
0.3
28
(8)
0.0
39
-0.4
99
(*)
-0.4
97
(*)
-0.3
49
-0.5
32
(**
)
-0.4
80
(*)
0.6
26
(**
)
-0.2
48
-0.5
00
(*)
-0.0
92
-0.1
01
0.1
60
(9)
0.1
88
-0.3
55
-0.0
33
-0.3
82
-0.0
85
-0.3
20
-0.0
47
-0.1
43
0.0
93
-0.0
46
0.0
60
(10
)
-0.6
27
(**
)
0.1
57
0.3
93
0.0
38
0.2
78
0.0
23
-0.3
64
-0.0
75
0.3
66
0.5
94
(**
)
(11
)
-0.6
59
(**
)
-0.1
55
0.1
68
-0.1
98
-0.0
68
-0.2
48
-0.5
70
(**
)
-0.3
35
0.6
48
(**
)
(12
)
-0.5
60
(**
)
0.2
39
0.4
99
(*)
0.2
31
0.4
29
(*)
0.2
75
-0.9
39
(**
)
-0.3
57
(13)
0.4
45
(*)
0.2
85
-0.0
73
-0.1
03
0.1
14
0.0
16
0.0
13
(14
)
0.4
35(*
)
-0.3
61
-0.5
07
(**
)
-0.2
10
-0.5
01
(*)
-0.3
01
(15)
-0.1
65
0.8
28(*
*)
0.7
53(*
*)
0.9
60(*
*)
0.8
36(*
*)
(16)
-0.2
26
0.8
41
(**)
0.8
32
(**)
0.7
94
(**)
(17)
-0.1
91
0.7
57(*
*)
0.6
86(*
*)
(18)
-0.4
58(*
)
0.7
40(*
*)
(19)
-0.0
98
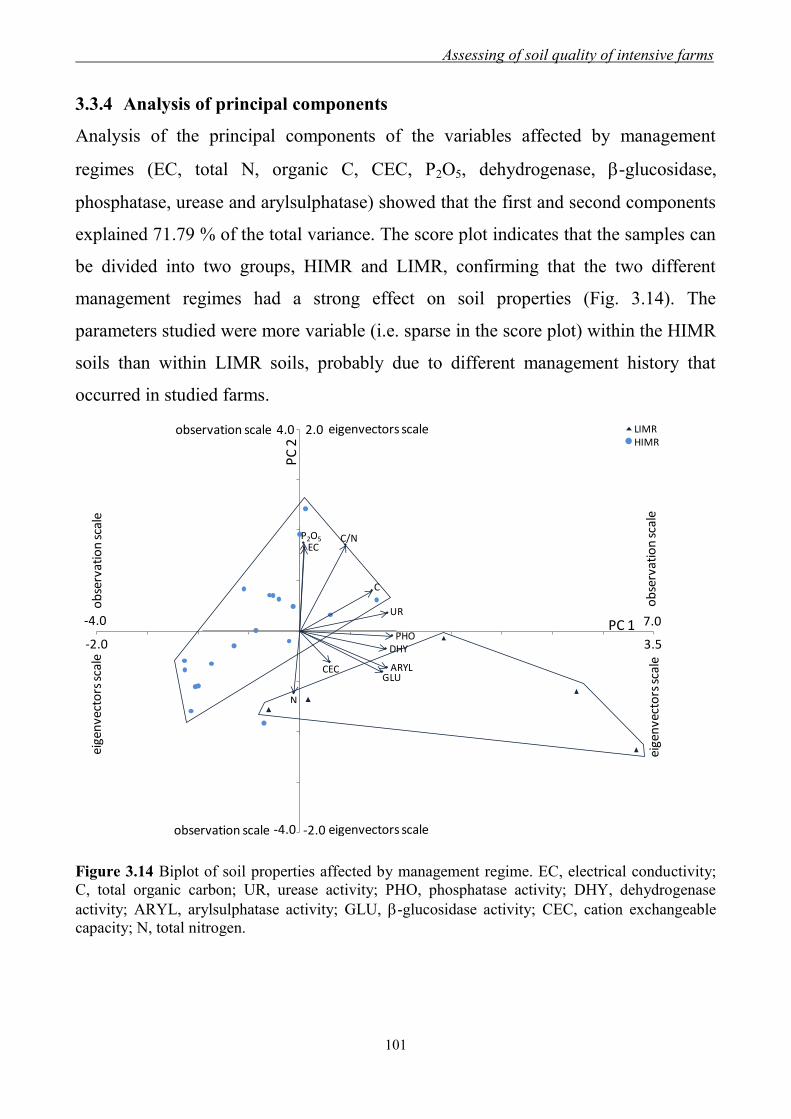
Assessing of soil quality of intensive farms
101
3.3.4 Analysis of principal components
Analysis of the principal components of the variables affected by management
regimes (EC, total N, organic C, CEC, P2O5, dehydrogenase, -glucosidase,
phosphatase, urease and arylsulphatase) showed that the first and second components
explained 71.79 % of the total variance. The score plot indicates that the samples can
be divided into two groups, HIMR and LIMR, confirming that the two different
management regimes had a strong effect on soil properties (Fig. 3.14). The
parameters studied were more variable (i.e. sparse in the score plot) within the HIMR
soils than within LIMR soils, probably due to different management history that
occurred in studied farms.
Figure 3.14 Biplot of soil properties affected by management regime. EC, electrical conductivity;
C, total organic carbon; UR, urease activity; PHO, phosphatase activity; DHY, dehydrogenase
activity; ARYL, arylsulphatase activity; GLU, -glucosidase activity; CEC, cation exchangeable
capacity; N, total nitrogen.
LIMRHIMR
ARYL
N
C/N
PHO
GLU
DHY
UR
EC
CEC
P2O5
C
eige
nve
cto
rs s
cale
ob
serv
atio
n s
cale
7.0
3.5
ob
serv
atio
n s
cale
eige
nve
cto
rs s
cale
-4.0
-2.0
observation scale eigenvectors scale 2.04.0
observation scale eigenvectors scale-2.0-4.0
PC
2
PC 1
Chapter 3 .
102
3.4 Conclusions
This study has demonstrated that long-lasting soil cultivation under plastic cover
negatively affects chemical and biochemical soil quality. The reduction in soil C
content and soil enzymatic activities, determining a decrease of functional and
species diversity, and the drastic increase in soil salinity are the result of such land
use. The full consequences of such changes on crop productivity are still unknown,
but they probably determine a multiple stress to plants with potential negative
consequences on crop yield. Phytopathological disorders with complex, often
unidentified ethyology are growing under the HIMR, and farmers continuously
increase the cultivation inputs (mainly soil fumigations and mineral fertilizers) to
overcome such problems and maintain crop productivity. Further studies are needed
to identify agronomic strategies that will mitigate the negative effects of HIMR
cultivation on soil quality.
Assessing of soil quality of intensive farms
103
3.5 References
Abiven S., Menassero S., Chenu C., 2009. The effect of organic inputs over time on
soil aggregate stability, A literature analysis. Soil Biology and Biochemistry 41:1-
12.
Acosta-Martínez V., Acosta Mercado D., Sotomajor-Ramírez D., Cruz-Rodríguez, L.,
2008. Microbial community and enzymatic activities under different management
in semiarid soils. Applied Soil Ecology 38:249-260.
Bandick A.K. and Dick R., 1999. Field management effects on soil enzyme activities.
Soil Biology and Biochemistry 31:1471-1479.
Beyer L., Wackendorf C., Balzen F.M., Balzer-Graf,V.R., 1992. The effect of soil
texture and soil management on microbial biomass and soil enzyme activities in
arable soils of Northwest Germany. Agrobiology Research 45:276-283.
Birkhofer K., Bezemer T.M., Bloem J., Bonkowski M., Christensen S., Dubois D.,
Ekelund F., Fließbach A., Gunst L., Hedlund K., Mäder P., Mikola J., Robin C.,
Setälä H., Tatin-Froux F., Van der Putten W.H., Scheu S., 2008. Long-term
organic farming fosters below and aboveground biota: Implications for soil quality,
biological control and productivity. Soil Biology and Biochemistry 40:2297-2308.
Bloem J., Hopkins D.W., Benedetti A., 2006a. Microbiological methods for assessing
soil quality. CABI Publishing, Oxfordshire, UK..
Bloem J., Schouten A.J., Sørensen S.J., Rutger M., van der Werf A., Breure A.M.,
2006b. Monitoring and evaluating soil quality. In: Bloem, J. Hopkins, D.W.,
Benedetti, A., (Eds.), Microbiological methods for assessing soil quality. CABI
Publishing, Oxfordshire, UK..
Bonanomi G., Antignani V., Pane C., Scala F., 2007. Suppression of soilborne fungal
diseases with organic amendments. Journal of Plant Pathology 89:311-340.
Caravaca F., Masciandaro G., Ceccanti B., 2002. Land use in relation to soil chemical
and biochemical properties in a semiarid Mediterranean environment. Soil Tillage
Research 68:23-30.
Chapter 3 .
104
De la Horra A.M., Conti M.E., Palma R.M., 2003. -Glucosidase and protease
activities as affected by long-term management practices in a Typic Argiudoll soil.
Commun. Soil Science & Plant Nutrition 34:2395-2404.
Dick R.P., Myrold D.D., Kerle E.A., 1988. Microbial biomass and soil enzyme
activities in compacted and rehabilitated skid trail soils. Soil Science Society of
America Journal 52:512-516.
Dick R.P., 1992. A review: Long term effects of agricultural systems on soil
biochemical and microbial parameters. Agriculture, Ecosystems and Environment
40:25-36.
Dilly O., Blume H.P., Munch J.C., 2003. Soil microbial activities in Luvisols and
Anthrosols during 9 years of region-typical tillage and fertilization practices in
northern Germany. Biogeochemistry 65:319-339.
Doran J.W. and Parkin T.B., 1994. Defining and assessing soil quality. In: Defining
Soil Quality or a Sustainable Environment. Doran J.W., Coleman D.C., Bezdicek
D.F. and Stewart B.A. (Eds.), SSSA Inc Madison, USA..
Drinkwater L.E., Letourneau D.K., Workneh F., van Bruggen A.H.C., Shennan C.,
1995. Fundamental differences between conventional and organic tomato
agroecosystems in California. Ecological Applications 5, 1098-1112.
Enoch H.Z., Enoch Y., 1999. The history and geography of the greenhouse. In:
Stanhil G., Enoch H.Z., (Eds.), Greenhouse Ecosystems. Ecosystems of the World
20. Elsevier, Amsterdam, pp. 1-15.
Fließbach A., Oberholzer H.-R., Gunst L., Mäder P., 2007. Soil organic matter and
biological soil quality indicators after 21 years of organic and conventional
farming. Agriculture, Ecosystems and Environment 18:273-284.
Gianfreda L., Rao M.A., Piotrowska A., Palombo G., Colombo C., 2005. Soil
enzyme activities as affected by anthropogenic alterations: intensive agricultural
practices and organic pollution. Science of the Total Environment 341:265-279.
Assessing of soil quality of intensive farms
105
Gianfreda L., Ruggiero P., 2006. Enzyme Activities in Soil. In: Soil Biology, Volume
8: Nucleic Acids and Proteins in Soil. (P. Nannipieri and K. Smalla, Eds.),
Springer-Verlag Berlin Heidelberg, pp.257-311.
Gregorich E.G., Carter M.R., Angers D.A., Monreal C.M., Ellert B.H., 1994.
Towards a minimum data set to assess soil organic quality in agricultural soils.
Canadian Journal of Soil Science 74:367-385.
Haynes R.J., 2000. Labile organic matter as an indicator of organic matter quality in
arable and pastoral soils in New Zealand. Soil Biology and Biochemistry 32:211-
219.
Haynes R.J., Tregurtha R., 1999. Effects of increasing periods under intensive arable
vegetable production on biological, chemical and physical indices of soil quality.
Biology and Fertility of Soils 28:259-266.
Hinojosa M.B., Carreira J.A., García- Ruiz R., Dick R.P., 2004. Soil moisture pre-
treatment effects on enzyme activities as indicators of heavy metal-contaminated
and reclaimed soils. Soil Biology and Biochemistry 36:1559-1568.
Islam K.R., Weil R.R., 2000. Land use effects on soil quality in a tropical forest
ecosystem of Bangladesh. Agriculture, Ecosystems and Environment 79:9-16.
Janvier C., Villeneuve F., Alabouvette C., Edel-Hermann V., Mateille T., Steinberg
C., 2007. Soil health through soil disease suppression: Which strategy from
descriptors to indicators? Soil Biology and Biochemistry 39:1-23.
Juma N.G. and Tabatabai M.A., 1978. Distribution of phosphomonoesterases in soils.
Soil Sci 126:101-108.
Kandeler E. and Gerber H., 1988. Short-term assay of soil urease activity using
colorimetric determination of ammonium. Biology and Fertility of Soils 6:68-72.
Lagomarsino A., Di Tizio A., Marinari S., Moscatelli M.C., Mancinelli R., Grego S.,
in press. Soil organic matter pools under different system management and tillage
level in a three-year crop rotation. Agrochimica.

Chapter 3 .
106
Leirós M.C., Trasar-Cepeda C., García-Fernández F., Gil- Sotres F., 1999. Defining
the validity of a biochemical index of soil quality. Biology and Fertility of Soils
30:140-146.
Loeppert R.H., Suarez D.L., 1996. Carbonate and gypsum. In: Sparks, D.L. (Ed.),
Methods of Soil Analysis. Part 3 e Chemical Methods. SSSA Book Series no. 5.
SSSA-ASA, Madison, WI, USA, pp. 437-474.
Loveland P., Webb J., 2003. Is there a critical level of organic matter in the
agricultural soils of temperate regions: a review. Soil Tillage Research 70:1-18.
Lupwayi N.Z., Hanson K.G., Harker K.N., Clayton G.W., Blackshaw R.E.,
O'Donovan J.T., Johnson E.N., Gan Y., Irvine R.B., Monreal M.A., 2007. Soil
microbial biomass functional diversity and enzyme activity in glyphosate-resistant
wheat-canola rotations under low-disturbance direct seeding and conventional
tillage. Soil Biology and Biochemistry 39:1418-1427.
Maas E.V., Hoffman G.J., 1977. Crop salt tolerance - current assessment. Journal of
Irrigation and Drainage Engineering 103:115-134.
Mäder P., Flieβbach A., Dubois D., Gunst L., Fried P., Niggli U., 2002. Soil fertility
and biodiversity in organic farming. Science 296, 1694-1697.
Marcote I., Hernandez T., Garcia C., Polo A., 2001. Influence of one or two
successive annual applications of organic fertilisers on the enzyme activity of a soil
under barley cultivation. Bioresource Technology 79, 147-154.
Martens D.A., Reedy T.E., Lewis D.T., 2003. Soil carbon content and composition of
130-year crop, pasture and forest land-use managements. Global Change Biology
10:65-78.
Marzaioli R., D‟Ascoli R., De Pascale R.A., Rutigliano F.A., 2010. Soil quality in a
Mediterranean area of Southern Italy as related to different land use types. Applied
Soil Ecology 44:205-212.
Moolenaar S.W., Van Der Zee S.E.A.T.M., Lexmond T.M., 1997. Indicators of the
sustainability of heavy-metal management in agro-ecosystems. Science of the Total
Environment 201:155-169.
Assessing of soil quality of intensive farms
107
Nannipieri P., Greco S., Ceccanti B., 1990. Ecological significance of the biological
activity in soil. In: Bollag, J.M., Stotzky, G. (Eds.), Soil Biochemistry, 6:293-355.
Ndiaye E.L., Sandeno J.M., McGrath D., Dick R.P., 2000. Integrative biological
indicators for detecting change in soil quality. American Journal of Alternative
Agriculture 15:26-36.
Puglisi E., Del Rea A.A.M., Rao M.A., Gianfreda L., 2006. Development and
validation of numerical indexes integrating enzyme activities of soils. Soil Biology
and Biochemestry 38:1673-1681.
Reinecke A.J., Helling B., Louw K., Fourie J., Reinecke S.A., 2002. The impact of
different herbicides and cover crops on soil biological activity in vineyards in the
Western Cape, South Africa. Pedobiologia 46:475-484.
Rietz D.N., Haynes R.J., 2003. Effects of irrigation-induced salinity and sodicity on
soil microbial activity. Soil Biology and Biochemistry 35:845-854.
Ross D.J., 1971. Some factors influencing the estimation of dehydrogenase activities
of some soil under pasture. Soil Biology and Biochemistry 3:97-110.
SAS Institute, 2008. SAS/STAT Users‟ Guide. Release 6.08. Ed. SAS, Cary, NC.
Schloter M., Dilly O., Munch J.C., 2003. Indicators for evaluating soil quality.
Agriculture, Ecosystems and Environment 98:255-262.
Sparks D.L., 1996. Methods of Soil Analysis. Part 3. Chemical Methods. SSSA Book
Series 5 SSSA and ASA, Madison, WI.
Sumner M.E., 1995. Sodic soils: new perspectives. In: Naidu, R., Sumner, M.E.,
Rengasamy, P., (Eds), Australian Sodic Soils: Distribution, Properties, and
Management. CSIRO, Melbourne, pp. 1-34.
Tiessen H., Cuevas E., Chacon, P., 1994. The role of soil organic matter in sustaining
soil fertility. Nature 371:783-785.
Trasar-Cepeda C., Leiròs M.C, Gil-Sotres F., 2008. Hydrolytic enzyme activities in
agricultural and forest soils. Some implications for their use as indicators of soil
quality. Soil Biology and Biochemistry 40:2146-2155.
Chapter 3 .
108
Trevors J.T., 1984. Dehydrogenase activity in soil. A comparison between the INT
and TTC assay. Soil Biology and Biochemistry 16:673-674.
Udawatta R.P., Kremer R.J., Adamson B.W., Anderson S.H., 2008. Variations in soil
aggregate stability and enzyme activities in a temperate agroforestry practice.
Applied Soil Ecology 39:153-160.
United States Department of Agriculture Natural Resources Conservation Service
(USDA) Soil Survey Staff, 1998. Keys to Soil Taxonomy. Washington.
Weller D.M., Raaijmakers J.M., Gardener B.B.M., Thomashow L.S., 2002. Microbial
populations responsible for specific soil suppressiveness to plant pathogens.
Annual Review of Phytopathology 40:309-348.

109
Chapter 4
Organic amendments to improve
soil quality under intensive farming
4.1 Introduction
Demand for organically produced food has increased by 24% yearly in the USA in
the 1990s, as many consumers have expressed concern over pesticide residues on
foods (Govindasamy and Italia, 1998; Thompson, 1998). Food and environmental
safety are often-cited reasons for the use of alternative soil amendments, but
increasingly economic considerations are becoming important with a rise in
popularity of organically produced foods (Govindasamy and Italia, 1998; Klonsky
and Tourte, 1998; Thompson, 1998).
On the other hand, the growing demand of food and the necessity to produce
agricultural products throughout the year have prompted farmers to adopt more
intensive cultivation techniques.
The long-term performance of intensive agricultural systems is important for poverty
alleviation and sustaining food production against continued population growth, but
studies on long-term effects can provide key data for understanding many relevant
effects of intensive agriculture managements on soil properties (Bonanomi et al.,
2010).
The intensive agriculture determines a decrease of soil fertility, due to crop systems
based on monoculture, continuous tillage, and excessive use of pesticides and mineral
fertilizations (Marcote et al., 2001). In particular, the intensive agriculture under
greenhouse, due to high temperature under cover and the rains lack, determines a
strong decrease of organic carbon in the soil, favoring mineralization processes.
The decline in organic matter (OM) content of many soils is becoming a major
process of soil degradation, particularly in European semi-arid Mediterranean
Chapter 4 .
110
regions. Degraded soils are not fertile and thus cannot maintain sustainable
production.
Use of organic amendments is generally seen as a key tool for soil health and
sustainability in intensive agriculture systems, both in terms of maintaining the
amount and quality of soil OM and in terms of supplying important micronutrients
(Gill and Meelu, 1982; Ponnamperuma, 1984; Mahapatra et al., 1991; Bronson et al.,
1997; Nambiar, 1997; Singh et al., 1997; Reichardt et al., 2000; Yadav et al., 1998;
Timsina and Connor, 2001).
The use of organic amendments has been associated with desirable soil properties
including higher plant available water holding capacity, lower bulk density and CEC,
and can foster beneficial microorganisms (Doran, 1995; Drinkwater et al., 1995).
Benefits of compost amendments to soil also include pH stabilization and faster water
infiltration rate due to enhanced soil aggregation (Stamatiadis et al., 1999). If from
one hand, soil chemical properties are positively affected by organic amendment,
from the other hand, yields of crops grown, under organic amendment, can be
equivalent to those under conventional fertilizers. Vegetable fields under organic
amendments in California produced yields equal to those under conventional
production (Drinkwater et al., 1995; Stamatiadis et al., 1999).
The application of organic amendments, such as compost, has been proposed, in
successfully many cases, to improve the structural and chemical fertility of soils
(Zucconi, 1996; Magid et al., 2001; Conklin et al. 2002; Cavigelli and Thien, 2003),
the biological (Borken et al. 2002; Ros et al 2003), as well as for monitoring telluric
pathogens (Hoitink and Boehm, 1999; Bonanomi et al., 2007).
The same studies have demonstrated that the effectiveness of organic amendments to
recovery of soil fertility depends on the kind of used OM, doses and agronomic
practices. If these variables are not handled properly, the amendment may result in
insignificant or even harmful effects on the productivity of the crop (phytotoxicity,
increase in the incidence of pathogens) and environmental (release of nitrates) due to
rapid mineralization and low efficiency of humification (Zucconi, 1996). Most of the
Organic amendments to improve soil quality
111
studies carried out on different Italian soil also in the context of the Piana del Sele
(Morra et al., 2006; Zaccardelli et al., 2006) indicated that the application of organic
amendments characterized by easily decomposable material (low C/N) could lead to a
not persistent increase of OM. For example, Morra et al. (2006) found no positive
change in the balance of C three years after the yearly compost supply of 30 t ha-1
.
In this context it is clear that it weeds to set up experimental designs aimed to identify
conditions which can maximize the humification efficiency.
The amendment should be not limited to guarantee the labile OM, that ameliorates
physical properties, enhances nutrient availability and improve soil biological
activity in short term. The treatment should produce long-term advantages and
therefore, besides having beneficial effect on physical, chemical and biological
properties, described above, it should favour humification processes and retard OM
mineralization rate.
Aim of this work was to study the fertility recover in agricultural soils, under
intensive farming for long time, by supplying compost enriched with wood scraps, in
order to have a material that undergoes a slower mineralization process.
The hypothesis was that when less easily degradable OM arrives in soil, more
complex chemical and biological processes occurred that could lead to well know
increase of OM, but also to retard mineralization process or at least to improve the
quality and stability of soil OM. All these expected results would guarantee beneficial
effects on soil fertility in long-term.
This study has been conducted in two farms selected among those studied in the
previous research step (Chapter 3). Different amount of a mixture having compost
from municipal solid waste, as a source of easily degradable OM, and wood (scraps
of poplars pruning), as a slow degradation source, were used.
After the amendments at different ratio and doses, main soil chemical properties (pH,
electrical conductibility, CEC, organic carbon content, total nitrogen, available
phosphorus) and main enzymatic activities (dehydrogenase, -glucosidase,
Chapter 4 .
112
phosphatase, invertase and arylsulphatase) were determined to assess the effects of
organic amendments on soil fertility during one year.
The present work was carried out within the framework “Monitoraggio e recupero
della Fertilità dei suoli in sistemi agricoli intensivi” a research project funded by
CCIAA of Salerno (Italy) in collaboration with the research groups of Prof. Astolfo
Zoina, Dipartimento di Arboricoltura, Botanica e Patologia Vegetale, Università degli
Studi di Napoli Federico II, and Dr. Rosaria D‟Ascoli, Dipartimento di Scienze
Ambientali, Seconda Università di Napoli.
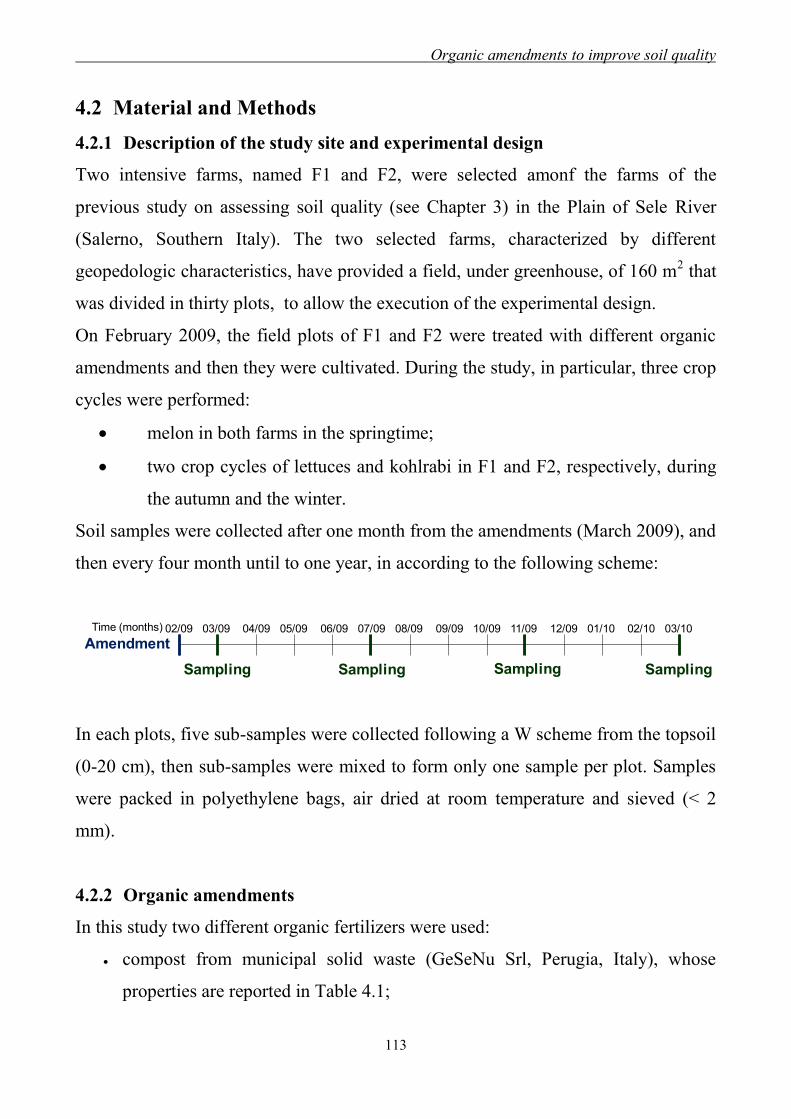
Organic amendments to improve soil quality
113
4.2 Material and Methods
4.2.1 Description of the study site and experimental design
Two intensive farms, named F1 and F2, were selected amonf the farms of the
previous study on assessing soil quality (see Chapter 3) in the Plain of Sele River
(Salerno, Southern Italy). The two selected farms, characterized by different
geopedologic characteristics, have provided a field, under greenhouse, of 160 m2 that
was divided in thirty plots, to allow the execution of the experimental design.
On February 2009, the field plots of F1 and F2 were treated with different organic
amendments and then they were cultivated. During the study, in particular, three crop
cycles were performed:
melon in both farms in the springtime;
two crop cycles of lettuces and kohlrabi in F1 and F2, respectively, during
the autumn and the winter.
Soil samples were collected after one month from the amendments (March 2009), and
then every four month until to one year, in according to the following scheme:
In each plots, five sub-samples were collected following a W scheme from the topsoil
(0-20 cm), then sub-samples were mixed to form only one sample per plot. Samples
were packed in polyethylene bags, air dried at room temperature and sieved (< 2
mm).
4.2.2 Organic amendments
In this study two different organic fertilizers were used:
compost from municipal solid waste (GeSeNu Srl, Perugia, Italy), whose
properties are reported in Table 4.1;
02/09 03/09 04/09 05/09 06/09 07/09 08/09 09/09 10/09 11/09 12/09 01/10 02/10 03/10 Time (months)
Amendment
Sampling Sampling SamplingSampling
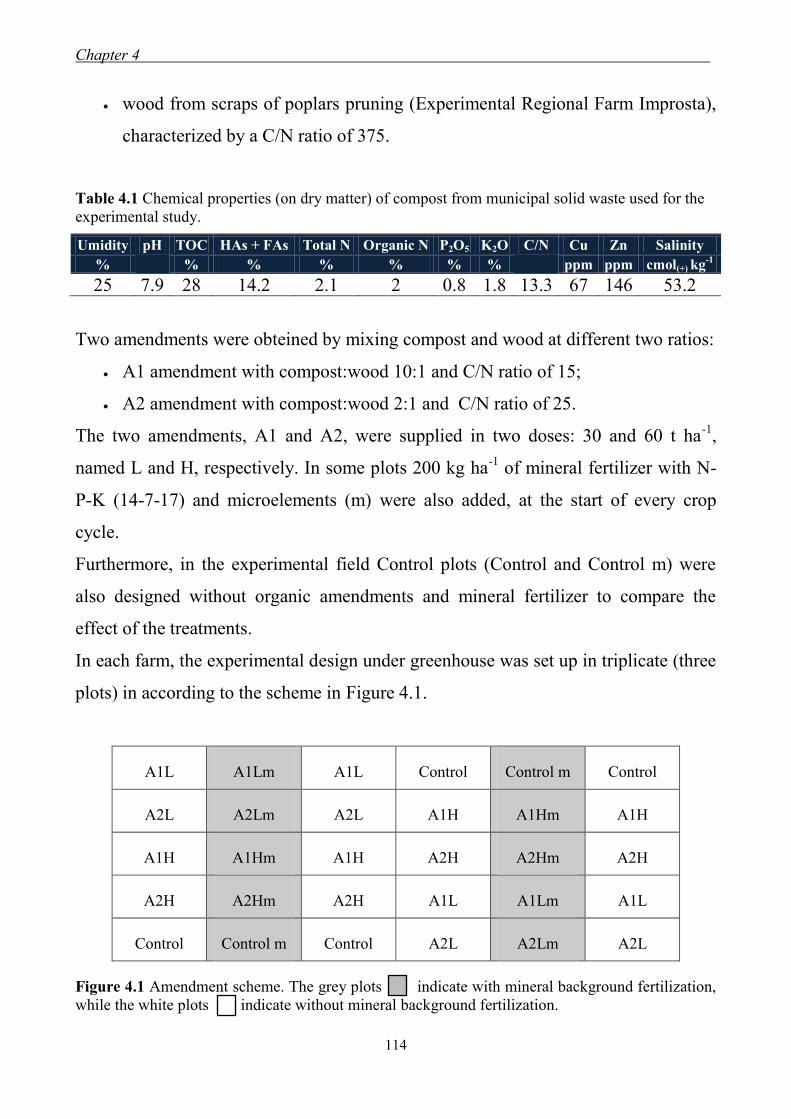
Chapter 4 .
114
wood from scraps of poplars pruning (Experimental Regional Farm Improsta),
characterized by a C/N ratio of 375.
Table 4.1 Chemical properties (on dry matter) of compost from municipal solid waste used for the
experimental study.
Umidity pH TOC HAs + FAs Total N Organic N P2O5 K2O C/N Cu Zn Salinity
%
% % % % % %
ppm ppm cmol(+) kg-1
25 7.9 28 14.2 2.1 2 0.8 1.8 13.3 67 146 53.2
Two amendments were obteined by mixing compost and wood at different two ratios:
A1 amendment with compost:wood 10:1 and C/N ratio of 15;
A2 amendment with compost:wood 2:1 and C/N ratio of 25.
The two amendments, A1 and A2, were supplied in two doses: 30 and 60 t ha-1
,
named L and H, respectively. In some plots 200 kg ha-1
of mineral fertilizer with N-
P-K (14-7-17) and microelements (m) were also added, at the start of every crop
cycle.
Furthermore, in the experimental field Control plots (Control and Control m) were
also designed without organic amendments and mineral fertilizer to compare the
effect of the treatments.
In each farm, the experimental design under greenhouse was set up in triplicate (three
plots) in according to the scheme in Figure 4.1.
A1L A1Lm A1L Control Control m Control
A2L A2Lm A2L A1H A1Hm A1H
A1H A1Hm A1H A2H A2Hm A2H
A2H A2Hm A2H A1L A1Lm A1L
Control Control m Control A2L A2Lm A2L
Figure 4.1 Amendment scheme. The grey plots indicate with mineral background fertilization,
while the white plots indicate without mineral background fertilization.
Organic amendments to improve soil quality
115
4.2.3 Soil chemical and biochemical properties
Samples collected, in each sampling, have been characterized for the main chemical
properties (pH, EC, CEC, exchangeable basis, organic C content, total N and
available phosphorus) following the methodologies already described in Chapter 3,
Par. 3.2.4. Organic C content and total nitrogen analyses were performed by the
research group of Dr. Rosaria D‟Ascoli at Dipartimento di Scienze Ambientali,
Seconda Università di Napoli.
The activities of arylsulphatase, -glucosidase, phosphatase and dehydrogenase were
detected as described in detail in Chapter 3, Par. 3.2.5. The invertase activity was
determined with 50 mM sucrose as substrate in 2 M acetate buffer (pH 5.5),
incubating for 3 h at 50 °C. The released reducing sugars were determined following
the method of Nelson (1944). Triplicates were performed for each activity assay.
4.2.4 Yield crops
The yields of melon crop were measured by summing the weight of all melons
produced in each plot during the complete crop cycle. The sugar content analysis of
the melons was performed using undiluted juice from the fruits just harvested.
Approximately 20 μL of juice was placed in the well of a refractometer (Spear
Scientifc Digital refractometer model 300 016; Scottsdale, AZ, USA) to measure the
Brix value (%). The average weights of lettuces and kohlrabies were assessed by
recording the weights of 15 plants collected per plot.
4.2.5 Statistical analysis
The relationships among soil physical, chemical and biochemical properties were
assessed by using Pearson correlation coefficients, and on these results the analysis of
Principal Component (PCA) was performed.
Analysis of variance (ANOVA-one way with replication) was used to evaluate the
effect of different organic amendments on crop yields. The significance between
means with P <0.01 was determined using the Tukey test.

Chapter 4 .
116
Principal component analysis (PCA), and all statistical analysis were performed by
JMP 8 (SAS Institute, 2008).

Organic amendments to improve soil quality
117
4.3 Results and Discussion
4.3.1 Soil chemical properties of studied farm soils
The starting step of the study was the soil characterization of two farms where the
experiment have been carried out, in order to better assess the effects of organic
amendments on soil properties. Physical and chemical properties of the F1 and F2
soils are showed in Table 4.2.
Table 4.2 Soil physical and chemical properties (±sd) of the two farms soils (F1 and F2) at the
starting time.
Properties F1 soil F2 soil
Texture Clay loam Sandy loam
Sand, % 37 ±3 56 ±1
Silt, % 26 ±2 27 ±1
Clay, % 37 ±2 17 ±2
pH 7.74 ±0.12 7.65 ±0.12
EC, dS m-1
0.08 ±0.02 0.17 ±0.03
Limestone, g kg-1
1.55 ±1.03 639 ±75
Organic C, g kg-1
10.47 ±0.56 16.19 ±0.39
Total N, g kg-1
4.13 ±0.31 3.90 ±0.03
C/N 2.5 ±0.2 4.11 ±0.15
P2O5, mg kg-1
162.34 ±9.21 174.71 ±17.32
CEC, cmol(+) kg-1
21.1 ±0.2 13.6 ±0.9
K+, cmol(+)
kg
-1 1.47 ±0.06 0.62 ±0.20
Na+, cmol(+)
kg
-1 0.74 ±0.04 0.40 ±0.05
The F1 soil was a clay loam soil, a Mollic Haploxeralf according to Soil Taxonomy
(USDA, 1998; Regione Campania, 2004), with sub-alkaline pH, low electrical
conductivity and limestone and high cation exchange capacity.
The farm F2, by contrast, was characterized by sandy loam soil, a Lithic Haplustolls
according to Soil Taxonomy (USDA, 1998; Regione Campania, 2004), with sub-
alkaline pH, high electrical conductivity, but in particular very high limestone,
reaching over 600 g kg-1
.
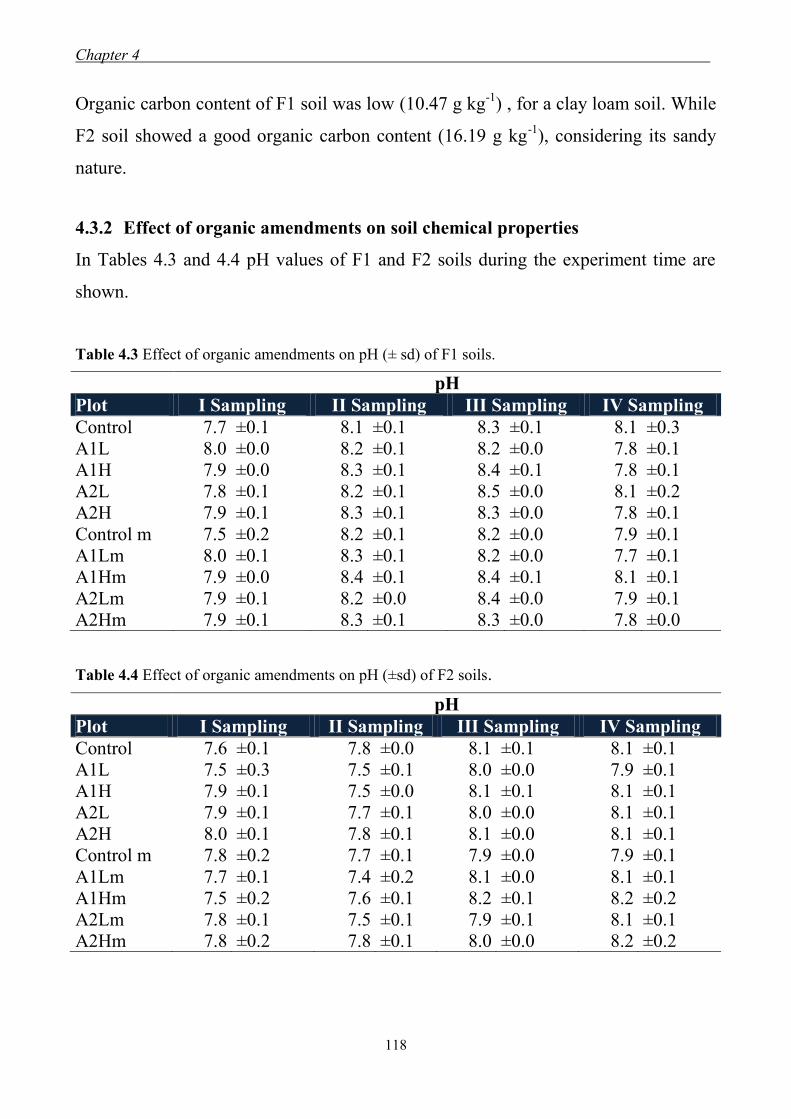
Chapter 4 .
118
Organic carbon content of F1 soil was low (10.47 g kg-1
) , for a clay loam soil. While
F2 soil showed a good organic carbon content (16.19 g kg-1
), considering its sandy
nature.
4.3.2 Effect of organic amendments on soil chemical properties
In Tables 4.3 and 4.4 pH values of F1 and F2 soils during the experiment time are
shown.
Table 4.3 Effect of organic amendments on pH (± sd) of F1 soils.
pH
Plot I Sampling II Sampling III Sampling IV Sampling
Control 7.7 ±0.1 8.1 ±0.1 8.3 ±0.1 8.1 ±0.3
A1L 8.0 ±0.0 8.2 ±0.1 8.2 ±0.0 7.8 ±0.1
A1H 7.9 ±0.0 8.3 ±0.1 8.4 ±0.1 7.8 ±0.1
A2L 7.8 ±0.1 8.2 ±0.1 8.5 ±0.0 8.1 ±0.2
A2H 7.9 ±0.1 8.3 ±0.1 8.3 ±0.0 7.8 ±0.1
Control m 7.5 ±0.2 8.2 ±0.1 8.2 ±0.0 7.9 ±0.1
A1Lm 8.0 ±0.1 8.3 ±0.1 8.2 ±0.0 7.7 ±0.1
A1Hm 7.9 ±0.0 8.4 ±0.1 8.4 ±0.1 8.1 ±0.1
A2Lm 7.9 ±0.1 8.2 ±0.0 8.4 ±0.0 7.9 ±0.1
A2Hm 7.9 ±0.1 8.3 ±0.1 8.3 ±0.0 7.8 ±0.0
Table 4.4 Effect of organic amendments on pH (±sd) of F2 soils.
pH
Plot I Sampling II Sampling III Sampling IV Sampling
Control 7.6 ±0.1 7.8 ±0.0 8.1 ±0.1 8.1 ±0.1
A1L 7.5 ±0.3 7.5 ±0.1 8.0 ±0.0 7.9 ±0.1
A1H 7.9 ±0.1 7.5 ±0.0 8.1 ±0.1 8.1 ±0.1
A2L 7.9 ±0.1 7.7 ±0.1 8.0 ±0.0 8.1 ±0.1
A2H 8.0 ±0.1 7.8 ±0.1 8.1 ±0.0 8.1 ±0.1
Control m 7.8 ±0.2 7.7 ±0.1 7.9 ±0.0 7.9 ±0.1
A1Lm 7.7 ±0.1 7.4 ±0.2 8.1 ±0.0 8.1 ±0.1
A1Hm 7.5 ±0.2 7.6 ±0.1 8.2 ±0.1 8.2 ±0.2
A2Lm 7.8 ±0.1 7.5 ±0.1 7.9 ±0.1 8.1 ±0.1
A2Hm 7.8 ±0.2 7.8 ±0.1 8.0 ±0.0 8.2 ±0.2
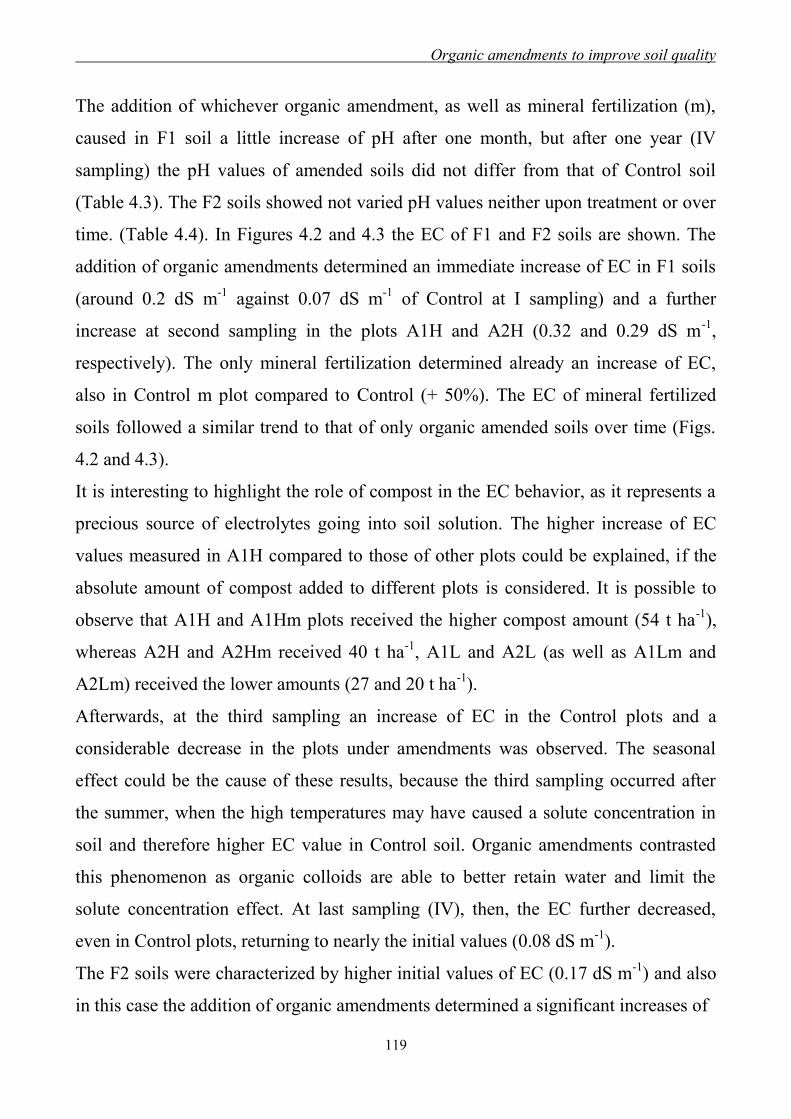
Organic amendments to improve soil quality
119
The addition of whichever organic amendment, as well as mineral fertilization (m),
caused in F1 soil a little increase of pH after one month, but after one year (IV
sampling) the pH values of amended soils did not differ from that of Control soil
(Table 4.3). The F2 soils showed not varied pH values neither upon treatment or over
time. (Table 4.4). In Figures 4.2 and 4.3 the EC of F1 and F2 soils are shown. The
addition of organic amendments determined an immediate increase of EC in F1 soils
(around 0.2 dS m-1
against 0.07 dS m-1
of Control at I sampling) and a further
increase at second sampling in the plots A1H and A2H (0.32 and 0.29 dS m-1
,
respectively). The only mineral fertilization determined already an increase of EC,
also in Control m plot compared to Control (+ 50%). The EC of mineral fertilized
soils followed a similar trend to that of only organic amended soils over time (Figs.
4.2 and 4.3).
It is interesting to highlight the role of compost in the EC behavior, as it represents a
precious source of electrolytes going into soil solution. The higher increase of EC
values measured in A1H compared to those of other plots could be explained, if the
absolute amount of compost added to different plots is considered. It is possible to
observe that A1H and A1Hm plots received the higher compost amount (54 t ha-1
),
whereas A2H and A2Hm received 40 t ha-1
, A1L and A2L (as well as A1Lm and
A2Lm) received the lower amounts (27 and 20 t ha-1
).
Afterwards, at the third sampling an increase of EC in the Control plots and a
considerable decrease in the plots under amendments was observed. The seasonal
effect could be the cause of these results, because the third sampling occurred after
the summer, when the high temperatures may have caused a solute concentration in
soil and therefore higher EC value in Control soil. Organic amendments contrasted
this phenomenon as organic colloids are able to better retain water and limit the
solute concentration effect. At last sampling (IV), then, the EC further decreased,
even in Control plots, returning to nearly the initial values (0.08 dS m-1
).
The F2 soils were characterized by higher initial values of EC (0.17 dS m-1
) and also
in this case the addition of organic amendments determined a significant increases of
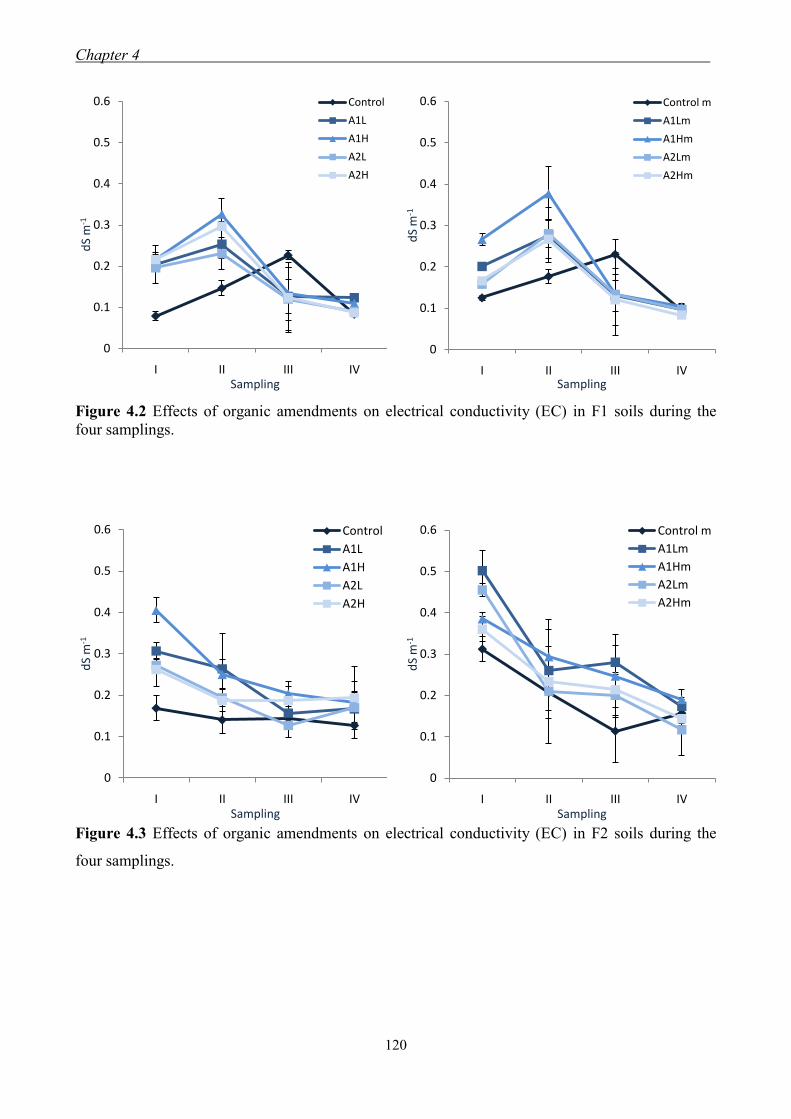
Chapter 4 .
120
Figure 4.2 Effects of organic amendments on electrical conductivity (EC) in F1 soils during the
four samplings.
Figure 4.3 Effects of organic amendments on electrical conductivity (EC) in F2 soils during the
four samplings.
0
0.1
0.2
0.3
0.4
0.5
0.6
I II III IV
dS
m-1
Sampling
Control
A1L
A1H
A2L
A2H
0
0.1
0.2
0.3
0.4
0.5
0.6
I II III IV
dS
m-1
Sampling
Control m
A1Lm
A1Hm
A2Lm
A2Hm
0
0.1
0.2
0.3
0.4
0.5
0.6
I II III IV
dS
m-1
Sampling
Control
A1L
A1H
A2L
A2H
0
0.1
0.2
0.3
0.4
0.5
0.6
I II III IV
dS
m-1
Sampling
Control m
A1Lm
A1Hm
A2Lm
A2Hm
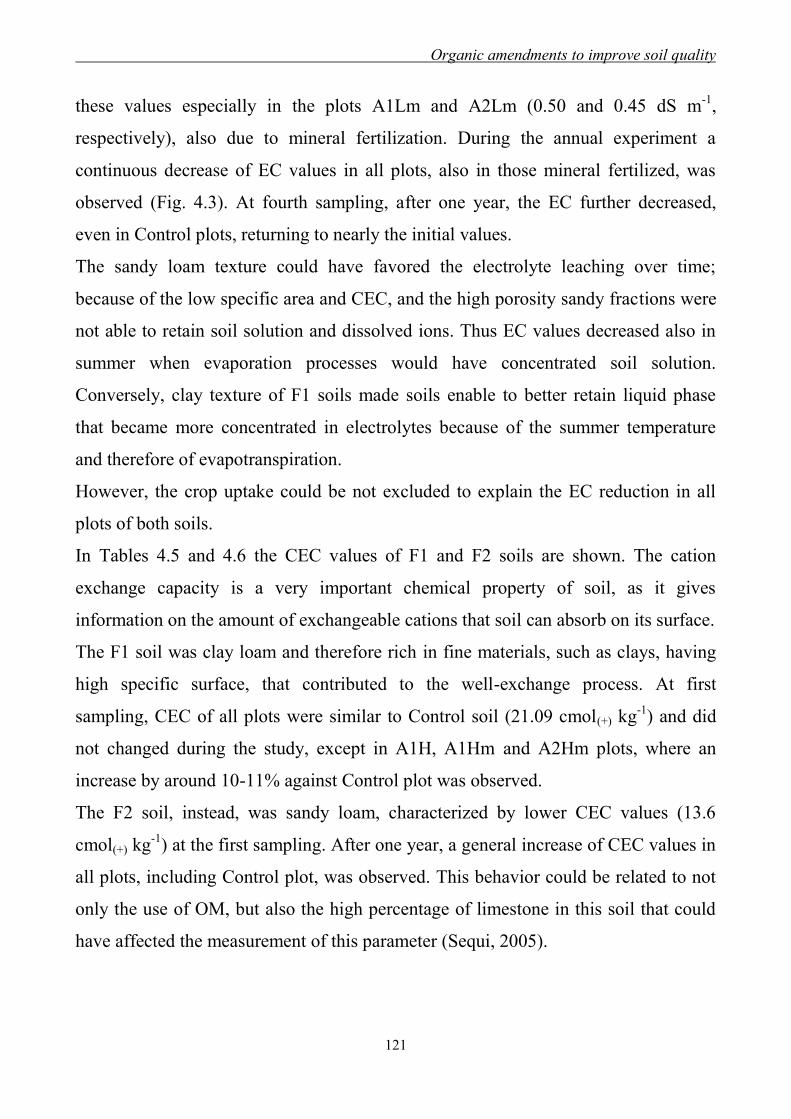
Organic amendments to improve soil quality
121
these values especially in the plots A1Lm and A2Lm (0.50 and 0.45 dS m-1
,
respectively), also due to mineral fertilization. During the annual experiment a
continuous decrease of EC values in all plots, also in those mineral fertilized, was
observed (Fig. 4.3). At fourth sampling, after one year, the EC further decreased,
even in Control plots, returning to nearly the initial values.
The sandy loam texture could have favored the electrolyte leaching over time;
because of the low specific area and CEC, and the high porosity sandy fractions were
not able to retain soil solution and dissolved ions. Thus EC values decreased also in
summer when evaporation processes would have concentrated soil solution.
Conversely, clay texture of F1 soils made soils enable to better retain liquid phase
that became more concentrated in electrolytes because of the summer temperature
and therefore of evapotranspiration.
However, the crop uptake could be not excluded to explain the EC reduction in all
plots of both soils.
In Tables 4.5 and 4.6 the CEC values of F1 and F2 soils are shown. The cation
exchange capacity is a very important chemical property of soil, as it gives
information on the amount of exchangeable cations that soil can absorb on its surface.
The F1 soil was clay loam and therefore rich in fine materials, such as clays, having
high specific surface, that contributed to the well-exchange process. At first
sampling, CEC of all plots were similar to Control soil (21.09 cmol(+) kg-1
) and did
not changed during the study, except in A1H, A1Hm and A2Hm plots, where an
increase by around 10-11% against Control plot was observed.
The F2 soil, instead, was sandy loam, characterized by lower CEC values (13.6
cmol(+) kg-1
) at the first sampling. After one year, a general increase of CEC values in
all plots, including Control plot, was observed. This behavior could be related to not
only the use of OM, but also the high percentage of limestone in this soil that could
have affected the measurement of this parameter (Sequi, 2005).
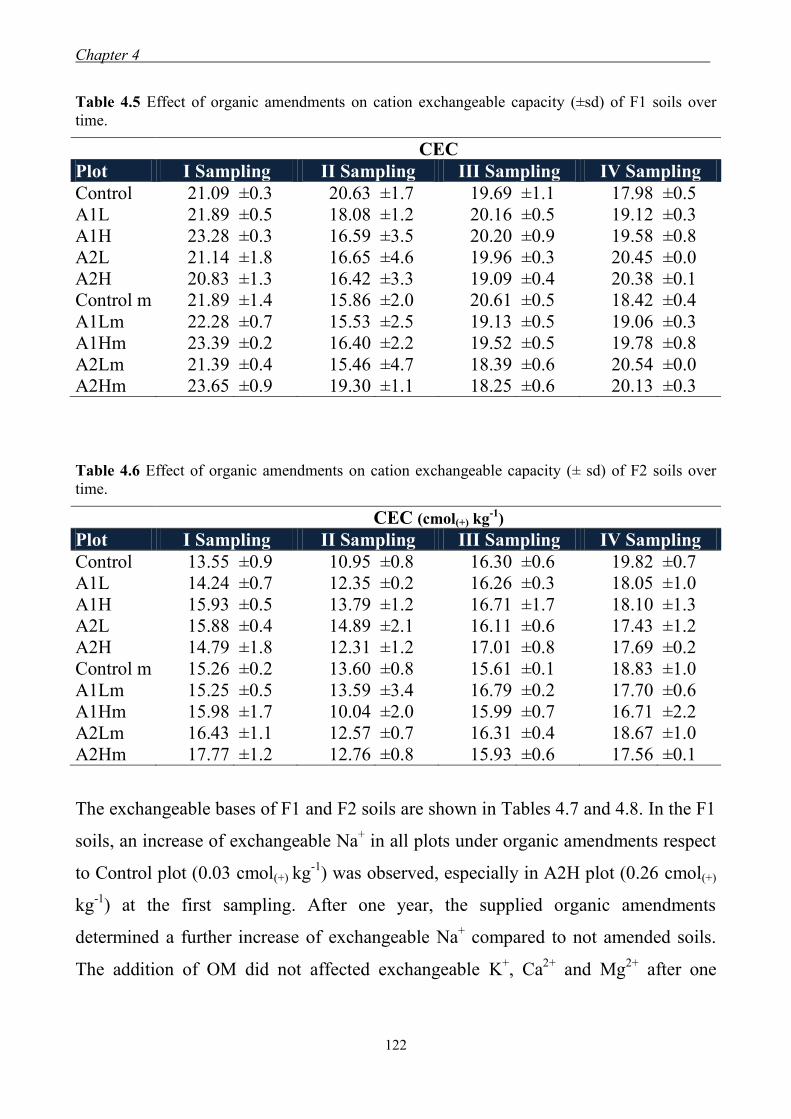
Chapter 4 .
122
Table 4.5 Effect of organic amendments on cation exchangeable capacity (±sd) of F1 soils over
time.
CEC
Plot I Sampling II Sampling III Sampling IV Sampling
Control 21.09 ±0.3 20.63 ±1.7 19.69 ±1.1 17.98 ±0.5
A1L 21.89 ±0.5 18.08 ±1.2 20.16 ±0.5 19.12 ±0.3
A1H 23.28 ±0.3 16.59 ±3.5 20.20 ±0.9 19.58 ±0.8
A2L 21.14 ±1.8 16.65 ±4.6 19.96 ±0.3 20.45 ±0.0
A2H 20.83 ±1.3 16.42 ±3.3 19.09 ±0.4 20.38 ±0.1
Control m 21.89 ±1.4 15.86 ±2.0 20.61 ±0.5 18.42 ±0.4
A1Lm 22.28 ±0.7 15.53 ±2.5 19.13 ±0.5 19.06 ±0.3
A1Hm 23.39 ±0.2 16.40 ±2.2 19.52 ±0.5 19.78 ±0.8
A2Lm 21.39 ±0.4 15.46 ±4.7 18.39 ±0.6 20.54 ±0.0
A2Hm 23.65 ±0.9 19.30 ±1.1 18.25 ±0.6 20.13 ±0.3
Table 4.6 Effect of organic amendments on cation exchangeable capacity (± sd) of F2 soils over
time.
CEC (cmol(+) kg-1
)
Plot I Sampling II Sampling III Sampling IV Sampling
Control 13.55 ±0.9 10.95 ±0.8 16.30 ±0.6 19.82 ±0.7
A1L 14.24 ±0.7 12.35 ±0.2 16.26 ±0.3 18.05 ±1.0
A1H 15.93 ±0.5 13.79 ±1.2 16.71 ±1.7 18.10 ±1.3
A2L 15.88 ±0.4 14.89 ±2.1 16.11 ±0.6 17.43 ±1.2
A2H 14.79 ±1.8 12.31 ±1.2 17.01 ±0.8 17.69 ±0.2
Control m 15.26 ±0.2 13.60 ±0.8 15.61 ±0.1 18.83 ±1.0
A1Lm 15.25 ±0.5 13.59 ±3.4 16.79 ±0.2 17.70 ±0.6
A1Hm 15.98 ±1.7 10.04 ±2.0 15.99 ±0.7 16.71 ±2.2
A2Lm 16.43 ±1.1 12.57 ±0.7 16.31 ±0.4 18.67 ±1.0
A2Hm 17.77 ±1.2 12.76 ±0.8 15.93 ±0.6 17.56 ±0.1
The exchangeable bases of F1 and F2 soils are shown in Tables 4.7 and 4.8. In the F1
soils, an increase of exchangeable Na+ in all plots under organic amendments respect
to Control plot (0.03 cmol(+) kg
-1) was observed, especially in A2H plot (0.26 cmol(+)
kg-1
) at the first sampling. After one year, the supplied organic amendments
determined a further increase of exchangeable Na+ compared to not amended soils.
The addition of OM did not affected exchangeable K+, Ca
2+ and Mg
2+ after one
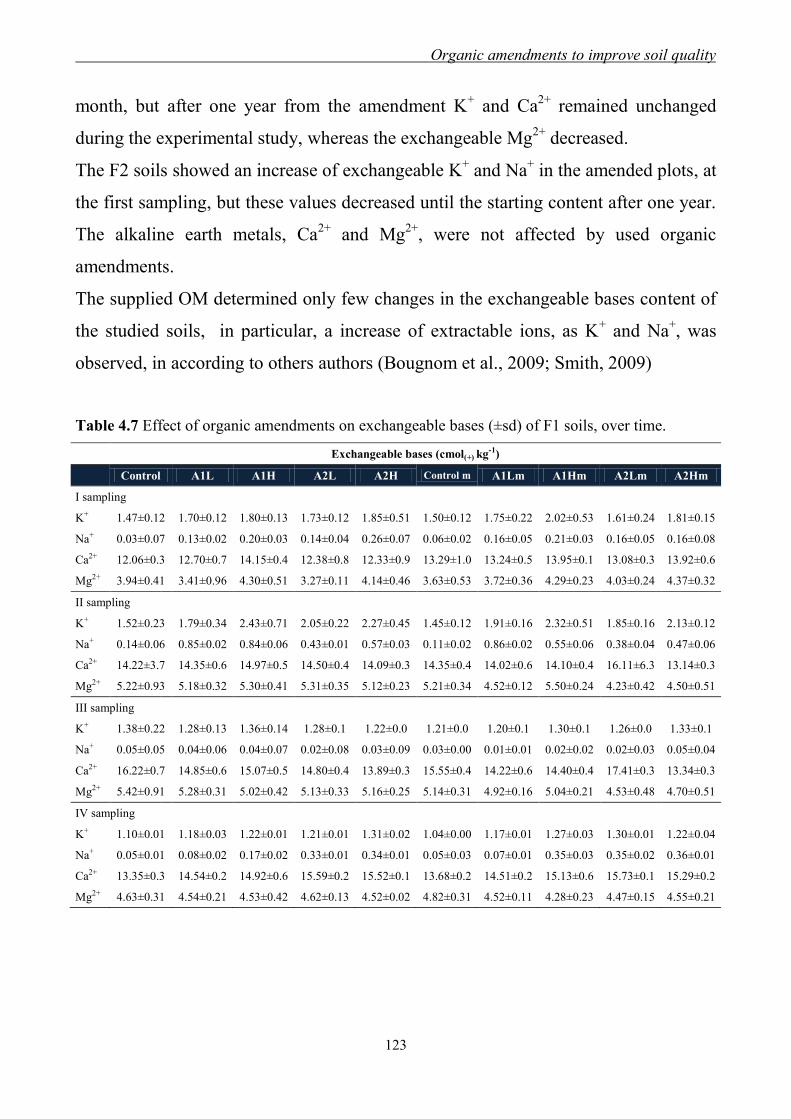
Organic amendments to improve soil quality
123
month, but after one year from the amendment K+ and Ca
2+ remained unchanged
during the experimental study, whereas the exchangeable Mg2+
decreased.
The F2 soils showed an increase of exchangeable K+ and Na
+ in the amended plots, at
the first sampling, but these values decreased until the starting content after one year.
The alkaline earth metals, Ca2+
and Mg2+
, were not affected by used organic
amendments.
The supplied OM determined only few changes in the exchangeable bases content of
the studied soils, in particular, a increase of extractable ions, as K+ and Na
+, was
observed, in according to others authors (Bougnom et al., 2009; Smith, 2009)
Table 4.7 Effect of organic amendments on exchangeable bases (±sd) of F1 soils, over time.
Exchangeable bases (cmol(+)
kg-1)
Control A1L A1H A2L A2H Control m A1Lm A1Hm A2Lm A2Hm
I sampling
K+ 1.47±0.12 1.70±0.12 1.80±0.13 1.73±0.12 1.85±0.51 1.50±0.12 1.75±0.22 2.02±0.53 1.61±0.24 1.81±0.15
Na+ 0.03±0.07 0.13±0.02 0.20±0.03 0.14±0.04 0.26±0.07 0.06±0.02 0.16±0.05 0.21±0.03 0.16±0.05 0.16±0.08
Ca2+ 12.06±0.3 12.70±0.7 14.15±0.4 12.38±0.8 12.33±0.9 13.29±1.0 13.24±0.5 13.95±0.1 13.08±0.3 13.92±0.6
Mg2+ 3.94±0.41 3.41±0.96 4.30±0.51 3.27±0.11 4.14±0.46 3.63±0.53 3.72±0.36 4.29±0.23 4.03±0.24 4.37±0.32
II sampling
K+ 1.52±0.23 1.79±0.34 2.43±0.71 2.05±0.22 2.27±0.45 1.45±0.12 1.91±0.16 2.32±0.51 1.85±0.16 2.13±0.12
Na+ 0.14±0.06 0.85±0.02 0.84±0.06 0.43±0.01 0.57±0.03 0.11±0.02 0.86±0.02 0.55±0.06 0.38±0.04 0.47±0.06
Ca2+ 14.22±3.7 14.35±0.6 14.97±0.5 14.50±0.4 14.09±0.3 14.35±0.4 14.02±0.6 14.10±0.4 16.11±6.3 13.14±0.3
Mg2+ 5.22±0.93 5.18±0.32 5.30±0.41 5.31±0.35 5.12±0.23 5.21±0.34 4.52±0.12 5.50±0.24 4.23±0.42 4.50±0.51
III sampling
K+ 1.38±0.22 1.28±0.13 1.36±0.14 1.28±0.1 1.22±0.0 1.21±0.0 1.20±0.1 1.30±0.1 1.26±0.0 1.33±0.1
Na+ 0.05±0.05 0.04±0.06 0.04±0.07 0.02±0.08 0.03±0.09 0.03±0.00 0.01±0.01 0.02±0.02 0.02±0.03 0.05±0.04
Ca2+ 16.22±0.7 14.85±0.6 15.07±0.5 14.80±0.4 13.89±0.3 15.55±0.4 14.22±0.6 14.40±0.4 17.41±0.3 13.34±0.3
Mg2+ 5.42±0.91 5.28±0.31 5.02±0.42 5.13±0.33 5.16±0.25 5.14±0.31 4.92±0.16 5.04±0.21 4.53±0.48 4.70±0.51
IV sampling
K+ 1.10±0.01 1.18±0.03 1.22±0.01 1.21±0.01 1.31±0.02 1.04±0.00 1.17±0.01 1.27±0.03 1.30±0.01 1.22±0.04
Na+ 0.05±0.01 0.08±0.02 0.17±0.02 0.33±0.01 0.34±0.01 0.05±0.03 0.07±0.01 0.35±0.03 0.35±0.02 0.36±0.01
Ca2+ 13.35±0.3 14.54±0.2 14.92±0.6 15.59±0.2 15.52±0.1 13.68±0.2 14.51±0.2 15.13±0.6 15.73±0.1 15.29±0.2
Mg2+ 4.63±0.31 4.54±0.21 4.53±0.42 4.62±0.13 4.52±0.02 4.82±0.31 4.52±0.11 4.28±0.23 4.47±0.15 4.55±0.21
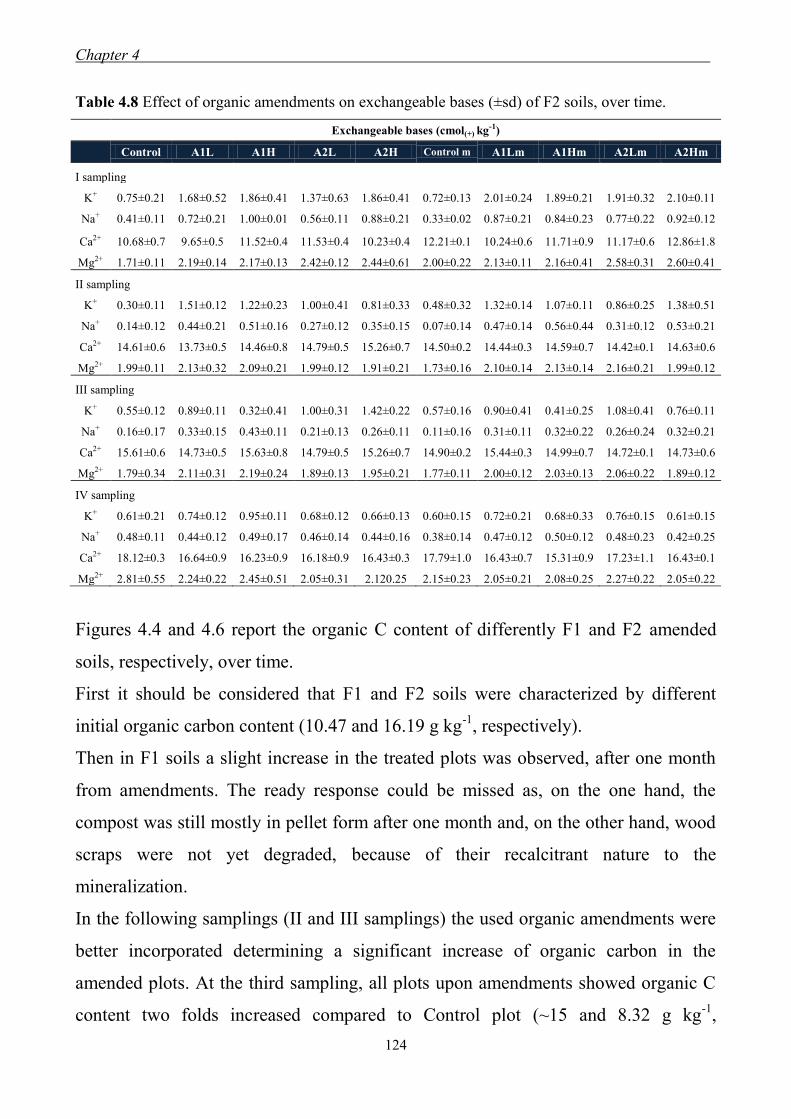
Chapter 4 .
124
Table 4.8 Effect of organic amendments on exchangeable bases (±sd) of F2 soils, over time.
Exchangeable bases (cmol(+)
kg-1)
Control A1L A1H A2L A2H Control m A1Lm A1Hm A2Lm A2Hm
I sampling
K+ 0.75±0.21 1.68±0.52 1.86±0.41 1.37±0.63 1.86±0.41 0.72±0.13 2.01±0.24 1.89±0.21 1.91±0.32 2.10±0.11
Na+ 0.41±0.11 0.72±0.21 1.00±0.01 0.56±0.11 0.88±0.21 0.33±0.02 0.87±0.21 0.84±0.23 0.77±0.22 0.92±0.12
Ca2+ 10.68±0.7 9.65±0.5 11.52±0.4 11.53±0.4 10.23±0.4 12.21±0.1 10.24±0.6 11.71±0.9 11.17±0.6 12.86±1.8
Mg2+ 1.71±0.11 2.19±0.14 2.17±0.13 2.42±0.12 2.44±0.61 2.00±0.22 2.13±0.11 2.16±0.41 2.58±0.31 2.60±0.41
II sampling
K+ 0.30±0.11 1.51±0.12 1.22±0.23 1.00±0.41 0.81±0.33 0.48±0.32 1.32±0.14 1.07±0.11 0.86±0.25 1.38±0.51
Na+ 0.14±0.12 0.44±0.21 0.51±0.16 0.27±0.12 0.35±0.15 0.07±0.14 0.47±0.14 0.56±0.44 0.31±0.12 0.53±0.21
Ca2+ 14.61±0.6 13.73±0.5 14.46±0.8 14.79±0.5 15.26±0.7 14.50±0.2 14.44±0.3 14.59±0.7 14.42±0.1 14.63±0.6
Mg2+ 1.99±0.11 2.13±0.32 2.09±0.21 1.99±0.12 1.91±0.21 1.73±0.16 2.10±0.14 2.13±0.14 2.16±0.21 1.99±0.12
III sampling
K+ 0.55±0.12 0.89±0.11 0.32±0.41 1.00±0.31 1.42±0.22 0.57±0.16 0.90±0.41 0.41±0.25 1.08±0.41 0.76±0.11
Na+ 0.16±0.17 0.33±0.15 0.43±0.11 0.21±0.13 0.26±0.11 0.11±0.16 0.31±0.11 0.32±0.22 0.26±0.24 0.32±0.21
Ca2+ 15.61±0.6 14.73±0.5 15.63±0.8 14.79±0.5 15.26±0.7 14.90±0.2 15.44±0.3 14.99±0.7 14.72±0.1 14.73±0.6
Mg2+ 1.79±0.34 2.11±0.31 2.19±0.24 1.89±0.13 1.95±0.21 1.77±0.11 2.00±0.12 2.03±0.13 2.06±0.22 1.89±0.12
IV sampling
K+ 0.61±0.21 0.74±0.12 0.95±0.11 0.68±0.12 0.66±0.13 0.60±0.15 0.72±0.21 0.68±0.33 0.76±0.15 0.61±0.15
Na+ 0.48±0.11 0.44±0.12 0.49±0.17 0.46±0.14 0.44±0.16 0.38±0.14 0.47±0.12 0.50±0.12 0.48±0.23 0.42±0.25
Ca2+ 18.12±0.3 16.64±0.9 16.23±0.9 16.18±0.9 16.43±0.3 17.79±1.0 16.43±0.7 15.31±0.9 17.23±1.1 16.43±0.1
Mg2+ 2.81±0.55 2.24±0.22 2.45±0.51 2.05±0.31 2.120.25 2.15±0.23 2.05±0.21 2.08±0.25 2.27±0.22 2.05±0.22
Figures 4.4 and 4.6 report the organic C content of differently F1 and F2 amended
soils, respectively, over time.
First it should be considered that F1 and F2 soils were characterized by different
initial organic carbon content (10.47 and 16.19 g kg-1
, respectively).
Then in F1 soils a slight increase in the treated plots was observed, after one month
from amendments. The ready response could be missed as, on the one hand, the
compost was still mostly in pellet form after one month and, on the other hand, wood
scraps were not yet degraded, because of their recalcitrant nature to the
mineralization.
In the following samplings (II and III samplings) the used organic amendments were
better incorporated determining a significant increase of organic carbon in the
amended plots. At the third sampling, all plots upon amendments showed organic C
content two folds increased compared to Control plot (~15 and 8.32 g kg-1
,

Organic amendments to improve soil quality
125
respectively). After one year, higher organic C content in amended plots than Control
plot was still observed. No effects of mineral fertilization were observed.
The positive effect of organic amendment on organic C content could be better
observed if the data were analyzed in percentage deviation from initial value of the
Control soil (Fig. 4.5). After the third sampling these increases reached 40 until to
80% compared to Control plot and remained unchanged over time, also one year
from amendments, except in A2H plot (Fig. 4.5).
These results testify the positive effect in terms of OM recovery, especially if these
results are considered in long-term (after 12 months from the treatment) and after
three crop cycles. The clay nature of F1 soils had an important role in this recovery.
In fact, clay particles are involved in biophysical and chemical processes of C
stabilization (Christensen, 1996), by forming organo-mineral complexes that protect
soil OM and delay its mineralization. Moreover, the lower porosity and therefore the
less aired environment could slow down soil microbial activity and, consequently,
OM degradation processes by microorganism (Amato and Ladd, 1980; Anderson and
Paul, 1984; Schulten and Leinweber, 2000).
In F2 soils, as occurred in the F1, only a slight increase of organic carbon in the
amended plots was observed after one month (Fig. 4.6). Only at the third sampling
the supplied organic amendments determined a strong increase of organic C (~22 g
kg-1
in the amended plots against 16.19 g kg-1
of Control plot). The increase, in
general, was by around 40% compared to Control plot, except in A1Lm and A1Hm,
where deviation percentage from Control plot were 64 and 48%, respectively (Fig.
4.7). In these plots, the addition of mineral fertilizer determined a further increase of
organic carbon content, in according to Kiem and Kandeler (1997) that found, after
mineral fertilization, an increase of microbial activity and consequently, an increase
of OM degradation. After one year, the added OM was almost completely degraded,
and the organic carbon content of treated plots were similar to Control plot, also in
the mineral fertilized plots, as shown in Figure 4.6.
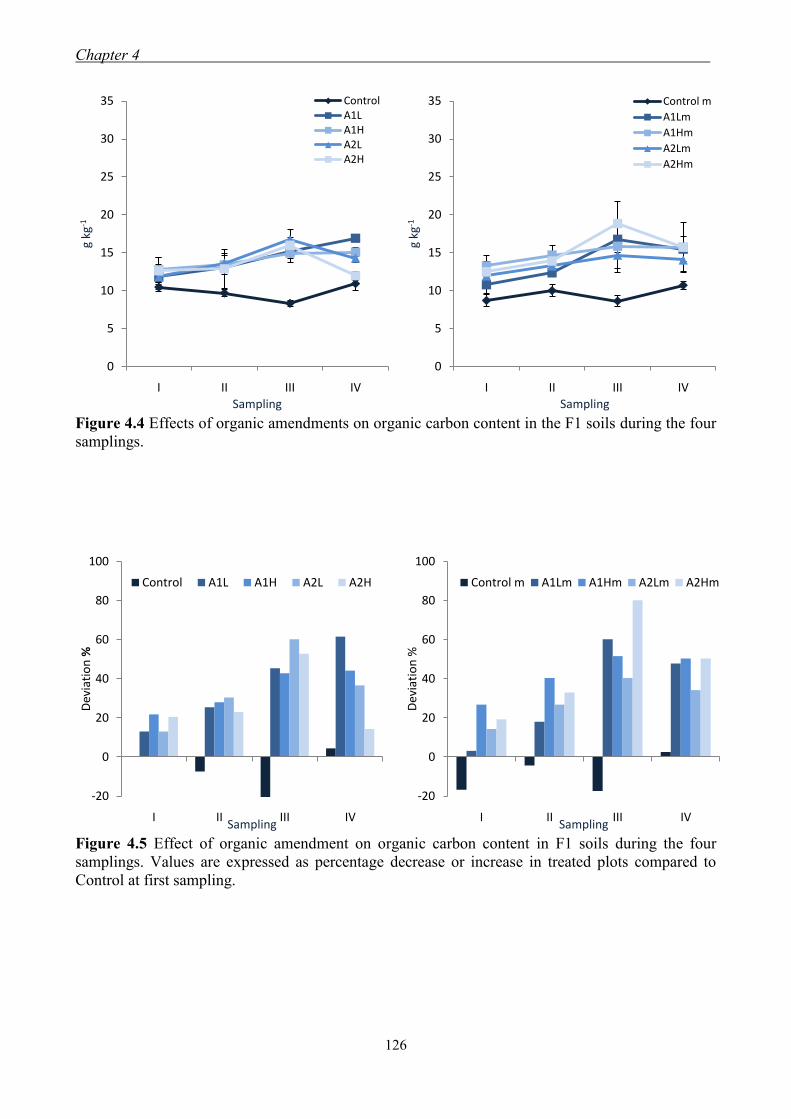
Chapter 4 .
126
Figure 4.4 Effects of organic amendments on organic carbon content in the F1 soils during the four
samplings.
Figure 4.5 Effect of organic amendment on organic carbon content in F1 soils during the four
samplings. Values are expressed as percentage decrease or increase in treated plots compared to
Control at first sampling.
0
5
10
15
20
25
30
35
I II III IV
g kg
-1
Sampling
ControlA1LA1HA2LA2H
0
5
10
15
20
25
30
35
I II III IV
g kg
-1Sampling
Control m
A1Lm
A1Hm
A2Lm
A2Hm
-20
0
20
40
60
80
100
I II III IV
Dev
iati
on
%
Sampling
Control A1L A1H A2L A2H
-20
0
20
40
60
80
100
I II III IV
Dev
iati
on
%
Sampling
Control m A1Lm A1Hm A2Lm A2Hm

Organic amendments to improve soil quality
127
Figure 4.6 Effects of organic amendments on organic carbon content in the F2 soils during the four
samplings.
Figure 4.7 Effect of organic amendment on organic carbon content in F2 soils, during the four
samplings. Values are expressed as percentage decrease or increase in treated plots compared to
Control at first sampling.
0
5
10
15
20
25
30
35
I II III IV
g kg
-1
Sampling
Control
A1L
A1H
A2L
A2H
0
5
10
15
20
25
30
35
I II III IV
g kg
-1Sampling
Control m
A1Lm
A1Hm
A2Lm
A2Hm
-20
0
20
40
60
80
100
I II III IV
Dev
iati
on
%
Sampling
Control A1L A1H A2L A2H
-20
0
20
40
60
80
100
I II III IV
Dev
iati
on
%
Sampling
Control m A1Lm A1Hm A2Lm A2Hm

Chapter 4 .
128
The sandy loam nature, and consequently the low clay content, determined aired
conditions that favoured the biomass activity, oxidative processes and leaching of
OM, that contributed to lead to faster degradation and removal of fresh OM added to
F2 soils in according to Christensen (1996) end Hassink et al. (1997).
The total nitrogen of amended F1 and F2 soils was reported in Figures 4.8 and 4.9,
respectively. Both soils were characterized by a high total N content (about 4 g kg-1
),
higher than the normal content of an agricultural soil (0.7 to 2 g kg-1
) (Sequi, 2005).
In F1 soils, only after one year a slightly increase of total N in the amended plots was
observed, whereas in F2 soils, the total N content was not significantly affected by
organic amendments over time. In both soils no further effects due to mineral
fertilization were observed.
Differently from chemical fertilizations, that determine a rapid N release, organic
amendments determine a slow N release, but extended over time (Claassen and
Carey, 2006). In our case, used organic amendments showed a slow release of N, but
sufficient to maintain a high total N content, considering the uptake from three crop
cycles and mineralization processes occurred during the experimental time. Besides
the plant uptake, the microbial biomass use of nitrogen could not be excluded
(Borken et al., 2002).
By the values of organic carbon and total nitrogen it was possible to calculate the C/N
ratios that providing information about the amount of carbon relative to the amount
on nitrogen present. The ratio generally falls within well defined limit, usually from
about 10 to 12. The decay of organic residues by soil microorganisms leads to
incorporation of part of the C into microbial tissue with the remainder being liberated
as CO2. The decay process is accompanied by conversion of organic forms of N to
NH3 and NO3-, and soil microorganisms utilize part of this N for synthesis of new
cells. The gradual transformation of organic material into stable OM (humus) leads to
the establishment of consistent relationship between C and N. Factors which may be
involved in narrowing of the C/N ratio include chemical fixation of NH3 as amines by
lignin like substances.
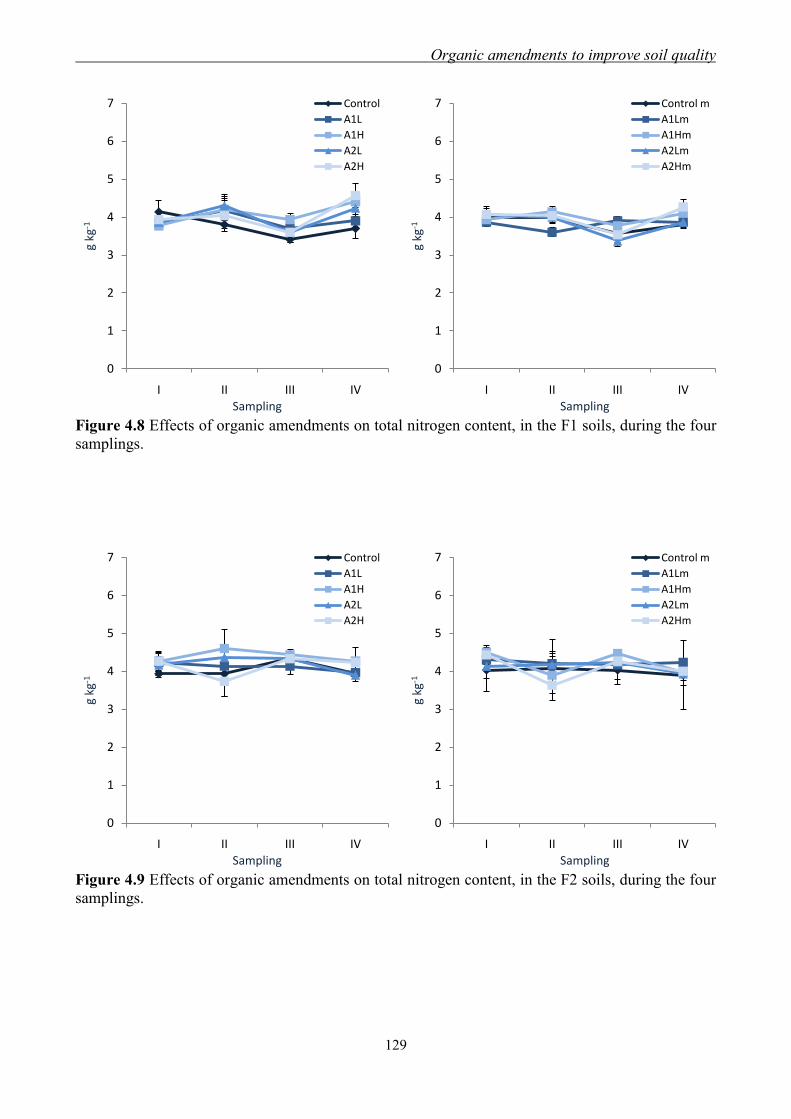
Organic amendments to improve soil quality
129
Figure 4.8 Effects of organic amendments on total nitrogen content, in the F1 soils, during the four
samplings.
Figure 4.9 Effects of organic amendments on total nitrogen content, in the F2 soils, during the four
samplings.
0
1
2
3
4
5
6
7
I II III IV
g kg
-1
Sampling
Control
A1L
A1H
A2L
A2H
0
1
2
3
4
5
6
7
I II III IV
g kg
-1Sampling
Control m
A1Lm
A1Hm
A2Lm
A2Hm
0
1
2
3
4
5
6
7
I II III IV
g kg
-1
Sampling
Control
A1L
A1H
A2L
A2H
0
1
2
3
4
5
6
7
I II III IV
g kg
-1
Sampling
Control m
A1Lm
A1Hm
A2Lm
A2Hm
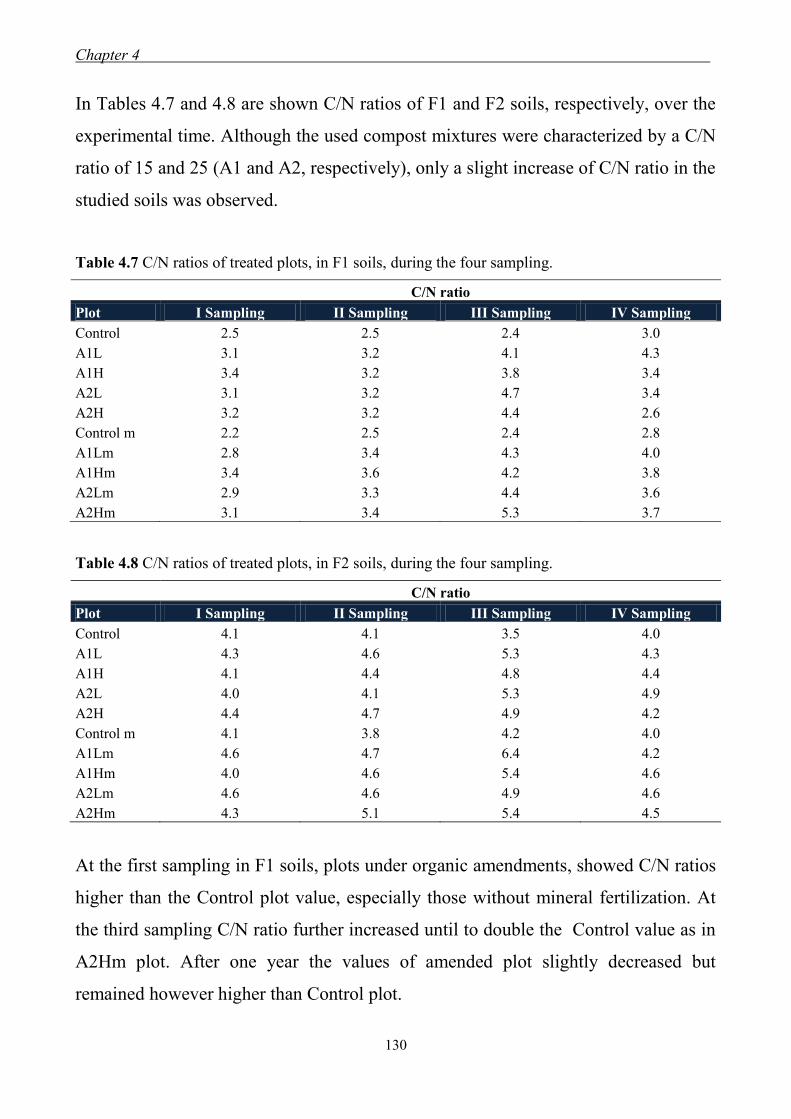
Chapter 4 .
130
In Tables 4.7 and 4.8 are shown C/N ratios of F1 and F2 soils, respectively, over the
experimental time. Although the used compost mixtures were characterized by a C/N
ratio of 15 and 25 (A1 and A2, respectively), only a slight increase of C/N ratio in the
studied soils was observed.
Table 4.7 C/N ratios of treated plots, in F1 soils, during the four sampling.
C/N ratio
Plot I Sampling II Sampling III Sampling IV Sampling
Control 2.5 2.5 2.4 3.0
A1L 3.1 3.2 4.1 4.3
A1H 3.4 3.2 3.8 3.4
A2L 3.1 3.2 4.7 3.4
A2H 3.2 3.2 4.4 2.6
Control m 2.2 2.5 2.4 2.8
A1Lm 2.8 3.4 4.3 4.0
A1Hm 3.4 3.6 4.2 3.8
A2Lm 2.9 3.3 4.4 3.6
A2Hm 3.1 3.4 5.3 3.7
Table 4.8 C/N ratios of treated plots, in F2 soils, during the four sampling.
C/N ratio
Plot I Sampling II Sampling III Sampling IV Sampling
Control 4.1 4.1 3.5 4.0
A1L 4.3 4.6 5.3 4.3
A1H 4.1 4.4 4.8 4.4
A2L 4.0 4.1 5.3 4.9
A2H 4.4 4.7 4.9 4.2
Control m 4.1 3.8 4.2 4.0
A1Lm 4.6 4.7 6.4 4.2
A1Hm 4.0 4.6 5.4 4.6
A2Lm 4.6 4.6 4.9 4.6
A2Hm 4.3 5.1 5.4 4.5
At the first sampling in F1 soils, plots under organic amendments, showed C/N ratios
higher than the Control plot value, especially those without mineral fertilization. At
the third sampling C/N ratio further increased until to double the Control value as in
A2Hm plot. After one year the values of amended plot slightly decreased but
remained however higher than Control plot.
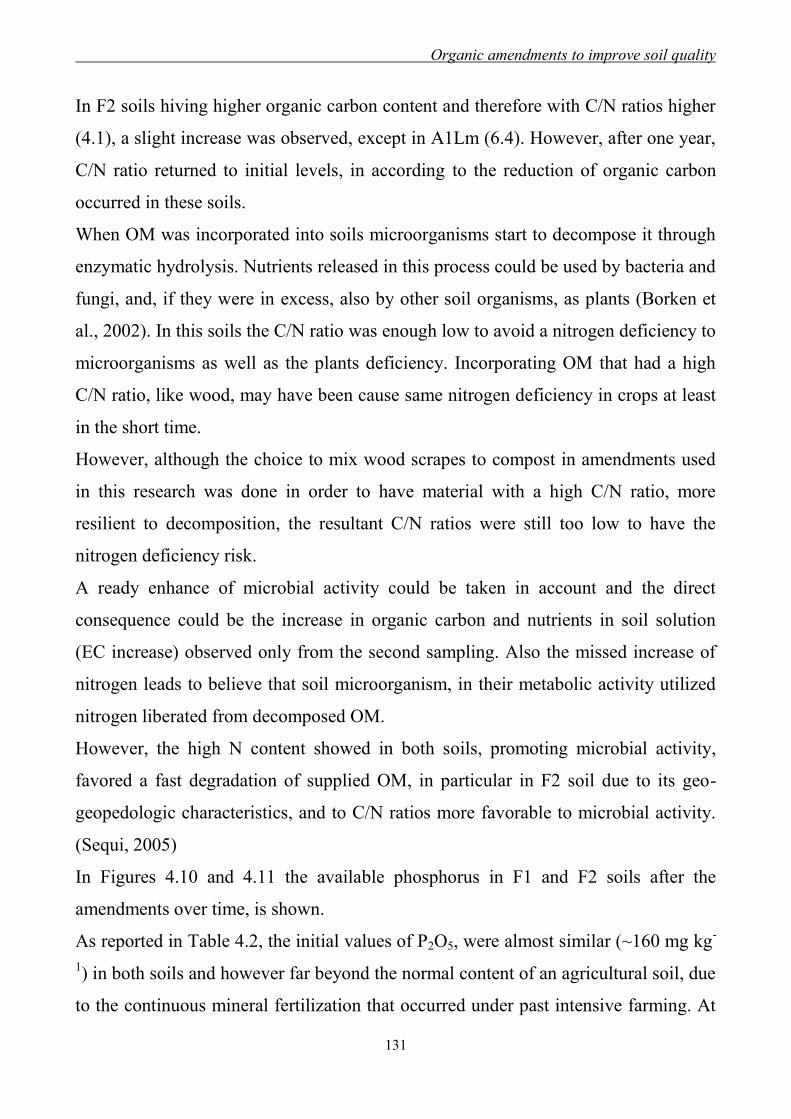
Organic amendments to improve soil quality
131
In F2 soils hiving higher organic carbon content and therefore with C/N ratios higher
(4.1), a slight increase was observed, except in A1Lm (6.4). However, after one year,
C/N ratio returned to initial levels, in according to the reduction of organic carbon
occurred in these soils.
When OM was incorporated into soils microorganisms start to decompose it through
enzymatic hydrolysis. Nutrients released in this process could be used by bacteria and
fungi, and, if they were in excess, also by other soil organisms, as plants (Borken et
al., 2002). In this soils the C/N ratio was enough low to avoid a nitrogen deficiency to
microorganisms as well as the plants deficiency. Incorporating OM that had a high
C/N ratio, like wood, may have been cause same nitrogen deficiency in crops at least
in the short time.
However, although the choice to mix wood scrapes to compost in amendments used
in this research was done in order to have material with a high C/N ratio, more
resilient to decomposition, the resultant C/N ratios were still too low to have the
nitrogen deficiency risk.
A ready enhance of microbial activity could be taken in account and the direct
consequence could be the increase in organic carbon and nutrients in soil solution
(EC increase) observed only from the second sampling. Also the missed increase of
nitrogen leads to believe that soil microorganism, in their metabolic activity utilized
nitrogen liberated from decomposed OM.
However, the high N content showed in both soils, promoting microbial activity,
favored a fast degradation of supplied OM, in particular in F2 soil due to its geo-
geopedologic characteristics, and to C/N ratios more favorable to microbial activity.
(Sequi, 2005)
In Figures 4.10 and 4.11 the available phosphorus in F1 and F2 soils after the
amendments over time, is shown.
As reported in Table 4.2, the initial values of P2O5, were almost similar (~160 mg kg-
1) in both soils and however far beyond the normal content of an agricultural soil, due
to the continuous mineral fertilization that occurred under past intensive farming. At
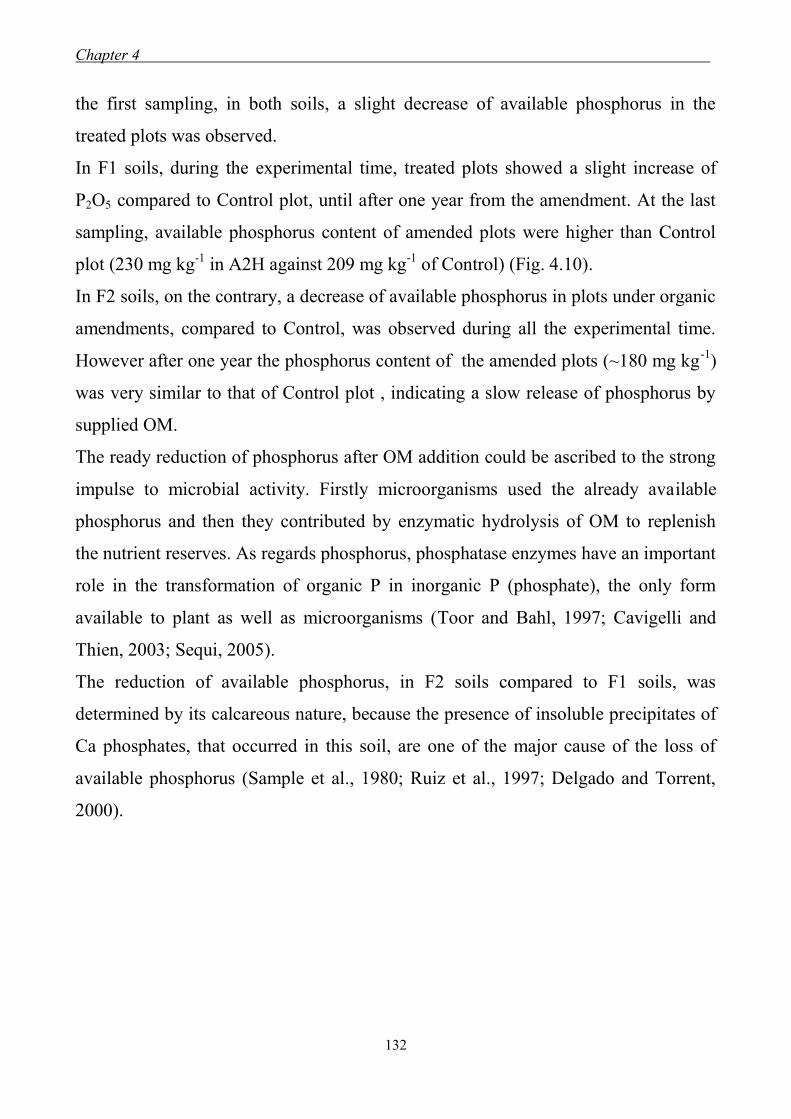
Chapter 4 .
132
the first sampling, in both soils, a slight decrease of available phosphorus in the
treated plots was observed.
In F1 soils, during the experimental time, treated plots showed a slight increase of
P2O5 compared to Control plot, until after one year from the amendment. At the last
sampling, available phosphorus content of amended plots were higher than Control
plot (230 mg kg-1
in A2H against 209 mg kg-1
of Control) (Fig. 4.10).
In F2 soils, on the contrary, a decrease of available phosphorus in plots under organic
amendments, compared to Control, was observed during all the experimental time.
However after one year the phosphorus content of the amended plots (~180 mg kg-1
)
was very similar to that of Control plot , indicating a slow release of phosphorus by
supplied OM.
The ready reduction of phosphorus after OM addition could be ascribed to the strong
impulse to microbial activity. Firstly microorganisms used the already available
phosphorus and then they contributed by enzymatic hydrolysis of OM to replenish
the nutrient reserves. As regards phosphorus, phosphatase enzymes have an important
role in the transformation of organic P in inorganic P (phosphate), the only form
available to plant as well as microorganisms (Toor and Bahl, 1997; Cavigelli and
Thien, 2003; Sequi, 2005).
The reduction of available phosphorus, in F2 soils compared to F1 soils, was
determined by its calcareous nature, because the presence of insoluble precipitates of
Ca phosphates, that occurred in this soil, are one of the major cause of the loss of
available phosphorus (Sample et al., 1980; Ruiz et al., 1997; Delgado and Torrent,
2000).
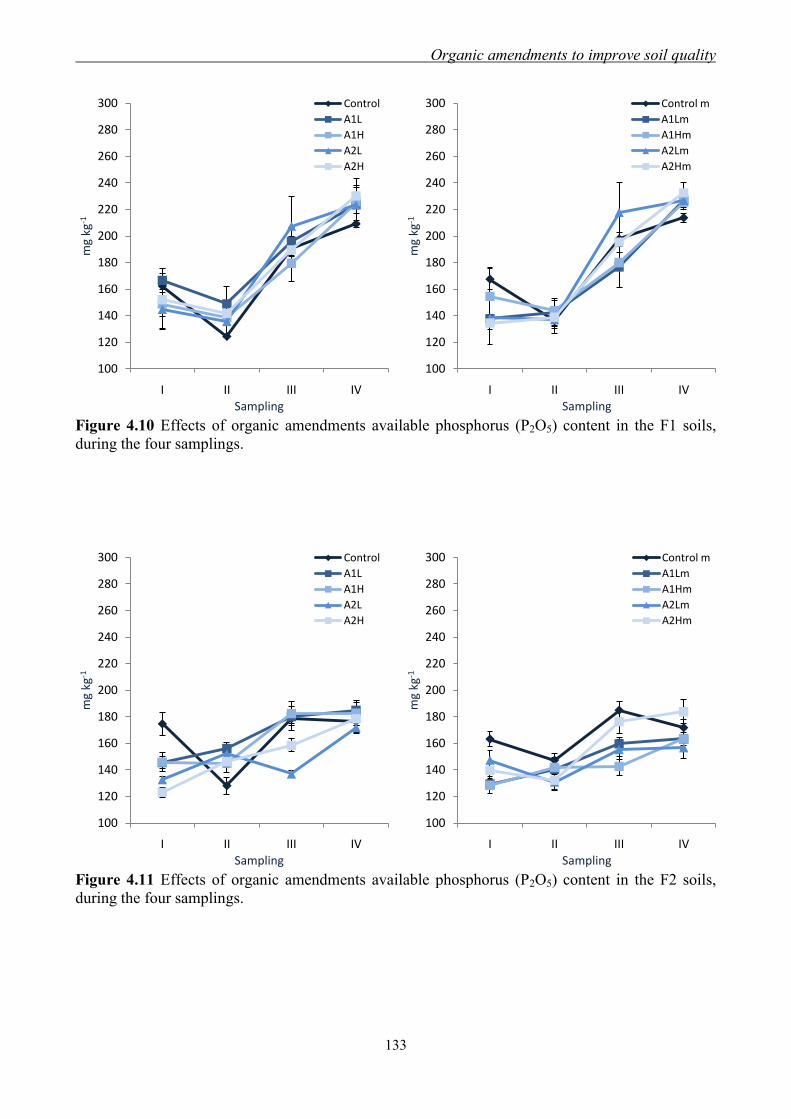
Organic amendments to improve soil quality
133
Figure 4.10 Effects of organic amendments available phosphorus (P2O5) content in the F1 soils,
during the four samplings.
Figure 4.11 Effects of organic amendments available phosphorus (P2O5) content in the F2 soils,
during the four samplings.
100
120
140
160
180
200
220
240
260
280
300
I II III IV
mg
kg-1
Sampling
Control
A1L
A1H
A2L
A2H
100
120
140
160
180
200
220
240
260
280
300
I II III IV
mg
kg-1
Sampling
Control m
A1Lm
A1Hm
A2Lm
A2Hm
100
120
140
160
180
200
220
240
260
280
300
I II III IV
mg
kg-1
Sampling
Control
A1L
A1H
A2L
A2H
100
120
140
160
180
200
220
240
260
280
300
I II III IV
mg
kg-1
Sampling
Control m
A1Lm
A1Hm
A2Lm
A2Hm
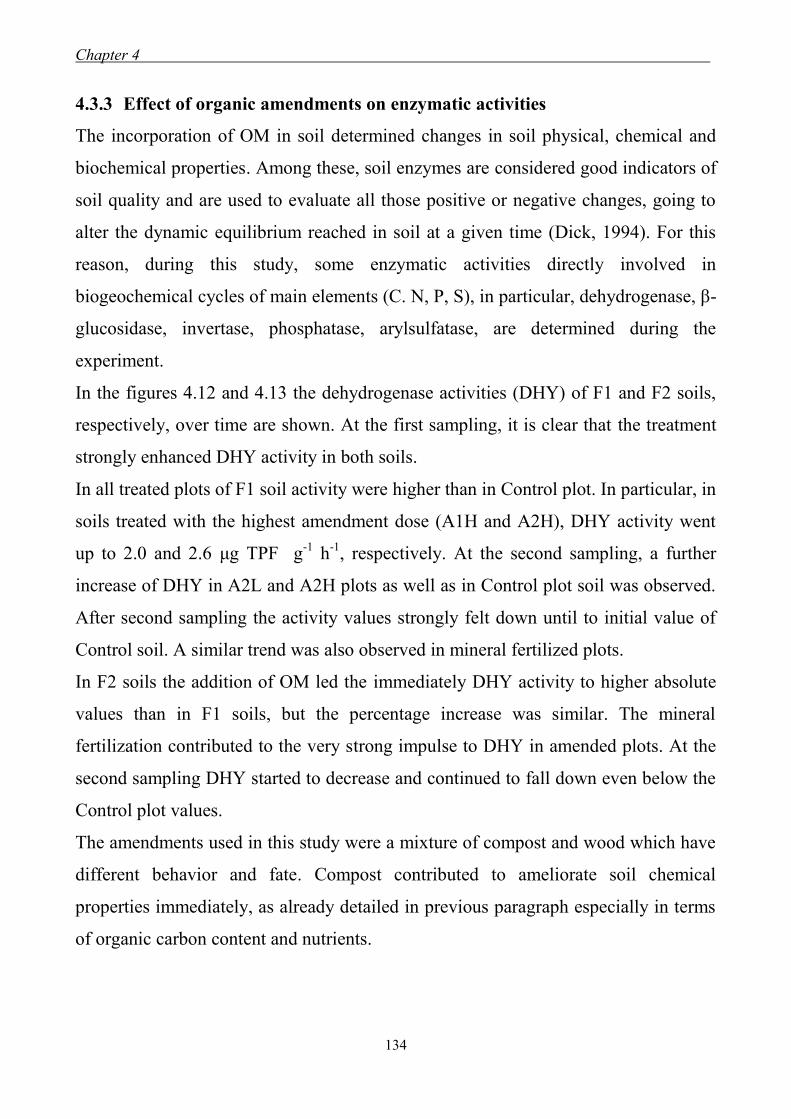
Chapter 4 .
134
4.3.3 Effect of organic amendments on enzymatic activities
The incorporation of OM in soil determined changes in soil physical, chemical and
biochemical properties. Among these, soil enzymes are considered good indicators of
soil quality and are used to evaluate all those positive or negative changes, going to
alter the dynamic equilibrium reached in soil at a given time (Dick, 1994). For this
reason, during this study, some enzymatic activities directly involved in
biogeochemical cycles of main elements (C. N, P, S), in particular, dehydrogenase, β-
glucosidase, invertase, phosphatase, arylsulfatase, are determined during the
experiment.
In the figures 4.12 and 4.13 the dehydrogenase activities (DHY) of F1 and F2 soils,
respectively, over time are shown. At the first sampling, it is clear that the treatment
strongly enhanced DHY activity in both soils.
In all treated plots of F1 soil activity were higher than in Control plot. In particular, in
soils treated with the highest amendment dose (A1H and A2H), DHY activity went
up to 2.0 and 2.6 μg TPF g-1
h-1
, respectively. At the second sampling, a further
increase of DHY in A2L and A2H plots as well as in Control plot soil was observed.
After second sampling the activity values strongly felt down until to initial value of
Control soil. A similar trend was also observed in mineral fertilized plots.
In F2 soils the addition of OM led the immediately DHY activity to higher absolute
values than in F1 soils, but the percentage increase was similar. The mineral
fertilization contributed to the very strong impulse to DHY in amended plots. At the
second sampling DHY started to decrease and continued to fall down even below the
Control plot values.
The amendments used in this study were a mixture of compost and wood which have
different behavior and fate. Compost contributed to ameliorate soil chemical
properties immediately, as already detailed in previous paragraph especially in terms
of organic carbon content and nutrients.
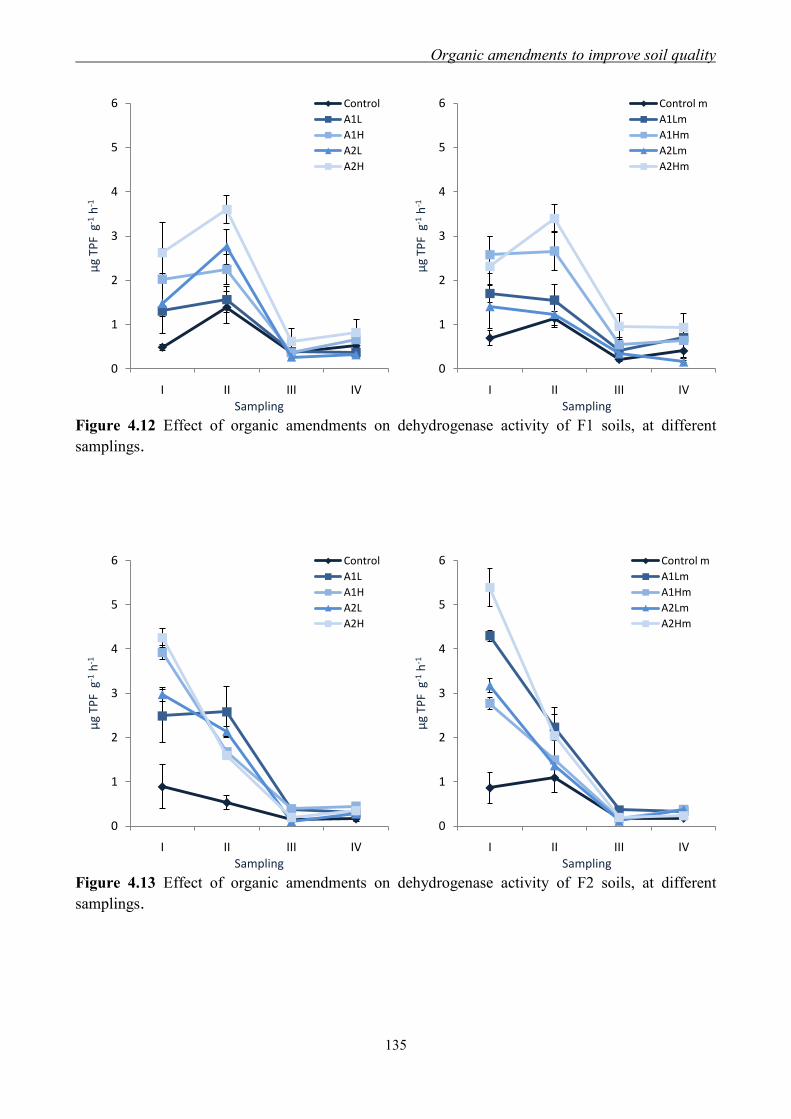
Organic amendments to improve soil quality
135
Figure 4.12 Effect of organic amendments on dehydrogenase activity of F1 soils, at different
samplings.
Figure 4.13 Effect of organic amendments on dehydrogenase activity of F2 soils, at different
samplings.
0
1
2
3
4
5
6
I II III IV
μg
TPF
g-1
h-1
Sampling
Control
A1L
A1H
A2L
A2H
0
1
2
3
4
5
6
I II III IV
μg
TPF
g-1
h-1
Sampling
Control m
A1Lm
A1Hm
A2Lm
A2Hm
0
1
2
3
4
5
6
I II III IV
μg
TPF
g-1
h-1
Sampling
Control
A1L
A1H
A2L
A2H
0
1
2
3
4
5
6
I II III IV
μg
TPF
g-1
h-1
Sampling
Control m
A1Lm
A1Hm
A2Lm
A2Hm
Chapter 4 .
136
The A1H and A2H , which were the plots receiving the larger amount of compost (54
and 40 t ha-1
, respectively), showed the higher increase of DHY, at first sampling in
both soils. DHY, as expected, was in according to the other parameters closely
related to this enzyme, in particular to organic carbon (Aon and Colanieri, 2001). In
fact, DHY was higher in F2 than F1 soils, according to their organic carbon content
(respectively 10.47 and 16.19 g kg-1
). In according to Kiem and Kandler (1997) the
positive effect of mineral fertilization could be due to the further stimulation of soil
microbial biomass. The dehydrogenase is a soil enzyme involved in all degradation
reactions of OM (Dick, 1994). Its activity is closely related to the activity of soil
microbial biomass and directly reflects the conditions of the biological activity in the
soil. Therefore, DHY performance is strongly affected by those factors that modify
the entity and the activity of the soil biomass (Dick, 1994).
To explain the behavior of the studied soils, seasonal effects should be also taken in
account. In fact samplings occurred in different seasons. The third and fourth
sampling were carried out in autumn and winter, when soil biological activity is
reduced compared to the spring and summer (first and second samplings) (Ros et al.,
2003). However also the reduced amount of labile organic C fraction over time
should be not excluded since microbial biomass is able to consume for metabolic
needs above all more available compounds, like polysaccharides, lipids etc (Kandeler
et al., 1999).
The β-glucosidase activity (GLU) of F1 and F2 soil, is shown in Figures 4.14 and
4.15, respectively.
In F1 soils, the addition of organic amendments determined no significant increase of
GLU activities at the first as well as second sampling, except in the plots with
mineral fertilization (m), indicating a positive effect of mineral fertilization on the
microbial activities. At the third and fourth sampling the activities decreased reaching
similar level (~0.1 mol p-NP g-1
h-1
) in all plots, included mineral fertilized ones.
In the F2 soils, on the contrary, the use of OM determined a significant increase of
the GLU activity compared to Control plot, but already from the second sampling a
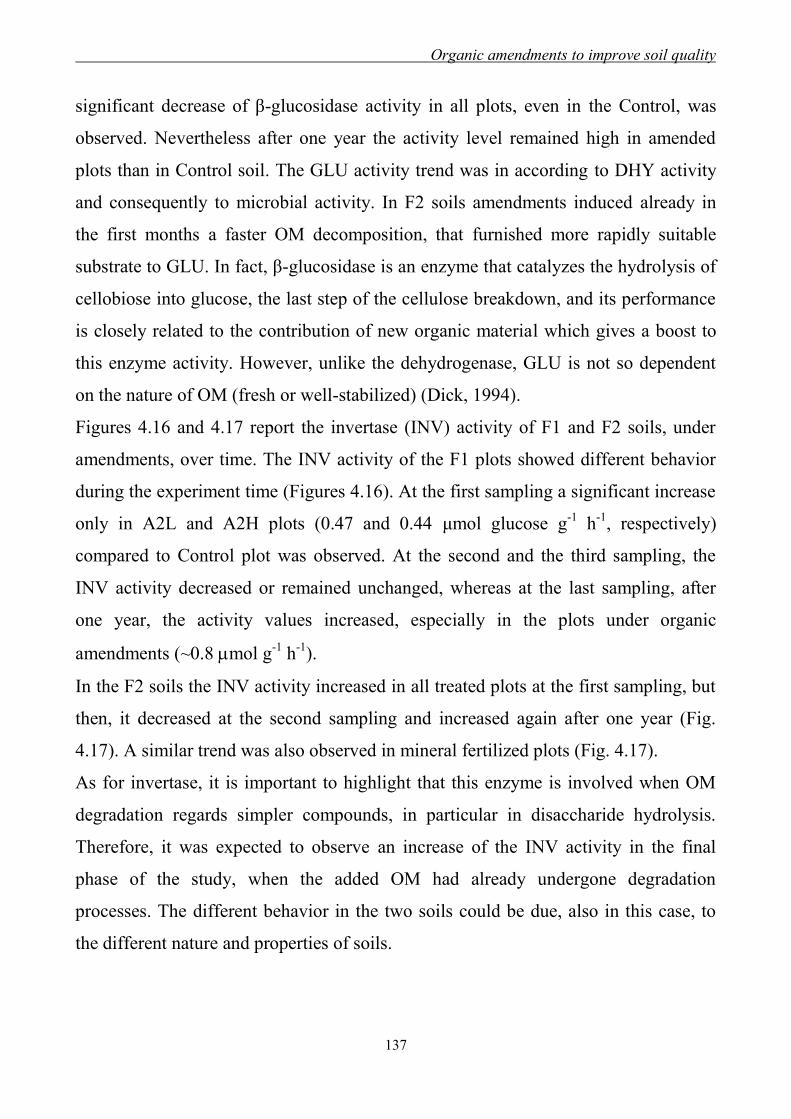
Organic amendments to improve soil quality
137
significant decrease of β-glucosidase activity in all plots, even in the Control, was
observed. Nevertheless after one year the activity level remained high in amended
plots than in Control soil. The GLU activity trend was in according to DHY activity
and consequently to microbial activity. In F2 soils amendments induced already in
the first months a faster OM decomposition, that furnished more rapidly suitable
substrate to GLU. In fact, β-glucosidase is an enzyme that catalyzes the hydrolysis of
cellobiose into glucose, the last step of the cellulose breakdown, and its performance
is closely related to the contribution of new organic material which gives a boost to
this enzyme activity. However, unlike the dehydrogenase, GLU is not so dependent
on the nature of OM (fresh or well-stabilized) (Dick, 1994).
Figures 4.16 and 4.17 report the invertase (INV) activity of F1 and F2 soils, under
amendments, over time. The INV activity of the F1 plots showed different behavior
during the experiment time (Figures 4.16). At the first sampling a significant increase
only in A2L and A2H plots (0.47 and 0.44 μmol glucose g-1
h-1
, respectively)
compared to Control plot was observed. At the second and the third sampling, the
INV activity decreased or remained unchanged, whereas at the last sampling, after
one year, the activity values increased, especially in the plots under organic
amendments (~0.8 mol g-1
h-1
).
In the F2 soils the INV activity increased in all treated plots at the first sampling, but
then, it decreased at the second sampling and increased again after one year (Fig.
4.17). A similar trend was also observed in mineral fertilized plots (Fig. 4.17).
As for invertase, it is important to highlight that this enzyme is involved when OM
degradation regards simpler compounds, in particular in disaccharide hydrolysis.
Therefore, it was expected to observe an increase of the INV activity in the final
phase of the study, when the added OM had already undergone degradation
processes. The different behavior in the two soils could be due, also in this case, to
the different nature and properties of soils.
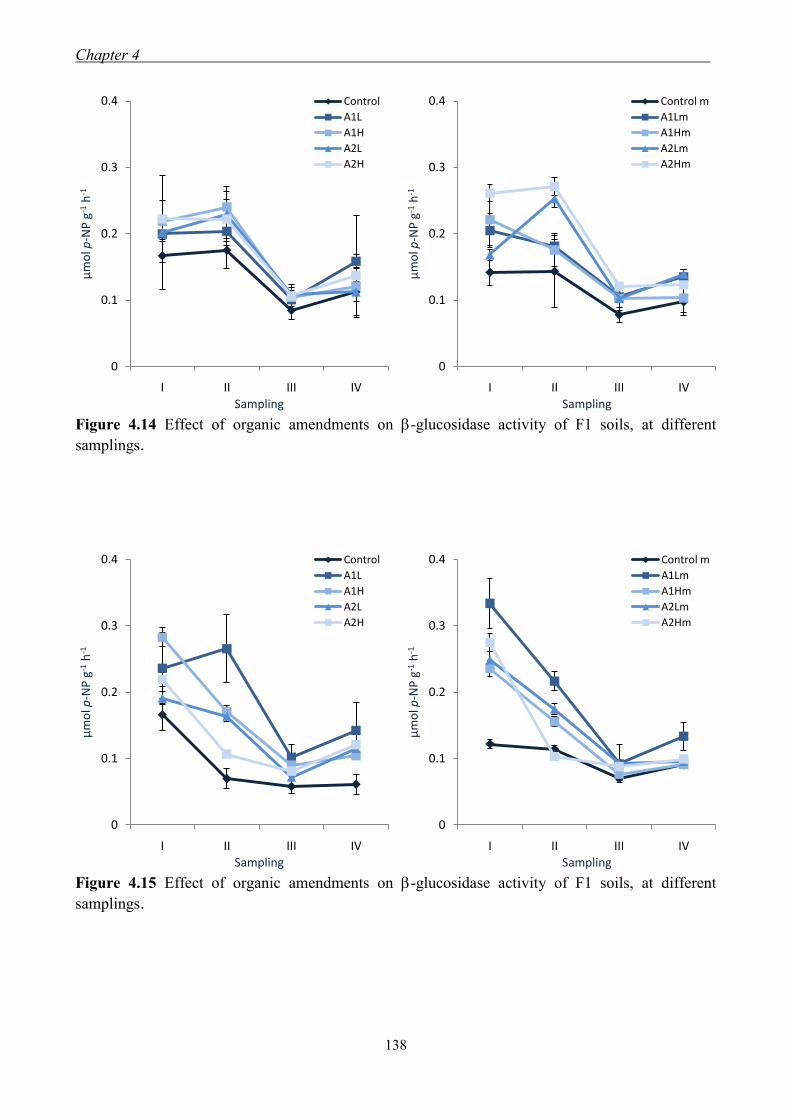
Chapter 4 .
138
Figure 4.14 Effect of organic amendments on -glucosidase activity of F1 soils, at different
samplings.
Figure 4.15 Effect of organic amendments on -glucosidase activity of F1 soils, at different
samplings.
0
0.1
0.2
0.3
0.4
I II III IV
μm
ol p
-NP
g-1
h-1
Sampling
Control
A1L
A1H
A2L
A2H
0
0.1
0.2
0.3
0.4
I II III IV
μm
ol p
-NP
g-1
h-1
Sampling
Control m
A1Lm
A1Hm
A2Lm
A2Hm
0
0.1
0.2
0.3
0.4
I II III IV
μm
ol p
-NP
g-1
h-1
Sampling
Control
A1L
A1H
A2L
A2H
0
0.1
0.2
0.3
0.4
I II III IV
μm
ol p
-NP
g-1
h-1
Sampling
Control m
A1Lm
A1Hm
A2Lm
A2Hm
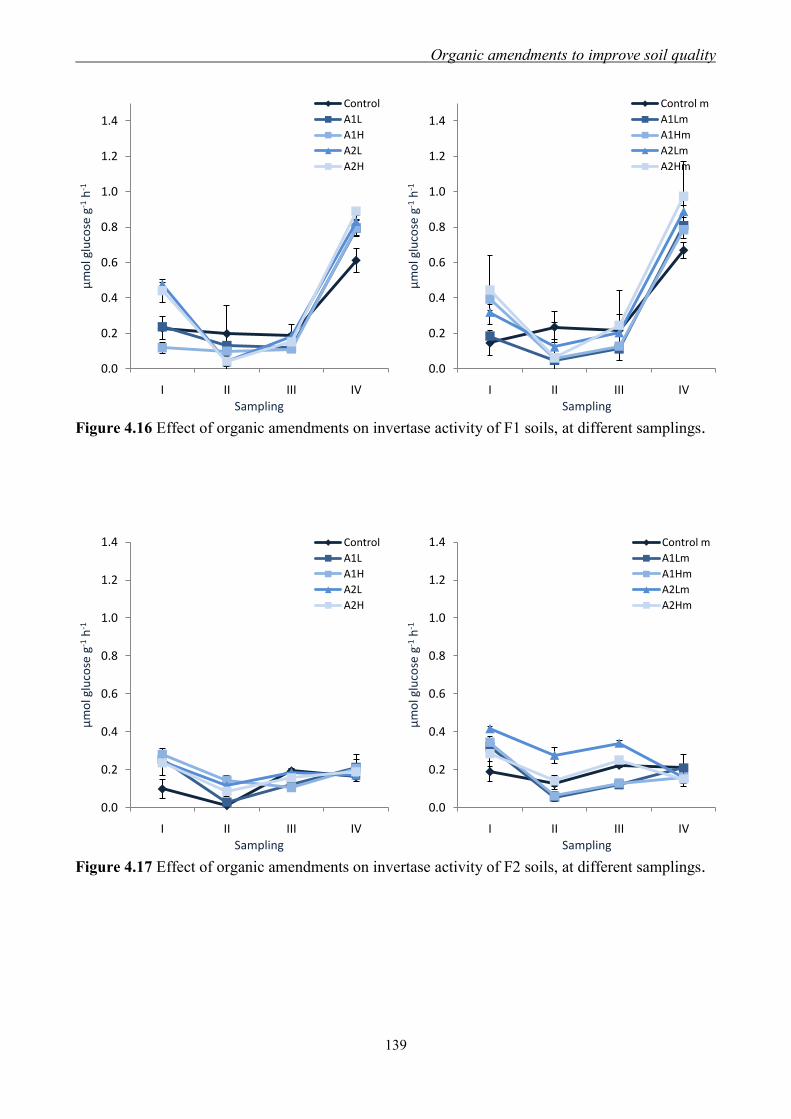
Organic amendments to improve soil quality
139
Figure 4.16 Effect of organic amendments on invertase activity of F1 soils, at different samplings.
Figure 4.17 Effect of organic amendments on invertase activity of F2 soils, at different samplings.
0.0
0.2
0.4
0.6
0.8
1.0
1.2
1.4
I II III IV
μm
ol g
luco
se g
-1h
-1
Sampling
Control
A1L
A1H
A2L
A2H
0.0
0.2
0.4
0.6
0.8
1.0
1.2
1.4
I II III IV
μm
ol g
luco
se g
-1h
-1Sampling
Control m
A1Lm
A1Hm
A2Lm
A2Hm
0.0
0.2
0.4
0.6
0.8
1.0
1.2
1.4
I II III IV
μm
ol g
luco
se g
-1h
-1
Sampling
Control
A1L
A1H
A2L
A2H
0.0
0.2
0.4
0.6
0.8
1.0
1.2
1.4
I II III IV
μm
ol g
luco
se g
-1h
-1
Sampling
Control m
A1Lm
A1Hm
A2Lm
A2Hm
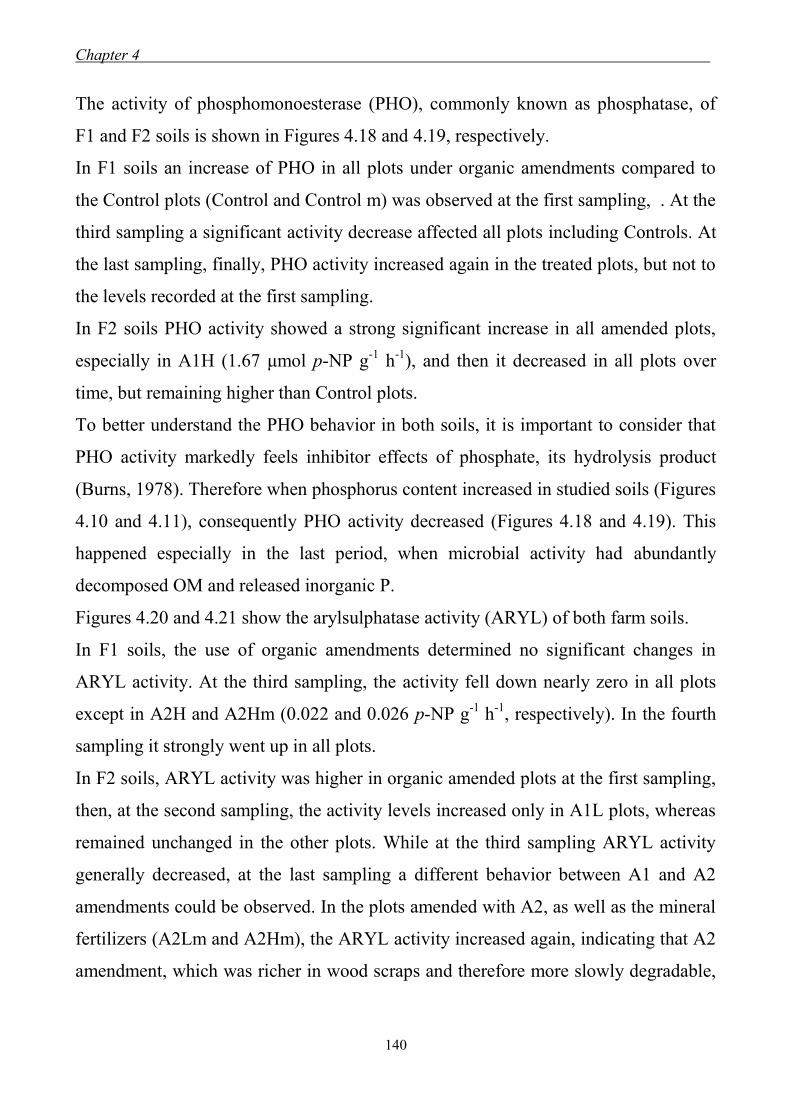
Chapter 4 .
140
The activity of phosphomonoesterase (PHO), commonly known as phosphatase, of
F1 and F2 soils is shown in Figures 4.18 and 4.19, respectively.
In F1 soils an increase of PHO in all plots under organic amendments compared to
the Control plots (Control and Control m) was observed at the first sampling, . At the
third sampling a significant activity decrease affected all plots including Controls. At
the last sampling, finally, PHO activity increased again in the treated plots, but not to
the levels recorded at the first sampling.
In F2 soils PHO activity showed a strong significant increase in all amended plots,
especially in A1H (1.67 μmol p-NP g-1
h-1
), and then it decreased in all plots over
time, but remaining higher than Control plots.
To better understand the PHO behavior in both soils, it is important to consider that
PHO activity markedly feels inhibitor effects of phosphate, its hydrolysis product
(Burns, 1978). Therefore when phosphorus content increased in studied soils (Figures
4.10 and 4.11), consequently PHO activity decreased (Figures 4.18 and 4.19). This
happened especially in the last period, when microbial activity had abundantly
decomposed OM and released inorganic P.
Figures 4.20 and 4.21 show the arylsulphatase activity (ARYL) of both farm soils.
In F1 soils, the use of organic amendments determined no significant changes in
ARYL activity. At the third sampling, the activity fell down nearly zero in all plots
except in A2H and A2Hm (0.022 and 0.026 p-NP g-1
h-1
, respectively). In the fourth
sampling it strongly went up in all plots.
In F2 soils, ARYL activity was higher in organic amended plots at the first sampling,
then, at the second sampling, the activity levels increased only in A1L plots, whereas
remained unchanged in the other plots. While at the third sampling ARYL activity
generally decreased, at the last sampling a different behavior between A1 and A2
amendments could be observed. In the plots amended with A2, as well as the mineral
fertilizers (A2Lm and A2Hm), the ARYL activity increased again, indicating that A2
amendment, which was richer in wood scraps and therefore more slowly degradable,
Organic amendments to improve soil quality
141
furnished suitable substrate to ARYL, also in long-term. A similar trend was
observed also in A1Hm.
As for PHO, also for ARYL it is possible to implicate inhibition phenomenon due to
sulphate releasing from OM decomposition (Burns, 1978).
The stability of the data collected during the experiment shows that this enzyme, in
the experimental conditions cannot be considered a good indicator for this study, due
to the its sensibility to trace elements present in compost (Al-Khafaji and Tabatabai,
1979; Bardgett et al., 1994) and the intensive use of fungicide, based on sulphaets, in
both farms (Trasar-Cepeda et al., 2008).
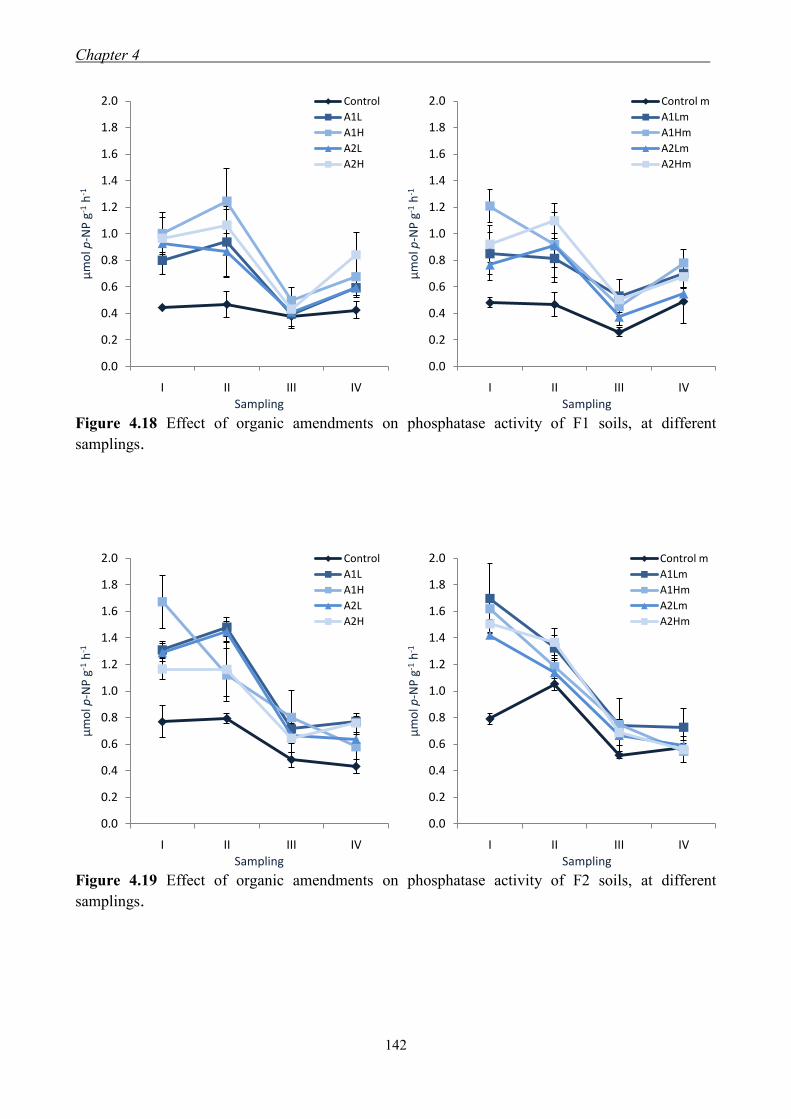
Chapter 4 .
142
Figure 4.18 Effect of organic amendments on phosphatase activity of F1 soils, at different
samplings.
Figure 4.19 Effect of organic amendments on phosphatase activity of F2 soils, at different
samplings.
0.0
0.2
0.4
0.6
0.8
1.0
1.2
1.4
1.6
1.8
2.0
I II III IV
μm
ol p
-NP
g-1
h-1
Sampling
Control
A1L
A1H
A2L
A2H
0.0
0.2
0.4
0.6
0.8
1.0
1.2
1.4
1.6
1.8
2.0
I II III IV
μm
ol p
-NP
g-1
h-1
Sampling
Control m
A1Lm
A1Hm
A2Lm
A2Hm
0.0
0.2
0.4
0.6
0.8
1.0
1.2
1.4
1.6
1.8
2.0
I II III IV
μm
ol p
-NP
g-1
h-1
Sampling
Control
A1L
A1H
A2L
A2H
0.0
0.2
0.4
0.6
0.8
1.0
1.2
1.4
1.6
1.8
2.0
I II III IV
μm
ol p
-NP
g-1
h-1
Sampling
Control m
A1Lm
A1Hm
A2Lm
A2Hm
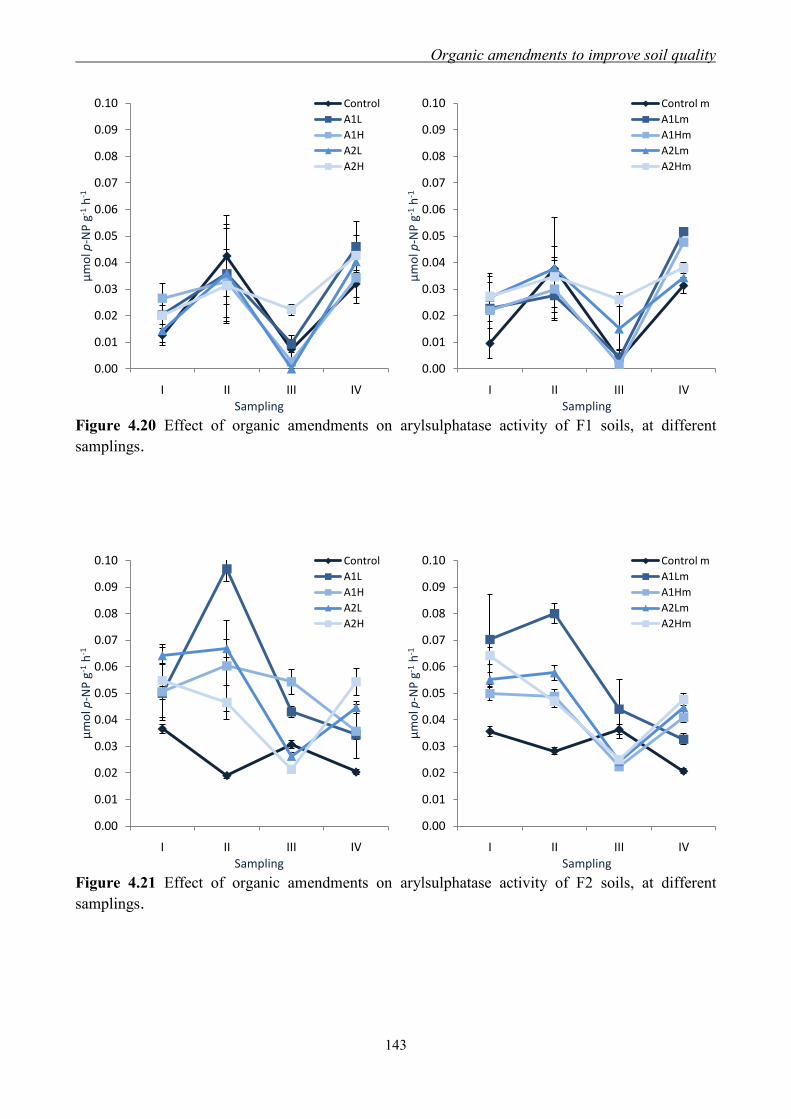
Organic amendments to improve soil quality
143
Figure 4.20 Effect of organic amendments on arylsulphatase activity of F1 soils, at different
samplings.
Figure 4.21 Effect of organic amendments on arylsulphatase activity of F2 soils, at different
samplings.
0.00
0.01
0.02
0.03
0.04
0.05
0.06
0.07
0.08
0.09
0.10
I II III IV
μm
ol p
-NP
g-1
h-1
Sampling
Control
A1L
A1H
A2L
A2H
0.00
0.01
0.02
0.03
0.04
0.05
0.06
0.07
0.08
0.09
0.10
I II III IV
μm
ol p
-NP
g-1
h-1
Sampling
Control m
A1Lm
A1Hm
A2Lm
A2Hm
0.00
0.01
0.02
0.03
0.04
0.05
0.06
0.07
0.08
0.09
0.10
I II III IV
μm
ol p
-NP
g-1
h-1
Sampling
Control
A1L
A1H
A2L
A2H
0.00
0.01
0.02
0.03
0.04
0.05
0.06
0.07
0.08
0.09
0.10
I II III IV
μm
ol p
-NP
g-1
h-1
Sampling
Control m
A1Lm
A1Hm
A2Lm
A2Hm

Chapter 4 .
144
4.3.4 Effect of organic amendments on crop production
In Figure 4.22 crop productions obtained in F1 plots are shown. During the first crop
cycle a significantly difference among soils under organic amendment was observed.
The treated plots produced lower melon yields (from 59.3 to 79.7 kg per plot, in A2H
and A2Lm, respectively) than Control and Control m (89.7 and 101 kg per plot,
respectively), whereas the sugar content of melon was no affected by organic
amendments (data not showed).
During the second and the third crop cycle, the average weight of lettuces (AWL) in
F1 soils was calculated (Fig. 4.23a) and this was significantly and positively affected
by organic amendments. In fact, in the second crop cycle Control and Control m
showed lower AWL (193.56 and 211.60 g plant-1
, respectively) than treated plots. In
particular, the amendment A1determined the higher AWL (A1L and A1H, 291.38
and 309.09 g, respectively). Similar trend was observed in the third cycle: 301.27 and
317.00 g in A1L and A1H plots, respectively (Fig. 4.23b).
In F2, during the first crop cycle, few differences among plots were observed (Fig.
4.22b). Also in these soils Control plot produced the highest melon yield (63.7 kg),
while the amendment A2 determined the lowest (38 and 39 kg per plot in A2L and
A2H, respectively). As occured in F1, also in these soils the sugar content of melon
was no affected by organic amendments (data not showed).
As in F1 soils, in F2 soils crop production was significantly enhanced by organic
amendments, in the second and third crop cycles (Fig. 4.24). While in the second
cycle only A1L and A1Lm (372.27 and 369.82 g plant-1
, respectively) determined a
significant improvement to kohlrabi weight compared to Control plot (256.93 g plant-
1), in the third crop cycle, all amendment led to significant differences against Control
plot. Also in this case, A1H determined the higher average weight of kohlrabi
(479.53 g plant-1
).
Therefore, by summarize crop yield results, the positive effects of all used organic
amendment in this study was highlighted only from the second crop cycle, as in
short-term a negative effect attributable to initial phytotoxicity of supplied OM was
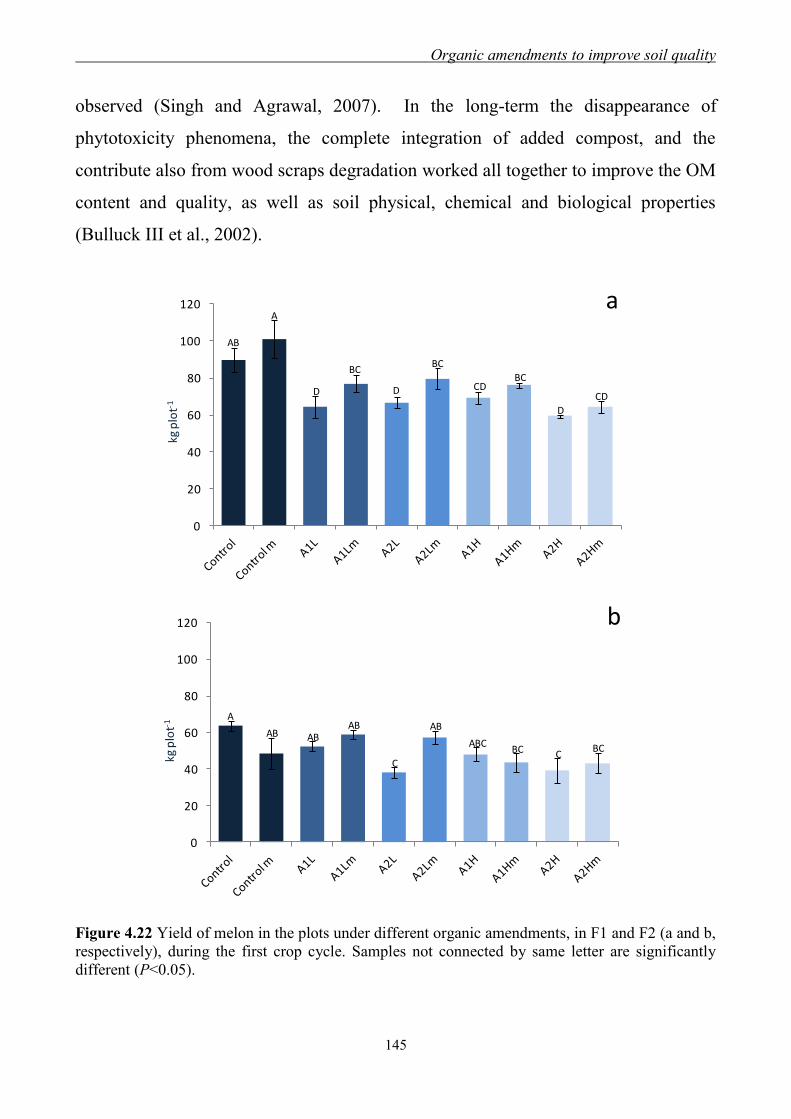
Organic amendments to improve soil quality
145
observed (Singh and Agrawal, 2007). In the long-term the disappearance of
phytotoxicity phenomena, the complete integration of added compost, and the
contribute also from wood scraps degradation worked all together to improve the OM
content and quality, as well as soil physical, chemical and biological properties
(Bulluck III et al., 2002).
Figure 4.22 Yield of melon in the plots under different organic amendments, in F1 and F2 (a and b,
respectively), during the first crop cycle. Samples not connected by same letter are significantly
different (P<0.05).
0
20
40
60
80
100
120
kg p
lot-1
BC
aA
AB
D D
BC
CDBC
D
CD
0
20
40
60
80
100
120
kg p
lot-1
b
AAB AB
ABABC
AB
BC BCC
C
a
b
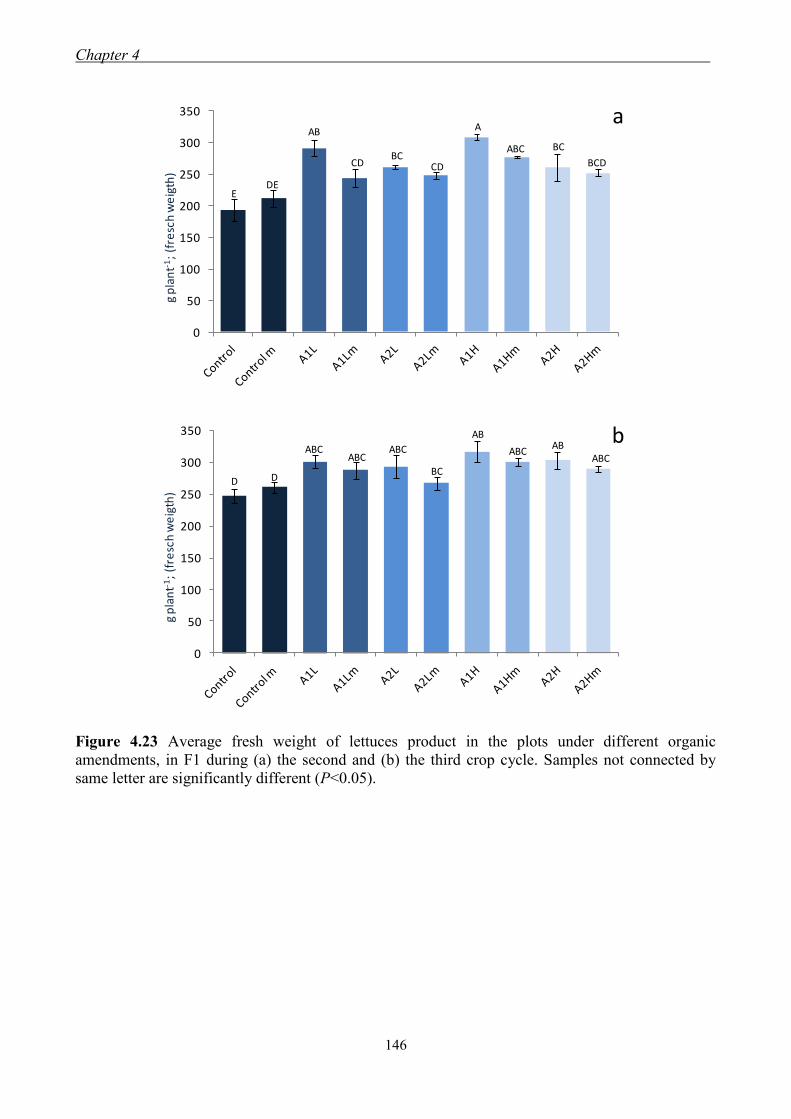
Chapter 4 .
146
Figure 4.23 Average fresh weight of lettuces product in the plots under different organic
amendments, in F1 during (a) the second and (b) the third crop cycle. Samples not connected by
same letter are significantly different (P<0.05).
0
50
100
150
200
250
300
350
g p
lan
t-1;
(fre
sch
we
igth
)
EDE
AB
CDBC
CD
A
ABC BC
BCD
a
0
50
100
150
200
250
300
350
g p
lan
t-1;
(fre
sch
we
igth
)
bABABABC ABCABC
ABCABC
BCDD
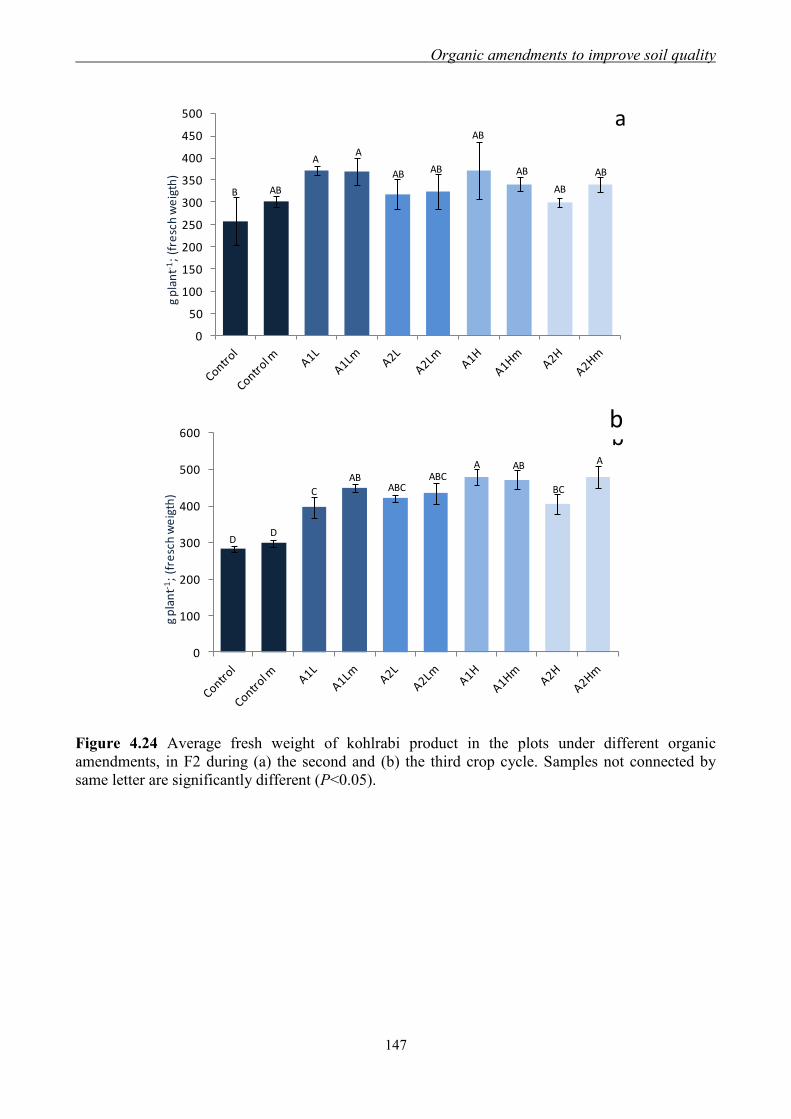
Organic amendments to improve soil quality
147
Figure 4.24 Average fresh weight of kohlrabi product in the plots under different organic
amendments, in F2 during (a) the second and (b) the third crop cycle. Samples not connected by
same letter are significantly different (P<0.05).
0
50
100
150
200
250
300
350
400
450
500
g p
lan
t-1;
(fre
sch
we
igth
)
aAB
AA
B
AB
AB
ABABAB
AB
0
100
200
300
400
500
600
g p
lan
t-1;
(fre
sch
we
igth
)
bA AAB
AB ABCABC BCC
DD
b
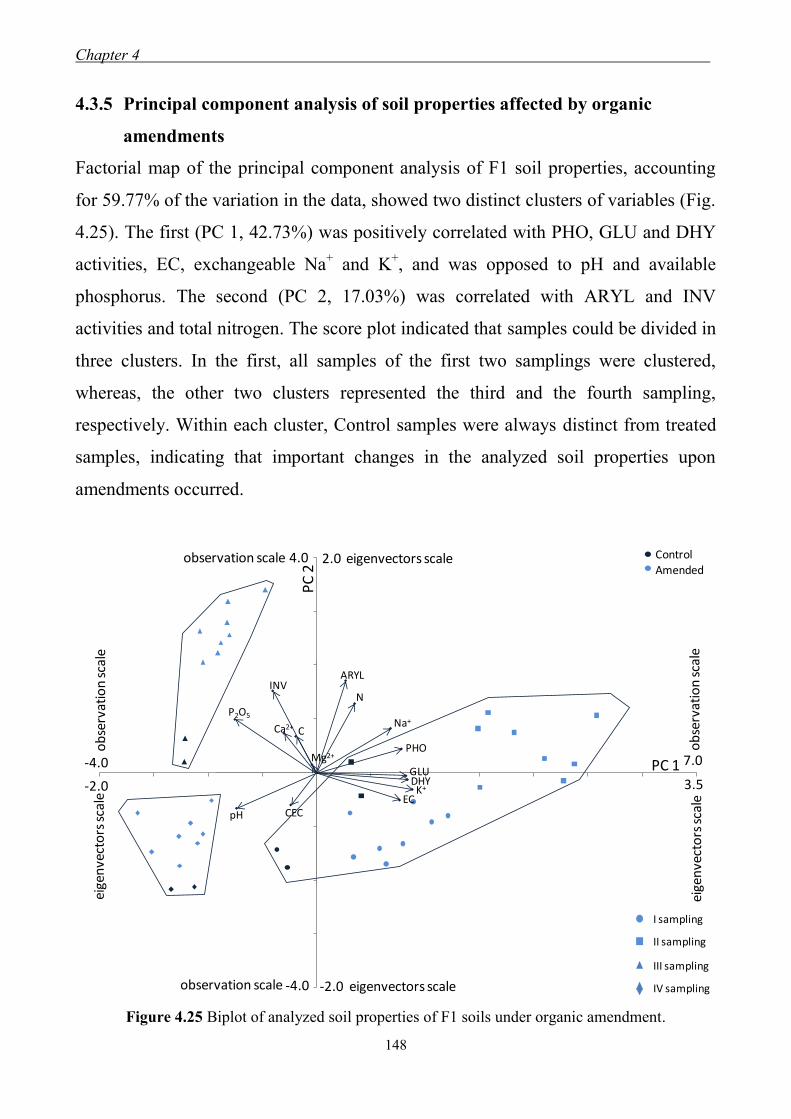
Chapter 4 .
148
4.3.5 Principal component analysis of soil properties affected by organic
amendments
Factorial map of the principal component analysis of F1 soil properties, accounting
for 59.77% of the variation in the data, showed two distinct clusters of variables (Fig.
4.25). The first (PC 1, 42.73%) was positively correlated with PHO, GLU and DHY
activities, EC, exchangeable Na+ and K
+, and was opposed to pH and available
phosphorus. The second (PC 2, 17.03%) was correlated with ARYL and INV
activities and total nitrogen. The score plot indicated that samples could be divided in
three clusters. In the first, all samples of the first two samplings were clustered,
whereas, the other two clusters represented the third and the fourth sampling,
respectively. Within each cluster, Control samples were always distinct from treated
samples, indicating that important changes in the analyzed soil properties upon
amendments occurred.
Figure 4.25 Biplot of analyzed soil properties of F1 soils under organic amendment.
ControlAmended
INVARYL
N
Na+
PHO
GLUDHYK+
ECCECpH
P2O5
Ca2+ C
Mg2+
eige
nve
cto
rs s
cale
ob
serv
atio
n s
cale
7.0
3.5
ob
serv
atio
n s
cale
eige
nve
cto
rs s
cale
-4.0
-2.0
observation scale eigenvectors scale2.04.0
observation scale eigenvectors scale-2.0-4.0
PC 1
PC
2
I sampling
II sampling
III sampling
IV sampling
Organic amendments to improve soil quality
149
The first cluster had positive values of PC 1, in particular in treated samples. This
result suggested and confirmed that the addition of organic amendments have
determined an increase of microbial activity and exchangeable Na+ and K
+, but a
decrease of phosphorus content, probably because microorganisms, stimulated by
added OM, used available phosphorus for their metabolic needs.
The second cluster, formed by all samples of the third sampling, had negative values
of PC 1 and PC 2, in particular untreated samples. The seasonal effect on this
sampling and the reduction of labile OM could be responsible for the microbial
activity reduction. Negative values of PC 1 indicate an increase of available
phosphorus likely caused by the OM degradation, and the consequently increase of
available phosphate. Reduction of total nitrogen observed from negative values of PC
2, instead, could be due to intensive microbial activity that metabolized available
nitrogen for its metabolic needs in the first phase of study.
The last cluster represented in the score plot, collected soils samples of the last
sampling. These samples were characterized by negative values of PC 1 and by
positive values of PC 2.Treated samples had higher values of PC 2 than Control
samples belonging to the same cluster, highlighting higher values of total nitrogen,
ARYL and INV activities in the treated samples, after one year from the OM
addition, compared to Control plot.
Therefore, the separation of all samples in three cluster, related to samplings,
indicated an evolution of analyzed soil properties over time, that could be related to
the seasonal factor and the maturity of added OM.
The analysis of principal components of F2 soils showed that the first and second
clusters of variables explained 66.75% of the total variance (Fig. 4.26). The first one
was correlated with PHO, GLU, ARYL and DHY activities, EC, exchangeable Na+
and K+, and negatively correlated with available phosphorus, whereas the second
with INV activity, CEC and exchangeable Mg2+
.
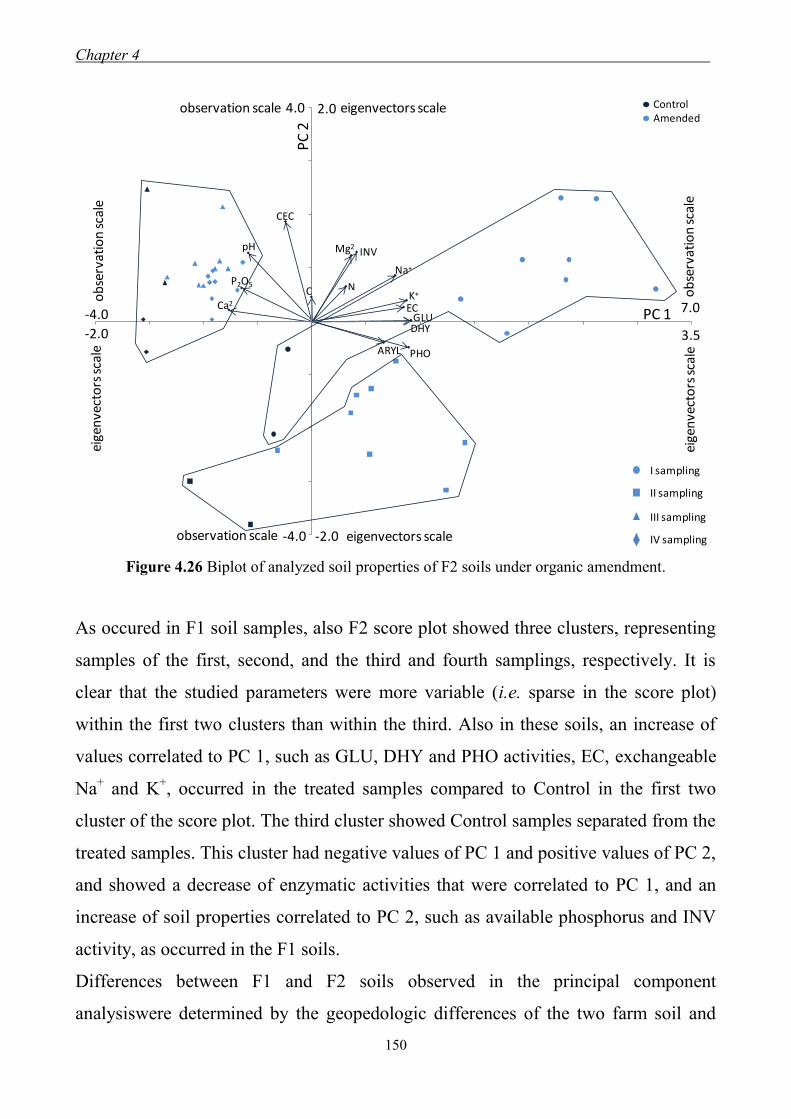
Chapter 4 .
150
Figure 4.26 Biplot of analyzed soil properties of F2 soils under organic amendment.
As occured in F1 soil samples, also F2 score plot showed three clusters, representing
samples of the first, second, and the third and fourth samplings, respectively. It is
clear that the studied parameters were more variable (i.e. sparse in the score plot)
within the first two clusters than within the third. Also in these soils, an increase of
values correlated to PC 1, such as GLU, DHY and PHO activities, EC, exchangeable
Na+ and K
+, occurred in the treated samples compared to Control in the first two
cluster of the score plot. The third cluster showed Control samples separated from the
treated samples. This cluster had negative values of PC 1 and positive values of PC 2,
and showed a decrease of enzymatic activities that were correlated to PC 1, and an
increase of soil properties correlated to PC 2, such as available phosphorus and INV
activity, as occurred in the F1 soils.
Differences between F1 and F2 soils observed in the principal component
analysiswere determined by the geopedologic differences of the two farm soil and
INV
ARYL
N
Na+
PHO
GLUDHY
K+
EC
CEC
pH
P2O5
Ca2
C
Mg2
eige
nve
cto
rs s
cale
ob
serv
atio
n s
cale
7.0
3.5
ob
serv
atio
n s
cale
eige
nve
cto
rs s
cale
-4.0
-2.0
observation scale eigenvectors scale 2.04.0
observation scale eigenvectors scale-2.0-4.0
PC
2PC 1
ControlAmended
I sampling
II sampling
III sampling
IV sampling

Organic amendments to improve soil quality
151
different responses to various organic amendments, as explained in detail the in
previous paragraphs.
Chapter 4 .
152
4.4 Conclusions
This study confirmed the positive effects of organic amendments on soil fertility. The
amended soils of both farms, after one year, showed an improvement of soil chemical
properties, in particular in terms of organic carbon content. In disaccording to
previous studies that showed no positive change in the C balance after three years of
30-1
t ha compost yearly supply (Morra et al., 2006), in the present study the use of
compost mixed with wood scraps, as low mineralization rate material, determined a
stable increase of organic C content over time, in particular in F1 soils, due to its
geopedologic characteristics. Organic amendments provided both positive effects on
organic C content and nutrients especially as available phosphorus, so demonstrating
to be a good alternative to conventional fertilizers.
Biochemical properties, such as enzymatic activities, were positively influenced by
organic amendments, but after one year strongly decreased. Probably, the seasonal
effect and changes in substrate availability could determine a decrease of DHY, GLU
and PHO activities, whereas the degraded OM into simpler carbohydrates, as
disaccharides, caused the increase of INV activities.
At the end of the study, no different response to different amendment doses and to the
kind of mixture supplied was observed. At the light of these results, already the use of
the lower amount of A1 mixture led to significant advantages, in particular in terms
of OM recovery.
In this study, crop yields were higher in fields under organic amendments than in the
Control plots under conventional farming, after the second crop cycle. The effects of
amendments were correlated to the time analysis: negative correlation in the short
time (first crop cycle) due to an initial phytotoxicity of supplied compost, but
strongly positive correlation over time for the beneficial effects on soil nutrients and
OM.
Our results demonstrated that the use of compost enriched with low mineralization
materials, such as wood scraps, can enhance soil biochemical and chemical properties
Organic amendments to improve soil quality
153
compared with synthetic fertilizers, and consequently improve crop yield, but above
all to guarantee an OM recovery that kept stable over time.
Chapter 4 .
154
4.5 References
Al-Khafaji A.A. and Tabatabai M.A., 1979 Effects of trace elements on arylsulfatase
activity in soils. Soil Science 127:129-133.
Amato M. and Ladd, J.N., 1980. Studies of nitrogen immobilization and
mineralization in calcareous soils. V. Formation and distribution of isotope-
labelled biomass during decomposition of 14
C- and 15
N carbon and nitrogen
isotope-labelled plant material. Soil Biology and Biochemistry 12:405-411.
Anderson D.W. and Paul E.A., 1984. Organo-mineral complexes and their study by
radiocarbon dating. Soil Science Society of America Journal 48:298-301.
Aon M.A., Colanieri A.C., 2001. Temporal and spatial evolution of enzymatic
activities and physico-chemical properties in an agricultural soil. Applied Soil
Ecology 18:255-270.
Bardgett R.D., Speir T.W., Ross D.J., Yeates G.W. and Kettles H.A., Impact of
pasture contamination by copper, chromium and arsenic timber preservative on soil
microbial properties and nematodes. Biology and Fertility of Soils 18:71-79.
Bonanomi G., Antignani V., Capodilupo M., Cozzolino L., D‟Ascoli R., Marzioli R.,
Puopolo G., Rao M.A., Rutigliano F.A., Scotti R., Zoina A., 2010. Assessing soil
quality under intensive cultivation and tree orchards in Southern Italy. Applied Soil
Ecology Accepted.
Bonanomi G., Antignani V., Pane C., Scala F. 2007. Suppression of soilborne fungal
diseases with organic amendments. Journal of Plant Pathology 89:311-340.
Borken W., Muhs A., Beese F. 2002. Changes in microbial and soil properties
following compost treatment of degraded temperate forest soils. Soil Biology and
Biochemistry 34: 403-412.
Bougnom B.P., Mair J., Etoa F.X., Insam H. 2009 Composts withwood ash addition:
A risk or a chance for ameliorating acid tropical soils? Geoderma 153:402-407.
Organic amendments to improve soil quality
155
Bronson K.F., Cassman K.G., Wassman R., Olk D.C., van Noordwijk M., Garrity
D.P., 1997. Soil carbon dynamics in different cropping systems in principal
ecoregions of Asia. In: Lal, R., et al. (Eds.), Management of Carbon Sequestration
in Soil. CRC Press, Boca Raton, FL, pp. 35-57.
Bulluck III L.R., Brosius M., Evanylo G.K., Ristaino J.B. 2002. Organic and
synthetic fertility amendments influence soil microbial, physical and chemical
properties on organic and conventional farms. Applied Soil Ecology 19:147-160.
Burns R.G. 1978. Soil Enzymes. Academic Press, New York.
Cavigelli M.A., Thien S.J., 2003. Phosphorus bioavailability following incorporation
of green manure crops. Soil Science Society American Journal 67:1186-1194.
Christensen B.T., 1996. Carbon in primary and secondary organomineral complexes.
In: Carter, M.R., Stewart, B.A. (Eds.), Structure and Organic Matter Storage in
Agricultural Soils. Lewis Publ., Boca Raton, FL, pp. 97-165.
Claassen V.P. and Carey J. L. 2006 Comparison of slow-release nitrogen yield from
organic soil amendments and chemical fertilizers and implications for regeneration
of disturbed sites. Land Degradation and Development 18:119-132.
Conklin A.E., Erich M.S., Liebman M., Lambert D., Gallandt E.R., Halteman W.A.
2002. Effects of red clover (Trifolium pratense) green manure and compost soil
amendments on wild mustard (Brassica kaber) growth and incidence of disease.
Plant and Soil 238: 245-256.
Delgado A. and Torrent J., 2000. Phosphorus forms and desorption patterns in
heavily fertilized calcareous and limed soils. Soil Science Society of America
Journal 64:2031-2037.
Dick R.P., 1994. Soil enzyme activities as indicators of soil quality. In: Doran J.W.,
Coleman D.C., Bezdicek D.F., Stewart B.A. (Eds.) Defining Soil Quality for a
Sustainable Environment. Soil Science Society of America Special Publication No.
35, Madison, Winsconsin, pp. 107-124.
Chapter 4 .
156
Doran, J., 1995. Building soil quality. In: Proceedings of the 1995 Conservation
Workshop on Opportunities and Challenges in Sustainable Agriculture. Red Deer,
Alta., Canada, Alberta Conservation Tillage Society and Alberta Agriculture
Conservation, Development Branch, pp. 151-158.
Drinkwater L.E., Letourneau D.K., Workneh F., van Bruggen A.H.C., Shennan C.,
1995. Fundamental differences between conventional and organic tomato
agroecosystems in California. Ecological Applications 5:1098-1112.
Gill H.S. and Meelu O.P., 1982. Studies on the substitution of inorganic fertilizers
with organic manure and their effect on soil fertility in rice-wheat rotation.
Fertilezer Research 3:303-314.
Govindasamy R. and Italia J., 1998. A willingness-to-purchase comparison of
integrated pest management and conventional produce. Agribusiness 14:403-414.
Hassink J., Whitmore A.P., Kubat J., 1997. Size and density fractionation of soil
organic matter and the physical capacity of soil to protect organic matter.
European Journal of Agronomy 7:189-199.
Hoitink H.A.J., Boehm M.J., 1999. Biocontrol within the context of soil microbial
communities: a substrate-dependent phenomenon. Annual Review of
Phytopathology 37:427-446.
Kandeler E., Stemmer M., Klimanek E.M., 1999. Response of soil microbial
biomass, urease and xylanase within particle size fraction to long-term soil
management. Soil Biology and Biochemistry 31:261-273.
Kiem R. and Kandeler E., 1997. Stabilization of aggregates by the microbial biomass
as affected by soil texture and type. Applied Soil Ecology 5:221-230.
Klonsky K. and Tourte L., 1998. Organic agricultural production in the United States:
debates and directions. American Journal of Agriculture Economy 80:1119-1124.
Magid J., Henriksen O., Thorup-Kristensen K., Mueller T. 2001. Disproportionately
high N-mineralisation rates from green manures at low temperatures - implications
for modelling and management in cool temperate agro-ecosystems. Plant and Soil
228:73-82.

Organic amendments to improve soil quality
157
Mahapatra B.S., Sharma G.L., Singh N., 1991. Integrated management of straw and
urea nitrogen in lowland rice under a rice-wheat rotation. Journal of Agriculture
Science Cambridge 116:217-222.
Marcote I., Hernandez T., Garcia C., Polo A., 2001. Influence of one or two
successive annual application of organic fertilisers on the enzyme activity of a soil
under barley cultivation. Bioresource technology 79:147-154.
Morra L., Bilotto M., Pagano L., Calì., Iovieno P., Tonini A., 2006. Studio degli
effetti dell‟ammendamento con compost in un agrosistema orticolo sotto serra
attraverso l‟analisi della produzione colturale, della fertilità chimica del terreno e
della micorrizzazione radical. Atti del convegno: Utilizzo del compost da frazione
organica dei rifiuti solidi urbani : attualità e prospettive. Napoli, Citta della
Scienza.
Nambiar K.K.M., 1997. Soil health and organic matter—changing scenario.
Proceedings of the Indian National Science Academy 67B:141-160.
Nelson N., 1944. A photometric adaptation of the Somogyi method for the
determination of glucose. Journal of Biological Chemistry 153:375-380.
Ponnamperuma F.N., 1984. Straw as a source of nutrients for wetland rice. In:
Organic Matter and Rice. International Rice Research Institute, Manila,
Philippines, pp. 117-136.
Regione Campania - Assessorato Agricoltura - Settore SIRCA, 2004. Carta dei Suoli
della Piana in sinistra Sele.
Reichardt W., Inubushi K., Tiedje J., 2000. Microbial processes in C and N
dynamics. In: Kirk, G.J.D., Olk, D.C. (Eds.), Carbon and Nitrogen Dynamics in
Flooded Soils. International Rice Research Institute, Makati City, Philippines, pp.
101-146.
Ros M., Hernandez M.T., Garcìa C., 2003. Soil microbial activity after restoration of
a semiarid soil by organic amendments. Soil Biology and Biochemistry 35:463-
469.

Chapter 4 .
158
Ruiz J. M., Delgado A., Torrent J., 1997. Iron-related phosphorus in over fertilized
European soils. Journal of Environmental Quality 26:1548-1554.
Sample E. C., Soper R. J., Racz G. J., 1980. Reactions of phosphate fertilizers in
soils. In: The role of phosphorus in agriculture. Eds. Khassawneh F. E., Sample E.
C., Kamprath. pp. 263-310. ASA, CSSA, SSSA, Madison, WI.
SAS Institute, 2008.SAS/STAT Users‟ Guide. Release 6.08. Ed. SAS, Cary, NC.
Schulten H.-R., Leinweber P., 2000. New insights into organic-mineral particles:
composition, properties and models of molecular structure. Biology and Fertility of
Soils 30:1-34.
Sequi P., 2005. Fondamenti di Chimica del Suolo. Patron Editore.
Singh R.P. and Agrawal M., 2007. Effects of sewage sludge amendment on heavy
metal accumulation and consequent responses of Beta vulgaris plants.
Chemosphere 67:2229-2240.
Singh V., Singh Y., Maskina M.S., Meelu O.P., 1997. The value of poultry manure
for wetland rice grown in rotation with wheat. Nutrient Cycling in Agroecosystems
47:243-250.
Smith S.R., 2009. A critical review of the bioavailability and impacts of heavy metals
in municipal solid waste composts compared to sewage sludge. Environmental
International 35:142-156.
Stamatiadis S., Werner M., Buchanan M., 1999. Field assessment of soil quality as
affected by compost and fertilizer application in a broccoli field (San Benito
County, California). Applied Soil Ecology 12:217-225.
Thompson G.T., 1998. Consumer demand for organic foods: what we know and what
we need to know. American Journal of Agriculture Economy 80:1113-1118.
Timsina J. and Connor D.J., 2001. Productivity and management of rice-wheat
cropping systems: issues and challenges. Field Crops Research 69:93-132.
Toor G. S. and Bahl G. S., 1997. Effect of solitary and integrated use mineral of
poultry manure and fertilizer phosphorus on the dynamics of P availability in
different soils. Bioresource Technology 62:25-28.

Organic amendments to improve soil quality
159
Trasar-Cepeda C., Leiròs M.C, Gil-Sotres F. 2008. Hydrolytic enzyme activities in
agricultural and forest soils. Some implications for their use as indicators of soil
quality. Soil Biology and Biochemistry 40:2146-2155.
United States Department of Agriculture Natural Resources Conservation Service
(USDA) Soil Survey Staff, 1998. Keys to Soil Taxonomy. Washington.
Yadav R.L., Yadav D.S., Singh R.M., Kumar A., 1998. Long-term effects of
inorganic fertilizer inputs on crop productivity in a rice-wheat cropping system.
Nutrient Cycling in Agroecosystems 51:193-200.
Zaccardelli M., Mori M., Teshale A.B., Di Mola I., Perrone D., Giordano I. 2006.
Dinamica dei nitrati e bilancio della fertilità chimica in un terreno agrario della
Piana del Sele ammendato con compost da F.O.R.S.U. Atti del convegno: Utilizzo
del compost da frazione organica dei rifiuti solidi urbani : attualità e prospettive.
Napoli, Citta della Scienza.
Zucconi F. 1996. Declino del suolo e stanchezza del terreno. Edizioni Spazio Verde
Padova.

Chapter 4 .
160
161
Chapter 5
Long-term effects
of organic amendments on soil organic matter
5.1 Introduction
One of the most worrying aspects of intensive agriculture is the gradual loss of soil
fertility due to organic matter (OM) decrease. The delicate balance between OM
accumulation and consumption must be retained in agricultural systems in order to
prevent soil fertility reduction.
The maintenance or even an improvement of soil fertility as well as of OM content,
can be achieved through the use of different types of composts such as those
produced by municipal organic wastes, sewage sludges, agricultural wastes, animal
manures and some industrial wastes (e.g. char and bio-char by-products produced by
energy-developing companies) (Masciandaro et al., 2000; Soumaré et al., 2003).
Compost represents an available and low cost organic amendment. It is obtained by
the degradation, at different extents, of plant biomasses deriving either from mowing
and yard trimmings or from lignocellulose-containing plant residues. These latter can
also be used as bulking and carbon sources for the stabilization of selected municipal
solid wastes and sewage sludges.
Soil amendments with composts positively affect physical, chemical and biochemical
soil quality, thereby imporving soil capacity for plant nutrition (Kowaljow and
Mazzarino, 2007;Weber et al., 2007; Hargreaves et al., 2008). In fact, as an example,
compost-amended soils reveal larger cation exchange capacity (CEC), as well as
larger nitrogen and organic carbon contents as compared to Control soils which did
not receive any treatment (Adani et al., 2006). In addition, compost amendment
increase the content of the colloidal humified OM which, in turn, affects the
quantitative and qualitative long-term status of soil OM (Adani et al., 2006, 2007;
Gonzales-Vila et al., 1999; Quedraogo et al., 2001; Leifeld et al., 2002). In fact,
Chapter 5 .
162
incorporation of compost in soils strongly modifies quality of endogenous humic
substances (Rivero et al., 2004; Adani et al., 2007) and reduces mineralization of
biolabile compounds, thereby enhancing the role of soil OM as a sink of organic
carbon (Spaccini et al., 2002; Fortuna et al., 2003; Piccolo et al., 2004).
As carbon is the most important element for living organisms, soil OM represents the
main source for CO2 in nature due to soil respiration. However, the drastic increase in
atmospheric CO2 concentration, mainly due to land use changes since industrial
revolution, has leaded to the identification of sustainable strategies for threat
offsetting of the global climate change (Lal, 2004). By considering that the carbon
accumulated in soils accounts for over two-thirds of the total carbon in forestal
ecosystems (Dixon et al., 1994) and that it is more stable than the one stored in living
plant biomasses (Vesterdal et al., 2002; Chen et al., 2005; Laganière et al., 2010), a
deeper understanding of the dynamics of soil organic carbon stocks in agricultural
fields is of paramount importance to address the modern agriculture towards
sustainable practices.
Study of dynamics and fate of soil OM necessarily passes through the comprehension
of its structure and conformation. In fact, it has been already clarified that nature of
soil OM strongly affects, for example, soil aggregate stability, fate of organic and
inorganic contaminants, and nutrient availability for plant nutrition (Stevenson,
1994). In general, the importance of examining threshold values at which organic
carbon becomes effective and asserts a positive influence on soil properties should
not be underestimated, as detrimental effects can occur if too much carbon is added to
the soil. Therefore, although carbon increase is usually helpful to improve soil
functions, more is not always better. For example, too much carbon can result in
surface crusting, increased detachment by raindrops and decreased hydraulic
conductivity (Haynes and Naidu, 1998). One reason for structural breakdown is a
high content of monovalent cations, which can occur if too much animal waste is
added.
Long-term effects of organic amendments on soil organic matter
163
Among the different techniques that can be used for structural and conformational
analyses of soil OM, the main ones are spectroscopic techniques such as UV,
fluorescence, FT-IR, and NMR spectroscopy.
FT-IR stands for Fourier Transform InfraRed, the preferred method of infrared
spectroscopy. In infrared spectroscopy, IR radiation is passed through a sample.
Some of the infrared radiations are absorbed by the sample and others pass through
(i.e. they are transmitted). The resulting spectrum represents the molecular absorption
and transmission which creates a molecular fingerprint of the sample. Like a
fingerprint, two unique molecular structures cannot produce the same infrared
spectrum. This makes infrared spectroscopy useful for several types of analysis. In
fact, FT-IR spectroscopy can be used to identify unknown materials, to determine
quality or consistency of a sample and quantify the amount of components in a
complex mixture (Grube et al., 1999). In the case of environmental analysis, FT-IR
spectroscopy has been applied to recognize quality of soil OM (Olk et al., 1999;
Mermut and Eswaran, 2001), nature of humic and fulvic acids from different sources
(Naidja et al., 2002; Filip and Bielek, 2002; Chien et al., 2003; Senesi et al., 2003),
extent of degradation of organic wastes (Reeves and Van Kessel, 2002; Reveille et
al., 2003), compost quality and compost maturity degree (Tseng et al., 1996;
Provenzano et al., 2001; Smidt et al., 2002; Grube et al., 2006).
Deeper structural and conformational information on soil OM characteristics can be
obtained by high field (HF) nuclear magnetic resonance (NMR) spectroscopy either
in the liquid or in the solid state (Martin et al., 2001; Lguirati et al., 2005; Conte, et
al., 2004). The technique is based on the interaction between a radio-frequency and
the magnetic moments of selected nuclei as far as they are subjected to a Zeeman
magnetic field. In general, liquid state NMR spectroscopy is applied on soluble OM
(dissolved OM also referred to as DOM), whereas solid state NMR spectroscopy is
mainly used when water solubilisation is impossible as in the case of highly
hydrophobic natural OM (Conte et al., 1997). The results obtained from NMR
spectrocopy either in the liquid or in the solid state are spectra from which structure
Chapter 5 .
164
and amount of soil OM constituents can be retrieved (Conte et al., 2004; Albers and
Hansen, 2010). In addition, NMR spectroscopy can be applied to recognize
interactions among pollutants and soil components (Russo et al., 2010).
Very recently, development of a new low field NMR technique has been achieved.
Namely, this technique investigates the effect of variable Zeeman magnetic fields
over the spectral densities (J()) and the strength (C) of the dipolar interactions being
modulated. The technique known as Fast Field Cycling (FFC) NMR relaxometry
allows a fast investigation of the conformational and dynamic properties of whole
complex molecular systems through measurement of longitudinal or spin-lattice
relaxation rates ( 11 1 TR ) (Kimmich and Anoardo, 2004). The latter is the lifetime of
the first order process that returns the magnetization to the Boltzman equilibrium
(Bakhtumov, 2004). The 1R magnitude depends on the nature of the nuclei, the
physical state of the system, its viscosity and temperature (Bakhtumov, 2004). Spin-
lattice relaxation occurs when the lattice creates magnetic fields fluctuating at
frequencies resembling those of the observed nuclei (e.g. protons). Fluctuating fields
are created by molecular motions which strongly affect dipolar interactions
(Bakhtumov, 2004). In particular, the faster the motions are, the less efficient is the
dipolar interaction, thereby favouring lower 1R values (Bakhtumov, 2004).
Conversely, slower molecular dynamics can be associated with faster spin-lattice
relaxation rates due to a higher intra and inter nuclear dipolar interaction efficiency
(Bakhtumov, 2004).
FFC relaxometry is based on the cycling of the Zeeman magnetic field (B0) through
three different values traditionally indicated as polarization (Bpol), relaxation (Brelax),
and acquisition (Bacq) fields (Kimmich and Anoardo, 2004; Ferrante and Sykora,
2005). Bpol is applied for a limited and fixed period of time in order to obtain
magnetization saturation and sensitivity enhancement (Kimmich and Anoardo, 2004).
Then, the magnetic field is switched to a new one, Brelax, applied for a period ()
during which the intensity of the magnetization changes (or relaxes) to reach a new
equilibrium condition. Finally, the application of the acquisition magnetic field
Long-term effects of organic amendments on soil organic matter
165
together with a 1H 90° pulse makes the magnetization observable and the free
induction decay (FID) acquirable. The proton longitudinal relaxation times are
obtained at the fixed Brelax intensity through a progressive variation of the values.
The objective of this work was to study the effect of different organic amendments on
an agricultural soil and, in particular, on its OM over time. Innovative and
conventional spectroscopic techniques were used such as low field NMR relaxometry
for the direct analysis of soil, and FT-IR and solid phase NMR for humic fraction
extracted from the same soil samples.
The present work was carried out in collaboration with Prof. Pellegrino Conte,
Dipartimento di Ingegneria e Tecnologie Agro-Forestali, Università degli Studi di
Palermo, and with Dr. Anne E. Berns, Forschungszentrum Jülich GmbH, Institute of
Bio- and Geosciences, IBG-3: Agrosphere, 52425 Jülich, Germany.
Chapter 5 .
166
5.2 Materials and Methods
5.2.1 Description of the study site and sampling
Two commercial farms (F1 and F2) were selected in the Plane of Sele river (Salerno,
Southern Italy), one of the most productive farming area (See Chapter 4, Par. 4.2.1).
The two selected farms, characterized by different geopedologic characteristics
(Table 4.2, Par. 4.3.1), provided a field under greenhouse of 160 m2 that was divided
in thirty plots, as described in Par. 4.2.2, Figure 4.1.
On February 2009, the soils of two farms were treated with organic amendments. Soil
samples were collected after one (March 2009) and twelve months (February 2010)
from treatment. In each plot, five sub-samples, were taken, following a W scheme
from the topsoil (0-20 cm), to form a sample. Samples were packed in polyethylene
bags, dried at room temperature and sieved (mesh size 2 mm).
5.2.2 Organic amendments
In this study, two different organic amendments were used. They were a compost
from municipal solid waste (GeSeNu Srl, Perugia, Italy) (Chapter 4, Par. 4.2.2., Table
4.1) and wood from scraps of poplars pruning (Experimental Regional Farm
Improsta), as descibed in Chapter 4, Paragraph 4.2.2, Figure 4.1.
Compost and wood were mixed in different two ratios: A1 amendment with
compost:wood 10:1 and a C/N ratio of 15, and A2 amendment with compost:wood
2:1 and a C/N ratio of 25. The two amendments (A1 and A2) were supplied in two
doses: 30 and 60 tons ha-1
, named L and H, respectively. Also 200 kg ha-1
of mineral
fertilizer with N-P-K (14-7-17) and microelements (m), were added. Minelar
fertilizers were applied at the start of every crop cycles. Each treatment was studied
in triplicate (three plots), as shown in Figure 4.1, Paragraph 4.2.2.
Furthermore, in the experimental field Control plots (Control and Control m) were
designed without organic amendments and mineral fertilizer to compare the effect of
the treatments.

Long-term effects of organic amendments on soil organic matter
167
5.2.3 Extraction of organic matter
OM was extracted from all samples collected after one month and after one year from
amendment (March 2009 and February 2010). Soil (150 g) was shaked for 24 h with
750 ml of 1 M NaOH - 0.1 M Na4P2O7 (1:1 v/v) solution under N2 atmosphere. After
shaking, samples were centrifuged at 7000 rpm for 20 minutes. The supernatants
were filtered on a quartz filter (Whatman GF/C), and acidified to pH 1 with
concentrated HCl. The solution was centrifuged at 7000 rpm for 20 minutes, the
precipitated (humic acid, HA) was separated by supernatant (fulvic acids, FA + non-
humified fractions, NH). The pellet, formed by HA, was purified by a 48 h shaking
with 0.1 M HCl/0.3 M HF solution (1:50 w/v). The solution was centrifuged at 7000
rpm for 20 minutes and the final residue was resuspend in deionized water, dialyzed
against deionized water, frezeed and lyophilized.
The supernatans, formed by FA + NH, were pour in on small columns packed with
Superlite DAX 8 resine (Supelco, USA) previously washed with 0.5 M NaOH and
distilled water and then equilibrated with 0.1 M HCl.
The non-retained materials (non-humified fractions, NH) were discarded. The
fractions retained on the column (fulvic acids, FAs) were eluted with 0.5 M NaOH
and collected in a beaker, and then acidified to pH 1 with concentrated HCl. The
fulvic acids were dialyzed against deionized water, frezeed and lyophilized.
5.2.4 Elemental analyses
The elemental composition (C, H, N, O) of HAs and FAs, of the samples after one
year from amendment, was determined by the ash combustion procedure with a
Fisons 1108 Elemental Analyzer. Calibration of the Fisons instrument with
appropriate standard (acetanilide) was carried out. Accuracy (<0.05%) and recovery
of C and N (for both instrument detection limit 10 mg kg-1
) were checked, analyzing
a sample of the standard material after each set of eight sample analyses. The
percentage of C, H and N were obtained directly from analysis, whereas O was
Chapter 5 .
168
calculated by difference, i.e. O % = 100 - C % - H % - N %, and therefore it can
include trace fractions of S or P.
5.2.5 FT-IR analyses
Diffuse reflectance infrared Fourier transform spectroscopy (DRIFT) spectra of HA,
of the samples collected in the second sampling (February 2010), were recorded with
a Perkin Elmer Spectrum-One spectrometer, equipped with a diffuse reflectance
accessory, and by accumulating up to 100 scans with a resolution of 4 cm-1
. Before
DRIFT analysis, dry samples were finely ground in an agate mortar while diluting
with oven-dried KBr powder (5/100, w/w).
5.2.6 Fast Field Cycling (FFC) NMR relaxometry
A Stelar Spinmaster-FFC-2000 field-cycling relaxometer (Stelar s.r.l., Mede, PV -
Italy) was used to run relaxometry experiments directly on soil samples collected in
the first sampling (March 2009). The solid state HA samples were studied at the
constant probe temperature of 298 K. The experimental relaxometry setting consisted
of a polarization field with a flux density of 580 mT corresponding to a proton
Larmor frequency (ωL) of 25 MHz applied for a period of time (Tpol) of 0.1 s; a
relaxation field with a flux density of 500 mT (ωL = 20 MHz) chosen inside the
highest sensitivity instrumental region and applied for a period arrayed with 64
values varying from 1 to 800 ms. array was chosen in a geometrical progression in
order to cover the entire relaxation curve of interest. Finally, a 380 mT (ωL = 16.2
MHz) acquisition field with a 1H 90° pulse of 7 s in order to obtain observable
magnetization and reveal free induction decay (FID) with a time domain of 100 s
sampled with 512 points. 64 scans were accumulated. Acquisition of relaxation
curves was achieved with the AcquNMR V95® software provided by Stelar. The
experimental data were processed with UPEN algorithm (Alma Mater Studorium,
Università di Bologna), which gives the distributions of T1 values (Borgia et al.,
1998, 2000). The T1 distribution curves (also indicated as relaxograms or T1-D
Long-term effects of organic amendments on soil organic matter
169
curves) were exported to OriginPro 7.5 SR6 (Version 7.5885, OriginLab Corporation,
Northampton, MA, USA) in order to perform deconvolution with Gaussian functions
and to recover the different components giving rise to the longitudinal relaxation time
distributions. The number of Gaussian functions that were used for the deconvolution
without unreasonably increasing the number of parameters were determined by
means of the Merit function analysis (Halle et al., 1998).
5.2.7 CPMAS 13
C NMR spectroscopy
Cross polarization magic angle spinning (CPMAS) 13
C NMR experiments were done
on HA of two sampling by a 14.1 T Varian NMR System (Varian Inc., Palo Alto CA,
USA) with a 6 mm T3 NB HX probe head. The samples were spun at 7500 ± 1 Hz.
All free induction decays (FID) were recorded with a recycle delay of 6 s, an
acquisition time of 20 ms and a sweep width of 50 kHz. Cross-polarization was
performed with a contact time of 1 ms and a 13
C r.f. field set at 39 kHz, while the 1H
r.f. field was ramped from 40 to 45.5 kHz. Decoupling was done using a SPINAL
sequence with a 1H r.f. field of 35.5 kHz, a pulse width of 9 µs and a phase of 9.98.
All the experiments were done with the classical TOSS (Total Suppression of
Spinning Side Bands) sequence. The FIDs were acquired with VNMRJ version 2.2C
software (Varian Inc., Palo Alto CA, USA) and elaborated with MestReNova 6.1.1
software (Mestrelab Research, Santiago de Compostela, Spain).
Chapter 5 .
170
5.3 Results and Discussion
5.3.1 Yields and elemental content of organic fractions in amended soils
Organic fractions were extracted from the soils sampled at the end of the
experimental session, one year after the organic amendment. HA and FA yields of
extraction from soils F1 and F2 soils are reported in Table 5.1.
An increase of both organic fractions was observed as a consequence of the
amendment. In particular, the increase extent after one year from the starting of the
experiment appeared to be farm-specific, very likely because of the geopedologic
differences between the two soils.
The amount of HAs extracted from F1 soils, under organic amendments, increased
also until two fold, compared to Control soil (Table 5.1), suggesting a progressive
incorporation of organic compounds in HA with increasing stabilization of compost
over time. The elemental analysis of HAs extracted by differently treated soils
showed higher C contents than those from Control soils (Table 5.2).
The amount of extracted FAs was not affected by organic amendments, as the values
remained unchanged or only slightly reduced (Table 5.1) similarly to the trend of the
C content determined by elemental analysis (Table 5.3). The organic amendment
supplied new OM rich in labile carbon fractions (promptly used by soil biomass)
humified matter and wood scrapes which contribute either straightaway or over the
time by degradation processes to increase soil humic fractions (Kiem and Kandeler,
1997; Liu et al., 2010).
In the F2 soils, the amount of extracted HAs was larger in the amended soils than in
the F1 ones (Table 5.1). Moreover, C content in F2 soils also resulted larger than in
F1 soils (Table 5.2). Also FAs content increased upon organic amendments, although
their C content showed an opposite trend (Table 5.3) . The F2 soil was a calcaric
sandy loam soil and its sand nature determined aired conditions that favoured the
biomass activity and OM oxidative processes, thereby leading to faster OM
degradation, as confirmed by the reduction of organic carbon in these soils (see
Chapter 4, Figure 4.7). In these environmental conditions the higher FAs content
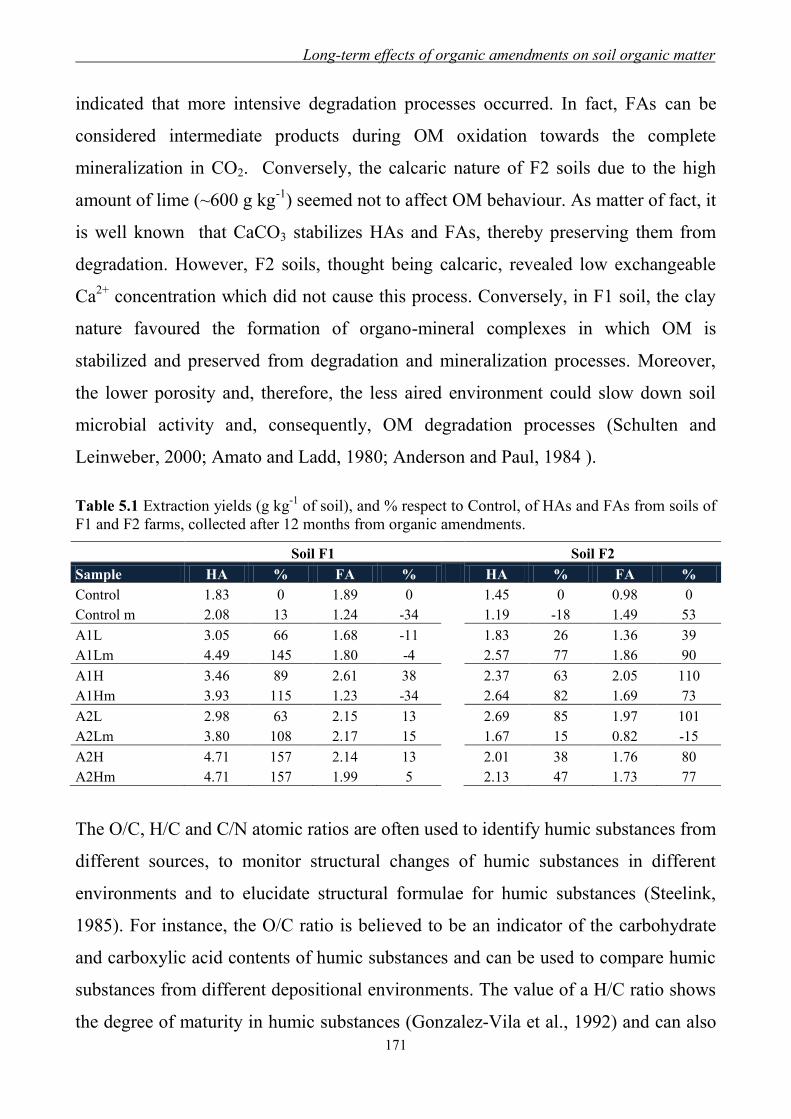
Long-term effects of organic amendments on soil organic matter
171
indicated that more intensive degradation processes occurred. In fact, FAs can be
considered intermediate products during OM oxidation towards the complete
mineralization in CO2. Conversely, the calcaric nature of F2 soils due to the high
amount of lime (~600 g kg-1
) seemed not to affect OM behaviour. As matter of fact, it
is well known that CaCO3 stabilizes HAs and FAs, thereby preserving them from
degradation. However, F2 soils, thought being calcaric, revealed low exchangeable
Ca2+
concentration which did not cause this process. Conversely, in F1 soil, the clay
nature favoured the formation of organo-mineral complexes in which OM is
stabilized and preserved from degradation and mineralization processes. Moreover,
the lower porosity and, therefore, the less aired environment could slow down soil
microbial activity and, consequently, OM degradation processes (Schulten and
Leinweber, 2000; Amato and Ladd, 1980; Anderson and Paul, 1984 ).
Table 5.1 Extraction yields (g kg-1
of soil), and % respect to Control, of HAs and FAs from soils of
F1 and F2 farms, collected after 12 months from organic amendments.
Soil F1 Soil F2
Sample HA % FA % HA % FA %
Control 1.83 0 1.89 0 1.45 0 0.98 0
Control m 2.08 13 1.24 -34 1.19 -18 1.49 53
A1L 3.05 66 1.68 -11 1.83 26 1.36 39
A1Lm 4.49 145 1.80 -4 2.57 77 1.86 90
A1H 3.46 89 2.61 38 2.37 63 2.05 110
A1Hm 3.93 115 1.23 -34 2.64 82 1.69 73
A2L 2.98 63 2.15 13 2.69 85 1.97 101
A2Lm 3.80 108 2.17 15 1.67 15 0.82 -15
A2H 4.71 157 2.14 13 2.01 38 1.76 80
A2Hm 4.71 157 1.99 5 2.13 47 1.73 77
The O/C, H/C and C/N atomic ratios are often used to identify humic substances from
different sources, to monitor structural changes of humic substances in different
environments and to elucidate structural formulae for humic substances (Steelink,
1985). For instance, the O/C ratio is believed to be an indicator of the carbohydrate
and carboxylic acid contents of humic substances and can be used to compare humic
substances from different depositional environments. The value of a H/C ratio shows
the degree of maturity in humic substances (Gonzalez-Vila et al., 1992) and can also
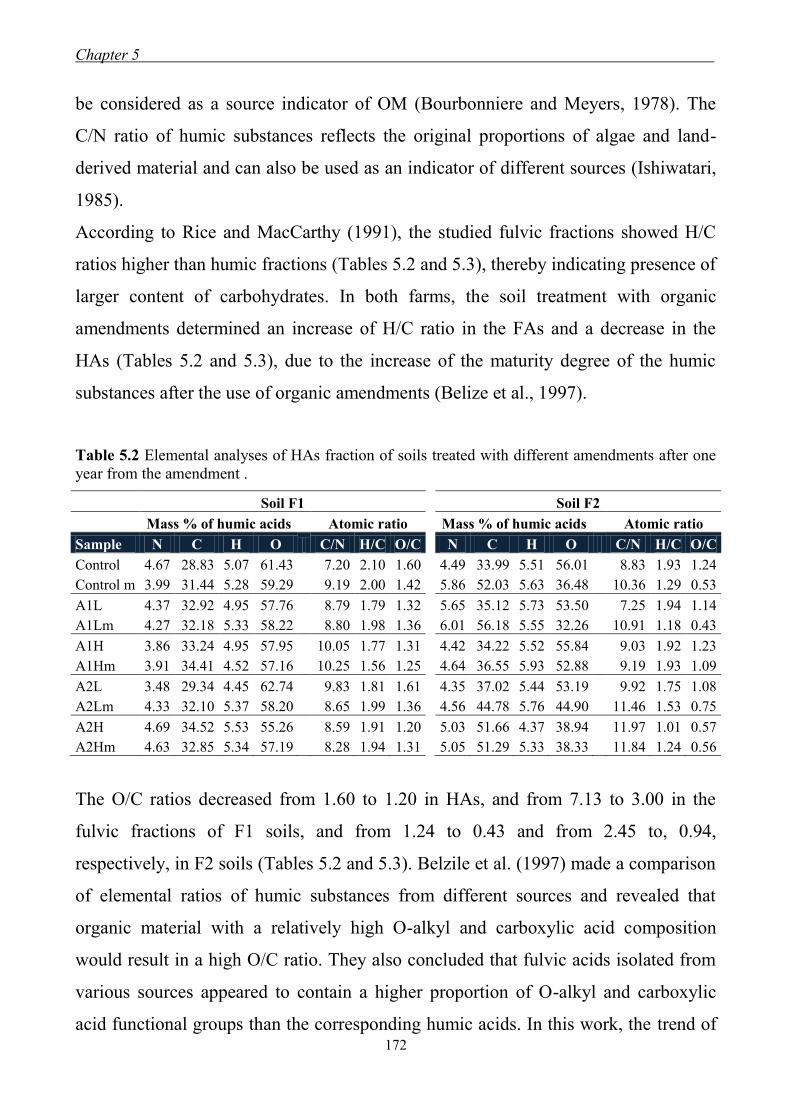
Chapter 5 .
172
be considered as a source indicator of OM (Bourbonniere and Meyers, 1978). The
C/N ratio of humic substances reflects the original proportions of algae and land-
derived material and can also be used as an indicator of different sources (Ishiwatari,
1985).
According to Rice and MacCarthy (1991), the studied fulvic fractions showed H/C
ratios higher than humic fractions (Tables 5.2 and 5.3), thereby indicating presence of
larger content of carbohydrates. In both farms, the soil treatment with organic
amendments determined an increase of H/C ratio in the FAs and a decrease in the
HAs (Tables 5.2 and 5.3), due to the increase of the maturity degree of the humic
substances after the use of organic amendments (Belize et al., 1997).
Table 5.2 Elemental analyses of HAs fraction of soils treated with different amendments after one
year from the amendment .
Soil F1 Soil F2
Mass % of humic acids Atomic ratio Mass % of humic acids Atomic ratio
Sample N C H O C/N H/C O/C N C H O C/N H/C O/C
Control 4.67 28.83 5.07 61.43 7.20 2.10 1.60 4.49 33.99 5.51 56.01 8.83 1.93 1.24
Control m 3.99 31.44 5.28 59.29 9.19 2.00 1.42 5.86 52.03 5.63 36.48 10.36 1.29 0.53
A1L 4.37 32.92 4.95 57.76 8.79 1.79 1.32 5.65 35.12 5.73 53.50 7.25 1.94 1.14
A1Lm 4.27 32.18 5.33 58.22 8.80 1.98 1.36 6.01 56.18 5.55 32.26 10.91 1.18 0.43
A1H 3.86 33.24 4.95 57.95 10.05 1.77 1.31 4.42 34.22 5.52 55.84 9.03 1.92 1.23
A1Hm 3.91 34.41 4.52 57.16 10.25 1.56 1.25 4.64 36.55 5.93 52.88 9.19 1.93 1.09
A2L 3.48 29.34 4.45 62.74 9.83 1.81 1.61 4.35 37.02 5.44 53.19 9.92 1.75 1.08
A2Lm 4.33 32.10 5.37 58.20 8.65 1.99 1.36 4.56 44.78 5.76 44.90 11.46 1.53 0.75
A2H 4.69 34.52 5.53 55.26 8.59 1.91 1.20 5.03 51.66 4.37 38.94 11.97 1.01 0.57
A2Hm 4.63 32.85 5.34 57.19 8.28 1.94 1.31 5.05 51.29 5.33 38.33 11.84 1.24 0.56
The O/C ratios decreased from 1.60 to 1.20 in HAs, and from 7.13 to 3.00 in the
fulvic fractions of F1 soils, and from 1.24 to 0.43 and from 2.45 to, 0.94,
respectively, in F2 soils (Tables 5.2 and 5.3). Belzile et al. (1997) made a comparison
of elemental ratios of humic substances from different sources and revealed that
organic material with a relatively high O-alkyl and carboxylic acid composition
would result in a high O/C ratio. They also concluded that fulvic acids isolated from
various sources appeared to contain a higher proportion of O-alkyl and carboxylic
acid functional groups than the corresponding humic acids. In this work, the trend of
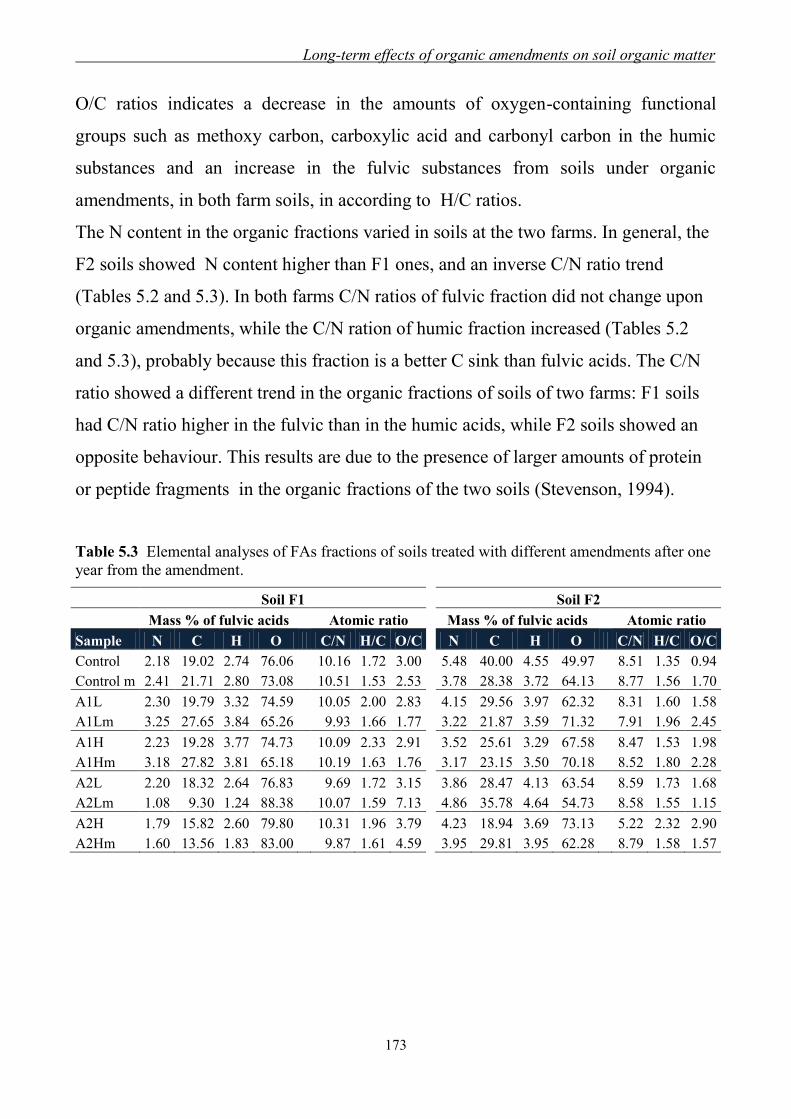
Long-term effects of organic amendments on soil organic matter
173
O/C ratios indicates a decrease in the amounts of oxygen-containing functional
groups such as methoxy carbon, carboxylic acid and carbonyl carbon in the humic
substances and an increase in the fulvic substances from soils under organic
amendments, in both farm soils, in according to H/C ratios.
The N content in the organic fractions varied in soils at the two farms. In general, the
F2 soils showed N content higher than F1 ones, and an inverse C/N ratio trend
(Tables 5.2 and 5.3). In both farms C/N ratios of fulvic fraction did not change upon
organic amendments, while the C/N ration of humic fraction increased (Tables 5.2
and 5.3), probably because this fraction is a better C sink than fulvic acids. The C/N
ratio showed a different trend in the organic fractions of soils of two farms: F1 soils
had C/N ratio higher in the fulvic than in the humic acids, while F2 soils showed an
opposite behaviour. This results are due to the presence of larger amounts of protein
or peptide fragments in the organic fractions of the two soils (Stevenson, 1994).
Table 5.3 Elemental analyses of FAs fractions of soils treated with different amendments after one
year from the amendment.
Soil F1 Soil F2
Mass % of fulvic acids Atomic ratio Mass % of fulvic acids Atomic ratio
Sample N C H O C/N H/C O/C N C H O C/N H/C O/C
Control 2.18 19.02 2.74 76.06 10.16 1.72 3.00 5.48 40.00 4.55 49.97 8.51 1.35 0.94
Control m 2.41 21.71 2.80 73.08 10.51 1.53 2.53 3.78 28.38 3.72 64.13 8.77 1.56 1.70
A1L 2.30 19.79 3.32 74.59 10.05 2.00 2.83 4.15 29.56 3.97 62.32 8.31 1.60 1.58
A1Lm 3.25 27.65 3.84 65.26 9.93 1.66 1.77 3.22 21.87 3.59 71.32 7.91 1.96 2.45
A1H 2.23 19.28 3.77 74.73 10.09 2.33 2.91 3.52 25.61 3.29 67.58 8.47 1.53 1.98
A1Hm 3.18 27.82 3.81 65.18 10.19 1.63 1.76 3.17 23.15 3.50 70.18 8.52 1.80 2.28
A2L 2.20 18.32 2.64 76.83 9.69 1.72 3.15 3.86 28.47 4.13 63.54 8.59 1.73 1.68
A2Lm 1.08 9.30 1.24 88.38 10.07 1.59 7.13 4.86 35.78 4.64 54.73 8.58 1.55 1.15
A2H 1.79 15.82 2.60 79.80 10.31 1.96 3.79 4.23 18.94 3.69 73.13 5.22 2.32 2.90
A2Hm 1.60 13.56 1.83 83.00 9.87 1.61 4.59 3.95 29.81 3.95 62.28 8.79 1.58 1.57
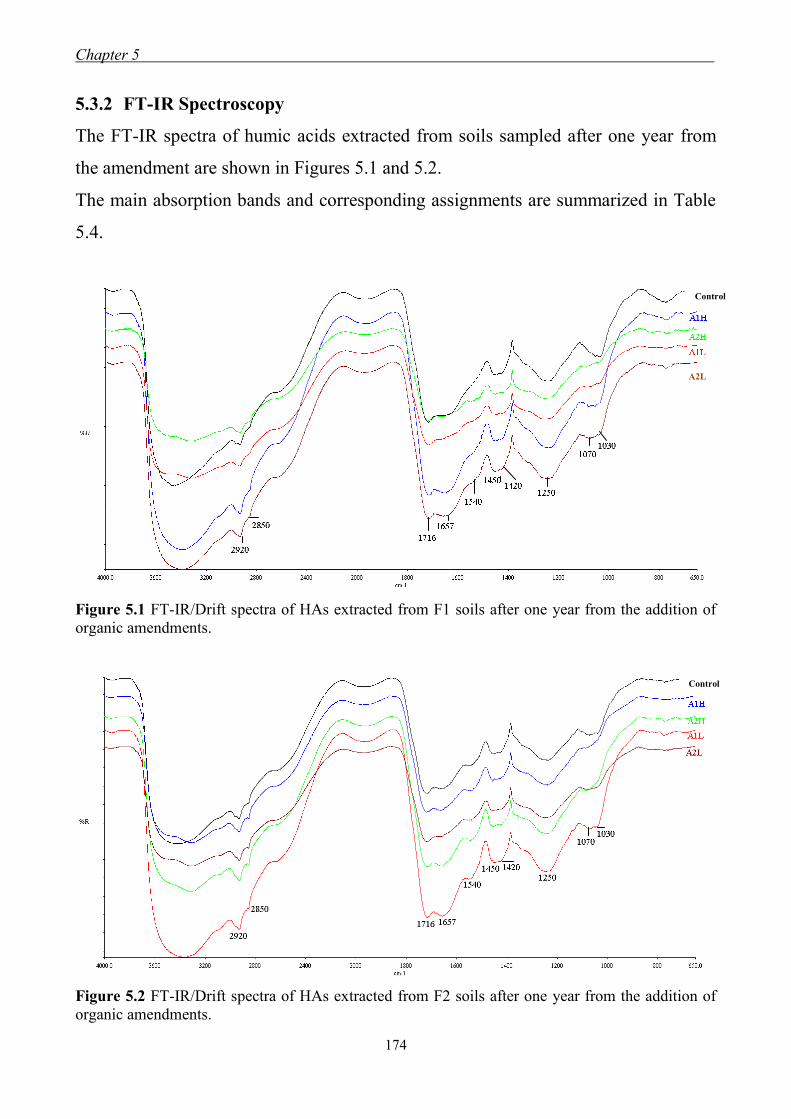
Chapter 5 .
174
5.3.2 FT-IR Spectroscopy
The FT-IR spectra of humic acids extracted from soils sampled after one year from
the amendment are shown in Figures 5.1 and 5.2.
The main absorption bands and corresponding assignments are summarized in Table
5.4.
Figure 5.1 FT-IR/Drift spectra of HAs extracted from F1 soils after one year from the addition of
organic amendments.
Figure 5.2 FT-IR/Drift spectra of HAs extracted from F2 soils after one year from the addition of
organic amendments.
A2L
Control
Control
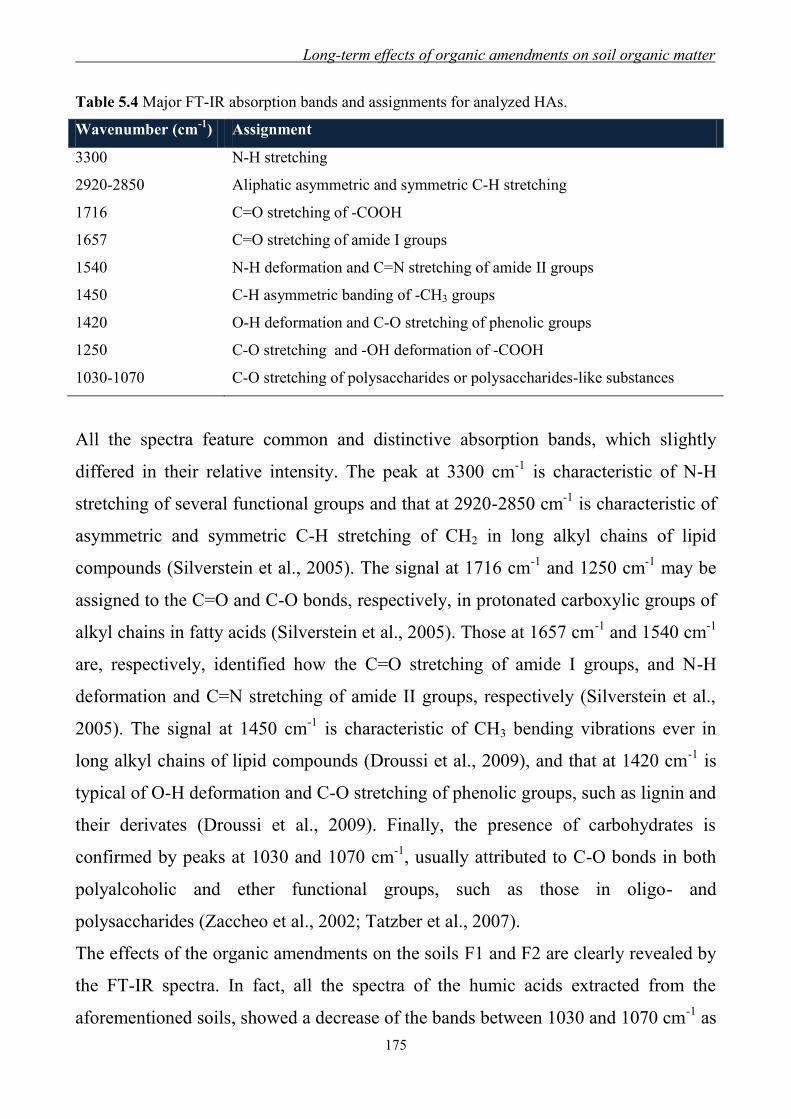
Long-term effects of organic amendments on soil organic matter
175
Table 5.4 Major FT-IR absorption bands and assignments for analyzed HAs.
Wavenumber (cm-1
) Assignment
3300 N-H stretching
2920-2850 Aliphatic asymmetric and symmetric C-H stretching
1716 C=O stretching of -COOH
1657 C=O stretching of amide I groups
1540 N-H deformation and C=N stretching of amide II groups
1450 C-H asymmetric banding of -CH3 groups
1420 O-H deformation and C-O stretching of phenolic groups
1250 C-O stretching and -OH deformation of -COOH
1030-1070 C-O stretching of polysaccharides or polysaccharides-like substances
All the spectra feature common and distinctive absorption bands, which slightly
differed in their relative intensity. The peak at 3300 cm-1
is characteristic of N-H
stretching of several functional groups and that at 2920-2850 cm-1
is characteristic of
asymmetric and symmetric C-H stretching of CH2 in long alkyl chains of lipid
compounds (Silverstein et al., 2005). The signal at 1716 cm-1
and 1250 cm-1
may be
assigned to the C=O and C-O bonds, respectively, in protonated carboxylic groups of
alkyl chains in fatty acids (Silverstein et al., 2005). Those at 1657 cm-1
and 1540 cm-1
are, respectively, identified how the C=O stretching of amide I groups, and N-H
deformation and C=N stretching of amide II groups, respectively (Silverstein et al.,
2005). The signal at 1450 cm-1
is characteristic of CH3 bending vibrations ever in
long alkyl chains of lipid compounds (Droussi et al., 2009), and that at 1420 cm-1
is
typical of O-H deformation and C-O stretching of phenolic groups, such as lignin and
their derivates (Droussi et al., 2009). Finally, the presence of carbohydrates is
confirmed by peaks at 1030 and 1070 cm-1
, usually attributed to C-O bonds in both
polyalcoholic and ether functional groups, such as those in oligo- and
polysaccharides (Zaccheo et al., 2002; Tatzber et al., 2007).
The effects of the organic amendments on the soils F1 and F2 are clearly revealed by
the FT-IR spectra. In fact, all the spectra of the humic acids extracted from the
aforementioned soils, showed a decrease of the bands between 1030 and 1070 cm-1
as

Chapter 5 .
176
compared to the untreated soils. These bands are typical for carbohydrates, and the
intensity diminution is in line with the H/C ratio decrease (Table 5.2). Clearly,
supply of organic amendment favored microbial activity, thereby leading to an
increase of the consumption of the polysaccharidic OM fraction. In addition, the
spectra of the humic acids extracted from the untreated F1 farm soils (Figure 5.1)
revealed lower signal intensity at 1540-47 cm-1
and 1507 cm-1
, typical regions for
stretching of C-N amide II groups and C=C in aromatic systems. These signals were
more intense in A2Lm and A2Hm than in the other soils since the addition of wood-
rich amendment mixture (A2) supplied greater amount of lignin-derived compounds
rich in aromatic groups. Presence of wooden residues together with mineral fertilizer
produced a stronger degradative attack by microorganism, because of the nutrient
provided by the mineral fertilizers (Juan et al., 2008).
As compared to the HAs from F1 soils, the FT-IR spectra of the humic acids
extracted from F2 soils (Figure 5.2) showed stronger signals around 1540-47 cm-1
and 1507 cm-1
to indicate higher amounts of nitrogen organic compounds, such as
proteins and peptide fragments. These results are also confirmed by higher N content
of HAs of F2 soils (Tables 5.2 and 5.3). The use of organic amendments stimulated
biomass growth, but when substrates of their metabolic activity (more labile OM)
decreased and microenvironment conditions are no more suitable, microorganisms
came at an end of their life cycle, leaving in soil cells debris and their molecular
components represented a reservoir/source of organic C as well as N (Bengtsson et
al., 2003; Iyyemperumal et al., 2007).

Long-term effects of organic amendments on soil organic matter
177
5.3.3 13C CPMAS-NMR Spectroscopy
Figure 5.3 reports the solid state 13
C CPMAS-NMR spectra of some HAs extracted
from F1 soils, after one month from amendment.
Figure 5.3 Solid state 13
C CPMAS-NMR spectra of some HAs extracted from F1 soils.
According to literature (Knicker and Lüdemann, 1995; Dignac et al., 2002; Lima et
al., 2009; Conte et al. 2010) seven different regions were assigned to the spectra
(Table 5.5). The first region, in the interval 0-45 ppm, can be assigned to aliphatic
compounds. In this region, the most important signals of humic substances extracted
from studied soils were at 20 ppm, assigned to methyl groups which terminate alkyl
chains, 24 and 30 ppm that could be attributed to linear methylene chains belonging
to lipids and cutin-like structures (Conte et al., 2010). The second spectral region,
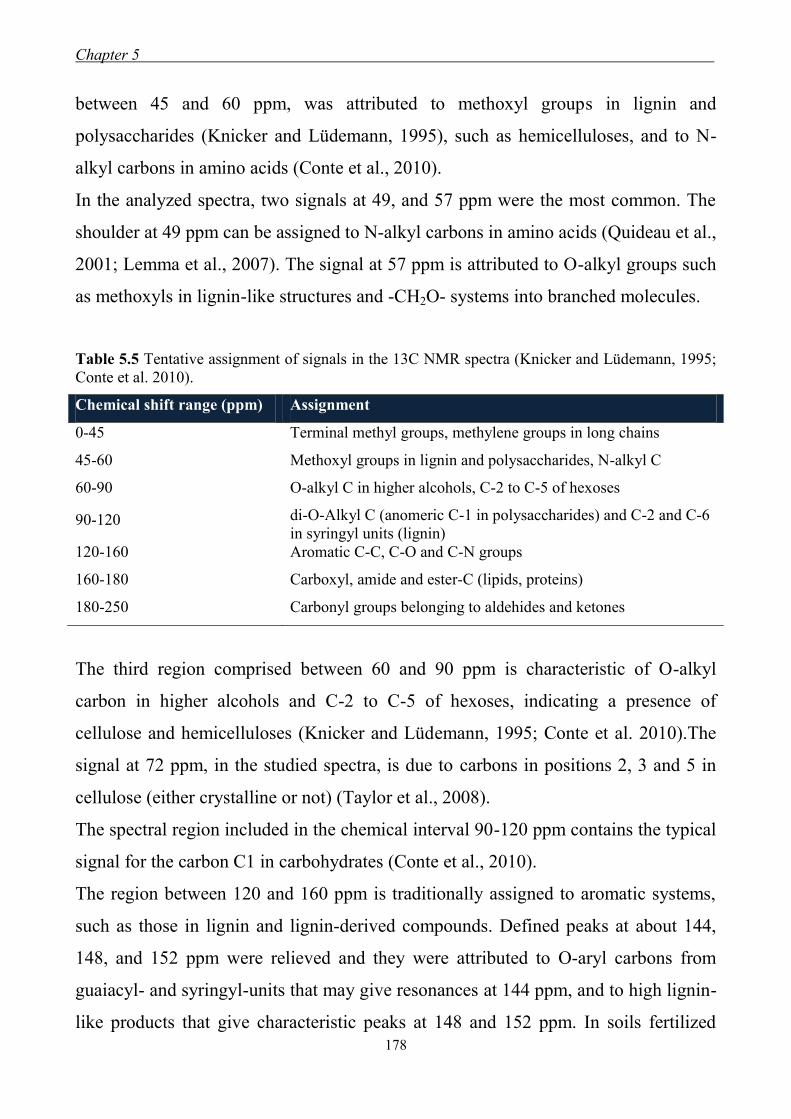
Chapter 5 .
178
between 45 and 60 ppm, was attributed to methoxyl groups in lignin and
polysaccharides (Knicker and Lüdemann, 1995), such as hemicelluloses, and to N-
alkyl carbons in amino acids (Conte et al., 2010).
In the analyzed spectra, two signals at 49, and 57 ppm were the most common. The
shoulder at 49 ppm can be assigned to N-alkyl carbons in amino acids (Quideau et al.,
2001; Lemma et al., 2007). The signal at 57 ppm is attributed to O-alkyl groups such
as methoxyls in lignin-like structures and -CH2O- systems into branched molecules.
Table 5.5 Tentative assignment of signals in the 13C NMR spectra (Knicker and Lüdemann, 1995;
Conte et al. 2010).
Chemical shift range (ppm) Assignment
0-45 Terminal methyl groups, methylene groups in long chains
45-60 Methoxyl groups in lignin and polysaccharides, N-alkyl C
60-90 O-alkyl C in higher alcohols, C-2 to C-5 of hexoses
90-120 di-O-Alkyl C (anomeric C-1 in polysaccharides) and C-2 and C-6
in syringyl units (lignin)
120-160 Aromatic C-C, C-O and C-N groups
160-180 Carboxyl, amide and ester-C (lipids, proteins)
180-250 Carbonyl groups belonging to aldehides and ketones
The third region comprised between 60 and 90 ppm is characteristic of O-alkyl
carbon in higher alcohols and C-2 to C-5 of hexoses, indicating a presence of
cellulose and hemicelluloses (Knicker and Lüdemann, 1995; Conte et al. 2010).The
signal at 72 ppm, in the studied spectra, is due to carbons in positions 2, 3 and 5 in
cellulose (either crystalline or not) (Taylor et al., 2008).
The spectral region included in the chemical interval 90-120 ppm contains the typical
signal for the carbon C1 in carbohydrates (Conte et al., 2010).
The region between 120 and 160 ppm is traditionally assigned to aromatic systems,
such as those in lignin and lignin-derived compounds. Defined peaks at about 144,
148, and 152 ppm were relieved and they were attributed to O-aryl carbons from
guaiacyl- and syringyl-units that may give resonances at 144 ppm, and to high lignin-
like products that give characteristic peaks at 148 and 152 ppm. In soils fertilized
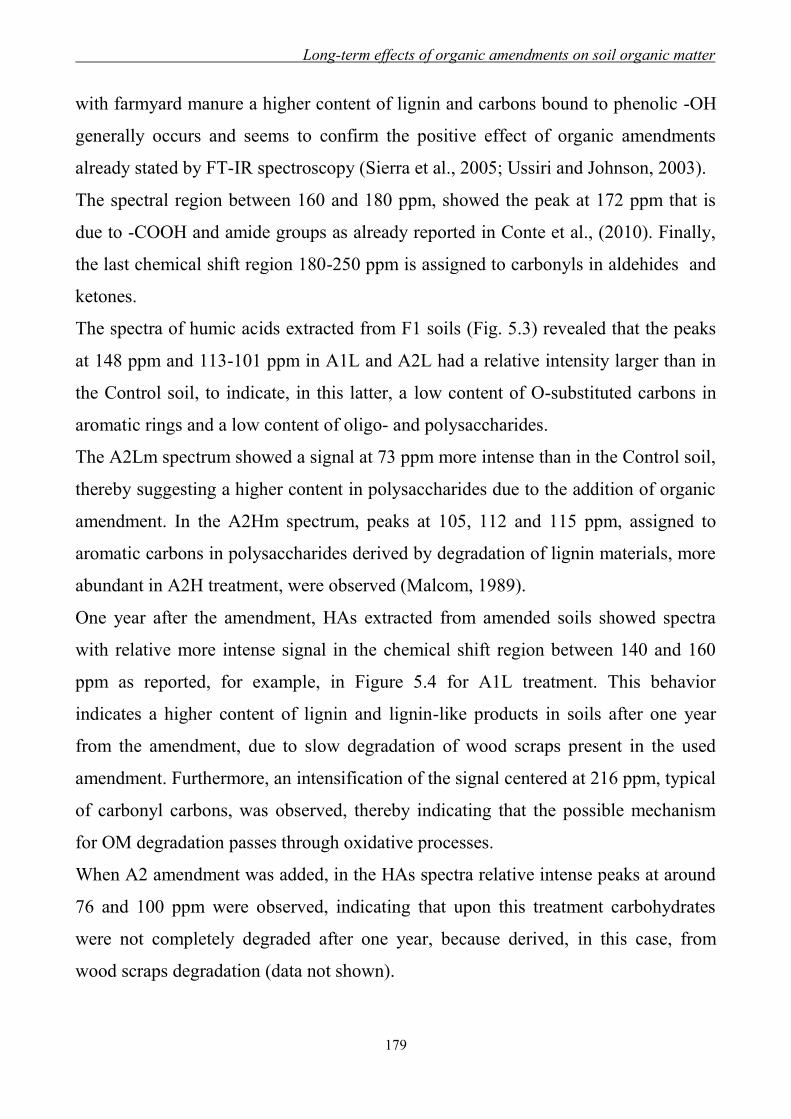
Long-term effects of organic amendments on soil organic matter
179
with farmyard manure a higher content of lignin and carbons bound to phenolic -OH
generally occurs and seems to confirm the positive effect of organic amendments
already stated by FT-IR spectroscopy (Sierra et al., 2005; Ussiri and Johnson, 2003).
The spectral region between 160 and 180 ppm, showed the peak at 172 ppm that is
due to -COOH and amide groups as already reported in Conte et al., (2010). Finally,
the last chemical shift region 180-250 ppm is assigned to carbonyls in aldehides and
ketones.
The spectra of humic acids extracted from F1 soils (Fig. 5.3) revealed that the peaks
at 148 ppm and 113-101 ppm in A1L and A2L had a relative intensity larger than in
the Control soil, to indicate, in this latter, a low content of O-substituted carbons in
aromatic rings and a low content of oligo- and polysaccharides.
The A2Lm spectrum showed a signal at 73 ppm more intense than in the Control soil,
thereby suggesting a higher content in polysaccharides due to the addition of organic
amendment. In the A2Hm spectrum, peaks at 105, 112 and 115 ppm, assigned to
aromatic carbons in polysaccharides derived by degradation of lignin materials, more
abundant in A2H treatment, were observed (Malcom, 1989).
One year after the amendment, HAs extracted from amended soils showed spectra
with relative more intense signal in the chemical shift region between 140 and 160
ppm as reported, for example, in Figure 5.4 for A1L treatment. This behavior
indicates a higher content of lignin and lignin-like products in soils after one year
from the amendment, due to slow degradation of wood scraps present in the used
amendment. Furthermore, an intensification of the signal centered at 216 ppm, typical
of carbonyl carbons, was observed, thereby indicating that the possible mechanism
for OM degradation passes through oxidative processes.
When A2 amendment was added, in the HAs spectra relative intense peaks at around
76 and 100 ppm were observed, indicating that upon this treatment carbohydrates
were not completely degraded after one year, because derived, in this case, from
wood scraps degradation (data not shown).
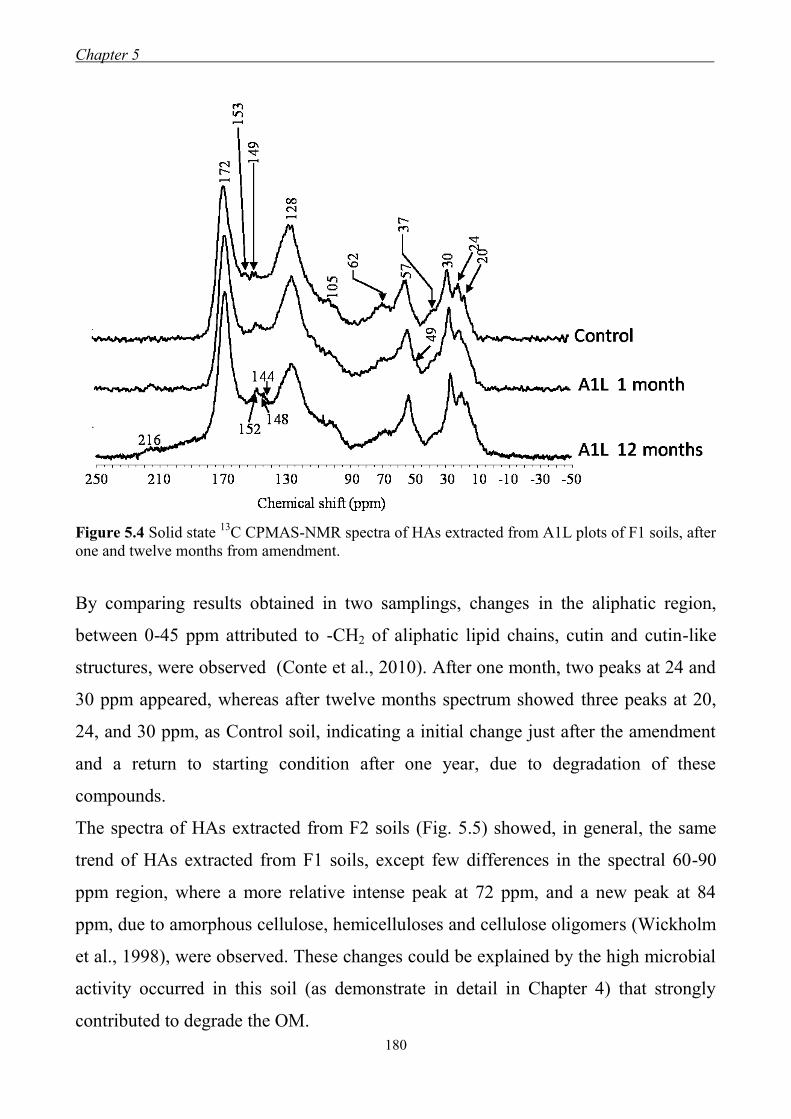
Chapter 5 .
180
Figure 5.4 Solid state 13
C CPMAS-NMR spectra of HAs extracted from A1L plots of F1 soils, after
one and twelve months from amendment.
By comparing results obtained in two samplings, changes in the aliphatic region,
between 0-45 ppm attributed to -CH2 of aliphatic lipid chains, cutin and cutin-like
structures, were observed (Conte et al., 2010). After one month, two peaks at 24 and
30 ppm appeared, whereas after twelve months spectrum showed three peaks at 20,
24, and 30 ppm, as Control soil, indicating a initial change just after the amendment
and a return to starting condition after one year, due to degradation of these
compounds.
The spectra of HAs extracted from F2 soils (Fig. 5.5) showed, in general, the same
trend of HAs extracted from F1 soils, except few differences in the spectral 60-90
ppm region, where a more relative intense peak at 72 ppm, and a new peak at 84
ppm, due to amorphous cellulose, hemicelluloses and cellulose oligomers (Wickholm
et al., 1998), were observed. These changes could be explained by the high microbial
activity occurred in this soil (as demonstrate in detail in Chapter 4) that strongly
contributed to degrade the OM.
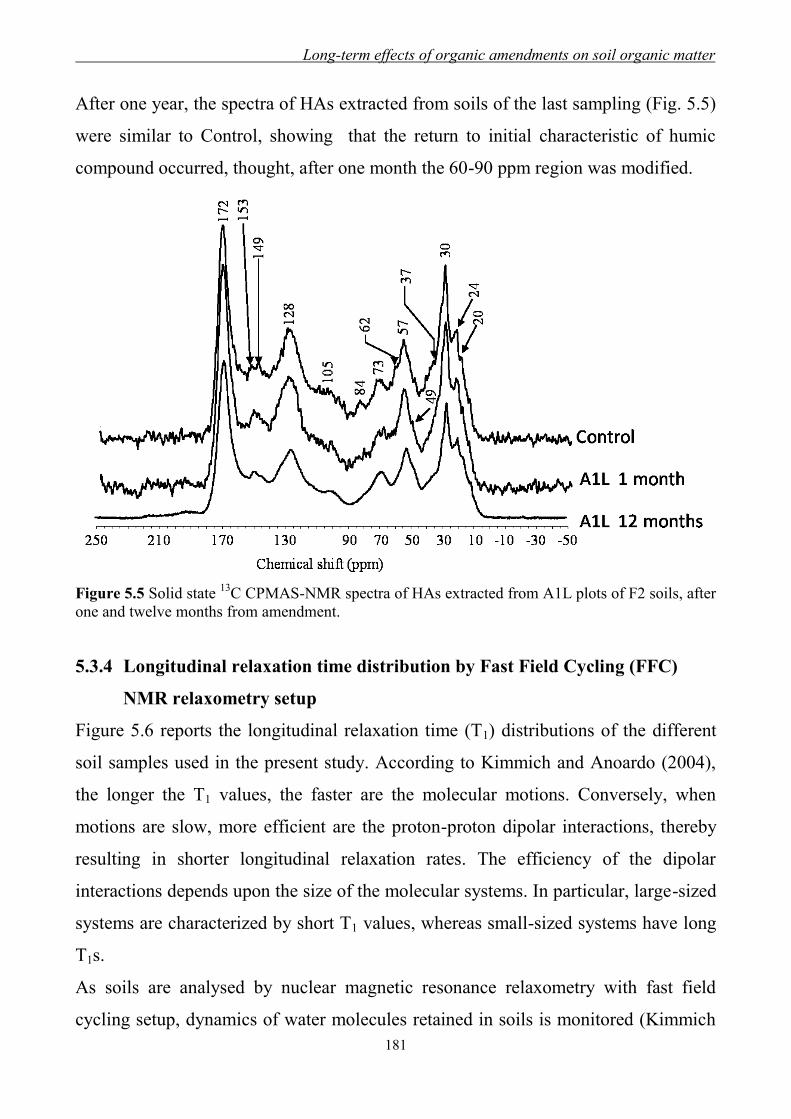
Long-term effects of organic amendments on soil organic matter
181
After one year, the spectra of HAs extracted from soils of the last sampling (Fig. 5.5)
were similar to Control, showing that the return to initial characteristic of humic
compound occurred, thought, after one month the 60-90 ppm region was modified.
Figure 5.5 Solid state 13
C CPMAS-NMR spectra of HAs extracted from A1L plots of F2 soils, after
one and twelve months from amendment.
5.3.4 Longitudinal relaxation time distribution by Fast Field Cycling (FFC)
NMR relaxometry setup
Figure 5.6 reports the longitudinal relaxation time (T1) distributions of the different
soil samples used in the present study. According to Kimmich and Anoardo (2004),
the longer the T1 values, the faster are the molecular motions. Conversely, when
motions are slow, more efficient are the proton-proton dipolar interactions, thereby
resulting in shorter longitudinal relaxation rates. The efficiency of the dipolar
interactions depends upon the size of the molecular systems. In particular, large-sized
systems are characterized by short T1 values, whereas small-sized systems have long
T1s.
As soils are analysed by nuclear magnetic resonance relaxometry with fast field
cycling setup, dynamics of water molecules retained in soils is monitored (Kimmich
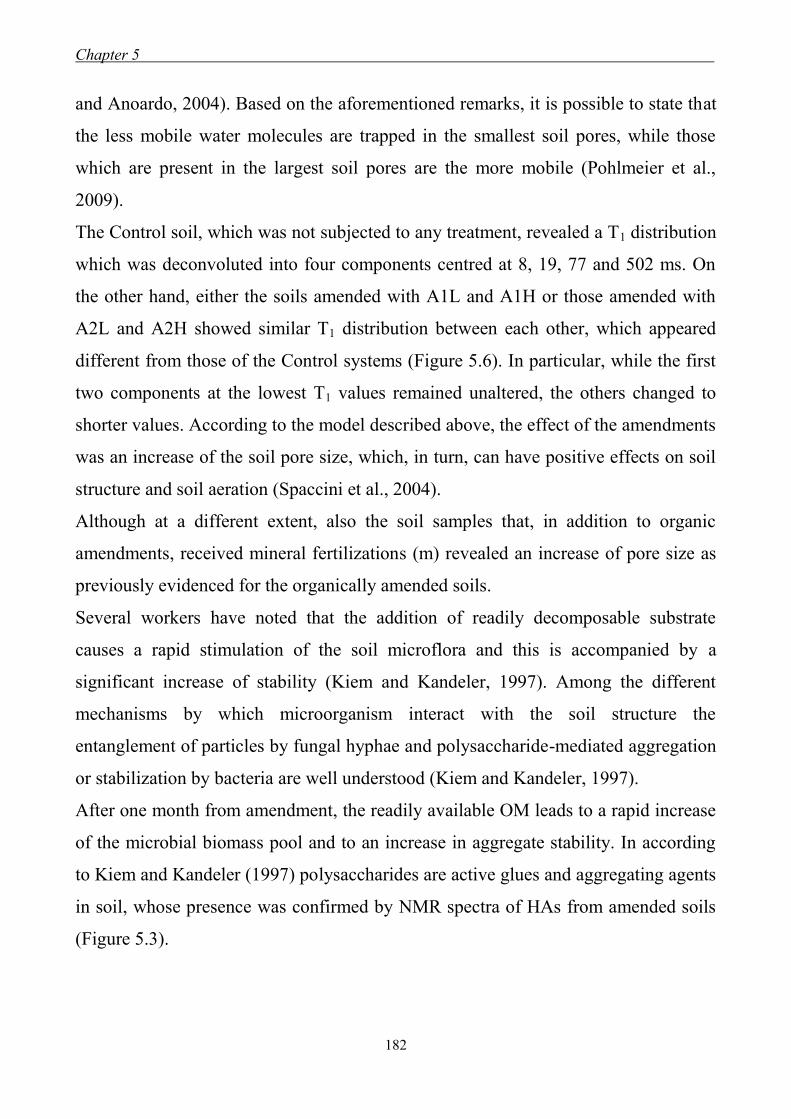
Chapter 5 .
182
and Anoardo, 2004). Based on the aforementioned remarks, it is possible to state that
the less mobile water molecules are trapped in the smallest soil pores, while those
which are present in the largest soil pores are the more mobile (Pohlmeier et al.,
2009).
The Control soil, which was not subjected to any treatment, revealed a T1 distribution
which was deconvoluted into four components centred at 8, 19, 77 and 502 ms. On
the other hand, either the soils amended with A1L and A1H or those amended with
A2L and A2H showed similar T1 distribution between each other, which appeared
different from those of the Control systems (Figure 5.6). In particular, while the first
two components at the lowest T1 values remained unaltered, the others changed to
shorter values. According to the model described above, the effect of the amendments
was an increase of the soil pore size, which, in turn, can have positive effects on soil
structure and soil aeration (Spaccini et al., 2004).
Although at a different extent, also the soil samples that, in addition to organic
amendments, received mineral fertilizations (m) revealed an increase of pore size as
previously evidenced for the organically amended soils.
Several workers have noted that the addition of readily decomposable substrate
causes a rapid stimulation of the soil microflora and this is accompanied by a
significant increase of stability (Kiem and Kandeler, 1997). Among the different
mechanisms by which microorganism interact with the soil structure the
entanglement of particles by fungal hyphae and polysaccharide-mediated aggregation
or stabilization by bacteria are well understood (Kiem and Kandeler, 1997).
After one month from amendment, the readily available OM leads to a rapid increase
of the microbial biomass pool and to an increase in aggregate stability. In according
to Kiem and Kandeler (1997) polysaccharides are active glues and aggregating agents
in soil, whose presence was confirmed by NMR spectra of HAs from amended soils
(Figure 5.3).
Long-term effects of organic amendments on soil organic matter
183
1 10 100 1000
0
5
10
15
20
25
Sig
na
l x N
ep
er
of R
ela
xa
tio
n T
ime
(%
)
T1 (ms)
8
19
77
502
Ctrl
1 10 100 1000-2
0
2
4
6
8
10
12
14
16
18
20
22
24
26
Sig
na
l x N
ep
er
of R
ela
xa
tio
n T
ime
(%
)
T1 (ms)
7
20
90223
Ctrl m
1 10 100 1000
0
5
10
15
20
25
Sig
na
l x N
ep
er
of R
ela
xa
tio
n T
ime
(%
)
T1 (ms)
821
111
474
A1L
1 10 100 1000
0
5
10
15
20
25
30
Sig
na
l x N
ep
er
of R
ela
xa
tio
n T
ime
(%
)
T1 (ms)
11
35
202
672
A1Lm
1 10 100 1000
0
5
10
15
20
25
Sig
na
l x N
ep
er
of R
ela
xa
tio
n T
ime
(%
)
T1 (ms)
8 23
109
355
A1H
1 10 100 1000
0
5
10
15
20
25
Sig
na
l x N
ep
er
of R
ela
xa
tio
n T
ime
(%
)
T1 (ms)
7 18
85
287
A1Hm
1 10 100 1000
0
5
10
15
20
25
Sig
na
l x N
ep
er
of R
ela
xa
tio
n T
ime
(%
)
T1 (ms)
7
19
100
447
A2L
1 10 100 1000
0
5
10
15
20
25
30
Sig
na
l x N
ep
er
of R
ela
xa
tio
n T
ime
(%
)
T1 (ms)
10
25125
543
A2Lm
1 10 100 1000
0
5
10
15
20
25
Sig
na
l x N
ep
er
of R
ela
xa
tio
n T
ime
(%
)
T1 (ms)
820
100
399
A2H
1 10 100 1000
0
5
10
15
20
25
Sig
na
l x N
ep
er
of R
ela
xa
tio
n T
ime
(%
)
T1 (ms)
6 24
135
422
A2Hm
Figure 5.6 FFC NMR relaxometry
spectra of F1 soils at first
sampling (March 2009).
Control Control m
Chapter 5 .
184
5.4 Conclusions
The results obtained by elemental analysis, FT-IR and 13
C CPMAS NMR
spectroscopy gave important information on soil OM evolution. Changes in elemental
composition of both HAs and FAs, depending on soil geopedologic characteristics
(F1 and F2) and on experimental time (one and twelve months) were observed after
the addition of different organic amendments.
In both amended soils OM fractions showed an increase of HAs fractions,
characterized by a lower content of more labile fraction, such as polysaccharides and
lipid components, and a higher content of aromatic compounds, indicating a selective
preservation of recalcitrant hydrophobic molecules, such as lignin and lignin-like
compounds, and confirming the positive effects of wood materials add in mix with
compost.
The nature of soils affected the behaviour and fate of OM. In fact, on the one hand
the clay nature of F1 soil favoured processes leading to more stable OM, rich in
carbonyl groups belonging to aldehydes and ketones, on the other hand the sandy
nature of F2 soil induced faster degradative processes, due to oxidative conditions
and more intensive microbial activity, in according to results obtained from soil
chemical and biochemical characterization.
The 13
C CPMAS NMR spectroscopy showed important changes in their functional
composition that allow to better understand also the physical, chemical and
biochemical results previously described. Also FFC NMR relaxometry as innovative
application of spectroscopic technique to soil, allowed to obtained interesting
information on the effects of organic amendments on soil properties. In particular
results suggest that the amendments induced an increase of the soil pore size, by
organo-mineral aggregates formation, which, in turn, can have positive effects on soil
structure and soil aeration.

Long-term effects of organic amendments on soil organic matter
185
5.5 References
Adani A., Genevini P., Tambone F., Montoneri E., 2006. Compost effect on soil
humic acid: A NMR study. Chemosphere 65:1414-1418.
Adani F., Genevini P., Ricca F. Tambone and Montoneri E., 2007. Modification of
soil humic matter after 4 years of compost application. Waste Management 27:319-
324.
Albers C. N. and Hansen P. E., 2010. 13
C-NMR Chemical Shift Databases as a Quick
Tool to Evaluate Structural Models of Humic Substances. The Open Magnetic
Resonance Journal 3:96-105.
Amato M. and Ladd J.N., 1980. Studies of nitrogen immobilization and
mineralization in calcareous soils. V. Formation and distribution of isotope-
labelled biomass during decomposition of 14
C- and 15
N carbon and nitrogen
isotope-labelled plant material. Soil Biology and Biochemistry 12:405-411.
Anderson D.W. and Paul E.A., 1984. Organo-mineral complexes and their study by
radiocarbon dating. Soil Science Society of America Journal 48:298-301.
Bakhmutov V. I., 2004. Pratical NMR Relaxation for Chemists, John Wiley and
Sons Ltd: Chichester, West Sussex, UK..
Belzile N., Joly H.A., Li H., 1997. Characterization of humic substances extracted
from Canadian lake sediments. Canadian Journal of Chemistry 75:14-27.
Bengtsson G., Bengtson P., Mansson, K.F., 2003. Gross nitrose mineralization-,
immobilization-, and nitrification rates as a function of soil C/N ratio and
microbial activity. Soil Biology and Biochemistry 35:143-154.
Borgia G.C., Brown R.J.S., Fantazzini P., 1998. Uniform-penalty inversion of
multiexponential decay data. Journal of Magnetic Resonance 132:65-77.
Borgia G.C., Brown R.J.S., Fantazzini P., 2000. Uniform-penalty inversion of
multiexponential decay data II: data spacing, T2 data, systematic data errors, and
diagnostics. Journal of Magnetic Resonance 147:273-285.

Chapter 5 .
186
Bourbonniere R.A. and Meyers P.A., 1978. Characterization of sedimentary humic
matter by elemental and spectroscopic methods. Canadian Journal of Spectroscopy
23:35-41.
Chen X., Hutley L.B., Eamus D., 2005. Soil organic carbon content at a range of
north Australian tropical savana with contrasting site histories. Plant and Soil
268:161-171.
Chien S.-W., Huang C.-C., Wang M.-C., 2003. Analytical and spectroscopic
characteristics of refuse compost-derived humic substances. International Journal
of Applied Science and Engineering 1:62- 71.
Conte P., De Pasquale C., Novotny E.H., Caponetto G., Laudicina V. A., Ciofalo M.,
Panno M., Palazzolo E., Badalucco L. and Alonzo G. 2010 CPMAS 13
C NMR
Characterization of Leaves and Litters from the Reafforestated Area of Mustigarufi
in Sicily (Italy). The Open Magnetic Resonance Journal 3:89-95.
Conte P., Piccolo A., van Lagen B., Buurman P., de Jager P. A., 1997. Quantitaitve
differences in evaluating soil humic substances by liquid- and solid-state 13
C-NMR
spectroscopy Geoderma 80:339-352.
Conte P., Spaccini, R., Piccolo, A., 2004. State of the art of CPMAS 13
C-NMR
spectroscopy applied to natural organic matter. Progress in Nuclear Magnetic
Resonance Spectroscopy 44:215-223.
Dignac M.-F., Kögel-Knabner I., Michel K., Matzner E., Knicker H., 2002.
Chemistry of soil organic matter as related to C/N in Norway spruce forest (Picea
abies (L.) Karst.) floors and mineral soils. Zeitschrift für Pflanzenernährung und
Bodenkunde 165, 281-289.
Dixon R.K., Brown S., Houghton R.A., Solomon A.M., Trexler M.C., Wisniewski J.,
1994. Carbon pools and flux of global forest ecosystems. Science 263:185-190.
Droussi Z., D‟Orazio V., Hafidi M., Ouatmane A., 2009. Elemental and
spectroscopic characterization of humic-acid-like compounds during composting
of olive mill by-products. Journal of Hazardous Materials 163:1289-1297.

Long-term effects of organic amendments on soil organic matter
187
Ferrante G., Sykora S., 2005. Technical aspects of fast field cycling. Advances in
Inorganic Chemistry 57:405-470.
Filip Z., Bielek P., 2002. Susceptibility of humic acids from soils with various
contents of metals to microbial utilisation and transformation. Biology and Fertility
of Soils 36:426- 433.
Fortuna A., Harwood R., Kizilkaya K., Paul E.A., 2003. Optimizing nutrient
availability and potential carbon sequestration in an agroecosystem. Soil Biology
and Biochemistry 35:1005-1013.
Gonzàles-Vila F.J., Almendros G., Madrid F., 1999. Molecular alterations of organic
fractions from urban waste in the course of composting and their further
transformation in amended soil. Science of the Total Environment 236:215-229.
Gonzalez-Vila F.J., Martin F., del Rio J.C., Fruünd, R., 1992. Structure
characteristics and geochemical signifcance of humic acids isolated from three
Spanish lignite deposits. Science of the Total Environment 117/118:335-343.
Grube M., Lin J.G., Lee P.H., Kokorevicha S., 2006. Evaluation of sewage
sludgebased compost by FT-IR spectroscopy. Geoderma 130:324-333.
Grube M., Zagreba J., Gromozova E., Fomina M., 1999. Comparative investigation
of the macromolecular composition of mycelia forms Thielavia terrestris by
infrared spectroscopy. Vibration Spectroscopy 19:301-306.
Halle B., Johannesson H., Venu K., 1998. Model-Free Analysis of stretched
relaxation dispersions. Journal of Magnetic Resonance 135:1-13.
Hargreaves J.C., Adl M.S., Warman P.R., 2008. A review of the use of composted
municipal solid waste in agricolture. Agriculture, Ecosystems and Environment
123:1-14.
Haynes R.J., Naidu R., 1998. Influence of lime, fertilizer and manure applications on
soil organic matter content and soil physical conditions: a review. Nutrient Cycling
in Agroecosystems 51:123-137.
Chapter 5 .
188
Ishiwatari R., 1985. Geochemistry of humic substances in lake sediments. In: Aiken
G.R., McKnight D.M., Wershow R.L., MacCarthy P. (Eds.), Humic Substances in
Soil, Sediment, and Water. John Wiley and Sons, New York, pp. 147-180.
Iyyemperumal K., Israel D.W., Shi W., 2007. Soil microbial biomass, activity and
potential nitrogen mineralization in a pasture: Impact of stock camping activity.
Soil Biology and Biochemistry 39:149-157.
Juan Li., Bing-qiangl Z., Xiu-yingl L., Rui-bol J., Hwat Bing S., 2008. Effects of
long-term combined application of organic and mineral fertilizers on microbial
biomass, soil enzyme activities and soil fertility. Agricultural Sciences in China
7:336-343.
Kiem R. and Kandeler E., 1997. Stabilization of aggregates by the microbial biomass
as affected by soil texture and type. Applied Soil Ecology 5:221-230.
Kimmich R. and Anoardo E., 2004. Field-cycling NMR relaxometry. Progress in
Nuclear Magnetic Resonance Spectroscopy 44:257-320.
Knicker H. and Lüdemann H.-D., 1995. N-15 and C-13 CPMAS and solution NMR
studies of N-15 enriched plant material during 600 days of microbial degradation.
Organic Geochemistry 23:329-341.
Komaljow E. and Mazzarino M.J., 2007. Soil restoration in semiarid Patagonia:
Chemical and biological response to different compost quality. Soil Biology and
Biochemistry 39:1580-1588.
Laganière J., Angers D.A., Paré D., 2010. Carbon accumulation in agricultural soils
after afforestation: a meta-analysis. Global Change Biology 16:439-453.
Lal R., 2004. Soil carbon sequestration to mitigate climate change. Geoderma 123:1-
22.
Leifeld J., Siebert S., Kogel-Knaber I., 2002. Changes in the chimica composition of
soil organic matter after application of compost. European Journal of Soil Science
53:299-309.

Long-term effects of organic amendments on soil organic matter
189
Lemma B., Nilsson I., Kleja D.B., Olsson M., Knicker H., 2007. Decomposition and
substrate quality of leaf litters and fine roots from three exotic plantations and a
native forest in the southwestern highlands of Ethiopia. Soil Biology and
Biochemestry 39:2317-28.
Lguirati A., Ait Baddi G., El Mousadik A., Gilard V., Revel J.C., Hafidi M., 2005.
Analysis of humic acids from aerated and non-aerated urban landfill composts.
International Biodeterioration and Biodegradation 56:8-16.
Lima D.L.D., Santos S.M., Scherer H.W., Schneider R.J., Duarte A.C., Santos
E.B.H., Esteves V.I., 2009. Effects of organic and inorganic amendments on soil
organic matter properties. Geoderma 150:38-45.
Liu N., He H., Xie H., Bai Z., Zhang X., Peng C., Zhu P., Ren J., Wang L., 2010.
Impacts of long-term inorganic and organic fertilization on lignin in a Mollisol.
Journal of Soils Sediments 10:1466-1474.
Malcolm R.L., 1989. Application of solid state 13
C NMR spectroscopy to
Geochemical structure of humic sub- stances. Hayes MHB, MacCarthy P.,
Malcolm R.L., Swift R.S.. In: Humic Substances II. In Search of Structure. John
Wiley and Sons, New York, pp. 339±372.
Martin F., Almendros G., Gonzàlez-Vila F.-J., Verdejo T., 2001. Experimental
reappraisal of flash pyrolysis and low-temperature thermally assisted hydrolysis
and and methylation using tetramethylammonium hydroxide for the molecular
characterization of humic acids. Journal of Analytical and Applied Pyrolysis
61:133-145.
Masciandaro G., Ceccanti B., Gracía C., 2000. In situ vermicomposting of biological
sludges and impact on soil quality. Soil Biology and Biochemistry 32:1015-1024.
Mermut A.R., Eswaran H., 2001. Some major developments in soil science since the
mid-1960s. Geoderma 100:403- 426.
Chapter 5 .
190
Naidja A., Huang P.M., Anderson D.W., Van Kessel J.S., 2002. FT-IR, UV-visible,
and X-ray diffraction analyses of organic matter in humin, humic acid, and fulvic
acid fractions in soil exposed to elevated CO2 and N fertilisation. Applied
Spectroscopy 56:318-324.
Olk D.C., Brunetti G., Senesi N., 1999. Organic matter in doublecropped lowland
rice soils: chemical and spectroscopic properties. Soil Science 164:633- 649.
Piccolo A., Spaccini R., Nieder R., Richter J., 2004. Sequestration of a biologically
labile organic carbon in soils by humified organic matter. Climatic Change 67:329-
343.
Pohlmeier A., Haber-Pohlmeier S., Stapf S., 2009. A Fast Field Cycling Nuclear
Magnetic Resonance Relaxometry Study of Natural Soils, Vadose Zone Journal, 8,
735-742.
Provenzano M.R., de Oliveira S.C., Silva M.R.S., Senesi N., 2001. Assessment of
maturity degree of composts from domestic solid wastes by fluorescence and
Fourier transform infrared spectroscopy. Journal of Agricultural and Food
Chemistry 49:5874-5879.
Quèdraogo E., Mando A., Zombre` N.P., 2001. Use of compost to improve soil
properties and crop productivity under low input agricultural system in West
Africa. Agriculture, Ecosystems and Environment 84:259-266.
Quideau S.A., Chadwick O.A., Benesi A., Graham R.C., Anderson M.A., 2001. A
direct link between forest vegetation type and soil organic matter composition.
Geoderma 104: 41-60.
Reeves III J.B., Van Kessel J.S., 2002. Spectroscopic analysis of dried manure: near-
versus mid-infrared spectroscopy for the analysis of dried dairy manure. Journal of
Near Infrared Spectroscopy 10:93-101.
Reveille V., Mansuy L., Jarde E., Garnier-Sillam E., 2003. Characterization of
sewage sludge-derived organic matter: lipids and humic acids. Organic
Geochemistry 34:615-627.
Long-term effects of organic amendments on soil organic matter
191
Rice J.A., MacCarthy P., 1991. Statistical evaluation of the elemental composition of
humic substances. Organic Geochemestry 17:635-648.
Rivero C., Chirenje T., Ma L.Q., Martinez G., 2004. Influence of compost on soil
organic matter quality under tropical conditions. Geoderma 123, 355-361.
Russo F., Gianfreda L., Conte P. and Rao M. A., 2010, Interaction of a Recombinant
Prion Protein with Organo-Mineral Complexes as Assessed by FT-IR and CPMAS
13C NMR Analysis, The Open Magnetic Resonance Journal 3:84-89.
Schulten H.-R., Leinweber P., 2000. New insights into organic-mineral particles:
composition, properties and models of molecular structure. Biology and Fertility of
Soils 30:1-34.
Senesi N., Orazio V.D., Ricca G., 2003. Humic acids in the first generation of
EUROSILS. Geoderma 116:325-344.
Sierra M.M.D., Giovanela M., Parlanti E., Esteves V.I., Duarte A.C., Fransozo A.,
Soriano-Sierra E.J., 2005. Structural description of humic substances from
subtropical coastal environments using elemental analysis, FT-IR and 13
C-solid
state NMR data. Journal of Coastal Research 42:370-382.
Silverstein R. M., Webster F. X., Kiemle D., 2005. The Spectrometric Identification
of Organic Compounds, 7th ed. J. Wiley and Sons, NJ, USA.
Smidt E., Lechner P., Schwanninger M., Haberhauer G., Gerzabek M.H., 2002.
Characterization of waste organic matter by FT-IR spectroscopy: application in
waste science. Applied Spectroscopy 56:1170-1175.
Soumaré M., Tack F.M.G., Verloo M.G., 2003. Effects of a municipal solid waste
compost and mineral fertilization on plant growth in two tropical agriculture soils
of Mali. Bioresource Technology 86:15-20.
Spaccini R., Mbagwu J.S.C., Igwe C.A., Conte P., Piccolo A., 2004. Carbohydrates
and aggregation in lowland soils of Nigeria as influenced by organic inputs, Soil
and Tillage Research 75:161-172.

Chapter 5 .
192
Spaccini R., Piccolo A., Conte P., Haberhauer G., Gerzabek M.H., 2002. Increased
soil organic carbon sequestration through hydrophobic protection by humic
substances. Soil Biology and Biochemistry 34:1839-1851.
Steelink C. 1985. Implications of elemental characteristics of humic substances. In:
Aiken G.R., McKnight D.M., Wershow R.L., MacCarthy P. (Eds.), Humic
Substances in Soil, Sediment, and Water. John Wiley and Sons, New York, pp.
457±476.
Stevenson F.J., 1994. Humus chemistry: genesis, composition, reactions. Journal of
Chemical Education 72:A93.
Tatzber M., Stemmer M., Spiegel H., Katzlberger C., Haberhauer G., Mentler A., and
Gerzabek M.H., 2007. FTIR-spectroscopic characterization of humic acids and
humin fractions obtained by advanced NaOH, Na4P2O7, and Na2CO3 extraction
procedures Journal of Plant Nutrition and Soil Science 170:522-529.
Taylor R.E., French A.D., Gamble G.R., et al. 1H and
13C solid-state NMR of
Gossypium barbadense (Pima) cotton. Journal of Molecular Structure 878:177-84.
Tseng D.Y., Vir R., Traina S.J., Chalmers J.J., 1996. A Fourier transform infrared
spectroscopic analysis of organic matter degradation in a bench-scale solid
substrate fermentation (composting) system. Biotechnology and Bioengineering
52:661-671.
Ussiri D.A.N. and Johnson C.E., 2003. Characterization of organic matter in a
northern hardwood forest soil by 13
C NMR spectroscopy and chemical methods.
Geoderma 111:123-149.
Vesterdal L., Ritter E., Gundersen P., 2002. Change in soil organic carbon following
afforestation of former arable land. Forest Ecology and Management 169:137-147.
Weber J., Karczewska A., Drozd J., Licznar M., Licznar S., Jamroz E., Kocowicz A.,
2007. Agricultural and ecological aspects of a sandy soil as affected by the
application of municipal solid waste composts. Soil Biology and Biochemistry
39:1294-1302.

Long-term effects of organic amendments on soil organic matter
193
Wickholm K., Hult E.-L., Larsson P.T., Iversen T., Lennholm H.,1998. Assignment
of non-crystalline forms in cellulose I by CP/MAS 13
C NMR spectroscopy.
Carbohydrates research 312:123-129.
Zaccheo P., Cabassi G., Ricca G., Crippa L., 2002. Decomposition of organic
residues in soil: experimental technique and spectroscopic approach. Organic
Geochemistry 33:327-345.

Chapter 5 .
194
195
Chapter 6
Effects of organic fertilizers on development
of arbuscular mycorrhizal fungi indigenous in lettuce
6.1 Introduction
In the natural ecosystem, the symbiotic association between the roots of plants and
fungi is very common. Among the different types of fungi forming these associations
the most important are the arbuscular mycorrhizal fungi (AMF) of the Phylum
Glomeromycota (Schussler et al., 2001). AMF form a symbiotic association with
more than 80% of cultivated plants, though crops in the Brassicaceae and
Chenopodiaceae generally do not form mycorrhizal associations (Newman and
Reddell, 1987). The AMF consists of an internal part inside the plant root and an
external part, called extra radical mycelium, which can form an extensive network
within the soil.
A widely accepted definition, that includes all aspects of the association between the
host plant and the AMF, does not appear in literature. Fitter and Moyersoen (1996)
defined AMF association as „„a sustainable non-pathogenic biotrophic interaction
between a fungus and a root‟‟, but although having merit, it does not emphasize the
importance of the extra radical phase (Hodge, 2000; Gosling et al., 2005).
The AMF facilitate their host principally by increasing the uptake of relatively
immobile phosphate ions, due to the ability of the fungal extra radical mycelium to
grow beyond the phosphate depletion zone that quickly develops around the root
(Sanders and Tinker, 1971; Koide, 1991; George et al., 1995; Smith and Read, 1997).
In return, the fungi receive carbon from the host plant. Other benefits to the host
include: increased resistance to foliar-feeding insects (Gange and West, 1994),
improved drought resistance (Augé et al., 1994), increased resistance to soil
pathogens (Newsham et al., 1995; Lingua et al., 2002; Pozo et al., 2002) and
increased tolerance to salinity and heavy metals (Shetty et al., 1995; Diaz et al., 1996;

Chapter 6 .
196
Al-Karaki et al., 2001; Feng et al., 2002; Mohammad et al., 2003). Increased uptake
of macronutrients besides phosphorus (P), including nitrogen (N) potassium (K) and
magnesium (Mg) has also been reported (Smith and Read, 1997; Hodge et al., 2001)
as well as increased uptake of some micronutrients (Faber et al., 1990; Kothari et al.,
1991a; Li et al., 1991; Azaizeh et al., 1995). In addition, mycorrhizas have been
shown to play an important role in maintaining soil aggregate stability (Tisdall, 1991;
Degens et al., 1996).
Crop management can affect AMF association both directly, by damaging or killing
AMF and indirectly, by creating conditions either favorable or unfavorable to AMF.
In general, intensive agricultural managements negatively affected the AMF
association, determining an impoverished AMF in the agro-ecosystems, particularly
in terms of biodiversity (Helgason et al., 1998; Menéndez et al., 2001).
The intensive use of mineral fertilizers, such occurs in intensive farming, depleted the
AMF development (Gosling et al., 2005).
Use of phosphate fertilizers has a significant impact on the relationship between the
plant and the fungus. The intensive use of phosphate fertilizers, used in excess respect
to crop requirements, determines a build-up of total and, in some cases, of easily
available phosphorus in the soil (Boehm and Anderson, 1997; Withers et al., 2001;
De Clerck et al., 2003; Kogelmann et al., 2004). This has led, in turn, to less reliance
of crops on the AMF association and lower AMF colonization and propagule density.
Use of nitrogen fertilizers it has also been reported to have a negative effect on AMF
colonization and/or diversity in some cases (Miller and Jackson, 1998; Liu et al.,
2000; Burrows and Pfleger, 2002; Treseder and Allen, 2002). On the other hand,
organic amendments, such as farmyard manure, compost and crop residues, and slow
release mineral fertilizers, such as rock phosphate, do not seem to suppress AMF and
could even stimulate them (Douds et al., 1997; Kabir et al., 1998; Miller and Jackson,
1998; Joner, 2000; Alloush and Clark, 2001).
Low input practices, such as occur in organic farming, are generally more favourable
to AMF and this fungi have the potential to replace synthetic fertilizers and biocides,
Effects of organic fertilizers on arbuscular mycorrhizal fungi
197
which are forbidden in organic systems. However, the available evidence suggests
that, despite the use of generally favourable management practices, organic agro-
ecosystems do not always have large, diverse or efficient AMF communities. Many
authors report higher levels of AMF colonization, higher propagule numbers or
higher diversity in organic farming (Douds et al., 1993; Kahiluoto and Vestberg,
1998; Eason et al., 1999; Ryan and Ash, 1999; Ryan et al., 2000, 2004; Galvez et al.,
2001; Oehl et al., 2003, 2004; Bending et al., 2004).
To better understand how organic fertilizers can affect AMF, the aim of this work
was to evaluate the effect of nitrogen and phosphorus, by organic fertilizations, on the
development of indigenous AMF and on the growth of lettuce plants, an important
crop widely cultivated under organic farming and with high percentage of root
colonization by AMF.
This study was performed, during the period of Ph doctorate foreign, at the
Departamento de Ciencias Químicas, Universidad de la Frontera, Temuco, Chile,
under the supervision of Prof. Fernando Borie.
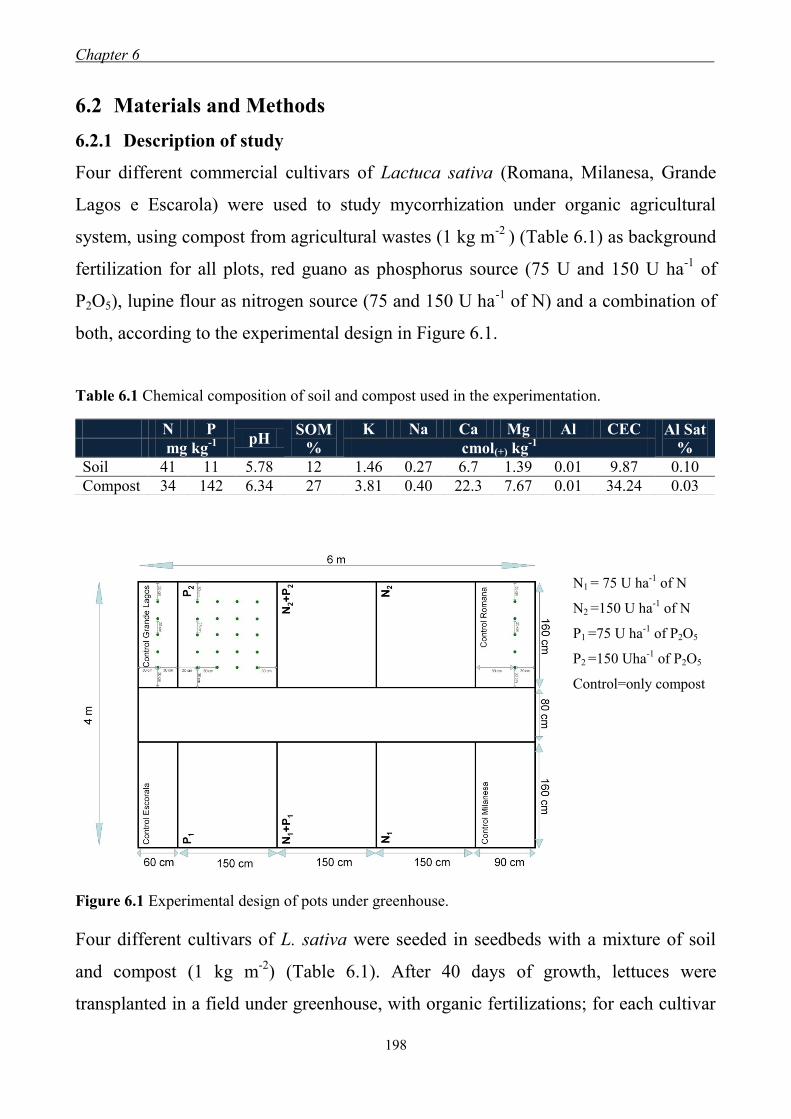
Chapter 6 .
198
6.2 Materials and Methods
6.2.1 Description of study
Four different commercial cultivars of Lactuca sativa (Romana, Milanesa, Grande
Lagos e Escarola) were used to study mycorrhization under organic agricultural
system, using compost from agricultural wastes (1 kg m-2
) (Table 6.1) as background
fertilization for all plots, red guano as phosphorus source (75 U and 150 U ha-1
of
P2O5), lupine flour as nitrogen source (75 and 150 U ha-1
of N) and a combination of
both, according to the experimental design in Figure 6.1.
Table 6.1 Chemical composition of soil and compost used in the experimentation.
N1 = 75 U ha-1
of N
N2 =150 U ha-1
of N
P1 =75 U ha-1
of P2O5
P2 =150 Uha-1
of P2O5
Control=only compost
Figure 6.1 Experimental design of pots under greenhouse.
Four different cultivars of L. sativa were seeded in seedbeds with a mixture of soil
and compost (1 kg m-2
) (Table 6.1). After 40 days of growth, lettuces were
transplanted in a field under greenhouse, with organic fertilizations; for each cultivar
N P pH
SOM
%
K Na Ca Mg Al CEC Al Sat
% mg kg-1
cmol(+) kg-1
Soil 41 11 5.78 12 1.46 0.27 6.7 1.39 0.01 9.87 0.10
Compost 34 142 6.34 27 3.81 0.40 22.3 7.67 0.01 34.24 0.03

Effects of organic fertilizers on arbuscular mycorrhizal fungi
199
5 plants in each amendment condition were transplanted. After 60 days of growth
under greenhouse, when lettuces were ready to commerce, the plants were harvested.
6.2.2 Plant analyses
Plants were harvested by recording of shoot and root parts and rhizosphere soils were
collected. The roots were washed under a stream of cold tap water to remove soil
residues and fresh and dry (65 °C, 24 h) weight of both shoot and roots was recorded.
Before drying, roots were subsampled in three 2-cm cross-sections of the upper,
middle, and lower root system to determine mycorrhizal colonization. To assess
colonization, roots were cleared with 10% KOH at room temperature, rinsed with
water, neutralized with 1 N HCl, and stained with 0.05% trypan blue for 24 h
(Phillips and Hayman, 1970). The percentage of root colonized by AMF was
calculated by the gridline intersect method (Giovanetti and Mosse, 1980). Positive
counts for AM colonization included the presence of vesicles or arbuscules or typical
mycelium within the roots.
6.2.3 Rhizosphere soil analysis
Mycorrhizal spores were collected from soil by wet sieving and decanting as
described by Sieverding (1991). Glomalin extraction from whole-soil subsamples (1
g) was conducted as described by Wright and Upadhyaya (1998) with three
replicates. Total glomalin (TG) was extracted with 50 mM sodium citrate, at pH 8.0
at 121 °C in rounds of 60 min cycles until supernatant showed none of the red-brown
colour typical of glomalin. Extracts from each replicate were centrifuged to remove
soil particles, and protein in the supernatant was analyzed using a Bradford assay
with bovine serum albumin as standard (Wright and Upadhyaya, 1998).
6.2.4 Statistical analysis
Analysis of variance (ANOVA-one way with replication) was used to evaluate the
effect of different organic fertilizers on crop yields. The significance between means
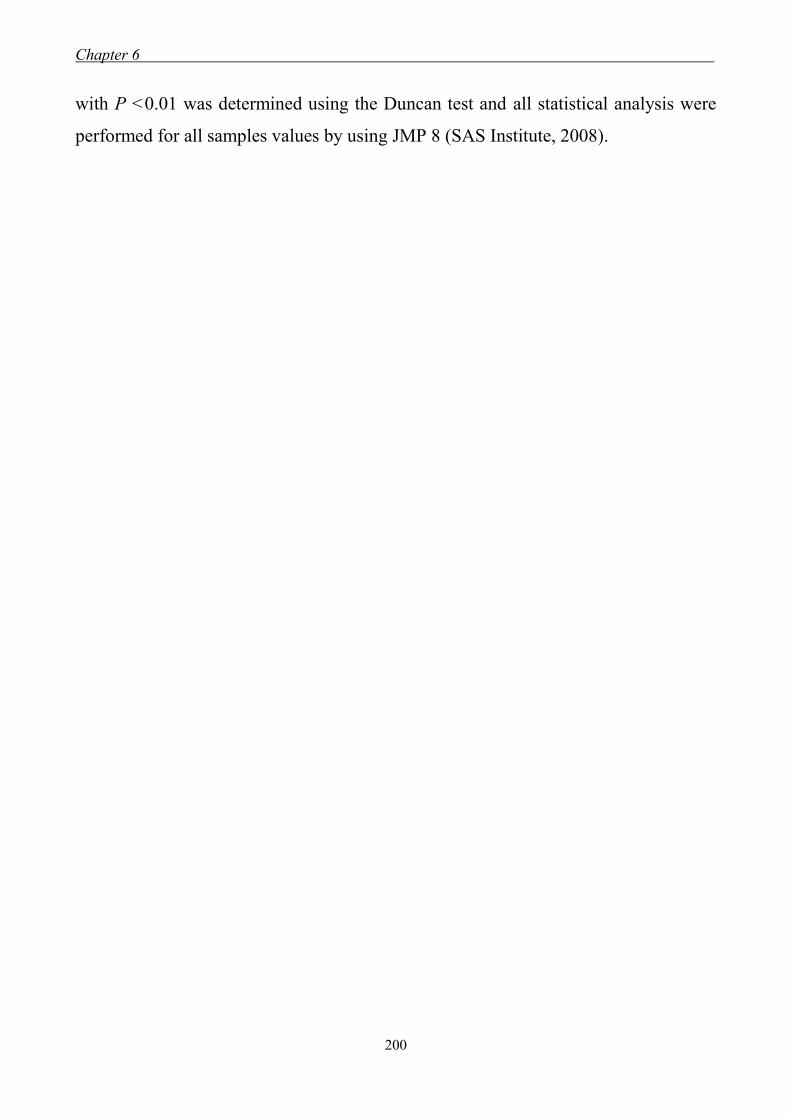
Chapter 6 .
200
with P <0.01 was determined using the Duncan test and all statistical analysis were
performed for all samples values by using JMP 8 (SAS Institute, 2008).
Effects of organic fertilizers on arbuscular mycorrhizal fungi
201
6.3 Results and Discussion
6.3.1 Effect of organic fertilization on lettuces growth
The use of red guano, as sole phosphorus (P) fertilizer determined a significant
increase of weight in all cultivars (Fig. 6.2). The high dose of phosphorus fertilizer
(P2) determined a significant increase of weight in cultivar Romana (5.0 g) compared
to Control (2.0 g), whereas in cultivars Grande Lagos and Milanesa a strongly
increase of weight (8.1 g and 8.3 g, respectively) was detected. In this latter cultivar
also the low dose of phosphorus (P1) positively affected the growth of lettuces,
determining the same dry weight of P2. In cultivar Escarola, P fertilization
determined an increase of dry weight, but not as in the other cultivars.
Lupine flour used as nitrogen (N) fertilizer did not determined the same effect of red
guano (Fig. 6.2a). In this case the weight of all plants was lower than those grown
under only P fertilization. In general, no significant differences of growth were
observed in plants under N fertilization, compared to not fertilized plants. Only in
cultivar Milanesa the higher dose of N (N2) determined an increase of dry weight (3.1
g) compared to the Control (1.3 g).
Combined use of nitrogen and phosphorus fertilization (N+P) determined higher
growth in cultivars Milanesa, Grande Lagos and Escarola, whereas in cultivar
Romana no positive effects on plant growth were observed (Fig. 6.3). The higher
dose (N2+P2) produced higher dry weight values in cultivars Escarola and Grande
Lagos (3.9 g and 3.6 g, respectively) compared to the others three cultivars.
Dry weight roots were affected by organic fertilizers in different ways. In general, a
decrease of root weight in all cultivars under the only nitrogen fertilization compared
to plants cultivated with P fertilization was observed; at low N availability, plant
increases the proportion of biomass allocated into roots, to promote the uptake of
limited nutrients (Chapin, 1991).
The differences of lettuces growth depending on the two organic fertilizers could be
explained by the different amendment nature. Red guano is a phosphorus source
easily available, so it determined a strong increase of plant weight, whereas lupine
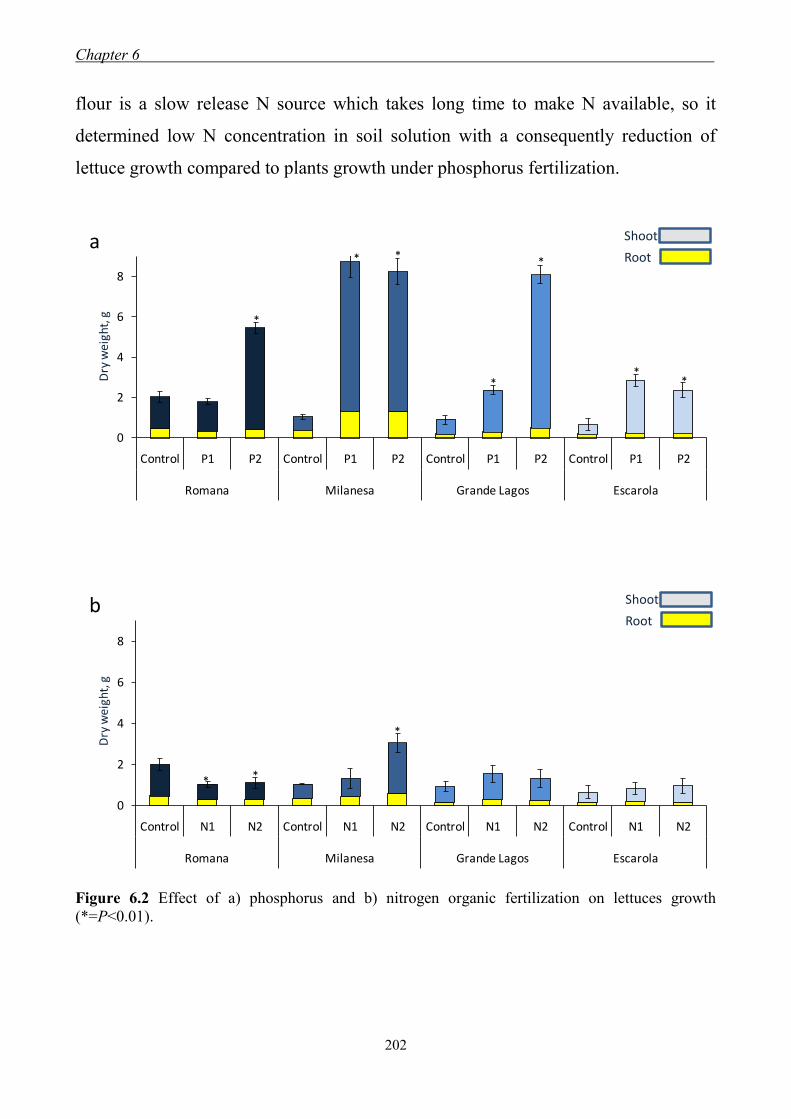
Chapter 6 .
202
flour is a slow release N source which takes long time to make N available, so it
determined low N concentration in soil solution with a consequently reduction of
lettuce growth compared to plants growth under phosphorus fertilization.
Figure 6.2 Effect of a) phosphorus and b) nitrogen organic fertilization on lettuces growth
(*=P<0.01).
0
2
4
6
8
Control P1 P2 Control P1 P2 Control P1 P2 Control P1 P2
Romana Milanesa Grande Lagos Escarola
Dry
we
igh
t, g *
* *
*
*
**
a Shoot
Root
0
2
4
6
8
Control N1 N2 Control N1 N2 Control N1 N2 Control N1 N2
Romana Milanesa Grande Lagos Escarola
Dry
wei
ght,
g
* *
*
b Shoot
Root
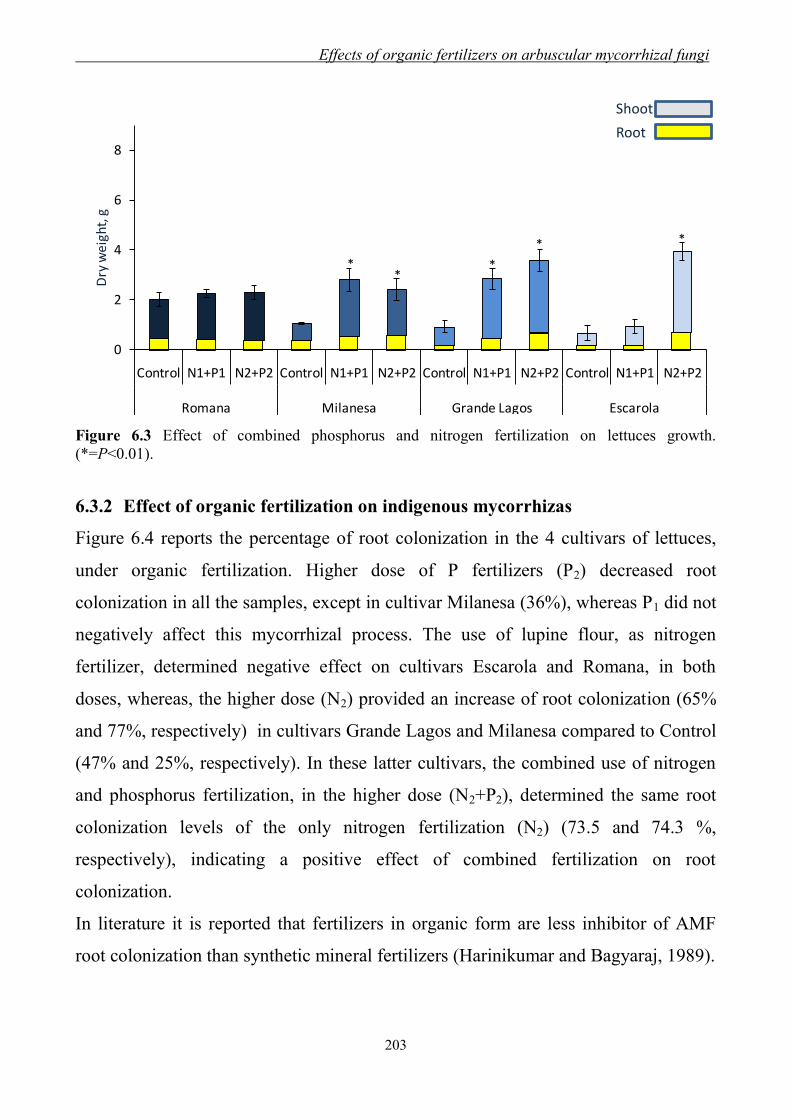
Effects of organic fertilizers on arbuscular mycorrhizal fungi
203
Figure 6.3 Effect of combined phosphorus and nitrogen fertilization on lettuces growth.
(*=P<0.01).
6.3.2 Effect of organic fertilization on indigenous mycorrhizas
Figure 6.4 reports the percentage of root colonization in the 4 cultivars of lettuces,
under organic fertilization. Higher dose of P fertilizers (P2) decreased root
colonization in all the samples, except in cultivar Milanesa (36%), whereas P1 did not
negatively affect this mycorrhizal process. The use of lupine flour, as nitrogen
fertilizer, determined negative effect on cultivars Escarola and Romana, in both
doses, whereas, the higher dose (N2) provided an increase of root colonization (65%
and 77%, respectively) in cultivars Grande Lagos and Milanesa compared to Control
(47% and 25%, respectively). In these latter cultivars, the combined use of nitrogen
and phosphorus fertilization, in the higher dose (N2+P2), determined the same root
colonization levels of the only nitrogen fertilization (N2) (73.5 and 74.3 %,
respectively), indicating a positive effect of combined fertilization on root
colonization.
In literature it is reported that fertilizers in organic form are less inhibitor of AMF
root colonization than synthetic mineral fertilizers (Harinikumar and Bagyaraj, 1989).
0
2
4
6
8
Control N1+P1 N2+P2 Control N1+P1 N2+P2 Control N1+P1 N2+P2 Control N1+P1 N2+P2
Romana Milanesa Grande Lagos Escarola
Dry
wei
ght,
g
**
*
* *
Shoot
Root

Chapter 6 .
204
Figure 6.4 Effect of organic fertilizations on root colonization in lettuces cultivars by AMF
indigenous.
The different root colonization by indigenous AMF reflected partly the intensity of
fertilizer input and the soluble-nutrients content, especially of P, in the soils. This was
in accordance with Hayman (1982) and Gosling (2006) that demonstrated as P has
the most pronounced effect on the development of AMF symbiosis. In general, the
percentage of AMF root colonization decreases by increasing P status of the host
plant (Smith and Read, 1997). In our case, a decrease of root colonization in lettuces
under the only phosphorus fertilization was observed, due to easily available P of red
guano, which had strongly increased P in soil solution, inhibiting root colonization by
indigenous AMF.
As occur for phosphorus, high solubility of N fertilizers generates high soil N
concentrations detrimental to many soil microorganisms and mycorrhizal fungi
0
20
40
60
80
100
Control P1 P2 N1 N2 N1+P1 N2+P2
Co
lon
izat
ion
, %
Romana
0
20
40
60
80
100
Control P1 P2 N1 N2 N1+P1 N2+P2
Col
oniz
atio
n, %
Milanesa
0
20
40
60
80
100
Control P1 P2 N1 N2 N1+P1 N2+P2
Col
oniz
atio
n, %
Grande Lagos
0
20
40
60
80
100
Control P1 P2 N1 N2 N1+P1 N2+P2
Co
lon
izat
ion
, %
Escarola
Effects of organic fertilizers on arbuscular mycorrhizal fungi
205
(O‟Donnell et al., 2001; Scagel, 2005). By contrast, organic fertilizers often promote
activity and diversity of these microorganisms because of low-solubility and slow
release of N (such as lupine flour) and other nutrients released by microbial
degradation of the organic compounds (Goulart et al., 1995; van Bruggen and
Semenov, 2000). For this reason, the use of lupine flour as N source did not affect the
root colonization in the studied lettuces, and in some cases, such as in cultivars
Milanesa and Grande Lagos, positively affected the colonization by AMF.
In general the indigenous AMF spore density was positively affected by organic
fertilizers, as shown in Figure 6.5. The use of only P fertilization slightly raised
spores, in all studied cultivars; whereas, when lupine flour was used as N
fertilization, a strong increase, particularly in cultivars Romana and Escarola, was
observed. The combined use of N and P fertilization favoured, in both doses, in
cultivars Milanesa a strongly increase in spores number, compared to Control; while
in cultivars Escarola and Grande Lagos, the low dose determined similar spore
numbers, compared to N2.
The increase of AMF spores number observed after the addition of organic fertilizers,
in particular with N fertilizers, was in according to the generally observed positive
effect of organic fertilizer amendments on AMF (Oehl et al., 2004; Gosling et al.,
2006). This result could relates to the characteristics of lupine flour, an organic
fertilizer with a low-solubility and a slow release of N that determined low N
concentration in the soil solution. Consequently higher soil colonization occurred in
order to keep plants supply the supplied with more soluble N (Koide, 1991; Smith
and Read, 1997).
These soils showed an active soil microbial community due to the exclusion of
soluble mineral fertilizers and the limited use of biocides, as it occurs in organic
farming (Gosling et al., 2006).

Chapter 6 .
206
Figure 6.5 Effect of organic fertilizations on AMF indigenous spores numbers.
In the rhizospheric soils of all studied cultivars, under organic fertilizer, 10-11
different spore ecotypes were identified. This result confirmed that under low-input
fertilizers, as it occurs under organic fertilizations, a high AMF biodiversity can be
established (Oehl et al., 2009). The same ecological AMF groups in soils under
organic fertilizer, compared with no treated soils, could indicate no loss of soil
function and soil quality.
Total glomalin content ranged from 5 to 6 mg g-1
in all studied soils (Table 6.2), and
remained unchanged by organic fertilizers, according to the average values of
agriculture soil (Borie et al., 2006).
0
500
1000
1500
2000
2500
3000
3500
4000
Control P1 P2 N1 N2 N1+P1 N2+P2
N°
spo
res
10
0g-1
Romana
0
500
1000
1500
2000
2500
3000
3500
4000
Control P1 P2 N1 N2 N1+P1 N2+P2
N°
spo
res
10
0g-1
Milanesa
0
500
1000
1500
2000
2500
3000
3500
4000
Control P1 P2 N1 N2 N1+P1 N2+P2
N°
spo
res
10
0g-1
Grande Lagos
0
500
1000
1500
2000
2500
3000
3500
4000
Control P1 P2 N1 N2 N1+P1 N2+P2
N°
spo
res
10
0g-1
Escarola
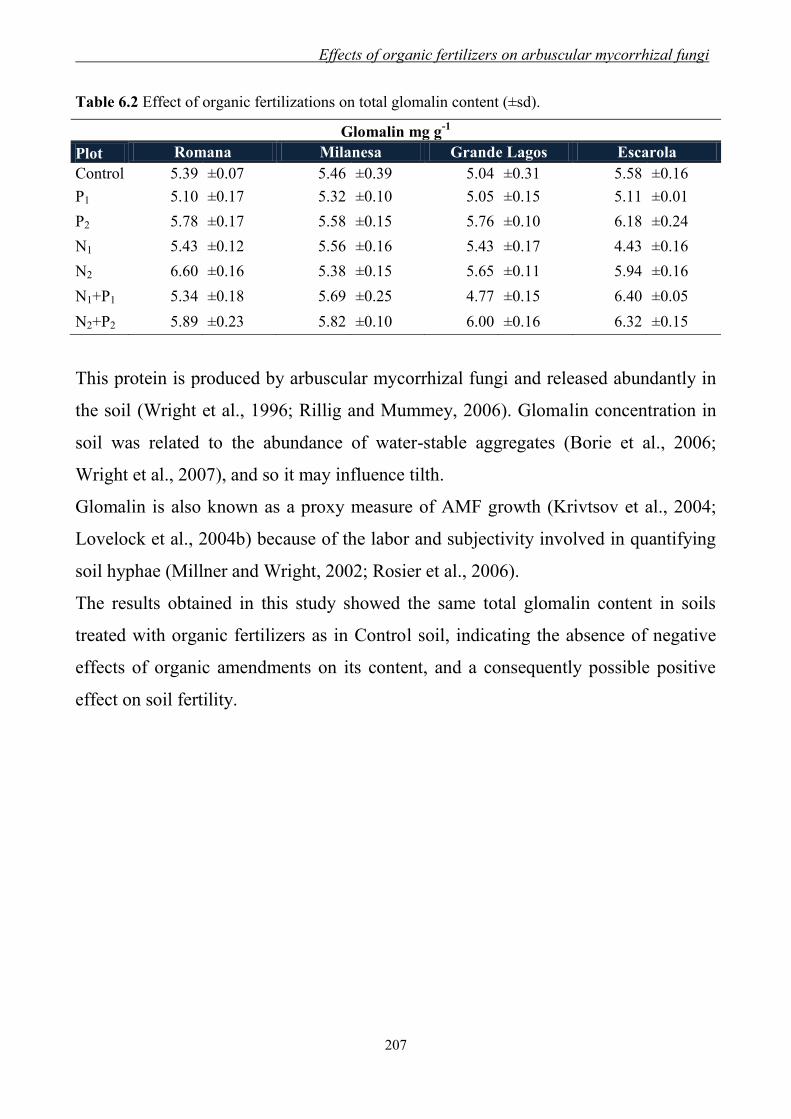
Effects of organic fertilizers on arbuscular mycorrhizal fungi
207
Table 6.2 Effect of organic fertilizations on total glomalin content (±sd).
Glomalin mg g-1
Plot Romana Milanesa Grande Lagos Escarola
Control 5.39 ±0.07 5.46 ±0.39 5.04 ±0.31 5.58 ±0.16
P1 5.10 ±0.17 5.32 ±0.10 5.05 ±0.15 5.11 ±0.01
P2 5.78 ±0.17 5.58 ±0.15 5.76 ±0.10 6.18 ±0.24
N1 5.43 ±0.12 5.56 ±0.16 5.43 ±0.17 4.43 ±0.16
N2 6.60 ±0.16 5.38 ±0.15 5.65 ±0.11 5.94 ±0.16
N1+P1 5.34 ±0.18 5.69 ±0.25 4.77 ±0.15 6.40 ±0.05
N2+P2 5.89 ±0.23 5.82 ±0.10 6.00 ±0.16 6.32 ±0.15
This protein is produced by arbuscular mycorrhizal fungi and released abundantly in
the soil (Wright et al., 1996; Rillig and Mummey, 2006). Glomalin concentration in
soil was related to the abundance of water-stable aggregates (Borie et al., 2006;
Wright et al., 2007), and so it may influence tilth.
Glomalin is also known as a proxy measure of AMF growth (Krivtsov et al., 2004;
Lovelock et al., 2004b) because of the labor and subjectivity involved in quantifying
soil hyphae (Millner and Wright, 2002; Rosier et al., 2006).
The results obtained in this study showed the same total glomalin content in soils
treated with organic fertilizers as in Control soil, indicating the absence of negative
effects of organic amendments on its content, and a consequently possible positive
effect on soil fertility.
Chapter 6 .
208
6.4 Conclusions
The nature of the used organic fertilizers has had a crucial role in the
experimentation.
Red guano, due to its nature of easily available P source, determined a strongly
increase of biomass in all lettuce cultivars. In particular, cultivar Milanesa showed
the higher growth than all studied cultivars, also with the lower level of phosphorus
fertilization (P1). On the other hand, the increase of soil P concentration negatively
affected root colonization by AMF, according to literature (Gosling et al., 2006).
Conversely, the use of lupine flour, as N source, determined a lower growth of lettuce
plant, because of its low solubility. For this reason therefore, it cannot be considered
a good organic fertilizer for plants as lettuce, having a very short crop cycle.
Although lupine flour was recalcitrant to degradation it enhanced root colonization,
in particular in cultivars Grande Lagos and Milanesa. In this latter cultivars the
combined use of red guano and lupine flour led to a high percentage of root
colonization as well as a good green biomass development, and affected positively
AMF biodiversity, as it occurred also with the others organic treatments.
In conclusion, agriculture management practices like the use of different organic
fertilizers, soil tillage, etc., always interact with crop biological factors, as AMF
(Ngosong et al., 2010), highlighting the need for farmers to always consider the crops
related to their implication on soil microbial communities. This, in a sustainable
agriculture, is essential to preserve crop associated microorganisms involved in plant
growth and soil fertility.
Effects of organic fertilizers on arbuscular mycorrhizal fungi
209
6.5 References
Al-Karaki G.N., Hammad R., Rusan M., 2001. Response of two tomato cultivars
differing in salt tolerance to inoculation with mycorrhizal fungi under salt stress.
Mycorrhiza 11:43-47.
Alloush G.A., Clark R.B., 2001. Maize response to phosphate rock and arbuscular
mycorrhizal fungi in acidic soil. Communications in Soil Science and Plant
Analysis 32:231-254.
Augé R.M., Duan X., Ebel R.C., Stodola A.J.W., 1994. Non hydraulic signalling of
soil drying in mycorrhizal maize. Planta 193:74-82.
Azaizeh H.A., Marschner H., Römheld V., Wittenmayer L., 1995. Effects of a
vesicular-arbuscular mycorrhizal fungus and other soil microorganisms on growth,
mineral nutrient acquisition and root exudation of soil grown maize plants.
Mycorrhiza 5:321-327.
Bending G.D., Turner M.K., Rayns F., Marx M.C., Wood M., 2004. Microbial and
biochemical soil quality indicators and their potential for differentiating areas
under contrasting agricultural management regimes. Soil Biology and Biochemistry
36:1785-1792.
Boehm M.M., Anderson D.W., 1997. A landscape-scale study of soil quality in three
prairie farming systems. Soil Science Society of America Journal 61:1147-1159.
Borie F., Rubio R., Rouanet J.L., Morales A., Borie G., Rojas C., 2006. Effects of
tillage systems on soil characteristics, glomalin and mycorrhizal propagules in a
Chilean Ultisol. Soil and Tillage Research 88:253-261.
Burrows R.L., Pfleger F.L., 2002. Arbuscular mycorrhizal fungi respond to
increasing plant diversity. Canadian Journal of Botany 80:120-130.
Chapin F.S., 1991. Effects of multiple environmental stresses on nutrient availability
and use Accademy press , San Diego, CA pp 67-88.
De Clerck F., Singer M.J., Lindert P., 2003. A 60-year history of California soil
quality using paired samples. Geoderma 114:215-230.
Chapter 6 .
210
Degens B.P., Sparling G.P., Abbott L.K., 1996. Increasing the length of hyphae in a
sandy soil increases the amount of water-stable aggregates. Applied Soil Ecology
3:149-159.
Diaz G., Azcon Aguilar, C., Honrubia M., 1996. Influence of arbuscular mycorrhizae
on heavy metal (Zn and Pb) uptake and growth of Lygeum spartum and Anthyllis
cytisoides. Plant and Soil 180:241-249.
Douds D.D., Galvez L., Franke-Snyder M., Reider C., Drinkwater L.E., 1997. Effect
of compost addition and crop rotation point upon VAM fungi. Agriculture,
Ecosystems and Environment 65:257-266.
Douds D.D., Janke R.R., Peters S.E., 1993. VAM fungus spore populations and
colonization of roots of maize and soybean under conventional and low-input
sustainable agriculture. Agriculture, Ecosystems and Environment 43:325-335.
Eason W.R., Scullion J., Scott E.P., 1999. Soil parameters and plant responses
associated with arbuscular mycorrhizas from contrastino grassland management
regimes. Agriculture, Ecosystems and Environment 73:245-255.
Faber B.A., Zasoski R.J., Burau R.G., Uriu K., 1990. Zinc uptake by corn as affected
by vesicular-arbuscular mycorrhizae. Plant and Soil 129:121-130.
Feng G., Zhang F.S., Li X.L., Tian C.Y., Tang C., Rengel Z., 2002. Improved
tolerance of maize plants to salt stress by arbuscular mycorrhiza is related to higher
accumulation of soluble sugars in roots. Mycorrhiza 12:185-190.
Fitter A.H., Moyersoen B., 1996. Evolutionary trends in root-microbe symbioses.
Philosophical Transactions: Biological Sciences 351:1367-1375.
Galvez L., Douds Jr. D.D., Drinkwater L.E., Wagoner P., 2001. Effect of tillage and
farming system upon VAM fungus populations and mycorrhizas and nutrient
uptake of maize. Plant and Soil 118:299-308.
Gange A.C., West H.M., 1994. Interactions between arbuscular mycorrhizal fungi
and foliar-feeding insects in Plantago lanceolata L. New Phytologist 128:79-87.

Effects of organic fertilizers on arbuscular mycorrhizal fungi
211
George E., Marschner H., Jakobsen I., 1995. Role of arbuscular mycorrhizal fungi in
uptake of phosphorus and nitrogen from soil. Critical Reviews in Biotechnology
15:257-270.
Giovanetti M. and Mosse B., 1980. An evolution of techniques for measuring
vesicular arbuscular mycorrhizal infection in roots. New Phytologist 84:489-499.
Gosling P., Hodge A., Goodlass G., Bending G.D., 2006. Arbuscular mycorrhizal
fungi and organic farming. Agriculture, Ecosystem and Environment 113:17-35.
Goulart B.L., Demchak K., Yang W.Q., 1995. Organic matter and nitrogen level
effects on mycorrhizal infection in „Bluecrop‟ highbush blueberry plants. Journal
of Small Fruit & Viticulture 3:151-164.
Harinikumar K.M. and Bagyaraj D.J., 1989. Effect of cropping sequence, fertilizers
and farmyard manure on vesicular-arbuscular mycorrhizal fungi in different crops
over three consecutive seasons. Biology and Fertility of Soils 7:173-175.
Hayman D.S., 1982. Influence of soil and fertility on activity and survival of
vesicular-arbuscular mycorrhizal fungi. Phytopathology 72:1119-1125.
Helgason T., Daniell T.J., Husband R., Fitter A.H., Young J.P.W., 1998. Ploughing
up the wood-wide web? Nature 394:431.
Hodge A., 2000. Microbial ecology of the arbuscular mycorrhiza. FEMS
Microbiology Ecology 32:91-96.
Hodge A., Campbell C.D., Fitter A.H., 2001. An arbuscular mycorrhizal fungus
accelerates decomposition and acquires nitrogen directly from organic material.
Nature 413:297-299.
Joner E.J., 2000. The effect of long-term fertilization with organic or inorganic
fertilizers on mycorrhiza-mediated phosphorus uptake in subterranean clover.
Biology and Fertility Soils 32:435-440.
Kabir Z., O‟Halloran I.P., Fyles J.W., Hamel C., 1998. Dynamics of the mycorrhizal
symbiosis of corn (Zea mays L.), effects of host physiology, tillage practice and
fertilization on spatial distribution of extra-radical mycorrhizal hyphae in the field.
Agriculture, Ecosystems and Environment 68:151-163.
Chapter 6 .
212
Kahiluoto H. and Vestberg M., 1998. The effect of arbuscular mycorrhiza on biomass
production and phosphorus uptake from sparingly soluble sources by leek (Allium
porrum L.) in Finnish field soils. Biology, Agriculture and Horticulture16, 65-85.
Kogelmann W.J., Lin H.S., Bryant R.B., Beege D.B., Wolf A.M., Petersen G.W.,
2004. A state wide assessment of the impacts of phosphorus-index implementation
in Pennsylvania. Journal of Soil and Water Conservation 59:9-18.
Koide R., 1991. Nutrient supply, nutrient demand and plant-response to mycorrhizal
infection. New Phytologist 117:365-386.
Kothari S.K., Marschner H., Römheld V., 1991a. Contribution of the VA mycorrhizal
hyphae in acquisition of phosphorus and zinc by maize grown in calcareous soil.
Plant and Soil 131:177-185.
Krivtsov V., Griffiths B.S., Salmond R., Liddell K., Garside A., Bezginova T.,
Thompson J.A., Staines H.J., Watling R., Palfreyman J.W., 2004. Some aspects of
interrelations between fungi and other biota in forest soil. Mycological Research
108:933-946.
Li X.L., Marschner H., George E., 1991. Acquisition of phosphorus and copper by
VA-mycorrhizal hyphae and root-to-shoot transport in white clover. Plant and Soil
136:49-57.
Lingua G., D‟Agostino G., Massa N., Antosiano M., Berta G., 2002. Mycorrhiza-
induced differential response to a yellows disease in tomato. Mycorrhiza 12:191-
198.
Liu A., Hamel C., Hamilton R.I., Ma B.L., Smith D.L., 2000. Acquisition of Cu, Zn,
Mn and Fe by mycorrhizal maize (Zea mays L.) grown in soil at different P and
micronutrient levels. Mycorrhiza 9:331-336.
Lovelock C.E., Wright S.F., Nichols K.A., 2004b. Using glomalin as an indicator for
arbuscular mycorrhizal hyphal growth: an example from a tropical rain forest soil.
Soil Biology and Biochemistry 36:1009-1012.
Effects of organic fertilizers on arbuscular mycorrhizal fungi
213
Menéndez A.B., Scervino J.M., Godeas A.M., 2001. Arbuscular mycorrhizal
populations associated with natural and cultivated vegetation on a site of Buenos
Aires province, Argentina. Biology and Fertility of Soils 33:373-381.
Miller R.L. and Jackson L.E., 1998. Survey of vesicular-arbuscular mycorrhizae in
lettuce production in relation to management and soil factors. Journal of Soil and
Water Conservation 130:173-182.
Millner P.D. and Wright S.F., 2002. Tools for support of ecological research on
arbuscular mycorrhizal fungi. Symbiosis 33:101-123.
Mohammad M.J., Malkawi H.I., Shibli R., 2003. Effects of mycorrhizal fungi and
phosphorus fertilization on growth and nutrient uptake of barley grown on soils
with different levels of salts. Journal of Plant Nutrition 26:125-137.
Newman E.I., Reddell P., 1987. The distribution of mycorrhizas among the families
of vascular plants. New Phytologist 106:745-751.
Newsham K.K., Fitter A.H., Watkinson A.R., 1995. Multi-functionality and
biodiversity in arbuscular mycorrhizas. Trends Ecology and Evolution 10:407-411.
Ngosong C., Jarosch M., Raupp J., Neumann E, Ruess L., 2010. The impact of
farming practice on soil microorganisms and arbuscular mycorrhizal fungi: Crop
type versus long-term mineral and organic fertilization. Applied Soil Ecology
46:134-142
O‟Donnell A.G., Seasman M., Macrae A., Waite I., Davies J.T., 2001. Plants and
fertilisers as drivers of change in microbial community structure and function in
soils. Plant and Soil 232:135-145.
Oehl F., Sieverding E., Ineichen K., Mader P., Wiemken A., Boller T., 2009. Distinct
sporulation dynamics of arbuscular mycorrhizal fungal communities from different
agroecosystems in long-term microcosms. Agriculture, Ecosystems and
Environment 134:257-268.
Chapter 6 .
214
Oehl F., Sieverding E., Ineichen K., Mader P., Boller T., Wiemken A., 2003. Impact
of land use intensity on the species diversity of arbuscular mycorrhizal fungi in
agroecosystems of central Europe. Applied Environmental Microbiology 69:2816-
2824.
Oehl F., Sieverding E., Mader P., Dubois D., Ineichen K., Boller T., Wiemken A.,
2004. Impact of long-term conventional and organic farming on the diversity or
arbuscular mycorrhizal fungi. Oecologia 138:574-583.
Phillips J.M., Hayman D.S., 1970. Improved procedures for clearing roots and
staining parasitic and vesicular-arbuscular mycorrhizal fungi for rapid assessment
of infection. Transactions of the British Mycological Society 55:158-161.
Pozo M.J., Cordier C., Dumas-Gaudot E., Gianinazzi S., Barea J.M., Azcòn-Aguilar
C., 2002. Localized versus systemic effect of arbuscular mycorrhizal fungi on
defence responses to Phytophthora infection in tomato plants. Journal of
Experimental Botany 53:525-534.
Rillig M.C., Mummey D.L., 2006. Mycorrhizas and soil structure. New Phytologist
171:41-53.
Rosier C.L., Hoye A.T., Rillig M.C., 2006. Glomalin-related soil protein: assessment
of current detection and quantification tools. Soil Biology and Biochemistry
38:2205-2211.
Ryan M.H. and Ash J., 1999. Effects of phosphorus and nitrogen on growth of
pasture plants and VAM fungi in SE Australian soils with contrastino fertiliser
histories (conventional and biodynamic). Agriculture, Ecosystems and
Environment 73:51-62.
Ryan M.H., Derrick J.W., Dann P.R., 2004. Grain mineral concentrations and yield
of wheat grown under organic and conventional management. Journal of the
Science of Food and Agriculture 84:207-216.
Ryan M.H., Small D.R., Ash J.E., 2000. Phosphorus controls the level of colonisation
by arbuscular mycorrhizal fungi in conventional and biodynamic irrigated dairy
pastures. Australian Journal of Experimental Agriculture 40:663- 670.
Effects of organic fertilizers on arbuscular mycorrhizal fungi
215
Sanders F.E., Tinker P.B., 1971. Mechanism of absorption of phosphate from soil by
Endogone mycorrhizas. Nature 233:278-279.
SAS Institute, 2008. SAS/STAT Users‟ Guide. Release 6.08. Ed. SAS, Cary, NC.
Scagel C.F., 2005. Inoculation with ericoid mycorrhizal fungi alters fertilizer use of
highbush blueberry cultivars. HortScience 40:786-794.
Schüssler A., Schwarzott D., Walker C., 2001. A new fungal phylum, the
Glomeromycota: phylogeny and evolution. Mycological Research 105:1413-1421.
Shetty K.G., Hetrick B.A.D., Schwab A.P., 1995. Effects of mycorrhizae and
fertilizer amendments on zinc tolerance of plants. Environmental Pollution 88:307-
314.
Sieverding E., 1991. Vesicular-Arbuscular Mycorrhiza management in tropical
agroecosystems. Deutshe Gesellschaft Technische Zusammenarbeit (GTZ) GmbH,
Eschborn, Germany, 371 pp..
Smith S.E. and Read D.J., 1997. Mycorrhizal Symbiosis. 2nd edn. Academic Press,
London
Tisdall J.M., 1991. Fungal hyphae and structural stability of soil. Australian Journal
of Soil Research 29:729-743.
Treseder K.K. and Allen M.F., 2002. Direct nitrogen and phosphorus limitation of
arbuscular mycorrhizal fungi, a model and field test. New Phytologist 155:507-
515.
van Bruggen A.H.C., Semenov A.M., 2000. In search of biological indicators for soil
health and disease suppression. Applied Soil Ecology 15:13-24.
Withers P.J.A., Edwards A.C., Foy R.H., 2001. Phosphorus cycling in UK agriculture
and implications for phosphorus loss from soil. Soil Use and Management 17:139-
149.
Wright S.F., Franke-Snyder M., Morton J.B., Upadhyaya A., 1996. Time-course
study and partial characterization of a protein on hyphae of arbuscular mycorrhizal
fungi during active colonization of roots. Plant and Soil 181:193-203.

Chapter 6 .
216
Wright S.F., Green V.S., Cavigelli M.A., 2007. Glomalin in aggregate size classes
from three different farming systems. Soil and Tillage Research 94:546-549.
Wright S.F., Upadhyaya A., 1998. A survey of soils for aggregate stability and
glomalin, a glycoprotein produced by hyphae of arbuscular mycorrhizal fungi.
Plant and Soil 198:97-107.
217
Chapter 7
General conclusions
Intensive agriculture management determined a worsening of soil fertility in farms
sited in the Piana of Sele River in Campania Region, in South Italy, where under
plastic cover crops were cultivated for long-term,. A clear decrease in organic carbon
content and a strong depletion of enzyme activities were mainly detected in the
twenty soils monitored in this study. As no organic amendments were provided to
these soils since several years, these results confirmed that one of the most relevant
causes of soil degradation, in terms of fertility declining, are the loss and the
consequent deficiency of organic matter.
In the second phase of the present study an experimental design was set up in order to
compare the effects of different organic amendments on soil chemical and
biochemical properties of two farms selected among those previously monitored. All
the used organic amendments determined positive effects on soil chemical properties,
and in particular on the recovery of organic carbon in both studied soils. However, a
better response was obtained in the Farm 1, where soil clayey nature contributed to
maintain high the achieved OM levels after one year, confirming the determinant role
of soil geopedologic properties. Also in the Farm 2, characterized by a sandy soil, a
significant OM recovery was observed, but not so stable as in the Farm 1 over time.
Nevertheless it was not possible to discriminate between the organic amendments
utilized in this study in terms of better performance neither to establish the more
suitable dose inducing the higher advantages to soil properties. The presence of wood
scraps in the amendment mixtures certainly contributed to maintain high the organic
C content. More recalcitrant materials favoured a slight increase of C/N ratio and, as
their decomposition slowly occurred, guaranteed a continuous organic carbon
restoring in soils in long-term. Organic amendments modified the enzyme activity of
treated soils and the use of enzymes as indicators of the change in soil quality was
particularly useful. Through statistical analysis, chemical as well as biochemical

Chapter 7 .
218
properties of both soils were separated in clusters in according to samplings,
indicating a ready and positively effects of organic amendments.
Spectroscopic studies performed on humic and fulvic acids extracted from differently
amended soils gave interesting information about the chemical changes occurred in
OM upon the treatment. 13
C CPMAS NMR analysis showed changes in functional
group composition of soil OM. More labile OM fractions, such as carbohydrates,
lipids decreased through the experiment, in particular, the faster OM degradation in
F2 soils was confirmed. On the other hand, recalcitrant hydrophobic molecules, such
as lignin and lignin like compounds, were preserved highlighting the important role
of woody fractions mixed in the used amendments in the OM mineralization rate.
The enrichment of amendment mixture with wood scraps was determinant choice,
that led to results in disagreement with previous research, in which the OM loss was
found in study also by the addition of high compost doses. However it will be very
interesting to follow the second year of this ongoing study and the further results.
Finally the study carried out on the relationship between red guano and lupine flour,
as organic fertilizers, and indigenous AMF in lettuce plants in a Chilean soil
confirmed the positive effects of these amendments on soil biodiversity and, in
particular, on AMF development, although the nature of the used organic fertilizers
had a crucial role. Among studied lettuces the cultivar Milanesa showed the best
performace in terms of growth upon organic fertilization and no negative effects on
the indigenous AMF development.
In conclusion, it needs to think about the long-term implications of farming practices
and the broad interactions and dynamics of agricultural systems. A key goal is to
understand agriculture from an ecological perspective — in terms of nutrient and
energy dynamics, and interactions among plants, microorganisms, insects, etc. in
agroecosystems — then balance it with economic and social needs. In according to
sustainable agriculture it is possible to optimize skills and technology to achieve
long-term stability of the agricultural management, environmental protection, and

General conclusions
219
consumer safety, by minimizing adverse impacts to the immediate and off-farm
environments while providing a sustained level of production and soil fertility.

Chapter 7 .
220

221
Acknowledgements
Molteplici sono le persone che in una maniera o nell‟altra hanno contribuito a questa
tesi, con piccoli o grandi aiuti, spesso con parole o suggerimenti, alle volte
inconsciamente. Il mio ringraziamento va a tutti loro.
Se è vero che questi sono stati tre anni caratterizzati da eventi speciali e, se alla fine
questa tesi in qualche maniera sarà speciale, è grazie alla persona che mi accompagna
dall‟inizio della mia carriera universitaria, che con i Suoi consigli, le sue meticolose
revisioni e l‟immancabile appoggio scientifico e morale è stata la tutor di questo
percorso scientifico. Un sentito ringraziamento alla prof. Maria A. Rao.
Un ringraziamento va anche alla prof. Liliana Gianfreda, è anche grazie al suo aiuto
se questa tesi è giunta al termine, ma soprattutto è grazie a Lei che ho vissuto la mia
splendida esperienza in Cile. Parlando di Cile, non posso non ricordare la prof. Maria
de la Luz Mora Gil, coordinatrice di questo dottorato in Cile, a cui va il mio grazie
per l‟accoglienza e la disponibilità dimostrate.
Se il fantastico mondo delle micorrize è entrato a far parte dei miei studi di dottorato
è grazie al prof. Fernando Borie e al dr. Pablo Cornejo Rivas, che mi hanno sempre
supportato ed aiutato durante le mie ricerche presso il Departamento de Ciencias
Químicas, Universidad de la Frontera, facendomi sentire come a casa. Cosi come
Sebastian, Alex, Gustavo e Maria José, che oltre che ad essere compagni di lavoro,
sono stati i migliori compagni di vita che avrei potuto trovare dall‟altra parte del
mondo.
Gli studi del mio dottorato mi hanno condotto in ambiti della ricerca del tutto nuovi,
come quelli della risonanza magnetica nucleare. Se oggi ho ampliato le mie
conoscenze sull‟NMR e la rilassometria e questi argomenti sono entrati a far parte di
questo lavoro, è grazie all‟aiuto insostituibile del prof. Pellegrino Conte e della dr.
Anne E. Berns, grazie sinceramente.
Come le opere di una certa importanza, anche questa ha visto partecipi un gran
numero di persone, senza le quali il risultato non sarebbe stato sicuramente lo stesso,
perché quando i grandi cadono, tocca ai piccoli guidare. Allora non posso
Acknowledgements . .
222
dimenticare la dr. Scelza, prima amica e poi compagna di lavoro, senza la quale le
mie ore trascorse in laboratorio sarebbero state sicuramente più vuote, grazie per il
tuo in mancabile appoggio.
Se parlo di laboratorio, non posso tralasciare tutte quelle persone che rendono il
DiSSPAPA unico per me, trasformando le noiose ore lavorative, in momenti unici.
Grazie, allora, a Barbara, Bianca, e Pietro, che mi hanno accompagnato oltre che
nella vita lavorativa, anche e soprattutto nella vita al di fuori del laboratorio, spero
sinceramente che tutto questo non termini mai.
Come non ringraziare Massimo, per il suo in mancabile supporto abitativo, e per le
bellissime ore trascorse insieme, ma soprattutto come non ringraziare Imma e
Barbara, le mie compagne di vita per quasi sei mesi, mai avrei immaginato di poter
trascorrere esperienza più entusiasmante con voi, grazie per avermi supportato e
“sopportato” nei momenti più difficili.
Parte dei risultati prodotti in questo lavoro sono stati resi possibili da persone che con
semplici consigli o parole mi hanno aiutato, tra queste non posso dimenticare Lina e
Anna, che hanno partecipato a pieno nel mio lavoro di ricerca, a Diana, Donato e
Riccardo, che mi hanno aiutato nei momenti più complessi di questi studi.
Ci sono persone per le quali la ricerca è passione, che è affascinante sentire parlare e
che mi hanno contagiato con la loro passione per la ricerca, dandomi sempre nuovi
motivi per andare avanti e nuove idee per raggiungere risultati sempre più alti, grazie
a tutti Voi.
Per ultima, ma non per importanza, la mia famiglia, che mi ha sempre supportato
nelle mie scelte e mi ha sempre dato una spalla a cui appoggiarmi nei momenti più
difficili, grazie di esistere.
Se è vero che il mio dottorato qui si conclude, si chiude un cerchio che ho iniziato a
tracciare tre anni fa, in questi tre anni mille eventi, positivi e negativi, si sono
susseguiti, è difficile trovare l‟inizio e la fine di tutto questo, ma spero sinceramente
che possa essere l‟inizio di una nuova avventura, perché solo attraverso le difficoltà si
possono raggiungere grandi traguardi, “Per Aspera Ad Astra”.
Acknowledgements
223
In conclusione, se ho dimenticato qualcuno in questo lungo elenco di ringraziamenti,
che non se la prenda a male, perché “Cento volte al giorno ricordo a me stesso che la
mia vita interiore e esteriore sono basate sulle fatiche di altri uomini, vivi e morti, e
che io devo sforzarmi al massimo per dare nella stessa misura in cui ho ricevuto.” (A.
Einstein).