Embed Size (px)
Citation preview
HAL Id: hal-03003212https://hal.archives-ouvertes.fr/hal-03003212
Submitted on 13 Nov 2020
HAL is a multi-disciplinary open accessarchive for the deposit and dissemination of sci-entific research documents, whether they are pub-lished or not. The documents may come fromteaching and research institutions in France orabroad, or from public or private research centers.
L’archive ouverte pluridisciplinaire HAL, estdestinée au dépôt et à la diffusion de documentsscientifiques de niveau recherche, publiés ou non,émanant des établissements d’enseignement et derecherche français ou étrangers, des laboratoirespublics ou privés.
Effects of the chlorination and pressure flushing ofdrippers fed by reclaimed wastewater on biofouling
Kevin Lequette, Nassim Ait-Mouheb, Nicolas Adam, Marine Muffat-Jeandet,Valérie Bru-Adan, Nathalie Wery
To cite this version:Kevin Lequette, Nassim Ait-Mouheb, Nicolas Adam, Marine Muffat-Jeandet, Valérie Bru-Adan, et al..Effects of the chlorination and pressure flushing of drippers fed by reclaimed wastewater on biofouling.Science of the Total Environment, Elsevier, 2021, 758, pp.143598. �10.1016/j.scitotenv.2020.143598�.�hal-03003212�
Journal Pre-proof
Effects of the chlorination and pressure flushing of drippers fed byreclaimed wastewater on biofouling
Kévin Lequette, Nassim Ait-Mouheb, Nicolas Adam, MarineMuffat-Jeandet, Valérie Bru-Adan, Nathalie Wéry
PII: S0048-9697(20)37129-1
DOI: https://doi.org/10.1016/j.scitotenv.2020.143598
Reference: STOTEN 143598
To appear in: Science of the Total Environment
Received date: 17 July 2020
Revised date: 29 October 2020
Accepted date: 29 October 2020
Please cite this article as: K. Lequette, N. Ait-Mouheb, N. Adam, et al., Effects of thechlorination and pressure flushing of drippers fed by reclaimed wastewater on biofouling,Science of the Total Environment (2020), https://doi.org/10.1016/j.scitotenv.2020.143598
This is a PDF file of an article that has undergone enhancements after acceptance, suchas the addition of a cover page and metadata, and formatting for readability, but it isnot yet the definitive version of record. This version will undergo additional copyediting,typesetting and review before it is published in its final form, but we are providing thisversion to give early visibility of the article. Please note that, during the productionprocess, errors may be discovered which could affect the content, and all legal disclaimersthat apply to the journal pertain.
© 2020 Published by Elsevier.
Effects of the chlorination and pressure flushing of drippers fed by reclaimed wastewater on
biofouling
Kévin Lequette1-2
, Nassim Ait-Mouheb2, Nicolas Adam
3, Marine Muffat-Jeandet
2, Valérie
Bru-Adan1, Nathalie Wéry
1
1INRAE, University of Montpellier, LBE, 102, Avenue des Etangs, 11100 Narbonne, France;
2INRAE, University of Montpellier, UMR G-EAU, Avenue Jean-François Breton, 34000
Montpellier, France ; 3University of Toulouse, Centre de recherche Cerveau et Cognition,
31000 Toulouse, France
Correspondence: [email protected]
Tel.: +33 (0)4 68 42 51 86
Jour
nal P
re-p
roof
Journal Pre-proof
Abstract
Milli-channel baffle labyrinths are widely used in drip irrigation systems. They induce
a pressure drop enabling drip irrigation. However, with a section thickness that is measured in
mm², they are sensitive to clogging, which reduces the performance and service life of a drip
irrigation system. The impact of chlorination (1.5 ppm of free chlorine during 1 h application)
and pressure flushing (0.18 MPa) on the biofouling of non-pressure-compensating drippers, fed
by real reclaimed wastewater, was studied at lab scale using Optical Coherence Tomography.
The effect of these treatments on microbial composition (bacteria and eukaryotes) was also
investigated by High-throughput DNA sequencing. Biofouling was mainly observed in the
inlet, outlet and return areas of the milli-labyrinth channel from drippers. Chlorination
reduced biofilm development, particularly in the mainstream of the milli-labyrinth channel,
and it was more efficient when combined with pressure flushing. Moreover, chlorination was
more efficient in maintaining water distribution uniformity (CU <95% compared to less than
85% for unchlorinated lines). It reduced more efficiently the bacterial concentration (≈ 1 log)
and the diversity of the bacterial community in the dripper biofilms compared to the pressure
flushing method. This latter significantly modified the microbial communities, promoting
chlorine-resistant bacteria such as Comamonadaceae or Azospira. Inversely, several bacterial
groups were identified as sensitive to chlorination such as Chloroflexi and Planctomycetes.
Nevertheless, one month after stopping the treatments bacterial diversity recovered and the
chlorine-sensitive bacteria such as Chloroflexi phylum and the Saprospiraceae,
Spirochaetaceae, Christensenellaceae and Hydrogenophilaceae families re-emerged in
conjunction with the growth of biofouling, highlighting the resilience of the bacteria
originating from drippers. Based on PCoA analyses, the structure of the bacterial communities
still clustered separately from non-chlorinated drippers, showing that the effect of chlorination
was still detectable one month after stopping the treatment.
Jour
nal P
re-p
roof
Journal Pre-proof
Keywords: Drip irrigation; biofilm; cleaning methods, Optical Coherence Tomography;
High-throughput DNA sequencing, water reuse
Jour
nal P
re-p
roof
Journal Pre-proof
1. Introduction
Due to the scarcity of water resources, the use of reclaimed wastewater for crop
irrigation is significantly increasing worldwide, particularly in arid and semi-arid countries
(Ait-mouheb et al., 2020). Drip irrigation, combined with the use of reclaimed wastewater,
has several advantages, as it provides water to the plant (e.g. roots) in optimal quantities and
frequencies for plant growth (Goyal, 2018; Wang et al., 2013). The drippers are generally
characterized by a narrow labyrinth channel (internal flow section around 1 mm², which
enables the development of a turbulent regime composed of a main high velocity flow and
vortex zones in channel corners (Al-Muhammad et al., 2019, 2016; Wei et al., 2012). This
milli-labyrinth flow path can become clogged by suspended particles, chemical precipitation
and biofilms (Green et al., 2018; Y. Li et al., 2019; Oliveira et al., 2017, 2020; Rizk et al.,
2019; Zhou et al., 2018). Dripper clogging not only greatly reduces irrigation uniformity, but
also affects crops, by severely limiting the large-scale development of drip irrigation.
Biofouling caused by biofilm growth, increases physical and chemical clogging (Li et al.,
2013; Tarchitzky et al., 2013), and is considered a key factor in the clogging of drip irrigation
systems using reclaimed wastewater (Song et al., 2017; Wang et al., 2017). Therefore, the
evaluation of methods to control and limit the development of biofilms in these systems is
necessary (Lamm et al., 2007).
Existing methods used to reduce clogging include precipitation, filtration, chlorination,
acidification and pressure flushing (Duran-Ros et al., 2009; Katz et al., 2014; Puig-Bargués et
al., 2010; Song et al., 2017). Although chlorination has been recognised as the least expensive
method to treat biological-growth related clogging, the chlorination schemes recommended in
the scientific literature differ according to the type of reagent used (liquid sodium
hypochlorite (NaOCl), calcium hypochlorite (Ca(OCl)2), gaseous chlorine (Cl2)), the
Jour
nal P
re-p
roof
Journal Pre-proof
concentration and injection interval application (Goyal, 2018; Rav-Acha et al., 1995). Indeed,
chlorination can be applied in concentrations ranging from 0.4 ppm (Batista et al., 2009) to
more than 100 ppm (Chauhdary et al., 2015). Both chlorine concentrations and injection
frequency have an impact on clogging reduction efficiency. However, the application of high
chlorine concentrations can intensify clogging by releasing clogging constituents that were
previously stuck to the pipe wall (Rav-Acha et al., 1995), and can negatively impact crop
growth, since a high chlorine concentrations in the soil may lead to toxicity (Li and Li, 2009).
Therefore, the use of low free-chlorine concentrations (1–2 ppm) at repeated frequencies
(weekly, twice a week) has proven its effectiveness in limiting dripper fouling (J. Li et al.,
2010; Li et al., 2012; Song et al., 2017). Other studies have shown that the over frequent use
of chlorine (once or twice a week) can also promote the development of a biofilm resistant to
chlorination (J. Li et al., 2010). However, little is known about the mechanisms and
microorganisms involved in this process. An in-depth analysis of the chlorination effects on
the microbiome of drippers would be required to better understand the mechanisms of biofilm
development and optimise the control of biofilm development (Zhou et al., 2017). Pressure
flushing consists in washing water pipelines by increasing the hydraulic shear force within the
pipe system. To be effective, flushing must be carried out often enough, and at an appropriate
velocity rate, to dislodge and transport accumulated sediment. The minimum flow velocity for
flushing the drip irrigation system is 0.3-0.6 m s-1
, in order to remove clogging and particulate
matter (Han et al., 2018; Lamm et al., 2007; Li et al., 2018). As for chlorination, the
frequency of flushing (weekly to monthly) directly influences the efficiency of the method
and the service life of the drip irrigation system (Lamm, 2013; Li et al., 2015, 2018; Puig-
Bargués et al., 2010). Flushing the system as often as possible is recommended (Lamm et al.,
2007), but this may favour the development of a flushing-resistant biofilm caused by specific
bacteria (Li et al., 2015). Thus, despite studies aimed at optimizing application parameters,
Jour
nal P
re-p
roof
Journal Pre-proof
the problem of clogging has yet to be fully resolved, and the mechanisms involved are poorly
understood.
The effectiveness of chlorination and pressure flushing methods on the biofouling of
drip irrigation systems is often studied, but generally separately. However, several studies on
drinking water systems have shown that when two methods are combined, they were more
effective in reducing the level of colonisation than when they were used separately (Mathieu
et al., 2014; Tsvetanova, 2020). Thus, studying the effects of these methods, when used
separately and in combination, will lead to a better understanding of the mechanisms
involved.
The objectives of the present study were to determine the effects of chlorination and
pressure flushing, when combined or used alone, on (1) biofilm kinetic development and (2)
on the microbial communities in biofilms formed in irrigation systems fed by reclaimed
wastewater (RWW). To evaluate if the effects of the treatments were transient or permanent,
biofilms were also analysed 1 month after stopping the cleaning operations. A non-destructive
optical time-monitoring observation system was developed to study biofilm growth in
commercial drippers (1 l.h-1
) by optical coherence tomography (OCT) (Lequette et al., 2020).
For the first time, the combined use of the OCT method and high-throughput sequencing
made it possible to monitor biofilm development according to the cleaning methods used,
while also evaluating the impact of these methods on the bacterial compositions. Although
eukaryotes can influence the formation and development of biofilms (Parry, 2004; Parry et al.,
2007), data on eukaryotes in drippers supplied by reclaimed wastewater remain scarce
(Dehghanisanij et al., 2005). Therefore, the impact of these cleaning methods on eukaryotes
was also investigated.
Jour
nal P
re-p
roof
Journal Pre-proof
2. Materials and Methods
Experimental setup
Experimental setup and irrigation procedure
Non-pressure-compensating (NPC) drippers (model D2000, Rivulis Irrigation SAS,
Lespinasse, France) with a flow rate of 1 l.h-1
(Table 1) were used. The NPC drippers were
placed in a transparent tube (internal diameter 15 mm, TubClair, Vitry-le-François, France),
so that the analysis of the biofilm development along the channel could be performed over
time without disturbance. More details on these experiments are presented in Lequette et al.
(2020). Four irrigation lines with nine dripper systems per line were placed on the test bench:
control (C-without cleaning events), a pressure flushing (PF), chlorination line (Cl) and
pressure flushing/chlorination (PFCl) (see Cleaning procedures for details). Each of the four
lines was connected to a separate tank (total volume 60l) and a pump (JetInox 82M, DAB,
Saint-Quentin-Fallavier, France) (Figure 1.B). A disk filter (mesh size 0.13mm) was installed
to reduce the physical clogging of emitters according to the technical recommendations for
this type of dripper. The inlet pressure was set at 0.08 MPa (nominal working dripper
pressure) using a pressure gauge. A gutter system, connected to each respective tank, was
installed below each lateral line to collect the water discharged from the drippers during the
experiments. The lines were supplied twice a day, five days per week for 1 h, with an interval
of 6h off. Discharge measurements were performed each week to evaluate emitter
performance and clogging. The relative average discharge of drippers (Li et al., 2015) was
used to assess the drip irrigation performance and was calculated in Equation 1:
∑
(1)
where qi0 indicated the nominal flow of drippers (l.h
-1), qi
t the measured flow rate (l.h
-
1) and n the total number of experimental emitters.
Jour
nal P
re-p
roof
Journal Pre-proof
The drippers were considered clogged when the outflow presented a discharge rate below
75% (Yu et al., 2018b).
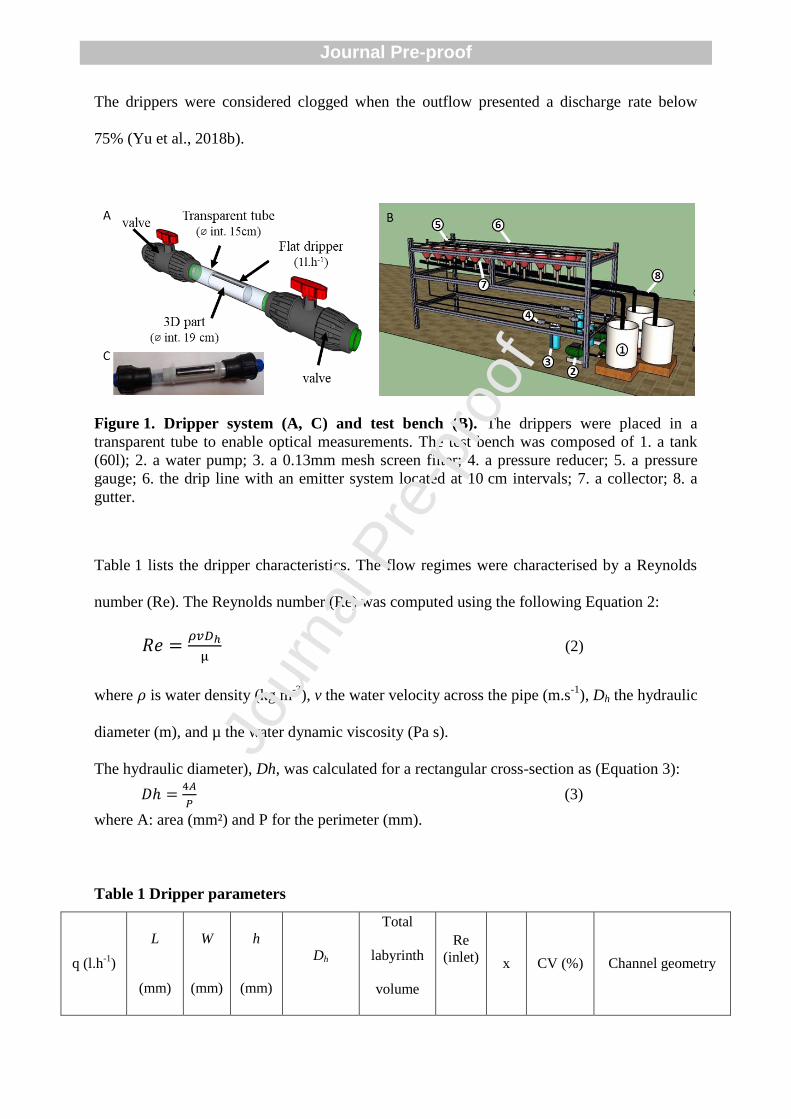
Figure 1. Dripper system (A, C) and test bench (B). The drippers were placed in a
transparent tube to enable optical measurements. The test bench was composed of 1. a tank
(60l); 2. a water pump; 3. a 0.13mm mesh screen filter; 4. a pressure reducer; 5. a pressure
gauge; 6. the drip line with an emitter system located at 10 cm intervals; 7. a collector; 8. a
gutter.
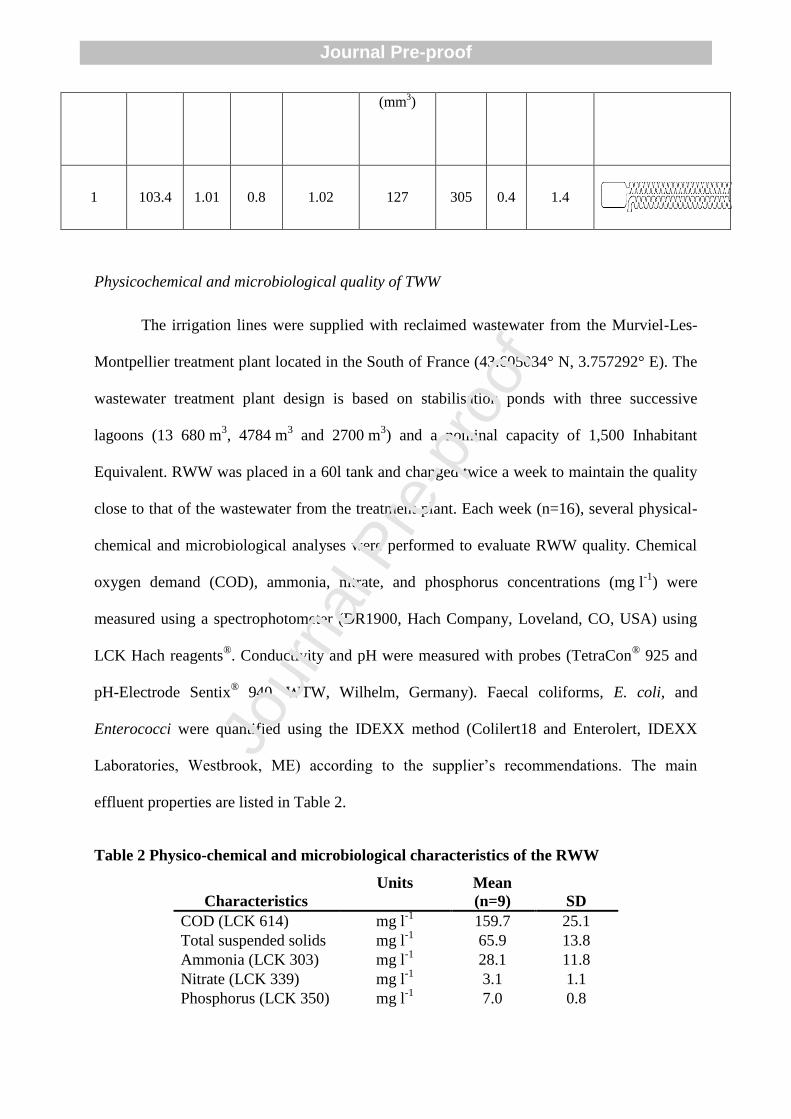
Table 1 lists the dripper characteristics. The flow regimes were characterised by a Reynolds
number (Re). The Reynolds number (Re) was computed using the following Equation 2:
(2)
where is water density (kg.m-3
), v the water velocity across the pipe (m.s-1
), Dh the hydraulic
diameter (m), and µ the water dynamic viscosity (Pa s).
The hydraulic diameter), Dh, was calculated for a rectangular cross-section as (Equation 3):
(3)
where A: area (mm²) and P for the perimeter (mm).
Table 1 Dripper parameters
q (l.h-1
)
L
(mm)
W
(mm)
h
(mm)
Dh
Total
labyrinth
volume
Re
(inlet)
x CV (%) Channel geometry
Jour
nal P
re-p
roof
Journal Pre-proof
(mm3)
1 103.4 1.01 0.8 1.02 127 305 0.4 1.4
Physicochemical and microbiological quality of TWW
The irrigation lines were supplied with reclaimed wastewater from the Murviel-Les-
Montpellier treatment plant located in the South of France (43.605034° N, 3.757292° E). The
wastewater treatment plant design is based on stabilisation ponds with three successive
lagoons (13 680 m3, 4784 m
3 and 2700 m
3) and a nominal capacity of 1,500 Inhabitant
Equivalent. RWW was placed in a 60l tank and changed twice a week to maintain the quality
close to that of the wastewater from the treatment plant. Each week (n=16), several physical-
chemical and microbiological analyses were performed to evaluate RWW quality. Chemical
oxygen demand (COD), ammonia, nitrate, and phosphorus concentrations (mg l-1
) were
measured using a spectrophotometer (DR1900, Hach Company, Loveland, CO, USA) using
LCK Hach reagents®. Conductivity and pH were measured with probes (TetraCon
® 925 and
pH-Electrode Sentix® 940, WTW, Wilhelm, Germany). Faecal coliforms, E. coli, and
Enterococci were quantified using the IDEXX method (Colilert18 and Enterolert, IDEXX
Laboratories, Westbrook, ME) according to the supplier’s recommendations. The main
effluent properties are listed in Table 2.
Table 2 Physico-chemical and microbiological characteristics of the RWW
Characteristics
Units Mean
(n=9) SD
COD (LCK 614) mg l-1
159.7 25.1
Total suspended solids mg l-1
65.9 13.8
Ammonia (LCK 303) mg l-1
28.1 11.8
Nitrate (LCK 339) mg l-1
3.1 1.1
Phosphorus (LCK 350) mg l-1
7.0 0.8
Jour
nal P
re-p
roof
Journal Pre-proof
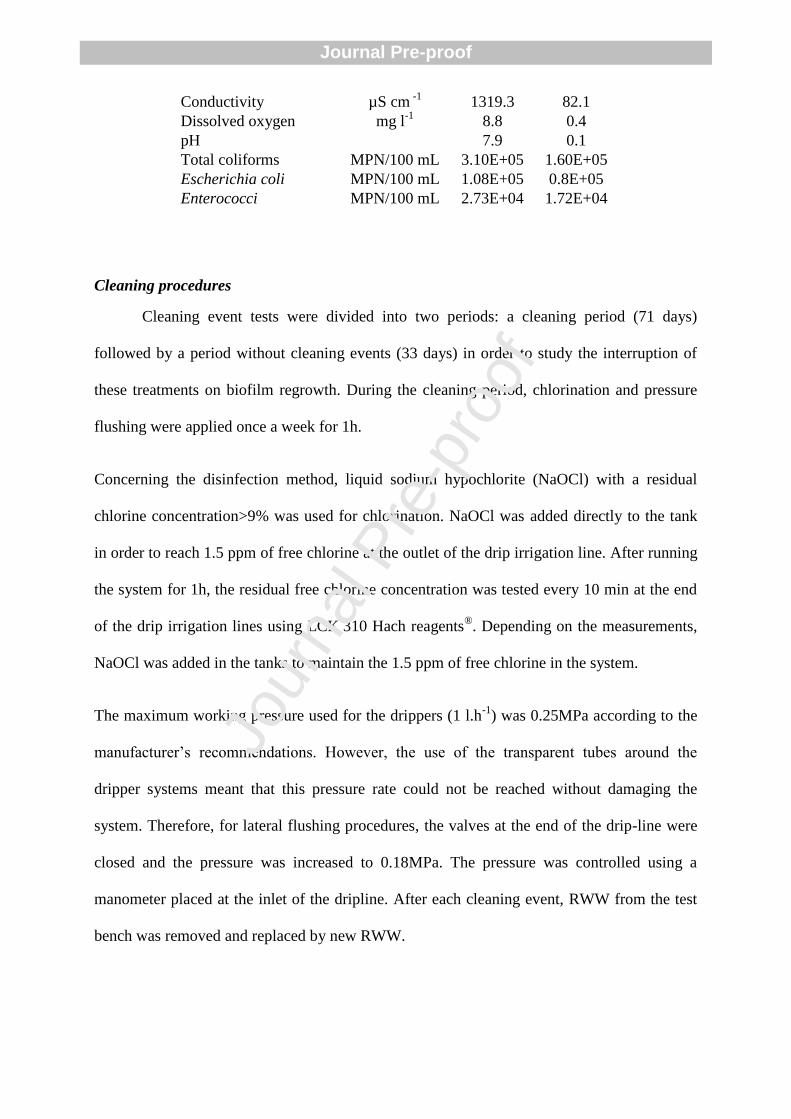
Conductivity µS cm -1
1319.3 82.1
Dissolved oxygen mg l-1
8.8 0.4
pH 7.9 0.1
Total coliforms MPN/100 mL 3.10E+05 1.60E+05
Escherichia coli MPN/100 mL 1.08E+05 0.8E+05
Enterococci MPN/100 mL 2.73E+04 1.72E+04
Cleaning procedures
Cleaning event tests were divided into two periods: a cleaning period (71 days)
followed by a period without cleaning events (33 days) in order to study the interruption of
these treatments on biofilm regrowth. During the cleaning period, chlorination and pressure
flushing were applied once a week for 1h.
Concerning the disinfection method, liquid sodium hypochlorite (NaOCl) with a residual
chlorine concentration>9% was used for chlorination. NaOCl was added directly to the tank
in order to reach 1.5 ppm of free chlorine at the outlet of the drip irrigation line. After running
the system for 1h, the residual free chlorine concentration was tested every 10 min at the end
of the drip irrigation lines using LCK 310 Hach reagents®. Depending on the measurements,
NaOCl was added in the tanks to maintain the 1.5 ppm of free chlorine in the system.
The maximum working pressure used for the drippers (1 l.h-1
) was 0.25MPa according to the
manufacturer’s recommendations. However, the use of the transparent tubes around the
dripper systems meant that this pressure rate could not be reached without damaging the
system. Therefore, for lateral flushing procedures, the valves at the end of the drip-line were
closed and the pressure was increased to 0.18MPa. The pressure was controlled using a
manometer placed at the inlet of the dripline. After each cleaning event, RWW from the test
bench was removed and replaced by new RWW.
Jour
nal P
re-p
roof
Journal Pre-proof
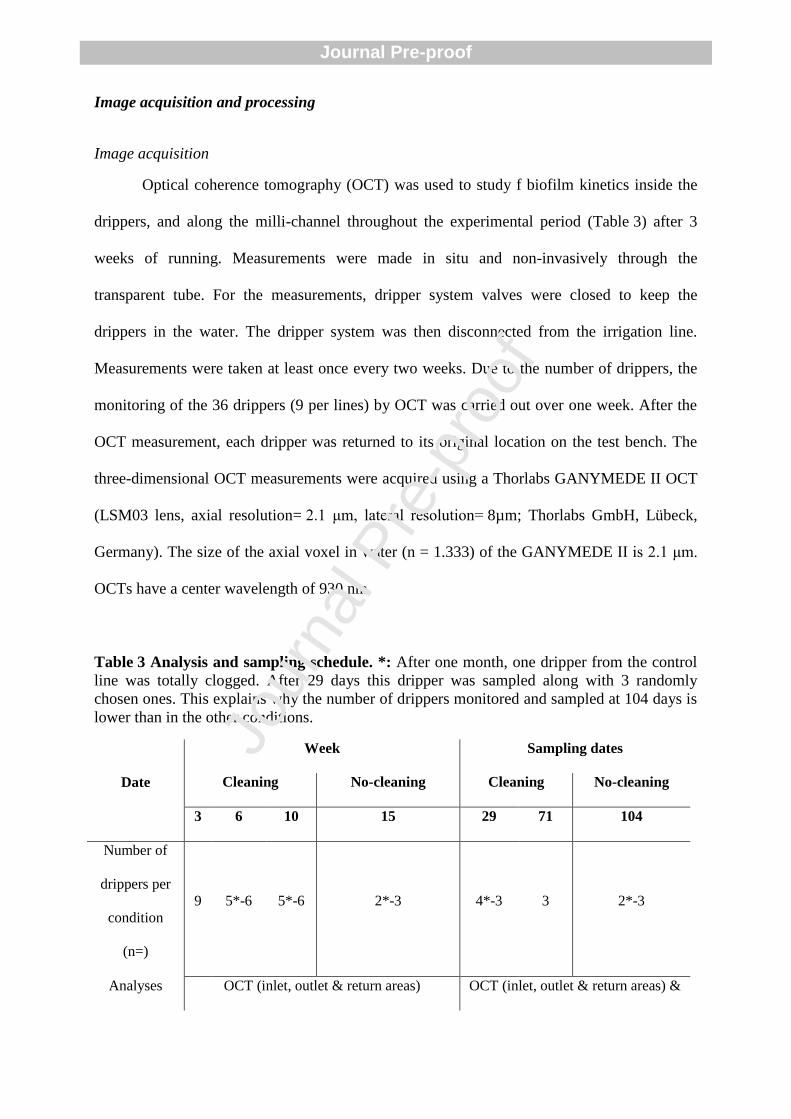
Image acquisition and processing
Image acquisition
Optical coherence tomography (OCT) was used to study f biofilm kinetics inside the
drippers, and along the milli-channel throughout the experimental period (Table 3) after 3
weeks of running. Measurements were made in situ and non-invasively through the
transparent tube. For the measurements, dripper system valves were closed to keep the
drippers in the water. The dripper system was then disconnected from the irrigation line.
Measurements were taken at least once every two weeks. Due to the number of drippers, the
monitoring of the 36 drippers (9 per lines) by OCT was carried out over one week. After the
OCT measurement, each dripper was returned to its original location on the test bench. The
three-dimensional OCT measurements were acquired using a Thorlabs GANYMEDE II OCT
(LSM03 lens, axial resolution= 2.1 μm, lateral resolution= 8µm; Thorlabs GmbH, Lübeck,
Germany). The size of the axial voxel in water (n = 1.333) of the GANYMEDE II is 2.1 μm.
OCTs have a center wavelength of 930 nm.
Table 3 Analysis and sampling schedule. *: After one month, one dripper from the control
line was totally clogged. After 29 days this dripper was sampled along with 3 randomly
chosen ones. This explains why the number of drippers monitored and sampled at 104 days is
lower than in the other conditions.
Date
Week Sampling dates
Cleaning No-cleaning Cleaning No-cleaning
3 6 10 15 29 71 104
Number of
drippers per
condition
(n=)
9 5*-6 5*-6 2*-3 4*-3 3 2*-3
Analyses OCT (inlet, outlet & return areas) OCT (inlet, outlet & return areas) &
Jour
nal P
re-p
roof
Journal Pre-proof
16S rRNA sequencing
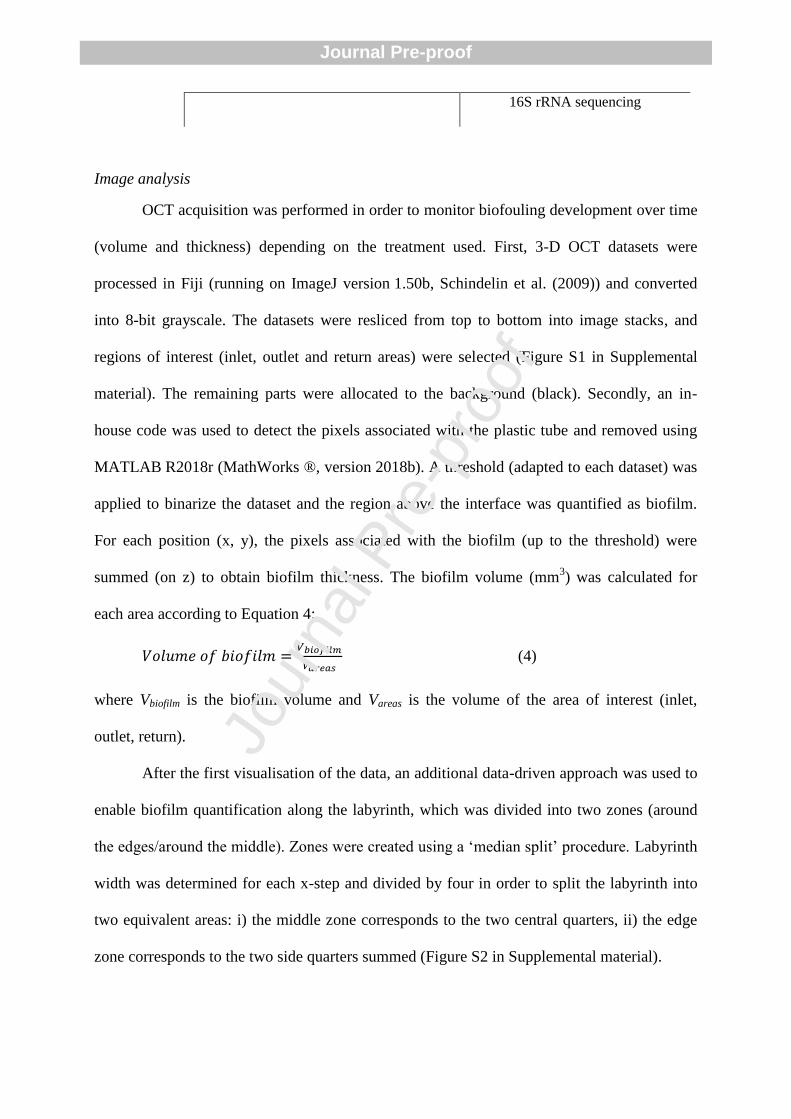
Image analysis
OCT acquisition was performed in order to monitor biofouling development over time
(volume and thickness) depending on the treatment used. First, 3-D OCT datasets were
processed in Fiji (running on ImageJ version 1.50b, Schindelin et al. (2009)) and converted
into 8-bit grayscale. The datasets were resliced from top to bottom into image stacks, and
regions of interest (inlet, outlet and return areas) were selected (Figure S1 in Supplemental
material). The remaining parts were allocated to the background (black). Secondly, an in-
house code was used to detect the pixels associated with the plastic tube and removed using
MATLAB R2018r (MathWorks ®, version 2018b). A threshold (adapted to each dataset) was
applied to binarize the dataset and the region above the interface was quantified as biofilm.
For each position (x, y), the pixels associated with the biofilm (up to the threshold) were
summed (on z) to obtain biofilm thickness. The biofilm volume (mm3) was calculated for
each area according to Equation 4:
(4)
where Vbiofilm is the biofilm volume and Vareas is the volume of the area of interest (inlet,
outlet, return).
After the first visualisation of the data, an additional data-driven approach was used to
enable biofilm quantification along the labyrinth, which was divided into two zones (around
the edges/around the middle). Zones were created using a ‘median split’ procedure. Labyrinth
width was determined for each x-step and divided by four in order to split the labyrinth into
two equivalent areas: i) the middle zone corresponds to the two central quarters, ii) the edge
zone corresponds to the two side quarters summed (Figure S2 in Supplemental material).
Jour
nal P
re-p
roof
Journal Pre-proof
Analysis of microbial communities
DNA extraction
DNA was extracted using the PowerWater® DNA Isolation Kit (Qiagen, Hilden,
Germany). The dripper and filter samples were placed in 5 ml tubes containing beads. The
manufacturer’s instructions were then followed. DNA concentrations were measured and
purity levels were estimated by spectrophotometry (Infinite NanoQuant M200, Tecan,
Austria). The extracted DNA was stored at -20 °C.
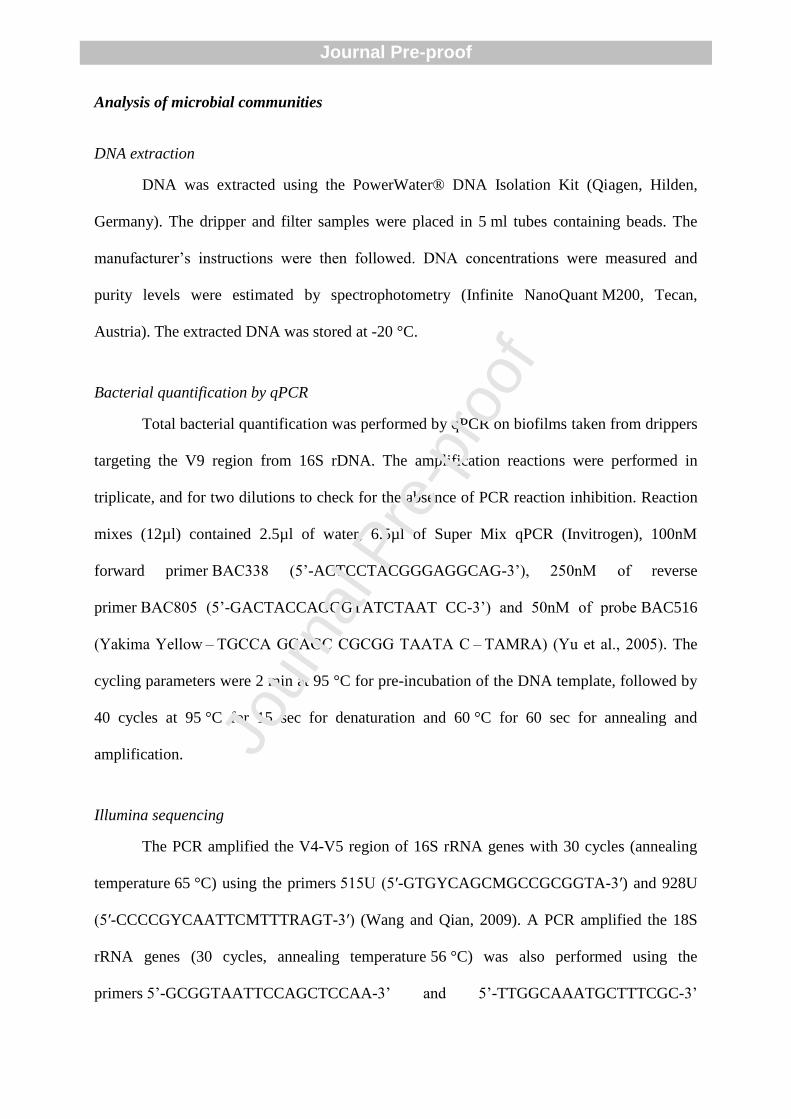
Bacterial quantification by qPCR
Total bacterial quantification was performed by qPCR on biofilms taken from drippers
targeting the V9 region from 16S rDNA. The amplification reactions were performed in
triplicate, and for two dilutions to check for the absence of PCR reaction inhibition. Reaction
mixes (12µl) contained 2.5µl of water, 6.5µl of Super Mix qPCR (Invitrogen), 100nM
forward primer BAC338 (5’-ACTCCTACGGGAGGCAG-3’), 250nM of reverse
primer BAC805 (5’-GACTACCAGGGTATCTAAT CC-3’) and 50nM of probe BAC516
(Yakima Yellow – TGCCA GCAGC CGCGG TAATA C – TAMRA) (Yu et al., 2005). The
cycling parameters were 2 min at 95 °C for pre-incubation of the DNA template, followed by
40 cycles at 95 °C for 15 sec for denaturation and 60 °C for 60 sec for annealing and
amplification.
Illumina sequencing
The PCR amplified the V4-V5 region of 16S rRNA genes with 30 cycles (annealing
temperature 65 °C) using the primers 515U (5′-GTGYCAGCMGCCGCGGTA-3′) and 928U
(5′-CCCCGYCAATTCMTTTRAGT-3′) (Wang and Qian, 2009). A PCR amplified the 18S
rRNA genes (30 cycles, annealing temperature 56 °C) was also performed using the
primers 5’-GCGGTAATTCCAGCTCCAA-3’ and 5’-TTGGCAAATGCTTTCGC-3’
Jour
nal P
re-p
roof
Journal Pre-proof
(Hadziavdic et al., 2014) on dripper biofilms at the end of the cleaning period. Adapters were
added for multiplexing samples during the second sequencing amplification step. The
resulting products were purified and loaded onto the Illumina MiSeq cartridge for sequencing
of paired 300 bp reads according to the manufacturer’s instructions (v3 chemistry).
Sequencing and library preparation tasks were performed at the Genotoul Lifescience
Network Genome and Transcriptome Core Facility in Toulouse, France (get.genotoul.fr).
Mothur (version 1.39.5) (Schloss et al., 2009) was used to associate forward and reverse
sequences and clustering at four different nucleotides over the length of the amplicon. Uchime
(Edgar et al., 2011) was used to identify and remove chimera. Sequences that appeared fewer
than three times in the entire data set were removed. In all, 16S rRNA sequences were aligned
using SILVA SSURef NR99 version 128 (Schloss et al., 2009). Finally, sequences with 97%
similarity were sorted into operational taxonomic units (OTUs) (Nguyen et al., 2016). The
chloroplast sequences from 16S rRNA sequences were removed from the raw data and
represented respectively 2.8% and 16.6% of the sequences in biofilms and RWW samples.
Finally, BLAST (http://www.ncbi.nlm.nih.gov/BLAST/) was used to locate publicly available
sequences closely related to the sequences obtained from the samples. A total of 2,281,644
reads were grouped in 3210 OTUs at the 97% similarity level. The rarefaction curves
indicated that the sequencing depths of all samples were satisfactory (Figure S3 in
Supplementary material).
Statistical analyses
Non-parametric statistical tests (Kruskal and Wilcoxon tests) were performed to
compare the biofilm volume and the biofilm distribution along the labyrinth depending on the
treatment used. The Shannon diversity index, the reciprocal Simpson index, and the
nonparametric richness estimator Chao1 were also calculated for each RWW and biofilm
sample. Chao1 richness estimates were based on singletons and doubletons as described by
Jour
nal P
re-p
roof
Journal Pre-proof
Chao1 (Chao, 1984). Kruskal-Wallis tests were performed to compare indices of diversity and
richness according to sample origin, and the biofouling rate between the drippers. To compare
bacterial community structures, a dissimilarity matrix (Bray-Curtis) was performed and
visualised using principal coordinate analysis (PCoA). A one-way analysis of similarities
(ANOSIM) was used to identify significant differences in community assemblage structure
between samples based on the origin of the sample (Clarke, 1993). The genera that contribute
most to the divergence between two habitats were identified using Similarity Percentage
(SIMPER) analysis (Clarke, 1993). The sequencing data analysis was processed under R v3.4
(www.r-project.org) through R-Studio (http://www.rstudio.com/) using the phyloseq package
(McMurdie and Holmes, 2012).
3. Results
Biofilm development kinetics under chlorination and pressure flushing treatments,
either combined or used separately, were monitored for 71 days using OCT measurements
and compared to each other as well as to non-treated controls. The drippers were collected
after 29 and 71 days in order to characterise the effect of these treatments on the bacterial
composition of the biofilms. After 71 days, the treatments were stopped, and drippers were
subsequently analysed at day 104 to evaluate if the effects of the treatments were permanent
or transitory.
Biofouling kinetic analysis
Dynamic changes in dripper outflow ratio variation
Changes in discharge ratios (Dra) along the lateral are shown in Figure 2. Dra decreased
mainly for control (C) and pressure flushing (PF) lines over time, reaching about 80% after 2
months. The Dra of the chlorinated lines (Cl and PFCl) was close to 100% after 2 months of
treatment, meaning that chlorination offered better control of flow rates than purging alone.
Jour
nal P
re-p
roof
Journal Pre-proof
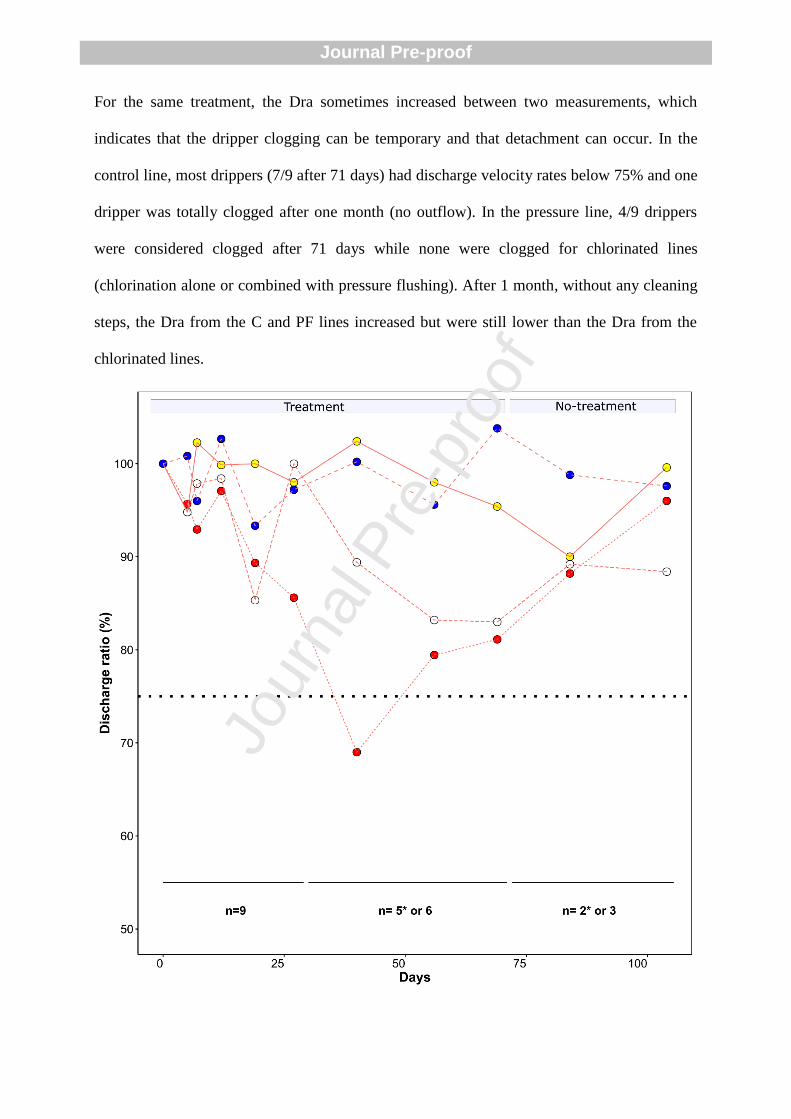
For the same treatment, the Dra sometimes increased between two measurements, which
indicates that the dripper clogging can be temporary and that detachment can occur. In the
control line, most drippers (7/9 after 71 days) had discharge velocity rates below 75% and one
dripper was totally clogged after one month (no outflow). In the pressure line, 4/9 drippers
were considered clogged after 71 days while none were clogged for chlorinated lines
(chlorination alone or combined with pressure flushing). After 1 month, without any cleaning
steps, the Dra from the C and PF lines increased but were still lower than the Dra from the
chlorinated lines.
Jour
nal P
re-p
roof
Journal Pre-proof
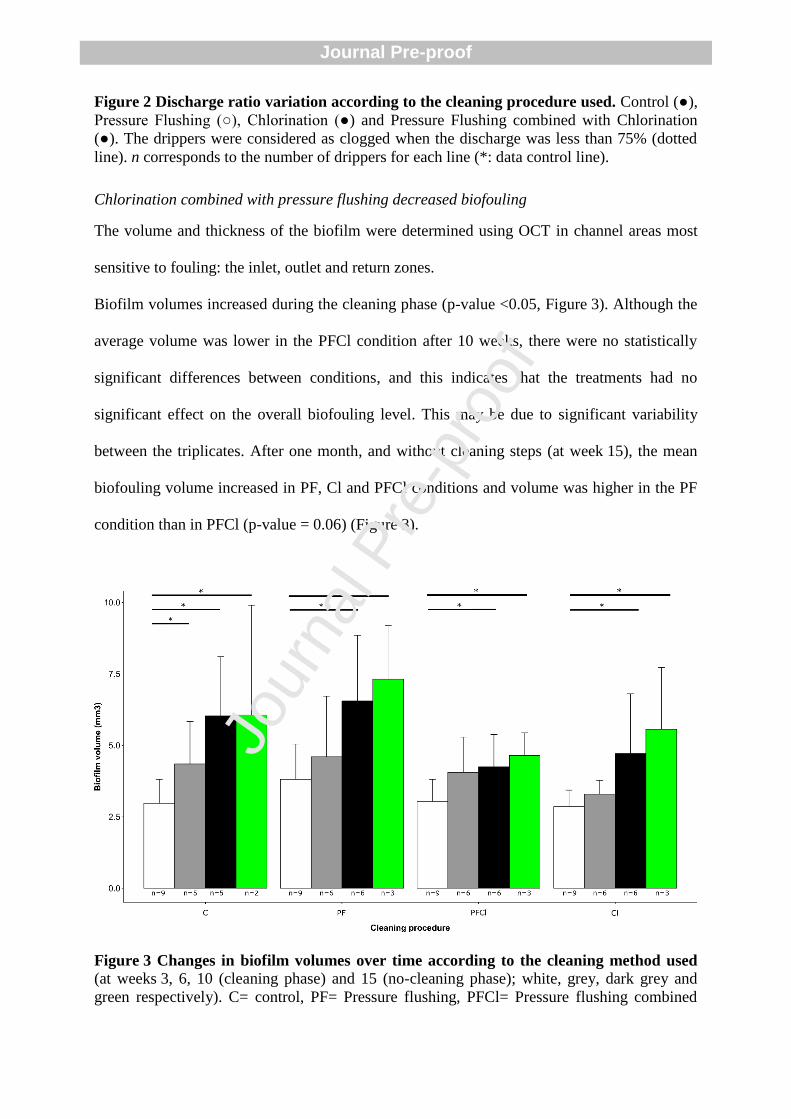
Figure 2 Discharge ratio variation according to the cleaning procedure used. Control (●),
Pressure Flushing (○), Chlorination (●) and Pressure Flushing combined with Chlorination
(●). The drippers were considered as clogged when the discharge was less than 75% (dotted
line). n corresponds to the number of drippers for each line (*: data control line).
Chlorination combined with pressure flushing decreased biofouling
The volume and thickness of the biofilm were determined using OCT in channel areas most
sensitive to fouling: the inlet, outlet and return zones.
Biofilm volumes increased during the cleaning phase (p-value <0.05, Figure 3). Although the
average volume was lower in the PFCl condition after 10 weeks, there were no statistically
significant differences between conditions, and this indicates that the treatments had no
significant effect on the overall biofouling level. This may be due to significant variability
between the triplicates. After one month, and without cleaning steps (at week 15), the mean
biofouling volume increased in PF, Cl and PFCl conditions and volume was higher in the PF
condition than in PFCl (p-value = 0.06) (Figure 3).
Figure 3 Changes in biofilm volumes over time according to the cleaning method used
(at weeks 3, 6, 10 (cleaning phase) and 15 (no-cleaning phase); white, grey, dark grey and
green respectively). C= control, PF= Pressure flushing, PFCl= Pressure flushing combined
Jour
nal P
re-p
roof
Journal Pre-proof
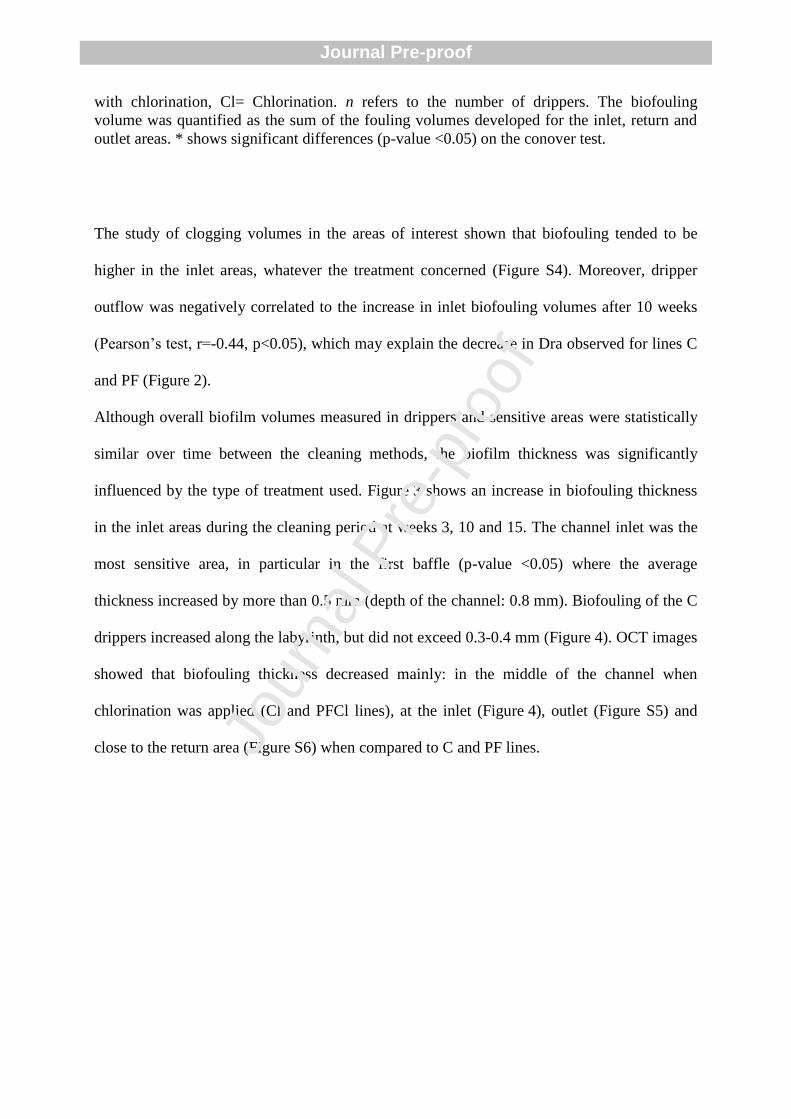
with chlorination, Cl= Chlorination. n refers to the number of drippers. The biofouling
volume was quantified as the sum of the fouling volumes developed for the inlet, return and
outlet areas. * shows significant differences (p-value <0.05) on the conover test.
The study of clogging volumes in the areas of interest shown that biofouling tended to be
higher in the inlet areas, whatever the treatment concerned (Figure S4). Moreover, dripper
outflow was negatively correlated to the increase in inlet biofouling volumes after 10 weeks
(Pearson’s test, r=-0.44, p<0.05), which may explain the decrease in Dra observed for lines C
and PF (Figure 2).
Although overall biofilm volumes measured in drippers and sensitive areas were statistically
similar over time between the cleaning methods, the biofilm thickness was significantly
influenced by the type of treatment used. Figure 3 shows an increase in biofouling thickness
in the inlet areas during the cleaning period at weeks 3, 10 and 15. The channel inlet was the
most sensitive area, in particular in the first baffle (p-value <0.05) where the average
thickness increased by more than 0.5 mm (depth of the channel: 0.8 mm). Biofouling of the C
drippers increased along the labyrinth, but did not exceed 0.3-0.4 mm (Figure 4). OCT images
showed that biofouling thickness decreased mainly: in the middle of the channel when
chlorination was applied (Cl and PFCl lines), at the inlet (Figure 4), outlet (Figure S5) and
close to the return area (Figure S6) when compared to C and PF lines. Jour
nal P
re-p
roof
Journal Pre-proof
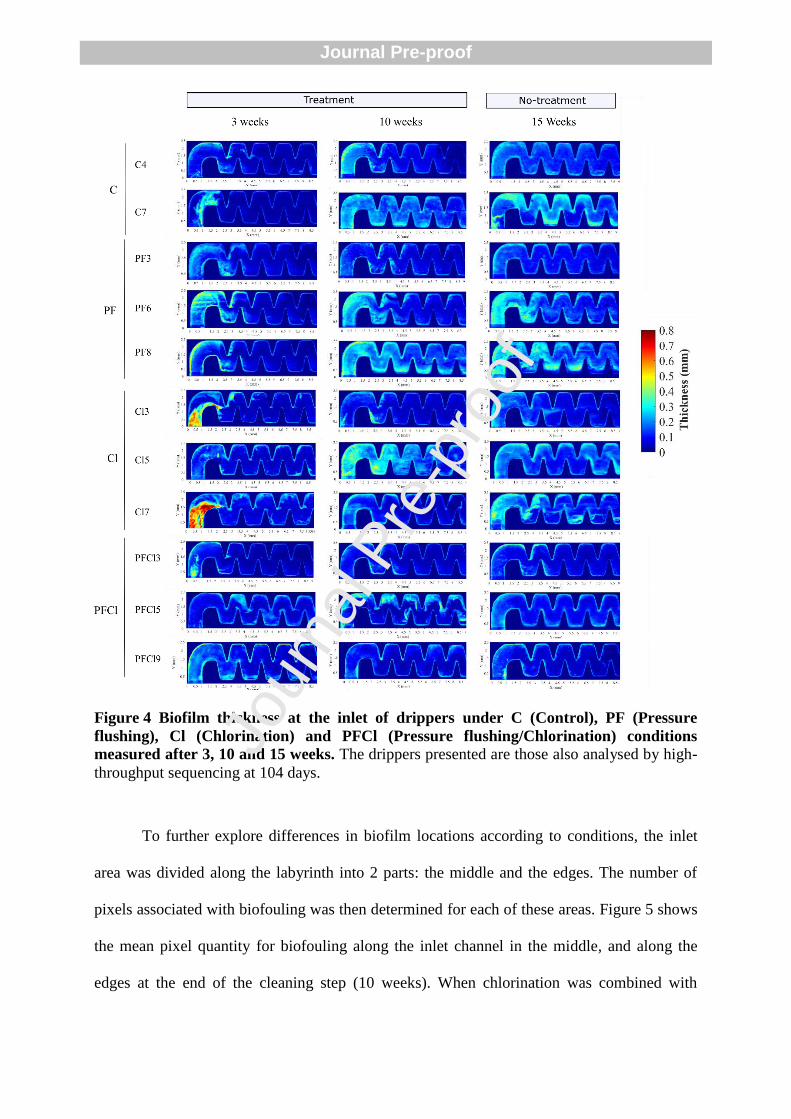
Figure 4 Biofilm thickness at the inlet of drippers under C (Control), PF (Pressure
flushing), Cl (Chlorination) and PFCl (Pressure flushing/Chlorination) conditions
measured after 3, 10 and 15 weeks. The drippers presented are those also analysed by high-
throughput sequencing at 104 days.
To further explore differences in biofilm locations according to conditions, the inlet
area was divided along the labyrinth into 2 parts: the middle and the edges. The number of
pixels associated with biofouling was then determined for each of these areas. Figure 5 shows
the mean pixel quantity for biofouling along the inlet channel in the middle, and along the
edges at the end of the cleaning step (10 weeks). When chlorination was combined with
Jour
nal P
re-p
roof
Journal Pre-proof
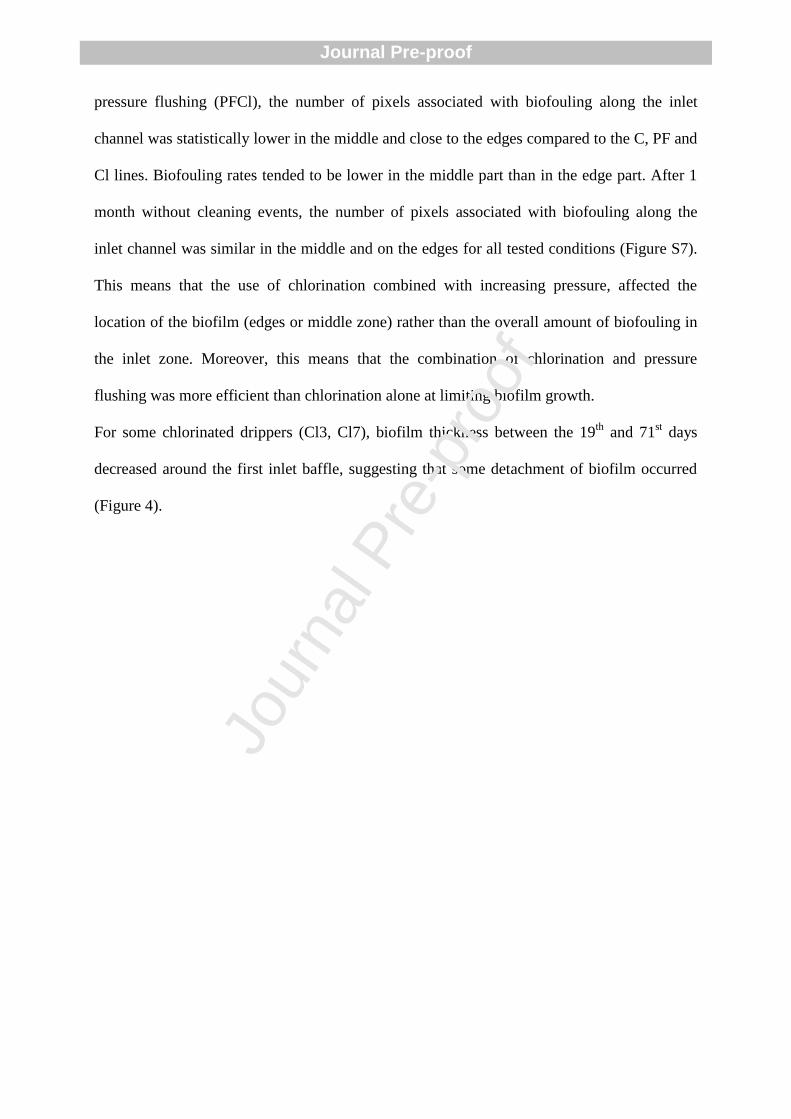
pressure flushing (PFCl), the number of pixels associated with biofouling along the inlet
channel was statistically lower in the middle and close to the edges compared to the C, PF and
Cl lines. Biofouling rates tended to be lower in the middle part than in the edge part. After 1
month without cleaning events, the number of pixels associated with biofouling along the
inlet channel was similar in the middle and on the edges for all tested conditions (Figure S7).
This means that the use of chlorination combined with increasing pressure, affected the
location of the biofilm (edges or middle zone) rather than the overall amount of biofouling in
the inlet zone. Moreover, this means that the combination of chlorination and pressure
flushing was more efficient than chlorination alone at limiting biofilm growth.
For some chlorinated drippers (Cl3, Cl7), biofilm thickness between the 19th
and 71st days
decreased around the first inlet baffle, suggesting that some detachment of biofilm occurred
(Figure 4).
Jour
nal P
re-p
roof
Journal Pre-proof
Figure 5 Means and standard deviation of pixels associated with biofouling in the middle
and on the edges of the inlet dripper channel after 10 weeks of treatment. For each
position of x, pixels in y-z are summed. Grey areas on inlet schemes at right-top indicate the
zone of interest. Control (C-●), Pressure flushing (PF-●), Chlorination (Cl-●) and Pressure
flushing combined with Chlorination (PFCl-●); the arrow indicates the direction of the flow
along the channel; n=6 per condition. P-value graphs show the results of the Wilcoxon tests
with ■: non-significant, ■: p<0.1, ■: p<0.05.
Biofouling level and Bacterial quantification
The quantity of bacterial cells in the drippers during the cleaning period was between
109 and 10
10 copies of 16S rDNA at 29 days and between 10
10 and 10
11 copies at 71 days
(Figure 6A) (background level of 103 copies of 16S rDNA at t0). The number of copies of
Jour
nal P
re-p
roof
Journal Pre-proof
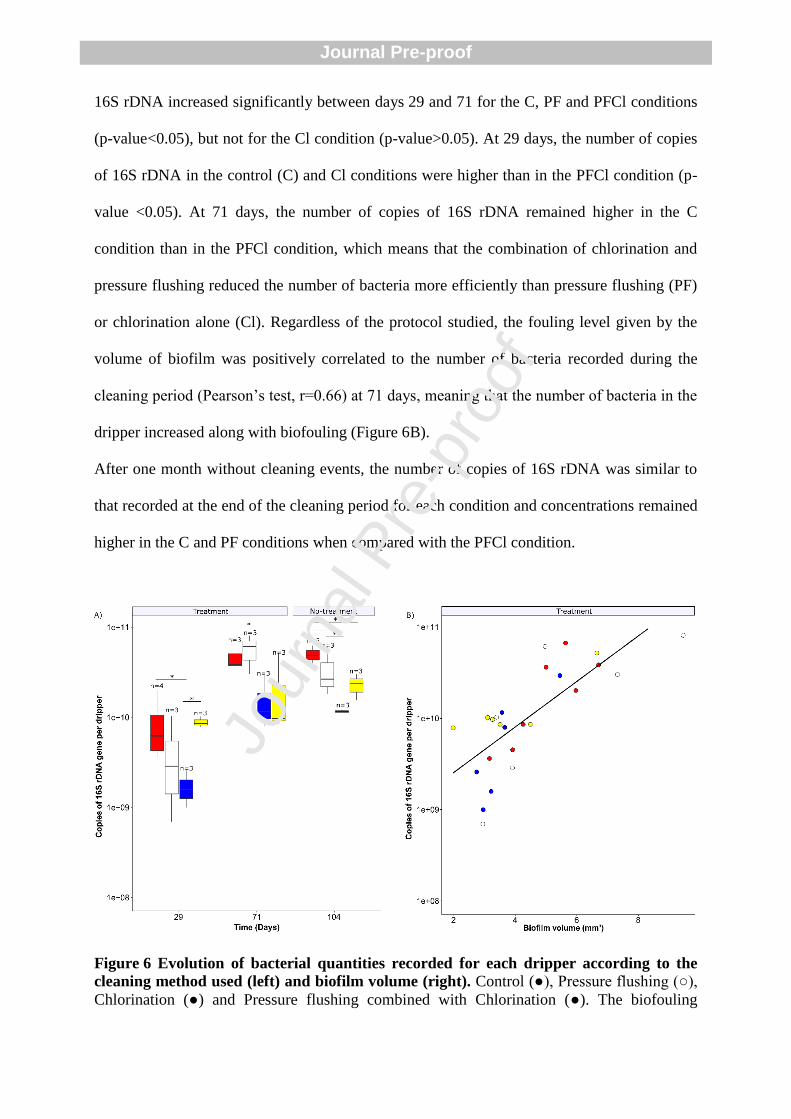
16S rDNA increased significantly between days 29 and 71 for the C, PF and PFCl conditions
(p-value<0.05), but not for the Cl condition (p-value>0.05). At 29 days, the number of copies
of 16S rDNA in the control (C) and Cl conditions were higher than in the PFCl condition (p-
value <0.05). At 71 days, the number of copies of 16S rDNA remained higher in the C
condition than in the PFCl condition, which means that the combination of chlorination and
pressure flushing reduced the number of bacteria more efficiently than pressure flushing (PF)
or chlorination alone (Cl). Regardless of the protocol studied, the fouling level given by the
volume of biofilm was positively correlated to the number of bacteria recorded during the
cleaning period (Pearson’s test, r=0.66) at 71 days, meaning that the number of bacteria in the
dripper increased along with biofouling (Figure 6B).
After one month without cleaning events, the number of copies of 16S rDNA was similar to
that recorded at the end of the cleaning period for each condition and concentrations remained
higher in the C and PF conditions when compared with the PFCl condition.
Figure 6 Evolution of bacterial quantities recorded for each dripper according to the
cleaning method used (left) and biofilm volume (right). Control (●), Pressure flushing (○),
Chlorination (●) and Pressure flushing combined with Chlorination (●). The biofouling
Jour
nal P
re-p
roof
Journal Pre-proof
volume was quantified as the sum of the fouling at the inlet, return and outlet areas. *
indicates significant differences (conover-test, p-value <0.05).
Bacterial Community Structure Analysis
The bacterial communities in dripper biofilms collected after 29 and 71 days were compared
using 16S rDNA Illumina sequencing to evaluate the treatment effects. They were also
compared with the communities present in reclaimed wastewater used to supply the dripper
systems and renewed every week. After 71 days, treatments were stopped and biofilms were
sampled again at 104 days to investigate the resilience of the communities, i.e. to test if the
biofilms would then become closer to those estimated for the control condition.
Structure of bacterial communities
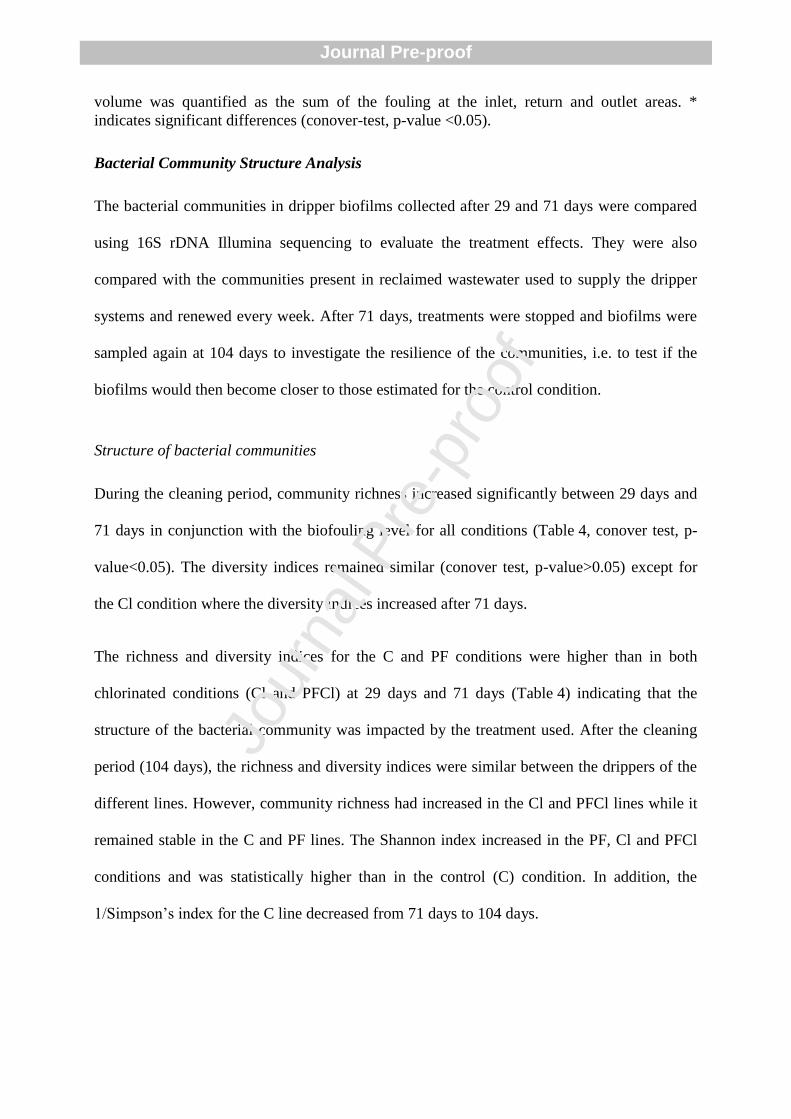
During the cleaning period, community richness increased significantly between 29 days and
71 days in conjunction with the biofouling level for all conditions (Table 4, conover test, p-
value<0.05). The diversity indices remained similar (conover test, p-value>0.05) except for
the Cl condition where the diversity indices increased after 71 days.
The richness and diversity indices for the C and PF conditions were higher than in both
chlorinated conditions (Cl and PFCl) at 29 days and 71 days (Table 4) indicating that the
structure of the bacterial community was impacted by the treatment used. After the cleaning
period (104 days), the richness and diversity indices were similar between the drippers of the
different lines. However, community richness had increased in the Cl and PFCl lines while it
remained stable in the C and PF lines. The Shannon index increased in the PF, Cl and PFCl
conditions and was statistically higher than in the control (C) condition. In addition, the
1/Simpson’s index for the C line decreased from 71 days to 104 days.
Jour
nal P
re-p
roof
Journal Pre-proof
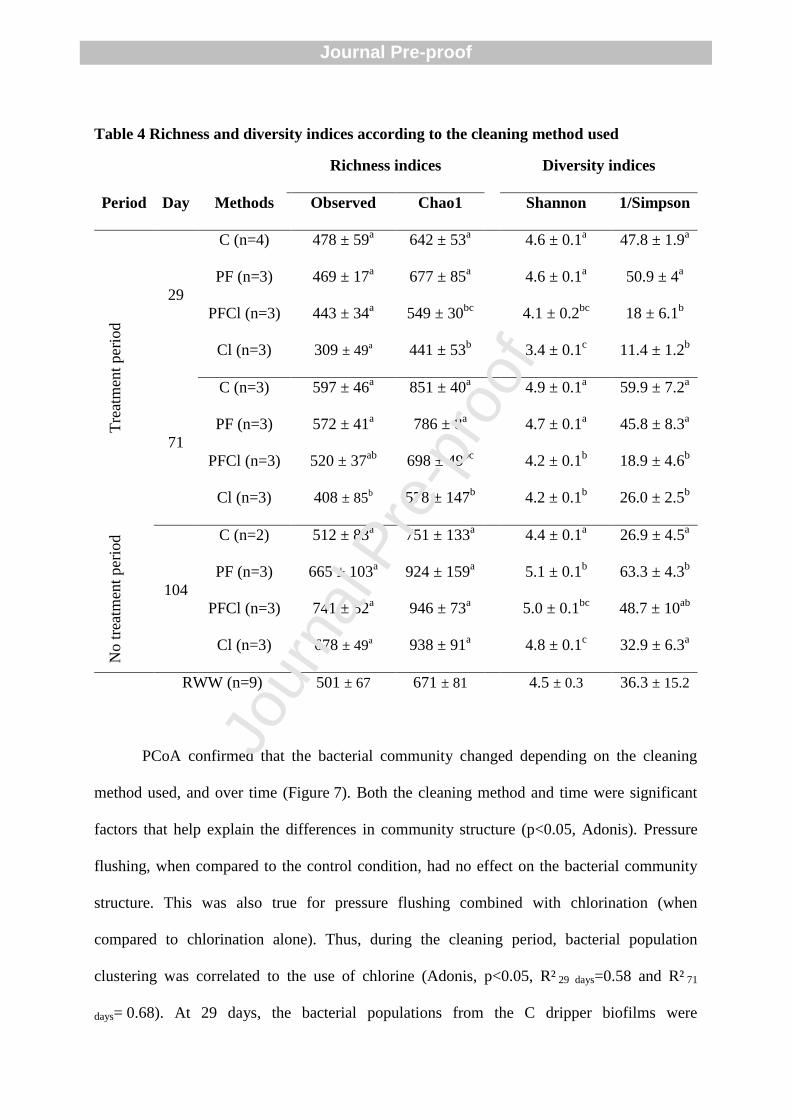
Table 4 Richness and diversity indices according to the cleaning method used
Richness indices Diversity indices
Period Day Methods Observed Chao1 Shannon 1/Simpson
Tre
atm
ent
per
iod
29
C (n=4) 478 ± 59a
642 ± 53a
4.6 ± 0.1a
47.8 ± 1.9a
PF (n=3) 469 ± 17a
677 ± 85a
4.6 ± 0.1a
50.9 ± 4a
PFCl (n=3) 443 ± 34a
549 ± 30bc
4.1 ± 0.2bc
18 ± 6.1b
Cl (n=3) 309 ± 49a
441 ± 53b
3.4 ± 0.1c
11.4 ± 1.2b
71
C (n=3) 597 ± 46a
851 ± 40a
4.9 ± 0.1a
59.9 ± 7.2a
PF (n=3) 572 ± 41a
786 ± 8a
4.7 ± 0.1a
45.8 ± 8.3a
PFCl (n=3) 520 ± 37ab
698 ± 49bc
4.2 ± 0.1b
18.9 ± 4.6b
Cl (n=3) 408 ± 85b
578 ± 147b
4.2 ± 0.1b
26.0 ± 2.5b
No t
reat
men
t per
iod
104
C (n=2) 512 ± 83a
751 ± 133a
4.4 ± 0.1a
26.9 ± 4.5a
PF (n=3) 665 ± 103a
924 ± 159a
5.1 ± 0.1b
63.3 ± 4.3b
PFCl (n=3) 741 ± 52a
946 ± 73a
5.0 ± 0.1bc
48.7 ± 10ab
Cl (n=3) 678 ± 49a
938 ± 91a
4.8 ± 0.1c
32.9 ± 6.3a
RWW (n=9) 501 ± 67 671 ± 81 4.5 ± 0.3 36.3 ± 15.2
PCoA confirmed that the bacterial community changed depending on the cleaning
method used, and over time (Figure 7). Both the cleaning method and time were significant
factors that help explain the differences in community structure (p<0.05, Adonis). Pressure
flushing, when compared to the control condition, had no effect on the bacterial community
structure. This was also true for pressure flushing combined with chlorination (when
compared to chlorination alone). Thus, during the cleaning period, bacterial population
clustering was correlated to the use of chlorine (Adonis, p<0.05, R² 29 days=0.58 and R² 71
days= 0.68). At 29 days, the bacterial populations from the C dripper biofilms were
Jour
nal P
re-p
roof
Journal Pre-proof
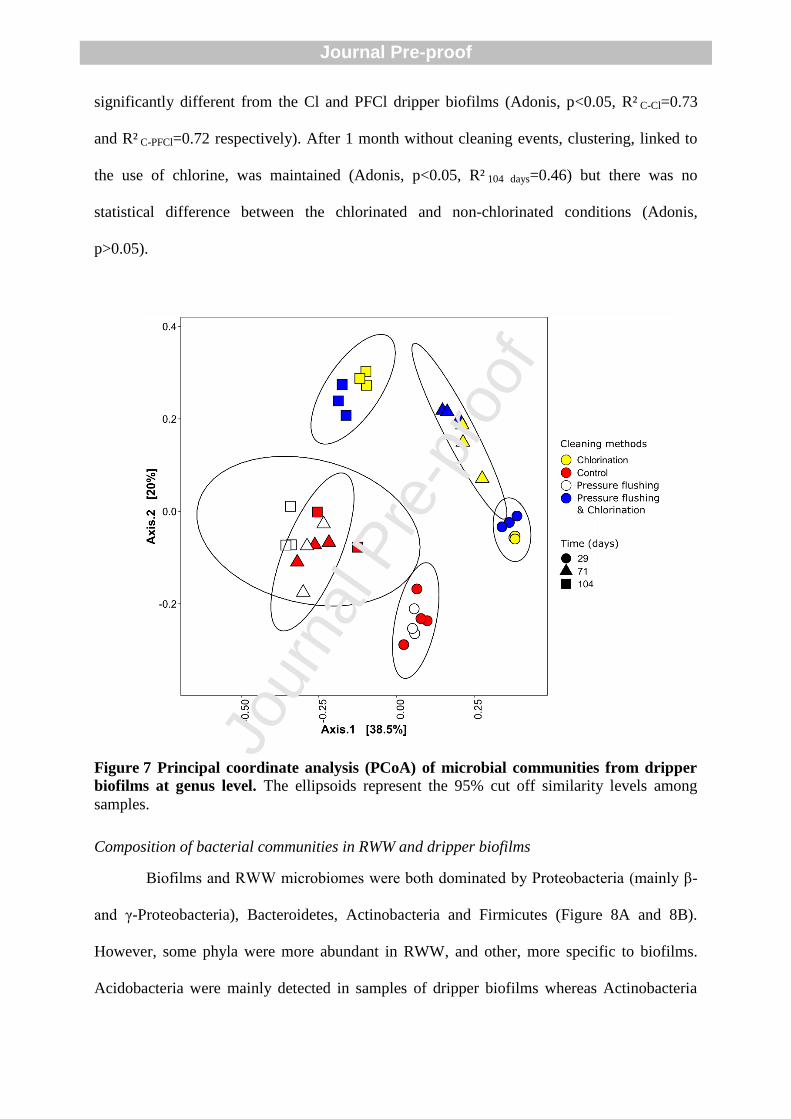
significantly different from the Cl and PFCl dripper biofilms (Adonis, p<0.05, R² C-Cl=0.73
and R² C-PFCl=0.72 respectively). After 1 month without cleaning events, clustering, linked to
the use of chlorine, was maintained (Adonis, p<0.05, R² 104 days=0.46) but there was no
statistical difference between the chlorinated and non-chlorinated conditions (Adonis,
p>0.05).
Figure 7 Principal coordinate analysis (PCoA) of microbial communities from dripper
biofilms at genus level. The ellipsoids represent the 95% cut off similarity levels among
samples.
Composition of bacterial communities in RWW and dripper biofilms
Biofilms and RWW microbiomes were both dominated by Proteobacteria (mainly β-
and γ-Proteobacteria), Bacteroidetes, Actinobacteria and Firmicutes (Figure 8A and 8B).
However, some phyla were more abundant in RWW, and other, more specific to biofilms.
Acidobacteria were mainly detected in samples of dripper biofilms whereas Actinobacteria
Jour
nal P
re-p
roof
Journal Pre-proof
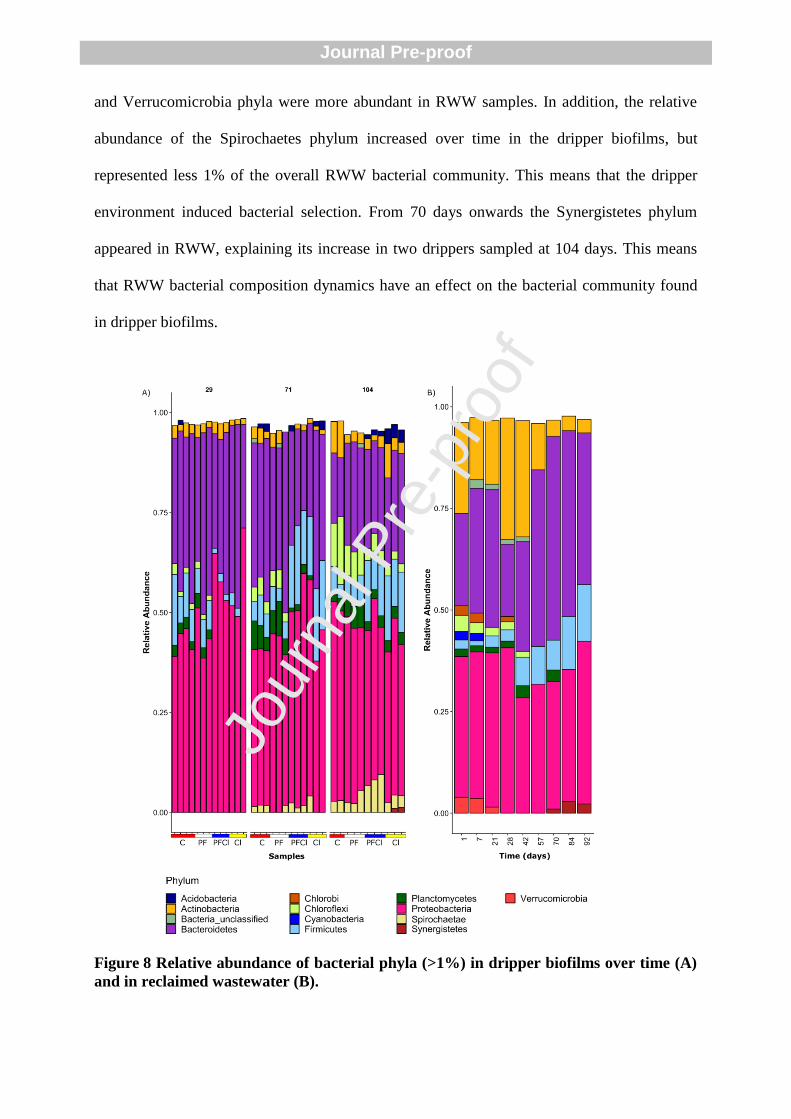
and Verrucomicrobia phyla were more abundant in RWW samples. In addition, the relative
abundance of the Spirochaetes phylum increased over time in the dripper biofilms, but
represented less 1% of the overall RWW bacterial community. This means that the dripper
environment induced bacterial selection. From 70 days onwards the Synergistetes phylum
appeared in RWW, explaining its increase in two drippers sampled at 104 days. This means
that RWW bacterial composition dynamics have an effect on the bacterial community found
in dripper biofilms.
Figure 8 Relative abundance of bacterial phyla (>1%) in dripper biofilms over time (A)
and in reclaimed wastewater (B).
Jour
nal P
re-p
roof
Journal Pre-proof
Both the chlorination and pressure flushing methods modified bacterial community structure
and composition. The relative abundance of Proteobacteria phylum was higher in chlorinated
biofilms over time (Kruskal-test, p<0.05), while the relative abundance of Chloroflexi and
Planctomycetes was lower (Kruskal-test, p <0.05). Indeed, Chloroflexi and Planctomycetes
phyla were under-represented (<1% of the global community) in the biofilms sampled on the
chlorinated lines when compared to those recorded in non-chlorinated biofilms during the
cleaning period (Figure 8A). These phyla were once more detectable in the 104 days samples
once the treatment was stopped, but were still less dominant than in the non-chlorinated lines
(mean relative abundances: 14% and 7% in C and PF respectively against 2% and 4% in Cl
and PFCl respectively). This means that chlorination induced a bacterial selection and,
although sensitive bacteria were able to grow again in the biofilm, chlorination effects on the
communities persisted 1 month after the treatments were stopped. Thus, the composition of
the bacterial community found in the biofilms was principally governed by two factors: the
dynamics of the RWW bacterial composition and the selection of some adapted taxa able to
cope with chlorination.
As suggested with Figure 7, the bacterial composition profiles of C and PF dripper
biofilms were similar and dominated by the same genera as members of Comamonadaceae
family, Dechloromonas, env.OPS_17 group at 29 days and Terrimonas, Dechloromonas and
Denitratisoma at 71 days (Table S1). In addition, the SIMPER analysis showed that there
were very few genera that revealed any significant differences between the structure of C and
PF communities (Figure S8), which confirmed that the bacterial structure and composition
were similar between C and PF dripper biofilms. There were also few differences between the
Cl and PFCl conditions (Table S1), indicating that chlorination was mainly responsible for the
bacterial composition, as suggested in Figure 7.
Jour
nal P
re-p
roof
Journal Pre-proof
The phyla whose abundance was most affected by the treatments were studied at
family and genus levels in the dripper biofilms. Proteobacteria were mainly composed of β-
Proteobacteria, followed by γ-Proteobacteria, δ-Proteobacteria and α-Proteobacteria. Relative
abundances of β-Proteobacteria and α-Proteobacteria were statistically higher in chlorinated
biofilms (Cl and PFCl, Kruskal test, p <0.05) while γ-Proteobacteria were not impacted by the
cleaning method used (Kruskal test, p> 0.05). Inversely, δ-Proteobacteria were statistically
higher in non-chlorinated drippers (C and PF) with 2% against <1% recorded for chlorinated
drippers (Cl and PFCl). Among the β-Proteobacteria and α-Proteobacteria, the
Comamonadaceae family members, Azospira, Sphingomonadaceae, Caulobacter and
Hyphomicrobium (α-Proteobacteria) were more abundant in chlorinated biofilms (Kruskal
test, p<0.05) whereas others were more abundant in the C and PF such as Denitratisoma and
Aquabacterium (Kruskal test, p<0.05) (Figure 9, Table S1). SIMPER analysis indicated that
Azospira, and an unclassified genus from Comamonadaceae,were the main genera
responsible for bacterial community clustering depending on the use of chlorination (Figure
S8) during the cleaning period. The genus Pseudoxanthomonas (γ-Proteobacteria) was more
abundant in Cl and PFCl (3–6%) conditions compared to C and PF conditions (<1%) whereas
the Run-SP154_ge was more abundant in non-chlorinated drippers (C and PF).
The relative abundance of Firmicutes (dominated by Clostridia class) were
significantly higher in chlorinated biofilm compared to non–chlorinated biofilm (Kruskal-test,
p<0.05) at 71 days (4–6% in C-PF against 16–17% in Cl and PFCl respectively, Figure 8A).
Moreover, Fusibacter genus (Clostridia class) drove the separation of the bacterial
community structure according to the use of chlorine (Figure S8).
Chloroflexi (mainly composed of one Anaerolineaceae member’s family, Leptolinea,
Choroflexi SBR2076 and SJA-15 group) and Planctomycetes phylum (mainly comprised of
Jour
nal P
re-p
roof
Journal Pre-proof
the OM190 group, Planctomyces and Schlesneria genera) were significantly less abundant in
the chlorinated biofilms (Cl and PFCl) during the treatment period (Figure 8A).
Composition of eucaryotic communities in dripper biofilms
At the end of the cleaning period, the 18S rRNA sequence analysis also showed a
treatment-related effect on the structure and composition of the eukaryotic communities
(Figure S9). The Ciliophora and Fungi classes were the most heavily represented. Among the
Ciliophora class, the family Tokophryidae was mainly present in the biofilms of non-
chlorinated drippers, while the families Vorticellidae and Peritrichia were mainly present in
chlorinated dripper biofilms. The fungi, which was dominated by the Dothideomycetes or
Pezizomycotina families, were less present in chlorinated drippers whereas the
Sordariomycetes family was mainly present in chlorinated biofilms.
Impact of cleaning stoppage on the bacterial community composition
SIMPER analysis at 104 days showed that there was no difference between C and the
other conditions (Table S8), which confirmed that bacterial communities converged
(Figure 7) when the treatments were stopped.
Chloroflexi and Planctomycetes phyla increased in chlorinated dripper biofilms from
Cl and PFCl lines once chlorination was stopped (Figure 8A). The genera and taxonomic
groups belonging to Chloroflexi such as the Anaerolineaceae family members: Leptolinea,
SBR2076 and SJA-15 groups settled in chlorinated dripper biofilms. Other minor bacterial
families in chlorinated drippers sampled during the cleaning period re-emerged such as
Saprospiraceae (Bacteroidetes), Spirochaetaceae (Spirochaetae), Christensenellaceae
(Firmicutes) and Hydrogenophilaceae (β-Proteobacteria) at similar levels found in biofilms
from non-chlorinated drippers (Figure 9). Inversely, the relative abundance of the main genera
Jour
nal P
re-p
roof
Journal Pre-proof
from chlorinated biofilm during the cleaning period decreased such as Azospira,
Flavobacterium and Cloacibacterium (Figure 9).
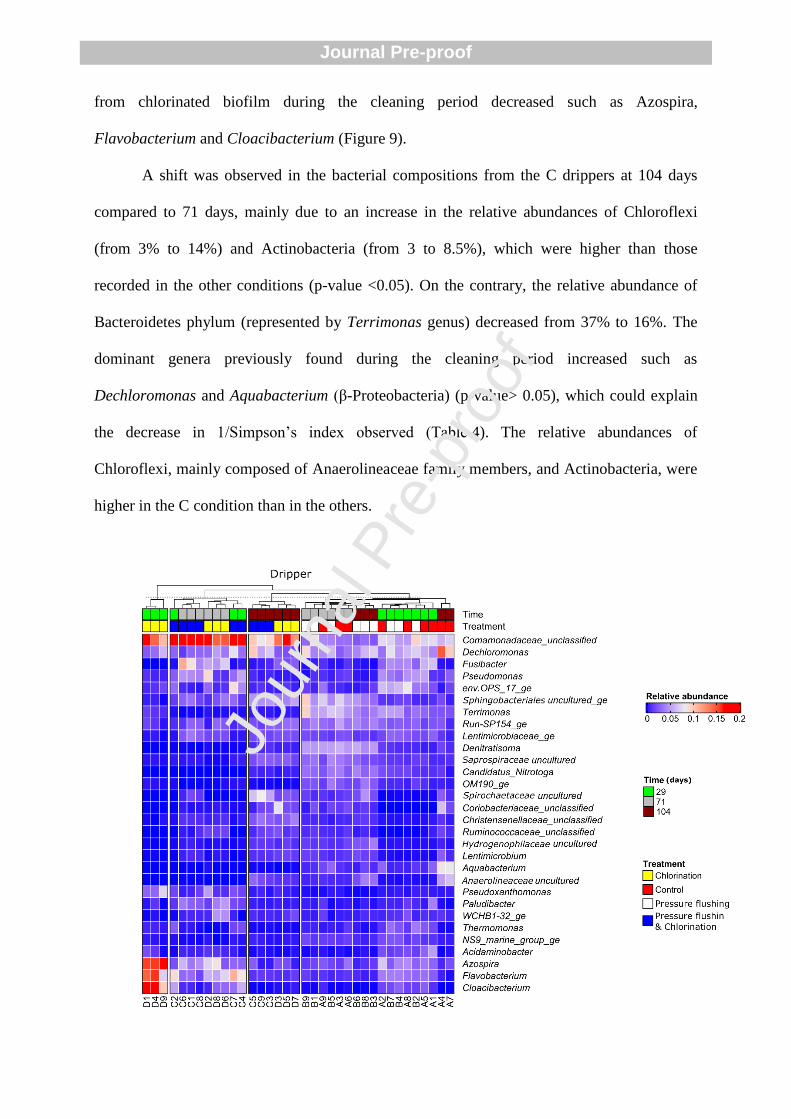
A shift was observed in the bacterial compositions from the C drippers at 104 days
compared to 71 days, mainly due to an increase in the relative abundances of Chloroflexi
(from 3% to 14%) and Actinobacteria (from 3 to 8.5%), which were higher than those
recorded in the other conditions (p-value <0.05). On the contrary, the relative abundance of
Bacteroidetes phylum (represented by Terrimonas genus) decreased from 37% to 16%. The
dominant genera previously found during the cleaning period increased such as
Dechloromonas and Aquabacterium (β-Proteobacteria) (p-value> 0.05), which could explain
the decrease in 1/Simpson’s index observed (Table 4). The relative abundances of
Chloroflexi, mainly composed of Anaerolineaceae family members, and Actinobacteria, were
higher in the C condition than in the others.
Jour
nal P
re-p
roof
Journal Pre-proof
Figure 9 Heat map of bacterial genera from dripper biofilms. Genera with the top 30
relative abundance are shown.
4. Discussion
In this study, the effects on biological clogging and microbial communities, resulting from
different cleaning methods (chlorination (Cl), pressure flushing (PF), and a combination of
both methods (PFCl)), were investigated. Commercial flat drippers (1 l.h-1
) used in agriculture
were installed on a test bench and fed with reclaimed wastewater. After a 2-month period of
treatments, cleaning events were interrupted in order to study the impact on biofouling
regrowth and bacterial communities.
Chlorination, unlike purge-only treatment, helped maintain flow rates
The effectiveness of cleaning methods is often looked at from the perspective of flow
maintenance (Feng et al., 2018; Han et al., 2018; Song et al., 2017). Chlorination (1.5 ppm),
alone or in combination with pressure flushing (Cl and PFCl), maintained flow rates and
reduced distribution heterogeneity throughout the cleaning period. Conversely, the uniformity
of water distribution decreased over time under non-chlorinated conditions (C and PF), which
means that chlorination use is preferable in order to maintain expected flow rates.
Chlorination results were consistent with those of J. Li et al. (2010) who showed that
chlorinating (2.5 ppm of free chlorine) once a week, maintained the expected dripper flow
rates supplied by reclaimed wastewater for a longer period of time. However, the impact of
pressure flushing is not consistent with Yu et al. (2018) who showed that increasing the
pressure from 0.1MPa to 0.3MPa for 2 minutes helped maintain the expected flow rates for
longer periods by removing large particles (<6.6 µm in diameter). The pressure increases used
in our experimental work may not have been sufficient to promote a detachment of biofilm
Jour
nal P
re-p
roof
Journal Pre-proof
and maintain flow rates. However, biofilm is considered to be an elastically deformable, but
quasi-static structure that enables it to deal with an increase in pressure and flow velocity
(Picioreanu et al., 2018). For instance, Li et al. (2015) showed that EPS concentrations found
in dripper biofilms were higher when purging was performed once rather than twice a week.
This suggests that purging too often does not optimally reduce biofilm development.
Moreover, Zhang et al. (2020) showed that lateral flushing changes deposit biomass and the
microbial environment rather than the attached biomass, which may explain the
nonsignificant effect of purging on biofilms.
Biofilms can also increase pressure loss due to friction along the labyrinth (Li et al., 2016):
the biofilm formed in the labyrinth increases roughness, which in turn increases friction,
resulting in increased flow resistance, and thus increased the pressure loss with a consequent
decrease in distribution uniformity.
Cleaning procedure impacts on biofouling
Purging had no impact on bacterial concentrations and biofouling (volume, thickness). A
recent study showed that flushing (1h per day) with reclaimed wastewater is not effective at
limiting dripper clogging when compared to freshwater flushing due to the presence of
suspended solids and other organic compounds (N. Li et al., 2019). Thus, the use of
freshwater could offer a solution to improve the efficiency of the pressure flushing method.
However, in the case of field irrigation with treated wastewater, it is not always possible to
have access to a second water resource.
Conversely, the level of biofouling and bacterial concentrations in the chlorinated lines (Cl
and PFCl), mainly in the PFCl line, tended to decrease when compared to those observed for
non-chlorinated lines. The combination of pressure flushing and chlorination seemed to offer
a better control of biofouling than chlorination alone. This decrease was mainly due to a
Jour
nal P
re-p
roof
Journal Pre-proof
significant decrease in biofouling in the middle of the channel, where flow velocity was
higher (Ait-Mouheb et al., 2018; Al-Muhammad et al., 2016; Yu et al., 2018a). Increasing the
flow velocity by increasing the pressure favours mass transfer (Beyenal and Lewandowski,
2002; Moreira et al., 2013) and influences mixing (Khaydarov et al., 2018; Naher et al.,
2011). Mathieu et al. (2014) showed using a rotating disc reactor that the shear stress and
cohesive force necessary to detach biofilm decreased after chlorine application (10 ppm
during 1h). This is probably due to the breaking of the hydrogen bond, as well as polymer and
hydrophobic interactions, caused by chlorine (Xue and Seo, 2013), thus weakening the
biofilm and makes it easier to detach. Therefore, chlorine mass transfer caused by
hydrodynamic conditions in the main flow zones (middle of the milli-channel) may explain
why the biofouling level was lower under PFCl conditions than in C and PF conditions in the
middle and corners of the channel, and why bacterial concentrations were lower under this
condition.
However, the combination of the two methods did not completely stifle the development of
biofouling. One explanation is that the increase in the PFCl condition favours the biofilm
compaction, and the resistance of the basal layer in the central and corner areas (Blauert et al.,
2015; Rochex et al., 2008; Valladares Linares et al., 2016; Wagner and Horn, 2017), which
reduced the chlorine effect (Lee et al., 2018). Lee et al. (2018) showed that the free chlorine
penetration at 10 ppm of Cl2 was low in a biofilm of 2000 µm (7 days to reach the
substratum) and tended to promote the sloughing off of the superficial layers of the biofilm.
Thus, the concentration of free chlorine used (1.5 ppm) may be insufficient to reduce the level
of clogging, especially in corner areas where biofilm thickness was higher. However, studies
have shown that the long-term use of a high-concentration of chlorine can have more
significant adverse effects on soil health than for the lower ones (Song et al., 2019). Further
studies on chlorine transfer, whether combined or not with a purge, while taking into account
Jour
nal P
re-p
roof
Journal Pre-proof
agricultural practices and soil health, are needed to find cleaning strategies, which are
efficient and with limited environmental impacts.
Chlorination strongly modified microbial communities in biofilms
In this study, total bacteria, diversity and richness indices in conjunction with the level of
clogging.
Bacterial diversity was lower in chlorinated conditions compared to those of the control and
pressure flushing lines. The bacterial diversity of biofilms found in drinking water
distribution pipes was also previously shown to decrease with the increasing concentration of
chlorine (0.05 to 1.76 ppm) (Fish and Boxall, 2018; Mi et al., 2015).
Pressure flushing had no impact on the bacterial community when f compared with
the non-treated control line, which is consistent with Li et al. (2015) who studied the
microbial composition of biofilms using PLFA analysis. On the other hand, the use of
chlorine, whether combined or not with pressure flushing, has significantly altered the
structure of the bacterial community during the cleaning step. Proteobacteria and Firmicutes
phyla appeared to contain bacterial members resistant to chlorine treatment whereas
Chloroflexi phylum appeared to be sensitive to chlorine, which is consistent with Song et al.
(2019). Chloroflexi phylum includes many filamentous bacteria such as Anaerolineaceae
member’s family and Leptolinea genus detected in sequencing data and responsible for
clogging membrane bioreactors in wastewater treatment plants (Li et al., 2008) and drippers
supplied by RWW (Lequette et al., 2019). Chloroflexi may have a key role in the dripper
clogging.
Chlorinated dripper biofilms were largely dominated by OTUs belonging to the
Comamonadaceae family (β-Proteobacteria), followed by Flavobacterium (Bacteroidetes),
Pseudomonas and Pseudoxanthomonas genera (γ-Proteobacteria). β-Proteobacteria are
Jour
nal P
re-p
roof
Journal Pre-proof
frequently found in chlorinated drinking distribution systems and wastewater biofilms
(Douterelo et al., 2016; Navarro et al., 2016; Shaw et al., 2014), and their abundance can
increase in conjunction with the chlorine concentration (Wang et al., 2019b). The
Comamonadaceae family was commonly found in water and chlorinated biofilms (Wang et
al., 2019a; Zhang et al., 2019). Pseudomonas and Hydrogenophaga (Comamonadaceae) are
known to exhibit resistance to disinfection (Jia et al., 2015; Wang et al., 2019a). Increases in
relative abundance of Pseudomonas have been observed in water samples after chlorination
(Jia et al., 2015) and Hydrogenophaga are known to colonise chlorinated distribution pipes
fed with reclaimed wastewater (Wang et al., 2019b).
Firmicutes predominated in the chlorinated drippers after 2 months of treatment. At
the class level, the bacterial community was mainly composed of Clostridia (abundance
between 10 and 14%), which includes many members capable of producing endospores.
These endospores are highly resistant to a variety of environmental challenges, such as heat,
solvents, oxidising agents, UV irradiation and desiccation (Abecasis et al., 2013). The
resilience of endospores allows them to remain viable in a hostile environment for long
periods of time, and contributes to their survival and proliferation in chlorinated environments
(Douterelo et al., 2016).
The eukaryotic communities, which are mainly composed of Ciliophora and Fungi, were also
influenced by chlorine use. Sordariomycetes, Tremellomycetes and Chytridiomycetes were
still present in chlorinated biofilms, while Dothideomycetes or Pezizomycotina were only
recovered in control and purge drippers. Sordariomycetes, Tremellomycetes and
Chytridiomycetes are commonly found in the effluent of wastewater treatment plants and are
associated with water treatment (Assress et al., 2019). Sordariomycetes has also been
detected, and deemed to be dominant, in biofilms found in drinking water distribution systems
(0.05 ppm to 0.8 ppm of free chlorine) (Fish and Boxall, 2018). These results suggest that
Jour
nal P
re-p
roof
Journal Pre-proof
among fungi, some are more tolerant to chemical disinfection. The resistance to chemical
disinfection of some fungi can be explained by their thick melanized cell walls, which
increases resistance to mechanical damage and restricts intrusion of biocides into the cell
(Hageskal et al., 2012), or may be due to their ability to form spores (Sonigo et al., 2011).
Ciliophora were affected by chlorine use, with chlorine-sensitive families (e.g.
Tokophryidae), whereas others were still present in chlorinated drippers (e.g. Vorticellidae).
Ciliophora contains bacteria predators that can significantly reduce bacteria concentrations
(Parry et al., 2007) and influences biofilm morphology (Böhme et al., 2009; Derlon et al.,
2012). Although eukaryotic communities found in dripper biofilms are poorly studied, their
role in biofilm development and resistance to cleaning processes may be important, and must
be integrated in biofilm control studies. In addition, the microbiome of reclaimed water
evolves over time, and depends on the treatment used. For this reason, additional studies to
investigate the effect of the wastewater treatment (i.e. activated sludge, membrane bioreactor)
as well as the role of bacterial predators on the microbial composition of a biofilm should be
performed.
Resilience of microbial communities once treatments are stopped
1 month after the stoppage of cleaning events, several bacterial families, deemed to be
chlorine-sensitive, re-emerged such as Saprospiraceae, Spirochaetaceae, Christensenellaceae
and Hydrogenophilaceae at levels similar to those measured in biofilms from non-chlorinated
drippers. The relative abundance of Chloroflexi phylum also increased significantly after this
period. Bacteria concentration, diversity and richness indexes also increased. This suggests
that treatment stoppage reduces selection pressure and makes it easier to recruit new species.
Fish and Boxall (2018) obtained a similar result for biofilm development in drinking water
distribution systems, and this would explain the increase in dripper clogging after the
Jour
nal P
re-p
roof
Journal Pre-proof
interruption of chlorination observed by Katz et al. (2014) (10 ppm of free chlorine). This also
illustrates the resilience of the bacterial community in its ability to deal with chlorine used
(Allison and Martiny, 2009) in a drip irrigation system. However, PCoA analyses showed that
the drippers in the chlorinated lines still form a different bacterial cluster than non-chlorinated
lines 1 month after treatment stoppage, which shows that the treatment, although finished,
has residual effects on the structure of the communities, and that resilience was only partial.
5. Conclusion
The combined use of OCT and high throughput sequencing shed light on the impact of
the two cleaning procedures (pressure flushing, chlorination) on the biofouling of RWW-fed
drip-irrigation systems:
- The pressure flushing method alone did not reduce the biofouling of the drippers
and did not influence the biofilm microbiome.
- Conversely, chlorination application alone or combined with pressure flushing
steps reduced dripper biofouling, mainly in the centre of the labyrinth.
- Some bacteria commonly known to clog systems, such as Chloroflexi and
Planctomycetes, appear sensitive to chlorine and susceptible to regrowth after
chlorination is discontinued.
- Others, such as the members of the Comamonadaceae and Clostridia (Firmicutes),
are less sensitive. Further research on the mechanisms governing sensitivity is
needed to improve biofilm control.
- Treatment suspension leads to an increase in the bacterial diversity of the initially
chlorinated biofilms, and to a convergence of the communities towards non-
chlorinated biofilms, although differences in the structure remain. This indicates
that the bacterial community is resilient to chlorine, but that the community at a
global scale keeps the ‘memory’ of the chlorination.
Jour
nal P
re-p
roof
Journal Pre-proof
Acknowledgements
The authors gratefully acknowledge the financial support of the French Water Agency, project
‘Experimental platform for the reuse of reclaimed wastewater in irrigation, Murviel-lès-
Montpellier’ (Project 2017-1399). We thank Guillaume Guizard (LBE-INRAE, Narbonne,
France) and Jean-François Bonicel (UMR ITAP-INRAE, Montpellier, France) for their
contribution to the development of the dripper system and Annabelle Mange (UMR G-Eau-
INRAE, Montpellier, France) for their assistance.
Disclosure statement
No potential conflict of interest was reported by the authors. Authors have approved the final
article.
References
Abecasis, A.B., Serrano, M., Alves, R., Quintais, L., Pereira-Leal, J.B., Henriques, A.O.,
2013. A genomic signature and the identification of new sporulation genes. J. Bacteriol.
195, 2101–2115. https://doi.org/10.1128/JB.02110-12
Ait-mouheb, N., Mayaux, P., Mateo-sagasta, J., Hartani, T., 2020. Water Reuse : a resource
for Mediterranean Agriculture. Water Resour. Mediterr. Reg. 1–25.
Ait-Mouheb, N., Schillings, J., Al-Muhammad, J., Bendoula, R., Tomas, S., Amielh, M.,
Anselmet, F., 2018. Impact of hydrodynamics on clay particle deposition and biofilm
development in a labyrinth-channel dripper. Irrig. Sci. 0, 0.
https://doi.org/10.1007/s00271-018-0595-7
Al-Muhammad, J., Tomas, S., Ait-Mouheb, N., Amielh, M., Anselmet, F., 2019.
Experimental and numerical characterization of the vortex zones along a labyrinth milli-
channel used in drip irrigation. Int. J. Heat Fluid Flow 80, 108500.
https://doi.org/10.1016/j.ijheatfluidflow.2019.108500
Jour
nal P
re-p
roof
Journal Pre-proof
Al-Muhammad, J., Tomas, S., Anselmet, F., 2016. Modeling a weak turbulent flow in a
narrow and wavy channel: case of micro-irrigation. Irrig. Sci. 34, 361–377.
https://doi.org/10.1007/s00271-016-0508-6
Allison, S.D., Martiny, J.B.H., 2009. Resistance, resilience, and redundancy in microbial
communities. Light Evol. 2, 149–166. https://doi.org/10.17226/12501
Assress, H.A., Selvarajan, R., Nyoni, H., Ntushelo, K., Mamba, B.B., Msagati, T.A.M., 2019.
Diversity, Co-occurrence and Implications of Fungal Communities in Wastewater
Treatment Plants. Sci. Rep. 9, 1–15. https://doi.org/10.1038/s41598-019-50624-z
Batista, R., Soares, A., Marin, O., Souza, J., Sartori, M., Batista, R., 2009. Efficiency of
chemical treatments in preventing the clogging of drippers by applying treated sanitary
sewerage. DYNA 76, 149–157.
Beyenal, H., Lewandowski, Z., 2002. Internal and external mass transfer in biofilms grown at
various flow velocities. Biotechnol. Prog. 18, 55–61. https://doi.org/10.1021/bp010129s
Blauert, F., Horn, H., Wagner, M., 2015. Time-resolved biofilm deformation measurements
using optical coherence tomography. Biotechnol. Bioeng. 112, 1893–1905.
https://doi.org/10.1002/bit.25590
Böhme, A., Risse-Buhl, U., Küsel, K., 2009. Protists with different feeding modes change
biofilm morphology. FEMS Microbiol. Ecol. 69, 158–169.
https://doi.org/10.1111/j.1574-6941.2009.00710.x
Chao, A., 1984. Non-parametric estimation of the classes in a population. Scand. J. Stat. 11,
265–270. https://doi.org/10.2307/4615964
Chauhdary, J.N., Bakhsh, A., Ahmad, N., Mehmood, K., 2015. Optimizing chlorine use for
improving performance of drip irrigation system under biologically contaminated water
source. Pakistan J. Agric. Sci. 52, 829–835.
Clarke, K.R., 1993. Non-parametric multivariate analyses of changes in community structure.
Jour
nal P
re-p
roof
Journal Pre-proof
Aust. J. Ecol. 18, 117–143. https://doi.org/10.1071/WR9840181
Dehghanisanij, H., Yamamoto, T., Ahmad, B.O., Fujiyama, H., Miyamoto, K., 2005. The
effect of chlorine on emitter clogging induced by algae and protozoa and the
performance of drip irrigation. Trans. ASAE 48, 519–527.
https://doi.org/10.13031/2013.18326
Derlon, N., Peter-Varbanets, M., Scheidegger, A., Pronk, W., Morgenroth, E., 2012. Predation
influences the structure of biofilm developed on ultrafiltration membranes. Water Res.
46, 3323–3333. https://doi.org/10.1016/j.watres.2012.03.031
Douterelo, I., Jackson, M., Solomon, C., Boxall, J., 2016. Microbial analysis of in situ biofilm
formation in drinking water distribution systems: implications for monitoring and control
of drinking water quality. Appl. Microbiol. Biotechnol. 100, 3301–3311.
https://doi.org/10.1007/s00253-015-7155-3
Duran-Ros, M., Puig-Bargués, J., Arbat, G., Barragán, J., Cartagena, F.R. de, 2009. Effect of
filter, emitter and location on clogging when using effluents. Agric. Water Manag. 96,
67–79. https://doi.org/10.1016/j.agwat.2008.06.005
Edgar, R.C., Haas, B.J., Clemente, J.C., Quince, C., Knight, R., 2011. UCHIME improves
sensitivity and speed of chimera detection. Bioinformatics 27, 2194–2200.
https://doi.org/10.1093/bioinformatics/btr381
Feng, J., Li, Y., Wang, W., Xue, S., 2018. Effect of optimization forms of flow path on
emitter hydraulic and anti-clogging performance in drip irrigation system. Irrig. Sci. 36,
37–47. https://doi.org/10.1007/s00271-017-0561-9
Fish, K.E., Boxall, J.B., 2018. Biofilm microbiome (re)growth dynamics in drinking water
distribution systems are impacted by chlorine concentration. Front. Microbiol. 9, 1–21.
https://doi.org/10.3389/fmicb.2018.02519
Goyal, M.R., 2018. Wastewater Management for Irrigation, Wastewater Management for
Jour
nal P
re-p
roof
Journal Pre-proof
Irrigation. https://doi.org/10.1201/b18967
Green, O., Katz, S., Tarchitzky, J., Chen, Y., 2018. Formation and prevention of biofilm and
mineral precipitate clogging in drip irrigation systems applying treated wastewater. Irrig.
Sci. 0, 1–14. https://doi.org/10.1007/s00271-018-0581-0
Hadziavdic, K., Lekang, K., Lanzen, A., Jonassen, I., Thompson, E.M., Troedsson, C., 2014.
Characterization of the 18s rRNA gene for designing universal eukaryote specific
primers. PLoS One 9. https://doi.org/10.1371/journal.pone.0087624
Hageskal, G., Tryland, I., Liltved, H., Skaar, I., 2012. No simple solution to waterborne fungi:
various responses to water disinfection methods. Water Supply 12, 220–226.
https://doi.org/10.2166/ws.2012.131
Han, S., Li, Y., Xu, F., Sun, D., Feng, J., Liu, Z., Wu, R., Wang, Z., 2018. Effect of Lateral
Flushing on Emitter Clogging under Drip Irrigation with Yellow River Water and a
Suitable Method. Irrig. Drain. 67, 199–209. https://doi.org/10.1002/ird.2193
J. Li, L. Chen, Y. Li, J. Yin, H. Zhang, 2010. Effects of Chlorination Schemes on Clogging in
Drip Emitters during Application of Sewage Effluent. Appl. Eng. Agric. 26, 565–578.
https://doi.org/10.13031/2013.32067
Jia, S., Shi, P., Hu, Q., Li, B., Zhang, T., Zhang, X.-X., 2015. Bacterial Community Shift
Drives Antibiotic Resistance Promotion during Drinking Water Chlorination. Environ.
Sci. Technol. 49, 12271–12279. https://doi.org/10.1021/acs.est.5b03521
Katz, S., Dosoretz, C., Chen, Y., Tarchitzky, J., 2014. Fouling formation and chemical control
in drip irrigation systems using treated wastewater. Irrig. Sci. 32, 459–469.
https://doi.org/10.1007/s00271-014-0442-4
Khaydarov, V., Borovinskaya, E.S., Reschetilowski, W., 2018. Numerical and experimental
investigations of a micromixer with chicane mixing geometry. Appl. Sci. 8, 3–6.
https://doi.org/10.3390/app8122458
Jour
nal P
re-p
roof
Journal Pre-proof
Lamm, F.R., 2013. Effect of Flushing Velocity and Flushing Duration on Sediment Transport
in Microirrigation Driplines. Trans. ASABE 56, 1821–1828.
https://doi.org/10.13031/trans.56.10293
Lamm, F.R., Ayars, J.E., Nakayama, F.S., 2007. Maintenance, in: Lamm, F.R., Ayars, J.E.,
Nakayama, F.S. (Eds.), Microirrigation for Crop Production: Design, Operation, and
Management, 13th Edn. Elsevier B.V., Amsterdam, pp. 1–643.
Lee, W.H., Pressman, J.G., Wahman, D.G., 2018. Three-Dimensional Free Chlorine and
Monochloramine Biofilm Penetration: Correlating Penetration with Biofilm Activity and
Viability. Environ. Sci. Technol. 52, 1889–1898. https://doi.org/10.1021/acs.est.7b05215
Lequette, K., Ait-Mouheb, N., Wéry, N., 2020. Hydrodynamic effect on biofouling of milli-
labyrinth channel and bacterial communities in drip irrigation systems fed with reclaimed
wastewater. Sci. Total Environ. 738, 139778.
https://doi.org/10.1016/j.scitotenv.2020.139778
Lequette, K., Ait-Mouheb, N., Wéry, N., 2019. Drip irrigation biofouling with treated
wastewater: bacterial selection revealed by high-throughput sequencing. Biofouling 35,
217–229. https://doi.org/10.1080/08927014.2019.1591377
Li, C., Wagner, M., Lackner, S., Horn, H., 2016. Assessing the influence of biofilm surface
roughness on mass transfer by combining optical coherence tomography and two-
dimensional modeling. Biotechnol. Bioeng. 113, 989–1000.
https://doi.org/10.1002/bit.25868
Li, J., Li, Y., Ohandja, D.G., Yang, F., Wong, F.S., Chua, H.C., 2008. Impact of filamentous
bacteria on properties of activated sludge and membrane-fouling rate in a submerged
MBR. Sep. Purif. Technol. 59, 238–243. https://doi.org/10.1016/j.seppur.2007.06.011
Li, J.S., Li, Y.F., Zhang, H., 2012. Tomato Yield and Quality and Emitter Clogging as
Affected by Chlorination Schemes of Drip Irrigation Systems Applying Sewage Effluent.
Jour
nal P
re-p
roof
Journal Pre-proof
J. Integr. Agric. 11, 1744–1754. https://doi.org/10.1016/S2095-3119(12)60179-8
Li, N., Kang, Y., Li, X., Wan, S., Zhang, C., Wang, X., 2019. Lateral flushing with fresh
water reduced emitter clogging in drip irrigation with treated effluent. Irrig. Sci. 37, 627–
635. https://doi.org/10.1007/s00271-019-00637-3
Li, Y., Li, J., 2009. Effects of chlorination on emitter clogging and tomato yield and nitrogen
uptake in a drip irrigation system with sewage effluent. Am. Soc. Agric. Biol. Eng.
Annu. Int. Meet. 2009, ASABE 2009 4, 2531–2543.
https://doi.org/10.13031/2013.27047
Li, Y., Pan, J., Chen, X., Xue, S., Feng, J., Muhammad, T., Zhou, B., 2019. Dynamic effects
of chemical precipitates on drip irrigation system clogging using water with high
sediment and salt loads. Agric. Water Manag. 213, 833–842.
https://doi.org/10.1016/j.agwat.2018.11.021
Li, Y., Song, P., Pei, Y., Feng, J., 2015. Effects of lateral flushing on emitter clogging and
biofilm components in drip irrigation systems with reclaimed water. Irrig. Sci. 33, 235–
245. https://doi.org/10.1007/s00271-015-0462-8
Li, Y., Zhou, B., Liu, Y., Jiang, Y., Pei, Y., Shi, Z., 2013. Preliminary surface topographical
characteristics of biofilms attached on drip irrigation emitters using reclaimed water.
Irrig. Sci. 31, 557–574. https://doi.org/10.1007/s00271-012-0329-1
Li, Z., Yu, L., Li, N., Chang, L., Cui, N., 2018. Influence of flushing velocity and flushing
frequency on the service life of labyrinth-channel emitters. Water (Switzerland) 10.
https://doi.org/10.3390/w10111630
Mathieu, L., Bertrand, I., Abe, Y., Angel, E., Block, J.C., Skali-Lami, S., Francius, G., 2014.
Drinking water biofilm cohesiveness changes under chlorination or hydrodynamic stress.
Water Res. 55, 175–184. https://doi.org/10.1016/j.watres.2014.01.054
McMurdie, P., Holmes, S., 2012. PHYLOSEQ: a biocondutor package for handling and
Jour
nal P
re-p
roof
Journal Pre-proof
analysis of high-throughput phylogenetic sequence data. Pac Symp Biocomput 235–246.
Mi, Z., Dai, Y., Xie, S., Chen, C., Zhang, X., 2015. Impact of disinfection on drinking water
biofilm bacterial community. J. Environ. Sci. (China) 37, 200–205.
https://doi.org/10.1016/j.jes.2015.04.008
Moreira, J.M.R., Teodósio, J.S., Simões, M., Melo, L.F., Mergulhão, F.J., 2013. Biofilm
formation under turbulent conditions: external mass transfer versus shear stress. Int.
Conf. Heat Exch. Fouling Clean. 2013, 200–204.
Naher, S., Orpen, D., Brabazon, D., Poulsen, C.R., Morshed, M.M., 2011. Effect of micro-
channel geometry on fluid flow and mixing. Simul. Model. Pract. Theory 19, 1088–
1095. https://doi.org/10.1016/j.simpat.2010.12.008
Navarro, R.R., Hori, T., Inaba, T., Matsuo, K., Habe, H., Ogata, A., 2016. High-resolution
phylogenetic analysis of residual bacterial species of fouled membranes after NaOCl
cleaning. Water Res. 94, 166–175. https://doi.org/10.1016/j.watres.2016.02.044
Nguyen, N.-P., Warnow, T., Pop, M., White, B., 2016. A perspective on 16S rRNA
operational taxonomic unit clustering using sequence similarity. npj Biofilms
Microbiomes 2, 16004. https://doi.org/10.1038/npjbiofilms.2016.4
Oliveira, F., Lavanholi, R., Camargo, A., Frizzone, A., Ait-Mouheb, N., Tomas, S., Molle, B.,
2017. Influence of Concentration and Type of Clay Particles on Dripper Clogging. Irrig.
Drain. Syst. Eng. 06, 1–5. https://doi.org/10.4172/2168-9768.1000184
Oliveira, F.C., Lavanholi, R., de Camargo, A.P., Ait-Mouheb, N., Frizzone, J.A., Tomas, S.,
Molle, B., 2020. Clogging of drippers caused by suspensions of kaolinite and
montmorillonite clays. Irrig. Sci. 38, 65–75. https://doi.org/10.1007/s00271-019-00652-4
Parry, J., 2004. Protozoan Grazing of Freshwater Biofilms. Adv. Appl. Microbiol. 54.
https://doi.org/0065-2164/04
Parry, J.D., Holmes, A.K., Unwin, M.E., Laybourn-Parry, J., 2007. The use of ultrasonic
Jour
nal P
re-p
roof
Journal Pre-proof
imaging to evaluate the effect of protozoan grazing and movement on the topography of
bacterial biofilms. Lett. Appl. Microbiol. 45, 364–370. https://doi.org/10.1111/j.1472-
765X.2007.02213.x
Picioreanu, C., Blauert, F., Horn, H., Wagner, M., 2018. Determination of mechanical
properties of bio fi lms by modelling the deformation measured using optical coherence
tomography. Water Res. 145, 588–598. https://doi.org/10.1016/j.watres.2018.08.070
Puig-Bargués, J., Arbat, G., Elbana, M., Duran-Ros, M., Barragán, J., de Cartagena, F.R.,
Lamm, F.R., 2010. Effect of flushing frequency on emitter clogging in microirrigation
with effluents. Agric. Water Manag. 97, 883–891.
https://doi.org/10.1016/j.agwat.2010.01.019
Rav-Acha, C., Kummel, M., Salamon, I., Adin, A., 1995. The effect of chemical oxidants on
effluent constituents for drip irrigation. Water Res. 29, 119–129.
https://doi.org/10.1016/0043-1354(94)E0113-K
Rizk, N., Ait-Mouheb, N., Molle, B., Roche, N., 2019. Treated wastewater reuse in micro-
irrigation: effect of shear stress on biofilm development kinetics and chemical
precipitation. Environ. Technol. 0, 1–11.
https://doi.org/10.1080/09593330.2019.1625956
Rochex, A., Godon, J.J., Bernet, N., Escudié, R., 2008. Role of shear stress on composition,
diversity and dynamics of biofilm bacterial communities. Water Res. 42, 4915–4922.
https://doi.org/10.1016/j.watres.2008.09.015
Schindelin, J., Arganda-Carrera, I., Frise, E., Verena, K., Mark, L., Tobias, P., Stephan, P.,
Curtis, R., Stephan, S., Benjamin, S., Jean-Yves, T., Daniel, J.W., Volker, H., Kevin, E.,
Pavel, T., Albert, C., 2009. Fiji - an Open platform for biological image analysis. Nat.
Methods 9, 241. https://doi.org/10.1038/nmeth.2019.Fiji
Schloss, P.D., Westcott, S.L., Ryabin, T., Hall, J.R., Hartmann, M., Hollister, E.B.,
Jour
nal P
re-p
roof
Journal Pre-proof
Lesniewski, R.A., Oakley, B.B., Parks, D.H., Robinson, C.J., Sahl, J.W., Stres, B.,
Thallinger, G.G., Van Horn, D.J., Weber, C.F., 2009. Introducing mothur: open-source,
platform-independent, community-supported software for describing and comparing
microbial communities. Appl. Environ. Microbiol. 75, 7537–41.
https://doi.org/10.1128/AEM.01541-09
Shaw, J.L.A., Monis, P., Fabris, R., Ho, L., Braun, K., Drikas, M., Cooper, A., 2014.
Assessing the impact of water treatment on bacterial biofilms in drinking water
distribution systems using high-throughput DNA sequencing. Chemosphere 117, 185–
192. https://doi.org/10.1016/j.chemosphere.2014.06.077
Song, P., Feng, G., Brooks, J., Zhou, B., Zhou, H., Zhao, Z., Li, Y., 2019. Environmental risk
of chlorine-controlled clogging in drip irrigation system using reclaimed water: the
perspective of soil health. J. Clean. Prod. 232, 1452–1464.
https://doi.org/10.1016/j.jclepro.2019.06.050
Song, P., Li, Y., Zhou, B., Zhou, C., Zhang, Z., Li, J., 2017. Controlling mechanism of
chlorination on emitter bio-clogging for drip irrigation using reclaimed water. Agric.
Water Manag. 184, 36–45. https://doi.org/10.1016/j.agwat.2016.12.017
Sonigo, P., Toni, A. De, Reilly, K., 2011. A Review ofFungi in Drinking Water and the
Implications for Human Health. Paris.
Tarchitzky, J., Rimon, A., Kenig, E., Dosoretz, C.G., Chen, Y., 2013. Biological and chemical
fouling in drip irrigation systems utilizing treated wastewater. Irrig. Sci. 31, 1277–1288.
https://doi.org/10.1007/s00271-013-0406-0
Tsvetanova, Z., 2020. Quantification of the bacterial community of drinking water ‑
associated biofilms under different flow velocities and changing chlorination regimes.
Appl. Water Sci. https://doi.org/10.1007/s13201-019-1086-6
Valladares Linares, R., Wexler, A.D., Bucs, S.S., Dreszer, C., Zwijnenburg, A., Flemming,
Jour
nal P
re-p
roof
Journal Pre-proof
H.C., Kruithof, J.C., Vrouwenvelder, J.S., 2016. Compaction and relaxation of biofilms.
Desalin. Water Treat. 57, 12902–12914.
https://doi.org/10.1080/19443994.2015.1057036
Wagner, M., Horn, H., 2017. Optical coherence tomography in biofilm research: A
comprehensive review. Biotechnol. Bioeng. https://doi.org/10.1002/bit.26283
Wang, J., Gong, S., Xu, D., Yu, Y., Zhao, Y., 2013. Impact of drip and level-basin irrigation
on growth and yield of winter wheat in the North China Plain. Irrig. Sci. 31, 1025–1037.
https://doi.org/10.1007/s00271-012-0384-7
Wang, Y., Qian, P.Y., 2009. Conservative fragments in bacterial 16S rRNA genes and primer
design for 16S ribosomal DNA amplicons in metagenomic studies. PLoS One 4.
https://doi.org/10.1371/journal.pone.0007401
Wang, Y.H., Wu, Y.H., Tong, X., Yu, T., Peng, L., Bai, Y., Zhao, X.H., Huo, Z.Y., Ikuno, N.,
Hu, H.Y., 2019a. Chlorine disinfection significantly aggravated the biofouling of reverse
osmosis membrane used for municipal wastewater reclamation. Water Res. 154, 246–
257. https://doi.org/10.1016/j.watres.2019.02.008
Wang, Y.H., Wu, Y.H., Yu, T., Zhao, X.H., Tong, X., Bai, Y., Huo, Z.Y., Hu, H.Y., 2019b.
Effects of chlorine disinfection on the membrane fouling potential of bacterial strains
isolated from fouled reverse osmosis membranes. Sci. Total Environ. 693, 133579.
https://doi.org/10.1016/j.scitotenv.2019.133579
Wang, Z., Li, J., Li, Y., 2017. Using Reclaimed Water for Agricultural and Landscape
Irrigation in China: a Review. Irrig. Drain. https://doi.org/10.1002/ird.2129
Wei, Z., Cao, M., Liu, X., Tang, Y., Lu, B., 2012. Flow behaviour analysis and experimental
investigation for emitter micro-channels. Chinese J. Mech. Eng. (English Ed. 25, 729–
737. https://doi.org/10.3901/CJME.2012.04.729
Xue, Z., Seo, Y., 2013. Impact of chlorine disinfection on redistribution of cell clusters from
Jour
nal P
re-p
roof
Journal Pre-proof
biofilms. Environ. Sci. Technol. 47, 1365–1372. https://doi.org/10.1021/es304113e
Yu, L., Li, N., Long, J., Liu, X., Yang, Q., 2018a. The mechanism of emitter clogging
analyzed by CFD – DEM simulation and PTV experiment. Adv. Mech. Eng. 10, 1–10.
https://doi.org/10.1177/1687814017743025
Yu, L., Li, N., Yang, Q., Liu, X., 2018b. Influence of Flushing Pressure before Irrigation on
the Anti-Clogging Performance of Labyrinth Channel Emitters. Irrig. Drain. 67, 191–
198. https://doi.org/10.1002/ird.2173
Zhang, H., Tian, Y., Kang, M., Chen, C., Song, Y., Li, H., 2019. Effects of
chlorination/chlorine dioxide disinfection on biofilm bacterial community and corrosion
process in a reclaimed water distribution system. Chemosphere 215, 62–73.
https://doi.org/10.1016/j.chemosphere.2018.09.181
Zhang, W., Niu, W., Li, G., Wang, J., Wang, Y., Dong, A., 2020. Lateral inner environment
changes and effects on emitter clogging risk for different irrigation times. Agric. Water
Manag. 233. https://doi.org/10.1016/j.agwat.2020.106069
Zhou, B., Wang, D., Wang, T., Li, Y., 2018. Chemical Clogging Behavior in Drip Irrigation
Systems Using Reclaimed Water. Trans. ASABE 61, 1667–1675.
https://doi.org/10.13031/trans.12902
Zhou, B., Wang, T., Li, Y., Bralts, V., 2017. Effects of microbial community variation on bio-
clogging in drip irrigation emitters using reclaimed water. Agric. Water Manag. 194,
139–149. https://doi.org/10.1016/j.agwat.2017.09.006
Jour
nal P
re-p
roof
Journal Pre-proof
Declaration of interests
☒ The authors declare that they have no known competing financial interests or personal relationships that could have appeared to influence the work reported in this paper.
☐The authors declare the following financial interests/personal relationships which may be
considered as potential competing interests:
Jo
urna
l Pre
-pro
of
Journal Pre-proof
Credit Author
Kévin Lequette : Conceptualization, Investigation, Methodology, Formal analysis,
Visualization, Writing - Review & Editing
Nassim Ait-Mouheb : Supervision, Methodology , Writing - Review & Editing
Nicolas Adam : Formal analysis, Visualization
Marine Muffat-Jeandet : Methodology, Ressources
Valérie Bru-Adan : Ressources
Nathalie Wéry : Supervision, Methodology, Writing - Review & Editing
Jour
nal P
re-p
roof
Journal Pre-proof
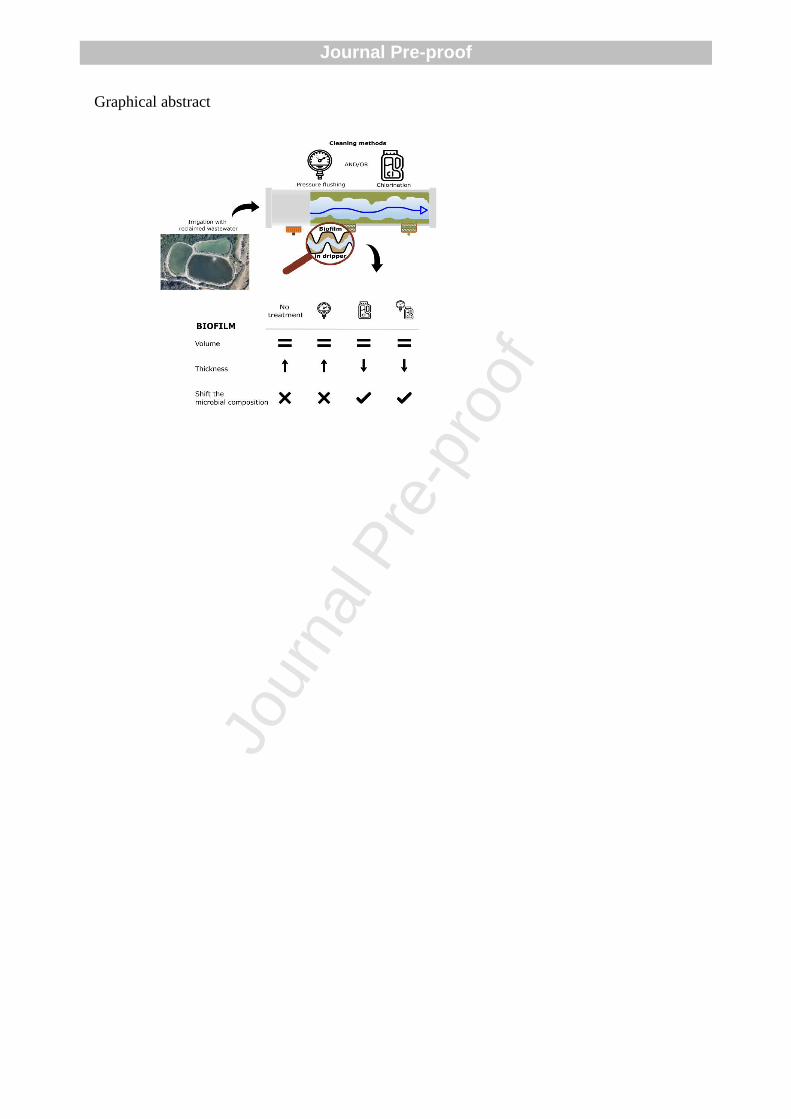
Graphical abstract
Jour
nal P
re-p
roof
Journal Pre-proof
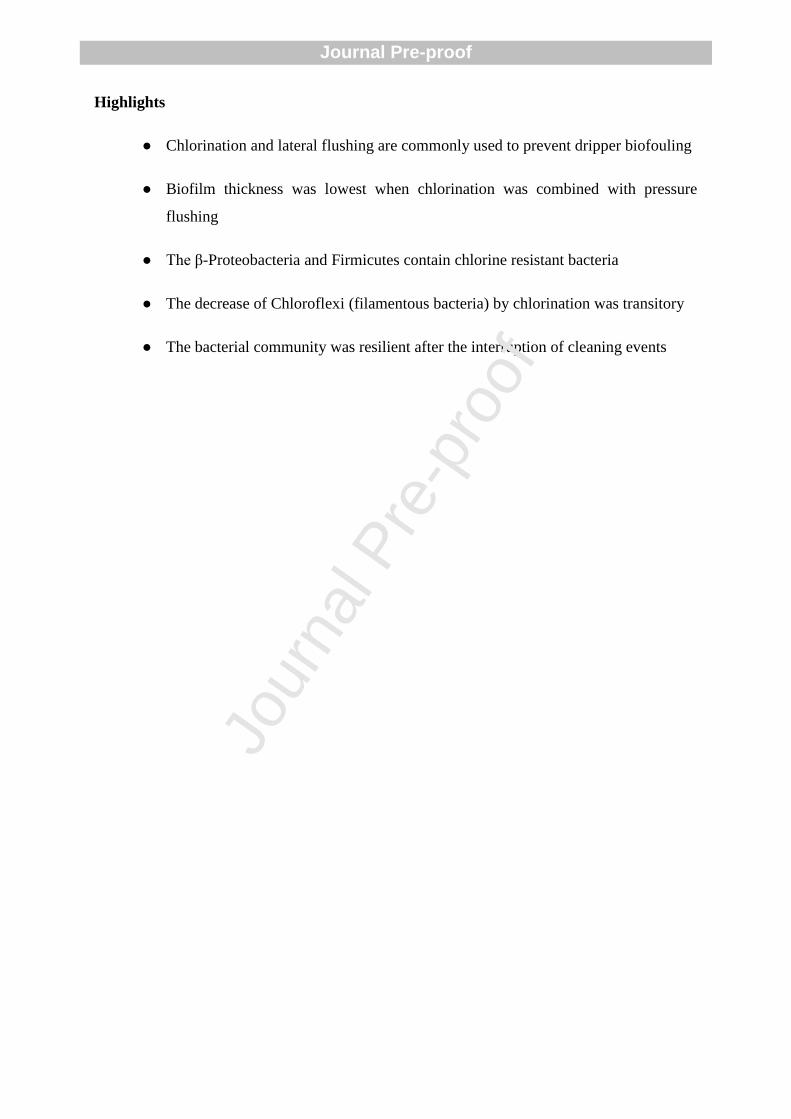
Highlights
● Chlorination and lateral flushing are commonly used to prevent dripper biofouling
● Biofilm thickness was lowest when chlorination was combined with pressure
flushing
● The β-Proteobacteria and Firmicutes contain chlorine resistant bacteria
● The decrease of Chloroflexi (filamentous bacteria) by chlorination was transitory
● The bacterial community was resilient after the interruption of cleaning events
Jour
nal P
re-p
roof
Journal Pre-proof