Embed Size (px)
Citation preview
Effects of Timber Harvest on Aquatic Macroinvertebrate CommunityComposition in a Northern Idaho Watershed
John A. Gravelle, Timothy E. Link, Justin R. Broglio, and Jeff H. Braatne
Abstract: Annual macroinvertebrate sampling was performed from 1994 to 2005 in the Mica Creek Experi-mental Watershed in northern Idaho to examine the relationship between contemporary timber harvest practicesand the structure and diversity of aquatic macroinvertebrate assemblages. Four years of calibration, 4 years ofpostroad, and 4 years of postharvest (roads ! harvest) data were used to analyze treatment effects. Metrics usedto assess change included functional feeding group composition, organism densities, taxa richness indices,species diversity, and sediment tolerance indices. These assessments included changes to three macroinverte-brate taxa commonly used as bioindicators of stream habitat quality: Ephemeroptera (mayflies), Plecoptera(stoneflies), and Trichoptera (caddis flies) (EPT). In relation to pretreatment conditions, there were generally nomajor changes in functional feeding group composition or species diversity. Increases were observed in overallabundance and EPT abundance, but they largely can be explained by natural population variability. These resultssuggest that little or no change in macroinvertebrate communities resulted from road construction and timberharvest activities in the watershed. Substantial interannual variability was also observed, suggesting thatinfrequent biomonitoring may not provide adequate information to assess subtle disturbance effects in water-sheds but can be an effective part of a comprehensive watershed monitoring program when coupled with otherbiotic and abiotic metrics. FOR. SCI. 55(4):352–366.
Keywords: aquatic macroinvertebrates, water quality, timber harvest, Pacific Northwest, Mica Creek
WATER QUALITY and aquatic ecosystem health arecritical issues that affect management of for-ested watersheds. Although timber harvest and
associated road construction practices have changed dra-matically through increased stream protection requirementsand implementation of best management practice (BMP)programs, more data are needed to determine their effec-tiveness. Timber harvest and road construction activitiescan change several aspects of stream ecosystems includingwater temperature (Gravelle and Link 2007), light (Davies-Colley and Rutherford 2005), and flow regimes (Stednick1996) that can lead to changes in primary production (Fuchset al. 2003), allochthonous and autochthonous organic mat-ter dynamics (Bilby and Bisson 1992), and macroinverte-brate community structure (Stone and Wallace 1998). Tim-ber harvest and road construction activities in mountainouswatersheds also have the potential to increase the amount offine sediment entering streams (Haggerty et al. 2004). Thesesediment inputs can potentially affect all biotic componentsof stream ecosystems (Relyea et al. 2000).
One method of assessing water quality and the eco-logical health of stream ecosystems is with benthic mac-roinvertebrates. Because they are relatively sedentary andgenerally have life cycles that leave them continuallyexposed to aquatic condition changes, benthic macroin-
vertebrates are widely used for assessing the biologicalintegrity of water bodies (Karr 1991, Bonada et al. 2006).Macroinvertebrates are popular organisms for monitoringwadeable streams in the Pacific Northwest and standard-ized protocols exist for sampling and analysis (Plafkin etal. 1989, Barbour et al. 1999). In addition, species as-semblage measurements are used as bioassessment toolsto estimate lotic ecosystem health (Idaho Division ofEnvironmental Quality 1996, 2002, Gibson et al. 1996,Fortino et al. 2004). Macroinvertebrates are consideredvaluable bioindicators because of their sensitivity tochanges in sediment, organic matter, temperature, andlight levels (Haggerty et al. 2004). Sediment inputs mayhave positive, negative, or neutral effects on macroinver-tebrate communities, depending on the quantities in-volved, geologic characteristics, nature of the streambed,composition of flora and fauna, and time of year (Mc-Clelland 1972). There are several other environmentalvariables that affect macroinvertebrate community com-position, including sediment composition and particlesize (Peeters et al. 2004), streamside vegetation, hypo-rheic and near-bed flows, and longitudinal hydraulic gra-dients. These variables influence the input and dynamicsof organic matter, nutrients, temperature, and radiativeenergy.
John A. Gravelle, University of Idaho, Environmental Science Program, 975 West 6th Street, Moscow, ID 83844-1133—[email protected]. Timothy E.Link, University of Idaho, College of Natural Resources, Moscow, ID—[email protected]. Justin R. Broglio, University of Idaho, College of NaturalResources, Moscow, ID. Jeff H. Braatne, University of Idaho, College of Natural Resources, Moscow, ID.
Acknowledgments: We recognize Dale J. McGreer for his foresight, planning, and implementation that made the Mica Creek Experimental Watershed therich resources that it has become. Justin Broglio’s participation was funded by the University of Idaho, College of Natural Resources Berklund UndergraduateResearch Award. Support for the basic data collection and laboratory analyses was provided by Potlatch Corporation. The analysis was partially supportedby the National Research Initiative of the US Cooperative State Research, Education, and Extension Service (Grant 2003-01264). Gratitude is extended toTerry Cundy and two anonymous reviewers whose comments greatly improved this manuscript. We also give special thanks to Bob Danehy for offering hisexpertise and enthusiasm in reviewing these research results. Last, this manuscript is dedicated to the memory of Dr. Jeff Braatne, whose contribution anddedication to this article, as well as the field of riparian and aquatic ecology, will be deeply missed.
Manuscript received October 18, 2007, accepted April 30, 2009 Copyright © 2009 by the Society of American Foresters
352 Forest Science 55(4) 2009
Within a given stream reach, macroinvertebrate commu-nity composition is controlled by complex interactions be-tween species assemblages, watershed physiography, hy-droclimatic regime, and the type and extent of disturbance.Disturbance by timber harvest can result in macroinverte-brate responses that are highly varied. For example, in alow-gradient sand-bottomed stream, clear-cutting alteredspecies composition and the richness and proportional abun-dance of functional feeding groups, with an increase incollector-gatherers and scrapers and a decrease in shredders(Kedzierski and Smock 2001). A similar trend of increasingscraper and declining shredder abundance after clear-cuttingwas noted in a low elevation oak (Quercus spp.) and hickory(Carya spp.) watershed in North Carolina (Stone and Wal-lace 1998). Macroinvertebrate densities in a subboreal forestincreased immediately after clear-cutting as a result of in-creased light levels, which increased primary production(Fuchs et al. 2003). In a broad survey of macroinvertebratecommunity responses to logging in eastern Quebec, taxo-nomic richness was observed to decline, with a shift in thesize structure of the macroinvertebrate community towardsmaller species (Martel et al. 2007). Declines in taxonomicrichness may occur after only a small portion of the water-shed is harvested (Kiffney et al. 2003), which could becaused by shifts in shredder and chironomid populations asa result of increased sedimentation from logging roads(Kreutzweiser et al. 2005). At the H.J. Andrews Experimen-tal Forest in Oregon, postharvest research showed increasedmacroinvertebrate densities (Murphy and Hall 1981, Mur-phy et al. 1981, Hawkins et al. 1982). After several decadesof postharvest recovery, there were similar densities andemergence patterns in both young- and old-growth forestedstreams at the H.J. Andrews Experimental Forest (Frady etal. 2007).
Whereas these previous studies revealed the range ofresponses that may arise between streams, the range ofresults also stress the importance of understanding howdifferent types of practices affect macroinvertebrate com-munities in different regions. The objectives of this studywere to assess the effects of contemporary timber harvestpractices and BMP effectiveness on macroinvertebrate com-munity composition and species diversity in an interiorPacific Northwest watershed, as well as assess downstreamcumulative effects of these activities using the same macro-invertebrate metrics.
Study SiteSite Characteristics
The Mica Creek Experimental Watershed (MCEW) is apaired and nested watershed study area in Shoshone Countyof northern Idaho (Figure 1). The watershed is privatelyheld by Potlatch Corporation and is managed primarily fortimber production. Mica Creek is a tributary of the St. JoeRiver, and the research area includes the headwaters of thewest fork and main stem of Mica Creek. The MCEW islocated at approximately 47.17°N latitude, 116.28°W lon-gitude, is approximately 2,700 ha in size, and ranges from1,000 to 1,600 m above mean sea level. Average annual airtemperature is 5°C, and average annual precipitation is
approximately 1,450 mm, over half of which typically fallsas snow. The geology is characterized by silt loam soil, andparent material is mainly gneiss and quartzite metasedi-ments. The area is mountainous with V-shaped valleys andmoderately sloped hillsides of 15–30%. Stream gradientsrange from 3 to 20%, and large and small organic debrisprovide step-pool configurations, with riffle-run habitats inlower gradient reaches. Substrate composition varies be-tween reaches, but the majority consists of large gravelsand sands.
The study area contains naturally regenerated, second-growth forest, approximately 70–80 years old. The second-growth forest is a mixture of tree species, mainly Grandfir (Abies grandis), Douglas-fir (Pseudotsuga menziesii),Western redcedar (Thuja plicata), and Western larch (Larixoccidentalis). There are also several stands of old-growthWestern redcedar within the MCEW that were unscathedby 20th century logging and fires. Tree species in the ri-parian zone are predominantly Western redcedar, Grandfir, and Engelmann spruce, with high densities of alder(Alnus spp.). Redosier dogwood (Cornus sericea), willows(Salix spp.), Rocky Mountain maple (Acer glabrum), cur-rants (Ribes spp.), thimbleberry (Rubus parviflorus), high-bush cranberry (Viburnum edule), and bracken ferns(Pteridium aquilinum) are also commonly found as stream-side understory vegetation.
Resident fish species found are westslope cutthroat trout(Oncorhynchus clarki lewisi), brook trout (Salvelinus fonti-nalis), and sculpin (Cottidae spp.). Common amphibiansinclude Rocky Mountain tailed frogs (Ascaphus montanus)and Idaho giant salamanders (Dicamptodon aterrimus).
Initial biological assessments before road constructionrevealed considerable variation between the upper, middle,and lower stream reaches, with the functional feeding groups,shredders and collectors, dominating the upper reaches(White 1997). This initial study also determined that taxarichness had no relationship to stream size and thatcollector-filterers were nearly constant among sites. A highdegree of taxonomic variation was observed throughout thewatershed, but this variation was related to habitat changeswith progression downstream (White 1997).
Site History and Experimental TreatmentsIn the early 1900s, approximately 95% of the overstory
canopy was removed from the MCEW using historic har-vesting techniques that included steam donkeys, horse-logging, log-transport flumes, and a narrow gauge railroad(Schultz 2000). By the early 1930s, logging ceased in upperMica Creek. In December 1933, a large rain-on-snow floodseemed to flush a substantial amount of sediment throughthe Mica Creek stream network (Schultz 2000). Between theearly 1930s and initiation of experimental treatments in thelate 1990s, the site was relatively undisturbed and is typicalof many second-growth forests in the region.
The experimental phase began in 1991, when a series ofpaired and nested catchments were instrumented to assesschanges in water flow, sediment, temperature, nutrient fluxes,channel stability, macroinvertebrate communities, and fishpopulations resulting from contemporary timber harvest
Forest Science 55(4) 2009 353
practices. Instrumentation consisted of seven steel Parshallflumes and instrument shelters at long-term stream gauginglocations. In addition to the flumes, Campbell ScientificCR10 dataloggers, Riverside Technology pressure transduc-ers, ISCO 3700 sediment samplers, and Campbell Scientific107 water temperature sensors were installed. Hydrometeo-rological instrumentation consisting of both all-season andtipping-bucket precipitation gauges and shielded air temper-ature sensors were installed.
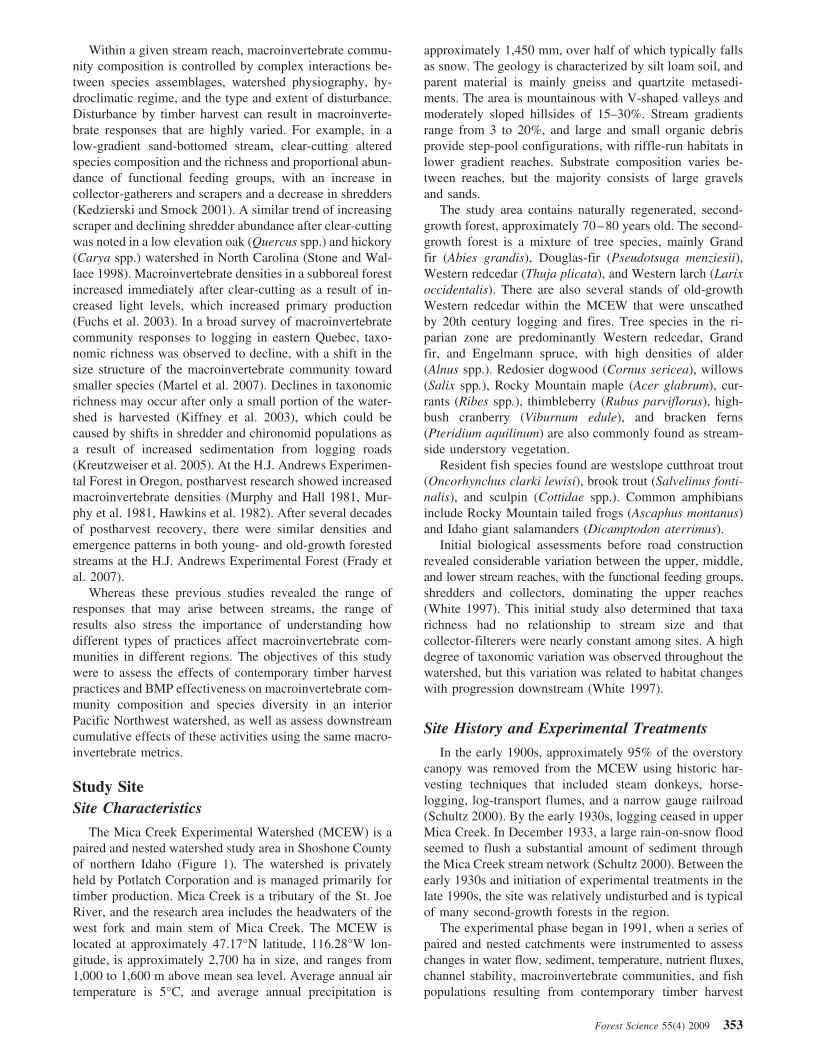
Beginning in 1994, macroinvertebrate communities weresampled annually in reaches near the Parshall flumes (Fig-ure 1). Three headwater reaches (flumes 1, 2, and 3) on thewest fork of Mica Creek were used as control-treatmentpairs to assess the effects of clearcut and partial cut harvestpractices. Reaches near flumes 4–7 were used to assess
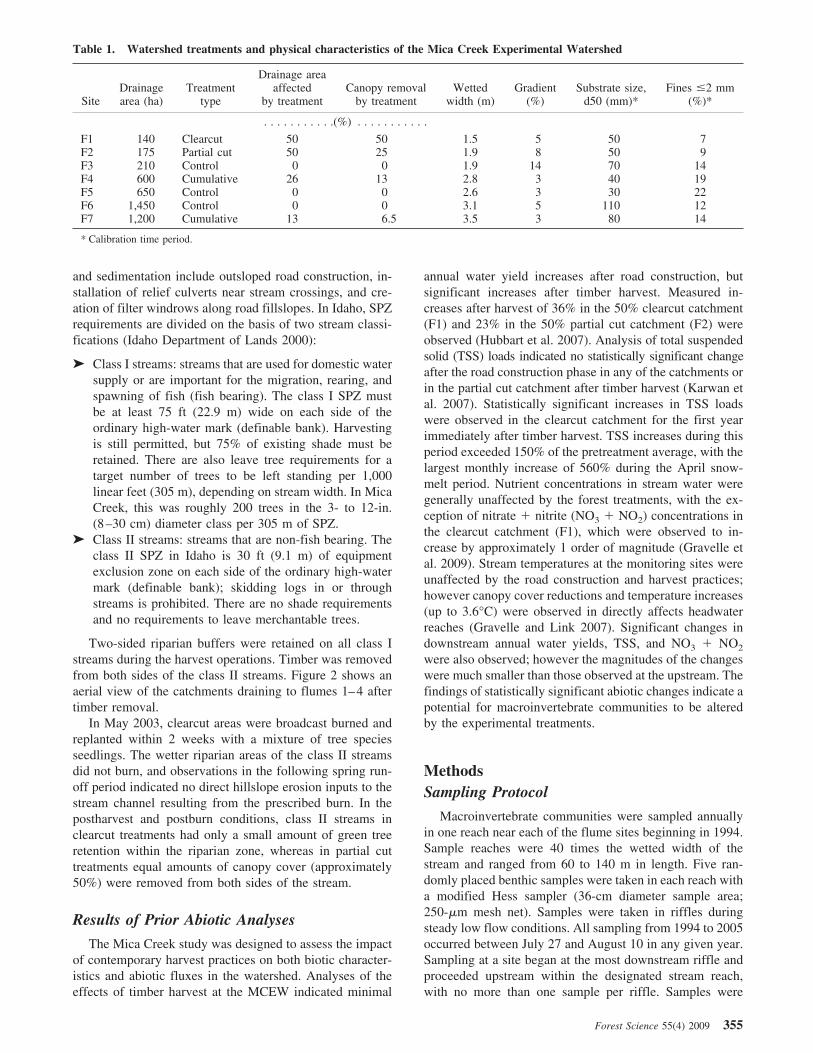
downstream cumulative effects. These seven flume stations(F1–F7) provide clearcut treatment (F1), partial cut treat-ment (F2), control (F3), downstream cumulative treatment(F4 and F7), and downstream control (F5 and F6) samplinglocations. Table 1 summarizes flumes 1–7 (F1–F7) harvesttreatment information and stream channel characteristics foreach location.
To isolate the effects of road construction from vegeta-tion removal due to timber harvest, roads for timber harvestwere constructed in the fall of 1997. Harvesting occurred 4years later with a combination of line and tractor skidding inthe late summer and fall of 2001. All timber harvest androad construction activities were conducted in compliancewith Idaho Forest Practices Act and Stream Protection Zone(SPZ) requirements. Contemporary BMPs to reduce erosion
Figure 1. MCEW, with road construction/timber harvest areas and sampling sites.
354 Forest Science 55(4) 2009
and sedimentation include outsloped road construction, in-stallation of relief culverts near stream crossings, and cre-ation of filter windrows along road fillslopes. In Idaho, SPZrequirements are divided on the basis of two stream classi-fications (Idaho Department of Lands 2000):
! Class I streams: streams that are used for domestic watersupply or are important for the migration, rearing, andspawning of fish (fish bearing). The class I SPZ mustbe at least 75 ft (22.9 m) wide on each side of theordinary high-water mark (definable bank). Harvestingis still permitted, but 75% of existing shade must beretained. There are also leave tree requirements for atarget number of trees to be left standing per 1,000linear feet (305 m), depending on stream width. In MicaCreek, this was roughly 200 trees in the 3- to 12-in.(8–30 cm) diameter class per 305 m of SPZ.
! Class II streams: streams that are non-fish bearing. Theclass II SPZ in Idaho is 30 ft (9.1 m) of equipmentexclusion zone on each side of the ordinary high-watermark (definable bank); skidding logs in or throughstreams is prohibited. There are no shade requirementsand no requirements to leave merchantable trees.
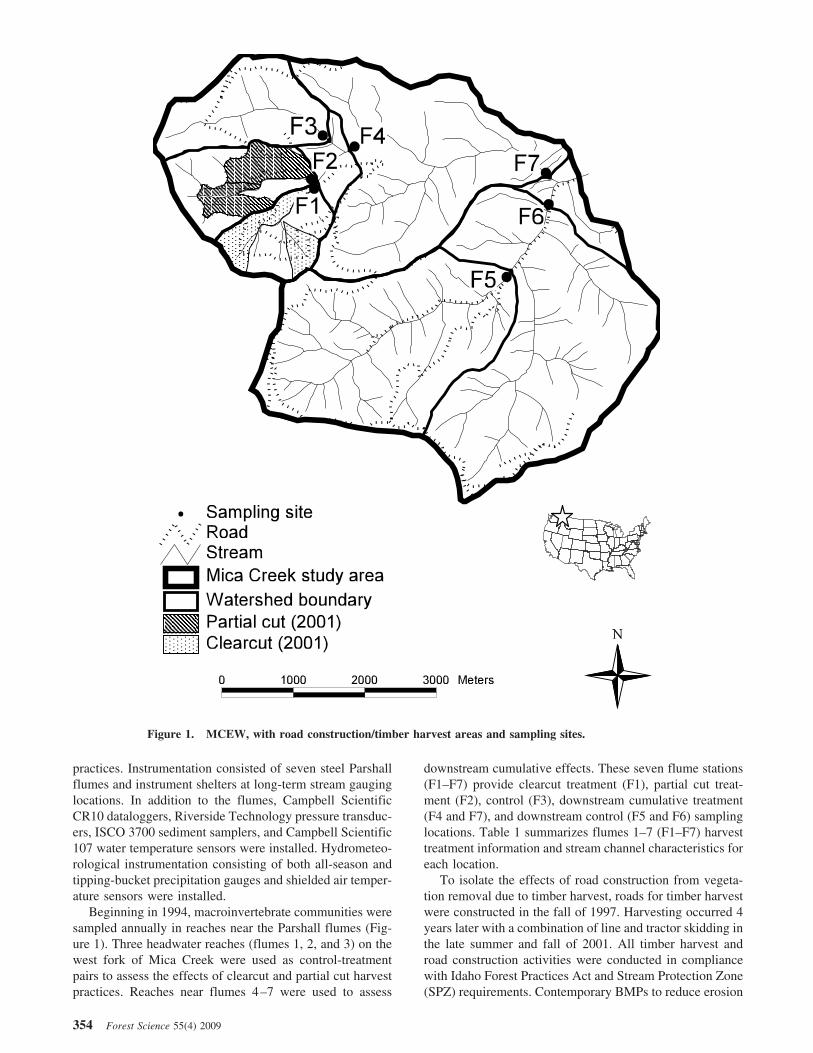
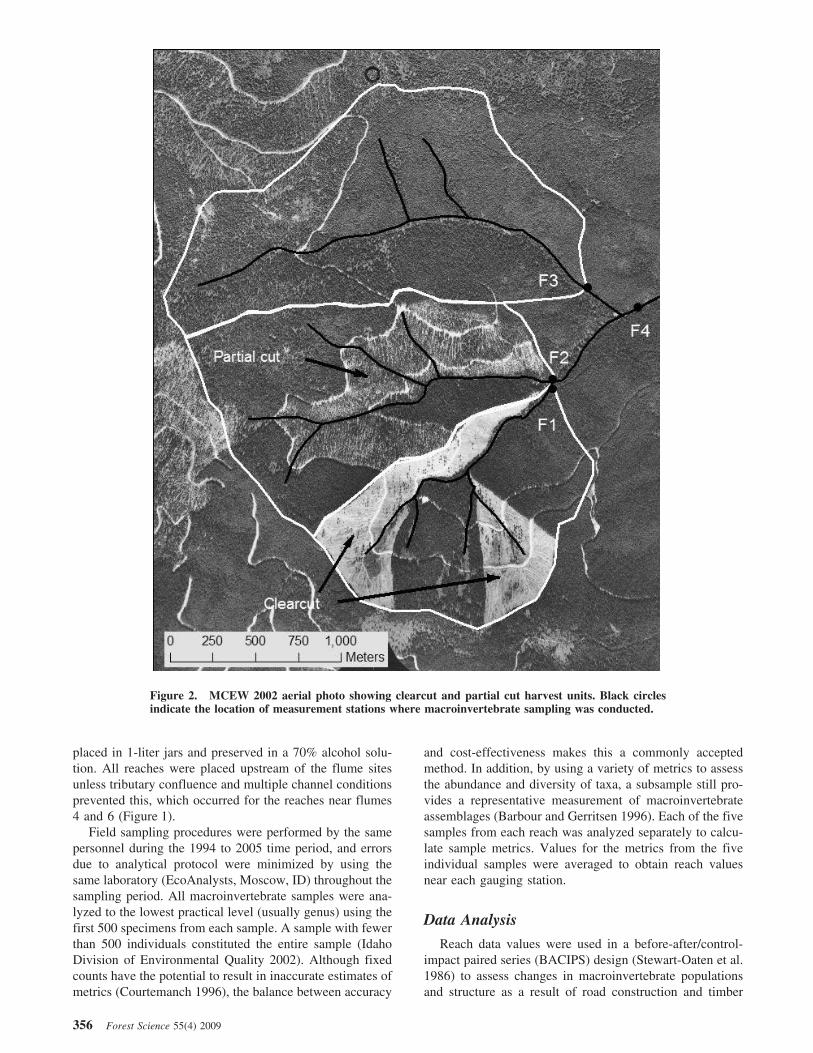
Two-sided riparian buffers were retained on all class Istreams during the harvest operations. Timber was removedfrom both sides of the class II streams. Figure 2 shows anaerial view of the catchments draining to flumes 1–4 aftertimber removal.
In May 2003, clearcut areas were broadcast burned andreplanted within 2 weeks with a mixture of tree speciesseedlings. The wetter riparian areas of the class II streamsdid not burn, and observations in the following spring run-off period indicated no direct hillslope erosion inputs to thestream channel resulting from the prescribed burn. In thepostharvest and postburn conditions, class II streams inclearcut treatments had only a small amount of green treeretention within the riparian zone, whereas in partial cuttreatments equal amounts of canopy cover (approximately50%) were removed from both sides of the stream.
Results of Prior Abiotic AnalysesThe Mica Creek study was designed to assess the impact
of contemporary harvest practices on both biotic character-istics and abiotic fluxes in the watershed. Analyses of theeffects of timber harvest at the MCEW indicated minimal
annual water yield increases after road construction, butsignificant increases after timber harvest. Measured in-creases after harvest of 36% in the 50% clearcut catchment(F1) and 23% in the 50% partial cut catchment (F2) wereobserved (Hubbart et al. 2007). Analysis of total suspendedsolid (TSS) loads indicated no statistically significant changeafter the road construction phase in any of the catchments orin the partial cut catchment after timber harvest (Karwan etal. 2007). Statistically significant increases in TSS loadswere observed in the clearcut catchment for the first yearimmediately after timber harvest. TSS increases during thisperiod exceeded 150% of the pretreatment average, with thelargest monthly increase of 560% during the April snow-melt period. Nutrient concentrations in stream water weregenerally unaffected by the forest treatments, with the ex-ception of nitrate ! nitrite (NO3 ! NO2) concentrations inthe clearcut catchment (F1), which were observed to in-crease by approximately 1 order of magnitude (Gravelle etal. 2009). Stream temperatures at the monitoring sites wereunaffected by the road construction and harvest practices;however canopy cover reductions and temperature increases(up to 3.6°C) were observed in directly affects headwaterreaches (Gravelle and Link 2007). Significant changes indownstream annual water yields, TSS, and NO3 ! NO2
were also observed; however the magnitudes of the changeswere much smaller than those observed at the upstream. Thefindings of statistically significant abiotic changes indicate apotential for macroinvertebrate communities to be alteredby the experimental treatments.
MethodsSampling Protocol
Macroinvertebrate communities were sampled annuallyin one reach near each of the flume sites beginning in 1994.Sample reaches were 40 times the wetted width of thestream and ranged from 60 to 140 m in length. Five ran-domly placed benthic samples were taken in each reach witha modified Hess sampler (36-cm diameter sample area;250-!m mesh net). Samples were taken in riffles duringsteady low flow conditions. All sampling from 1994 to 2005occurred between July 27 and August 10 in any given year.Sampling at a site began at the most downstream riffle andproceeded upstream within the designated stream reach,with no more than one sample per riffle. Samples were
Table 1. Watershed treatments and physical characteristics of the Mica Creek Experimental Watershed
SiteDrainagearea (ha)
Treatmenttype
Drainage areaaffected
by treatmentCanopy removal
by treatmentWetted
width (m)Gradient
(%)Substrate size,
d50 (mm)*Fines "2 mm
(%)*
. . . . . . . . . . .(%) . . . . . . . . . . .F1 140 Clearcut 50 50 1.5 5 50 7F2 175 Partial cut 50 25 1.9 8 50 9F3 210 Control 0 0 1.9 14 70 14F4 600 Cumulative 26 13 2.8 3 40 19F5 650 Control 0 0 2.6 3 30 22F6 1,450 Control 0 0 3.1 5 110 12F7 1,200 Cumulative 13 6.5 3.5 3 80 14
* Calibration time period.
Forest Science 55(4) 2009 355
placed in 1-liter jars and preserved in a 70% alcohol solu-tion. All reaches were placed upstream of the flume sitesunless tributary confluence and multiple channel conditionsprevented this, which occurred for the reaches near flumes4 and 6 (Figure 1).
Field sampling procedures were performed by the samepersonnel during the 1994 to 2005 time period, and errorsdue to analytical protocol were minimized by using thesame laboratory (EcoAnalysts, Moscow, ID) throughout thesampling period. All macroinvertebrate samples were ana-lyzed to the lowest practical level (usually genus) using thefirst 500 specimens from each sample. A sample with fewerthan 500 individuals constituted the entire sample (IdahoDivision of Environmental Quality 2002). Although fixedcounts have the potential to result in inaccurate estimates ofmetrics (Courtemanch 1996), the balance between accuracy
and cost-effectiveness makes this a commonly acceptedmethod. In addition, by using a variety of metrics to assessthe abundance and diversity of taxa, a subsample still pro-vides a representative measurement of macroinvertebrateassemblages (Barbour and Gerritsen 1996). Each of the fivesamples from each reach was analyzed separately to calcu-late sample metrics. Values for the metrics from the fiveindividual samples were averaged to obtain reach valuesnear each gauging station.
Data AnalysisReach data values were used in a before-after/control-
impact paired series (BACIPS) design (Stewart-Oaten et al.1986) to assess changes in macroinvertebrate populationsand structure as a result of road construction and timber
Figure 2. MCEW 2002 aerial photo showing clearcut and partial cut harvest units. Black circlesindicate the location of measurement stations where macroinvertebrate sampling was conducted.
356 Forest Science 55(4) 2009
harvest activities. This method was used in similar investi-gations involving harvest effects to account for samplevariability within a reach (Underwood 1994, Moore et al.2005). There were 4 years of calibration data from1994–1997 (calibration), 4 years of postroad constructiondata from 1998–2001 (roads), and 4 years of postharvestdata from 2002–2005 (roads ! harvest). Because road con-struction and timber harvest activities occurred in the latterpart of 1997 and 2001, respectively, these impacts were notexpected to affect annual macroinvertebrate samples untilthe following year. In 1997, road construction did not beginuntil at least 1 month after macroinvertebrate sampling. In2001, harvest activities were concurrent with sampling buthad just started, and the initial vegetation removal occurrednear ridges and at least 0.75 km away from the nearestsample reach.
Repeated-measures analysis of variance (RMANOVA)was performed on aquatic macroinvertebrate communitymetrics to test for differences between treatment and controlreaches based on the BACIPS sampling design. Com-putations were performed using the statistical package R(Ripley 2001, Venables and Ripley 2002). Metrics usedfor RMANOVA comparison were overall abundance;Ephemeroptera, Plecoptera, and Trichoptera (EPT) abun-dance, EPT richness, predator richness; scraper richness;sediment-intolerant taxa richness (Hilsenhoff’s 0–3),Shannon-Weiner diversity index, log e (Shannon 1948,Shannon and Weaver 1949), Hilsenhoff Biotic Index (HBI)(Hilsenhoff 1987, 1988), or Fine Sediment BioassessmentIndex (FSBI) (Relyea 2007); and % intolerant taxa (Barbouret al. 1995). Overall abundance values represented theentire macroinvertebrate community (e.g., Ephemeroptera,Plecoptera, Coleoptera, Diptera, Chironomidae, Tricho-ptera, Lumbricina, Oligochaeta, Bivalvia, Gastropoda,Ostracoda, Tricladida, and Acari) and EPT abundance val-ues represented the mayfly, stonefly, and caddis fly taxa(Ephemeroptera, Plecoptera, and Trichoptera). To providea relative measure of the number of distinctly different taxaat a site (Lillie et al. 2003), selected richness metrics wereused to evaluate different taxa community responses to theroad construction and timber harvest activities. EPT rich-ness, defined as the total number of identifiably distinct taxain the insect orders Ephemeroptera, Plecoptera, andTrichoptera was used to characterize macroinvertebraterichness. Predator and scraper richness metrics were used,and the sediment-intolerant taxa richness measurement pro-vided insight to sediment tolerance levels. Higher values ofthe richness and diversity indices are generally indicative ofbetter habitat quality, with the exception of the HBI, forwhich lower index values indicate better water quality con-ditions. All metric values were log-transformed (log e) foranalysis. Changes in all metrics between time periods weretested for significance at the # " 0.05 level.
Temporal trends in functional feeding groups (collector-gatherers, collector-filterers, shredders, scrapers, and pred-ators) and interannual metric variability were observed for12 years, from 1994 through 2005. Although proper assign-ment to the various feeding groups can sometimes be dif-ficult (Karr and Chu 1997), these data provide overallinsight to aquatic food dynamics. The functional feeding
group measurements were assembled by EcoAnalysts, andthe groups were categorized based on standardized assign-ments and regional adjustments for benthic macroinverte-brates (Barbour et al. 1999). To help demonstrate the year-to-year variability occurring in the measured metricsanalyzed with RMANOVA, an indexed annual variabilityvalue was created by dividing all metric values by themetric values for the initial year (1994). This method stan-dardizes the 1994 metric values to a base value of 1, withincreases in future years equating to a value "1 and de-creases equating to a value #1. This indexed annual vari-ability value was derived to demonstrate interannual metricfluctuations.
Results
Results of functional feeding group trends are presentedfirst, followed by RMANOVA results of abundance, taxarichness, and various indices. Finally, trends using indexedannual variability values are presented.
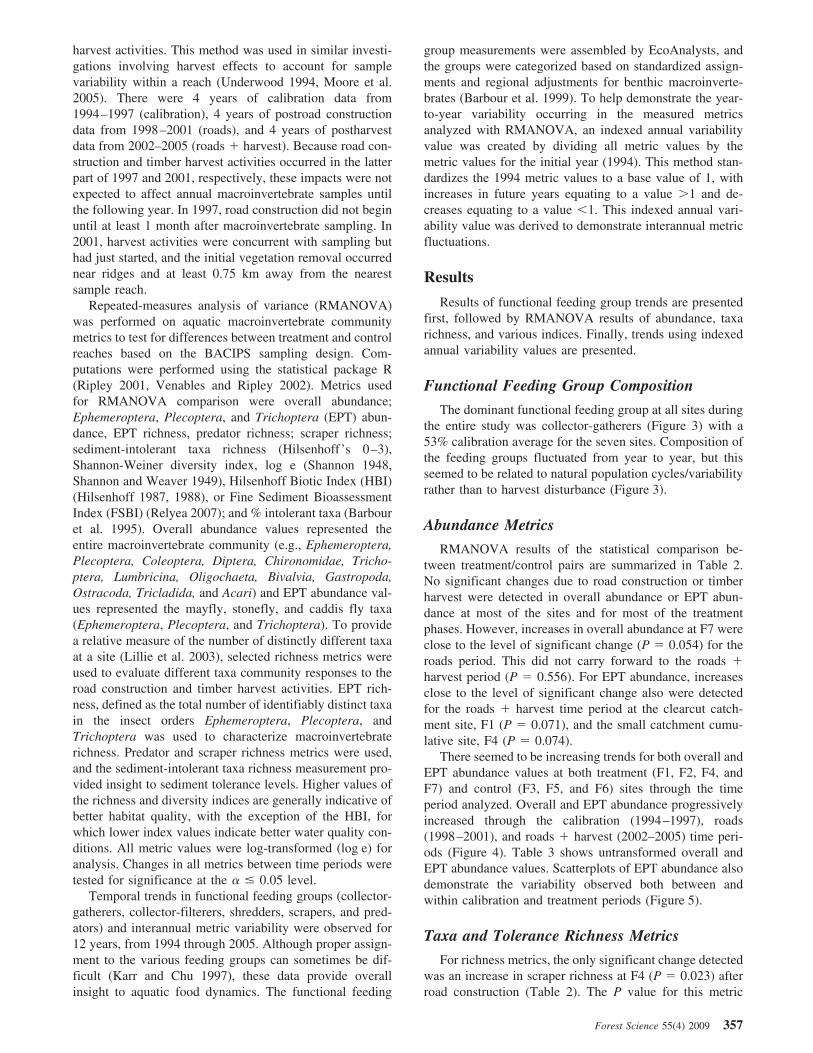
Functional Feeding Group CompositionThe dominant functional feeding group at all sites during
the entire study was collector-gatherers (Figure 3) with a53% calibration average for the seven sites. Composition ofthe feeding groups fluctuated from year to year, but thisseemed to be related to natural population cycles/variabilityrather than to harvest disturbance (Figure 3).
Abundance MetricsRMANOVA results of the statistical comparison be-
tween treatment/control pairs are summarized in Table 2.No significant changes due to road construction or timberharvest were detected in overall abundance or EPT abun-dance at most of the sites and for most of the treatmentphases. However, increases in overall abundance at F7 wereclose to the level of significant change (P $ 0.054) for theroads period. This did not carry forward to the roads !harvest period (P $ 0.556). For EPT abundance, increasesclose to the level of significant change also were detectedfor the roads ! harvest time period at the clearcut catch-ment site, F1 (P $ 0.071), and the small catchment cumu-lative site, F4 (P $ 0.074).
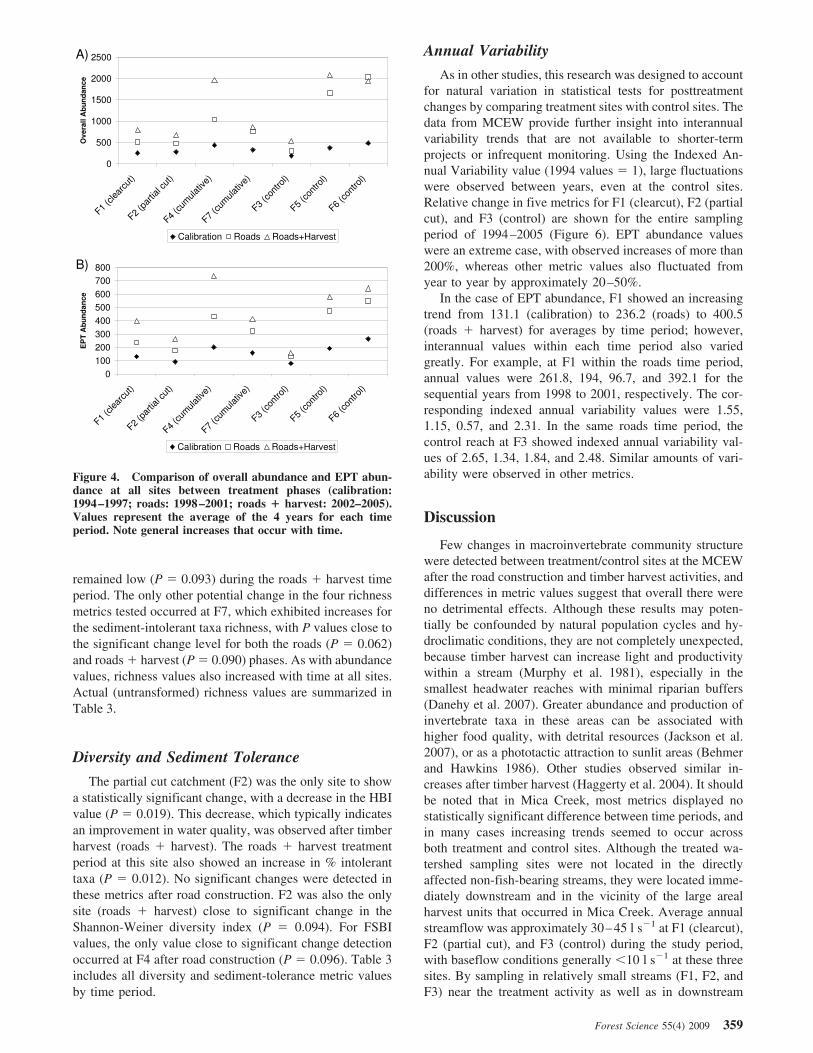
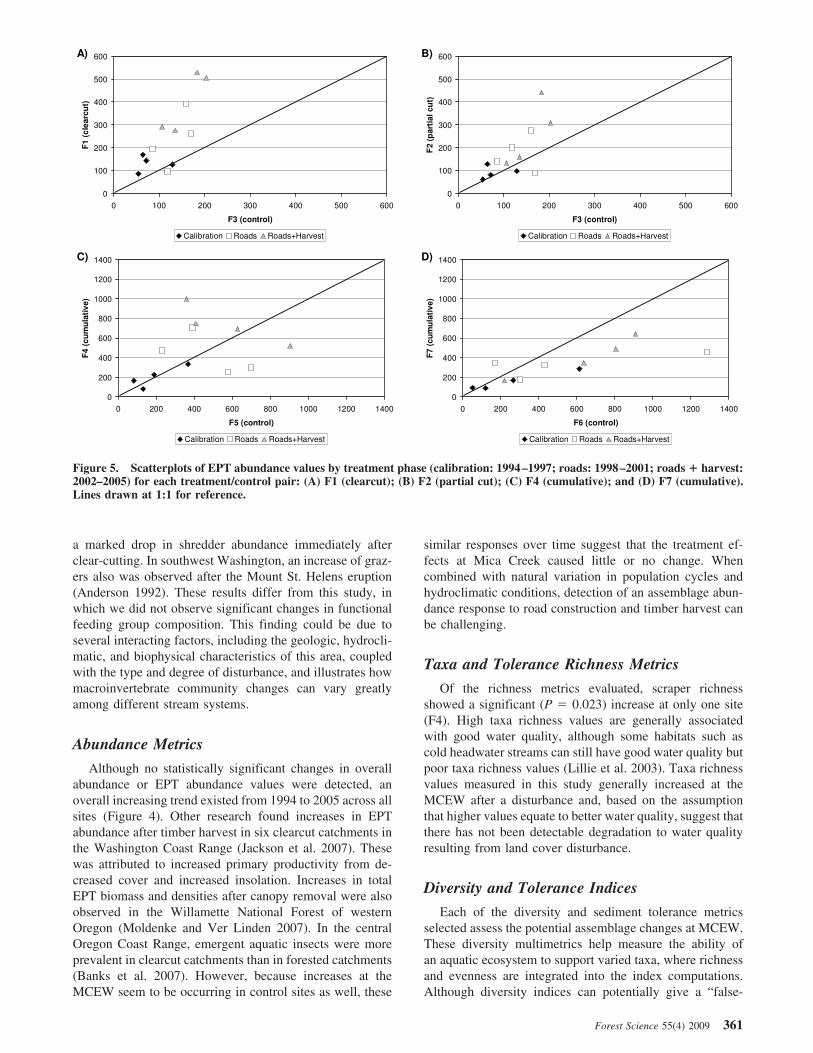
There seemed to be increasing trends for both overall andEPT abundance values at both treatment (F1, F2, F4, andF7) and control (F3, F5, and F6) sites through the timeperiod analyzed. Overall and EPT abundance progressivelyincreased through the calibration (1994–1997), roads(1998–2001), and roads ! harvest (2002–2005) time peri-ods (Figure 4). Table 3 shows untransformed overall andEPT abundance values. Scatterplots of EPT abundance alsodemonstrate the variability observed both between andwithin calibration and treatment periods (Figure 5).
Taxa and Tolerance Richness MetricsFor richness metrics, the only significant change detected
was an increase in scraper richness at F4 (P $ 0.023) afterroad construction (Table 2). The P value for this metric
Forest Science 55(4) 2009 357
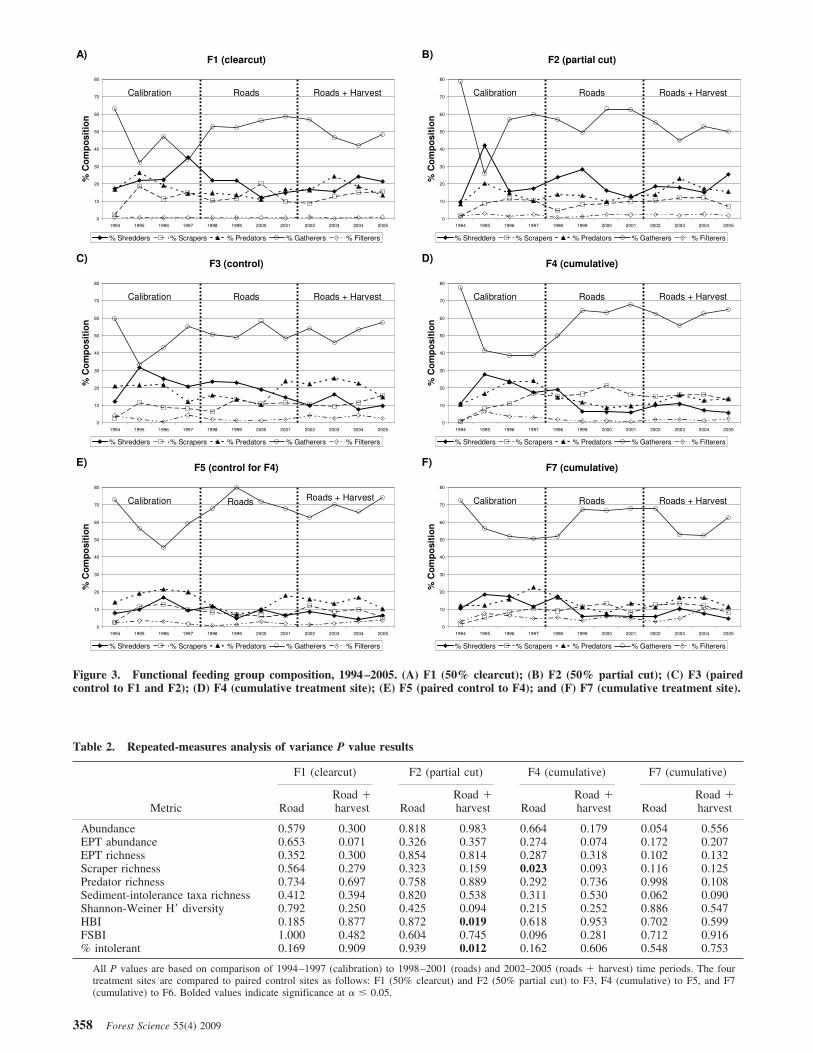
Table 2. Repeated-measures analysis of variance P value results
Metric
F1 (clearcut) F2 (partial cut) F4 (cumulative) F7 (cumulative)
RoadRoad !harvest Road
Road !harvest Road
Road !harvest Road
Road !harvest
Abundance 0.579 0.300 0.818 0.983 0.664 0.179 0.054 0.556EPT abundance 0.653 0.071 0.326 0.357 0.274 0.074 0.172 0.207EPT richness 0.352 0.300 0.854 0.814 0.287 0.318 0.102 0.132Scraper richness 0.564 0.279 0.323 0.159 0.023 0.093 0.116 0.125Predator richness 0.734 0.697 0.758 0.889 0.292 0.736 0.998 0.108Sediment-intolerance taxa richness 0.412 0.394 0.820 0.538 0.311 0.530 0.062 0.090Shannon-Weiner H% diversity 0.792 0.250 0.425 0.094 0.215 0.252 0.886 0.547HBI 0.185 0.877 0.872 0.019 0.618 0.953 0.702 0.599FSBI 1.000 0.482 0.604 0.745 0.096 0.281 0.712 0.916% intolerant 0.169 0.909 0.939 0.012 0.162 0.606 0.548 0.753
All P values are based on comparison of 1994–1997 (calibration) to 1998–2001 (roads) and 2002–2005 (roads ! harvest) time periods. The fourtreatment sites are compared to paired control sites as follows: F1 (50% clearcut) and F2 (50% partial cut) to F3, F4 (cumulative) to F5, and F7(cumulative) to F6. Bolded values indicate significance at # " 0.05.
Figure 3. Functional feeding group composition, 1994–2005. (A) F1 (50% clearcut); (B) F2 (50% partial cut); (C) F3 (pairedcontrol to F1 and F2); (D) F4 (cumulative treatment site); (E) F5 (paired control to F4); and (F) F7 (cumulative treatment site).
358 Forest Science 55(4) 2009
remained low (P $ 0.093) during the roads ! harvest timeperiod. The only other potential change in the four richnessmetrics tested occurred at F7, which exhibited increases forthe sediment-intolerant taxa richness, with P values close tothe significant change level for both the roads (P $ 0.062)and roads ! harvest (P $ 0.090) phases. As with abundancevalues, richness values also increased with time at all sites.Actual (untransformed) richness values are summarized inTable 3.
Diversity and Sediment ToleranceThe partial cut catchment (F2) was the only site to show
a statistically significant change, with a decrease in the HBIvalue (P $ 0.019). This decrease, which typically indicatesan improvement in water quality, was observed after timberharvest (roads ! harvest). The roads ! harvest treatmentperiod at this site also showed an increase in % intoleranttaxa (P $ 0.012). No significant changes were detected inthese metrics after road construction. F2 was also the onlysite (roads ! harvest) close to significant change in theShannon-Weiner diversity index (P $ 0.094). For FSBIvalues, the only value close to significant change detectionoccurred at F4 after road construction (P $ 0.096). Table 3includes all diversity and sediment-tolerance metric valuesby time period.
Annual VariabilityAs in other studies, this research was designed to account
for natural variation in statistical tests for posttreatmentchanges by comparing treatment sites with control sites. Thedata from MCEW provide further insight into interannualvariability trends that are not available to shorter-termprojects or infrequent monitoring. Using the Indexed An-nual Variability value (1994 values $ 1), large fluctuationswere observed between years, even at the control sites.Relative change in five metrics for F1 (clearcut), F2 (partialcut), and F3 (control) are shown for the entire samplingperiod of 1994–2005 (Figure 6). EPT abundance valueswere an extreme case, with observed increases of more than200%, whereas other metric values also fluctuated fromyear to year by approximately 20–50%.
In the case of EPT abundance, F1 showed an increasingtrend from 131.1 (calibration) to 236.2 (roads) to 400.5(roads ! harvest) for averages by time period; however,interannual values within each time period also variedgreatly. For example, at F1 within the roads time period,annual values were 261.8, 194, 96.7, and 392.1 for thesequential years from 1998 to 2001, respectively. The cor-responding indexed annual variability values were 1.55,1.15, 0.57, and 2.31. In the same roads time period, thecontrol reach at F3 showed indexed annual variability val-ues of 2.65, 1.34, 1.84, and 2.48. Similar amounts of vari-ability were observed in other metrics.
Discussion
Few changes in macroinvertebrate community structurewere detected between treatment/control sites at the MCEWafter the road construction and timber harvest activities, anddifferences in metric values suggest that overall there wereno detrimental effects. Although these results may poten-tially be confounded by natural population cycles and hy-droclimatic conditions, they are not completely unexpected,because timber harvest can increase light and productivitywithin a stream (Murphy et al. 1981), especially in thesmallest headwater reaches with minimal riparian buffers(Danehy et al. 2007). Greater abundance and production ofinvertebrate taxa in these areas can be associated withhigher food quality, with detrital resources (Jackson et al.2007), or as a phototactic attraction to sunlit areas (Behmerand Hawkins 1986). Other studies observed similar in-creases after timber harvest (Haggerty et al. 2004). It shouldbe noted that in Mica Creek, most metrics displayed nostatistically significant difference between time periods, andin many cases increasing trends seemed to occur acrossboth treatment and control sites. Although the treated wa-tershed sampling sites were not located in the directlyaffected non-fish-bearing streams, they were located imme-diately downstream and in the vicinity of the large arealharvest units that occurred in Mica Creek. Average annualstreamflow was approximately 30–45 l s&1 at F1 (clearcut),F2 (partial cut), and F3 (control) during the study period,with baseflow conditions generally #10 l s&1 at these threesites. By sampling in relatively small streams (F1, F2, andF3) near the treatment activity as well as in downstream
Figure 4. Comparison of overall abundance and EPT abun-dance at all sites between treatment phases (calibration:1994–1997; roads: 1998–2001; roads ! harvest: 2002–2005).Values represent the average of the 4 years for each timeperiod. Note general increases that occur with time.
Forest Science 55(4) 2009 359
larger ones (average annual streamflow '200–250 l s&1 atF7 and F6), these findings that MCEW treatments causedlittle to no changes in downstream fish-bearing reachesprovide important information for evaluating both the prox-imal and distal downstream cumulative effects on macro-invertebrate communities.
Prior analyses of abiotic (i.e., streamflow, water temper-ature, sediment, and nutrients) data at MCEW, as previouslydiscussed, are helpful to interpret these results. Although anumber of significant changes were observed at the sam-pling sites, the apparent lack of change in macroinvertebrateassemblages is less surprising given the relatively smallmagnitudes (e.g., temperature) or brief duration (e.g., sedi-ment) of observed changes.
Functional Feeding Group CompositionWhite (1997) observed collector-gatherer dominance be-
fore timber harvest, and this did not change markedly aftertreatments. The composition of functional feeding groups inthe MCEW was similar to results from other studies com-pleted in western Oregon and elsewhere (Gomi et al. 2002,Cole et al. 2003, Herlihy et al. 2005, Danehy et al. 2007).
Herlihy et al. (2005) found that almost half (49%) of func-tional feeding group assemblages in headwater streamsin western Oregon were composed of collector species,whereas the remainder where evenly divided among scrap-ers, shredders, and predators. Cole et al. (2003) found thatcollector-gatherers were the most abundant functional feed-ing group in an Oregon Coast Range study, averaging 45%of the sampled assemblages. At the MCEW, across all sitesand time periods (1994–2005), collector-gatherers com-prised 58% of the functional feeding group assemblage.
Other studies observed changes in functional feedinggroups as a result of harvest activity. Scrapers were foundto predominate in subboreal streams in British Columbiaaffected by recent clearcuts, with shredders dominatingstreams having denser riparian canopies (Fuchs et al. 2003).Collector-gatherers are correlated with fine particles andcommonly found in depositional areas. Kedzierski andSmock (2001) attributed an increase in both collector-gatherers and scrapers and a decrease in shredders to timberharvest in coastal Virginia. In a North Carolina study, Stoneand Wallace (1998) found that collectors were three timesmore abundant in clearcut stream reaches. They also noted
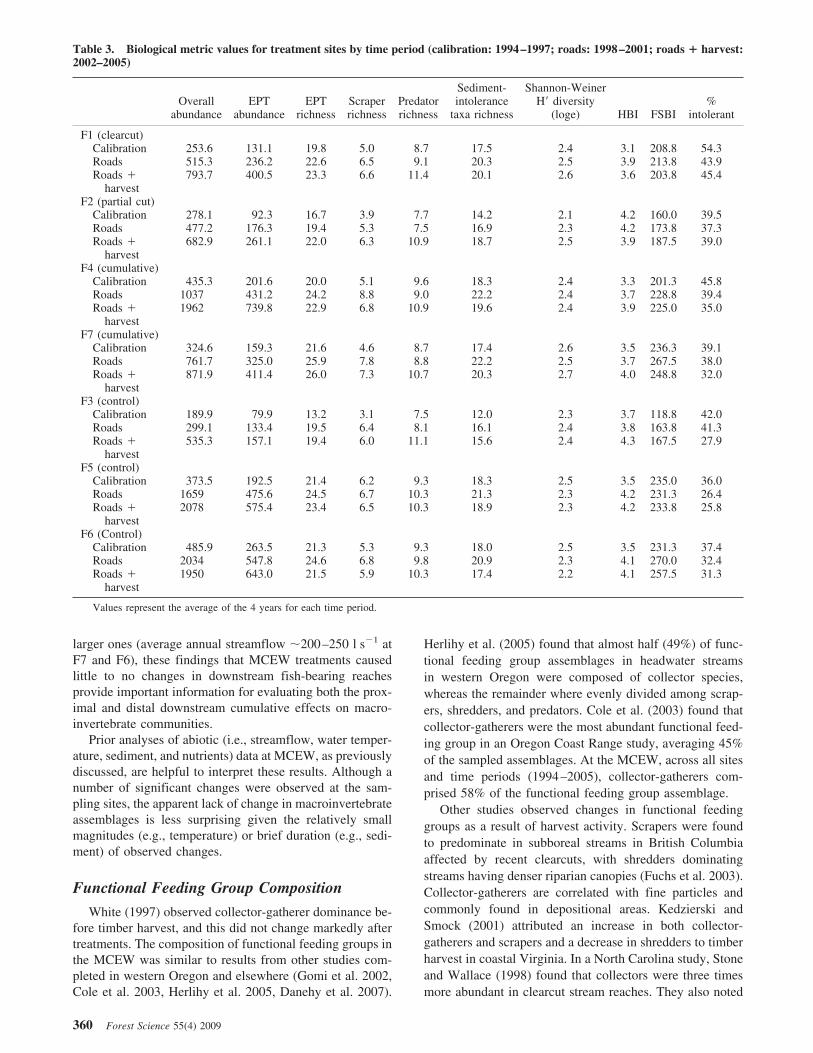
Table 3. Biological metric values for treatment sites by time period (calibration: 1994–1997; roads: 1998–2001; roads ! harvest:2002–2005)
Overallabundance
EPTabundance
EPTrichness
Scraperrichness
Predatorrichness
Sediment-intolerance
taxa richness
Shannon-WeinerH% diversity
(loge) HBI FSBI%
intolerant
F1 (clearcut)Calibration 253.6 131.1 19.8 5.0 8.7 17.5 2.4 3.1 208.8 54.3Roads 515.3 236.2 22.6 6.5 9.1 20.3 2.5 3.9 213.8 43.9Roads !
harvest793.7 400.5 23.3 6.6 11.4 20.1 2.6 3.6 203.8 45.4
F2 (partial cut)Calibration 278.1 92.3 16.7 3.9 7.7 14.2 2.1 4.2 160.0 39.5Roads 477.2 176.3 19.4 5.3 7.5 16.9 2.3 4.2 173.8 37.3Roads !
harvest682.9 261.1 22.0 6.3 10.9 18.7 2.5 3.9 187.5 39.0
F4 (cumulative)Calibration 435.3 201.6 20.0 5.1 9.6 18.3 2.4 3.3 201.3 45.8Roads 1037 431.2 24.2 8.8 9.0 22.2 2.4 3.7 228.8 39.4Roads !
harvest1962 739.8 22.9 6.8 10.9 19.6 2.4 3.9 225.0 35.0
F7 (cumulative)Calibration 324.6 159.3 21.6 4.6 8.7 17.4 2.6 3.5 236.3 39.1Roads 761.7 325.0 25.9 7.8 8.8 22.2 2.5 3.7 267.5 38.0Roads !
harvest871.9 411.4 26.0 7.3 10.7 20.3 2.7 4.0 248.8 32.0
F3 (control)Calibration 189.9 79.9 13.2 3.1 7.5 12.0 2.3 3.7 118.8 42.0Roads 299.1 133.4 19.5 6.4 8.1 16.1 2.4 3.8 163.8 41.3Roads !
harvest535.3 157.1 19.4 6.0 11.1 15.6 2.4 4.3 167.5 27.9
F5 (control)Calibration 373.5 192.5 21.4 6.2 9.3 18.3 2.5 3.5 235.0 36.0Roads 1659 475.6 24.5 6.7 10.3 21.3 2.3 4.2 231.3 26.4Roads !
harvest2078 575.4 23.4 6.5 10.3 18.9 2.3 4.2 233.8 25.8
F6 (Control)Calibration 485.9 263.5 21.3 5.3 9.3 18.0 2.5 3.5 231.3 37.4Roads 2034 547.8 24.6 6.8 9.8 20.9 2.3 4.1 270.0 32.4Roads !
harvest1950 643.0 21.5 5.9 10.3 17.4 2.2 4.1 257.5 31.3
Values represent the average of the 4 years for each time period.
360 Forest Science 55(4) 2009
a marked drop in shredder abundance immediately afterclear-cutting. In southwest Washington, an increase of graz-ers also was observed after the Mount St. Helens eruption(Anderson 1992). These results differ from this study, inwhich we did not observe significant changes in functionalfeeding group composition. This finding could be due toseveral interacting factors, including the geologic, hydrocli-matic, and biophysical characteristics of this area, coupledwith the type and degree of disturbance, and illustrates howmacroinvertebrate community changes can vary greatlyamong different stream systems.
Abundance MetricsAlthough no statistically significant changes in overall
abundance or EPT abundance values were detected, anoverall increasing trend existed from 1994 to 2005 across allsites (Figure 4). Other research found increases in EPTabundance after timber harvest in six clearcut catchments inthe Washington Coast Range (Jackson et al. 2007). Thesewas attributed to increased primary productivity from de-creased cover and increased insolation. Increases in totalEPT biomass and densities after canopy removal were alsoobserved in the Willamette National Forest of westernOregon (Moldenke and Ver Linden 2007). In the centralOregon Coast Range, emergent aquatic insects were moreprevalent in clearcut catchments than in forested catchments(Banks et al. 2007). However, because increases at theMCEW seem to be occurring in control sites as well, these
similar responses over time suggest that the treatment ef-fects at Mica Creek caused little or no change. Whencombined with natural variation in population cycles andhydroclimatic conditions, detection of an assemblage abun-dance response to road construction and timber harvest canbe challenging.
Taxa and Tolerance Richness MetricsOf the richness metrics evaluated, scraper richness
showed a significant (P $ 0.023) increase at only one site(F4). High taxa richness values are generally associatedwith good water quality, although some habitats such ascold headwater streams can still have good water quality butpoor taxa richness values (Lillie et al. 2003). Taxa richnessvalues measured in this study generally increased at theMCEW after a disturbance and, based on the assumptionthat higher values equate to better water quality, suggest thatthere has not been detectable degradation to water qualityresulting from land cover disturbance.
Diversity and Tolerance IndicesEach of the diversity and sediment tolerance metrics
selected assess the potential assemblage changes at MCEW.These diversity multimetrics help measure the ability ofan aquatic ecosystem to support varied taxa, where richnessand evenness are integrated into the index computations.Although diversity indices can potentially give a “false-
Figure 5. Scatterplots of EPT abundance values by treatment phase (calibration: 1994–1997; roads: 1998–2001; roads ! harvest:2002–2005) for each treatment/control pair: (A) F1 (clearcut); (B) F2 (partial cut); (C) F4 (cumulative); and (D) F7 (cumulative).Lines drawn at 1:1 for reference.
Forest Science 55(4) 2009 361
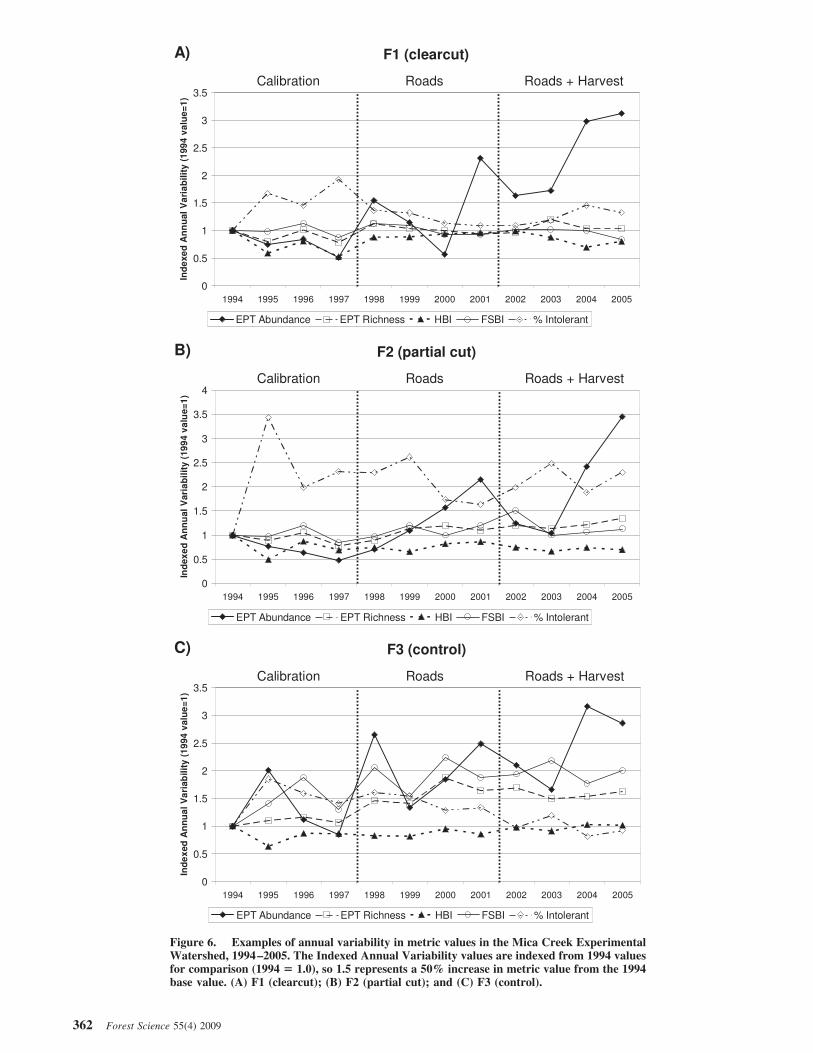
Figure 6. Examples of annual variability in metric values in the Mica Creek ExperimentalWatershed, 1994–2005. The Indexed Annual Variability values are indexed from 1994 valuesfor comparison (1994 " 1.0), so 1.5 represents a 50% increase in metric value from the 1994base value. (A) F1 (clearcut); (B) F2 (partial cut); and (C) F3 (control).
362 Forest Science 55(4) 2009
negative” result in nutrient-poor streams due to naturallyoccurring low diversity and can be more affected bychanges in species evenness than richness (Milner andRoberts 1997), a diversity metric does provide a goodindication of assemblage species structure. The % intoleranttaxa metric was included as another indicator because of thepotential susceptibility of macroinvertebrate communities toincreased sedimentation from road construction and timberharvest disturbance.
The only significant changes detected were in the HBI(decrease) and % intolerant taxa (increase) at the partial cutsite (F2) after timber removal (roads ! harvest). Besides aslight increase in the Shannon-Weiner diversity index,which was also at F2, the only other apparent increaseoccurred in FSBI values at F4 (roads). Because F4 was adownstream cumulative site and because there were nochanges detected in FSBI values at the other treatment sitesor for treatment period, there is a chance that these appar-ently spurious findings may be an artifact of low samplesize or stochastic processes that affected the species assem-blages. On the basis of actual values between time periods(Table 3), there was a slight increase in FSBI values at F4after treatments relative to the control site (F5), but thesechanges seemed to be minor, given that the other control site(F3) similarly showed increased FSBI values during thetreatment periods.
HBI values in the MCEW indicated that water quality isgenerally very good, based on a range from 3.1 to 4.2, withan average value of approximately 3.8. In developing theindex, Hilsenhoff (1987) determined that values of 0–3.50indicate excellent water quality with no apparent organicpollution and values between 3.51 and 4.50 indicate verygood water quality with slight organic pollution. It shouldbe noted that the HBI was intended to only measure re-sponses associated with high organic loading and decreaseddissolved oxygen levels (Lillie et al. 2003) but is nonethe-less a useful index to include for comparison with othersystems.
The FSBI is related to interactions between fine inor-ganic sediment and macroinvertebrates (Relyea et al. 2000,Relyea 2007) and therefore should be more applicable thanHBI for evaluating Pacific Northwest mountain streamssuch as Mica Creek. FSBI values in the MCEW indicatethat macroinvertebrate assemblages are expected to be rel-atively intolerant to fine inorganic sediment, given thataverage values across all sites in the MCEW were 199(calibration), 221 (roads), and 218 (roads ! harvest). WhenFSBI scores among 428 streams in the Northern Rockies/Idaho Batholith/Cascade Ecoregions were developed andevaluated, a score of 205 represented the 75th percentile,with a maximum score of 375 (Relyea 2007). Assemblageswithin the MCEW fall into the upper tier of water qualitybased on this index. Several annual values exceeded 300 atseveral sites, and based on the FSBI, streams within theMCEW contain some of the more sediment-intolerant mac-roinvertebrate communities in the Idaho Northern RockiesEcoregion. When FSBI scores were assessed by time period(Table 3), aquatic macroinvertebrate communities in theMCEW seemed to be insensitive to the short-term sedimentpulse that was observed at sites F2 and F3 after timber
harvest (Karwan et al. 2007). Another particular interestingindicator of this occurrence is the observation of individualtaxa such as Megarcys, which is considered to be “ex-tremely fine sediment sensitive” when FSBI scores arecompiled (Relyea 2007). Although abundance counts at F1were relatively low compared with more common Oli-gochaeta, Chironomidae, and Yoraperla, Megarcys abun-dance increased after clearcut activity, with average annualabundance counts of 6 (calibration), 10 (roads), and 18(roads ! harvest). It is also notable that at F3 (control site),Megarcys abundance also showed increases over time, withaverage annual abundance counts of 1 (calibration), 2(roads), and 7 (roads ! harvest).
Annual VariabilityOne of the potential shortfalls of this research is the
lack of statistical power required to detect change, eventhough the 4 years of calibration, 4 years of postroad, and4 years of postharvest (roads ! harvest) provide longer-term information than that in many other studies. Althoughthe sample size is small and therefore presents challengesfor statistical analysis (Loftis et al., 2001), the long-termrecord of annual macroinvertebrate sampling at MCEWalso provides more insight into natural variation in aquaticinsect population dynamics than other studies. Annual vari-ability due to natural fluctuations can be large, and thisvariability makes change detection extremely challenging,even with several control sites to help account for thisnatural variability. McElravy et al. (1989) observed a third-order coastal stream in northern California to have substan-tial year-to-year variability in precipitation and streamflowthat seemed to influence macroinvertebrate communitypatterns. Substantial interannual variability was also ob-served at MCEW. However, because all sites respondedsimilarly, the BACIPS design increased the potential todetect change.
This type of natural variation should be noted by re-searchers, land managers, and regulators. Whereas infre-quent or “snapshot” biomonitoring may be useful as a rapidcharacterization of general water quality, it may not provideadequate information to gauge subtle disturbance effects oraquatic conditions in a watershed. For example, if F2 (par-tial cut) was sampled only in 1995 and 2000, the % intol-erant taxa numbers would have been 62.1 and 31.2%, re-spectively. Based on this sampling frequency, one coulddraw a false conclusion that the invertebrate communitywas being adversely affected, whereas we know that the %intolerant values were relatively steady through the calibra-tion (39.5%), roads (37.3%), and roads ! harvest phases(39.0%). It should also be noted that, conversely, otherinfrequent sampling results could draw a false conclusionthat conditions are improving when in reality they arestaying the same. The observed interannual variability inboth treatment and control sites emphasizes that researchersshould be very cautious in inferring changes using biomoni-toring data unless results can be placed within the contextof natural variability. More research is needed to assess
Forest Science 55(4) 2009 363
whether this variability is confined to headwater and imme-diate downstream networks or whether it also extendsthroughout the river continuum.
Conclusions
Overall, macroinvertebrate communities in the MCEWwere relatively unresponsive to road construction and tim-ber harvest activities in the watershed, despite the fact thatsome changes were noted in the abiotic characteristics (i.e.,flow, nitrate concentrations, and short-term sediment load-ing) of the stream systems. There seem to be no majorchanges to functional feeding group composition after tim-ber harvest, although overall changes in abundance, rich-ness, and site-specific multimetric indices were detected.The MCEW treatment sites were not located in the directlyaffected non-fish-bearing streams, but the findings in thisstudy are valuable for evaluating immediately downstreamand cumulative effects in fish-bearing reaches. Further re-search is needed to determine whether the observed effectswill remain in the years after forest harvest and whether theincreased abundance values altered food webs or otherstream ecosystem components. There are a number of fur-ther investigations beyond the scope of this initial assess-ment that would be useful to more fully understand thesubtleties of macroinvertebrate response to forest manage-ment activities, including an assessment of long-termchanges using multiple approaches (Resh et al. 1988). Forexample, a more intensive examination of riparian foodwebs may assist with associating immature, larval stageswith adult stages, which has limited the precision of manystudies in aquatic ecology (Merritt and Cummins 1996). Itwould also be useful to expand interdisciplinary investiga-tions of the biophysical, biogeochemical, and ecologicalchanges associated with timber harvest in headwater systems.
Macroinvertebrate sampling is an important componentof a comprehensive biomonitoring program. Because ofnatural and sampling variations, it is likely that macro-invertebrate assemblage data alone will be insufficient toadequately discern disturbance effects in watersheds whereland use changes and/or water quality changes are subtle. Itcan, however, be an effective tool when used in conjunctionwith other abiotic and biotic monitoring to detect distur-bance effects. Researchers and land managers should becautioned about making macroinvertebrate assemblage re-sponse the only indicator of water quality change fromtimber harvest and should note that natural variability couldeasily produce faulty conclusions if temporal data are lim-ited. Important features such as the interannual variabilityobserved at Mica Creek underscore the importance of long-term monitoring to better understand stream ecosystemfunction. Likewise, forestland managers must understandthat management activities near riparian areas must be care-fully considered. Failure to comply with BMPs could lead todisturbance effects that are outside the range of naturalvariability and could produce results much different fromthose observed at the MCEW, where BMPs were closelyadhered to. This failure to comply could include result inimpacts on watersheds on a larger scale than in this study,in which 50% of the clearcut and partial cut catchments
were affected. Although these abiotic and biotic responsesmay not necessarily be extrapolated to other watersheds,they suggest that if BMPs are followed adequately, effectson water quality should be minimal in similar areas, andresponses in macroinvertebrate assemblages will probablybe difficult to discern from natural variations.
Literature CitedANDERSON, N.H. 1992. Influence of disturbance on insect com-
munities in Pacific Northwest streams. Hydrobiologia248:79–92.
BANKS, J.L., J. LI, AND A.T. HERLIHY. 2007. Influence of clearcutlogging, flow duration, and season on emergent aquatic insectsin headwater streams of the Central Oregon Coast Range. J. N.Am. Benthol. Soc. 26(4):620–632.
BARBOUR, M.T., J.B. STRIBLING, AND J.R. KARR. 1995. Multi-metric approach for establishing biocriteria and measuring bi-ological condition. P. 63–77 in Biological assessment andcriteria: Tools for water resource planning and decision mak-ing. Davis, W.S., and T.P. Simon (eds.). Lewis Publishers,Boca Raton, FL.
BARBOUR, M.T., AND J. GERRITSEN. 1996. Subsampling of benthicsamples: A defense of the fixed-count method. J. N. Am.Benthol. Soc. 15(3):386–391.
BARBOUR, M.T., J. GERRITSEN, B.D. SNYDER, AND J.B. STRIBLING.1999. Rapid bioassessment protocols for use in streams andwadeable rivers: Periphyton, benthic macroinvertebrates andfish. 2nd ed. EPA/841-B-99-002. U.S. Environmental Protec-tion Agency, Office of Water, Washington, DC. 339 p.
BEHMER, D.J., AND C.P. HAWKINS. 1986. Effects of overheadcanopy on macroinvertebrate production in a Utah stream.Fresh. Biol. 16(3):287–300.
BILBY, R.E., AND P.A. BISSON. 1992. Allochthonous versus au-tochthonous organic matter contributions to the trophic supportof fish populations in clear-cut and old-growth forested streams.Can. J. Fish. Aquat. Sci. 49(3):540–551.
BONADA, N., N. PRAT, V.H. RESH, AND B. STATZNER. 2006.Developments in aquatic insect biomonitoring: A comparativeanalysis of recent approaches. Annu. Rev. Entomol. 51:495–523.
COLE, M.B., K.R. RUSSELL, AND T.J. MABEE. 2003. Relation ofheadwater macroinvertebrate communities to in-stream andadjacent stand characteristics in managed second-growth for-ests of the Oregon Coast Range mountains. Can. J. For. Res.33:1433–1443.
COURTEMANCH, D.L. 1996. Commentary on the subsampling pro-cedures used for rapid bioassessments. J. N. Am. Benthol. Soc.15(3):381–385.
DANEHY, R.J., S.S. CHAN, G.T. LESTER, R.B. LANGSHAW, AND
T.R. TURNER. 2007. Periphyton and macroinvertebrate assem-blage structure in headwaters bordered by mature, thinned, andclearcut Douglas-fir stands. For. Sci. 53(2):294–307.
DAVIES-COLLEY, R.J., AND J.C. RUTHERFORD. 2005. Some ap-proaches to measuring and modelling riparian shade. Ecol. Eng.24(5):525–530.
FORTINO, K., A.E. HERSHEY, AND K.J. GOODMAN. 2004. Utility ofbiological monitoring for detection of timber harvest effects onstreams and evaluation of Best Management Practices: A re-view. J. N. Am. Benthol. Soc. 23(3):634–646.
FRADY, C., S. JOHNSON, AND J. LI. 2007. Stream macroinverte-brate community responses as legacies of forest harvest at theH.J. Andrews Experimental Forest, Oregon. For. Sci. 53(2):281–293.
FUCHS, S.A., S.G. HINCH, AND E. MELLINA. 2003. Effects of
364 Forest Science 55(4) 2009
streamside logging on stream macroinvertebrate communitiesand habitat in the sub-boreal forests of British Columbia, Can-ada. Can. J. For. Res. 33:1408–1415.
GIBSON, G.R., M.T. BARBOUR, J.B. STRIBLING, J. GERRITSEN, AND
J.R. KARR. 1996. Biological criteria: Technical guidance forstreams and small rivers. EPA 822-B-96-001. U.S. Environ-mental Protection Agency, Office of Water, Washington, DC.174 p.
GOMI, T., R.C. SIDLE, AND J.S. RICHARDSON. 2002. Understandingprocesses and downstream linkages of headwater systems. Bio-science 52(10):905–915.
GRAVELLE, J.A., AND T.E. LINK. 2007. Influence of timber har-vesting on headwater peak stream temperatures in a northernIdaho watershed. For. Sci. 53(2):189–205.
GRAVELLE, J.A., G. ICE, T.E. LINK, AND D.L. COOK. 2009. Nutri-ent concentration dynamics in an inland Pacific Northwestwatershed before and after timber harvest. For. Ecol. Manag.257:1663–1675.
HAGGERTY, S.M., D.P. BATZER, AND C.R. JACKSON. 2004. Mac-roinvertebrate response to logging in coastal headwater streamsof Washington, U.S.A. Can. J. Fish. Aquat. Sci. 61:529–537.
HAWKINS, C.P., M.L. MURPHY, AND N.H. ANDERSON. 1982. Ef-fects of canopy, substrate composition, and gradient on thestructure of macroinvertebrate communities in Cascade Rangestreams of Oregon. Ecology 63(6):1840–1856.
HERLIHY, A.T., W.J. GERTH, J. LI, AND J.L. BANKS. 2005. Mac-roinvertebrate community response to natural and forest har-vest gradients in western Oregon headwater streams. Fresh.Biol. 50:905–919.
HILSENHOFF, W.L. 1987. An improved biotic index of organicstream pollution. Great Lakes Entomologist 20:31–39.
HILSENHOFF, W.L. 1988. Rapid field assessment of organic pollu-tion with a family level biotic index. J. N. Am. Benthol. Soc.7(1):65–68.
HUBBART, J.A., T.E. LINK, J.A. GRAVELLE, AND W. ELLIOT. 2007.Timber harvest impacts on water yield in the continental/maritimehydroclimatic region of the U.S. For. Sci. 53(2):169–180.
IDAHO DEPARTMENT OF LANDS. 2000. Forest practices cumulativewatershed effects process for Idaho. Idaho Department ofLands, Boise, ID. 82 p.
IDAHO DIVISION OF ENVIRONMENTAL QUALITY. 1996. 1996 Bene-ficial use reconnaissance project workplan. Idaho Division ofEnvironmental Quality, Boise, ID. 75 p.
IDAHO DIVISION OF ENVIRONMENTAL QUALITY. 2002. Idaho smallstream ecological assessment framework. Idaho Division ofEnvironmental Quality, Boise, ID. 304 p.
JACKSON, C.R., D.P. BATZER, S.S. CROSS, S.M. HAGGERTY, AND
C.. STORM. 2007. Headwater streams and timber harvest: Chan-nel, macroinvertebrate, and amphibian response and recovery.For. Sci. 53(2):356–370.
KARR, J.R. 1991. Biological integrity: A long-neglected aspect ofwater resource management. Ecol. Appl. 1:66–84.
KARR, J.R., AND E.W. CHU. 1997. Biological monitoring: Essentialfoundation for ecological risk assessment. Hum. Ecol. RiskAssess. 3:933–1004.
KARWAN, D.L., J.A. GRAVELLE, AND J.A. HUBBART. 2007. Effectsof timber harvest on suspended sediment loads in Mica Creek,Idaho. For. Sci. 53(2):181–188.
KEDZIERSKI, W.M., AND L.A. SMOCK. 2001. Effects of logging onmacroinvertebrate production in a sand-bottomed, low gradientstream. Fresh. Biol. 46:821–833.
KIFFNEY, P.M., J.S. RICHARDSON, AND J.P. BULL. 2003. Responsesof periphyton and insects to experimental manipulation ofriparian buffer width along forest streams. J. Appl. Ecol.40(6):1060–1076.
KREUTZWEISER, D.P., S.S. CAPELL, AND K.P. GOOD. 2005. Effectof fine sediment inputs from a logging road on stream insectcommunities: A large-scale experimental approach in a Cana-dian headwater stream. Aquat. Ecol. 39:55–66.
LILLIE, R., S.W. SZCZYTKO, AND M.A. MILLER. 2003. Macro-invertebrate data interpretation guidance manual. PUB-SS-965, Wisconsin Department of Natural Resources, Madi-son, WI. 60 p.
LOFTIS, C.L., L.H. MACDONALD, S. STREETT, H.K. IYER, AND K.BUNTE. 2001. Detecting cumulative watershed effects: Thestatistical power of pairing. J. Hydrol. 251:49–64.
MARTEL, N., M.A. RODRIGUEZ, AND P. BERUBE. 2007. Multi-scaleanalysis of responses of stream macrobenthos to forestry ac-tivities and environmental context. Fresh. Biol. 52:85–97.
MCCLELLAND, W.T. 1972. Effects of introduced sediment on theecology and behavior of stream insects. Ph.D. dissertation,Univ. of Idaho, Moscow, ID. 172 p.
MCELRAVY, E.P., G.A. LAMBERTI, AND V.H. RESH. 1989. Year-to-year variation in the aquatic invertebrate fauna of a northernCalifornia stream. J. N. Am. Benthol. Soc. 8:51–63.
MERRITT, R.W., AND K.W. CUMMINS. 1996. An introduction to theaquatic insects of North America. 3rd ed. Kendall/Hunt Pub-lishing Company, Dubuque, IA. 862 p.
MILNER, A., AND S. ROBERTS. 1997. Aquatic macroinvertebrates;Their potential application in monitoring long term river eco-system change in Denali National Park, Alaska. Institute ofArctic Biology, University of Alaska, Fairbanks, AK. 16 p.
MOLDENKE, A.R., AND C. VER LINDEN. 2007. Effects of clearcut-ting and riparian buffers on the yield of adult aquatic macro-invertebrates from headwater streams. For. Sci. 53(2):308–319.
MOORE, R. D., D.L. SPITTLEHOUSE, AND A. STORY. 2005. Riparianmicroclimate and stream temperature response to forest har-vesting: A review. J. Am. Water Resour. Assoc. 41(4):813–834.
MURPHY, M.L., AND J.D. HALL. 1981. Varied effects of clear-cutlogging on predators and their habitat in small streams of theCascade Mountains, Ore. Can. J. Fish. Aquat. Sci. 38(2):137–145.
MURPHY, M.L., C.P. HAWKINS, AND N.H. ANDERSON. 1981. Ef-fects of canopy modification and accumulated sediment onstream communities. Trans. Am. Fish Soc. 110(4):469–478.
PEETERS, E.T.H.M., R. GYLSTRA, AND J. VOS. 2004. Benthicmacroinvertebrate community structure in relation to food andenvironmental variables. Hydrobiologia 519:103–115.
PLAFKIN, J.L., M.T. BARBOUR, K.D. PORTER, S.K. GROSS, AND
R.M. HUGHES. 1989. Rapid bioassessment protocols for use instreams and rivers: Benthic macroinvertebrates and fish. EPA440-4-89-001. U.S. Environmental Protection Agency, Officeof Water Regulations and Standards, Washington, DC.
RELYEA, C.D. 2007. Fine inorganic sediment effects on streammacroinvertebrates. Ph.D. dissertation. Idaho State University.Pocatello, ID. 265 p.
RELYEA, C.D., G.W. MINSHALL, AND R.J. DANEHY. 2000. Streaminsects as bioindicators of fine sediment. P. 663–687 in Proc.of Watershed 2000, Water Environment Federation specialtyconference. Vancouver, BC, Canada.
RESH, V., A.V. BROWN, A.P. COVICH, M.E. GURTZ, H.W. LI, G.W.MINSHALL, S.R. REICE, A.L. SHELDON, J.B. WALLACE, AND
R.C. WISSMAR. 1988. The role of disturbance in stream ecol-ogy. J. N. Am. Benthol. Soc. 7:433–455.
RIPLEY, B.D. 2001. The R project in statistical computing. MSORConnect. 1(1):23–25.
SCHULTZ, R. 2000. Land use history: Mica Creek—A tributary ofthe St. Joe River University of Idaho. Available online at
Forest Science 55(4) 2009 365

www.cnr.uidaho.edu/micacreek/history.htm; last accessed June2009.
SHANNON, C.E. 1948. A mathematical theory of communication.Bell Syst. Techn. J. 27:379–423, 623–656.
SHANNON, C.E., AND W. WEAVER. 1949. The mathematical theoryof communication. The University of Illinois Press. Urbana, IL.144 p.
STEDNICK, J.D. 1996. Monitoring the effects of timber harvest onannual water yield, J. Hydrol. 176:79–95.
STEWART-OATEN, A., W.W. MURDOCH, AND K.R. PARKER. 1986.Environmental impact assessment: ‘‘pseudoreplication” in time?Ecology 67:929–940.
STONE, M.K., AND J.B. WALLACE. 1998. Long-term recovery of amountain stream from clear-cut logging: The effects of forestsuccession on benthic invertebrate community structure. Fresh.Biol. 39:151–169.
UNDERWOOD. A.J. 1994. On beyond BACI: Sampling designs thatmight reliably detect environmental disturbances. Ecol. Appl.4:3–15.
VENABLES, W.N., AND B.D. RIPLEY. 2002. Modern applied statis-tics with S. 4th ed. Springer, New York, NY. 495 p.
WHITE, J.S. 1997. A multi-trophic level aquatic bioassessment ofa North Idaho watershed. M.Sc. thesis, Univ. of Idaho, Mos-cow, ID.
366 Forest Science 55(4) 2009