Embed Size (px)
Citation preview

Effects of various training modalities on blood volume
W. Schmidt, N. Prommer
Department of Sports Medicine/Sports Physiology, University of Bayreuth, Bayreuth, GermanyCorresponding author: W. Schmidt, Department of Sports Medicine/Sports Physiology, University of Bayreuth, 95440Bayreuth, Germany. Tel: 149 921 55 3464, Fax: 149 921 55 3468, E-mail: [email protected]
Accepted for publication 30 April 2008
It is controversially discussed whether soccer games shouldbe played at moderate (2001–3000m) and high altitudes(3001–5500m) or should be restricted to near sea level andlow altitude (501–2000m) conditions. Athletes living ataltitude are assumed to have a performance advantagecompared with lowlanders. One advantage of altitudeadaptation concerns the expansion of total hemoglobinmass (tHb-mass), which is strongly related to enduranceperformance at sea level. Cross-sectional studies show thatelite athletes posses � 35% higher tHb-mass than thenormal population, which is further elevated by 14% inathletes native to altitude of 2600m. Although the impact of
this huge tHb-mass expansion on performance is not yetinvestigated for altitude conditions, lowland athletes seek forpossibilities to increase tHb-mass to similar levels. At sealevel tHb-mass is only moderately influenced by training anddepends more on genetic predisposition. Altitude training incontrast, using either the conventional altitude training or thelive high–train low (414 h/day in hypoxia) protocol for 3–4weeks above 2500m leads to mean increases in tHb-mass of6.5%.This increase is, however, not sufficient to close the gapin tHb-mass to elite athletes native to altitude, which may bein advantagewhen tHb-mass has the same strong influence onaerobic performance at altitude as it has on sea level.
Hypotheses
Altitude residents are characterized by higher oxygentransport capacity of the blood than non-adaptedsubjects from lowlands. This improved oxygen capa-city is due to the adaptation of the erythropoieticsystem which compensates reduced oxygen availabil-ity by increasing total hemoglobin mass (tHb-mass).It, therefore, is assumed that this adaptation process isone main cause for the higher endurance performanceof altitude natives in hypoxia. In athletic competitions(e.g., soccer games) conducted at altitude it is assumedthat this fact may put lowlanders which do not havesufficient time to adapt their erythropoietic system ata disadvantage. However, the differences in enduranceperformance at altitude due the advantage of im-proved oxygen capacity have not yet been quantified.This fact is of special importance regarding thecurrent discussion whether soccer games should beplayed at moderate (2001–3000m) and high altitude(3001–5500m). To answer this question the presentreview addresses the following hypotheses:
1. Maximal endurance performance directly de-pends on the oxygen transport capacity andtherefore on tHb-mass
2. Athletes living at altitude posses more tHb-massand do therefore perform better at altitude thannon-adapted sea-level subjects
3. Training at sea level of professional athletes doesnot increase tHb-mass to the same level as itoccurs in athletes native to altitude.
4. Altitude training of athletes from lowlands mayclose the gap in tHb-mass between sea level andaltitude athletes and may therefore lead to equalchances regarding aerobic performance.
In addition, this review addresses (i) the hypoxicthreshold to elevate tHb-mass in a sea-level athleteand (ii) the magnitude of tHb-mass expansion whichcan be expected by different hypoxic measures.
OverviewInfluence of tHb-mass on endurance performance
Maximal endurance performance expressed as VO2max
depends on muscular oxygen consumption and oxy-gen transport of the blood. In elite endurance athletesmuscular oxidative capacity is well adapted whereasoxygen transport is the main limiting factor (Wagner,2000). The impact of blood on VO2max is demon-strated in studies describing the effect of phlebotomy,of blood re-transfusion, and of erythropoietin (EPO)application. One day after drawing 550mL of bloodVO2max decreased by 255mL/min in moderatelytrained subjects (Prommer et al., 2007b). After phle-botomy and subsequent re-transfusion of 1800mL
Scand J Med Sci Sports 2008: 18 (Suppl. 1): 57–69 Copyright & 2008 The Authors
Journal compilation & 2008 Blackwell MunksgaardPrinted in Singapore . All rights reservedDOI: 10.1111/j.1600-0838.2008.00833.x
57
blood VO2max differed by 740mL/min (Celsing et al.,1987), and in case of a 4-week lasting EPO applica-tion, a raise in VO2max by 307mL/min is reported(Parisotto et al., 2000). Best correlations betweenchanges in VO2max and blood constituents werefound for tHb-mass and red cell mass (RCM). Thechange of 1 g of hemoglobin, either by reduction orby expansion, is associated with a change in VO2max
by � 3mL/min (Parisotto et al., 2000; Prommeret al., 2007b). This review, therefore, focuses ontHb-mass/RCM rather than on blood or plasmavolume although both are the main performancelimiting factors for elite athletes under physiologicalconditions.
Measurement of tHb-mass
Until 1990 only few data on tHb-mass and RCM fortraining and altitude conditions were available be-cause the prevailing direct determination methods atthat time were based on radioactive markers andwere, therefore, associated with considerable sideeffects. The CO re-breathing method first describedby Grehant and Quinquard (1882) and modified byThomsen et al. (1991), Burge and Skinner (1995) andSchmidt and Prommer (2005) provided the possibi-lity of collecting substantial amounts of data. It was,however, at first criticized by, e.g., Sawka et al.(2000) as to overestimate tHb-mass by about 20%due to the assumption that CO diffuses to myoglobinand muscular cytocromes. This argument was re-cently rebutted by Prommer and Schmidt (2007)demonstrating that this effect is negligible becausethe duration of the test (7min) is too short for largediffusion rates. Complete mixing of CO in the bloodincluding also those red cells being located in thespleen (Prommer et al., 2007a) is guaranteed 7minafter inhalation of the CO bolus. In an extensivemeta-analysis Gore et al. (2005) demonstrated theCO-re-breathing method as the superior technique[coefficient of variance (CV) 2.2%] compared withthe hitherto gold standard using radioactive markers(51chromium labeled red cells, CV 2.8%) and toEvans Blue dilution (CV 6.7%). The actual opti-mized CO-re-breathing technique with a typical errorbetween 1.1% (Gore et al., 2006) and 1.7% (Schmidt& Prommer, 2005) allows the identification of evensmall changes in tHb-mass (95% confidence limit:between � 2.2% and � 3.3%, respectively) occur-ring with endurance training and adaptation tohypoxia.
tHb-mass at altitude
It is a well-known fact since decades that altitudehypoxia stimulates erythropoiesis and increases tHb-mass and blood volume (BV). Weil et al. (1968)
described a threshold at an arterial PO2 of70mmHg (1600m) corresponding to an oxygen sa-turation of 95%, below which RCM continuouslyincreases with declining SaO2. Residents from2600m (Bogota, Colombia; Boning et al., 2001)and 3550m (Putre, Chile; Heinicke et al., 2003) aretherefore characterized by 11% and 14% higher tHb-mass values, respectively. In subjects from 4390meven 83% elevated values were found (Sanchez et al.,1970). It has, however, to be noted that all of thesedata were collected from South and North Americaninhabitants. Whether this polycythemia is also pre-valent in residents from the Himalayas is question-able because they possess much lower [Hb] (Beall,2000) than the Andean population residing at similaraltitudes, indicating either higher plasma volume orlower hemoglobin mass.In this context, data are not only rare for chronic
hypoxia but also for transient stays at altitude. Nochanges in tHb-mass are reported for up to 3-weekperiods below 4000m (Sawka et al., 2000) whilemodest increases were described after 6 monthslong-term intermittent hypoxia at 3550m (11%;Heinicke et al., 2003; Prommer et al., 2007c), andafter a 6-week Himalaya expedition at a meanaltitude of 5000m (14%; Boning et al., 1997). Strongchanges by more than 40% were shown by Pugh(1964) after 126 days above 5500m and by Reyna-farje et al. (1959) after 1 year at 4550m. Availabledata, therefore, clearly demonstrate that hypoxiaimproves oxygen transport capacity in case time ofexposure and altitude pass a certain threshold.
tHb-mass and performance – cross-sectional studies innormoxia
Beside altitude exposure the state of enduranceperformance is the main factor associated withtHb-mass and RCM. Kjellberg et al. (1949) werethe first investigators describing the relationshipbetween BV, tHb-mass, and aerobic performance.They reported a training-dependent level of BV andtHb-mass of 75.0mL/kg and of 11.5 g/kg for un-trained male subjects, 90.1mL/kg (120%) and13.6 g/kg (118%) for moderately trained athletes,as well as 103.4mL/kg (138%) and 15.7 g/kg(137%) for elite athletes, respectively. A similarpicture on a 10% lower absolute level was demon-strated for females. In a second pioneer study,Astrand (1952) confirmed this close relationshipbetween tHb-mass and VO2max (r5 0.97) for a broadrange of tHb-mass (between 100 and 900 g) for allage groups between 7 and 30 years. The differences inBV between trained and untrained subjects wereconfirmed later by Dill et al. (1974) and Brotherhoodet al. (1975), while other investigators (e.g., Greenet al., 1999) showed only marginal differences in both,
Schmidt and Prommer
58

tHb-mass and BV. In 2001 Heinicke et al. differen-tiated BV and tHb-mass in male elite athletes ofdifferent disciplines and reported about 40% highervalues in endurance athletes (running, cycling, triath-lon, and cross country skiing) than in untrainedsubjects, but only moderately elevated values inathletes practicing anaerobic disciplines (112%,down hill skiers) and in swimmers (120%). In thelatter group, the supine position during trainingand the immersion effects may counteract the BVand tHb-mass expansion. Data from football playersare not yet available. From the results of Goreet al. (1997)) and Heinicke et al. (2001), however,we may assume a BV of about 100mL/kg and tHb-mass of 14.0 g/kg in elite football players (VO2max
65mL/kg).The strong positive relationship between VO2max,
BV, and tHb-mass for absolute and relative valueswas proved in several cross-sectional studies withsmall numbers of subjects (Astrand, 1952; Conver-tino, 1991; Gore et al., 1997; Schmidt et al., 1999;Heinicke et al., 2001).To obtain a generally accepted base for the depen-
dency of VO2max on tHb-mass and BV, we performedthe following meta-analysis: In total 611 subjects, 393males and 218 females, living at sea level (n5 490),2600m (n5 82), or 3500m (n5 39) were included.The studies were carried out by two laboratories[Berlin (n5 212) and Bayreuth (n5 399)] and most ofthe data are published in peer-reviewed journals(Schmidt, 1999, 2002; Heinicke et al., 2001; Boninget al., 2001; Schmidt et al., 2002; Prommer et al.,2007c).All subjects performed a vita maxima test on a
treadmill or on a cycle ergometer with a similarprotocol (for detailed description see original pub-lications). In order to obtain comparable VO2max forthe cycle ergometer and the treadmill, valuesachieved with the latter test were reduced by 7%(e.g. Dill et al., 1974). VO2max which was examined ataltitude was calculated to sea-level conditionsaccording to Fulco et al. (1998). In all subjects tHb-mass and BV were determined by the CO re-breathingtechnique as described by Heinicke et al. (2001,n5 507) or by Schmidt and Prommer (2005,n5 104). Both methods yielded identical results(Schmidt & Prommer, 2005). Furthermore, hemoglo-bin concentration and hematocrit (n5 593) as well asserum concentrations of EPO (n5 496) and transfer-rin receptor (n5 370) were included into the meta-analysis. All of the data, except for EPO, werenormally distributed and showed no systematic dif-ference between the two laboratories. No dependen-cies on age were observed. The athletes wereclassified into four performance categories accordingto their relative sea-level VO2max values (for classifi-cation see Table 1).
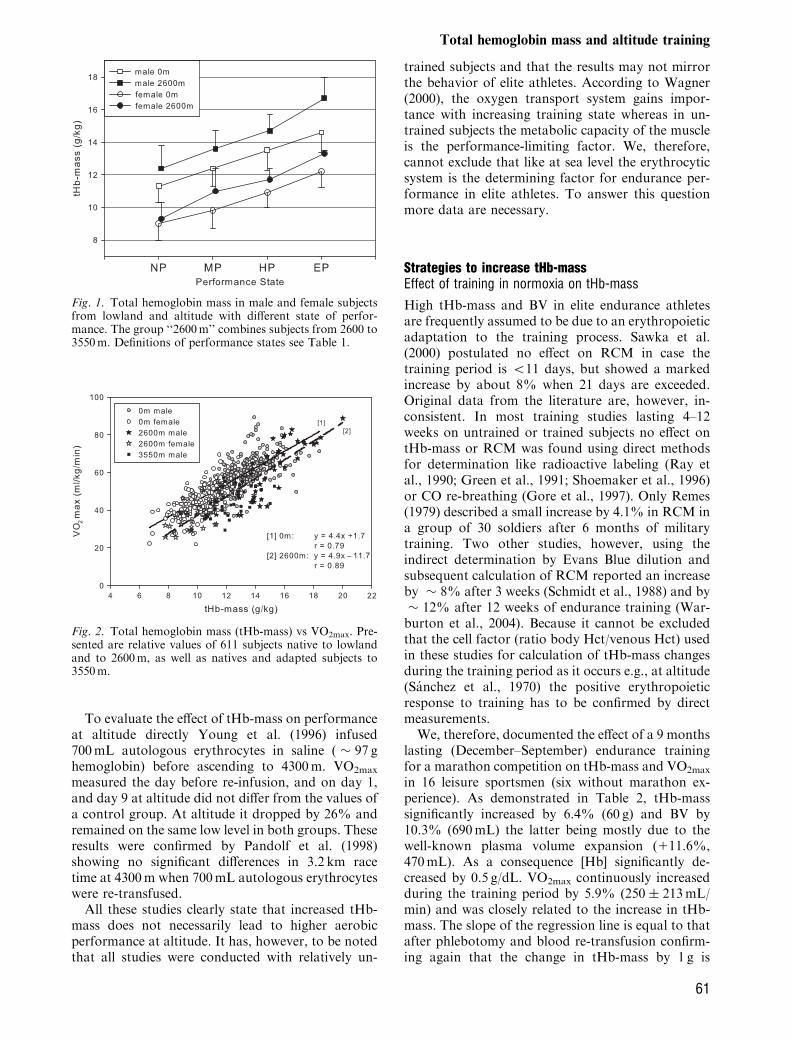
The results of this meta-analysis are in accordancewith the tHb-mass and BV data of Kjellberg et al.(1949) showing the lowest values for non-exercisingsubjects (NP) and about 30% higher values for eliteathletes (EP, Fig. 1, Table 1). It has to be noted thatthe NP-group was not completely sedentary. In all ofthe athletic performance groups, plasma volume waslikewise expanded as red cell volume leading tosimilar hemoglobin concentrations in all subgroupsof the same altitude.Despite a broad scattering of VO2max (e.g., with a
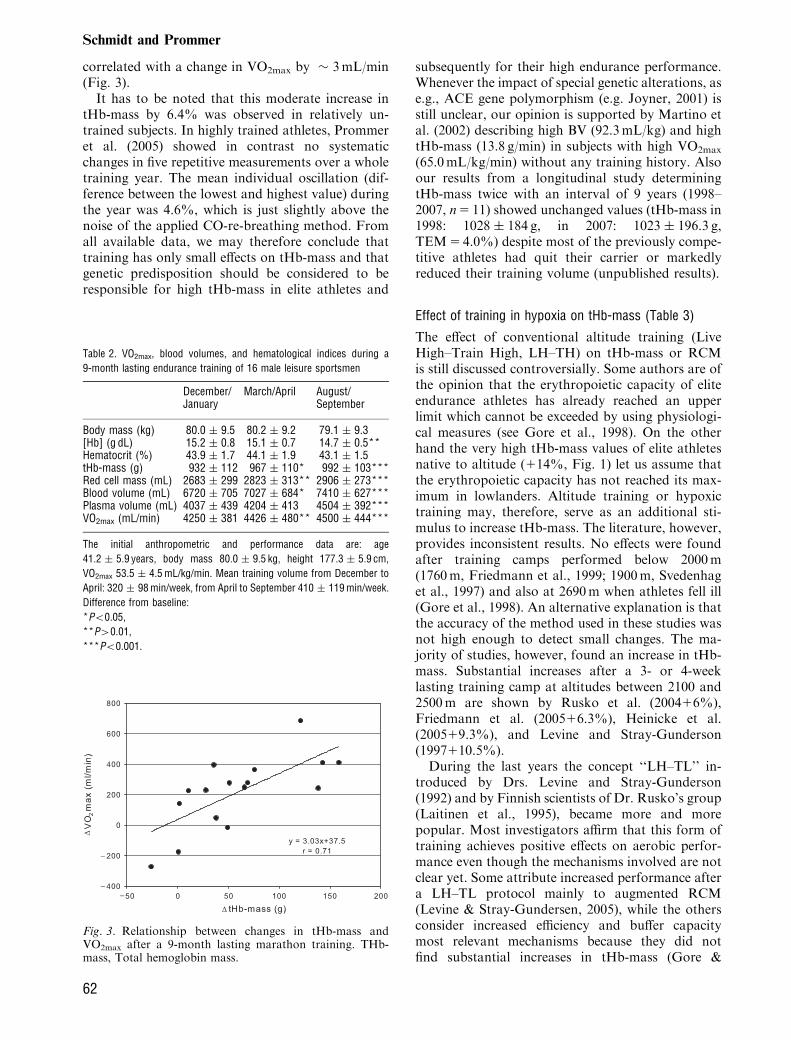
prevailing tHb-mass of 12.0 g/kg VO2max valuesbetween � 40 and � 60mL/kg/min can be at-tained), there is a close relationship between thesetwo parameters (r5 0.79, Fig. 2). The slope of theregression line (at 0m: 4.4), which is similar for males(4.2) and females (4.6) indicates that a change in tHb-mass by 1 g/kg is associated with a change in VO2max
by 4.4mL/kg/min. A similar close dependency isobtained between BV and VO2max (r5 0.762) wherea change in 1mLblood/kg is related to a change inVO2max by 0.7mL/kg/min.These data are well in accordance with the results
of previous studies involving smaller sample size.Gore et al. (1997) described a slope of 4.4 for relativetHb-mass and Convertino (1991) 0.66 for relative BVand VO2max.While the effects of tHb-mass and BV on perfor-
mance can be precisely quantified by all these cross-sectional studies, we did not find any significantdependency of VO2max on hemoglobin concentration(males r5 0.03, females r5 0.12) or hematocrit(males r5 0.08, females r5 0.11). We, therefore,conclude that under physiological, non-anemic con-ditions at sea level the oxygen transport to the muscletissue is regulated by changes in BV with normalhemoglobin concentration rather than by changes inhemoglobin concentration, itself.
tHb-mass and performance – cross-sectional studies inhypoxia
There is no doubt that altitude residents posseshigher tHb-mass than comparable inhabitants fromlowlands (see ‘‘tHb-mass at altitude’’). If tHb mass isthe major determinant of performance, one couldassume that endurance performance is also increasedwhich would give this population an advantage incompetitions at altitude (e.g., soccer games).Whether the strong relationship between the oxygentransport system and VO2max is also true for nativesto altitude, however, still has to be evaluated.To address this question, we also included subjects
from altitude (2600m, n5 82; 3500m, n5 39) intothe meta-analysis and classified them according tothe criteria for lowlanders (see Table 1). TheirVO2max determined at altitude was, therefore, cor-
Total hemoglobin mass and altitude training
59
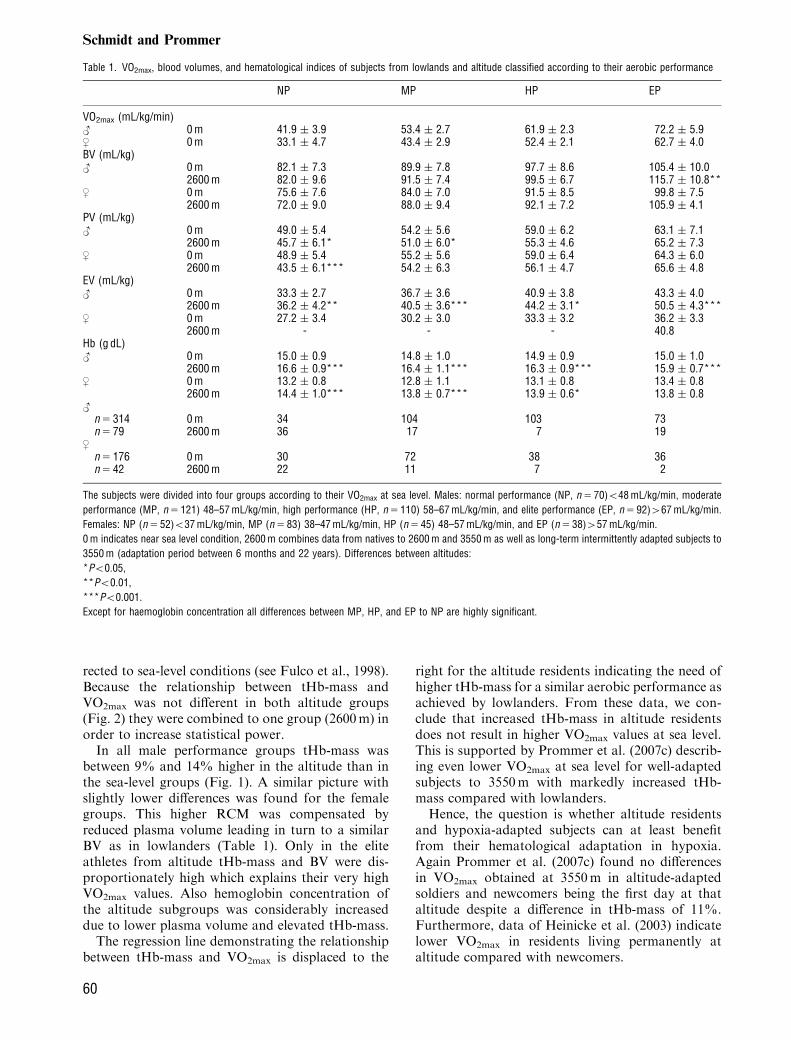
rected to sea-level conditions (see Fulco et al., 1998).Because the relationship between tHb-mass andVO2max was not different in both altitude groups(Fig. 2) they were combined to one group (2600m) inorder to increase statistical power.In all male performance groups tHb-mass was
between 9% and 14% higher in the altitude than inthe sea-level groups (Fig. 1). A similar picture withslightly lower differences was found for the femalegroups. This higher RCM was compensated byreduced plasma volume leading in turn to a similarBV as in lowlanders (Table 1). Only in the eliteathletes from altitude tHb-mass and BV were dis-proportionately high which explains their very highVO2max values. Also hemoglobin concentration ofthe altitude subgroups was considerably increaseddue to lower plasma volume and elevated tHb-mass.The regression line demonstrating the relationship
between tHb-mass and VO2max is displaced to the
right for the altitude residents indicating the need ofhigher tHb-mass for a similar aerobic performance asachieved by lowlanders. From these data, we con-clude that increased tHb-mass in altitude residentsdoes not result in higher VO2max values at sea level.This is supported by Prommer et al. (2007c) describ-ing even lower VO2max at sea level for well-adaptedsubjects to 3550m with markedly increased tHb-mass compared with lowlanders.Hence, the question is whether altitude residents
and hypoxia-adapted subjects can at least benefitfrom their hematological adaptation in hypoxia.Again Prommer et al. (2007c) found no differencesin VO2max obtained at 3550m in altitude-adaptedsoldiers and newcomers being the first day at thataltitude despite a difference in tHb-mass of 11%.Furthermore, data of Heinicke et al. (2003) indicatelower VO2max in residents living permanently ataltitude compared with newcomers.
Table 1. VO2max, blood volumes, and hematological indices of subjects from lowlands and altitude classified according to their aerobic performance
NP MP HP EP
VO2max (mL/kg/min)< 0 m 41.9 � 3.9 53.4 � 2.7 61.9 � 2.3 72.2 � 5.9, 0 m 33.1 � 4.7 43.4 � 2.9 52.4 � 2.1 62.7 � 4.0BV (mL/kg)< 0 m 82.1 � 7.3 89.9 � 7.8 97.7 � 8.6 105.4 � 10.0
2600 m 82.0 � 9.6 91.5 � 7.4 99.5 � 6.7 115.7 � 10.8**, 0 m 75.6 � 7.6 84.0 � 7.0 91.5 � 8.5 99.8 � 7.5
2600 m 72.0 � 9.0 88.0 � 9.4 92.1 � 7.2 105.9 � 4.1PV (mL/kg)< 0 m 49.0 � 5.4 54.2 � 5.6 59.0 � 6.2 63.1 � 7.1
2600 m 45.7 � 6.1* 51.0 � 6.0* 55.3 � 4.6 65.2 � 7.3, 0 m 48.9 � 5.4 55.2 � 5.6 59.0 � 6.4 64.3 � 6.0
2600 m 43.5 � 6.1*** 54.2 � 6.3 56.1 � 4.7 65.6 � 4.8EV (mL/kg)< 0 m 33.3 � 2.7 36.7 � 3.6 40.9 � 3.8 43.3 � 4.0
2600 m 36.2 � 4.2** 40.5 � 3.6*** 44.2 � 3.1* 50.5 � 4.3***, 0 m 27.2 � 3.4 30.2 � 3.0 33.3 � 3.2 36.2 � 3.3
2600 m - - - 40.8Hb (g dL)< 0 m 15.0 � 0.9 14.8 � 1.0 14.9 � 0.9 15.0 � 1.0
2600 m 16.6 � 0.9*** 16.4 � 1.1*** 16.3 � 0.9*** 15.9 � 0.7***, 0 m 13.2 � 0.8 12.8 � 1.1 13.1 � 0.8 13.4 � 0.8
2600 m 14.4 � 1.0*** 13.8 � 0.7*** 13.9 � 0.6* 13.8 � 0.8<
n 5 314 0 m 34 104 103 73n 5 79 2600 m 36 17 7 19
,n 5 176 0 m 30 72 38 36n 5 42 2600 m 22 11 7 2
The subjects were divided into four groups according to their VO2max at sea level. Males: normal performance (NP, n 5 70)o48 mL/kg/min, moderate
performance (MP, n 5 121) 48–57 mL/kg/min, high performance (HP, n 5 110) 58–67 mL/kg/min, and elite performance (EP, n 5 92)467 mL/kg/min.
Females: NP (n 5 52)o37 mL/kg/min, MP (n 5 83) 38–47 mL/kg/min, HP (n 5 45) 48–57 mL/kg/min, and EP (n 5 38)457 mL/kg/min.
0 m indicates near sea level condition, 2600 m combines data from natives to 2600 m and 3550 m as well as long-term intermittently adapted subjects to
3550 m (adaptation period between 6 months and 22 years). Differences between altitudes:*Po0.05,**Po0.01,***Po0.001.
Except for haemoglobin concentration all differences between MP, HP, and EP to NP are highly significant.
Schmidt and Prommer
60
To evaluate the effect of tHb-mass on performanceat altitude directly Young et al. (1996) infused700mL autologous erythrocytes in saline ( � 97 ghemoglobin) before ascending to 4300m. VO2max
measured the day before re-infusion, and on day 1,and day 9 at altitude did not differ from the values ofa control group. At altitude it dropped by 26% andremained on the same low level in both groups. Theseresults were confirmed by Pandolf et al. (1998)showing no significant differences in 3.2 km racetime at 4300m when 700mL autologous erythrocyteswere re-transfused.All these studies clearly state that increased tHb-
mass does not necessarily lead to higher aerobicperformance at altitude. It has, however, to be notedthat all studies were conducted with relatively un-
trained subjects and that the results may not mirrorthe behavior of elite athletes. According to Wagner(2000), the oxygen transport system gains impor-tance with increasing training state whereas in un-trained subjects the metabolic capacity of the muscleis the performance-limiting factor. We, therefore,cannot exclude that like at sea level the erythrocyticsystem is the determining factor for endurance per-formance in elite athletes. To answer this questionmore data are necessary.
Strategies to increase tHb-massEffect of training in normoxia on tHb-mass
High tHb-mass and BV in elite endurance athletesare frequently assumed to be due to an erythropoieticadaptation to the training process. Sawka et al.(2000) postulated no effect on RCM in case thetraining period is o11 days, but showed a markedincrease by about 8% when 21 days are exceeded.Original data from the literature are, however, in-consistent. In most training studies lasting 4–12weeks on untrained or trained subjects no effect ontHb-mass or RCM was found using direct methodsfor determination like radioactive labeling (Ray etal., 1990; Green et al., 1991; Shoemaker et al., 1996)or CO re-breathing (Gore et al., 1997). Only Remes(1979) described a small increase by 4.1% in RCM ina group of 30 soldiers after 6 months of militarytraining. Two other studies, however, using theindirect determination by Evans Blue dilution andsubsequent calculation of RCM reported an increaseby � 8% after 3 weeks (Schmidt et al., 1988) and by� 12% after 12 weeks of endurance training (War-burton et al., 2004). Because it cannot be excludedthat the cell factor (ratio body Hct/venous Hct) usedin these studies for calculation of tHb-mass changesduring the training period as it occurs e.g., at altitude(Sanchez et al., 1970) the positive erythropoieticresponse to training has to be confirmed by directmeasurements.We, therefore, documented the effect of a 9 months
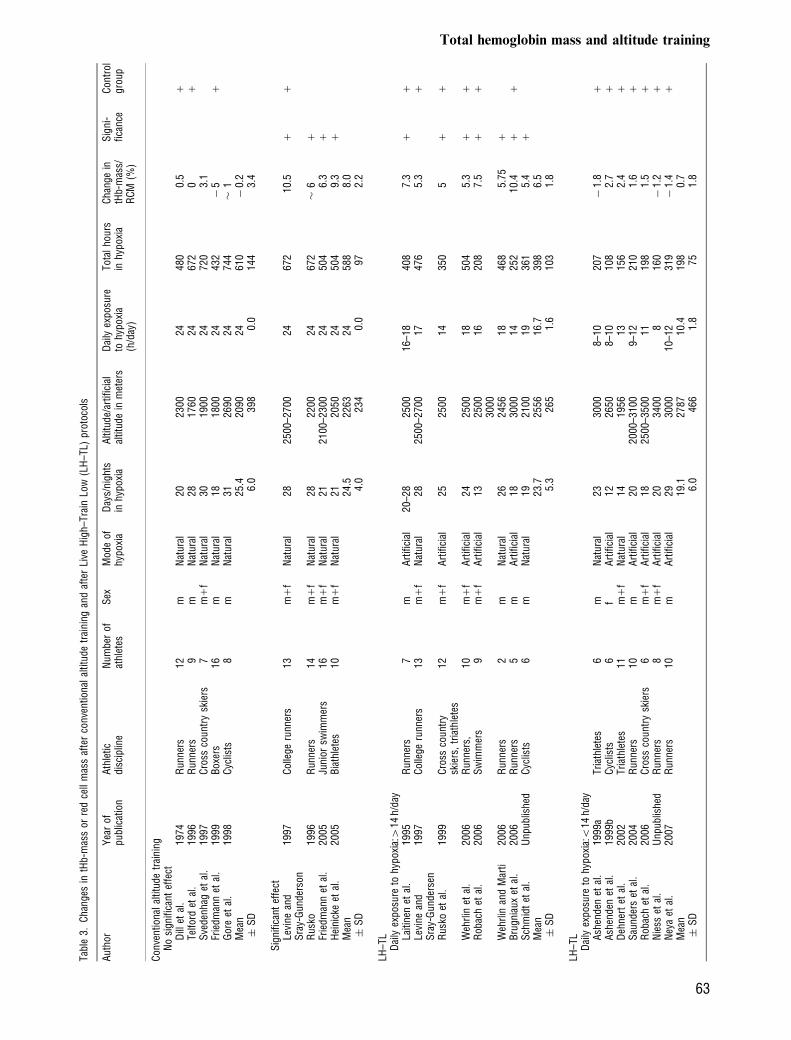
lasting (December–September) endurance trainingfor a marathon competition on tHb-mass and VO2max
in 16 leisure sportsmen (six without marathon ex-perience). As demonstrated in Table 2, tHb-masssignificantly increased by 6.4% (60 g) and BV by10.3% (690mL) the latter being mostly due to thewell-known plasma volume expansion (111.6%,470mL). As a consequence [Hb] significantly de-creased by 0.5 g/dL. VO2max continuously increasedduring the training period by 5.9% (250 � 213mL/min) and was closely related to the increase in tHb-mass. The slope of the regression line is equal to thatafter phlebotomy and blood re-transfusion confirm-ing again that the change in tHb-mass by 1 g is
Fig. 2. Total hemoglobin mass (tHb-mass) vs VO2max. Pre-sented are relative values of 611 subjects native to lowlandand to 2600m, as well as natives and adapted subjects to3550m.
Fig. 1. Total hemoglobin mass in male and female subjectsfrom lowland and altitude with different state of perfor-mance. The group ‘‘2600m’’ combines subjects from 2600 to3550m. Definitions of performance states see Table 1.
Total hemoglobin mass and altitude training
61
correlated with a change in VO2max by � 3mL/min(Fig. 3).It has to be noted that this moderate increase in
tHb-mass by 6.4% was observed in relatively un-trained subjects. In highly trained athletes, Prommeret al. (2005) showed in contrast no systematicchanges in five repetitive measurements over a wholetraining year. The mean individual oscillation (dif-ference between the lowest and highest value) duringthe year was 4.6%, which is just slightly above thenoise of the applied CO-re-breathing method. Fromall available data, we may therefore conclude thattraining has only small effects on tHb-mass and thatgenetic predisposition should be considered to beresponsible for high tHb-mass in elite athletes and
subsequently for their high endurance performance.Whenever the impact of special genetic alterations, ase.g., ACE gene polymorphism (e.g. Joyner, 2001) isstill unclear, our opinion is supported by Martino etal. (2002) describing high BV (92.3mL/kg) and hightHb-mass (13.8 g/min) in subjects with high VO2max
(65.0mL/kg/min) without any training history. Alsoour results from a longitudinal study determiningtHb-mass twice with an interval of 9 years (1998–2007, n5 11) showed unchanged values (tHb-mass in1998: 1028 � 184 g, in 2007: 1023 � 196.3 g,TEM5 4.0%) despite most of the previously compe-titive athletes had quit their carrier or markedlyreduced their training volume (unpublished results).
Effect of training in hypoxia on tHb-mass (Table 3)
The effect of conventional altitude training (LiveHigh–Train High, LH–TH) on tHb-mass or RCMis still discussed controversially. Some authors are ofthe opinion that the erythropoietic capacity of eliteendurance athletes has already reached an upperlimit which cannot be exceeded by using physiologi-cal measures (see Gore et al., 1998). On the otherhand the very high tHb-mass values of elite athletesnative to altitude (114%, Fig. 1) let us assume thatthe erythropoietic capacity has not reached its max-imum in lowlanders. Altitude training or hypoxictraining may, therefore, serve as an additional sti-mulus to increase tHb-mass. The literature, however,provides inconsistent results. No effects were foundafter training camps performed below 2000m(1760m, Friedmann et al., 1999; 1900m, Svedenhaget al., 1997) and also at 2690m when athletes fell ill(Gore et al., 1998). An alternative explanation is thatthe accuracy of the method used in these studies wasnot high enough to detect small changes. The ma-jority of studies, however, found an increase in tHb-mass. Substantial increases after a 3- or 4-weeklasting training camp at altitudes between 2100 and2500m are shown by Rusko et al. (200416%),Friedmann et al. (200516.3%), Heinicke et al.(200519.3%), and Levine and Stray-Gunderson(1997110.5%).During the last years the concept ‘‘LH–TL’’ in-
troduced by Drs. Levine and Stray-Gunderson(1992) and by Finnish scientists of Dr. Rusko’s group(Laitinen et al., 1995), became more and morepopular. Most investigators affirm that this form oftraining achieves positive effects on aerobic perfor-mance even though the mechanisms involved are notclear yet. Some attribute increased performance aftera LH–TL protocol mainly to augmented RCM(Levine & Stray-Gundersen, 2005), while the othersconsider increased efficiency and buffer capacitymost relevant mechanisms because they did notfind substantial increases in tHb-mass (Gore &
Table 2. VO2max, blood volumes, and hematological indices during a
9-month lasting endurance training of 16 male leisure sportsmen
December/January
March/April August/September
Body mass (kg) 80.0 � 9.5 80.2 � 9.2 79.1 � 9.3[Hb] (g dL) 15.2 � 0.8 15.1 � 0.7 14.7 � 0.5**Hematocrit (%) 43.9 � 1.7 44.1 � 1.9 43.1 � 1.5tHb-mass (g) 932 � 112 967 � 110* 992 � 103***Red cell mass (mL) 2683 � 299 2823 � 313** 2906 � 273***Blood volume (mL) 6720 � 705 7027 � 684* 7410 � 627***Plasma volume (mL) 4037 � 439 4204 � 413 4504 � 392***VO2max (mL/min) 4250 � 381 4426 � 480** 4500 � 444***
The initial anthropometric and performance data are: age
41.2 � 5.9 years, body mass 80.0 � 9.5 kg, height 177.3 � 5.9 cm,
VO2max 53.5 � 4.5 mL/kg/min. Mean training volume from December to
April: 320 � 98 min/week, from April to September 410 � 119 min/week.
Difference from baseline:*Po0.05,**P40.01,***Po0.001.
Fig. 3. Relationship between changes in tHb-mass andVO2max after a 9-month lasting marathon training. THb-mass, Total hemoglobin mass.
Schmidt and Prommer
62
Tabl
e3.
Cha
nges
intH
b-m
ass
orre
dce
llm
ass
afte
rco
nven
tiona
lal
titud
etr
aini
ngan
daf
ter
Live
Hig
h–Tr
ain
Low
(LH
–TL)
prot
ocol
s
Aut
hor
Yea
rof
publ
icat
ion
Ath
letic
disc
iplin
eN
umbe
rof
athl
etes
Sex
Mod
eof
hypo
xia
Day
s/ni
ghts
inhy
poxi
aA
ltitu
de/a
rtifi
cial
altit
ude
inm
eter
sD
aily
expo
sure
tohy
poxi
a(h
/day
)
Tota
lho
urs
inhy
poxi
aC
hang
ein
tHb-
mas
s/R
CM
(%)
Sig
ni-
fican
ceC
ontr
olgr
oup
Con
vent
iona
lal
titud
etr
aini
ngN
osi
gnifi
cant
effe
ctD
illet
al.
1974
Run
ners
12m
Nat
ural
2023
0024
480
0.5
1Te
lford
etal
.19
96R
unne
rs9
mN
atur
al28
1760
2467
20
1S
vede
nhag
etal
.19
97C
ross
coun
try
skie
rs7
m1
fN
atur
al30
1900
2472
03.
1Fr
iedm
ann
etal
.19
99B
oxer
s16
mN
atur
al18
1800
2443
2�
51
Gor
eet
al.
1998
Cyc
lists
8m
Nat
ural
3126
9024
744
�1
Mea
n25
.420
9024
610
�0.
2�
SD
6.0
398
0.0
144
3.4
Sig
nific
ant
effe
ctLe
vine
and
Sra
y-G
unde
rson
1997
Col
lege
runn
ers
13m
1f
Nat
ural
2825
00–2
700
2467
210
.51
1
Rus
ko19
96R
unne
rs14
m1
fN
atur
al28
2200
2467
2�
61
Frie
dman
net
al.
2005
Juni
orsw
imm
ers
16m
1f
Nat
ural
2121
00–2
300
2450
46.
31
Hei
nick
eet
al.
2005
Bia
thle
tes
10m
1f
Nat
ural
2120
5024
504
9.3
1M
ean
24.5
2263
2458
88.
0�
SD
4.0
234
0.0
972.
2
LH–T
LD
aily
expo
sure
tohy
poxi
a:4
14h/
day
Laiti
nen
etal
.19
95R
unne
rs7
mA
rtifi
cial
20–2
825
0016
–18
408
7.3
11
Levi
nean
dS
ray-
Gun
ders
en19
97C
olle
geru
nner
s13
m1
fN
atur
al28
2500
–270
017
476
5.3
1
Rus
koet
al.
1999
Cro
ssco
untr
ysk
iers
,tr
iath
lete
s12
m1
fA
rtifi
cial
2525
0014
350
51
1
Weh
rlin
etal
.20
06R
unne
rs,
10m
1f
Art
ifici
al24
2500
1850
45.
31
1R
obac
het
al.
2006
Sw
imm
ers
9m
1f
Art
ifici
al13
2500
1620
87.
51
1
3000
Weh
rlin
and
Mar
ti20
06R
unne
rs2
mN
atur
al26
2456
1846
85.
751
Bru
gnia
uxet
al.
2006
Run
ners
5m
Art
ifici
al18
3000
1425
210
.41
1S
chm
idt
etal
.U
npub
lishe
dC
yclis
ts6
mN
atur
al19
2100
1936
15.
41
Mea
n23
.725
5616
.739
86.
5�
SD
5.3
265
1.6
103
1.8
LH–T
LD
aily
expo
sure
tohy
poxi
a:o
14h/
day
Ash
ende
net
al.
1999
aTr
iath
lete
s6
mN
atur
al23
3000
8–10
207
�1.
81
Ash
ende
net
al.
1999
bC
yclis
ts6
fA
rtifi
cial
1226
508–
1010
82.
71
Deh
nert
etal
.20
02Tr
iath
lete
s11
m1
fN
atur
al14
1956
1315
62.
41
Sau
nder
set
al.
2004
Run
ners
10m
Art
ifici
al20
2000
–310
09–
1221
01.
61
Rob
ach
etal
.20
06C
ross
coun
try
skie
rs6
m1
fA
rtifi
cial
1825
00–3
500
1119
81.
51
Nie
sset
al.
Unp
ublis
hed
Run
ners
8m
1f
Art
ifici
al20
3400
816
0�
1.2
1N
eya
etal
.20
07R
unne
rs10
mA
rtifi
cial
2930
0010
–12
319
�1.
41
Mea
n19
.127
8710
.419
80.
7�
SD
6.0
466
1.8
751.
8
Total hemoglobin mass and altitude training
63
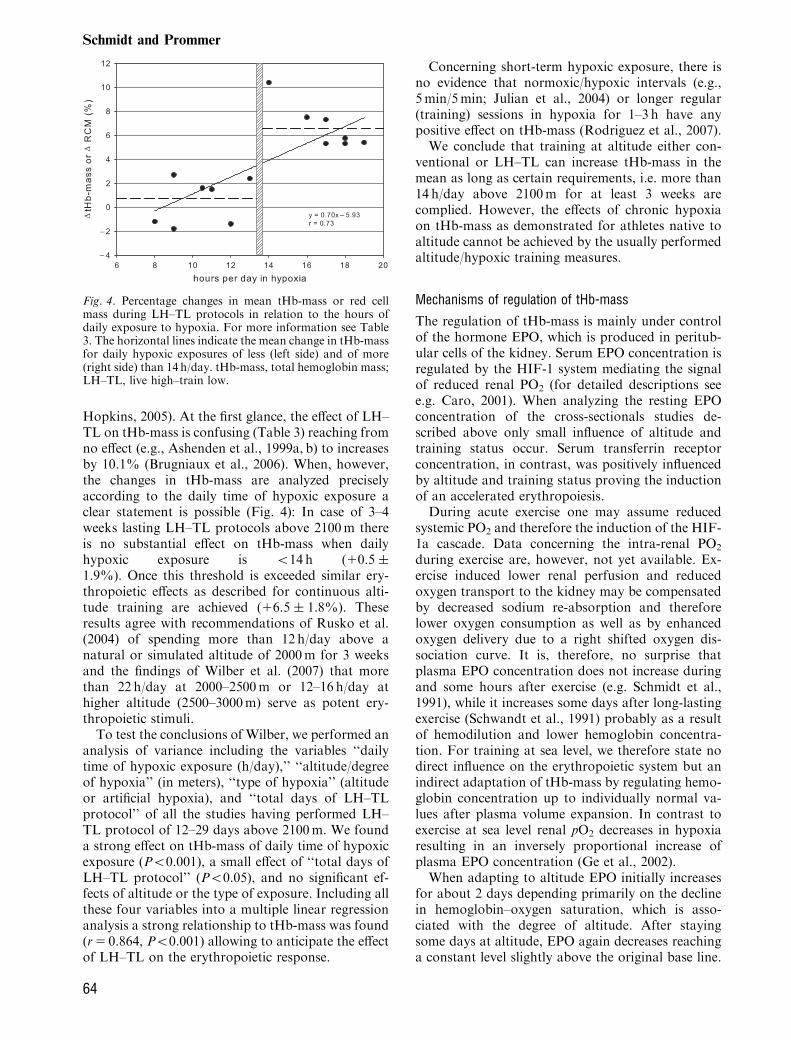
Hopkins, 2005). At the first glance, the effect of LH–TL on tHb-mass is confusing (Table 3) reaching fromno effect (e.g., Ashenden et al., 1999a, b) to increasesby 10.1% (Brugniaux et al., 2006). When, however,the changes in tHb-mass are analyzed preciselyaccording to the daily time of hypoxic exposure aclear statement is possible (Fig. 4): In case of 3–4weeks lasting LH–TL protocols above 2100m thereis no substantial effect on tHb-mass when dailyhypoxic exposure is o14 h (10.5 �1.9%). Once this threshold is exceeded similar ery-thropoietic effects as described for continuous alti-tude training are achieved (16.5 � 1.8%). Theseresults agree with recommendations of Rusko et al.(2004) of spending more than 12 h/day above anatural or simulated altitude of 2000m for 3 weeksand the findings of Wilber et al. (2007) that morethan 22 h/day at 2000–2500m or 12–16 h/day athigher altitude (2500–3000m) serve as potent ery-thropoietic stimuli.To test the conclusions of Wilber, we performed an
analysis of variance including the variables ‘‘dailytime of hypoxic exposure (h/day),’’ ‘‘altitude/degreeof hypoxia’’ (in meters), ‘‘type of hypoxia’’ (altitudeor artificial hypoxia), and ‘‘total days of LH–TLprotocol’’ of all the studies having performed LH–TL protocol of 12–29 days above 2100m. We founda strong effect on tHb-mass of daily time of hypoxicexposure (Po0.001), a small effect of ‘‘total days ofLH–TL protocol’’ (Po0.05), and no significant ef-fects of altitude or the type of exposure. Including allthese four variables into a multiple linear regressionanalysis a strong relationship to tHb-mass was found(r5 0.864, Po0.001) allowing to anticipate the effectof LH–TL on the erythropoietic response.
Concerning short-term hypoxic exposure, there isno evidence that normoxic/hypoxic intervals (e.g.,5min/5min; Julian et al., 2004) or longer regular(training) sessions in hypoxia for 1–3 h have anypositive effect on tHb-mass (Rodriguez et al., 2007).We conclude that training at altitude either con-
ventional or LH–TL can increase tHb-mass in themean as long as certain requirements, i.e. more than14 h/day above 2100m for at least 3 weeks arecomplied. However, the effects of chronic hypoxiaon tHb-mass as demonstrated for athletes native toaltitude cannot be achieved by the usually performedaltitude/hypoxic training measures.
Mechanisms of regulation of tHb-mass
The regulation of tHb-mass is mainly under controlof the hormone EPO, which is produced in peritub-ular cells of the kidney. Serum EPO concentration isregulated by the HIF-1 system mediating the signalof reduced renal PO2 (for detailed descriptions seee.g. Caro, 2001). When analyzing the resting EPOconcentration of the cross-sectionals studies de-scribed above only small influence of altitude andtraining status occur. Serum transferrin receptorconcentration, in contrast, was positively influencedby altitude and training status proving the inductionof an accelerated erythropoiesis.During acute exercise one may assume reduced
systemic PO2 and therefore the induction of the HIF-1a cascade. Data concerning the intra-renal PO2
during exercise are, however, not yet available. Ex-ercise induced lower renal perfusion and reducedoxygen transport to the kidney may be compensatedby decreased sodium re-absorption and thereforelower oxygen consumption as well as by enhancedoxygen delivery due to a right shifted oxygen dis-sociation curve. It is, therefore, no surprise thatplasma EPO concentration does not increase duringand some hours after exercise (e.g. Schmidt et al.,1991), while it increases some days after long-lastingexercise (Schwandt et al., 1991) probably as a resultof hemodilution and lower hemoglobin concentra-tion. For training at sea level, we therefore state nodirect influence on the erythropoietic system but anindirect adaptation of tHb-mass by regulating hemo-globin concentration up to individually normal va-lues after plasma volume expansion. In contrast toexercise at sea level renal pO2 decreases in hypoxiaresulting in an inversely proportional increase ofplasma EPO concentration (Ge et al., 2002).When adapting to altitude EPO initially increases
for about 2 days depending primarily on the declinein hemoglobin–oxygen saturation, which is asso-ciated with the degree of altitude. After stayingsome days at altitude, EPO again decreases reachinga constant level slightly above the original base line.
Fig. 4. Percentage changes in mean tHb-mass or red cellmass during LH–TL protocols in relation to the hours ofdaily exposure to hypoxia. For more information see Table3. The horizontal lines indicate the mean change in tHb-massfor daily hypoxic exposures of less (left side) and of more(right side) than 14 h/day. tHb-mass, total hemoglobin mass;LH–TL, live high–train low.
Schmidt and Prommer
64

It is not known, whether this decline reflectsenhanced EPO-binding to its receptor (Rusko et al.,2004) or a decrease in EPO production due toa functional feedback loop limiting the hypoxicresponse by a HIF-regulated expression ofprolyl-4-hydroxylase (PHD2 and PHD3) (Stiehlet al., 2006).Interestingly, the EPO-system completely recovers
within 2 or 3 days after returning to sea level.Subjects commuting weekly between altitudes showoscillations in plasma-EPO for more than 20 years(Heinicke et al., 2003). Daily changes of altitudesmay increase the sensitivity of the EPO systemand may therefore explain higher morning plasmaEPO concentration when applying the LH–TLcompared with the LH–TH protocol (Rusko et al.,2004).When exercise is performed under acute hypoxia,
EPO increases in a similar magnitude as underresting hypoxic conditions. Exercise in chronic hy-poxia (natives to 3500m) even results in a significantdecrease in plasma EPO (Schmidt et al., 1993). We,therefore, conclude that exercise under hypoxic con-ditions has no direct effect on red cell production.Originally, RCM was assumed to be exclusively
regulated by the erythropoietic activity of the bonemarrow and the red cell survival time to be relativelyconstant ( � 100 days) in healthy subjects. Thisdogma was disproved by Alfrey et al. (1997) andRice et al. (2001) showing a selective destruction ofyoung red cells (age lower than 12 days) in cases ofplethora induced by space flight or descend fromhigh altitude. Changing the altitude from 4380m tosea level resulted in a decrease of RCM by about10% within 7 days in well-acclimatized subjects (Riceet al., 2001). This reaction called neocytolysis istriggered by a strongly reduced plasma EPO concen-tration whereas daily administration of a small doseof rhEPO completely prevents the hemolysis. Neo-cytolysis probably occurs within the spleen, whereendothelial cells respond to the withdrawal of EPOby influencing the interaction of phagocytes withyoung red cells which are targeted by surface adhe-sion molecules (Trial et al., 2001; Rice & Alfrey,2005; Risso et al., 2007).This mechanism can also be considered as cause of
the above-described missing response of tHb-mass toLH–TL protocols with o14 h/day in hypoxia. Inthese cases, the daily occurring increase of EPOmay induce a high production of reticulocytes,which, however, do not survive due to the strongoscillating EPO-levels (Schmidt, 2006).Also the effects of conventional altitude training
may be modified by neocytolytic processes. That isthat under practical aspects a longer stay at altitudemay be more efficient, because more of the red cellsproduced at altitude exceed the critical age of � 10
days and will therefore not be subject to neocytolyticprocesses after the athletes return to sea level.The different individual responses to altitude
(Chapman et al., 1998) have been discussed on agenetic and physiological background. In a firststudy, Witkowski et al. (2002) showed a specific alleleof the EPO gene (D7S477 allele) discriminatingbetween subjects reacting with high or low erythro-poietin response to 2800m altitude. This result,however, was not confirmed in follow-up studies.One theory for the existence of responders and non-responders is based on the individual hypoxic venti-latory response influencing arterial Hb–O2-satura-tion and subsequently renal EPO production. Inthe study of Heinicke et al. (2005) an example for aresponder is provided. His increase in tHb-mass by18.3% within 3 weeks at 2100m (mean of thegroup17.2%) was accompanied by lower Hb–O2-saturation, right shifted oxygen dissociation curve,and higher EPO concentration. Reasons for a miss-ing response to altitude may be a high hypoxicventilatory response (HVR) as it is typical forfemales rather than for males (Boning et al., 2004)as well as the inhibition of erythropoiesis due toinflammatory diseases or a lack of iron availability.
Conclusions
VO2max directly depends on tHb-mass under nor-moxic conditions. Hence, a change in tHb-mass of1 g results in a change of VO2max of � 3mL/min.Elite endurance athletes show in the mean 35%higher values than the normal population, whereasathletes native to altitude posses even 14%more. Thealtitude induced higher O2-transport capacity doesneither augment VO2max at sea level nor at altitude inrelatively untrained subjects. Whether it increasesendurance performance in elite athletes native toaltitude still remains questionable.Training at sea level has only small direct impact
on the erythropoetic system. Genetic predispositionseems to be a prerequisite for high tHb-mass and highendurance performance. Conventional altitude train-ing as well as the concept LH–TL similarly increasestHb-mass as long as the following guidelines arefollowed: altitude above 2100m, duration about 3–4weeks, daily time of hypoxic exposure not o14 h/day(414 h/day – tHb-mass16.5%; o14 h/day – tHb-mass10.7%). The mean level of tHb-mass in eliteathletes native to altitude (114%) can, however, notbe achieved by these altitude training measures.
Recommendations
1. Organizers of athletic competitions should beaware that athletes of endurance disciplinesfrom lowlands may be discriminated due to
Total hemoglobin mass and altitude training
65
insufficient time for hematological adaptationand ventilatory acclimatization.
2. Regarding the general strong relationship be-tween tHb-mass and VO2max athletes from low-lands may improve their aerobic capacity ataltitude by increasing their tHb-mass. tHb-mass in highly trained athletes can be augmentedby either conventional altitude training and/orLH–TL at altitudes above 2100m. Both mod-alities of altitude training should be performedfor at least 3 weeks and in case of LH–TLprocedures the daily hypoxic exposure shouldnot be o14 h/day at natural altitude or corre-sponding normobaric or hypobaric hypoxia.
3. Whether an athlete can increase his tHb-mass byaltitude or hypoxia and to which extent this mayoccur is individually different. In case variousstays at altitude or various hypoxic measures arescheduled the erythropoietic response has to beevaluated to distinguish responders from non-responders.
4. Athletes of endurance disciplines are advised tomake use of the hematological adaptation pro-cess and arrive at least 1 week at moderate and 2weeks at high altitude before the start.
5. Since 3 weeks after an altitude training tHb-mass is reduced again by 50% the time lagbetween descent from altitude training andcompetition should be o20 days.
6. Filled iron stores (we recommend Ferritin levelsof 435 ng/mL) are necessary to obtain theoptimal effect of altitude or hypoxia exposureon erythropoiesis.
Further investigation
1. Further investigations are needed to clarify therole tHb-mass is playing for maximum perfor-mance at altitude. It has to be investigatedwhether the strong relationship between tHb-mass and VO2max at sea level is also true forhypoxic conditions.
2. tHb-mass and BV of football players native todifferent altitudes should be compared placingspecial emphasis on ethnic origin since the formof adaptation to hypoxia may be different.
3. The effects of neocytolysis on RCM have to beevaluated when well-adapted athletes descendfrom altitude and when sea-level athletes livehigh and train low.
Key words: VO2max, total hemoglobin mass, red cellmass, altitude, live high–train low.
Acknowledgement
We thank Prof. Dr. Boning for providing us with tHb-massdata.
Conflict of interest: The author has declared that they
have no conflict of interests.
References
Alfrey CP, Rice L, Udden MM, DriscollTB. Neocytolysis: physiological down-regulator of red-cell mass. Lancet 1997:349: 1389–1390.
Ashenden MJ, Gore CJ, Dobson GP,Hahn AG. Live high, train low doesnot change the total haemoglobin massof male endurance athletes sleeping at asimulated altitude of 3000m for 23nights. Eur J Appl Physiol 1999a: 80:479–484.
Ashenden MJ, Gore CJ, Martin DT,Dobson GP, Hahn AG. Effects of a 12-day ‘‘live high, train low’’ camp onreticulocyte production andhaemoglobin mass in elite female roadcyclists. Eur J Appl Physiol 1999b: 80:472–478.
Astrand P-O. The total quantity ofhemoglobin and blood volume. 1952:39–59.
Beall CM. Tibetan and Andeanpatterns of adaption to high-altitude
hypoxia. Human Biol 2000: 72:201–228.
Brotherhood J, Brozovic B, Pugh LGC.Haematological status of middle- andlong-distance runners. Clin Sci MolMed 1975: 48: 139–145.
Brugniaux JV, Schmitt P, Robach P,Nicolet G, Fouillot J-P, Moutereau S,Lasne F, Pialoux V, Saas P, Chorvot J,Cornolo J, Olsen NV, Richalet J-P.Eighteen days of ‘‘living high, traininglow’’ stimulate erythropoiesis andenhance aerobic performance in elitemiddle-distance runners. J ApplPhysiol 2006: 100: 203–211.
Burge CM, Skinner SL. Determination ofhemoglobin mass and blood volumewith CO: evaluation and application ofa method. J Appl Physiol 1995: 79:623–631.
Boning D, Cristancho E, Serrato M,Reyes O, Mora M, Coy L,Rojas J. Hemoglobin mass and
peak oxygen uptakes in untrainedand trained female altituderesidents. Int J Sports Med 2004: 25:561–568.
Boning D, Maassen N, Jochum F,Steinacker J, Halder A, Thomas A,Schmidt W, Noe G, Kubanek B. After-effects of a high altitude expedition onblood. Int J Sports Med 1997: 18: 179–185.
Boning D, Rojas J, Serrato M, Ulloa C,Coy L, Mora M, Hutler M.Hemoglobin mass and peak oxygenuptake in untrained and trainedresidents of moderate altitude. Int JSports Med 2001: 22: 1–7.
Caro J. Hypoxia regulation of genetranscription. High Alt Med Biol 2001:2: 145–154.
Celsing F, Svedenhag J, Pihlstedt P,Ekblom B. Effects of anaemia andstepwise-induced polycythaemia onmaximal aerobic power in individuals
Schmidt and Prommer
66
with high and low haemoglobinconcentrations. Acta Physiol Scand1987: 129: 47–54.
Chapman RF, Stray-Gunderson J, LevineBD. Individual variation in response toaltitude training. J Appl Physiol 1998:85: 1448–1456.
Convertino VA. Blood volume: itsadaptation to endurance training. MedSci Sports Exerc 1991: 23: 1338–1348.
Dehnert C, Hutler M, Liu Y, Menold E,Netzer C, Schick R, Kubanek B,Lehmann M, Boning D, SteinackerJM. Erythropoiesis and performanceafter two weeks of living high andtraining low in well trained triathletes.Int J Sports Med 2002: 23: 561–566.
Dill DB, Braithwaite K, Adams WC,Bernauer EM. Blood volume ofmiddle-distance runners: effect of2,300-m altitude and comparison withnon-athletes. Med Sci Sports 1974: 6:1–7.
Friedmann B, Frese F, Menold E,Kauper F, Jost J, Bartsch P. Individualvariation in the erythropoietic responseto altitude training in elite juniorswimmers. Br J Sports Med 2005: 39:148–153.
Friedmann B, Jost J, Rating T, Weller E,Werle E, Eckhardt K-U, Bartsch P,Mairlaurl H. Effects of ironsupplement on total body hemoglobinduring endurance training at moderatealtitude. Int J Sports Med 1999: 20: 78–85.
Fulco CS, Rock PB, Cymerman A.Maximal and submaximal exerciseperformance at altitude. Aviat SpaceEnviron Med 1998: 69: 793–801.
Ge R-L, Witkowski S, Zhang Y, AlfreyC, Sivieri M, Karlsen T, Resaland GK,Harber M, Stray-Gundersen J, LevineBD. Determinants of erythropoietinrelease in response to short-termhypobaric hypoxia. J Appl Phys 2002:92: 2361–2367.
Gore C, Craig N, Hahn A, Rice A,Bourdon P, Lawrence S, Waish C,Stanef T, Barnes P, Parisotto R,Martin D, Pyne D. Altitude training at2690m does not increase totalhaemoglobin mass or sea level VO2max
in world champion track cyclists. J SciMed Sport 1998: 1: 156–170.
Gore CJ, Bourdon PC, Woolford SM,Ostler LM, Eastwood A, Scroop GC.Time and sample site dependency ofthe optimized CO-Rebreathingmethod. Med Sci Sport Exerc 2006: 38:1187–1193.
Gore CJ, Hahn AG, Burge CM, TelfordRD. Vo2max and haemoglobin mass oftrained athletes during high intensitytraining. Int J Sports Med 1997: 18:477–482.
Gore CJ, Hopkins WG. Counterpoint:positive effects of intermittent hypoxia
(live high: train low) on exerciseperformance are not mediatedprimarily by augmented red cellvolume. J Appl Physiol 2005: 99: 2055–2057.
Gore CJ, Hopkins WG, Burge CM.Errors of measurement for bloodvolume parameters: a meta-analysis. JAppl Physiol 2005: 99: 1745–1758.
Green HJ, Carter S, Grant S, Tupling R,Coates G, Ali M. Vascular volumesand hematology in male and femalerunners and cyclists. Eur J ApplPhysiol 1999: 79: 244–250.
Green HJ, Sutton JR, Coates G, Ali M,Jones S. Response of red cell andplasma volume to prolonged training inhumans. J Appl Physiol 1991: 70: 1810–1815.
Grehant M, Quinquard E. Mesures duvolume du sang contenu dansl’organisme d’un mammifere vivant. CR Acad Sci Paris 1882: 94: 1450.
Heinicke K, Heinicke I, Schmidt W,Wolfarth B. A three-week traditionalaltitude training increases hemoglobinmass and red cell volume in elitebiathlon athletes. Int J Sports Med2005: 26: 350–355.
Heinicke K, Prommer N, Cajigal J, ViolaT, Behn C, Schmidt W. Long-termexposure to intermittent hypoxiaresults in increased hemoglobin mass,reduced plasma volume, and elevatederythropoietin plasma levels in man.Eur J Appl Physiol 2003: 88:535–543.
Heinicke K, Wolfahrt B, Winchenbach P,Biermann B, Schmid A, Huber G,Friedmann B, Schmidt W. Bloodvolume and hemoglobin mass in eliteathletes of different disciplines. Int JSports Med 2001: 22: 504–512.
Joyner MJ. Ace genetics and VO2max.Exerc Sport Sci Rev 2001: 29: 47–48.
Julian CG, Gore CJ, Wilber RL, DanielsJT, Fredericson M, Stray-Gundersen J,Hahn AG, Parisotto R, Levine BD.Intermittent normobaric hypoxia doesnot alter performance or erythropoieticmarkers in highly trained distancerunners. J Appl Physiol 2004: 96:1800–1807.
Kjellberg SR, Rudhe U, Sjostrand T.Increase of the amount of hemoglobinand blood volume in connection withphysical training. Acta Physiol Scand1949: 19: 146–152.
Laitinen H, Alopaeus K, Heikkinen R,Hietanen H, Mikkelson L, TikkanenH, Rusko HK. Acclimatization toliving in normobaric hypoxia andtraining in normoxia at sea level inrunners. Med Sci Sports Exerc 1995:27: 109.
Levine BD, Stray-Gunderson J. ‘‘Livinghigh-training low’’: effect of moderate-altitude acclimatization with low-
altitude training on performance. JAppl Physiol 1997: 83: 102–112.
Levine BD, Stray-Gundersen J. Point:positive effects of intermittent hypoxia(live high: train low) on exerciseperformance are mediated primarily byaugmented red cell volume. J ApplPhysiol 2005: 99: 2053–2055.
Levine BD, Stray-Gunderson J. Apractical approach to altitude training:where to live and train for optimalperformance enhancement. Int J SportsMed 1992: 13: 209–212.
Martino M, Gledhill N, Jamnik V. HighVO2max with no history of training isprimarily due to high blood volume.Med Sci Sports Exerc 2002: 34: 966–971.
Neya M, Enoki T, Kumai Y, Sugoh T,Kawahara T. The effects of nightlynormobaric hypoxia and high intensitytraining under intermittent normobarichypoxia on running economy andhemoglobin mass. J Appl Physiol 2007:103: 828–834.
Pandolf KB, Young AJ, Sawka MN,Kenney JL, Sharp MW, Cote RR,Freund BJ, Valeri CR. Doeserythrocyte infusion improve 3.2-kmrun performance at high altitude? Eur JAppl Physiol Occup Physiol 1998: 80:511–505.
Parisotto R, Gore CJ, Emslie KR,Ashenden MJ, Brugnara C, Howe C,Martin DT, Trout GJ. A novel methodutilizing markers of alterederythropoiesis for the detection ofrecombinant human erythropoeitinabuse in athletes. Haematologica 2000:85: 564–572.
Prommer N, Ehrmann U, Schmidt W,Steinacker JM, Radermacher P, MuthC-M. Total haemoglobin mass andspleen contraction: a study oncompetitive apnea divers, non-divingathletes and untrained controlsubjects. Eur J Appl Physiol 2007a:101: 753–759.
Prommer N, Heckel A, Schmidt W.Timeframe to detect blood withdrawalassociated with autologous blooddoping. Med Sci Sports Exerc 2007b:39: S3.
Prommer N, Heinicke K, Viola T, CajigalJ, Behn C, Schmidt WFJ. Long-termintermittent hypoxia increasesO2-transport capacity but notVO2 max. High Alt Med Biol 2007c:8: 225–235.
Prommer N, Schmidt W. Loss of COfrom the intravascular bed and itsimpact on the optimised CO-rebreathing method. Eur J ApplPhysiol 2007: 100: 383–391.
Prommer N, Schoch C, Heinrich L,Schumacher O, Vogt S, Schmid A,Schmidt W. Regular measurements oftotal hemoglobin mass. A new tool to
Total hemoglobin mass and altitude training
67
detect blood manipulations in athlete.Med Sci Sports Exerc 2005: 37: S64.
Pugh LGCE. Blood volume andhaemoglobin concentration at altitudesabove 18,000 ft. (5500m). J Physiol1964: 170: 344–354.
Ray CA, Cureton KJ, Ouzts HG.Postural specificity of cardiovascularadaptions to exercise training. J ApplPhysiol 1990: 69: 2202–2208.
Remes K. Effect of long-term physicaltraining on total red cell volume. ScandJ Clin Lab Invest 1979: 39: 311–319.
Reynafarje C, Lozano R, Valdiuieso J.The polycythemia of high altitudes:iron metabolism and related aspects.Blood 1959: 14: 433–455.
Rice L, Alfrey CP. The negativeregulation of red cell mass byneocytolysis: physiologic andpathophysiologic manifestations. CellPhysiol Biochem 2005: 15: 245–250.
Rice L, Ruitz W, Driscoll T, Whitley CE,Tapia R, Hachey DL, Gonzales GF,Alfrey CP. Neocytolysis on descentfrom altitude: a newly recognizedmechanism from the control of red cellmass. Ann Intern Med 2001: 134: 652–656.
Risso A, Turello M, Biffoni F, AntonuttoG. Red blood cell senescence andneocytolysis in humans after highaltitude acclimatization. Blood CellsMol Dis 2007: 38: 83–92.
Robach P, Schmitt L, Brugniaux J,Nicolet G, Duvallet A, Fouillot J-P,Moutereau S, Lasne F, Pialoux V,Olsen NV, Richalet J-P. Living high-training low: effect on erythropoiesisand maximal aerobic performance inelite Nordic skiers. Eur J Appl Physiol2006: 97: 695–705.
Rodriguez FA, Truijens MJ, TownsendNE, Stray-Gundersen J, Gore CJ,Levine BD. Performance of runnersand swimmers after four weeks ofintermittent hypobaric hypoxicexposure plus sea level training. J ApplPhysiol 2007: 103: 1523–1535.
Rusko HK. New aspects of attitudetraining. Am J Sports Med 1996: 24:545–552.
Rusko HK, Tikkanen H, Paavolainen L,Hamolainen I, Kalliokoski K, PuranenA. Effect of living in hypoxia andtraining in normoxia on sea levelVO2max and red cell mass. Med SciSports Exerc 1999: 31: S86.
Rusko HK, Tikkanen HO, Peltonen JE.Altitude and endurance training. JSports Sci 2004: 22: 928–945.
Sanchez C, Merino C, Figallo M.Simultaneous measurement of plasmavolume and cell mass in polycythemiaof high altitude. J Appl Physiol 1970:28: 775–778.
Saunders PU, Telford RD, Pyne DB,Cunningham RB, Gore CJ, Hahn AG,
Hawley JA. Improved runningeconomy in elite runners after 20 daysof simulated moderate-altitudeexposure. J Appl Physiol 2004: 96: 931–937.
Sawka MN, Convertino VA, Eichner ER,Schnieder SM, Young AJ. Bloodvolume: importance and adaptions toexercise training, environmentalstresses, and trauma/sickness.Med Sci Sports Exerc 2000: 32:332–348.
Schmidt W. Comments on Point-Counterpoint. Positive effects ofintermittent hypoxia (live high-trainlow) or exercise performance are/arenot mediated primarily by augmentedred cell volume. J Appl Physiol 2006:100: 369.
Schmidt W. Die Bedeutung desBlutvolumens fur denAusdauersportler. Dtsch ZtschrSportmed 1999: 50: 341–349.
Schmidt W. Effects of intermittentexposure to high altitude on bloodvolume and erythropoietic activity.High Alt Med Biol 2002: 3:167–176.
Schmidt W, Eckardt KU, Hilgendorf A,Strauch S, Bauer C. Effects of maximaland submaximal exercise undernormoxic and hypoxic conditions onserum erythropoietin level. Int J SportsMed 1991: 12: 457–461.
Schmidt W, Heinicke K, Rojas J, GomezJM, Serrato M, Mora M, Wolfarth B,Schmid A, Keul J. Blood volume andhemoglobin mass in endurance athletesfrom moderate altitude. Med SciSports Exerc 2002: 34: 1934–1940.
Schmidt W, Maassen N, Boning D.Training induced effects on bloodvolume, erythrocyte turnover andhaemoglobin oxygen bindingproperties. Eur J Appl Physiol 1988:57: 490–498.
Schmidt W, Prommer N. The optimisedCO-rebreathing method: a new tool todetermine total haemoglobin massroutinely. Eur J Appl Physiol 2005: 95:486–495.
Schmidt W, Spielvogel H, Eckardt KU,Quintela A, Penaloza R. Effects ofchronic hypoxia and exercise onplasma erythropoietin in high-altituderesidents. J Appl Physiol 1993: 74:1874–1878.
Schmidt W, Winchenbach P, Biermann B,Heinicke K, Zapf J, Friedmann B,Wolfahrt B. Blood volume, nothemoglobin concentration is related toVO2 max in endurance athletes. Med SciSports Exerc 1999: 31: S50.
Schwandt HL, Heyduk B, Gunga HC,Rocker L. Influence of prolongedphysical exercise on the erythropoietinconcentration in blood. Eur J ApplPhysiol 1991: 63: 463–466.
Shoemaker JK, Green HJ, Coates J, AliM, Grant S. Failure of prolongedexercise training to increase red cellmass in humans. Am J Physiol 1996:270: H121–H126.
Stiehl DP, Wirthner R, Koditz J,Spielmann P, Camenisch G, WengerRH. Increased prolyl 4-hydroxylasedomain proteins compensate fordecreased oxygen levels. Evidence foran autoregulatory oxygen-sensingsystem. J Biol Chem 2006: 181:23482–23491.
Svedenhag J, Piehl-Aulin K, Skog C,Saltin B. Increased left ventricularmuscle mass after long term altitudetraining in athletes. Acta Physiol Scand1997: 161: 63–70.
Telford RD, Graham KS, Sutton JR,Hahn AG, Campell DA, CreightonSW, Cunningham RB, Davis PG, GoreCJ, Smith JA, Tumilty DM. Mediumaltitude training and sea-levelperformance. Med Sci Sports Exerc1996: 28: S124.
Thomsen JK, Fogh-Andersen N, BulowK, Devantier A. Blood and plasmavolumes determined by carbonmonoxide gas, 99mTc-labellederythrocytes, 125 I-albumin andthe T 1824 technique. ScandJ Clin Lab Invest 1991: 51:185–190.
Trial J, Rice L, Alfrey CP. Erythropoietinwithdrawal alters interactions betweenyoung red blood cells, splenicendothelial cells, and macrophages: anin vitro model of neocytolysis. J InvestMed 2001: 49: 335–345.
Wagner PD. New ideas on limitations toVO2max. Exerc Sport Sci Rev 2000: 28:10–14.
Warburton DE, Haykowski MJ, QuinneyHA, Blackmore D, Teo KK,Mcgavock J, Humen D. Blood volumeexpansion and cardiorespiratoryfunction: effects of training modality.Med Sci Sports Exerc 2004: 36:991–1000.
Wehrlin JP, Marti B. Live high-train lowassociated with increased haemoglobinmass as preparation for the 2003 worldchampionships into native Europeanworld class runners. Br J Sports Med2006: 40: e3; discussion e3.
Wehrlin JP, Zuest P, Hallen J, Marti B.Live high-train low for 24 daysincreases hemoglobin mass andred cell volume in elite enduranceathletes. J Appl Physiol 2006: 100:1938–1945.
Weil JV, Jamieson G, Brown DW,Grover RF, Balchum OJ, Murray JF.The red cell mass – arterial oxygenrelationship in normal man. J ClinInvest 1968: 47: 1627–1639.
Wilber RL, Stray-Gundersen J, LevineBD. Effect of hypoxic ‘‘Dose’’ on
Schmidt and Prommer
68
physiological responses and sea-levelperformance. Med Sci Sports Exerc2007: 39: 1590–1599.
Witkowski S, Chen H, Stray-GundersenJ, Ge RL, Alfrey C, Prchal JT, LevineBD. Genetic marker for the
erythropoietic response to altitude.Med Sci Sports Exerc 2002: 34:S246.
Young AJ, Sawka MN, Muza SR,Boushel R, Lyons T, Rock PB,Freund BJ, Waters R, Cymerman A,
Pandolf KB, Valeri CR. Effects oferythrocyte infusion on VO2 max athigh altitude. J Appl Physiol 1996: 81:252–259.
Total hemoglobin mass and altitude training
69