Embed Size (px)
Citation preview
Effects of Water Injection and Increased Compression Ratio in a Gasoline Spark
Ignition Engine
A Thesis
Presented in Partial Fulfillment of the Requirements for the
Degree of Master of Science
with a
Major in Mechanical Engineering
in the
College of Graduate Studies
University of Idaho
by
J. Parley Wilson
February 2011
Major Professor: Karen Den Braven, Ph.D.
ii
AUTHORIZATION TO SUBMIT THESIS
This thesis of J. Parley Wilson, submitted for the degree of Master of Science with a major in
Mechanical Engineering and titled ―Effects of Water Injection and Increased Compression
Ratio in a Gasoline Spark Ignition Engine,‖ has been reviewed in final form. Permission, as
indicated by the signatures and dates given below, is now granted to submit final copies to
the College of Graduate Studies for approval.
Major Professor _________________________________ Date ________
Karen Den Braven, Ph.D.
Committee
Member _________________________________ Date ________
Steven Beyerlein, Ph.D.
Committee
Member _________________________________ Date ________
Judith Steciak, Ph.D.
Committee
Member _________________________________ Date ________
Richard Nielsen, Ph.D.
Department
Administrator _________________________________ Date ________
John Crepeau, Ph.D.
Discipline’s
College Dean _________________________________ Date ________
Donald Blackketter, Ph.D.
Final Approval and Acceptance by the College of Graduate Studies
_________________________________ Date _______
Nilsa A. Bosque-Pérez, Ph.D.
iii
Abstract
A single cylinder, four stroke, gasoline, spark ignition engine was modified to test the effects
of water injection in combination with an increased compression ratio in a engine. Three
air/fuel ratios (13.7, 14.7 and 15.7), six water/fuel mass ratios (from 0 to .75) and two
different compression ratios (6:1 and 7:1) were tested. It was found that water injection in
combination with an increased compression ratio can increase torque output (up to 65%),
reduce brake specific fuel consumption (up to 39%), lower exhaust temperature (up to 10%),
lower BSNO emissions (by up to 78%) and lower BSCO emissions (by up to78%) but may
increase BSHC emissions (up to 45%).
iv
Acknowledgments
This work was made possible through the funding and support of the National Institute for
Advanced Transportation Technology (NIATT). I am very grateful to my major professor
Dr. Karen Den Braven for her coaching, advice and guidance in helping me to achieve my
master’s degree. Thank you to my committee members, Judi Steciak, Steve Beyerlein and
Richard Nielsen for their valuable feedback and advice as I decided on my research,
experimented and reported my results. Special thanks to Dan Cordon for his wonderful
advice and insight as I planned and carried out my research. Many thanks to Russ Porter for
his help in machining parts for my engine modification. Thank you to the many members of
the CSC team at the University of Idaho for their invaluable help in preparing, tuning and
testing my engine. Many thanks to my mother and father for their love and support during
this time and all throughout my life. And humbly, thanks be to God, for blessing me to be
able to gain knowledge and understanding.
v
Table of Contents
AUTHORIZATION TO SUBMIT THESIS ......................................................................................................... II
ABSTRACT ..........................................................................................................................................................III
ACKNOWLEDGMENTS .................................................................................................................................... IV
TABLE OF CONTENTS ...................................................................................................................................... V
LIST OF FIGURES ............................................................................................................................................ VII
LIST OF EQUATIONS ......................................................................................................................................... X
LIST OF TABLES ................................................................................................................................................ XI
NOMENCLATURE ........................................................................................................................................... XII
1.0 INTRODUCTION AND BACKGROUND ...................................................................................................... 1
1.1 WATER ADDITION LOWERS NOX EMISSIONS ............................................................................................. 1
1.2 WATER ADDITION TENDS TO LOWER CO EMISSIONS ................................................................................ 3
1.3 WATER ADDITION MAY INCREASE HC EMISSIONS .................................................................................... 4
1.4 WATER ADDITION CAN INCREASE POWER AND EFFICIENCY ...................................................................... 5
1.5 POSSIBLE ADVANTAGES OF DIRECT WATER INJECTION ............................................................................. 8
1.6 WATER ADDITION FOR COOLING .............................................................................................................. 8
1.7 WATER ADDITION ALLOWS FOR HIGHER COMPRESSION RATIOS ............................................................... 9
1.8 SUMMARY OF BACKGROUND RESEARCH ................................................................................................. 12
1.9 PURPOSE OF THE PRESENT STUDY ........................................................................................................... 12
2.0 EXPERIMENTAL SETUP ............................................................................................................................ 14
2.1 ENGINE MODIFICATIONS ........................................................................................................................ 14
2.2 TESTING EQUIPMENT .............................................................................................................................. 23
3.0 EXPERIMENT, RESULTS AND DISCUSSION .......................................................................................... 25
3.1 TORQUE ................................................................................................................................................. 27
3.2 BRAKE SPECIFIC FUEL CONSUMPTION .................................................................................................... 31
3.3 EXHAUST TEMPERATURE ........................................................................................................................ 35
3.4 BSNO EMISSIONS .................................................................................................................................. 37
3.5 BSCO EMISSIONS ................................................................................................................................... 41
3.6 BSHC EMISSIONS ................................................................................................................................... 45
4.0 CONCLUSIONS ............................................................................................................................................. 48
5.0 FUTURE WORK ............................................................................................................................................ 50
vi
REFERENCES ..................................................................................................................................................... 52
APPENDIX A – DATA......................................................................................................................................... 54
APPENDIX B – EMISSIONS CHART ON A PERCENT OR PPMVOL BASIS ............................................. 58
APPENDIX C – CODE OF FEDERAL REGULATIONS (21) .......................................................................... 64
APPENDIX D – METHOD OF CALCULATING BRAKE SPECIFIC EMISSIONS ...................................... 67
APPENDIX E –METHOD OF ERROR ANALYSIS OF BRAKE SPECIFIC FUEL CONSUMPTION ........ 71
APPENDIX F – DRAWING PACKAGE OF MODIFICATIONS ..................................................................... 72
vii
List of Figures
Figure 1 Effect of water on nitric oxide emissions (3) ............................................................ 2
Figure 2 Effect of water on carbon monoxide emissions (3) ................................................... 3
Figure 3 Hydrocarbon emissions with emulsified fuels (3) ..................................................... 4
Figure 4 Normalized engine output and specific gasoline consumption (4) ........................... 7
Figure 5 Influence of water on theoretical equilibrium flame temps for isooctane (5) ........... 8
Figure 6 Effect of water content on the octane quality of water-gasoline emulsions (3) ........ 9
Figure 7 Effect of operating at the knock limited CR w/ and w/o 40 wt. % water (3) .......... 10
Figure 8 Effect of CR on engine performance of water gasoline fuels. (4) ........................... 11
Figure 9 Influence of CR on theoretical effectiveness of water injection (5) ........................ 12
Figure 10 EFI Conversion Products ....................................................................................... 15
Figure 11 Engine Setup Schematic ........................................................................................ 16
Figure 12 Engine, Intake Manifold Removed........................................................................ 17
Figure 13 Gasket and Adapter (rear) ..................................................................................... 17
Figure 14 CAD Image of Adapter (front) .............................................................................. 17
Figure 15 Engine with Adapter Attached .............................................................................. 18
Figure 16 First Intake Manifold Part Attached ...................................................................... 18
Figure 17 EFI Intake Manifold Assembly ............................................................................. 18
Figure 18 Engine to Dynamometer Coupler .......................................................................... 19
Figure 19 VR Sensor .............................................................................................................. 20
Figure 20 VR Sensor Mounted and Coupler with Trigger .................................................... 20
Figure 21 CAD Model of Engine Head ................................................................................. 21
Figure 22 Thermocouple and O2 Sensor on Exhaust Pipe ..................................................... 21
Figure 23 Engine on Test Stand ............................................................................................. 22
Figure 24 Engine and Dynamometer ..................................................................................... 22
Figure 25 Torque at Lean Conditions .................................................................................... 27
Figure 26 Torque at Stoichiometric Conditions..................................................................... 28
Figure 27 Torque at Rich Conditions..................................................................................... 28
Figure 28 Torque at All Conditions ....................................................................................... 29
Figure 29 P-V Diagram at Two Compression Ratios ............................................................ 31
viii
Figure 30 BSFC at Lean Conditions ...................................................................................... 33
Figure 31 BSFC at Stoichiometric Conditions ...................................................................... 33
Figure 32 BSFC at Rich Conditions ...................................................................................... 34
Figure 33 BSFC at All Conditions ......................................................................................... 34
Figure 34 Exhaust Temperature at Lean Conditions ............................................................. 35
Figure 35 Exhaust Temperature at Stoichiometric Conditions .............................................. 36
Figure 36 Exhaust Temperature at Rich Conditions .............................................................. 36
Figure 37 Exhaust Temperature All Conditions .................................................................... 37
Figure 38 BSNO Emission at Lean Conditions ..................................................................... 38
Figure 39 BSNO Emission at Stoichiometric Conditions...................................................... 39
Figure 40 BSNO Emission at Rich Conditions...................................................................... 39
Figure 41 BSNO Emissions All Conditions .......................................................................... 40
Figure 42 BSCO Emissions at Lean Conditions .................................................................... 42
Figure 43 BSCO Emissions at Stoichiometric Conditions .................................................... 43
Figure 44 BSCO Emissions at Rich Conditions .................................................................... 43
Figure 45 BSCO Emissions All Conditions........................................................................... 44
Figure 46 BSHC Emissions at Lean Conditions .................................................................... 45
Figure 47 BSHC Emissions at Stoichiometric Conditions .................................................... 46
Figure 48 BSHC Emissions at Rich Conditions .................................................................... 46
Figure 49 BSHC Emssions All Conditions ............................................................................ 47
Figure 50 ppmvol NO Emissions at Lean Conditions ........................................................... 58
Figure 51 ppmvol NO Emissions at Stoichiometric Conditions ............................................ 58
Figure 52 ppmvol NO Emissions at Rich Conditions ............................................................ 59
Figure 53 ppmvol NO Emissions All Conditions ................................................................. 59
Figure 54 %CO Emissions at Lean Conditions ..................................................................... 60
Figure 55 %CO Emissions at Stoichiometric Conditions ...................................................... 60
Figure 56 %CO Emissions at Rich Conditions ...................................................................... 61
Figure 57 %CO Emissions All Conditions ............................................................................ 61
Figure 58 ppmvol HC Emissions at Lean Conditions ........................................................... 62
Figure 59 ppmvol HC Emissions at Stoichiometric Conditions ............................................ 62
Figure 60 ppmvol HC Emissions at Rich Conditions ............................................................ 63
ix
Figure 61 ppmvol HC Emissions All Conditions .................................................................. 63
x
List of Equations
Equation 1 Mean Effective Pressure ........................................................................................ 5
Equation 2 Specific Fuel Consumption ................................................................................... 5
Equation 3 Brake Work Produced Per Cycle ........................................................................... 5
Equation 4 Engine Efficiency .................................................................................................. 6
Equation 5 Equivalence Ratio ................................................................................................ 26
xi
List of Tables
Table 1 Nomenclature ............................................................................................................. xii
Table 2 Briggs and Stratton 222416 Baseline Specifications, (17, 18) .................................. 14
Table 3 Uncertainties of Data ................................................................................................ 24
Table 4 Basic Properies of Water and Gasoline .................................................................... 24
xii
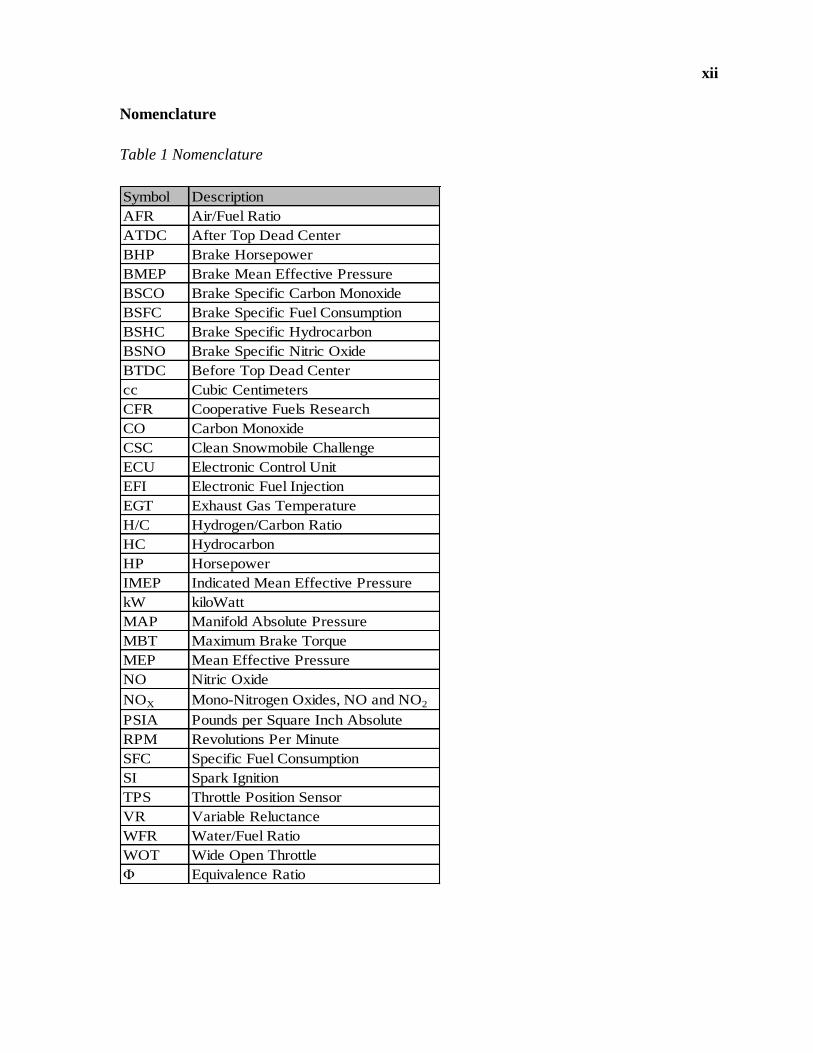
Nomenclature
Table 1 Nomenclature
Symbol Description
AFR Air/Fuel Ratio
ATDC After Top Dead Center
BHP Brake Horsepower
BMEP Brake Mean Effective Pressure
BSCO Brake Specific Carbon Monoxide
BSFC Brake Specific Fuel Consumption
BSHC Brake Specific Hydrocarbon
BSNO Brake Specific Nitric Oxide
BTDC Before Top Dead Center
cc Cubic Centimeters
CFR Cooperative Fuels Research
CO Carbon Monoxide
CSC Clean Snowmobile Challenge
ECU Electronic Control Unit
EFI Electronic Fuel Injection
EGT Exhaust Gas Temperature
H/C Hydrogen/Carbon Ratio
HC Hydrocarbon
HP Horsepower
IMEP Indicated Mean Effective Pressure
kW kiloWatt
MAP Manifold Absolute Pressure
MBT Maximum Brake Torque
MEP Mean Effective Pressure
NO Nitric Oxide
NOX Mono-Nitrogen Oxides, NO and NO2
PSIA Pounds per Square Inch Absolute
RPM Revolutions Per Minute
SFC Specific Fuel Consumption
SI Spark Ignition
TPS Throttle Position Sensor
VR Variable Reluctance
WFR Water/Fuel Ratio
WOT Wide Open Throttle
Φ Equivalence Ratio
1
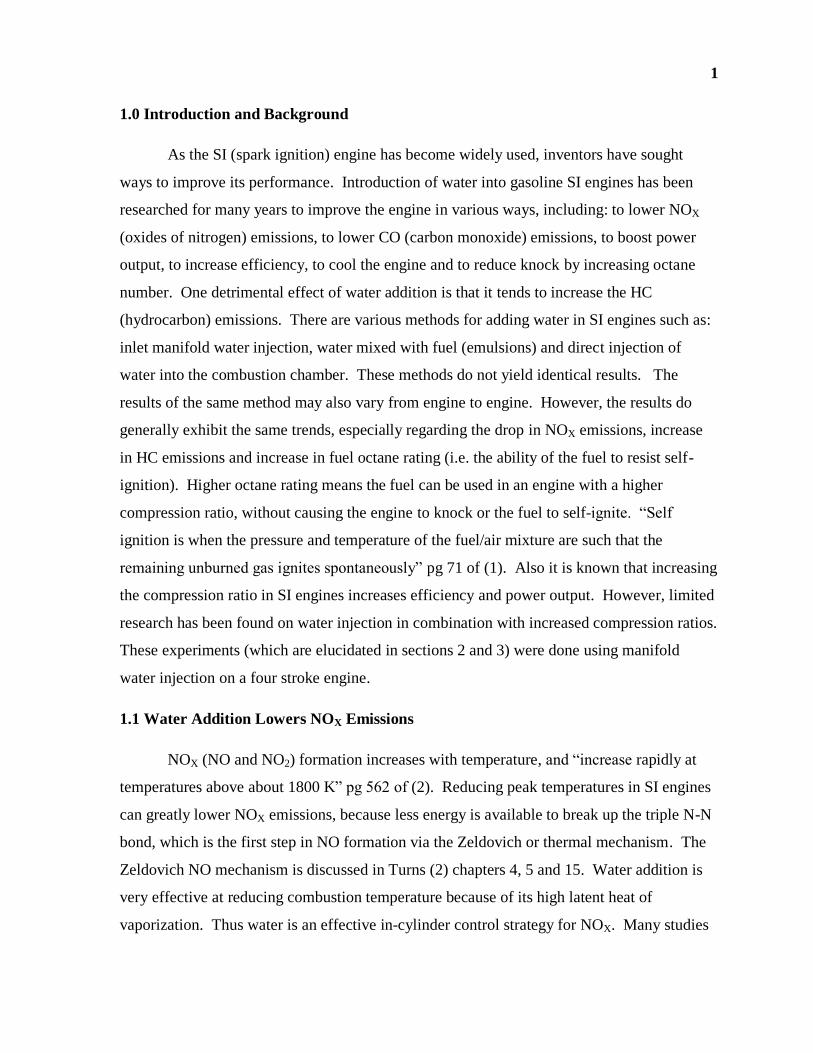
1.0 Introduction and Background
As the SI (spark ignition) engine has become widely used, inventors have sought
ways to improve its performance. Introduction of water into gasoline SI engines has been
researched for many years to improve the engine in various ways, including: to lower NOX
(oxides of nitrogen) emissions, to lower CO (carbon monoxide) emissions, to boost power
output, to increase efficiency, to cool the engine and to reduce knock by increasing octane
number. One detrimental effect of water addition is that it tends to increase the HC
(hydrocarbon) emissions. There are various methods for adding water in SI engines such as:
inlet manifold water injection, water mixed with fuel (emulsions) and direct injection of
water into the combustion chamber. These methods do not yield identical results. The
results of the same method may also vary from engine to engine. However, the results do
generally exhibit the same trends, especially regarding the drop in NOX emissions, increase
in HC emissions and increase in fuel octane rating (i.e. the ability of the fuel to resist self-
ignition). Higher octane rating means the fuel can be used in an engine with a higher
compression ratio, without causing the engine to knock or the fuel to self-ignite. ―Self
ignition is when the pressure and temperature of the fuel/air mixture are such that the
remaining unburned gas ignites spontaneously‖ pg 71 of (1). Also it is known that increasing
the compression ratio in SI engines increases efficiency and power output. However, limited
research has been found on water injection in combination with increased compression ratios.
These experiments (which are elucidated in sections 2 and 3) were done using manifold
water injection on a four stroke engine.
1.1 Water Addition Lowers NOX Emissions
NOX (NO and NO2) formation increases with temperature, and ―increase rapidly at
temperatures above about 1800 K‖ pg 562 of (2). Reducing peak temperatures in SI engines
can greatly lower NOX emissions, because less energy is available to break up the triple N-N
bond, which is the first step in NO formation via the Zeldovich or thermal mechanism. The
Zeldovich NO mechanism is discussed in Turns (2) chapters 4, 5 and 15. Water addition is
very effective at reducing combustion temperature because of its high latent heat of
vaporization. Thus water is an effective in-cylinder control strategy for NOX. Many studies
2
confirm the effectiveness of water addition at lowering NOX emissions. Different studies
may report decreases in oxides of nitrogen in terms of NO, NO2 or NOX but the trends are
similar.
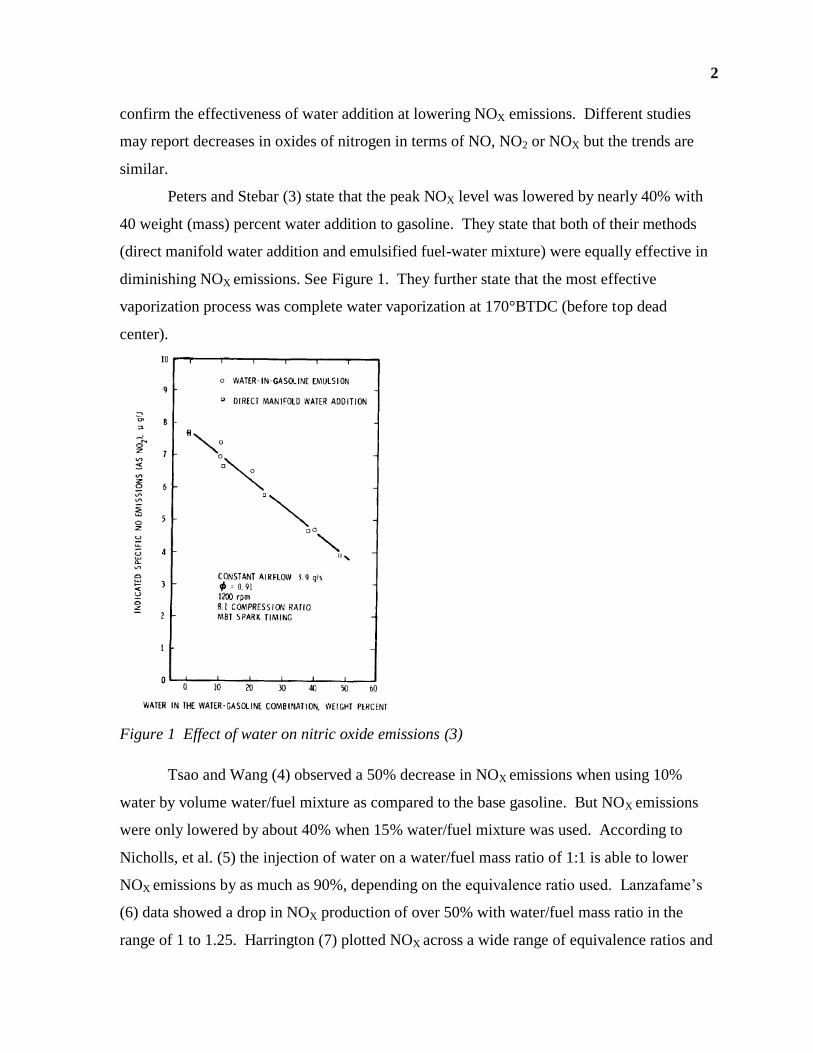
Peters and Stebar (3) state that the peak NOX level was lowered by nearly 40% with
40 weight (mass) percent water addition to gasoline. They state that both of their methods
(direct manifold water addition and emulsified fuel-water mixture) were equally effective in
diminishing NOX emissions. See Figure 1. They further state that the most effective
vaporization process was complete water vaporization at 170°BTDC (before top dead
center).
Figure 1 Effect of water on nitric oxide emissions (3)
Tsao and Wang (4) observed a 50% decrease in NOX emissions when using 10%
water by volume water/fuel mixture as compared to the base gasoline. But NOX emissions
were only lowered by about 40% when 15% water/fuel mixture was used. According to
Nicholls, et al. (5) the injection of water on a water/fuel mass ratio of 1:1 is able to lower
NOX emissions by as much as 90%, depending on the equivalence ratio used. Lanzafame’s
(6) data showed a drop in NOX production of over 50% with water/fuel mass ratio in the
range of 1 to 1.25. Harrington (7) plotted NOX across a wide range of equivalence ratios and
3
showed that NOX emissions can be lowered by up to 95%, depending on the amount of water
added and equivalence ratio. Brusca and Lanzafame (8) showed a 50% drop in NOX at a
water/fuel mass ratio of 1. Wu, et al. (9) show a drop of about 50% in NOX emissions with
15% water in the fuel by volume. Lestz, et al. (10) state that a 90% drop in NOX is possible
with a sacrifice in power, but 50% is possible without sacrificing power using maximum
brake torque (MBT) spark timing. These studies all agree that water addition tends to lower
NOX emissions.
1.2 Water Addition Tends to Lower CO Emissions
Studies show water addition can also lower CO emissions. Tsao and Wang (4)
concluded that CO emissions can be decreased by 40% with 10% water by volume. Wu, et
al. (9) also found that water addition to fuel lowers CO emissions by approximately 50% for
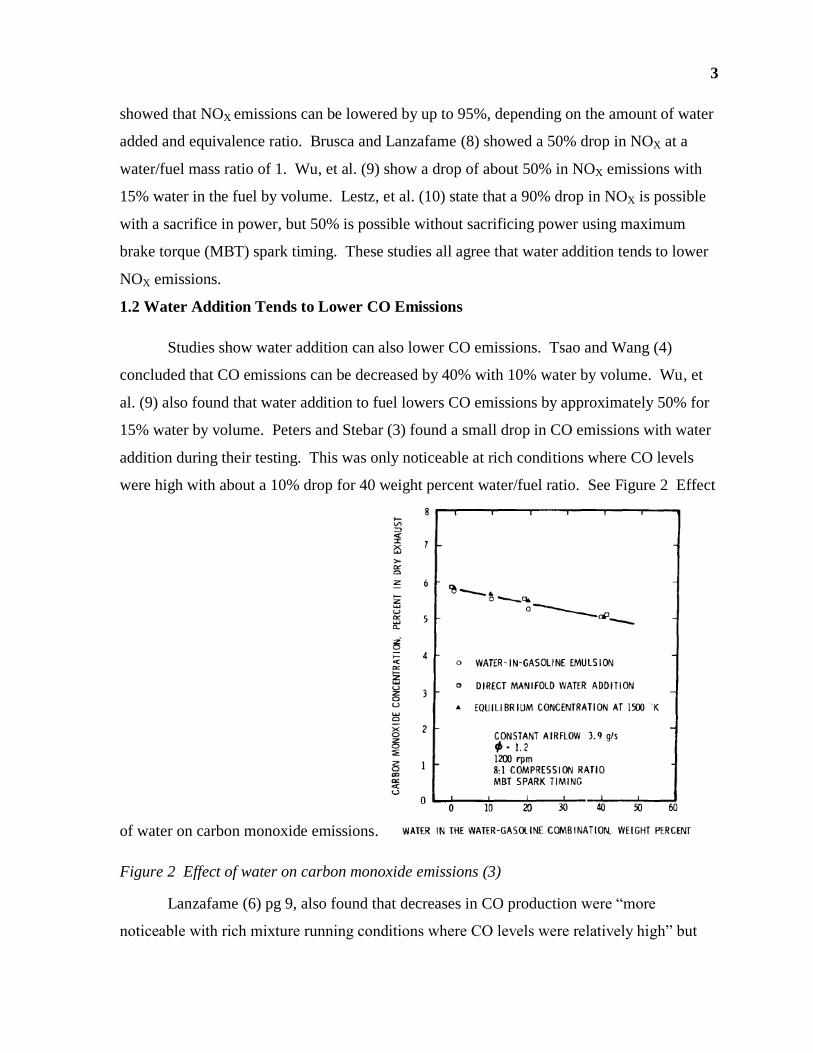
15% water by volume. Peters and Stebar (3) found a small drop in CO emissions with water
addition during their testing. This was only noticeable at rich conditions where CO levels
were high with about a 10% drop for 40 weight percent water/fuel ratio. See Figure 2 Effect
of water on carbon monoxide emissions.
Figure 2 Effect of water on carbon monoxide emissions (3)
Lanzafame (6) pg 9, also found that decreases in CO production were ―more
noticeable with rich mixture running conditions where CO levels were relatively high‖ but
4
did not state quantitatively how much. These studies indicate that water addition tends to
lower CO emissions.
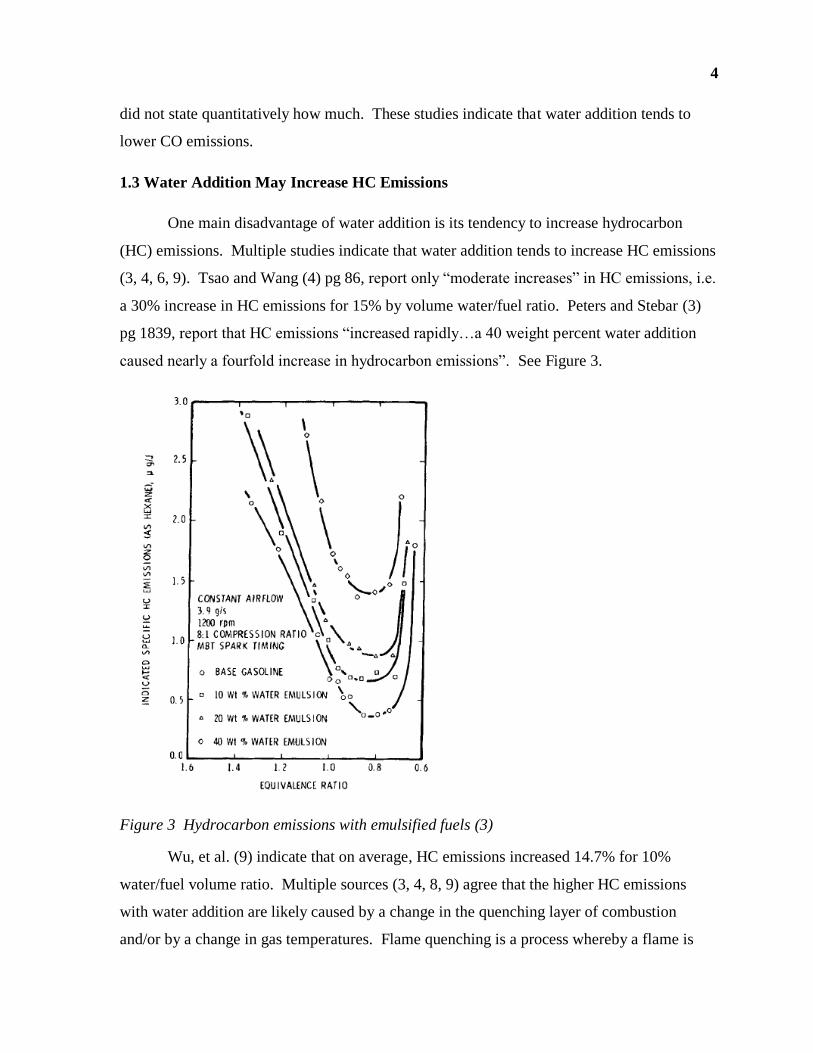
1.3 Water Addition May Increase HC Emissions
One main disadvantage of water addition is its tendency to increase hydrocarbon
(HC) emissions. Multiple studies indicate that water addition tends to increase HC emissions
(3, 4, 6, 9). Tsao and Wang (4) pg 86, report only ―moderate increases‖ in HC emissions, i.e.
a 30% increase in HC emissions for 15% by volume water/fuel ratio. Peters and Stebar (3)
pg 1839, report that HC emissions ―increased rapidly…a 40 weight percent water addition
caused nearly a fourfold increase in hydrocarbon emissions‖. See Figure 3.
Figure 3 Hydrocarbon emissions with emulsified fuels (3)
Wu, et al. (9) indicate that on average, HC emissions increased 14.7% for 10%
water/fuel volume ratio. Multiple sources (3, 4, 8, 9) agree that the higher HC emissions
with water addition are likely caused by a change in the quenching layer of combustion
and/or by a change in gas temperatures. Flame quenching is a process whereby a flame is
5
extinguished a short distance from a cool surface (2). As the flame approaches the cooler
combustion chamber walls it is extinguished, resulting in incomplete combustion. Because
water cools the combustion chamber, it may increase the thickness of the quenching layer
and thus also increase the amount of unburned hydrocarbons emitted during the exhaust
stroke.
1.4 Water Addition Can Increase Power and Efficiency
Water injection may also improve power output and efficiency. Power is torque
multiplied by RPM. A percent increase in torque results in the same percent increase in
power for a given RPM. Torque is sometimes measured using mean effective pressure
(MEP), with a higher MEP being more powerful. MEP is defined as:
Equation 1 Mean Effective Pressure
Improved efficiency is often reported as a reduction in specific fuel consumption
(SFC), with lower SFC being more efficient.
Equation 2 Specific Fuel Consumption
Similar terms, brake mean effective pressure (BMEP) and brake specific fuel consumption
(BSFC) are those calculated by using an engine dynamometer (brake) to measure work
output. A useful equation relating work and BMEP is the following.
Equation 3 Brake Work Produced Per Cycle (1)
Efficiency can also be reported as follows, where is the lower heating value of
the fuel.
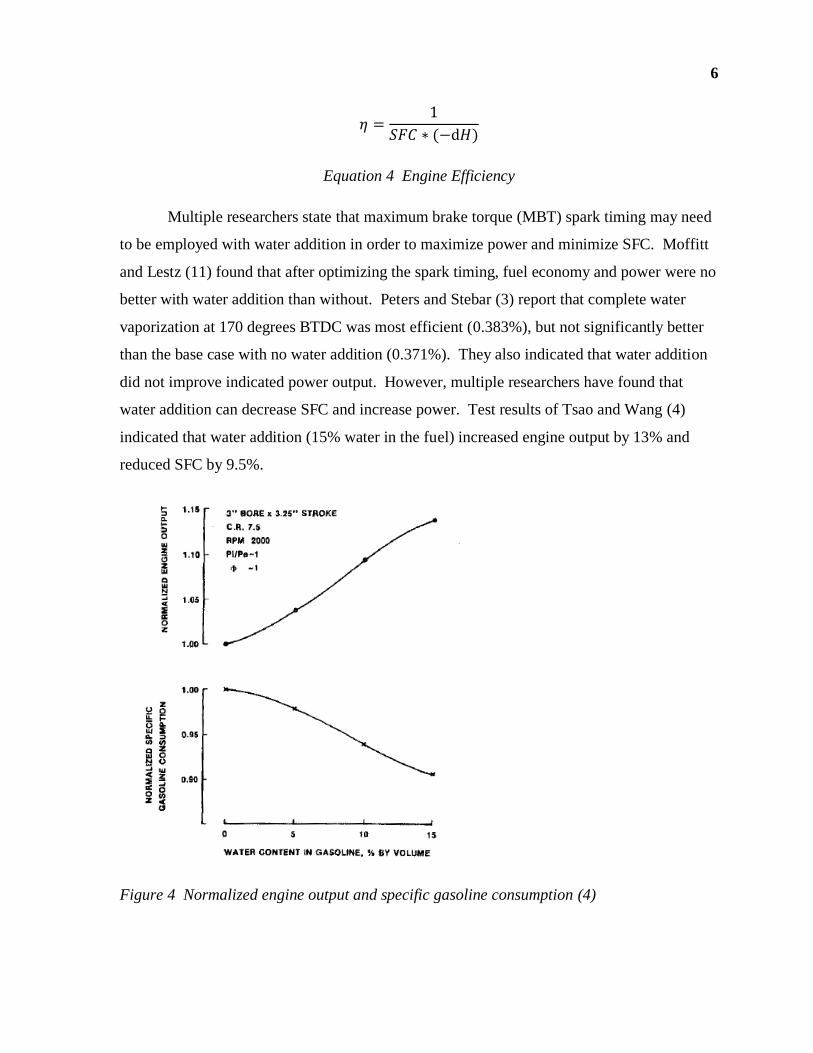
6
Equation 4 Engine Efficiency
Multiple researchers state that maximum brake torque (MBT) spark timing may need
to be employed with water addition in order to maximize power and minimize SFC. Moffitt
and Lestz (11) found that after optimizing the spark timing, fuel economy and power were no
better with water addition than without. Peters and Stebar (3) report that complete water
vaporization at 170 degrees BTDC was most efficient (0.383%), but not significantly better
than the base case with no water addition (0.371%). They also indicated that water addition
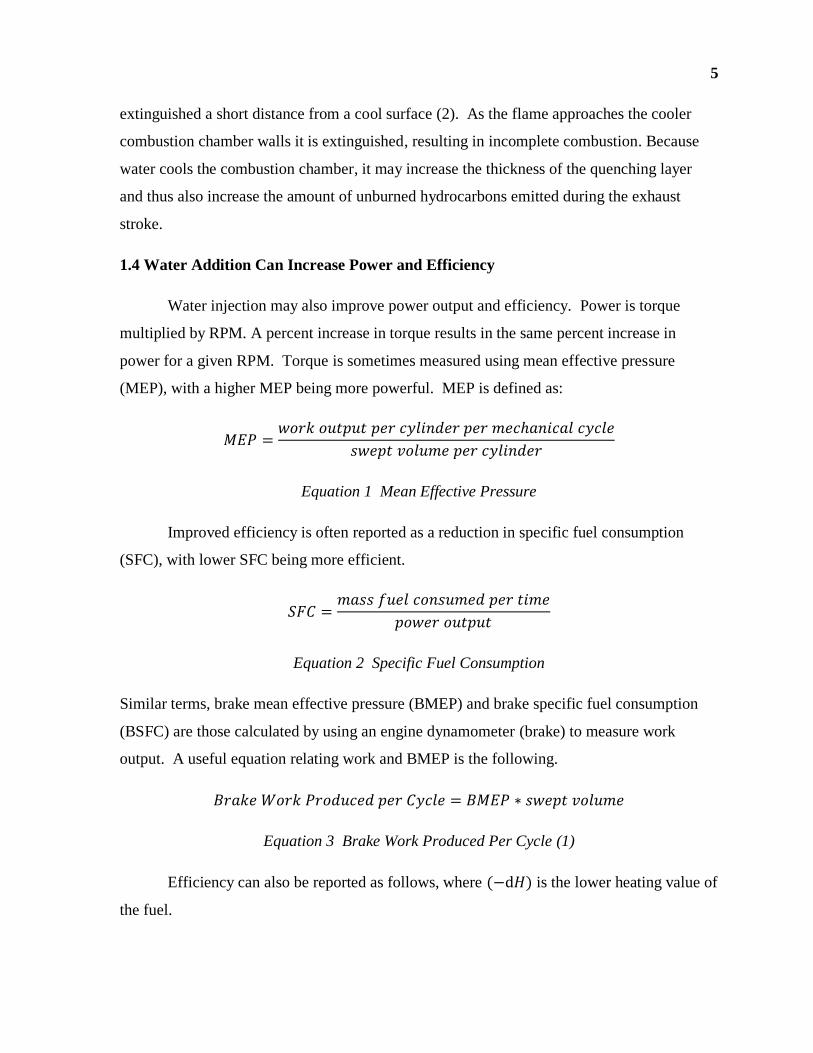
did not improve indicated power output. However, multiple researchers have found that
water addition can decrease SFC and increase power. Test results of Tsao and Wang (4)
indicated that water addition (15% water in the fuel) increased engine output by 13% and
reduced SFC by 9.5%.
Figure 4 Normalized engine output and specific gasoline consumption (4)
7
Wu, et al. (9) found that 10% water by volume in the fuel increased engine torque by
4.1% and decreased brake specific fuel consumption (BSFC) by 3.4%; however engine
performance deteriorated when water was increased to 15%. Nicholls, et al. (5)
experimenting with a Cooperative Fuels Research (CFR) engine found that water/fuel mass
ratios up to 0.75 yielded a slight increase (about 1-5%) in brake mean effective pressure
(BMEP), whereas water/fuel mass ratios above 0.75 began to decrease BMEP until by a
water/fuel ratio of about 1.25 BMEP diminished to the original value. Similarly, as
water/fuel ratio increased to 0.75 then BSFC decreased (about 2-4%), further increase in
water/fuel ratio increased BSFC.
Overall the research seems to indicate that adding water (up to a point) tends to
improve power and improve (decrease) SFC. MBT spark timing may need to be employed to
realize or maximize these benefits.
1.5 Possible Advantages of Direct Water Injection
Though the various methods of water addition yield generally similar results, direct
water injection may be advantageous in some respects. Lestz and Meyer (10) concluded that
direct cylinder injection results in a drop in NOX emissions greater than 85% using about
one-third the mass of water required by manifold injection for similar NOX decreases.
Juntarakod (12), in a theoretical study, concluded that direct cylinder water injection (up to
40% water/fuel molar ratio) after combustion could increase efficiency by 1-3% and increase
indicated mean effective pressure (IMEP) about 2-7%.
1.6 Water Addition for Cooling
Water may also be used to cool the engine. Weatherford and Quillan (13) concluded
that water addition by direct injection was adequate to cool the engine, i.e. water jackets and
air fins could be eliminated. Modak and Caretto (14) confirmed that water addition could be
used to cool internal combustion engines and used a computer program to conclude that the
optimal time for direct water injection was early in the compression stroke. Nicholls, et al.
(5) calculated theoretical flame temperatures across a span of water/fuel mass ratios, which
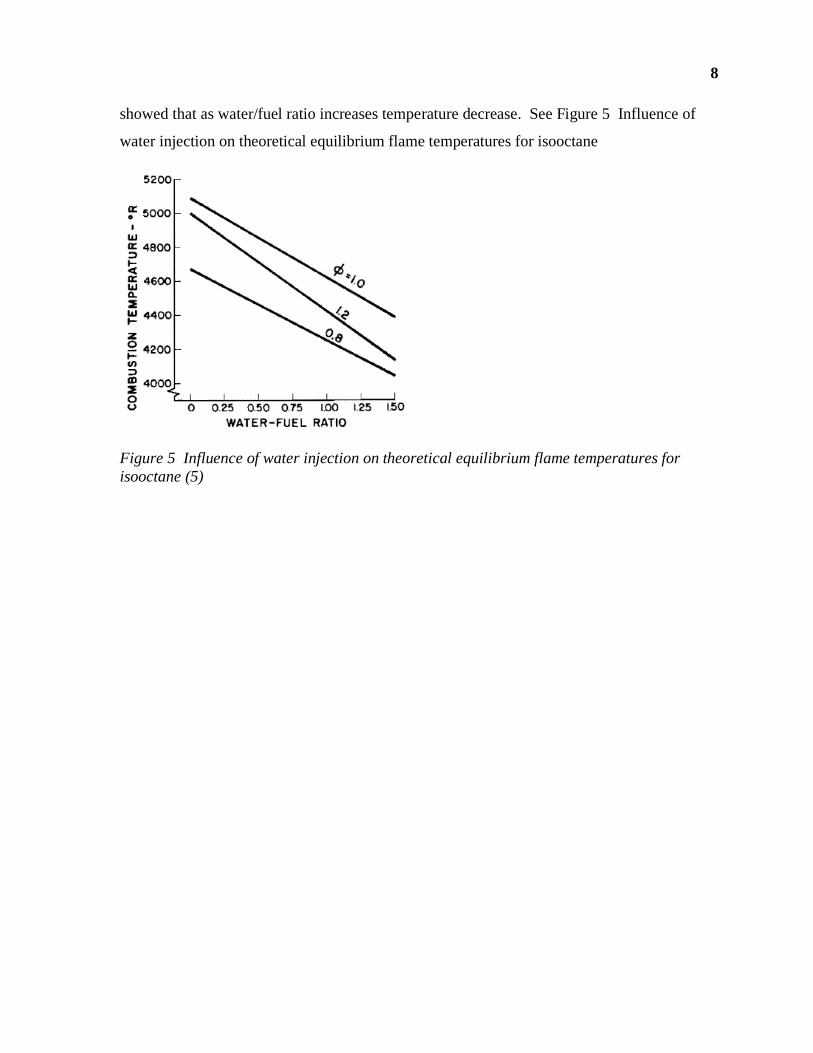
8
showed that as water/fuel ratio increases temperature decrease. See Figure 5 Influence of
water injection on theoretical equilibrium flame temperatures for isooctane
Figure 5 Influence of water injection on theoretical equilibrium flame temperatures for
isooctane (5)
9
1.7 Water Addition Allows for Higher Compression Ratios
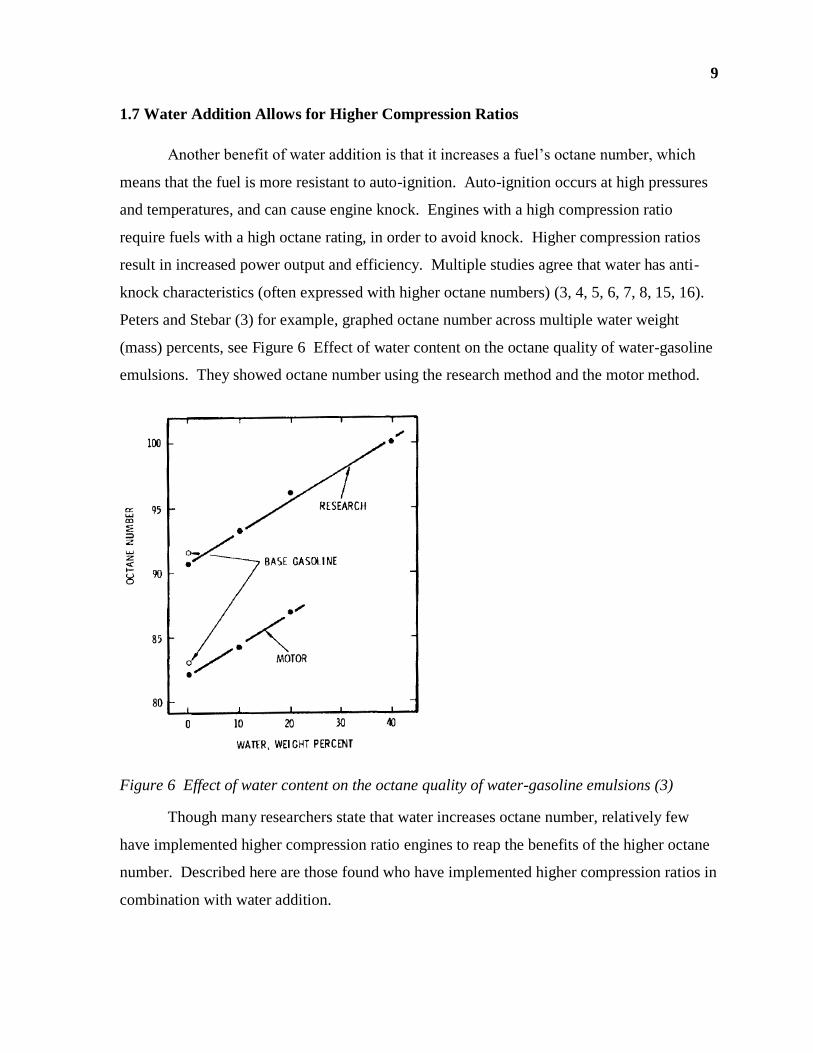
Another benefit of water addition is that it increases a fuel’s octane number, which
means that the fuel is more resistant to auto-ignition. Auto-ignition occurs at high pressures
and temperatures, and can cause engine knock. Engines with a high compression ratio
require fuels with a high octane rating, in order to avoid knock. Higher compression ratios
result in increased power output and efficiency. Multiple studies agree that water has anti-
knock characteristics (often expressed with higher octane numbers) (3, 4, 5, 6, 7, 8, 15, 16).
Peters and Stebar (3) for example, graphed octane number across multiple water weight
(mass) percents, see Figure 6 Effect of water content on the octane quality of water-gasoline
emulsions. They showed octane number using the research method and the motor method.
Figure 6 Effect of water content on the octane quality of water-gasoline emulsions (3)
Though many researchers state that water increases octane number, relatively few
have implemented higher compression ratio engines to reap the benefits of the higher octane
number. Described here are those found who have implemented higher compression ratios in
combination with water addition.
10
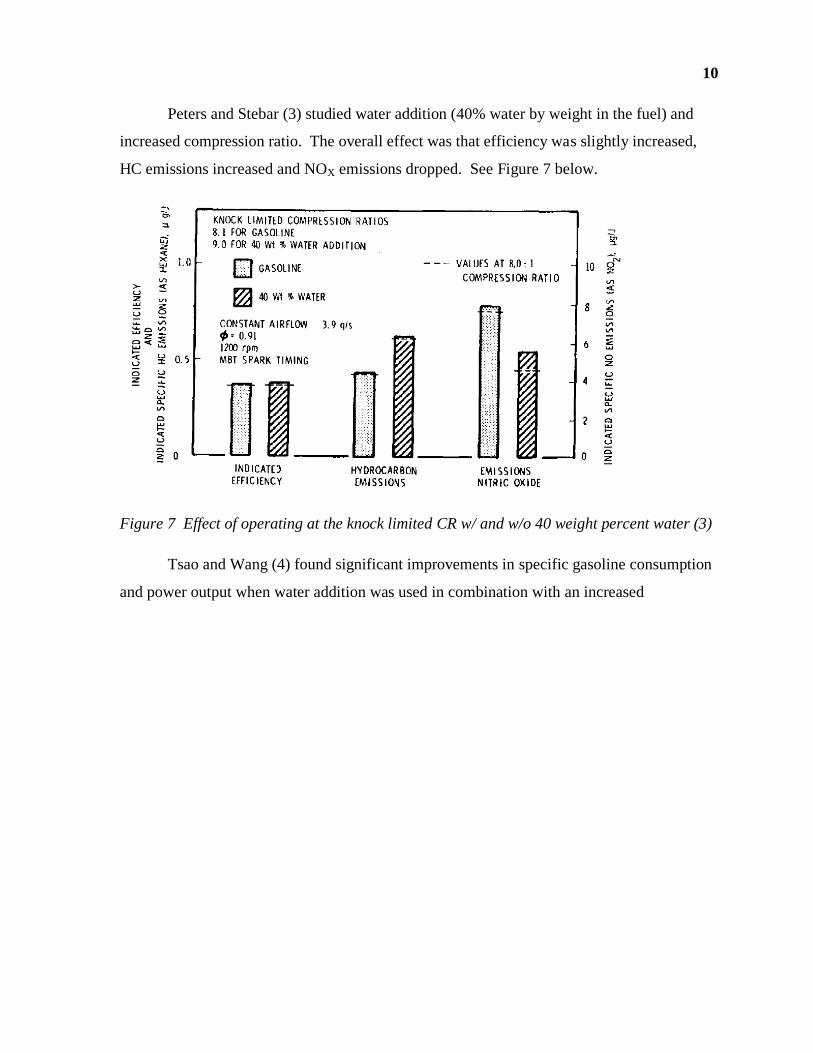
Peters and Stebar (3) studied water addition (40% water by weight in the fuel) and
increased compression ratio. The overall effect was that efficiency was slightly increased,
HC emissions increased and NOX emissions dropped. See Figure 7 below.
Figure 7 Effect of operating at the knock limited CR w/ and w/o 40 weight percent water (3)
Tsao and Wang (4) found significant improvements in specific gasoline consumption
and power output when water addition was used in combination with an increased
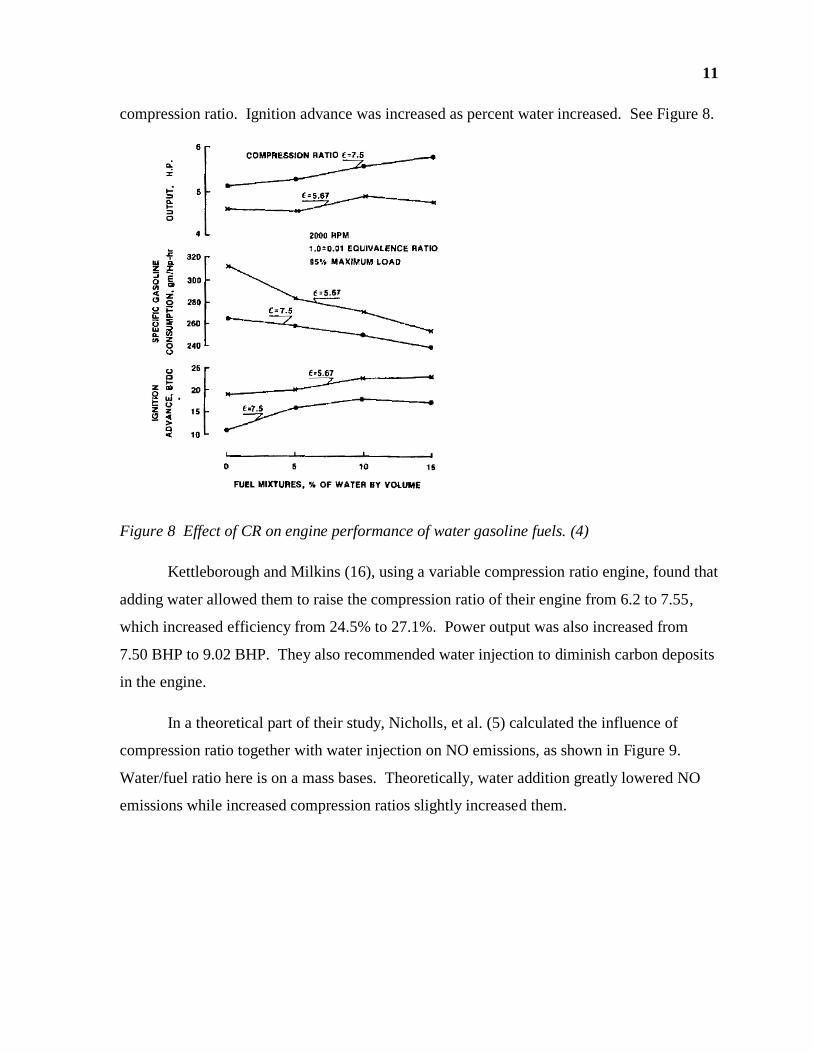
11
compression ratio. Ignition advance was increased as percent water increased. See Figure 8.
Figure 8 Effect of CR on engine performance of water gasoline fuels. (4)
Kettleborough and Milkins (16), using a variable compression ratio engine, found that
adding water allowed them to raise the compression ratio of their engine from 6.2 to 7.55,
which increased efficiency from 24.5% to 27.1%. Power output was also increased from
7.50 BHP to 9.02 BHP. They also recommended water injection to diminish carbon deposits
in the engine.
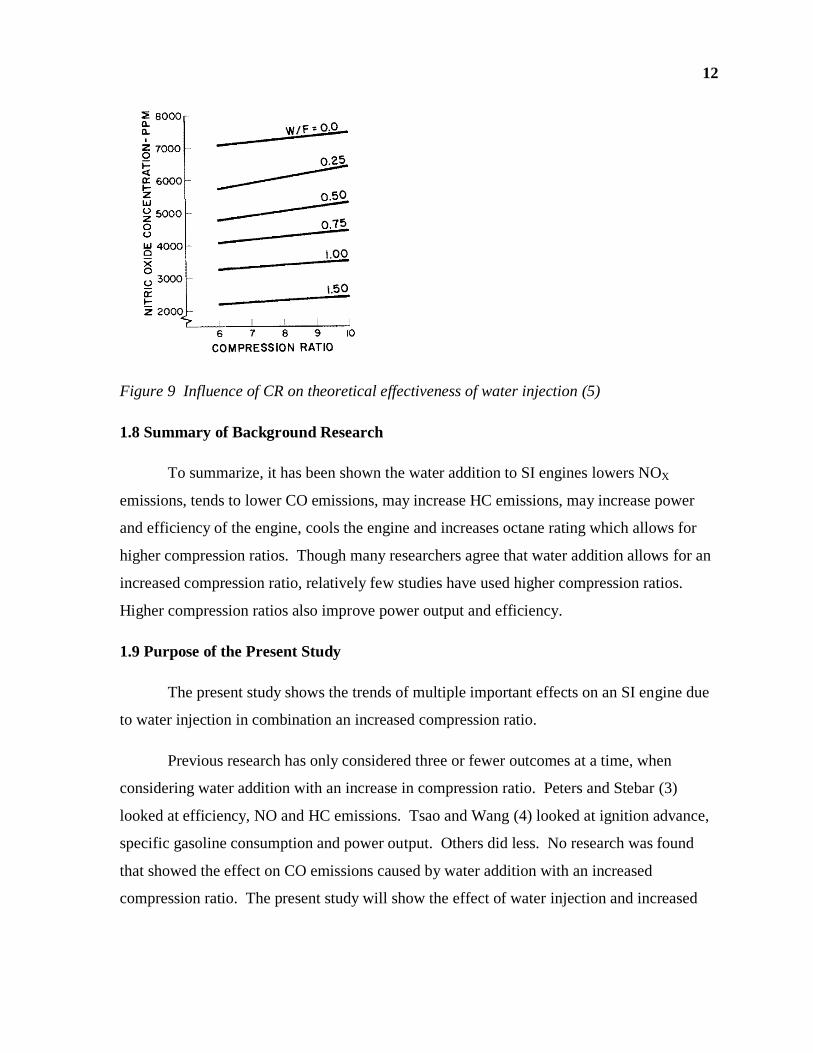
In a theoretical part of their study, Nicholls, et al. (5) calculated the influence of
compression ratio together with water injection on NO emissions, as shown in Figure 9.
Water/fuel ratio here is on a mass bases. Theoretically, water addition greatly lowered NO
emissions while increased compression ratios slightly increased them.
12
Figure 9 Influence of CR on theoretical effectiveness of water injection (5)
1.8 Summary of Background Research
To summarize, it has been shown the water addition to SI engines lowers NOX
emissions, tends to lower CO emissions, may increase HC emissions, may increase power
and efficiency of the engine, cools the engine and increases octane rating which allows for
higher compression ratios. Though many researchers agree that water addition allows for an
increased compression ratio, relatively few studies have used higher compression ratios.
Higher compression ratios also improve power output and efficiency.
1.9 Purpose of the Present Study
The present study shows the trends of multiple important effects on an SI engine due
to water injection in combination an increased compression ratio.
Previous research has only considered three or fewer outcomes at a time, when
considering water addition with an increase in compression ratio. Peters and Stebar (3)
looked at efficiency, NO and HC emissions. Tsao and Wang (4) looked at ignition advance,
specific gasoline consumption and power output. Others did less. No research was found
that showed the effect on CO emissions caused by water addition with an increased
compression ratio. The present study will show the effect of water injection and increased
13
compression ratio on: torque, brake specific fuel consumption, temperature, NO emissions,
CO emissions and HC emissions. Predictions were as follows:
Torque output and efficiency were expected to be minimally affected by water
added but increase with compression ratio.
The engine exhaust temperatures were expected to be greatly cooled by water
added but increase somewhat with compression ratio.
NOX levels were expected to diminish greatly with water added but increase
slightly with increased compression ratio.
CO emissions were expected to decrease with water added and be minimally
affected by compression ratio.
HC emissions were expected to increase with water added and with compression
ratio.
It was desired to better understand and give greater insight on the effects of water
injection with increased compression ratio.
To outline the remainder of this thesis, Section 2 describes experimental set up. This
includes the engine used and modifications made to the engine, as well as equipment used to
test the performance and emissions of the engine. Section 3 describes the experiment, the
results and a discussion of possible reasons that water injection and increased compression
ratio affect the engine in the way that they do. Section 4 summarizes the results of the
experiment. Section 5 describes future work that would further expand what is known of the
effects of water addition with increased compression ratios.
14
2.0 Experimental Setup
This section includes details of the engine used, modifications made to the engine,
type of gasoline used and equipment used to measure outcomes.
A four stroke 362cc Briggs and Stratton engine (Model 222416, Type 0516-01) was
used because it was relatively inexpensive, fairly robust, had a flat head (L-head) and could
be relatively easily attached to the dynamometer (Borghi & Saveri) at the University of
Idaho. The flat head (L-head) of this engine allowed for the compression ratio to be
increased relatively easily by milling some of the material off the bottom of the head.
Table 2 Briggs and Stratton 222416 Baseline Specifications, (17, 18)
Engine Type Single cylinder, L-head, air cooled engine
Model 222416
Type 0516-01
Bore 3-7/16 in. (87.31mm)
Stroke 2-3/8 in. (60.33 mm)
Displacement 22.04 cu. In. (361.2 cc)
Torque (Max.) 14.8 Ft.-Lbs (20.066 N-m) @ 3000 RPM
Compression Ratio 6:1
2.1 Engine Modifications
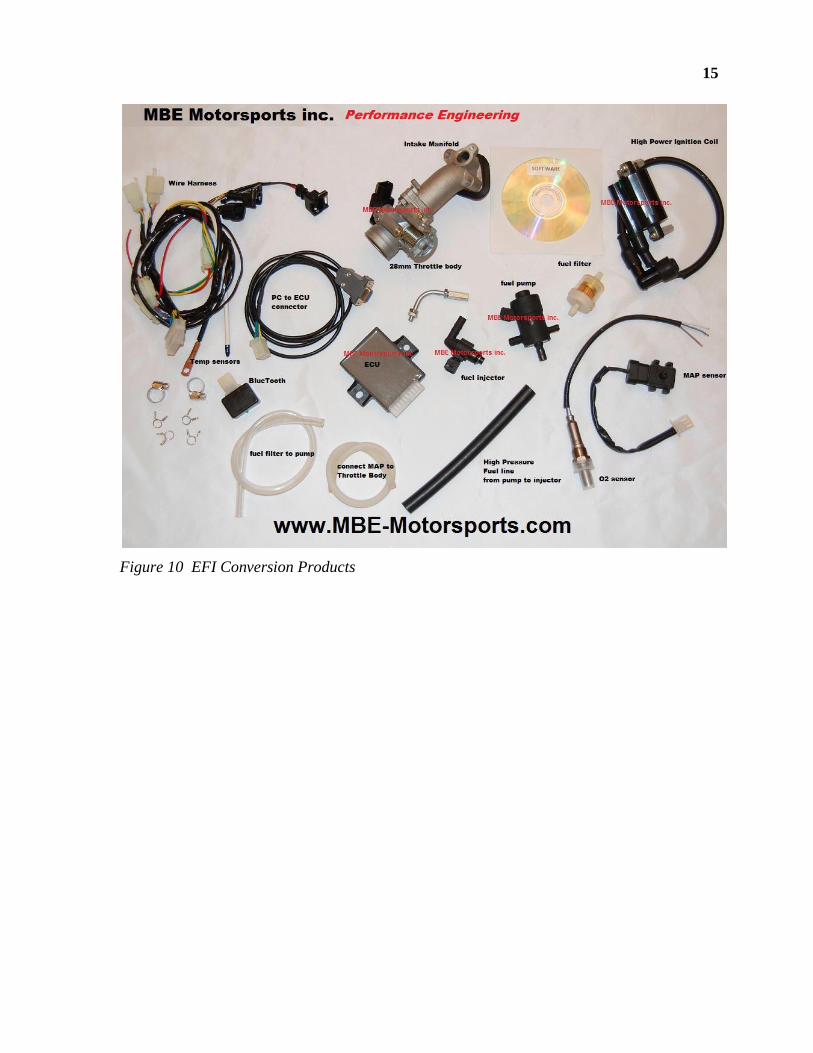
To provide the engine with an intake manifold fuel injection system and an intake
manifold water injection system, products were purchased from MBE Motorsports
(www.mbe-motorsports.com). This company makes kits to convert small carbureted engines
to EFI (electronic fuel injection) engines. Some of the products in the kit were purchased
twice (such as injectors and ECUs) to be able to control injection of both water and fuel.
Most of the products from MBE Motorsports which enable water and fuel injection on the
Briggs and Stratton engine can be seen in Figure 10 EFI Conversion Products.
15
Figure 10 EFI Conversion Products
16
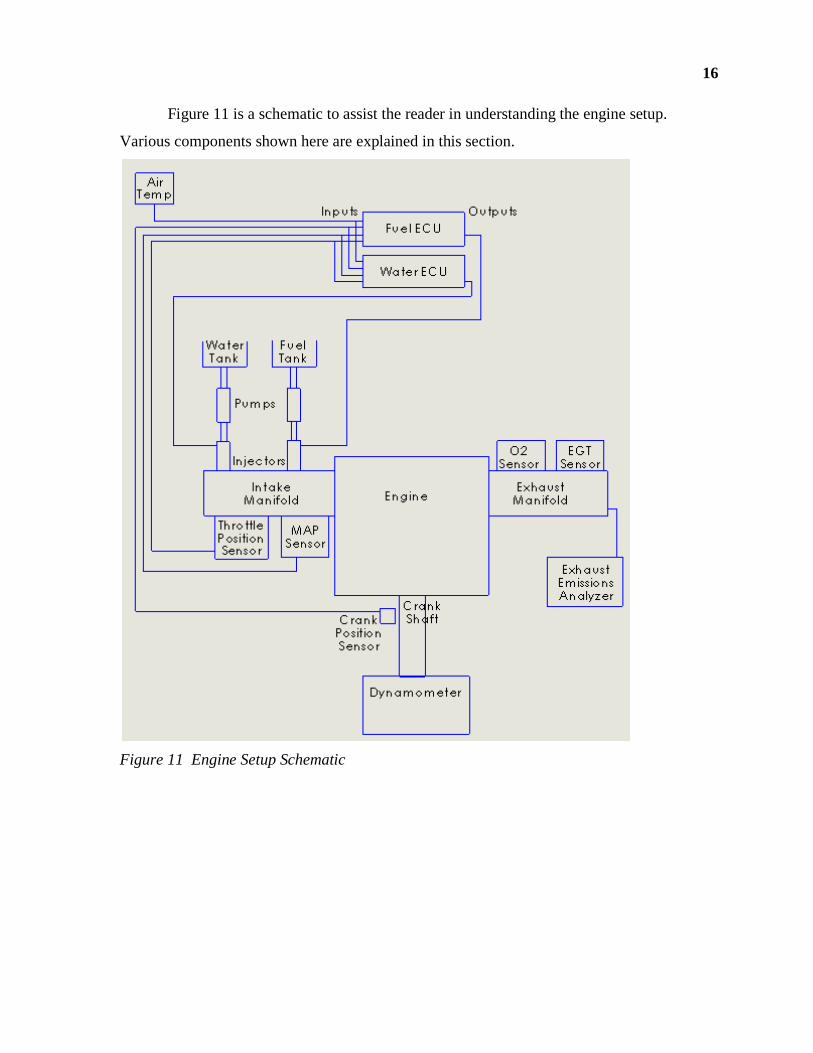
Figure 11 is a schematic to assist the reader in understanding the engine setup.
Various components shown here are explained in this section.
Figure 11 Engine Setup Schematic
17
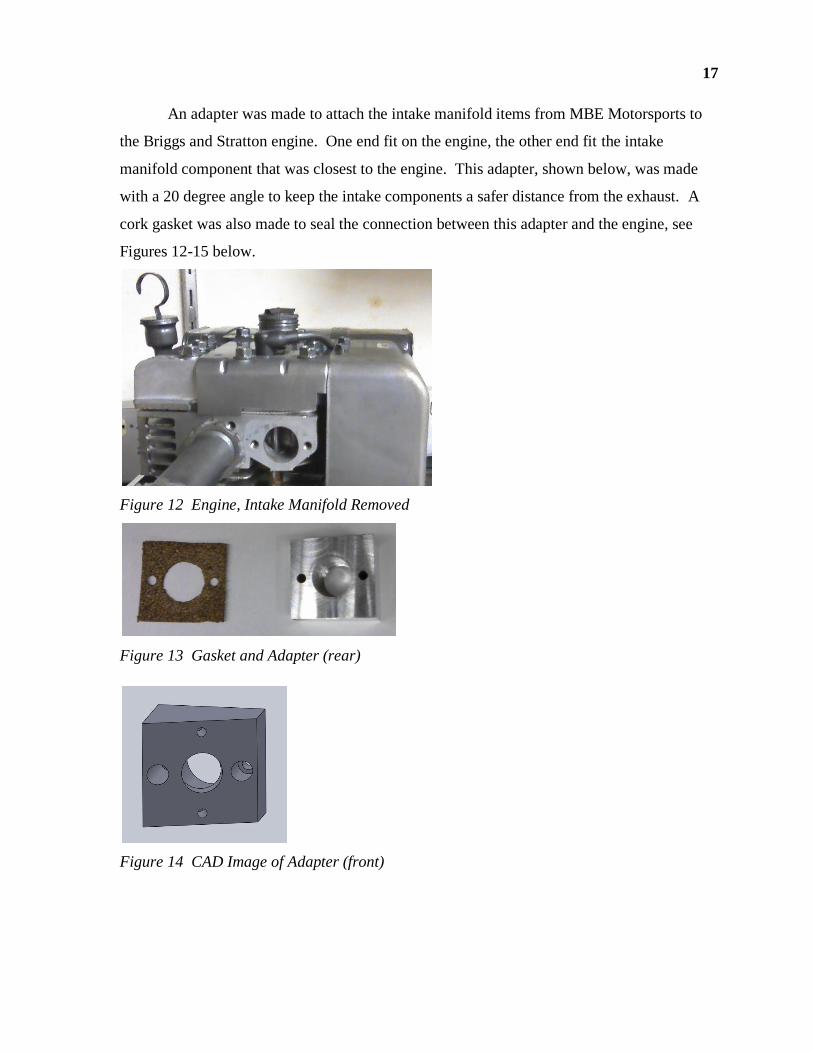
An adapter was made to attach the intake manifold items from MBE Motorsports to
the Briggs and Stratton engine. One end fit on the engine, the other end fit the intake
manifold component that was closest to the engine. This adapter, shown below, was made
with a 20 degree angle to keep the intake components a safer distance from the exhaust. A
cork gasket was also made to seal the connection between this adapter and the engine, see
Figures 12-15 below.
Figure 12 Engine, Intake Manifold Removed
Figure 13 Gasket and Adapter (rear)
Figure 14 CAD Image of Adapter (front)
18
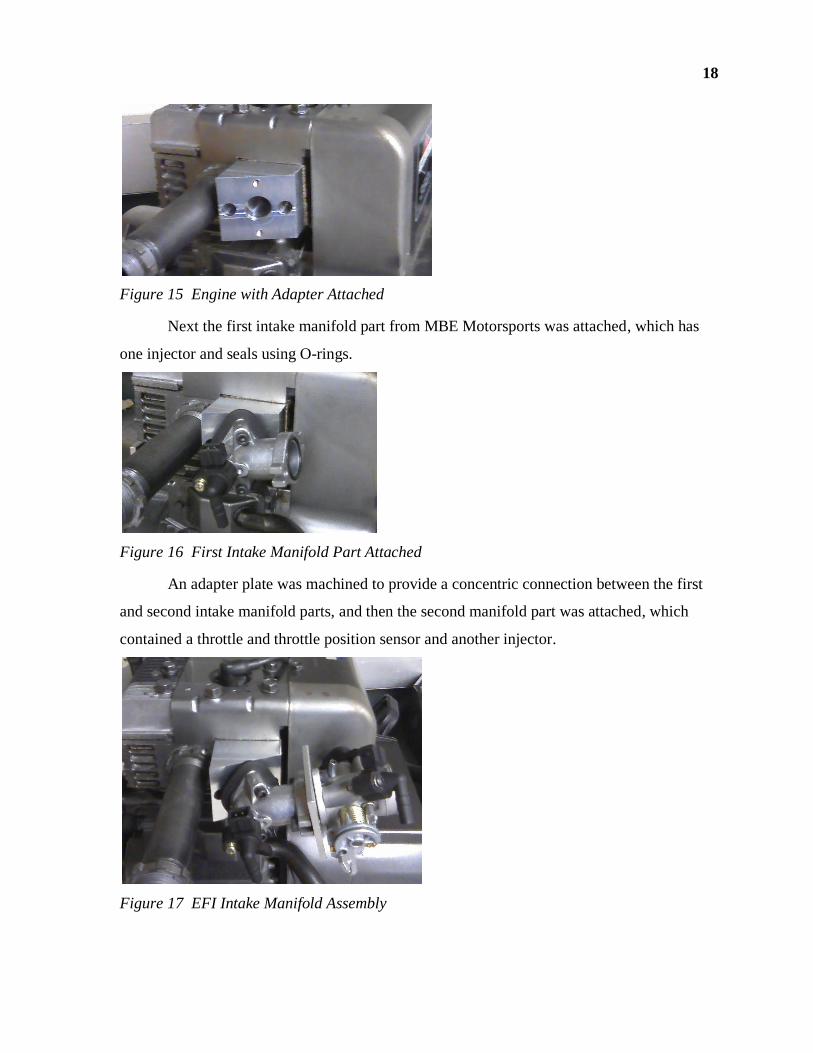
Figure 15 Engine with Adapter Attached
Next the first intake manifold part from MBE Motorsports was attached, which has
one injector and seals using O-rings.
Figure 16 First Intake Manifold Part Attached
An adapter plate was machined to provide a concentric connection between the first
and second intake manifold parts, and then the second manifold part was attached, which
contained a throttle and throttle position sensor and another injector.
Figure 17 EFI Intake Manifold Assembly
19
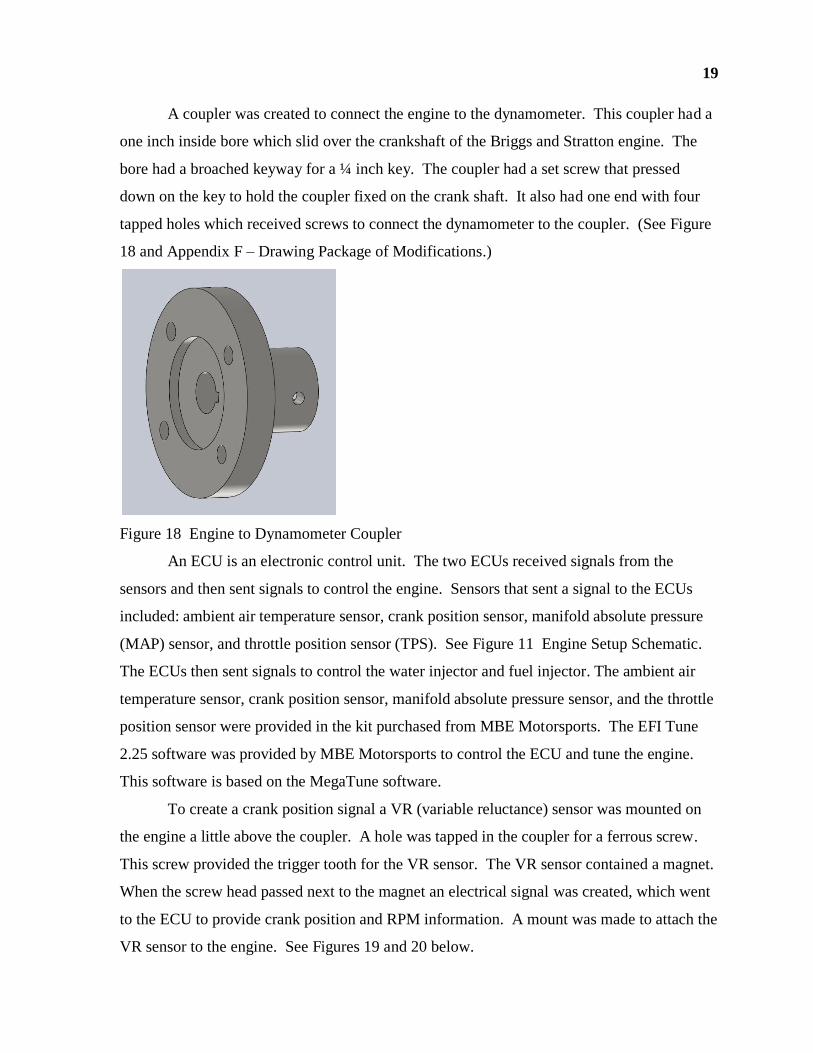
A coupler was created to connect the engine to the dynamometer. This coupler had a
one inch inside bore which slid over the crankshaft of the Briggs and Stratton engine. The
bore had a broached keyway for a ¼ inch key. The coupler had a set screw that pressed
down on the key to hold the coupler fixed on the crank shaft. It also had one end with four
tapped holes which received screws to connect the dynamometer to the coupler. (See Figure
18 and Appendix F – Drawing Package of Modifications.)
Figure 18 Engine to Dynamometer Coupler
An ECU is an electronic control unit. The two ECUs received signals from the
sensors and then sent signals to control the engine. Sensors that sent a signal to the ECUs
included: ambient air temperature sensor, crank position sensor, manifold absolute pressure
(MAP) sensor, and throttle position sensor (TPS). See Figure 11 Engine Setup Schematic.
The ECUs then sent signals to control the water injector and fuel injector. The ambient air
temperature sensor, crank position sensor, manifold absolute pressure sensor, and the throttle
position sensor were provided in the kit purchased from MBE Motorsports. The EFI Tune
2.25 software was provided by MBE Motorsports to control the ECU and tune the engine.
This software is based on the MegaTune software.
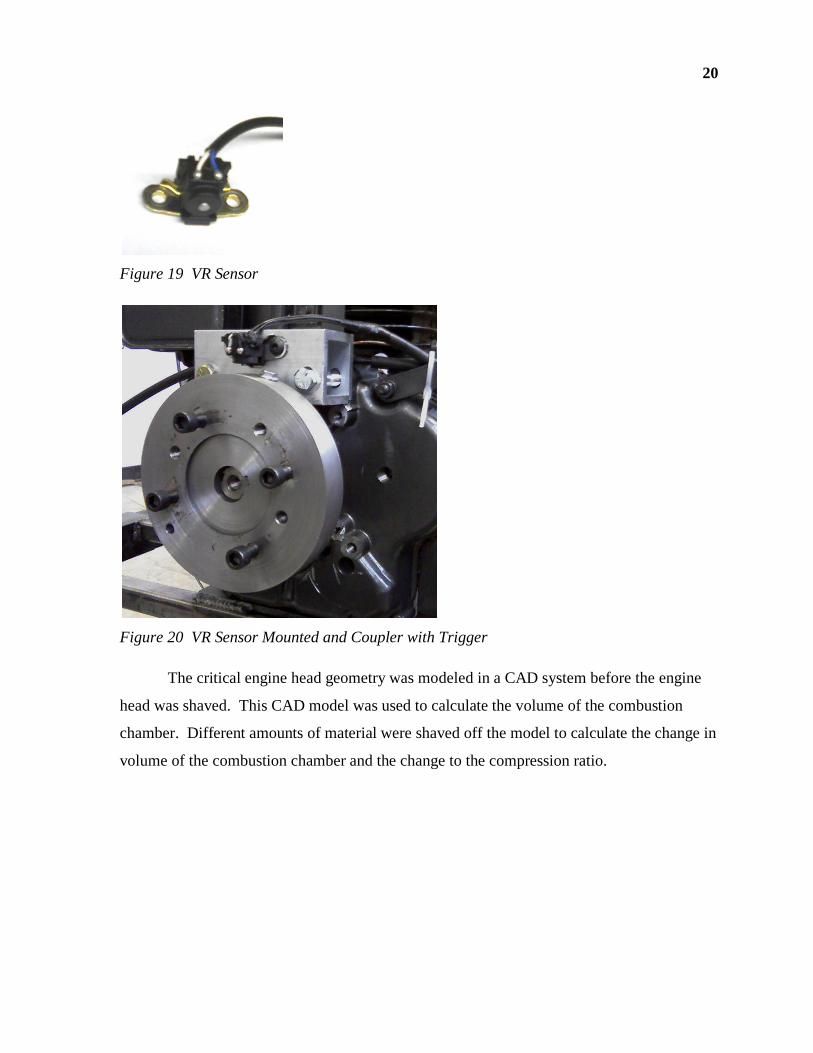
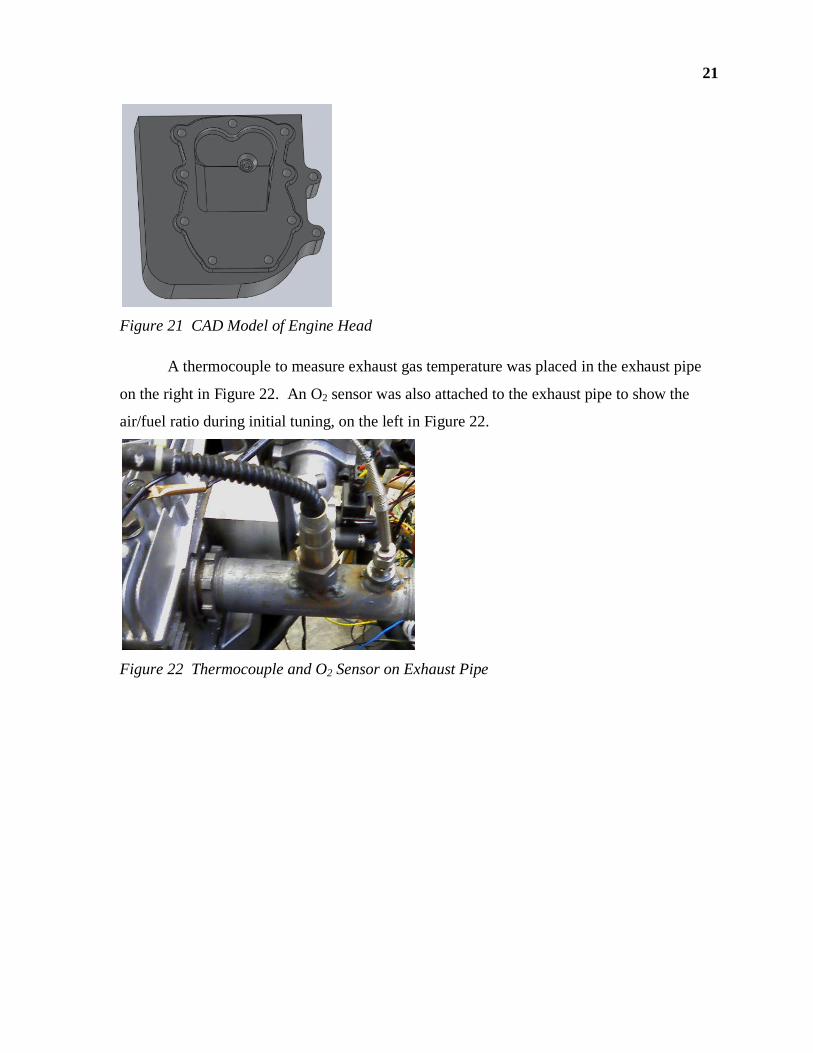
To create a crank position signal a VR (variable reluctance) sensor was mounted on
the engine a little above the coupler. A hole was tapped in the coupler for a ferrous screw.
This screw provided the trigger tooth for the VR sensor. The VR sensor contained a magnet.
When the screw head passed next to the magnet an electrical signal was created, which went
to the ECU to provide crank position and RPM information. A mount was made to attach the
VR sensor to the engine. See Figures 19 and 20 below.
20
Figure 19 VR Sensor
Figure 20 VR Sensor Mounted and Coupler with Trigger
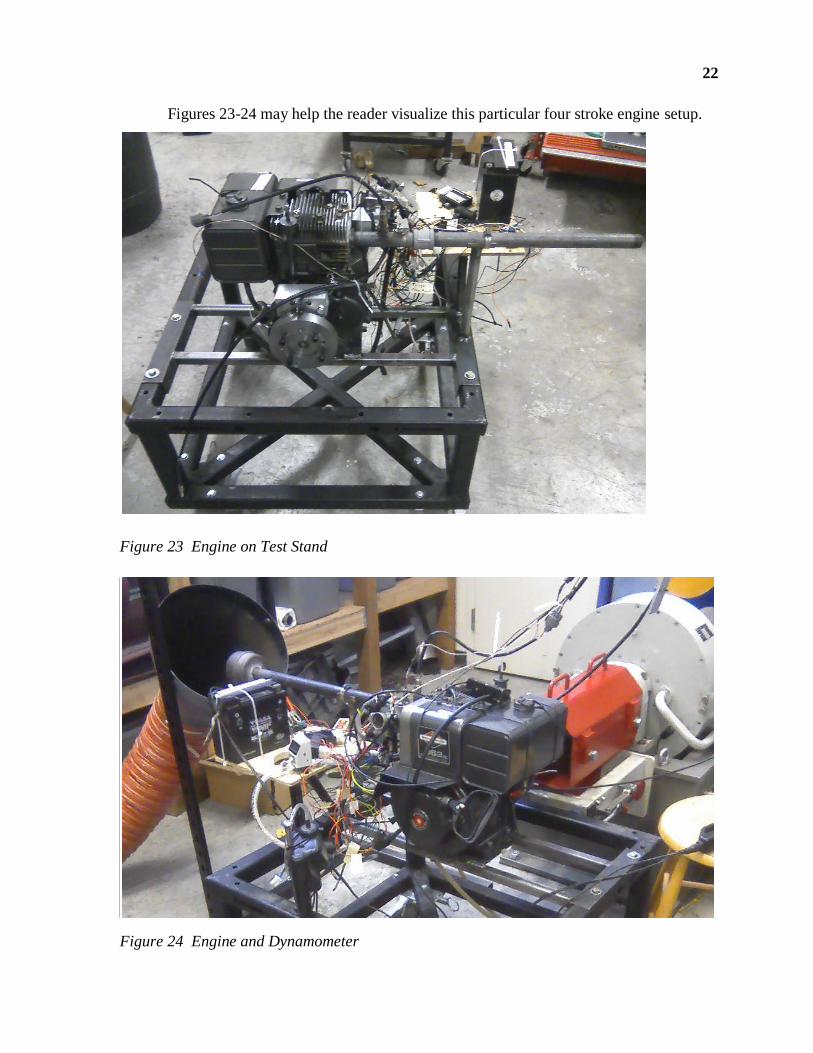
The critical engine head geometry was modeled in a CAD system before the engine
head was shaved. This CAD model was used to calculate the volume of the combustion
chamber. Different amounts of material were shaved off the model to calculate the change in
volume of the combustion chamber and the change to the compression ratio.
21
Figure 21 CAD Model of Engine Head
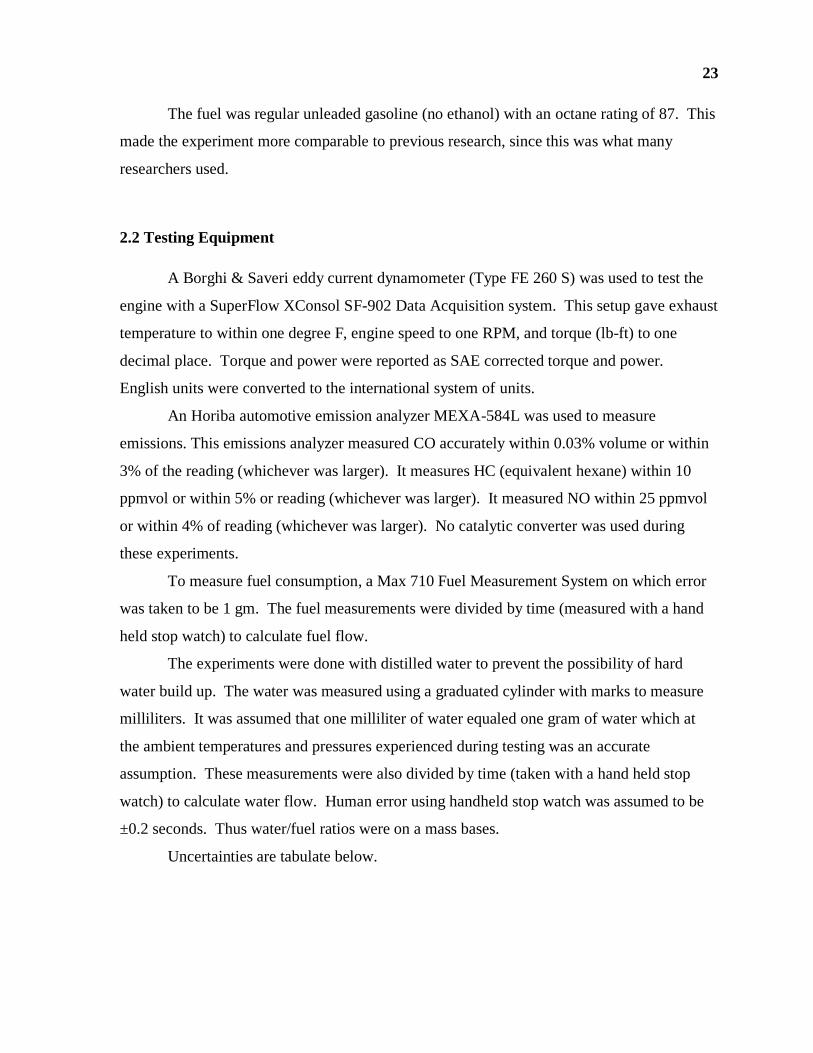
A thermocouple to measure exhaust gas temperature was placed in the exhaust pipe
on the right in Figure 22. An O2 sensor was also attached to the exhaust pipe to show the
air/fuel ratio during initial tuning, on the left in Figure 22.
Figure 22 Thermocouple and O2 Sensor on Exhaust Pipe
22
Figures 23-24 may help the reader visualize this particular four stroke engine setup.
Figure 23 Engine on Test Stand
Figure 24 Engine and Dynamometer
23
The fuel was regular unleaded gasoline (no ethanol) with an octane rating of 87. This
made the experiment more comparable to previous research, since this was what many
researchers used.
2.2 Testing Equipment
A Borghi & Saveri eddy current dynamometer (Type FE 260 S) was used to test the
engine with a SuperFlow XConsol SF-902 Data Acquisition system. This setup gave exhaust
temperature to within one degree F, engine speed to one RPM, and torque (lb-ft) to one
decimal place. Torque and power were reported as SAE corrected torque and power.
English units were converted to the international system of units.
An Horiba automotive emission analyzer MEXA-584L was used to measure
emissions. This emissions analyzer measured CO accurately within 0.03% volume or within
3% of the reading (whichever was larger). It measures HC (equivalent hexane) within 10
ppmvol or within 5% or reading (whichever was larger). It measured NO within 25 ppmvol
or within 4% of reading (whichever was larger). No catalytic converter was used during
these experiments.
To measure fuel consumption, a Max 710 Fuel Measurement System on which error
was taken to be 1 gm. The fuel measurements were divided by time (measured with a hand
held stop watch) to calculate fuel flow.
The experiments were done with distilled water to prevent the possibility of hard
water build up. The water was measured using a graduated cylinder with marks to measure
milliliters. It was assumed that one milliliter of water equaled one gram of water which at
the ambient temperatures and pressures experienced during testing was an accurate
assumption. These measurements were also divided by time (taken with a hand held stop
watch) to calculate water flow. Human error using handheld stop watch was assumed to be
±0.2 seconds. Thus water/fuel ratios were on a mass bases.
Uncertainties are tabulate below.
24
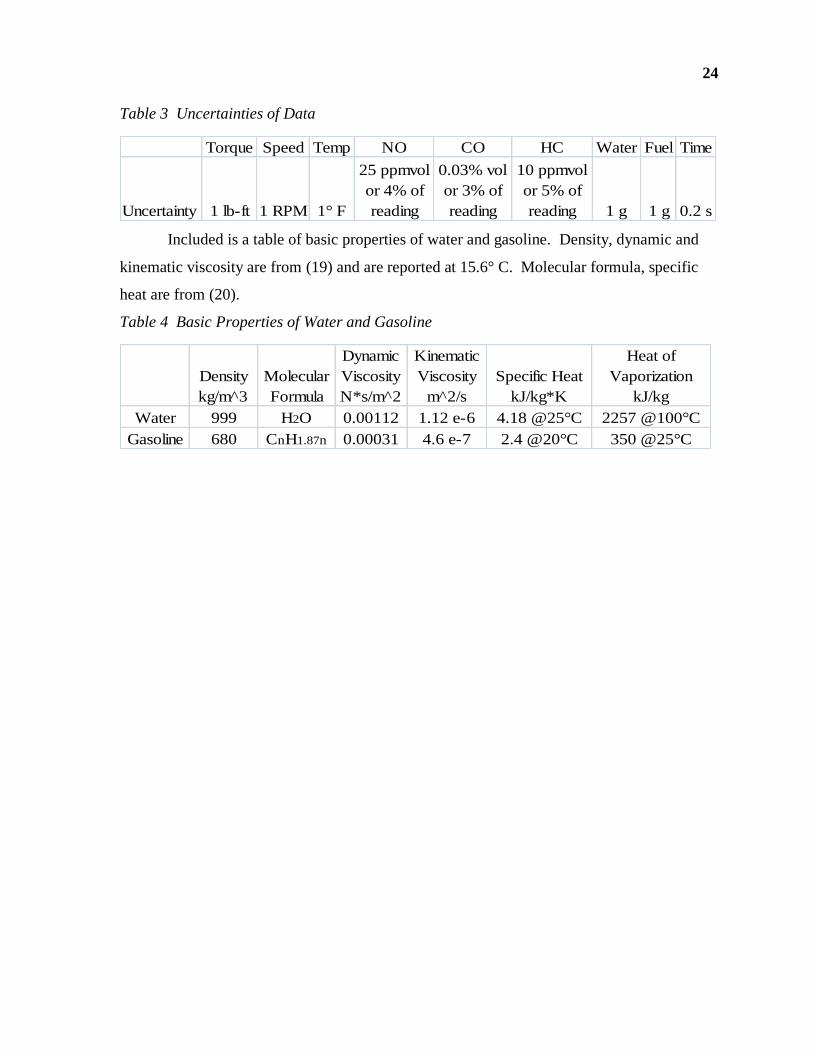
Table 3 Uncertainties of Data
Torque Speed Temp NO CO HC Water Fuel Time
Uncertainty 1 lb-ft 1 RPM 1° F
25 ppmvol
or 4% of
reading
0.03% vol
or 3% of
reading
10 ppmvol
or 5% of
reading 1 g 1 g 0.2 s
Included is a table of basic properties of water and gasoline. Density, dynamic and
kinematic viscosity are from (19) and are reported at 15.6° C. Molecular formula, specific
heat are from (20).
Table 4 Basic Properties of Water and Gasoline
Density
kg/m^3
Molecular
Formula
Dynamic
Viscosity
N*s/m^2
Kinematic
Viscosity
m^2/s
Specific Heat
kJ/kg*K
Heat of
Vaporization
kJ/kg
Water 999 H2O 0.00112 1.12 e-6 4.18 @25°C 2257 @100°C
Gasoline 680 CnH1.87n 0.00031 4.6 e-7 2.4 @20°C 350 @25°C
25
3.0 Experiment, Results and Discussion
The engine was run at three different air/fuel ratios, with varied amounts of water
injected and at two compression ratios. Torque, BSFC, exhaust temperature, as well as
emission levels of NO, CO and HC were collected and reported. Emissions are reported on a
brake specific basis. Graphs show averages of data taken over approximately one minute.
Error bars represent the standard deviation of the data. The spreadsheet containing the data
used for the various bar charts can be found in Appendix A. Equations used to calculate
brake specific emissions are found in Appendixes C and D. For brake specific emissions, the
hydrogen/carbon (H/C) ratio was assumed to be 1.87 .
A preliminary experiment was done on the engine with the fuel injection
modifications, from which it was determined that the engine ran best (max torque) at
approximately 2500 RPM and wide open throttle. Perhaps the temperature and pressure
conditions in Moscow, Idaho are the reason max torque was not achieved at 3000 RPM as
stated by the manufacturer. From this experiment it was determined to run the water
injection tests at this RPM (2500) and throttle position (wide open). The average RPM
varied up to 62 from the target RPM of 2500. The dynamometer used for testing was made
for more powerful engines than the 10 HP Briggs and Stratton used. The dynamometer had
difficulty holding the small engine at a constant speed. A small change in the load setting of
the dynamometer (controlled by a PID system) caused a larger change in engine speed. In
some cases this challenge resulted in data with standard deviations larger than would be
preferred.
The stock engine spark timing was determined to be 26 degrees before top dead
center. This same spark timing was used for all the experiments presented in this thesis.
Water addition can increase the O2 levels in the exhaust (9). Because emissions
analyzers usually calculate AFR based on O2 levels, water addition can make AFR readings
inaccurate. It was desired to run the tests with water and the tests without water at the same
air/fuel ratios. To keep air/fuel ratios as close to target values as possible, three fuel maps
were created (using the EFITune 2.25 software). These maps determined the amount of fuel
provided to the engine per cycle, based on throttle position, RPM and air temperature. These
maps were created with no water addition, and then were also used when water was added. It
26
was assumed that the water injected did not significantly alter the air/fuel ratios. However,
the air/fuel ratios are known with certainty only at 0 water/fuel ratio. Maps were made for
three different target air/fuel ratios: 13.7 (rich), 14.7 (stoichiometric), and 15.7 (lean).
Equivalence ratio the defined by equation 4, where (A/F) is air/fuel ratio.
Equation 5 Equivalence Ratio
Corresponding equivalence ratios (Ф) for the air/fuel ratios listed above are
respectively: 1.07 (rich), 1.00 (stoichiometric) and 0.94 (lean). The actual air/fuel ratios
varied up to 0.2 AFR (up to 0.015 Ф) from the target.
Target amounts of water were based on a water/fuel ratio (WFR) on a mass basis, e.g.
15g water per minute/ 100 g fuel per minute = 0.15 water/fuel ratio. Tests were run at each
air/fuel ratio while incrementally increasing amounts of water (0, 0.15, 0.30, 0.45, 0.60, 0.75
water/fuel mass ratios). Actual water/fuel ratios varied up to 0.018 from the target. With the
exception of one case (rich, compression ratio 6, target 0.75 WFR), where it was very
difficult to tune the AFR, the error was 0.06 off of the target WFR. WFR ratio increases
were stopped at 0.75 because it became very difficult to tune the water injection ECU for this
amount and because engine performance had stopped making significant improvements with
additional water.
Data at each combination of AFR and WFR were taken at the stock compression ratio
of 6:1. Then 0.059 inches (1.5 mm) were shaved off of the bottom of the head, image of the
engine head is shown Figure 21. Shaving the head decreased the volume of the combustion
chamber to increase the compression ratio to 7:1. Tests at each combination of AFR and
WFR were repeated.
Trends of torque, brake specific fuel consumption, temperature as well as emissions
of NO, CO and HC are presented in the following subsections. The trends of power output
are the same as the torque trends, because power is a function of torque and RPM, and all
tests were run at approximately 2500 RPM. Efficiency trends are opposite the trends in
BSFC. Brake specific fuel consumption is the amount of fuel consumed per unit of energy
received from the engine (grams/kW-h). Hence, if less fuel is used per kW-h produced, then
27
BSFC has diminished and efficiency has increased (equation 3). Trends as AFR changes
from lean to rich are known and can be found in An Introduction to Combustion by Turns (2).
They will not be thoroughly discussed here.
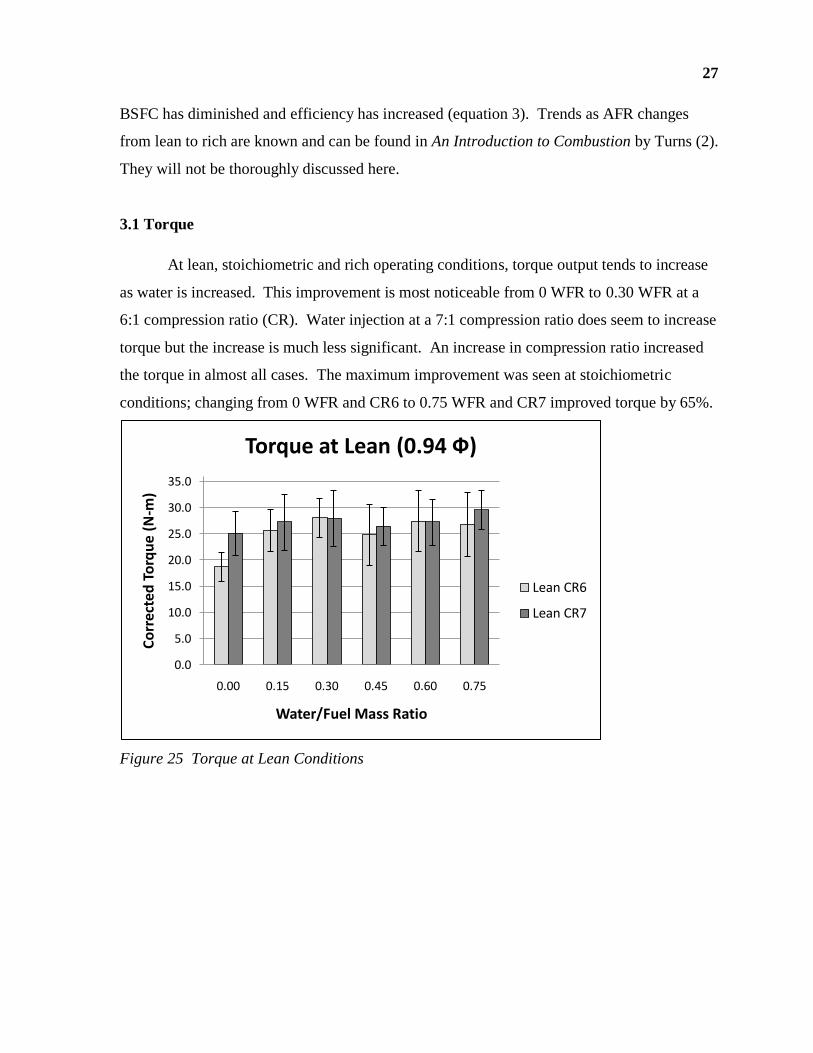
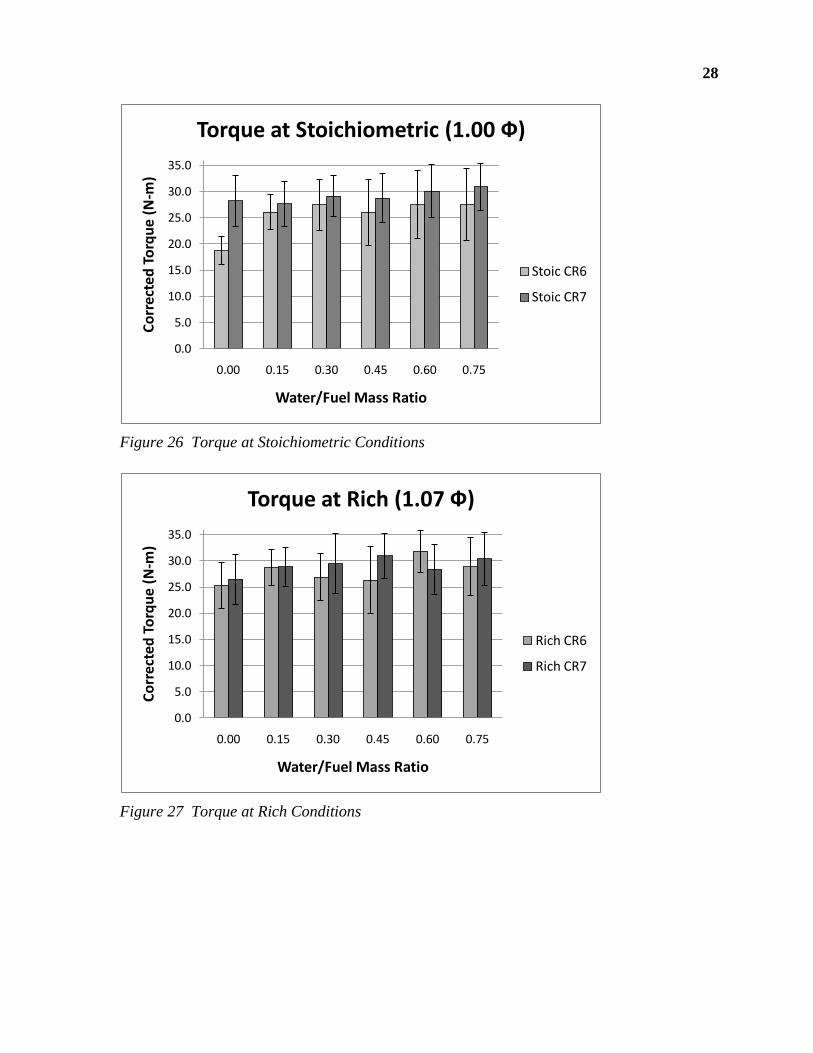
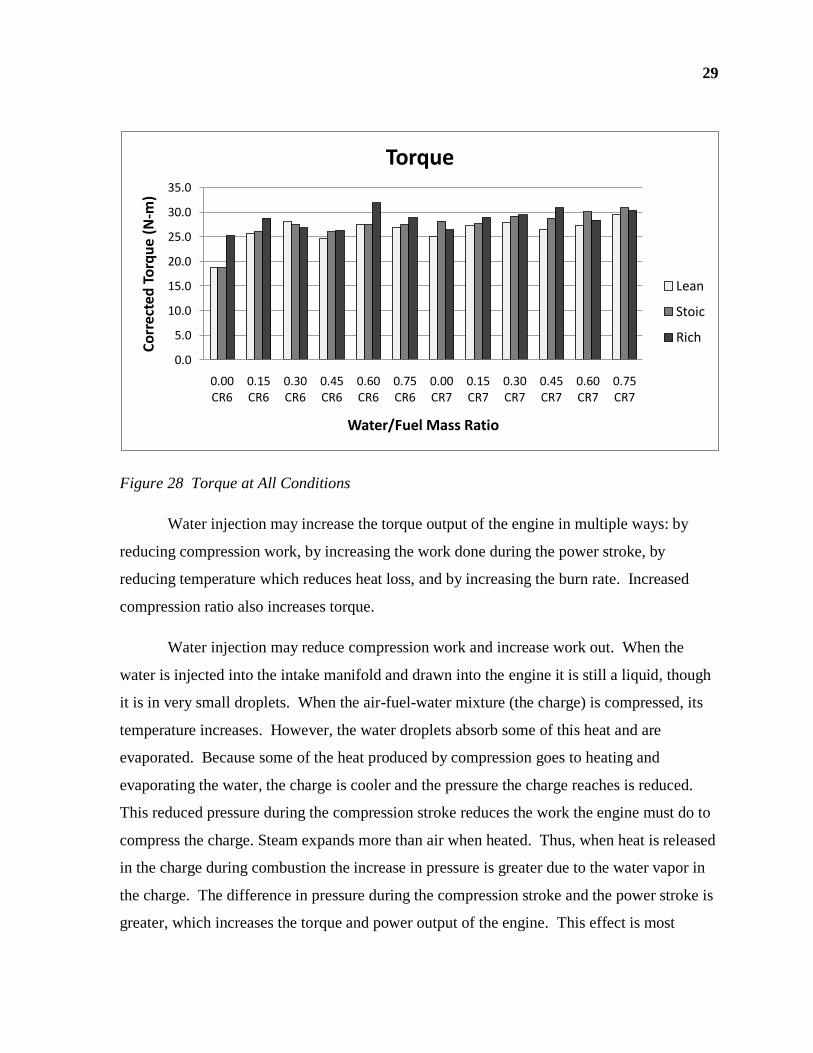
3.1 Torque
At lean, stoichiometric and rich operating conditions, torque output tends to increase
as water is increased. This improvement is most noticeable from 0 WFR to 0.30 WFR at a
6:1 compression ratio (CR). Water injection at a 7:1 compression ratio does seem to increase
torque but the increase is much less significant. An increase in compression ratio increased
the torque in almost all cases. The maximum improvement was seen at stoichiometric
conditions; changing from 0 WFR and CR6 to 0.75 WFR and CR7 improved torque by 65%.
Figure 25 Torque at Lean Conditions
0.0
5.0
10.0
15.0
20.0
25.0
30.0
35.0
0.00 0.15 0.30 0.45 0.60 0.75
Co
rrec
ted
To
rqu
e (N
-m)
Water/Fuel Mass Ratio
Torque at Lean (0.94 Ф)
Lean CR6
Lean CR7
28
Figure 26 Torque at Stoichiometric Conditions
Figure 27 Torque at Rich Conditions
0.0
5.0
10.0
15.0
20.0
25.0
30.0
35.0
0.00 0.15 0.30 0.45 0.60 0.75
Co
rrec
ted
To
rqu
e (N
-m)
Water/Fuel Mass Ratio
Torque at Stoichiometric (1.00 Ф)
Stoic CR6
Stoic CR7
0.0
5.0
10.0
15.0
20.0
25.0
30.0
35.0
0.00 0.15 0.30 0.45 0.60 0.75
Co
rre
cte
d T
orq
ue
(N
-m)
Water/Fuel Mass Ratio
Torque at Rich (1.07 Ф)
Rich CR6
Rich CR7
29
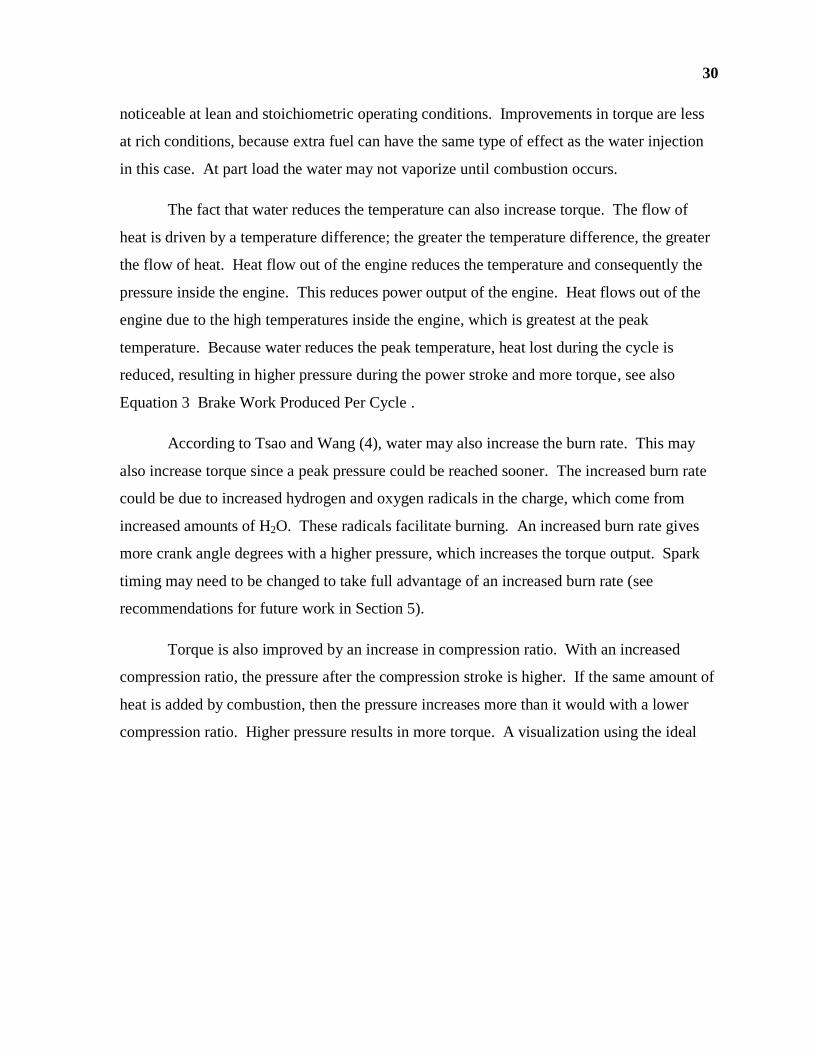
Figure 28 Torque at All Conditions
Water injection may increase the torque output of the engine in multiple ways: by
reducing compression work, by increasing the work done during the power stroke, by
reducing temperature which reduces heat loss, and by increasing the burn rate. Increased
compression ratio also increases torque.
Water injection may reduce compression work and increase work out. When the
water is injected into the intake manifold and drawn into the engine it is still a liquid, though
it is in very small droplets. When the air-fuel-water mixture (the charge) is compressed, its
temperature increases. However, the water droplets absorb some of this heat and are
evaporated. Because some of the heat produced by compression goes to heating and
evaporating the water, the charge is cooler and the pressure the charge reaches is reduced.
This reduced pressure during the compression stroke reduces the work the engine must do to
compress the charge. Steam expands more than air when heated. Thus, when heat is released
in the charge during combustion the increase in pressure is greater due to the water vapor in
the charge. The difference in pressure during the compression stroke and the power stroke is
greater, which increases the torque and power output of the engine. This effect is most
0.0
5.0
10.0
15.0
20.0
25.0
30.0
35.0
0.00 CR6
0.15 CR6
0.30 CR6
0.45 CR6
0.60 CR6
0.75 CR6
0.00 CR7
0.15 CR7
0.30 CR7
0.45 CR7
0.60 CR7
0.75 CR7
Co
rrec
ted
To
rqu
e (N
-m)
Water/Fuel Mass Ratio
Torque
Lean
Stoic
Rich
30
noticeable at lean and stoichiometric operating conditions. Improvements in torque are less
at rich conditions, because extra fuel can have the same type of effect as the water injection
in this case. At part load the water may not vaporize until combustion occurs.
The fact that water reduces the temperature can also increase torque. The flow of
heat is driven by a temperature difference; the greater the temperature difference, the greater
the flow of heat. Heat flow out of the engine reduces the temperature and consequently the
pressure inside the engine. This reduces power output of the engine. Heat flows out of the
engine due to the high temperatures inside the engine, which is greatest at the peak
temperature. Because water reduces the peak temperature, heat lost during the cycle is
reduced, resulting in higher pressure during the power stroke and more torque, see also
Equation 3 Brake Work Produced Per Cycle .
According to Tsao and Wang (4), water may also increase the burn rate. This may
also increase torque since a peak pressure could be reached sooner. The increased burn rate
could be due to increased hydrogen and oxygen radicals in the charge, which come from
increased amounts of H2O. These radicals facilitate burning. An increased burn rate gives
more crank angle degrees with a higher pressure, which increases the torque output. Spark
timing may need to be changed to take full advantage of an increased burn rate (see
recommendations for future work in Section 5).
Torque is also improved by an increase in compression ratio. With an increased
compression ratio, the pressure after the compression stroke is higher. If the same amount of
heat is added by combustion, then the pressure increases more than it would with a lower
compression ratio. Higher pressure results in more torque. A visualization using the ideal
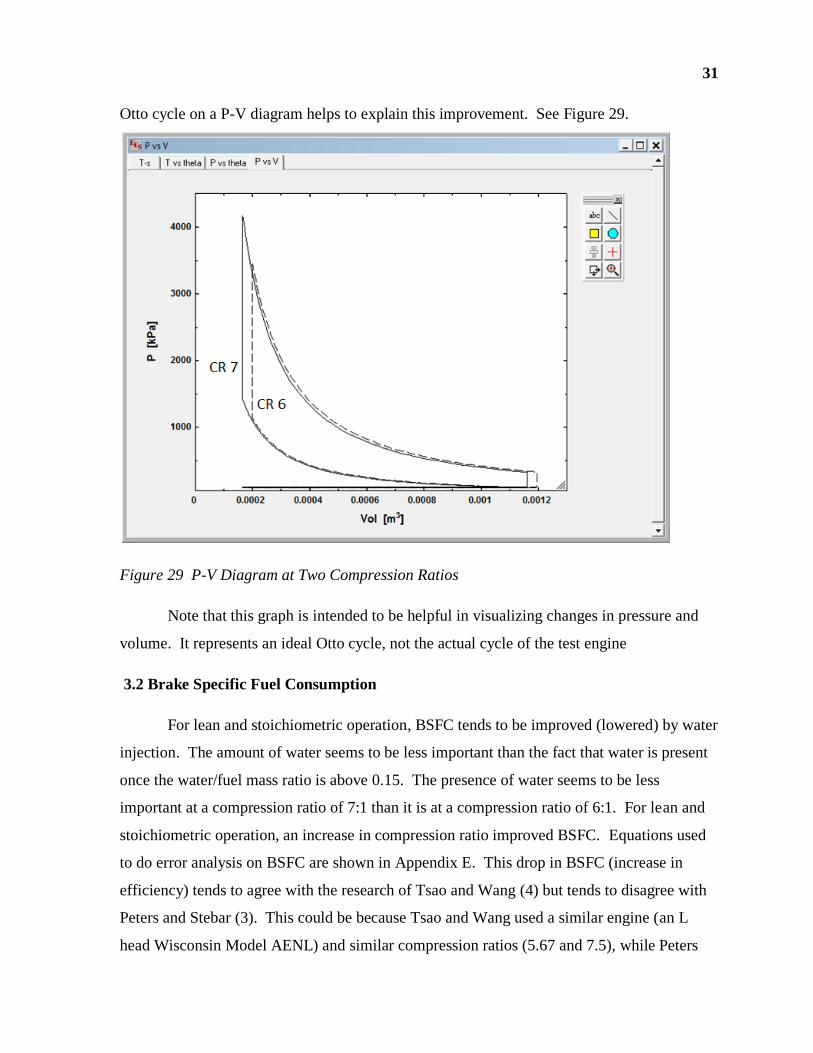
31
Otto cycle on a P-V diagram helps to explain this improvement. See Figure 29.
Figure 29 P-V Diagram at Two Compression Ratios
Note that this graph is intended to be helpful in visualizing changes in pressure and
volume. It represents an ideal Otto cycle, not the actual cycle of the test engine
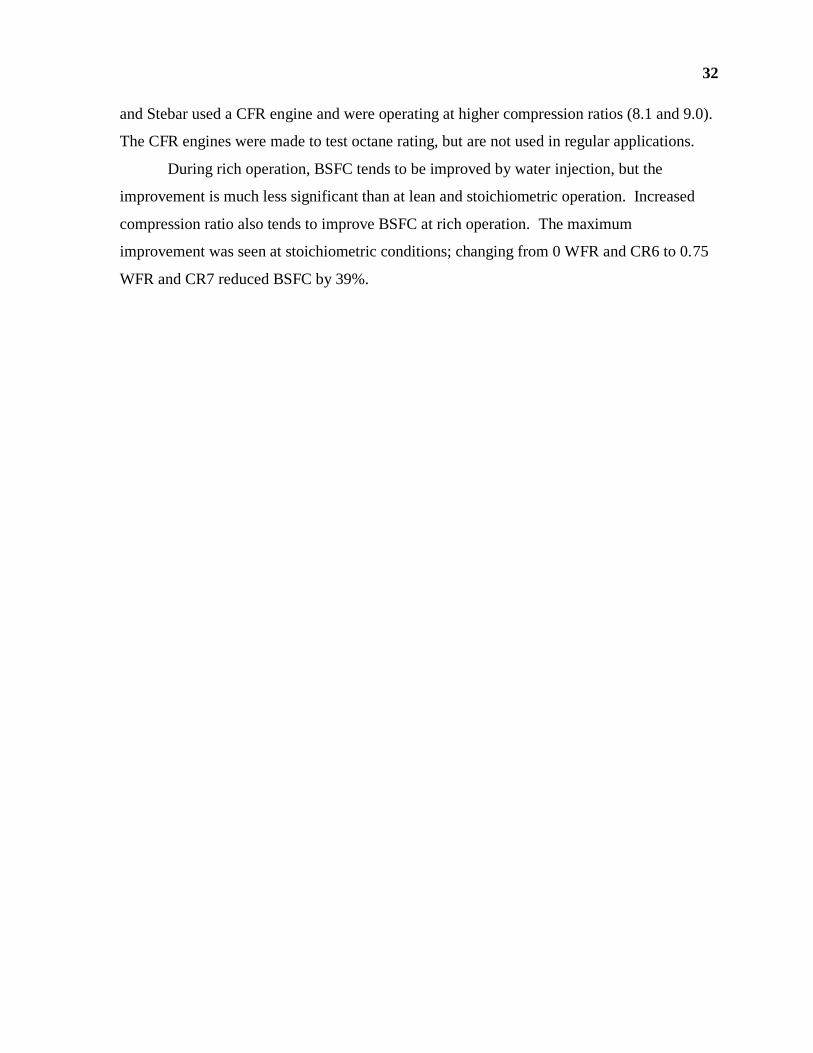
3.2 Brake Specific Fuel Consumption
For lean and stoichiometric operation, BSFC tends to be improved (lowered) by water
injection. The amount of water seems to be less important than the fact that water is present
once the water/fuel mass ratio is above 0.15. The presence of water seems to be less
important at a compression ratio of 7:1 than it is at a compression ratio of 6:1. For lean and
stoichiometric operation, an increase in compression ratio improved BSFC. Equations used
to do error analysis on BSFC are shown in Appendix E. This drop in BSFC (increase in
efficiency) tends to agree with the research of Tsao and Wang (4) but tends to disagree with
Peters and Stebar (3). This could be because Tsao and Wang used a similar engine (an L
head Wisconsin Model AENL) and similar compression ratios (5.67 and 7.5), while Peters
32
and Stebar used a CFR engine and were operating at higher compression ratios (8.1 and 9.0).
The CFR engines were made to test octane rating, but are not used in regular applications.
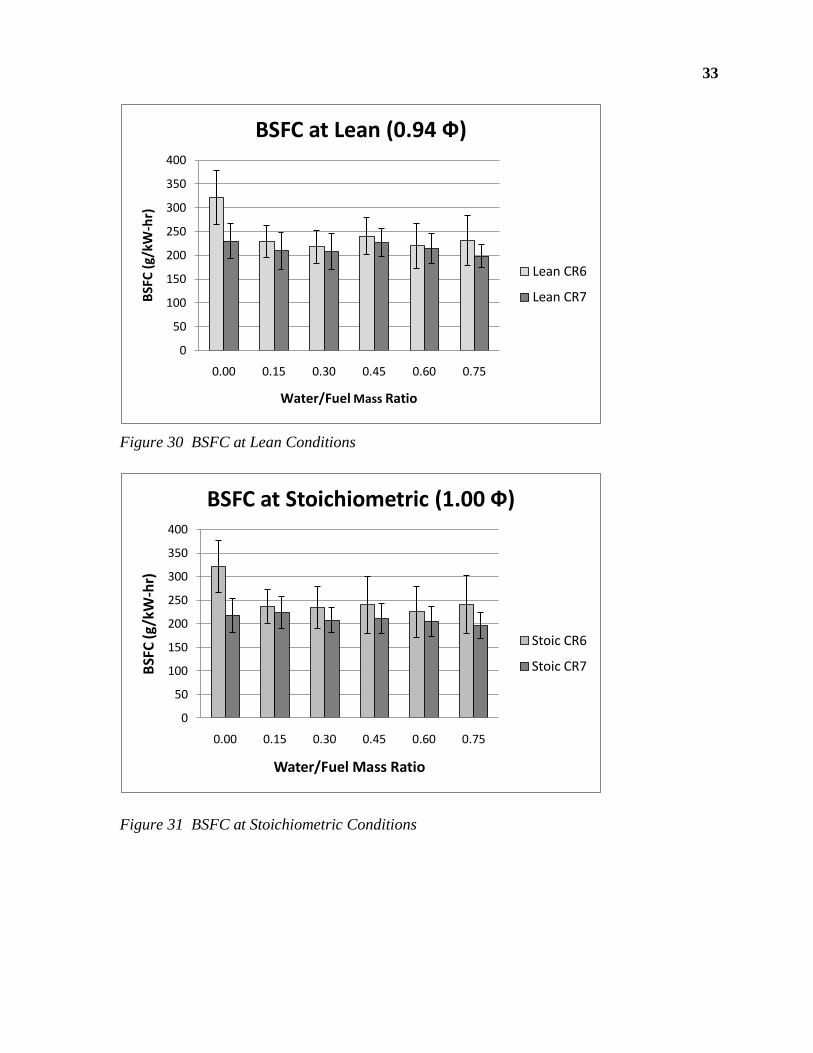
During rich operation, BSFC tends to be improved by water injection, but the
improvement is much less significant than at lean and stoichiometric operation. Increased
compression ratio also tends to improve BSFC at rich operation. The maximum
improvement was seen at stoichiometric conditions; changing from 0 WFR and CR6 to 0.75
WFR and CR7 reduced BSFC by 39%.
33
Figure 30 BSFC at Lean Conditions
Figure 31 BSFC at Stoichiometric Conditions
0
50
100
150
200
250
300
350
400
0.00 0.15 0.30 0.45 0.60 0.75
BSF
C (
g/kW
-hr)
Water/Fuel Mass Ratio
BSFC at Lean (0.94 Ф)
Lean CR6
Lean CR7
0
50
100
150
200
250
300
350
400
0.00 0.15 0.30 0.45 0.60 0.75
BSF
C (g
/kW
-hr)
Water/Fuel Mass Ratio
BSFC at Stoichiometric (1.00 Ф)
Stoic CR6
Stoic CR7
34
Figure 32 BSFC at Rich Conditions
Figure 33 BSFC at All Conditions
Water can improve BSFC for the same reasons it may improve torque. If torque and
power are increased and the same amount of fuel is used, then the BSFC was reduced, and
efficiency was increased. Hence, water injection may decrease the BSFC of the engine in
multiple ways: by reducing compression work, by increasing the work done during the power
0
50
100
150
200
250
300
350
0.00 0.15 0.30 0.45 0.60 0.75
BSF
C (g
/kW
-hr)
Water/Fuel Mass Ratio
BSFC at Rich (1.07 Ф)
Rich CR6
Rich CR7
0
50
100
150
200
250
300
350
0.00 0.15 0.30 0.45 0.60 0.75 0.00 0.15 0.30 0.45 0.60 0.75
BSF
C (g
/kW
-hr)
Water/Fuel Mass Ratio
Brake Specific Fuel Consumption
Lean
Stoic
Rich
35
stroke, by reducing temperature to reduce heat losses and by increasing the burn rate.
Increased compression ratio also increases torque and decreases BSFC. See Section 3.1 on
torque for further explanation.
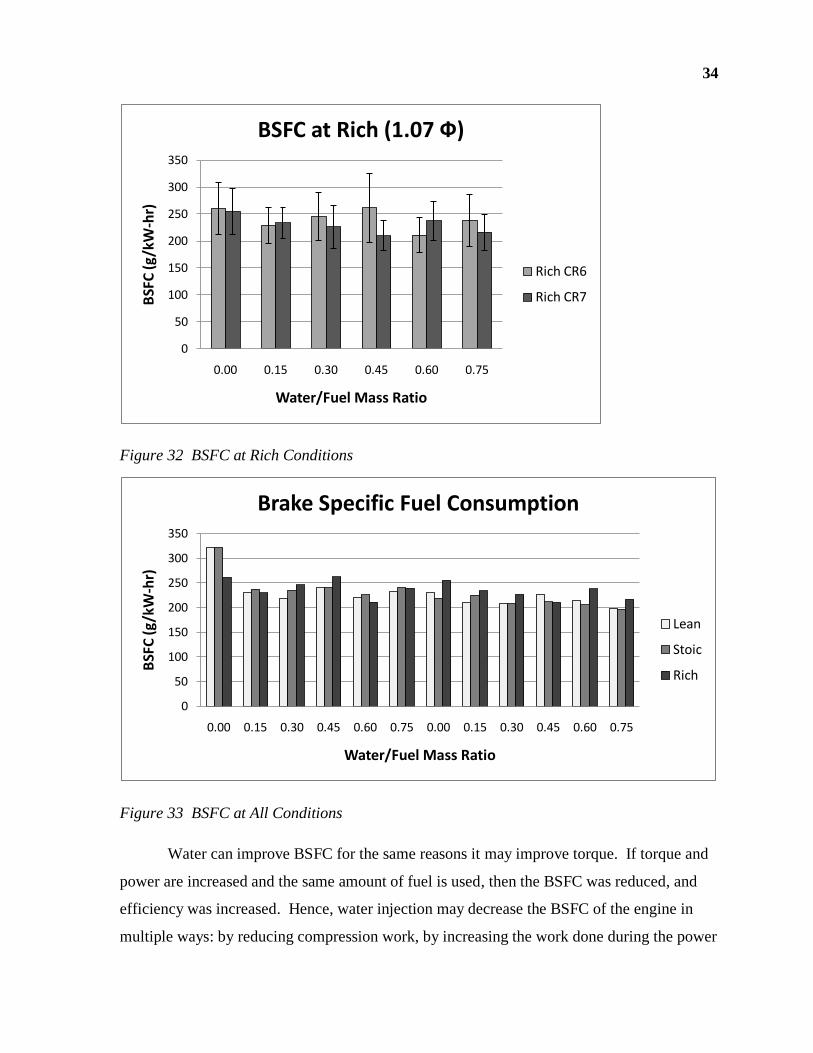
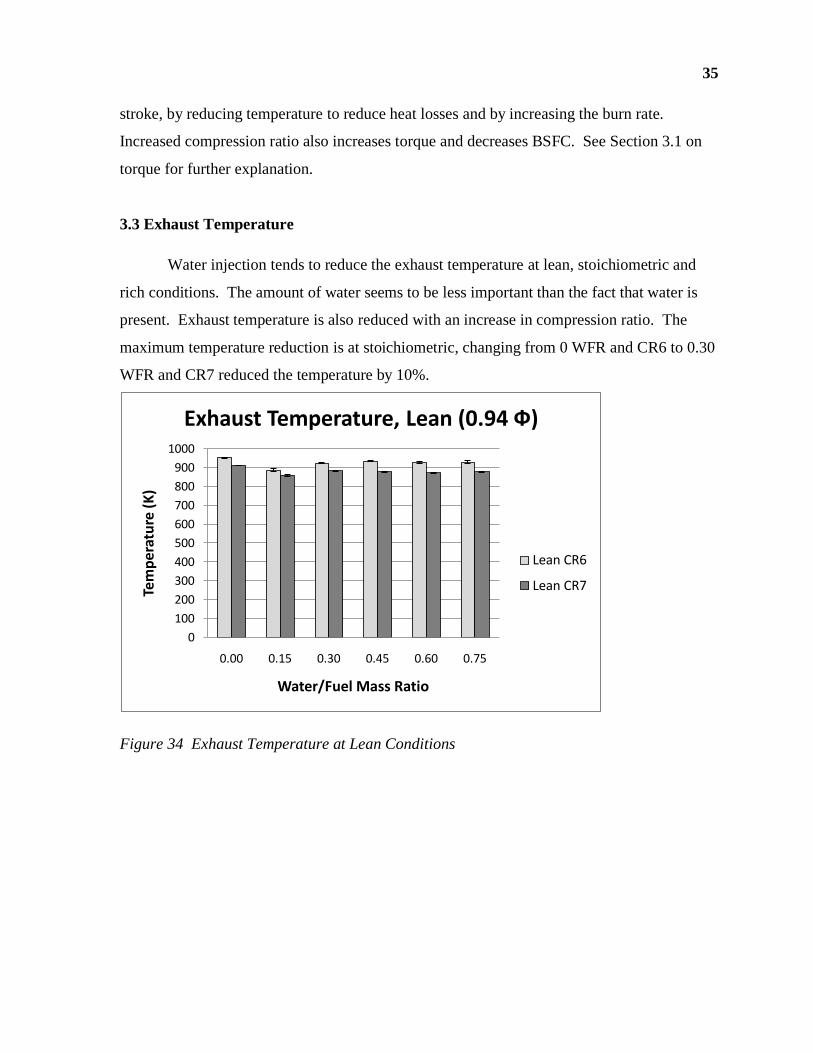
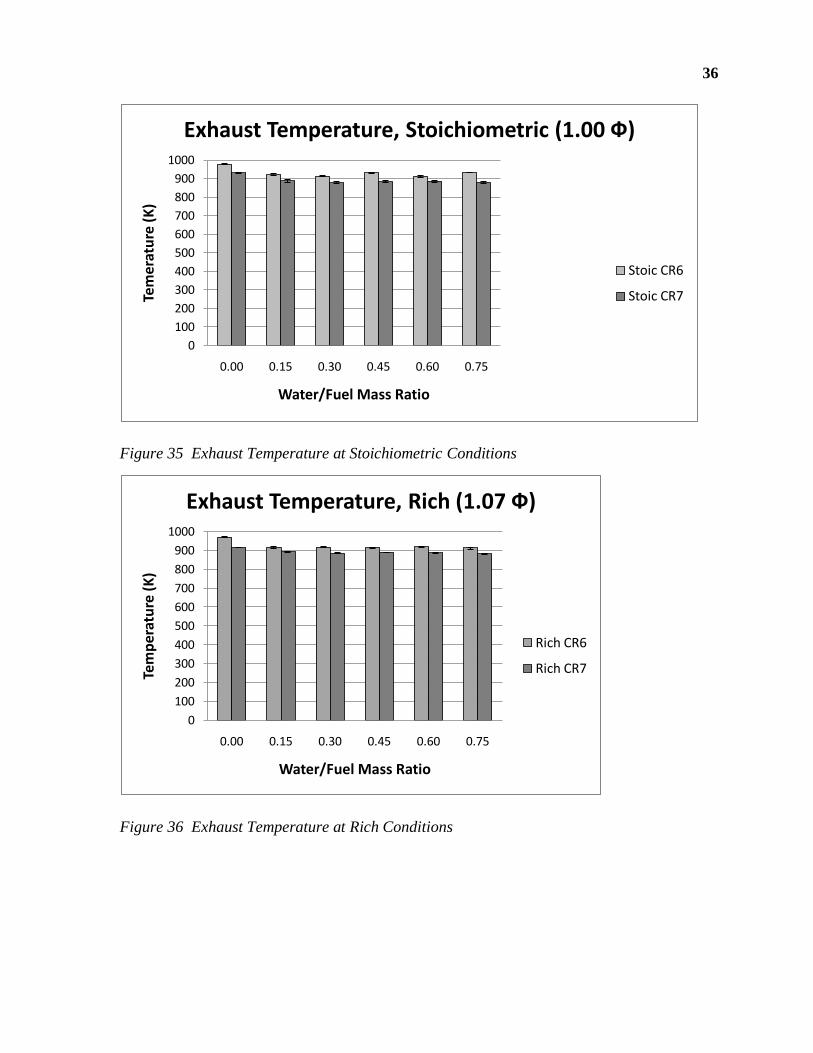
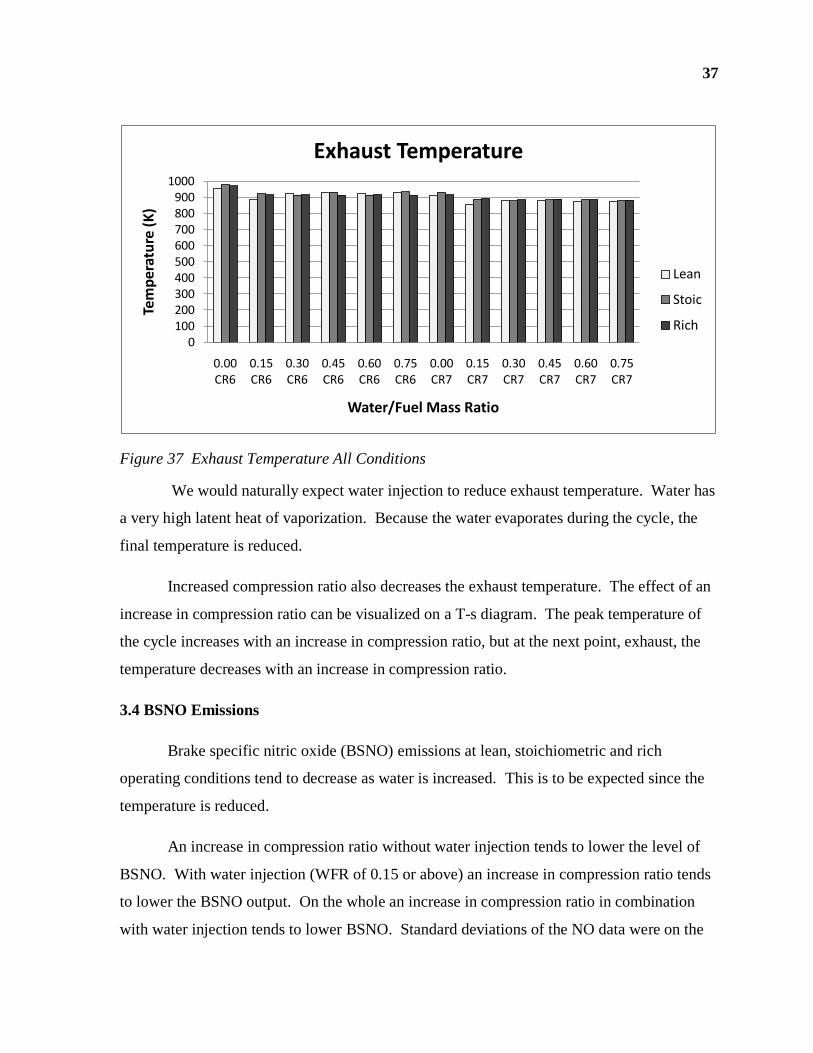
3.3 Exhaust Temperature
Water injection tends to reduce the exhaust temperature at lean, stoichiometric and
rich conditions. The amount of water seems to be less important than the fact that water is
present. Exhaust temperature is also reduced with an increase in compression ratio. The
maximum temperature reduction is at stoichiometric, changing from 0 WFR and CR6 to 0.30
WFR and CR7 reduced the temperature by 10%.
Figure 34 Exhaust Temperature at Lean Conditions
0
100
200
300
400
500
600
700
800
900
1000
0.00 0.15 0.30 0.45 0.60 0.75
Tem
per
atu
re (
K)
Water/Fuel Mass Ratio
Exhaust Temperature, Lean (0.94 Ф)
Lean CR6
Lean CR7
36
Figure 35 Exhaust Temperature at Stoichiometric Conditions
Figure 36 Exhaust Temperature at Rich Conditions
0
100
200
300
400
500
600
700
800
900
1000
0.00 0.15 0.30 0.45 0.60 0.75
Tem
erat
ure
(K
)
Water/Fuel Mass Ratio
Exhaust Temperature, Stoichiometric (1.00 Ф)
Stoic CR6
Stoic CR7
0
100
200
300
400
500
600
700
800
900
1000
0.00 0.15 0.30 0.45 0.60 0.75
Tem
per
atu
re (
K)
Water/Fuel Mass Ratio
Exhaust Temperature, Rich (1.07 Ф)
Rich CR6
Rich CR7
37
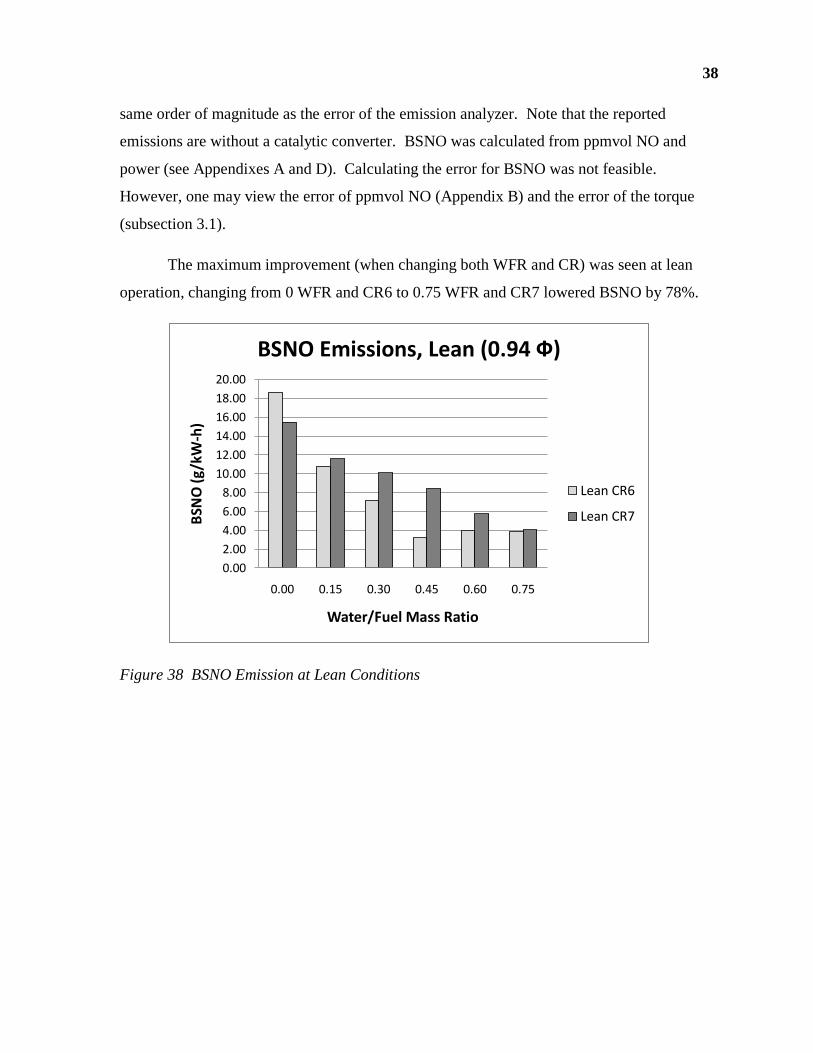
Figure 37 Exhaust Temperature All Conditions
We would naturally expect water injection to reduce exhaust temperature. Water has
a very high latent heat of vaporization. Because the water evaporates during the cycle, the
final temperature is reduced.
Increased compression ratio also decreases the exhaust temperature. The effect of an
increase in compression ratio can be visualized on a T-s diagram. The peak temperature of
the cycle increases with an increase in compression ratio, but at the next point, exhaust, the
temperature decreases with an increase in compression ratio.
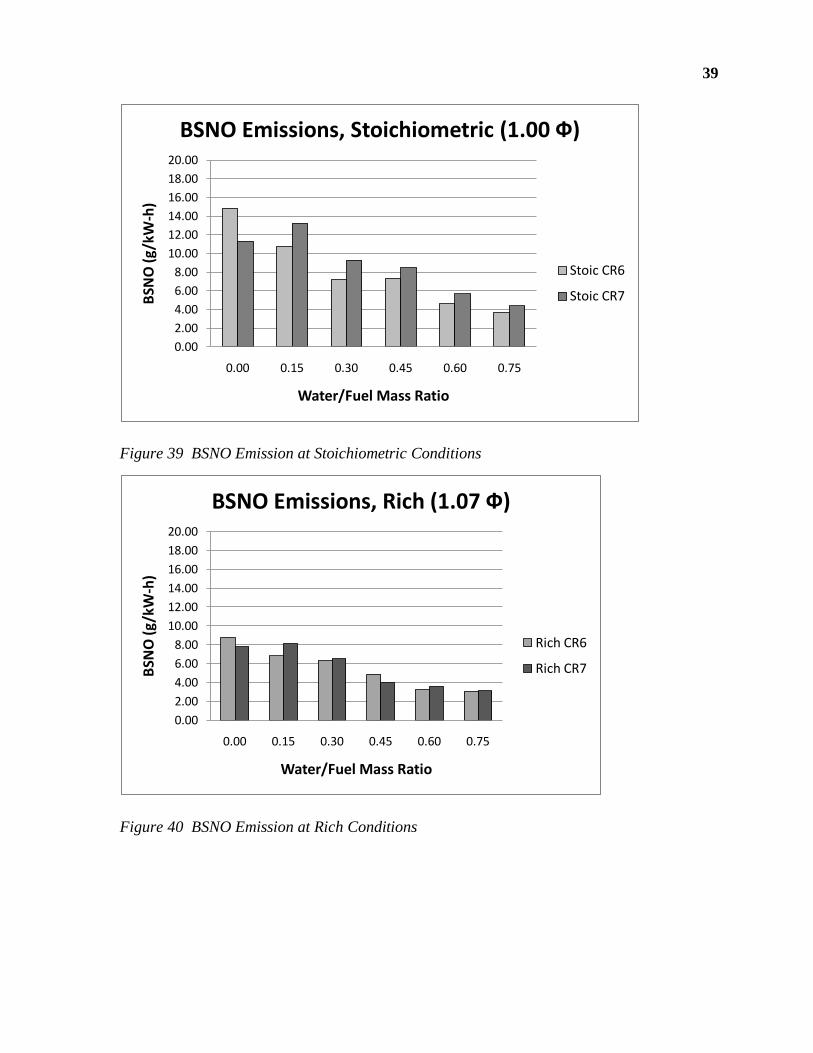
3.4 BSNO Emissions
Brake specific nitric oxide (BSNO) emissions at lean, stoichiometric and rich
operating conditions tend to decrease as water is increased. This is to be expected since the
temperature is reduced.
An increase in compression ratio without water injection tends to lower the level of
BSNO. With water injection (WFR of 0.15 or above) an increase in compression ratio tends
to lower the BSNO output. On the whole an increase in compression ratio in combination
with water injection tends to lower BSNO. Standard deviations of the NO data were on the
0100200300400500600700800900
1000
0.00 CR6
0.15 CR6
0.30 CR6
0.45 CR6
0.60 CR6
0.75 CR6
0.00 CR7
0.15 CR7
0.30 CR7
0.45 CR7
0.60 CR7
0.75 CR7
Tem
per
atu
re (
K)
Water/Fuel Mass Ratio
Exhaust Temperature
Lean
Stoic
Rich
38
same order of magnitude as the error of the emission analyzer. Note that the reported
emissions are without a catalytic converter. BSNO was calculated from ppmvol NO and
power (see Appendixes A and D). Calculating the error for BSNO was not feasible.
However, one may view the error of ppmvol NO (Appendix B) and the error of the torque
(subsection 3.1).
The maximum improvement (when changing both WFR and CR) was seen at lean
operation, changing from 0 WFR and CR6 to 0.75 WFR and CR7 lowered BSNO by 78%.
Figure 38 BSNO Emission at Lean Conditions
0.00
2.00
4.00
6.00
8.00
10.00
12.00
14.00
16.00
18.00
20.00
0.00 0.15 0.30 0.45 0.60 0.75
BSN
O (
g/kW
-h)
Water/Fuel Mass Ratio
BSNO Emissions, Lean (0.94 Ф)
Lean CR6
Lean CR7
39
Figure 39 BSNO Emission at Stoichiometric Conditions
Figure 40 BSNO Emission at Rich Conditions
0.00
2.00
4.00
6.00
8.00
10.00
12.00
14.00
16.00
18.00
20.00
0.00 0.15 0.30 0.45 0.60 0.75
BSN
O (
g/kW
-h)
Water/Fuel Mass Ratio
BSNO Emissions, Stoichiometric (1.00 Ф)
Stoic CR6
Stoic CR7
0.00
2.00
4.00
6.00
8.00
10.00
12.00
14.00
16.00
18.00
20.00
0.00 0.15 0.30 0.45 0.60 0.75
BSN
O (
g/kW
-h)
Water/Fuel Mass Ratio
BSNO Emissions, Rich (1.07 Ф)
Rich CR6
Rich CR7
40
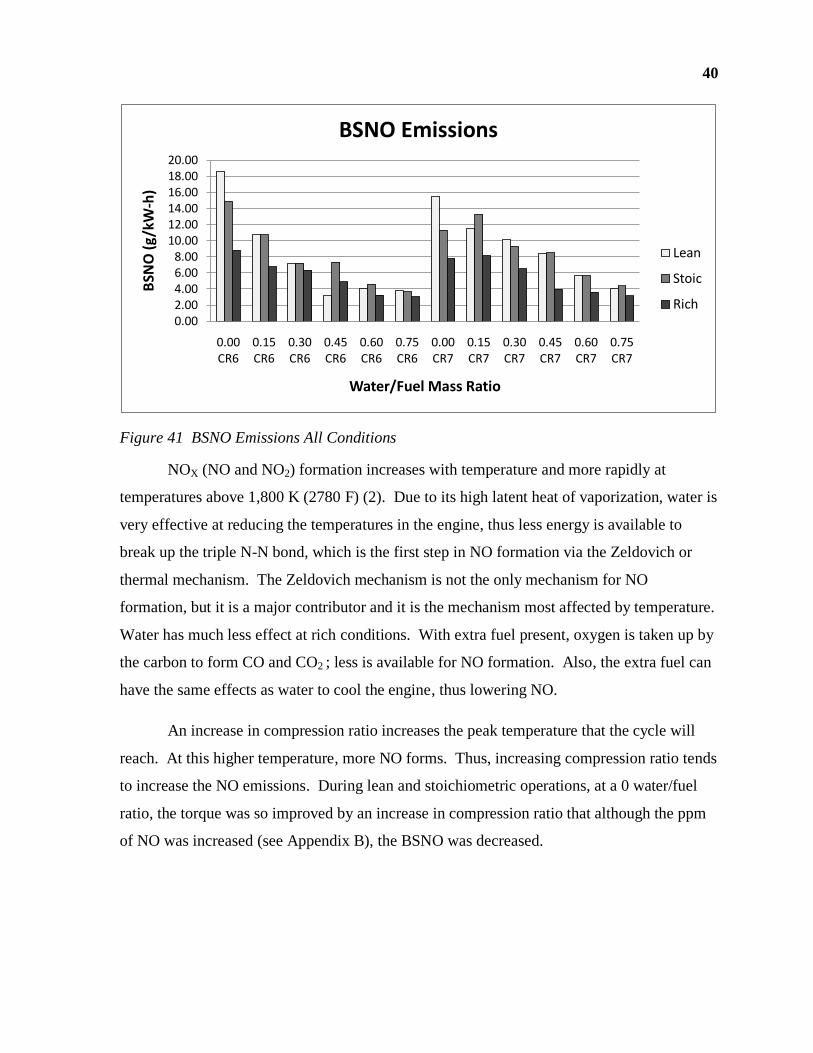
Figure 41 BSNO Emissions All Conditions
NOX (NO and NO2) formation increases with temperature and more rapidly at
temperatures above 1,800 K (2780 F) (2). Due to its high latent heat of vaporization, water is
very effective at reducing the temperatures in the engine, thus less energy is available to
break up the triple N-N bond, which is the first step in NO formation via the Zeldovich or
thermal mechanism. The Zeldovich mechanism is not the only mechanism for NO
formation, but it is a major contributor and it is the mechanism most affected by temperature.
Water has much less effect at rich conditions. With extra fuel present, oxygen is taken up by
the carbon to form CO and CO2 ; less is available for NO formation. Also, the extra fuel can
have the same effects as water to cool the engine, thus lowering NO.
An increase in compression ratio increases the peak temperature that the cycle will
reach. At this higher temperature, more NO forms. Thus, increasing compression ratio tends
to increase the NO emissions. During lean and stoichiometric operations, at a 0 water/fuel
ratio, the torque was so improved by an increase in compression ratio that although the ppm
of NO was increased (see Appendix B), the BSNO was decreased.
0.002.004.006.008.00
10.0012.0014.0016.0018.0020.00
0.00 CR6
0.15 CR6
0.30 CR6
0.45 CR6
0.60 CR6
0.75 CR6
0.00 CR7
0.15 CR7
0.30 CR7
0.45 CR7
0.60 CR7
0.75 CR7
BSN
O (
g/k
W-h
)
Water/Fuel Mass Ratio
BSNO Emissions
Lean
Stoic
Rich
41
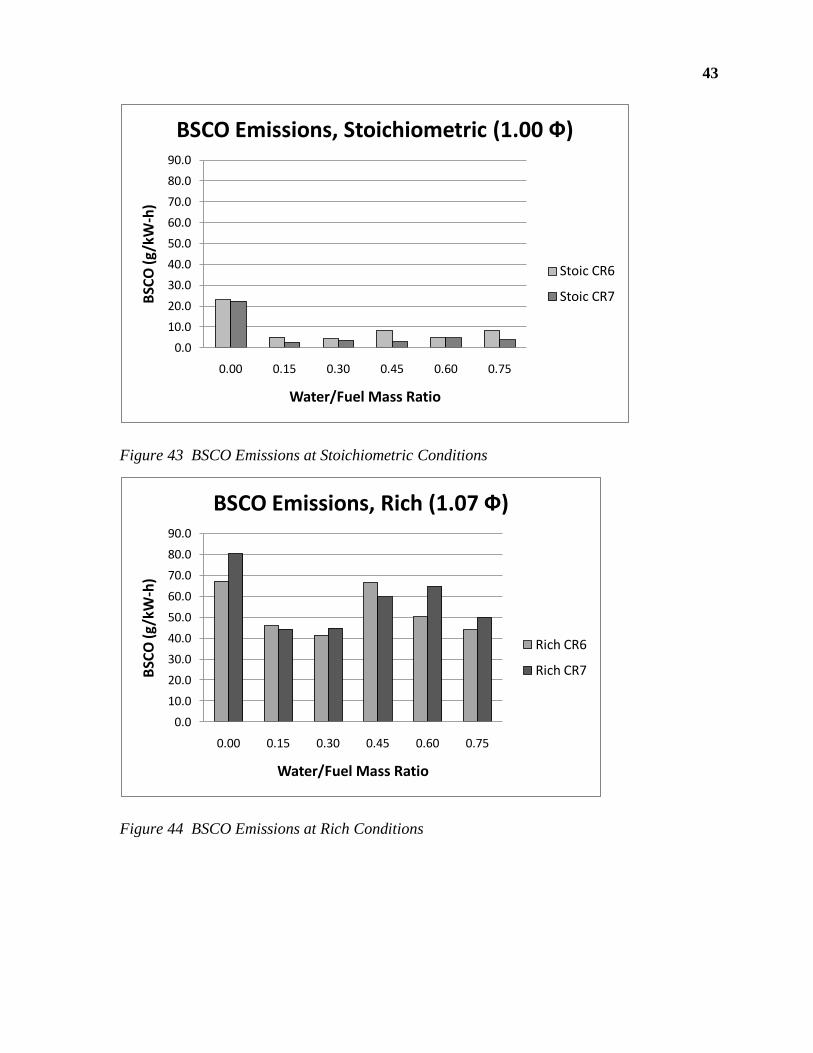
3.5 BSCO Emissions
At rich operating conditions an increase in water from 0 WFR to 0.30 WFR can be
effective at lowering brake specific carbon monoxide (BSCO) emissions. This agrees with
previous research (3, 4, 6, 9). Further increases in WFR at rich operation seem not to
improve BSCO. Higher compression ratios may tend to increase percent CO emissions, at
least at rich conditions where CO is more prevalent (see Figure 56 %CO Emissions at Rich
Conditions in Appendix B). However, the increased torque that comes with increased
compression ratio often offsets the increase in percent CO for a smaller effect on BSCO.
Water injection in combination with increased compression ratio can lower BSCO emissions.
CO is much more prevalent at rich conditions because there is not enough oxygen for
complete oxidation of the fuel to form CO2.
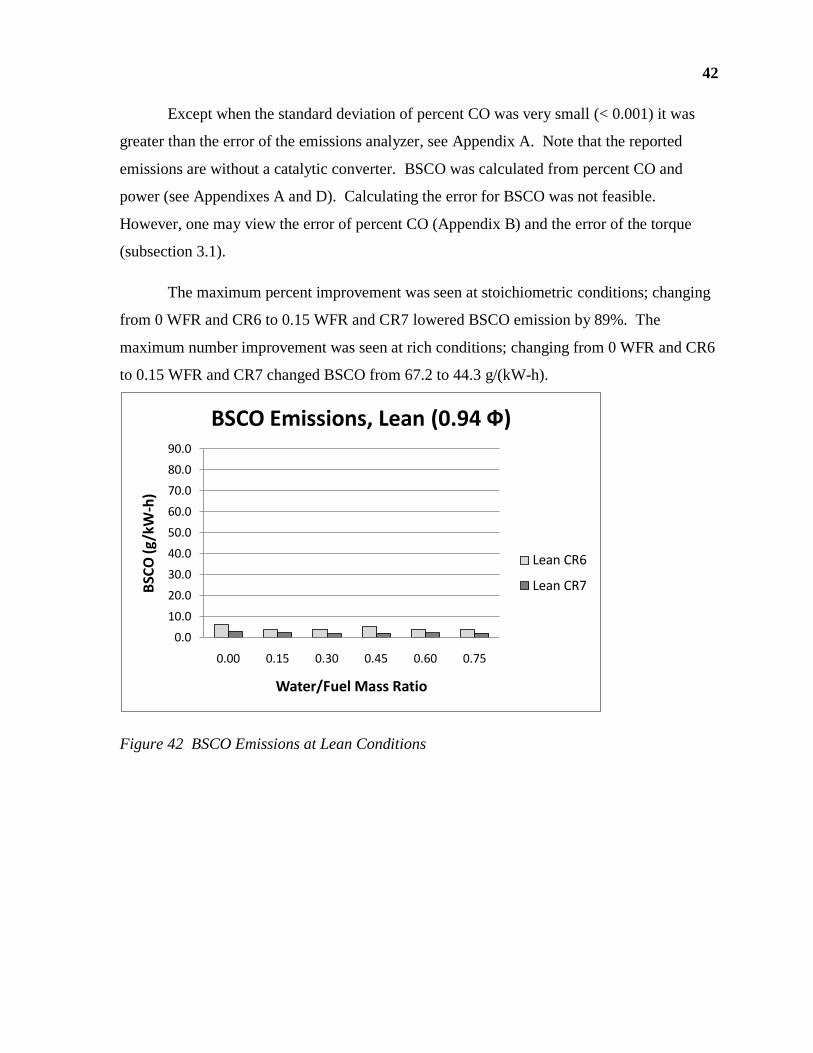
At stoichiometric conditions increasing water from 0 WFR to 0.15 WFR can also
lower BSCO emissions, but further increases tend not to improve BSCO emissions. Increased
compression ratio may have only a small effect BSCO emissions at stoichiometric.
However, this in not conclusive. To know for sure the effect of increased compression ratio
on CO a more precise method of tuning AFR would be needed, since CO levels are very
sensitive to AFR. As can be seen in Appendix A the AFR is not exact between compression
ratios.
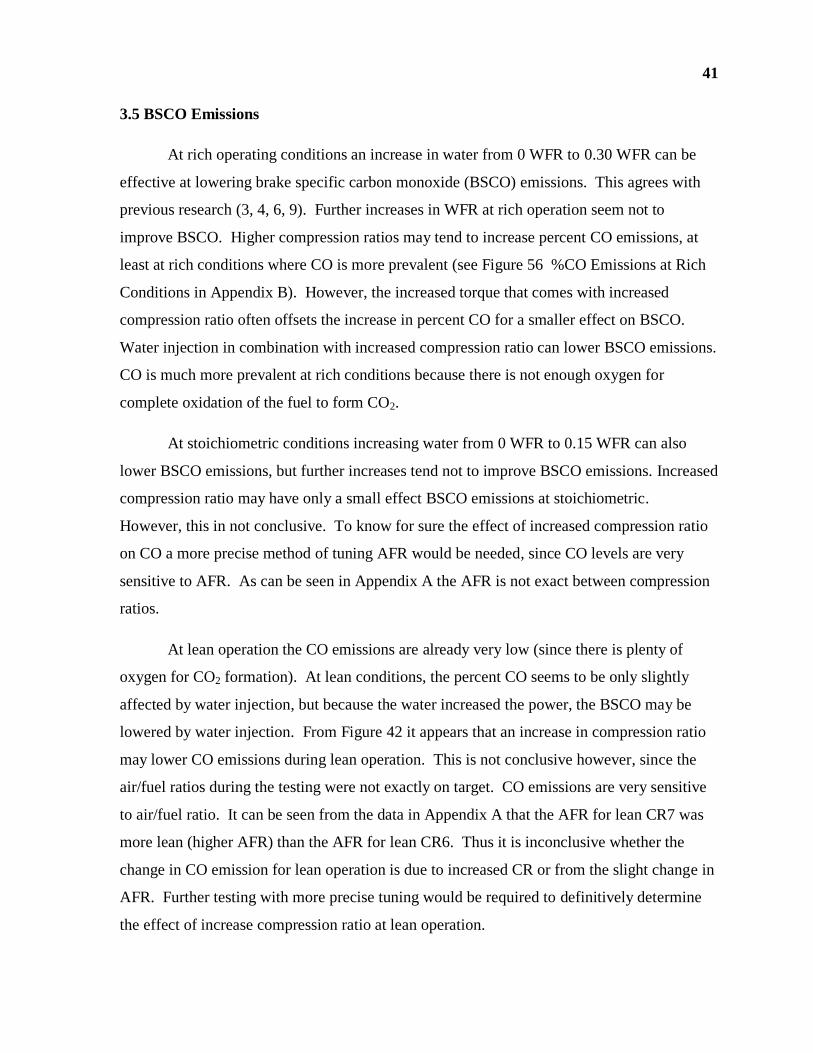
At lean operation the CO emissions are already very low (since there is plenty of
oxygen for CO2 formation). At lean conditions, the percent CO seems to be only slightly
affected by water injection, but because the water increased the power, the BSCO may be
lowered by water injection. From Figure 42 it appears that an increase in compression ratio
may lower CO emissions during lean operation. This is not conclusive however, since the
air/fuel ratios during the testing were not exactly on target. CO emissions are very sensitive
to air/fuel ratio. It can be seen from the data in Appendix A that the AFR for lean CR7 was
more lean (higher AFR) than the AFR for lean CR6. Thus it is inconclusive whether the
change in CO emission for lean operation is due to increased CR or from the slight change in
AFR. Further testing with more precise tuning would be required to definitively determine
the effect of increase compression ratio at lean operation.
42
Except when the standard deviation of percent CO was very small (< 0.001) it was
greater than the error of the emissions analyzer, see Appendix A. Note that the reported
emissions are without a catalytic converter. BSCO was calculated from percent CO and
power (see Appendixes A and D). Calculating the error for BSCO was not feasible.
However, one may view the error of percent CO (Appendix B) and the error of the torque
(subsection 3.1).
The maximum percent improvement was seen at stoichiometric conditions; changing
from 0 WFR and CR6 to 0.15 WFR and CR7 lowered BSCO emission by 89%. The
maximum number improvement was seen at rich conditions; changing from 0 WFR and CR6
to 0.15 WFR and CR7 changed BSCO from 67.2 to 44.3 g/(kW-h).
Figure 42 BSCO Emissions at Lean Conditions
0.0
10.0
20.0
30.0
40.0
50.0
60.0
70.0
80.0
90.0
0.00 0.15 0.30 0.45 0.60 0.75
BSC
O (g
/kW
-h)
Water/Fuel Mass Ratio
BSCO Emissions, Lean (0.94 Ф)
Lean CR6
Lean CR7
43
Figure 43 BSCO Emissions at Stoichiometric Conditions
Figure 44 BSCO Emissions at Rich Conditions
0.0
10.0
20.0
30.0
40.0
50.0
60.0
70.0
80.0
90.0
0.00 0.15 0.30 0.45 0.60 0.75
BSC
O (g
/kW
-h)
Water/Fuel Mass Ratio
BSCO Emissions, Stoichiometric (1.00 Ф)
Stoic CR6
Stoic CR7
0.0
10.0
20.0
30.0
40.0
50.0
60.0
70.0
80.0
90.0
0.00 0.15 0.30 0.45 0.60 0.75
BSC
O (g
/kW
-h)
Water/Fuel Mass Ratio
BSCO Emissions, Rich (1.07 Ф)
Rich CR6
Rich CR7
44
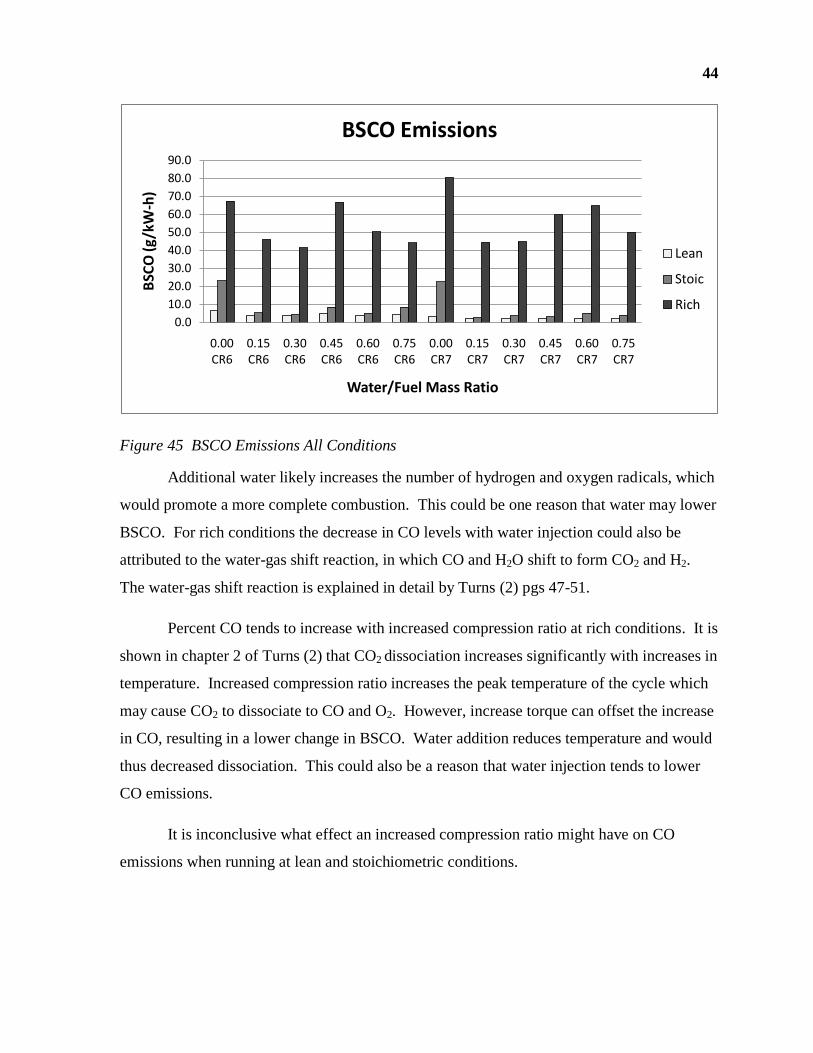
Figure 45 BSCO Emissions All Conditions
Additional water likely increases the number of hydrogen and oxygen radicals, which
would promote a more complete combustion. This could be one reason that water may lower
BSCO. For rich conditions the decrease in CO levels with water injection could also be
attributed to the water-gas shift reaction, in which CO and H2O shift to form CO2 and H2.
The water-gas shift reaction is explained in detail by Turns (2) pgs 47-51.
Percent CO tends to increase with increased compression ratio at rich conditions. It is
shown in chapter 2 of Turns (2) that CO2 dissociation increases significantly with increases in
temperature. Increased compression ratio increases the peak temperature of the cycle which
may cause CO2 to dissociate to CO and O2. However, increase torque can offset the increase
in CO, resulting in a lower change in BSCO. Water addition reduces temperature and would
thus decreased dissociation. This could also be a reason that water injection tends to lower
CO emissions.
It is inconclusive what effect an increased compression ratio might have on CO
emissions when running at lean and stoichiometric conditions.
0.0
10.0
20.0
30.0
40.0
50.0
60.0
70.0
80.0
90.0
0.00 CR6
0.15 CR6
0.30 CR6
0.45 CR6
0.60 CR6
0.75 CR6
0.00 CR7
0.15 CR7
0.30 CR7
0.45 CR7
0.60 CR7
0.75 CR7
BSC
O (g
/kW
-h)
Water/Fuel Mass Ratio
BSCO Emissions
Lean
Stoic
Rich
45
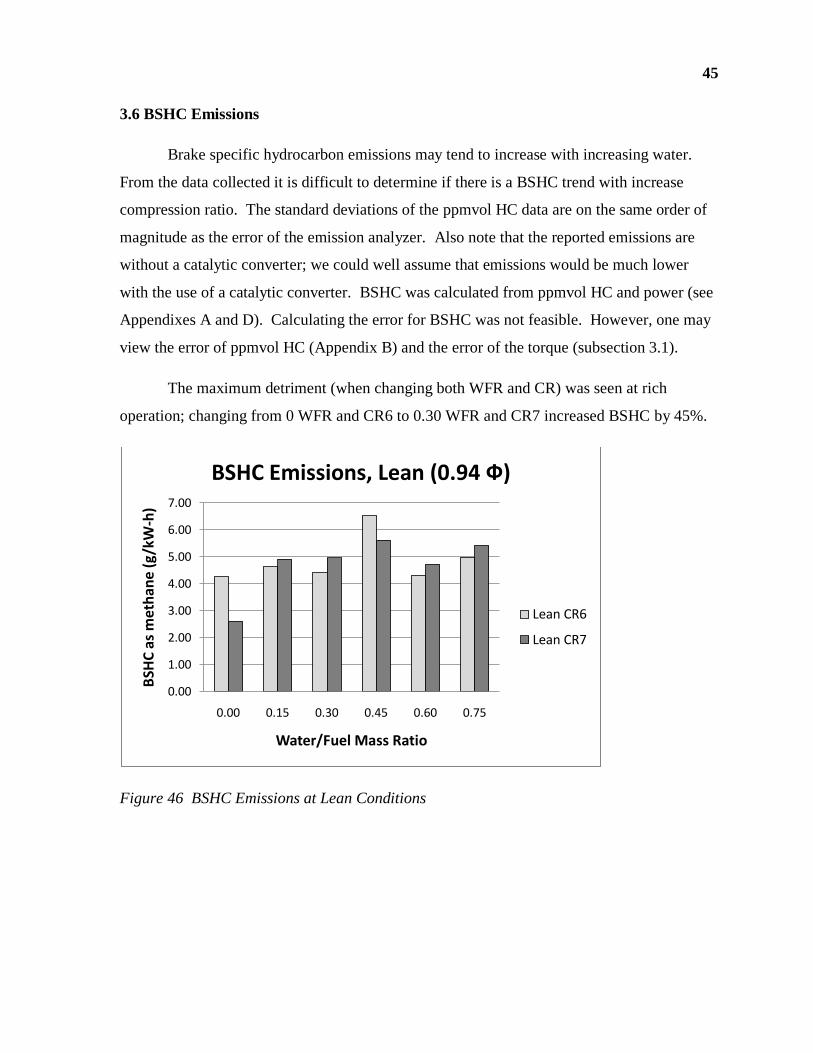
3.6 BSHC Emissions
Brake specific hydrocarbon emissions may tend to increase with increasing water.
From the data collected it is difficult to determine if there is a BSHC trend with increase
compression ratio. The standard deviations of the ppmvol HC data are on the same order of
magnitude as the error of the emission analyzer. Also note that the reported emissions are
without a catalytic converter; we could well assume that emissions would be much lower
with the use of a catalytic converter. BSHC was calculated from ppmvol HC and power (see
Appendixes A and D). Calculating the error for BSHC was not feasible. However, one may
view the error of ppmvol HC (Appendix B) and the error of the torque (subsection 3.1).
The maximum detriment (when changing both WFR and CR) was seen at rich
operation; changing from 0 WFR and CR6 to 0.30 WFR and CR7 increased BSHC by 45%.
Figure 46 BSHC Emissions at Lean Conditions
0.00
1.00
2.00
3.00
4.00
5.00
6.00
7.00
0.00 0.15 0.30 0.45 0.60 0.75
BSH
C a
s m
eth
ane
(g/k
W-h
)
Water/Fuel Mass Ratio
BSHC Emissions, Lean (0.94 Ф)
Lean CR6
Lean CR7
46
Figure 47 BSHC Emissions at Stoichiometric Conditions
Figure 48 BSHC Emissions at Rich Conditions
0.00
1.00
2.00
3.00
4.00
5.00
6.00
7.00
0.00 0.15 0.30 0.45 0.60 0.75
BSH
C m
eth
an
e (
g/k
W-h
)
Water/Fuel Mass Ratio
BSHC Emissions, Stoichiometric (1.00 Ф)
Stoic CR6
Stoic CR7
0.00
1.00
2.00
3.00
4.00
5.00
6.00
7.00
0.00 0.15 0.30 0.45 0.60 0.75
BSH
C m
eth
ane
(g/k
W-h
)
Water/Fuel Mass Ratio
BSHC Emissions, Rich (1.07 Ф)
Rich CR6
Rich CR7
47
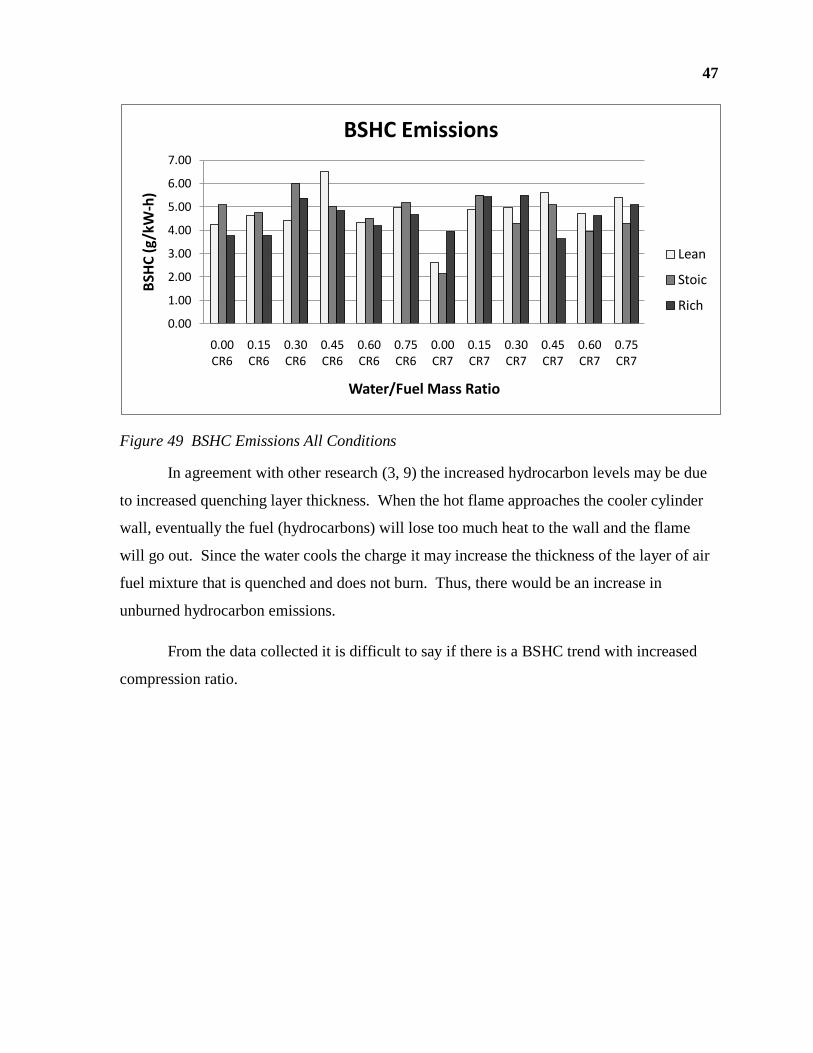
Figure 49 BSHC Emissions All Conditions
In agreement with other research (3, 9) the increased hydrocarbon levels may be due
to increased quenching layer thickness. When the hot flame approaches the cooler cylinder
wall, eventually the fuel (hydrocarbons) will lose too much heat to the wall and the flame
will go out. Since the water cools the charge it may increase the thickness of the layer of air
fuel mixture that is quenched and does not burn. Thus, there would be an increase in
unburned hydrocarbon emissions.
From the data collected it is difficult to say if there is a BSHC trend with increased
compression ratio.
0.00
1.00
2.00
3.00
4.00
5.00
6.00
7.00
0.00 CR6
0.15 CR6
0.30 CR6
0.45 CR6
0.60 CR6
0.75 CR6
0.00 CR7
0.15 CR7
0.30 CR7
0.45 CR7
0.60 CR7
0.75 CR7
BSH
C (
g/kW
-h)
Water/Fuel Mass Ratio
BSHC Emissions
Lean
Stoic
Rich
48
4.0 Conclusions
The purpose of the present study was to show the trends of multiple important effects
of water injection in combination with an increased compression ratio in a gasoline SI
engine. The engine was modified to have manifold fuel injection and manifold water
injection. Water/fuel mass ratio was varied between 0 and 0.75 . Compression ratio was
varied from 6:1 to 7:1. Testing was done at three air/fuel ratios. Based on the experimental
data it is concluded that water injection may:
Increase the torque and power output of the engine
Decrease brake specific fuel consumption and thus improve efficiency
Reduce exhaust temperature of the engine
Lower NO emissions
Lower CO emissions, at rich and stoichiometric conditions
Increase HC emissions
It is also concluded that increasing the compression ratio may:
Increase the torque and power output of the engine
Decrease brake specific fuel consumption and thus improve efficiency
Reduce exhaust temperature of the engine
Increase NO emissions
Increase CO emissions, at rich conditions
Have an inconclusive effect on HC emissions
Furthermore it is concluded that water injection in combination with an increase in
compression ratio may result in the follow benefits:
Increase in the torque (and power output) of the engine, (up to 65%)
49
Decrease in brake specific fuel consumption (up to 39%) and thus improve efficiency
Reduction of exhaust temperature of the engine (up to 10%)
Lower NO emissions (up to 78%)
Lower CO emissions, at rich and stoichiometric conditions (up to 89%)
However, there is also a detriment to water addition in combination with an increase in
compression ratio:
Increase in HC emissions (up to 45%)
It is concluded that water injection in combination with an increase in compression ratio
may represents a means to significantly improve the torque, decrease BSFC, reduce
temperature, lower NO and CO emissions, while increasing HC emissions. Note that
emissions are prior to a catalytic converter. Naturally, in order to gain the greatest benefit of
water injection with an increase in compression ratio, the engine would require some fine
tuning. For a mobile use of this engine, it is recommended to use a 0.15 WFR and a 7:1
compression ratio and lean operating conditions. This amount of water would not
significantly increase the mass of the vehicle, but provides significant improvement in torque
and BSFC, less NO, already low CO and marginal increase in HC. Fine tuning would allow
for the overall benefit of water injection with an increase in compression ratio to be
maximized.
50
5.0 Future Work
Various experiments could be done to further our knowledge of water injection with
increased compression ratios. Potential future work might include the following, prioritize
with suggestions considered more important listed last.
1. If the same type of ECU is used in future research, note that cutting power or interrupting
the ECU while maps or other settings are being burned or fetched to it may cause the
ECU to be corrupted. Also, stop the engine when burning settings. If the ECU is
receiving a trigger signal when it is turned on it may not work. Power should be turned
off when removing ECU. If the spark plug is removed from the engine it must be
grounded. All grounds should be connected to a common ground. Suggestions received
from MBE Motorsports Inc.
2. Test water addition on a more stable setup. It should also be noted for future research-
that a better combination of engine and dynamometer should be sought. In the present
study the engine was somewhat small for the size of the dynamometer. The
dynamometer had difficulty holding the small engine at a constant speed. A small
change in the load setting of the dynamometer caused a larger change in engine speed. In
this case a larger engine or a smaller dynamometer would have been preferred.
3. Measure in-cylinder pressure traces with water addition and multiple compression ratios.
This would help verify the torque and efficiency benefits of water addition with varied
compression ratios.
4. Calculate the in-cylinder temperature with water addition and an increase in compression
ratio to see the size of the effect that reduced temperatures have on cycle efficiency.
5. Tune spark timing for maximum brake torque, along with water addition and increased
compression ratio.
6. Vary methods of water injection: direct injection vs. manifold injection.
7. Research emissions with water injection and increased CR before and after a catalytic
converter.
51
8. Perform similar research using a more modern four stroke engine.
9. Perform similar research for a two-stroke engine.
10. Researching the feasibility of condensing steam in the exhaust for reuse in water
injection. Abundant amounts of water would be available since water is injected and a
major product of combustion is H2O. Recycling the water would be a great advantage for
automotive applications since the consumer would not have to remember to fill up with
water, the vehicle would not have to carry a water tank and what little water is carried
could be expelled if the vehicle is stored at freezing temperatures. However, water
condensed from exhaust may be acidic and precautions may need to be taken to prevent
corrosion.
11. Increasing compression ratio further to find the knock limited compression ratio at
various water/fuel ratios, then testing the effects at the knock limited compression ratios.
Finding the knock limited compression ratios will allow the power and efficiency benefits
of water addition to be maximized.
52
References
1. Stone, Richard. Introduction to Internal Combustion Engines. Warrendale, PA : Society
of Automotive Engineers, Inc., 1999. ISBN 0-7680-0495-0.
2. Turns, Stephen R. An Introduction to Combustion. New York, NY : McGraw Hill, Inc.,
2000. ISBN 978-0-07-230096-3.
3. Water-Gasoline Fuels - Their Effect on Spark Igntion Engine Emissions and Performance.
Peters, Bruce D. and Stebar, Russel F. 1976. Trans. SAE 760547.
4. Performance of Gasoline-Water Fuel in a Modified SI Engine. Tsao, K. C. and Wang, C.
L. 1984. SAE Paper 841399.
5. Inlet Manifold Water Injection for Control of Nitrogen Oxides - Theory and Experiment.
Nicholls, J. E., El-Messiri, I. A. and Newhall, H. K. 1969. SAE Paper 690018.
6. Water Injection Effects In A Single-Cylinder CFR Engine. Lanzafame, R. 1999. SAE
Paper 1999-01-0568.
7. Water Addition to Gasoline - Effect on Combustion, Emissions, Performance and Knock.
Harrington, J. A. 1982. SAE Paper 820314.
8. Water Injection in IC - SI Engines to Control Detonation and to Reduce Pollutant
Emissions. Brusca, S. and Lanzafame, R. s.l. : SAE Paper No. 2003-01-1912, 2003.
9. Performance and Emissions of Motorcycle Engines Using Water-Fuel Emulsions. Wu,
Yuh-Yih, et al. 1-3, s.l. : International Journal of Vehicle Design, 2009, Vol. 49, pp. 91-110.
OCLC#: 5882271.
10. Emissions from a Direct-Cylinder Water-Injected Spark-Ignition Engine. Lestz, S. S.,
Meyer, W. E. and Colony, C. M. 1972. SAE Paper No. 720113.
11. Water Induction Studies in a Military Spark Ignition Engine. Moffitt, J. V. and Lestz, S.
J. San Antonio, Texas : U. S. Army Fuels and Lubricants Research Laboratory, Southwest
Reseach Research Institute, 1974. Interim Report AFLRL No. 46.
53
12. Analysis of Water Injection into High-Temperature Mixtures of Combustion Products in
a Cylinder of Spark Ignition Engine. Juntarakod, Paramust. s.l. : Master's Thesis, King
Mongkut's University of Technology North Bangkok, 2008.
13. Total Cooling of Piston Engines by Direct Water Injection. Weatherford, Jr., W. D. and
Quillian, Jr., R. D. 1970. SAE Paper 700886.
14. Engine Cooling by Direct Injection of Cooling Water. Modak, A. and Carretto, L. S.
1970. SAE Paper 700887.
15. Water Addition to Practical Combustion Systems - Concepts and Applications. Dryer, F.
L. s.l. : 16th Symposium on Combustion, 1976, pp. 279 - 295.
16. Water Injection into Internal Combustion Engines. Kettleborough, C. F. and Milkins,
E. E. 8, s.l. : Commonweath Engineer, 1955, Vol. 42, pp. 303-308.
17. Briggs and Stratton Corp. Operating and Maintenance Instructions Sno/Gard Models
221400 to 222499 252400 to 252499. Milwaukee, Wisconsin : s.n. Form No. 271074-2/82.
18. Briggs and Stratton Answer Center. Aug 31, 2010.
19. Munson, Bruce R., Young, Donald F. and Okiishi, Theodore H. Fundamentals of
Fluid Mechanics, Fifth Edition. Hoboken, NJ : John Wiley & Sons, Inc., 2006. ISBN 978-0-
471-67582-2.
20. Cengel, Yunus A. and Boles, Michael A. Thermodynamics: An Engineering Approach,
Sixth Edition. New York, NY : McGraw-Hill, 2008. ISBN 978-0-07-352921-9.
21. Cordon, D., Exploring the Operating Limits and Performance of Catalytic Ignition with
Aqueous Ethanol and Heavy Fuels. Cordon, Dissertation, University of Idaho, 2010
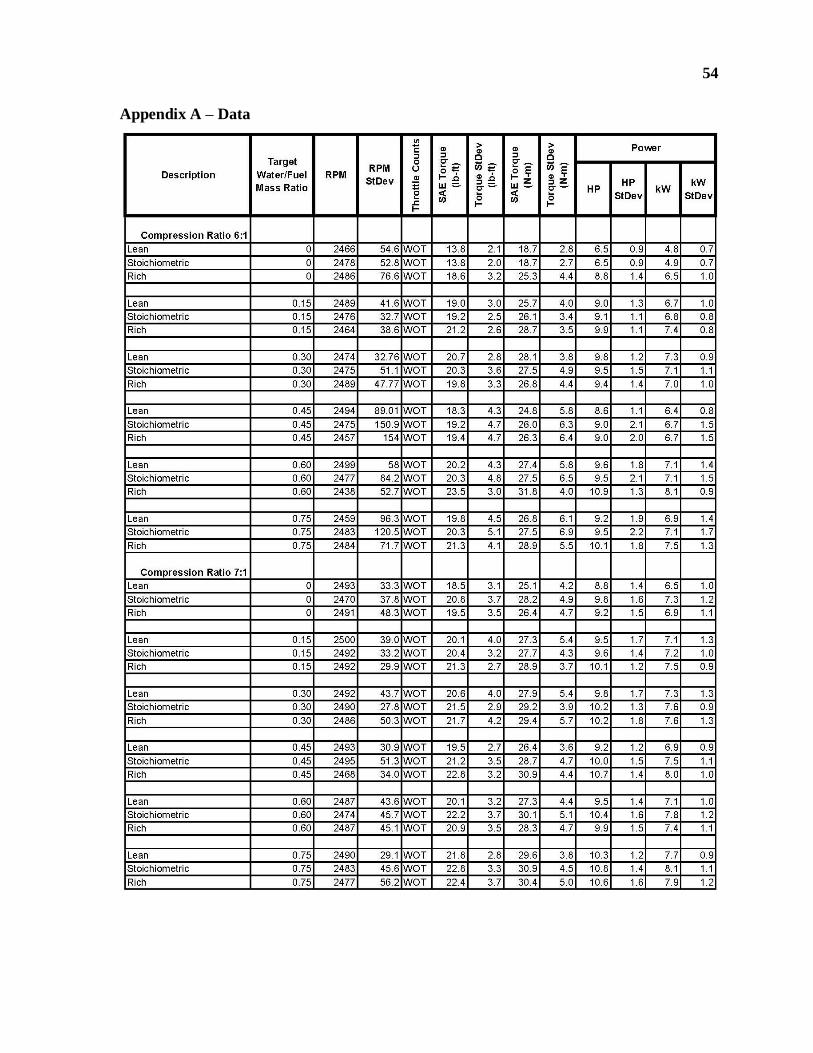
54
Appendix A – Data
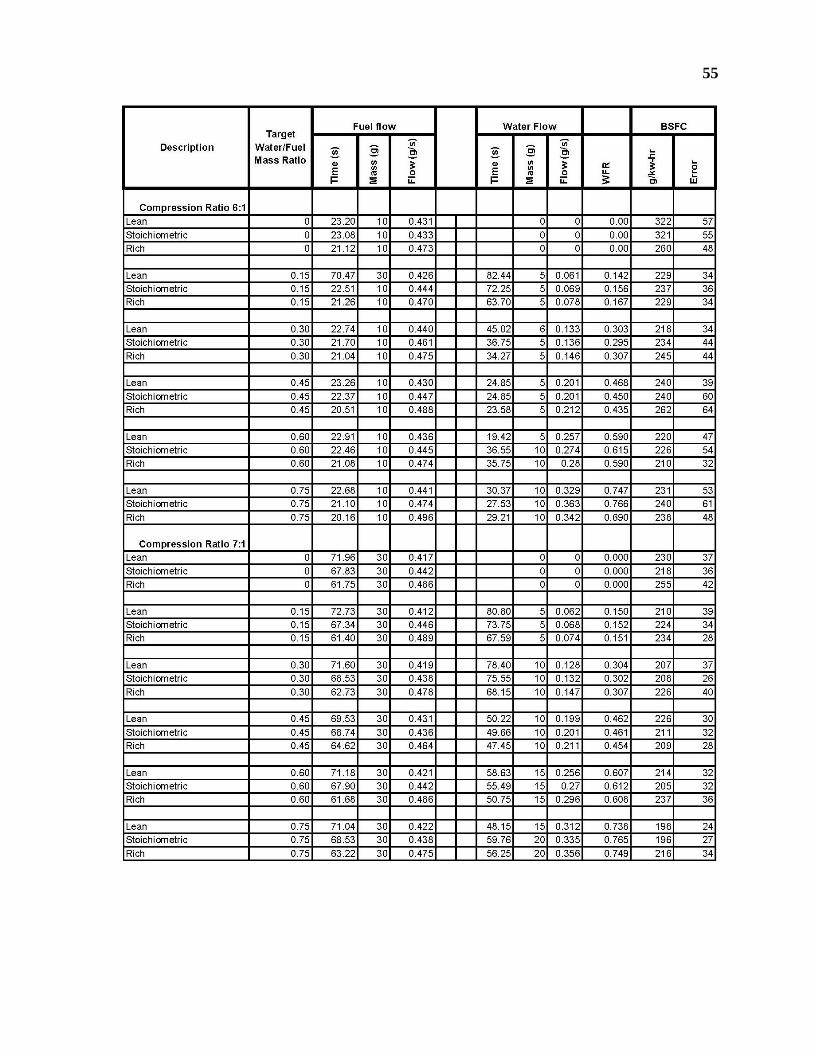
55
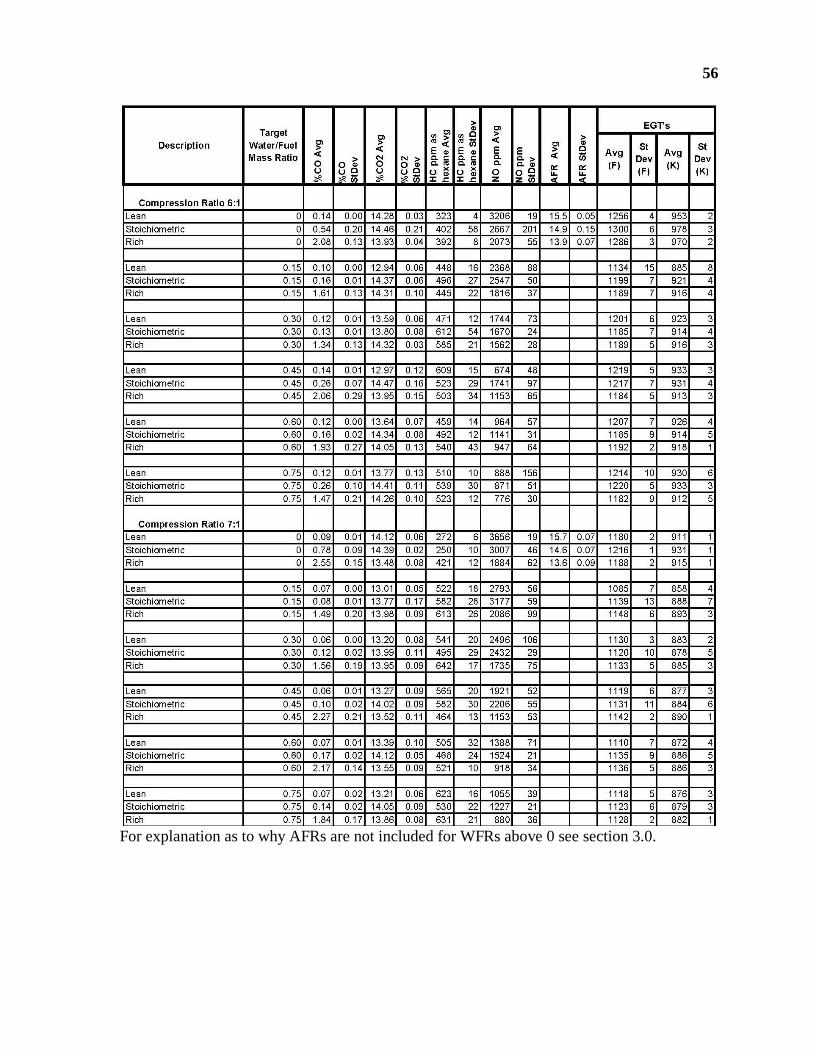
56
For explanation as to why AFRs are not included for WFRs above 0 see section 3.0.
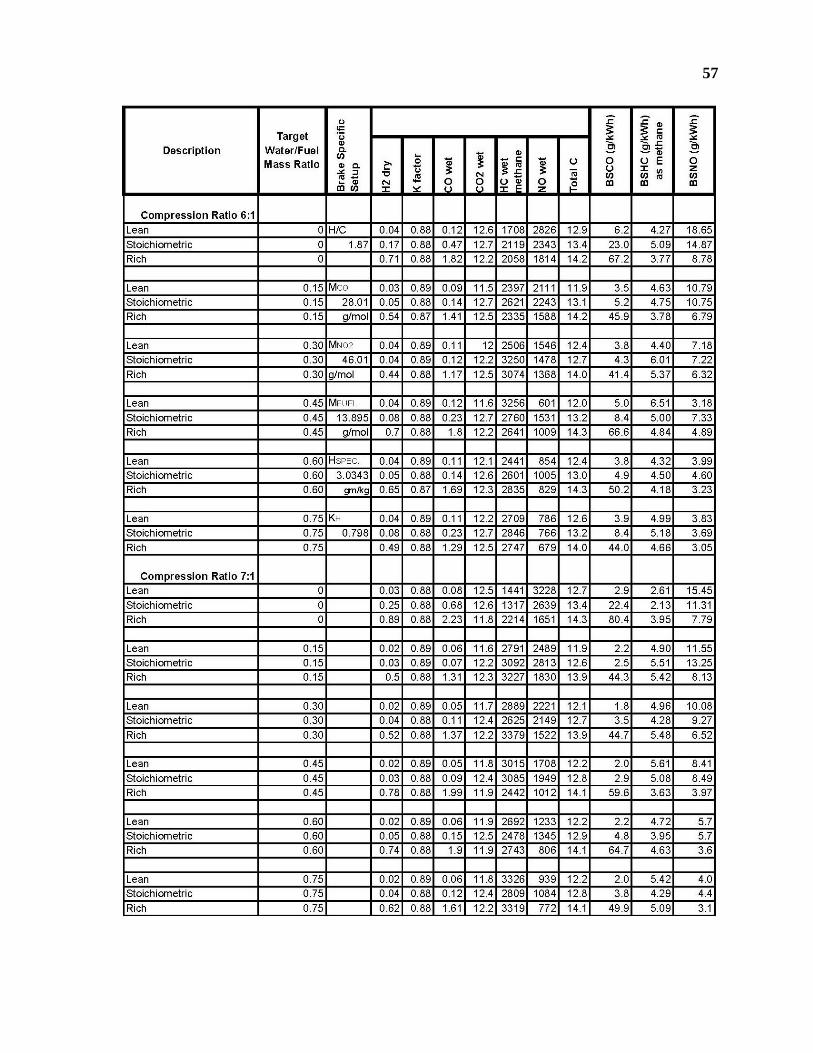
57
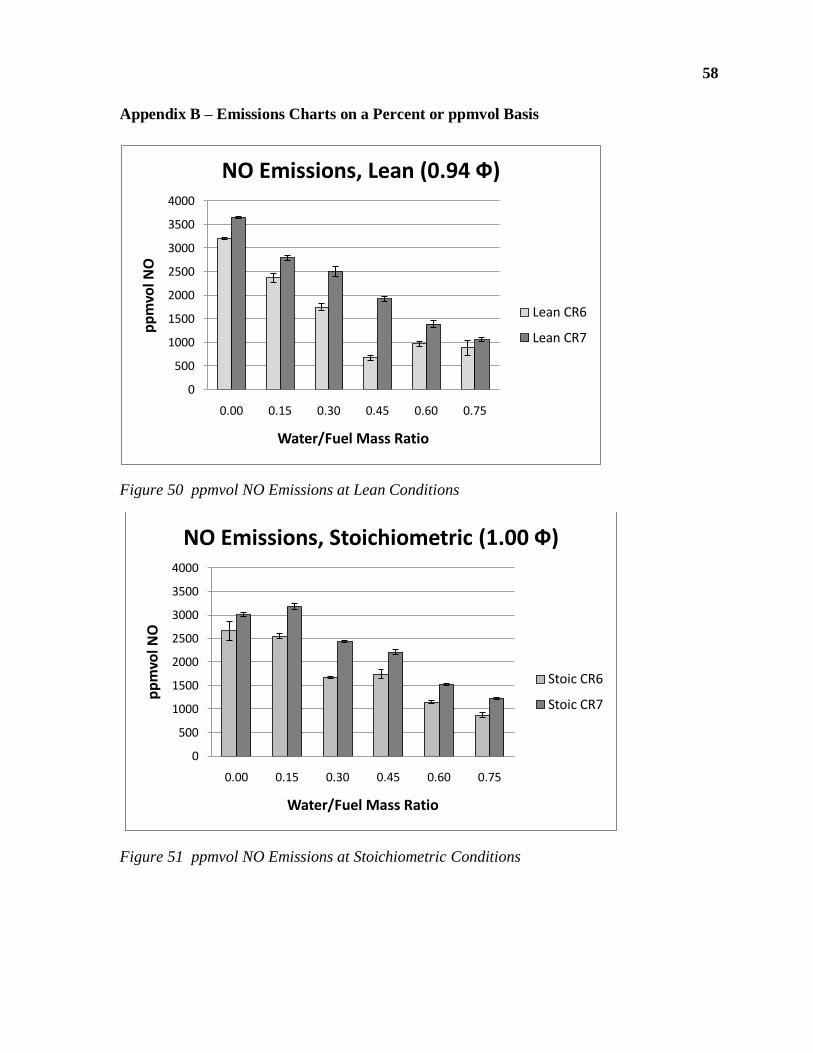
58
Appendix B – Emissions Charts on a Percent or ppmvol Basis
Figure 50 ppmvol NO Emissions at Lean Conditions
Figure 51 ppmvol NO Emissions at Stoichiometric Conditions
0
500
1000
1500
2000
2500
3000
3500
4000
0.00 0.15 0.30 0.45 0.60 0.75
pp
mvo
l NO
Water/Fuel Mass Ratio
NO Emissions, Lean (0.94 Ф)
Lean CR6
Lean CR7
0
500
1000
1500
2000
2500
3000
3500
4000
0.00 0.15 0.30 0.45 0.60 0.75
pp
mvo
l NO
Water/Fuel Mass Ratio
NO Emissions, Stoichiometric (1.00 Ф)
Stoic CR6
Stoic CR7
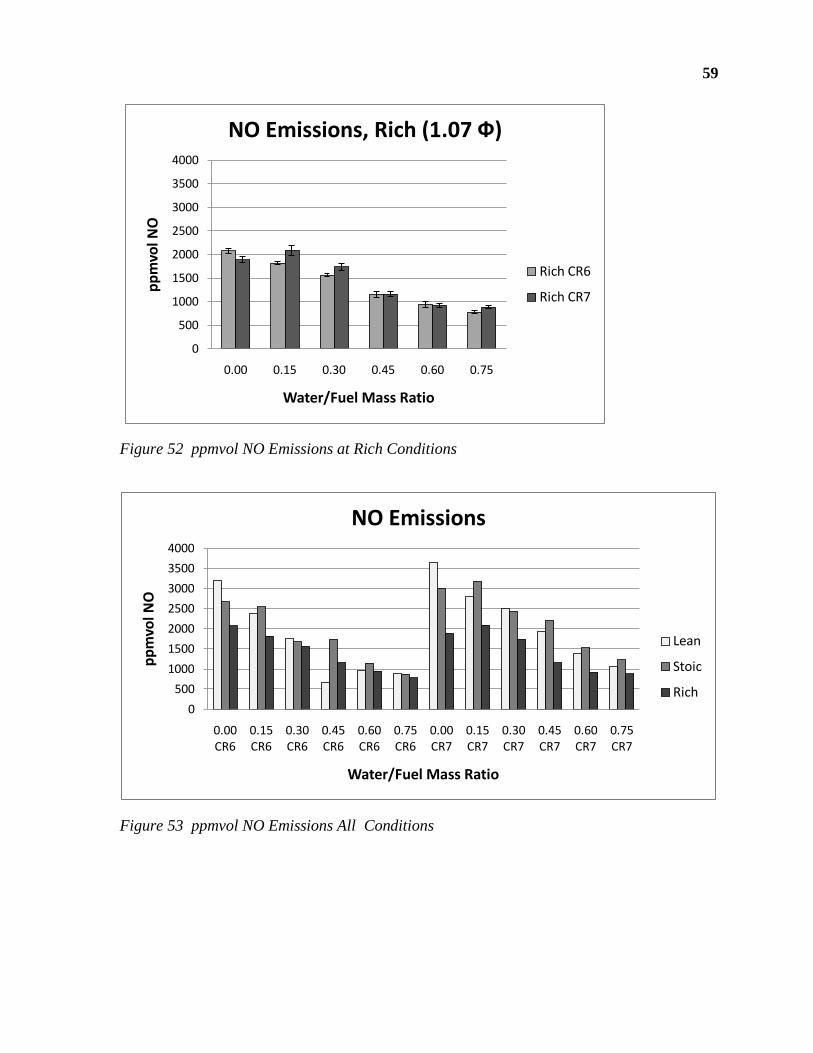
59
Figure 52 ppmvol NO Emissions at Rich Conditions
Figure 53 ppmvol NO Emissions All Conditions
0
500
1000
1500
2000
2500
3000
3500
4000
0.00 0.15 0.30 0.45 0.60 0.75
pp
mvo
l NO
Water/Fuel Mass Ratio
NO Emissions, Rich (1.07 Ф)
Rich CR6
Rich CR7
0
500
1000
1500
2000
2500
3000
3500
4000
0.00 CR6
0.15 CR6
0.30 CR6
0.45 CR6
0.60 CR6
0.75 CR6
0.00 CR7
0.15 CR7
0.30 CR7
0.45 CR7
0.60 CR7
0.75 CR7
pp
mvo
l NO
Water/Fuel Mass Ratio
NO Emissions
Lean
Stoic
Rich
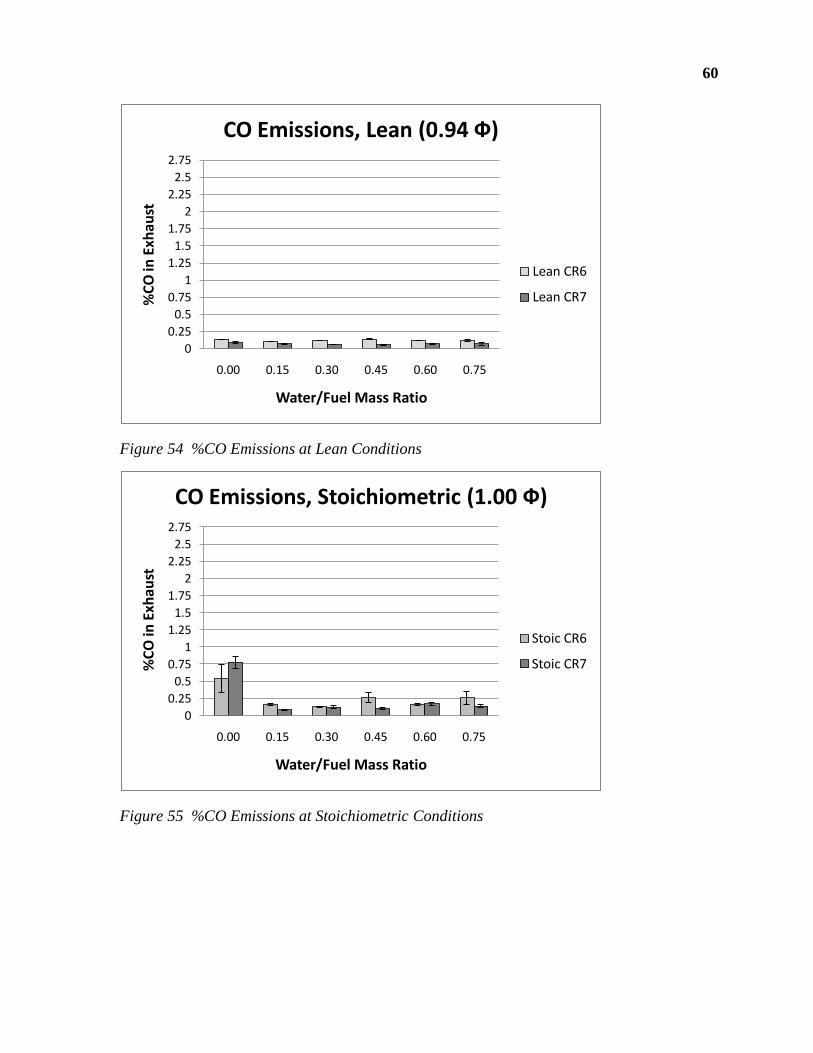
60
Figure 54 %CO Emissions at Lean Conditions
Figure 55 %CO Emissions at Stoichiometric Conditions
0
0.25
0.5
0.75
1
1.25
1.5
1.75
2
2.25
2.5
2.75
0.00 0.15 0.30 0.45 0.60 0.75
%C
O in
Exh
aust
Water/Fuel Mass Ratio
CO Emissions, Lean (0.94 Ф)
Lean CR6
Lean CR7
0
0.25
0.5
0.75
1
1.25
1.5
1.75
2
2.25
2.5
2.75
0.00 0.15 0.30 0.45 0.60 0.75
%C
O in
Exh
aust
Water/Fuel Mass Ratio
CO Emissions, Stoichiometric (1.00 Ф)
Stoic CR6
Stoic CR7
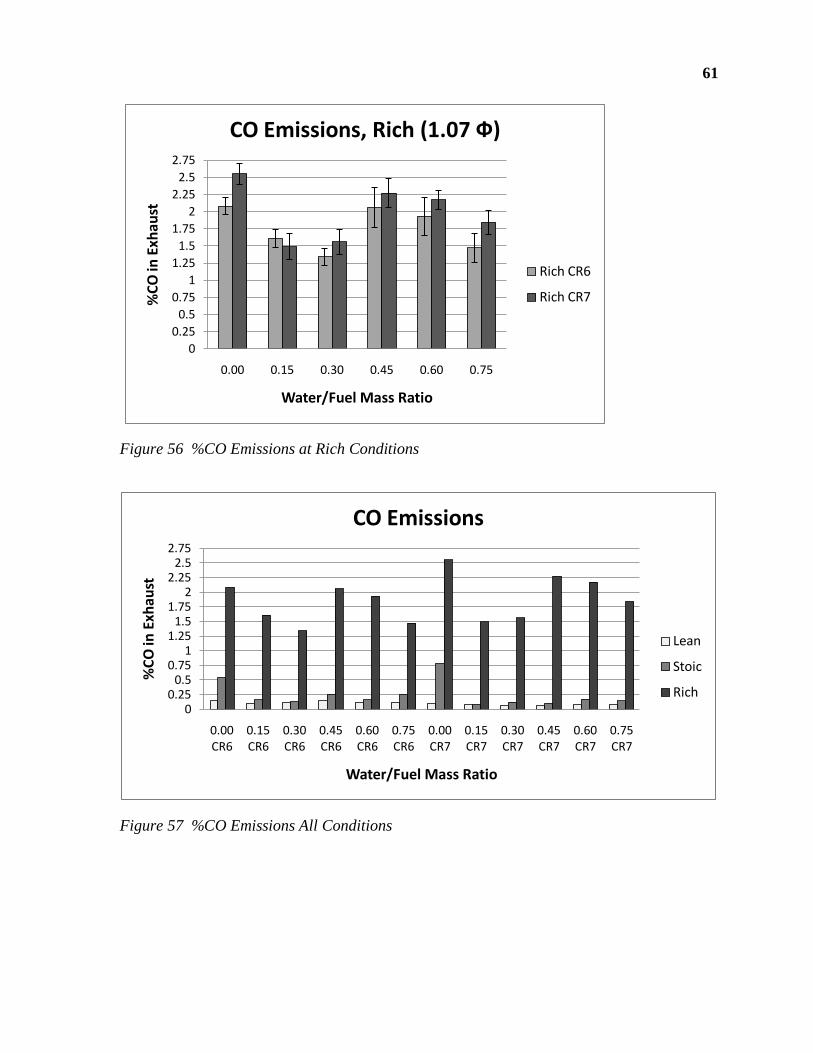
61
Figure 56 %CO Emissions at Rich Conditions
Figure 57 %CO Emissions All Conditions
0
0.25
0.5
0.75
1
1.25
1.5
1.75
2
2.25
2.5
2.75
0.00 0.15 0.30 0.45 0.60 0.75
%C
O in
Exh
aust
Water/Fuel Mass Ratio
CO Emissions, Rich (1.07 Ф)
Rich CR6
Rich CR7
00.25
0.50.75
11.25
1.51.75
22.25
2.52.75
0.00 CR6
0.15 CR6
0.30 CR6
0.45 CR6
0.60 CR6
0.75 CR6
0.00 CR7
0.15 CR7
0.30 CR7
0.45 CR7
0.60 CR7
0.75 CR7
%C
O in
Exh
aust
Water/Fuel Mass Ratio
CO Emissions
Lean
Stoic
Rich
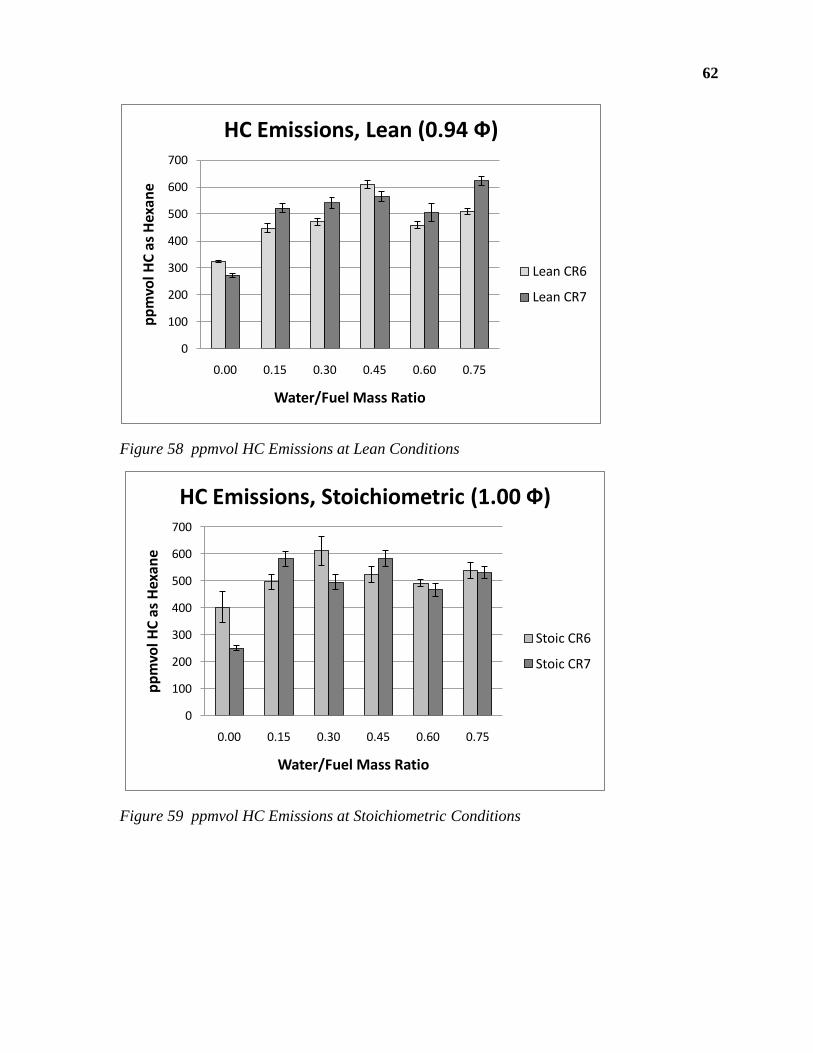
62
Figure 58 ppmvol HC Emissions at Lean Conditions
Figure 59 ppmvol HC Emissions at Stoichiometric Conditions
0
100
200
300
400
500
600
700
0.00 0.15 0.30 0.45 0.60 0.75
pp
mvo
l HC
as
Hex
ane
Water/Fuel Mass Ratio
HC Emissions, Lean (0.94 Ф)
Lean CR6
Lean CR7
0
100
200
300
400
500
600
700
0.00 0.15 0.30 0.45 0.60 0.75
pp
mvo
l HC
as
Hex
an
e
Water/Fuel Mass Ratio
HC Emissions, Stoichiometric (1.00 Ф)
Stoic CR6
Stoic CR7
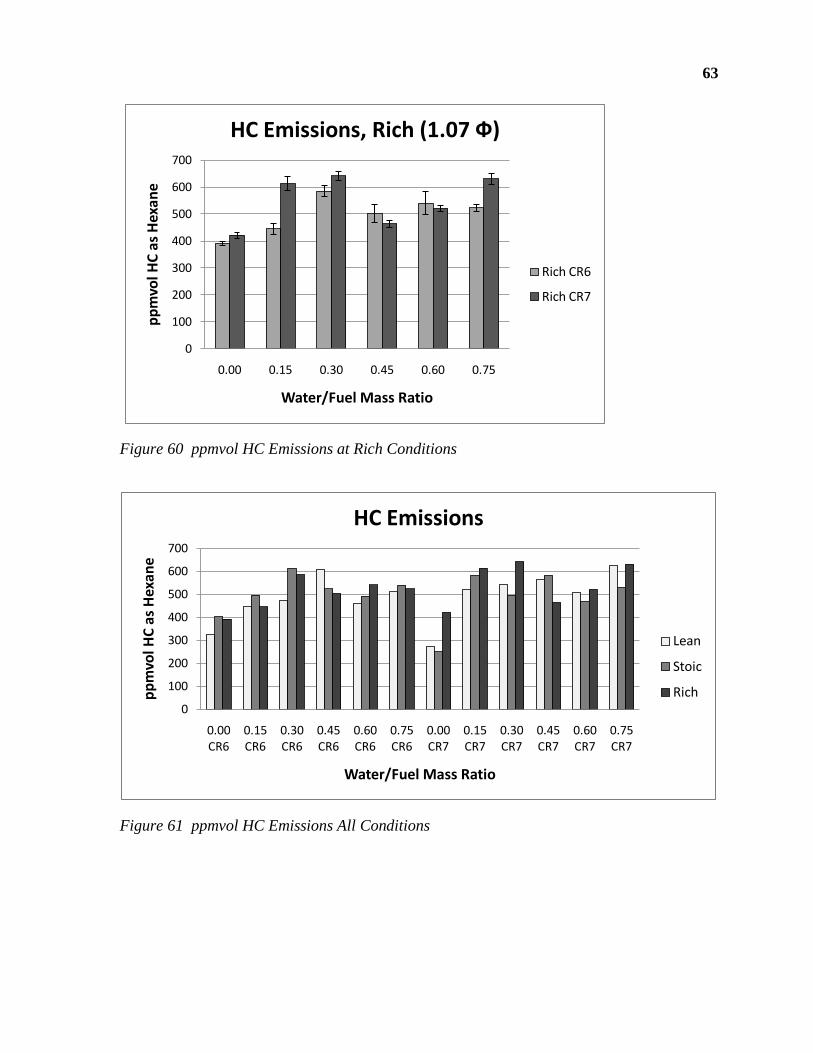
63
Figure 60 ppmvol HC Emissions at Rich Conditions
Figure 61 ppmvol HC Emissions All Conditions
0
100
200
300
400
500
600
700
0.00 0.15 0.30 0.45 0.60 0.75
pp
mvo
l HC
as
Hex
ane
Water/Fuel Mass Ratio
HC Emissions, Rich (1.07 Ф)
Rich CR6
Rich CR7
0
100
200
300
400
500
600
700
0.00 CR6
0.15 CR6
0.30 CR6
0.45 CR6
0.60 CR6
0.75 CR6
0.00 CR7
0.15 CR7
0.30 CR7
0.45 CR7
0.60 CR7
0.75 CR7
pp
mvo
l HC
as
Hex
ane
Water/Fuel Mass Ratio
HC Emissions
Lean
Stoic
Rich
64
Appendix C – Code of Federal Regulations (21)
e-CFR Data are current as of May 29, 2008
Title 40: Protection of Environment
PART 91—CONTROL OF EMISSIONS FROM MARINE SPARK-IGNITION ENGINES
Subpart E—Gaseous Exhaust Test Procedures
Browse Previous | Browse Next
§ 91.419 Raw emission sampling calculations.
(a) Derive the final test results through the steps described in this section.
(b) Air and fuel flow method. If both air and fuel flow mass rates are measured, the following
equations are used to determine the weighted emission values for the test engine:
(c) Fuel flow method. The following equations are to be used when fuel flow is selected as
the basis for mass emission calculations using the raw gas method.
Where:
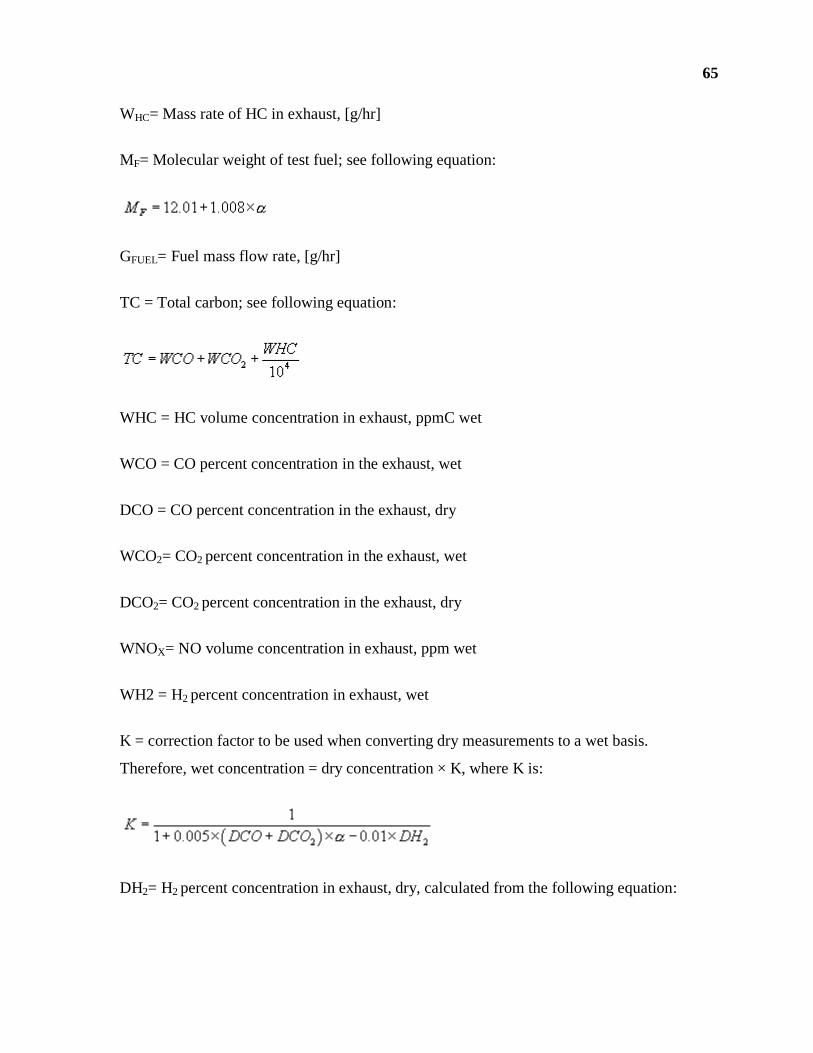
65
WHC= Mass rate of HC in exhaust, [g/hr]
MF= Molecular weight of test fuel; see following equation:
GFUEL= Fuel mass flow rate, [g/hr]
TC = Total carbon; see following equation:
WHC = HC volume concentration in exhaust, ppmC wet
WCO = CO percent concentration in the exhaust, wet
DCO = CO percent concentration in the exhaust, dry
WCO2= CO2 percent concentration in the exhaust, wet
DCO2= CO2 percent concentration in the exhaust, dry
WNOX= NO volume concentration in exhaust, ppm wet
WH2 = H2 percent concentration in exhaust, wet
K = correction factor to be used when converting dry measurements to a wet basis.
Therefore, wet concentration = dry concentration × K, where K is:
DH2= H2 percent concentration in exhaust, dry, calculated from the following equation:
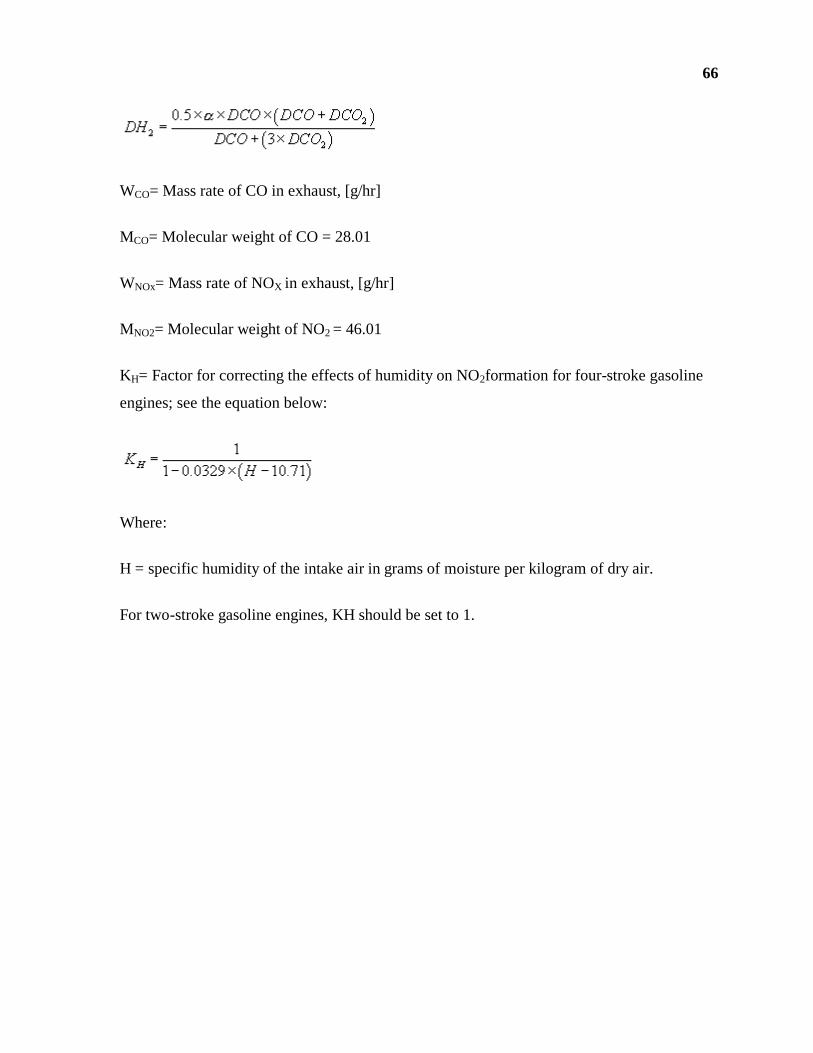
66
WCO= Mass rate of CO in exhaust, [g/hr]
MCO= Molecular weight of CO = 28.01
WNOx= Mass rate of NOX in exhaust, [g/hr]
MNO2= Molecular weight of NO2 = 46.01
KH= Factor for correcting the effects of humidity on NO2formation for four-stroke gasoline
engines; see the equation below:
Where:
H = specific humidity of the intake air in grams of moisture per kilogram of dry air.
For two-stroke gasoline engines, KH should be set to 1.
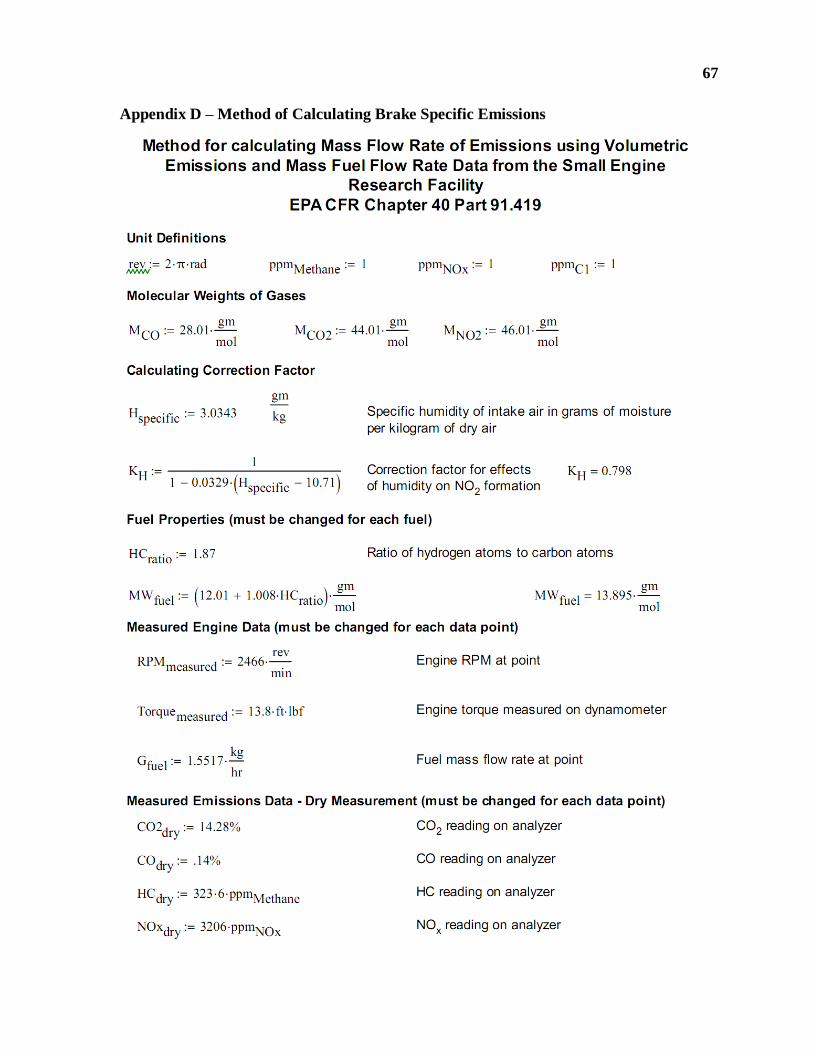
67
Appendix D – Method of Calculating Brake Specific Emissions
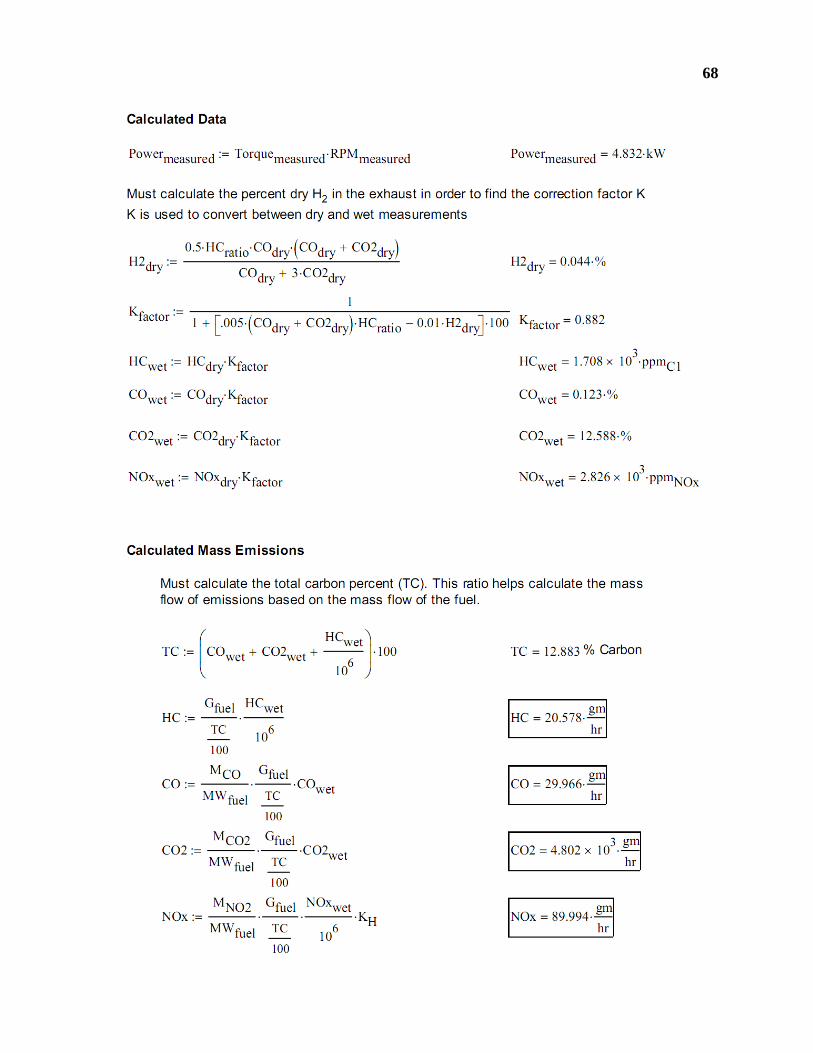
68
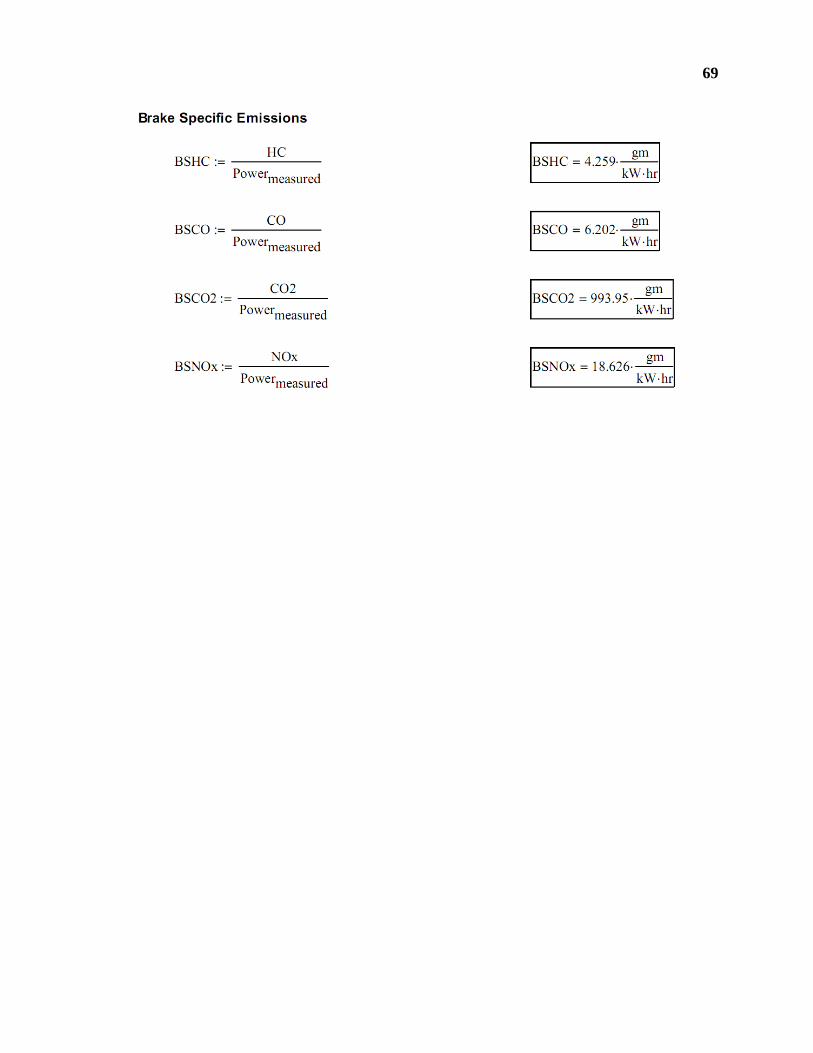
69
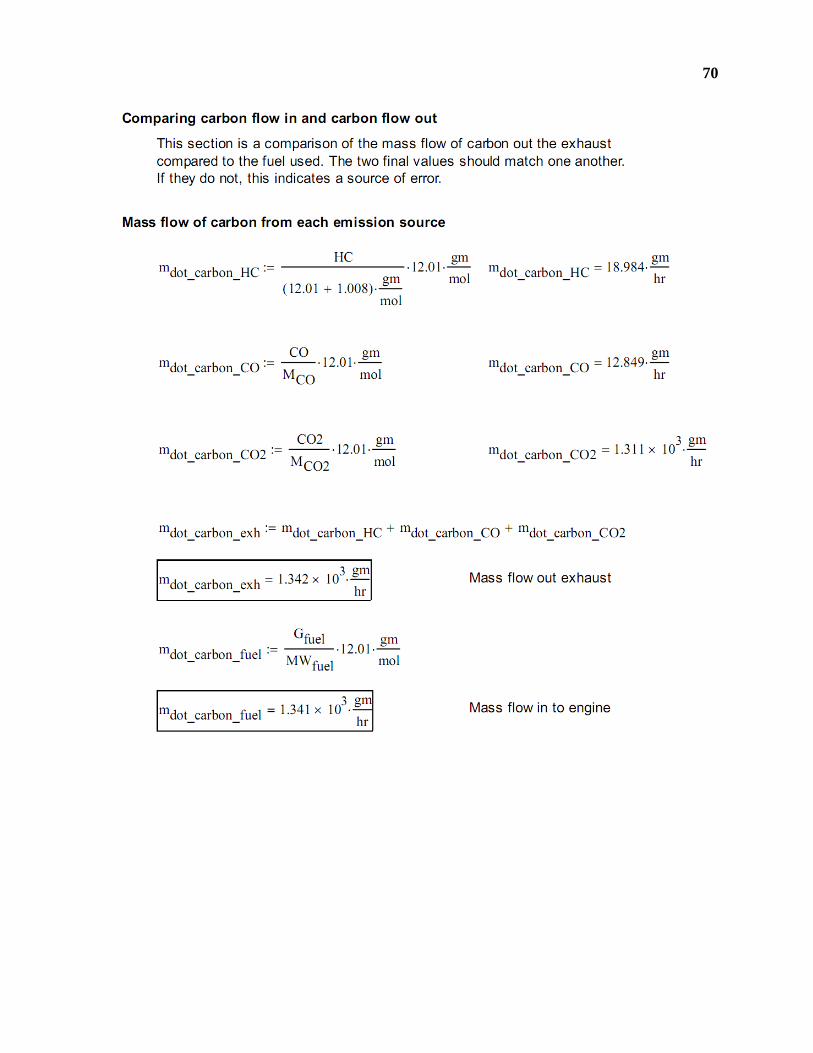
70
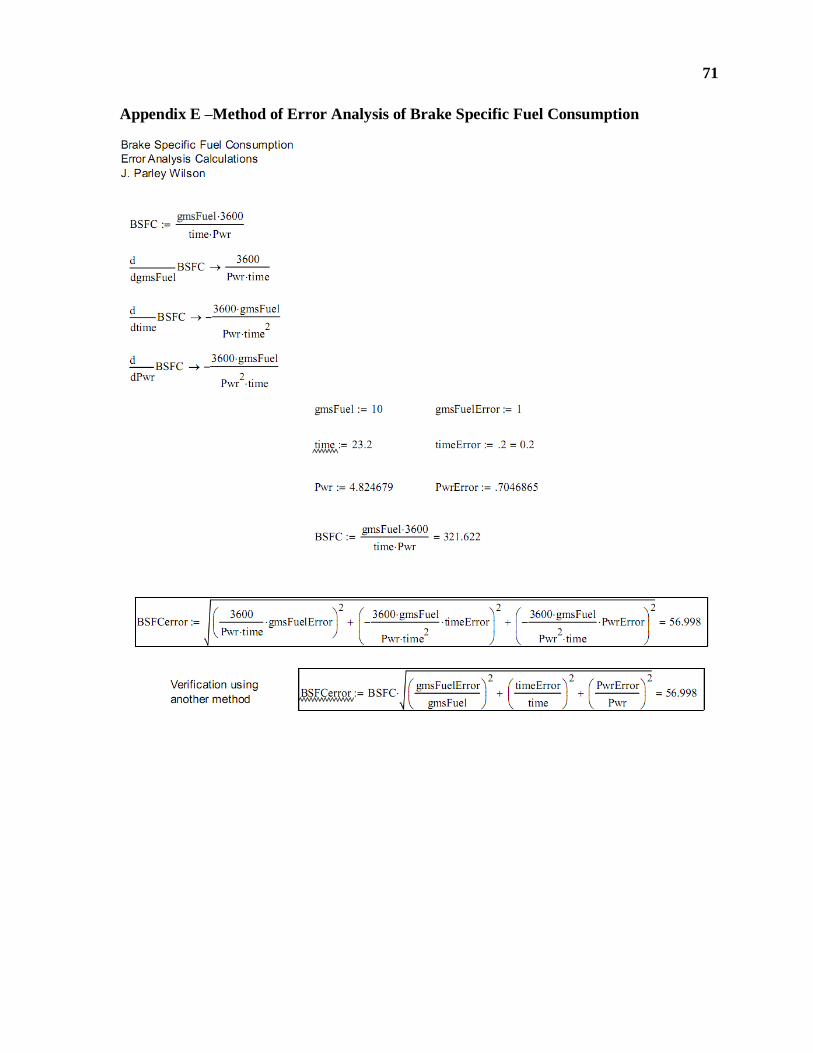
71
Appendix E –Method of Error Analysis of Brake Specific Fuel Consumption
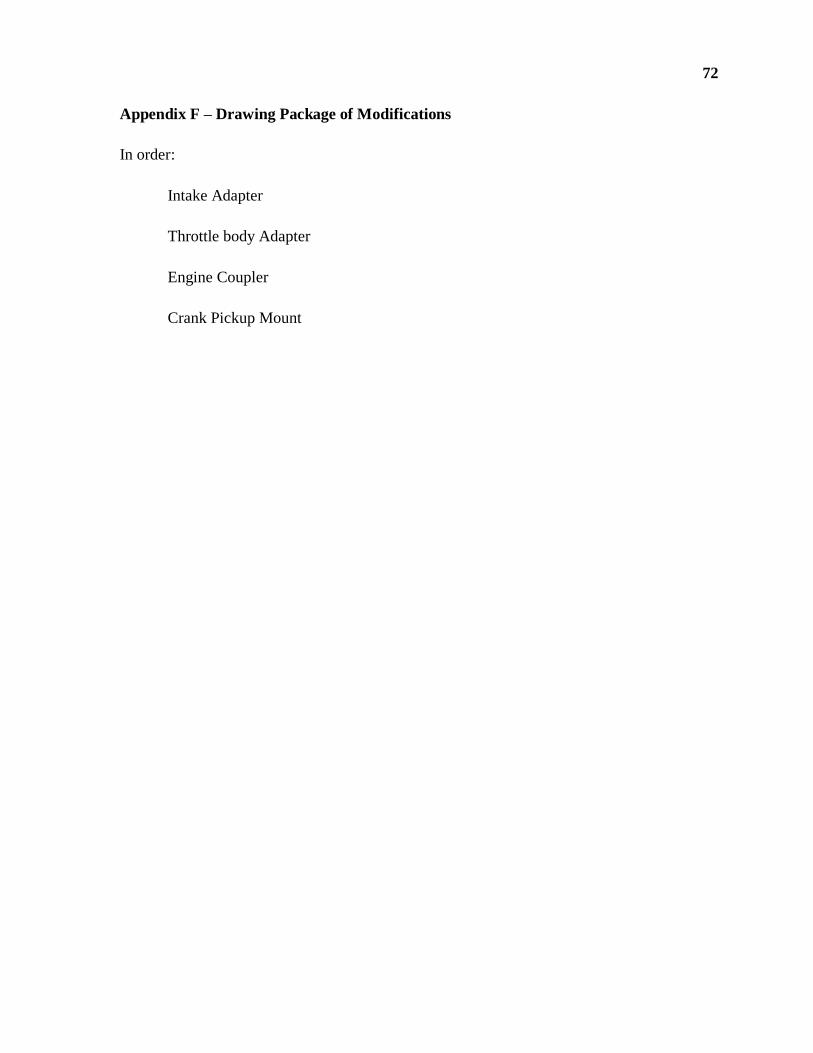
72
Appendix F – Drawing Package of Modifications
In order:
Intake Adapter
Throttle body Adapter
Engine Coupler
Crank Pickup Mount
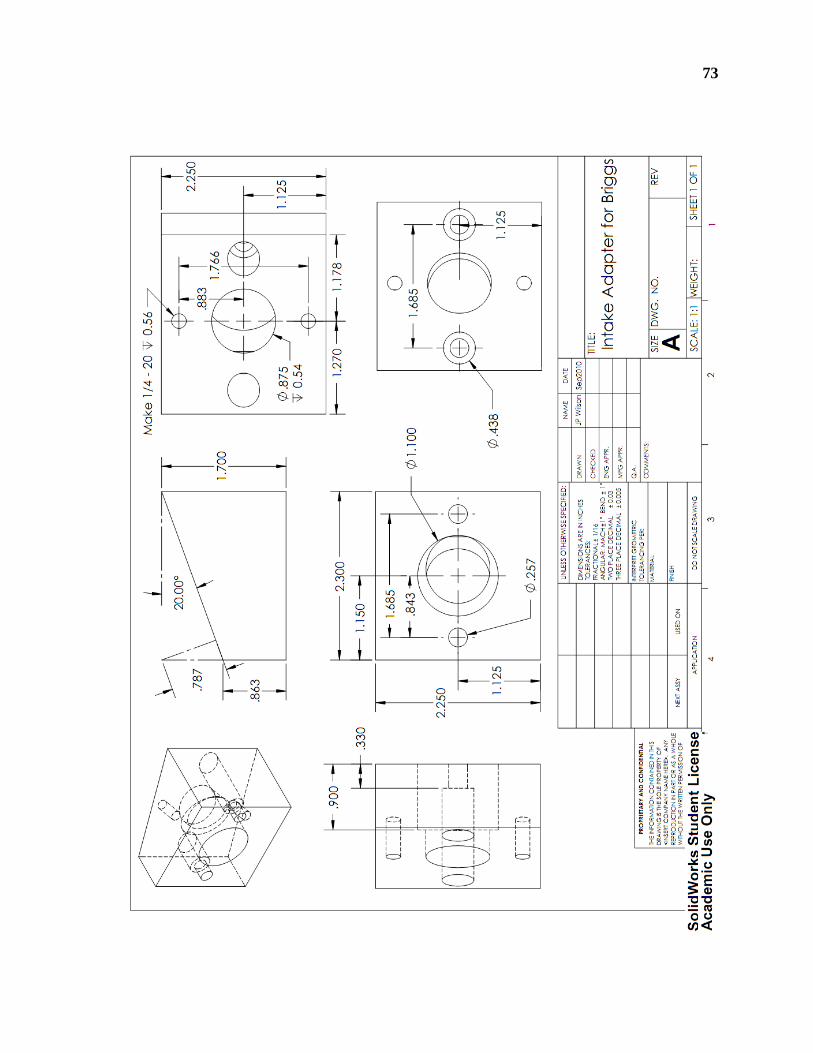
73
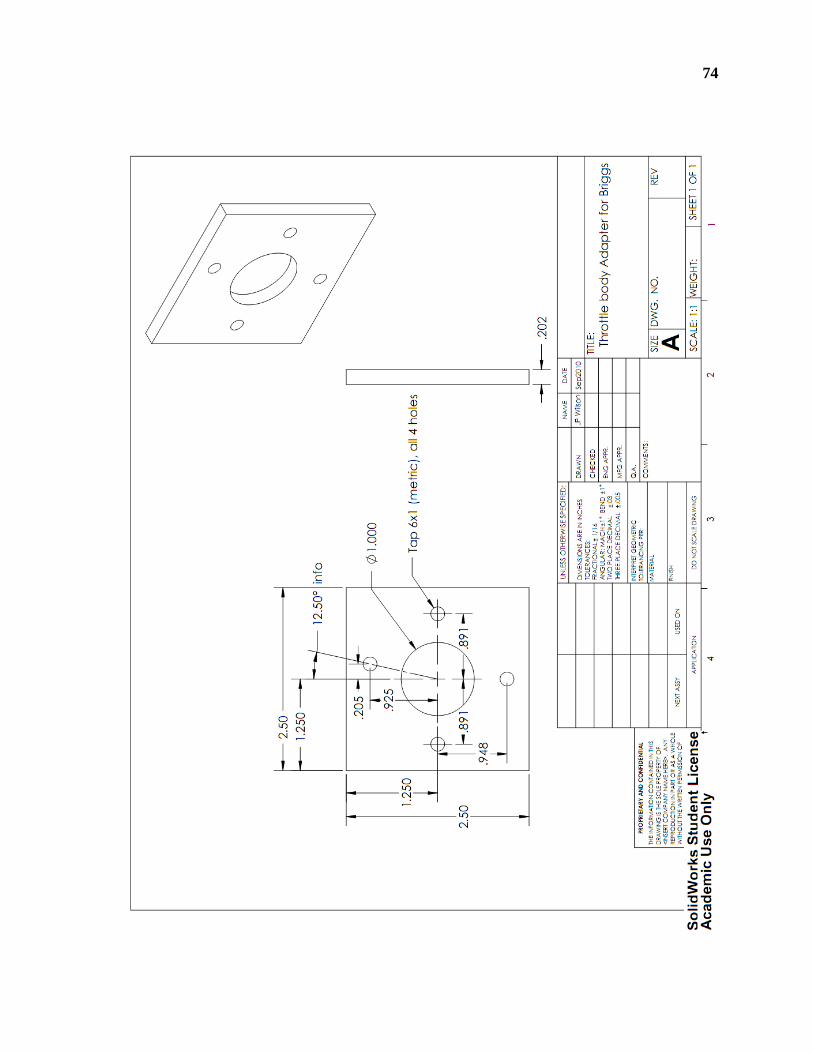
74
75
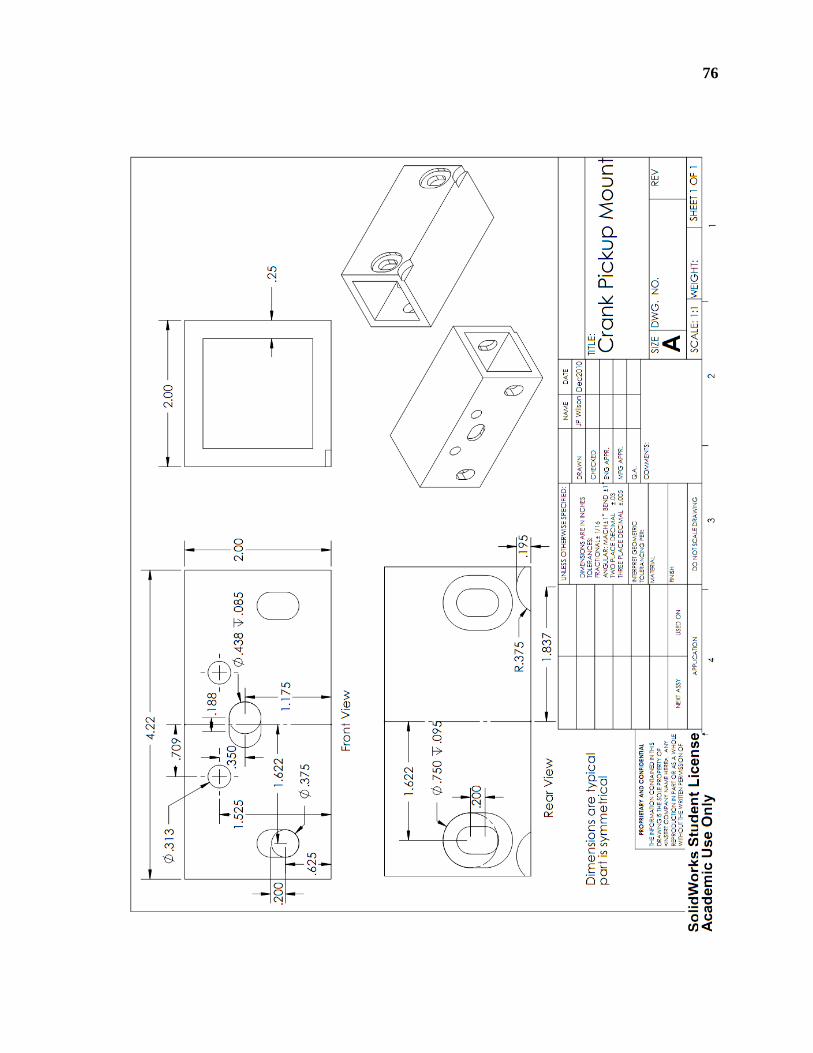
76