Embed Size (px)
Citation preview
UNIVERSITY OF NORTH DAKOTA Grand Forks
Effects of Water Reducer Admixtures on Concrete Strength and Durability
Final Report
September 2004
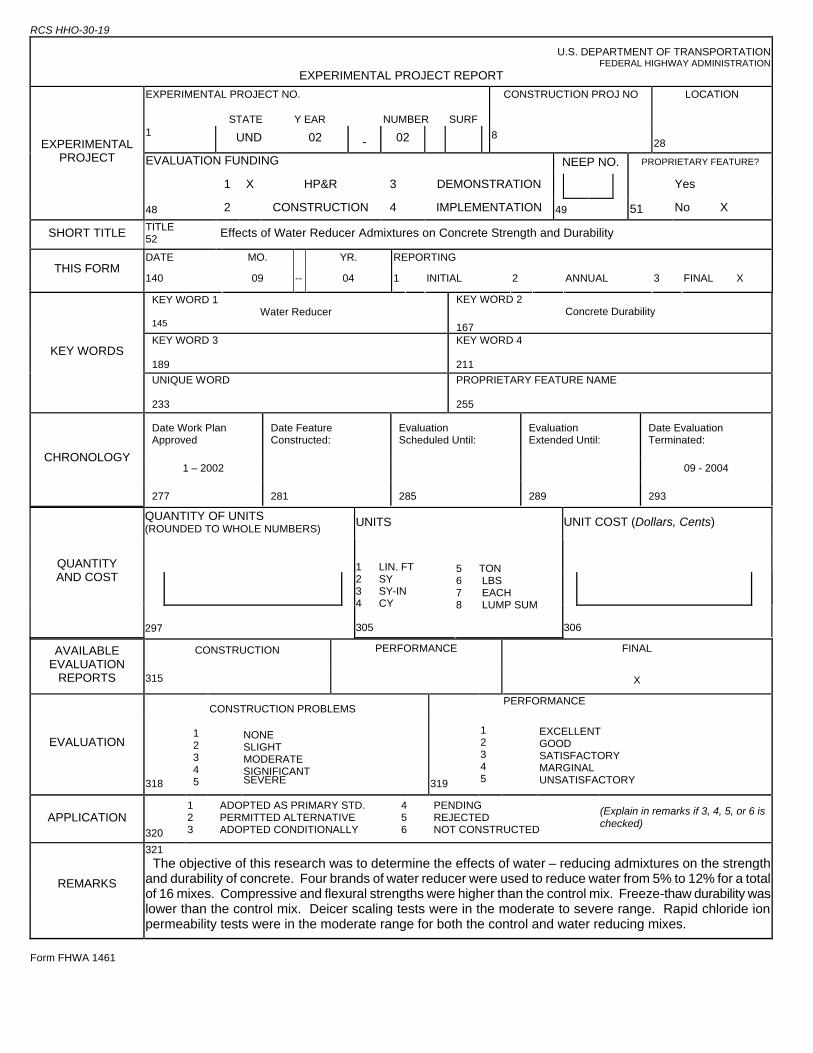
RCS HHO-30-19
U.S. DEPARTMENT OF TRANSPORTATION FEDERAL HIGHWAY ADMINISTRATION
EXPERIMENTAL PROJECT REPORT
EXPERIMENTAL PROJECT NO. CONSTRUCTION PROJ NO LOCATION STATE Y EAR NUMBER SURF 1 UND 02
- 02
8
28
EVALUATION FUNDING NEEP NO. PROPRIETARY FEATURE?
1 X HP&R 3 DEMONSTRATION Yes
EXPERIMENTAL PROJECT
48 2 CONSTRUCTION 4 IMPLEMENTATION 49 51 No X
SHORT TITLE TITLE 52 Effects of Water Reducer Admixtures on Concrete Strength and Durability
DATE MO. YR. REPORTING THIS FORM
140 09 -- 04 1 INITIAL 2 ANNUAL 3 FINAL X
KEY WORD 1 Water Reducer
145
KEY WORD 2 Concrete Durability
167 KEY WORD 3 189
KEY WORD 4 211
KEY WORDS
UNIQUE WORD 233
PROPRIETARY FEATURE NAME 255
Date Work Plan Approved
Date Feature Constructed:
Evaluation Scheduled Until:
Evaluation Extended Until:
Date Evaluation Terminated:
1 – 2002 09 - 2004 CHRONOLOGY
277 281 285 289 293
QUANTITY OF UNITS (ROUNDED TO WHOLE NUMBERS)
UNITS UNIT COST (Dollars, Cents)
QUANTITY AND COST
297
1 LIN. FT 2 SY 3 SY-IN 4 CY 305
5 TON 6 LBS 7 EACH 8 LUMP SUM
306
AVAILABLE EVALUATION
REPORTS
CONSTRUCTION
315
PERFORMANCE
FINAL
X
CONSTRUCTION PROBLEMS
PERFORMANCE
EVALUATION
318
1 2 3 4 5
NONE SLIGHT MODERATE SIGNIFICANT SEVERE
319
1 2 3 4 5
EXCELLENT GOOD SATISFACTORY MARGINAL UNSATISFACTORY
APPLICATION 320
1 ADOPTED AS PRIMARY STD. 2 PERMITTED ALTERNATIVE 3 ADOPTED CONDITIONALLY
4 PENDING 5 REJECTED 6 NOT CONSTRUCTED
(Explain in remarks if 3, 4, 5, or 6 is checked)
REMARKS
321 The objective of this research was to determine the effects of water – reducing admixtures on the strength and durability of concrete. Four brands of water reducer were used to reduce water from 5% to 12% for a total of 16 mixes. Compressive and flexural strengths were higher than the control mix. Freeze-thaw durability was lower than the control mix. Deicer scaling tests were in the moderate to severe range. Rapid chloride ion permeability tests were in the moderate range for both the control and water reducing mixes.
Form FHWA 1461
University of North Dakota Department of Civil Engineering
Effects of Water Reducer Admixtures on Concrete Strength and Durability
Final Report
Submitted to:
North Dakota Department of Transportation
By:
Alex Hoime, Kent Johnson, Dustin Scott, Dr. Charles Moretti, and Dr. Ali Abolmaali
September 2004
Disclaimer
The contents of this report reflect the views of the author or authors who are responsible for thefacts and the accuracy of the data presented herein. The contents do not reflect the officialviews of the North Dakota Department of Transportation or the Federal HighwayAdministration. This report does not constitute a standard, specification, or regulation.
Table of Contents Table of Contents i
List of Tables iii
List of Figures iv
Acknowledgement v
Chapter 1: Introduction and Literature Review 1
1.1 Introduction 1
1.2 Background Information on Water Reducing Admixtures 3 1.3 Scope of Research 6
Chapter 2: Materials and Methods 7 2.1 Chemical Admixtures 7
2.2 Aggregates 9
2.3 Cement and Fly Ash 9
2.4 Mix Design Methodology 11
2.5 Concrete Mixing Procedures 11
2.6 Test Methods 12
Chapter 3: Experimental Test Results 16
3.1 Introduction 16
3.2 Mix Design Proportions 16
3.3 Plastic Properties of Mixes 20
3.4 Flexural Strength Test Results 20
3.5 Compressive Strength Test Results 20
i
3.6 Air-Void Analysis Test Results 23
3.7 Freeze-Thaw Test Results 23
3.8 Resistance of Concrete to Deicing Chemicals Test Results 23
3.9 Permeability Test Results 25
Chapter 4: Discussion and Analysis of Results 29
4.1 Compressive and Flexural Test Strength 29
4.2 Freeze-Thaw Durability Test Results 32
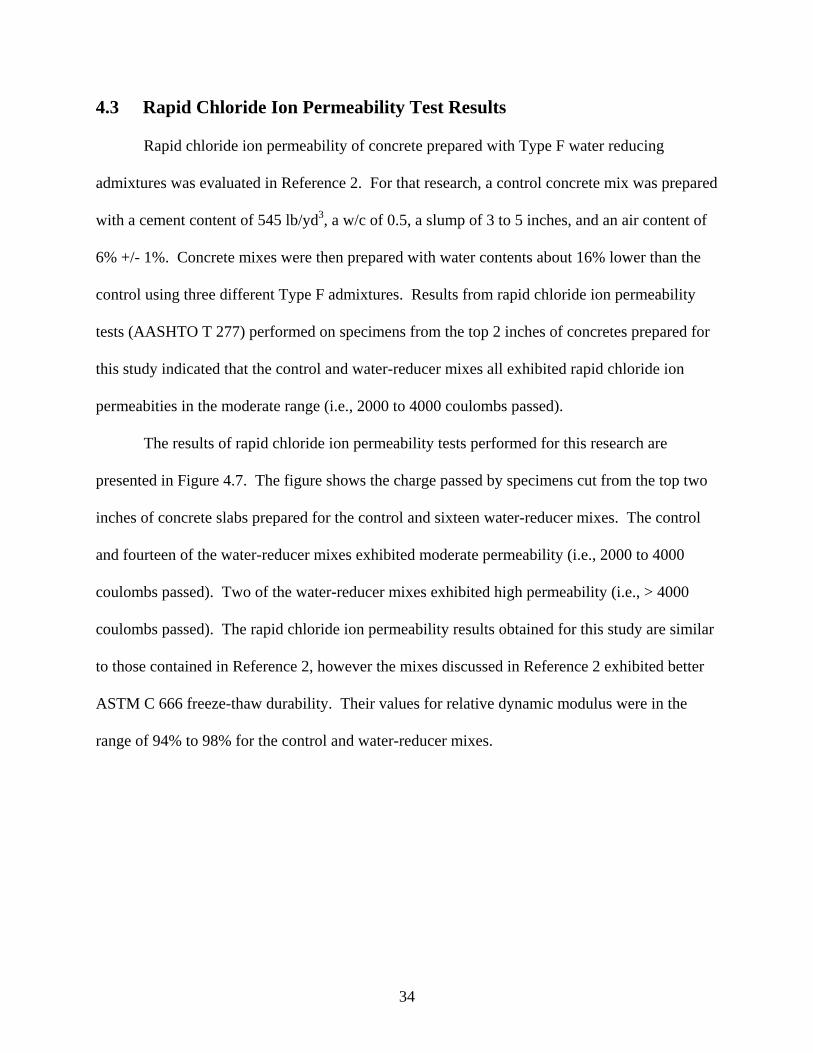
4.3 Rapid Chloride Ion Permeability Test Results 34
4.4 Resistance to Deicer Scaling Test Results 35
4.5 Analysis of Air Void System Test Results 36
Chapter 5: Summary and Conclusions 37
Chapter 6: Recommendations 41
Appendix A: Sample Mix Spreadsheet and Material Information A1
Appendix B: Control Mix Experimental Data B1
Appendix C: Master Builders Experimental Data C1
Appendix D: Brett Admixtures Experimental Data D1
Appendix E: GRACE Experimental Data E1
Appendix F: GRT Experimental Data F1
Appendix G: Complete Mix Data G1
Appendix H: Permeability Test Data H1
Appendix I: Deicing Test Data I1
Appendix J: Freeze -Thaw Test Data J1
ii
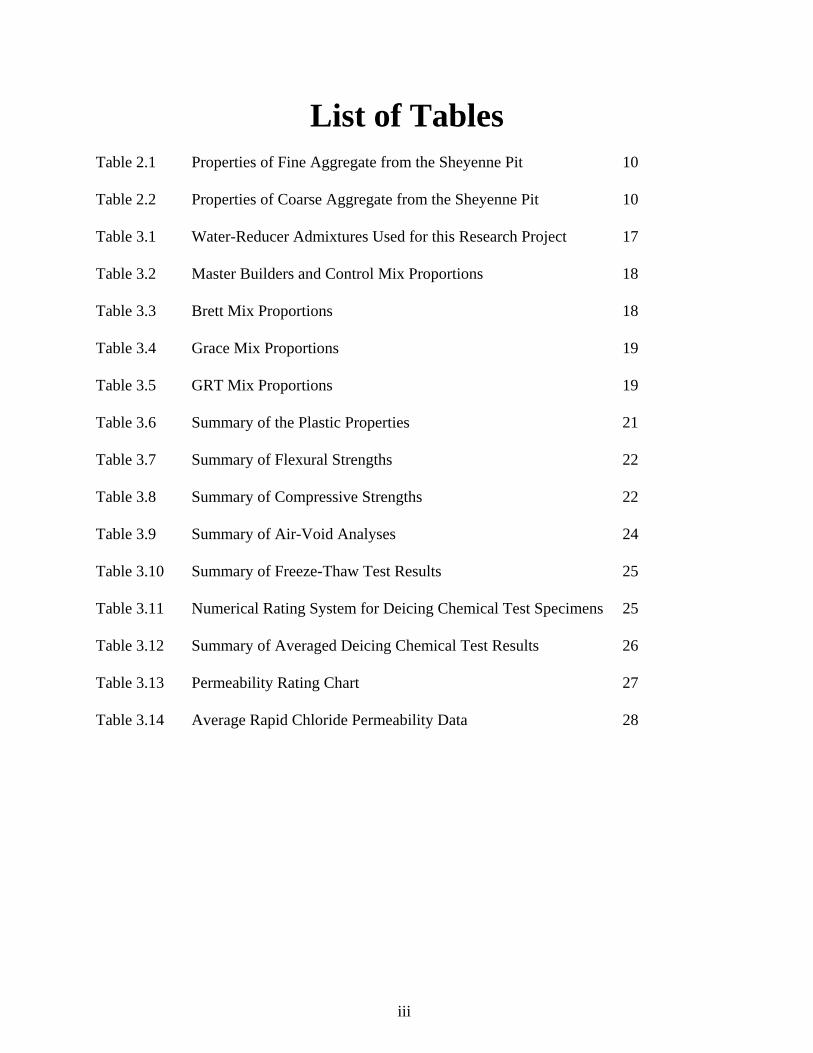
List of Tables Table 2.1 Properties of Fine Aggregate from the Sheyenne Pit 10
Table 2.2 Properties of Coarse Aggregate from the Sheyenne Pit 10
Table 3.1 Water-Reducer Admixtures Used for this Research Project 17
Table 3.2 Master Builders and Control Mix Proportions 18
Table 3.3 Brett Mix Proportions 18
Table 3.4 Grace Mix Proportions 19
Table 3.5 GRT Mix Proportions 19
Table 3.6 Summary of the Plastic Properties 21
Table 3.7 Summary of Flexural Strengths 22
Table 3.8 Summary of Compressive Strengths 22
Table 3.9 Summary of Air-Void Analyses 24
Table 3.10 Summary of Freeze-Thaw Test Results 25
Table 3.11 Numerical Rating System for Deicing Chemical Test Specimens 25
Table 3.12 Summary of Averaged Deicing Chemical Test Results 26
Table 3.13 Permeability Rating Chart 27
Table 3.14 Average Rapid Chloride Permeability Data 28
iii
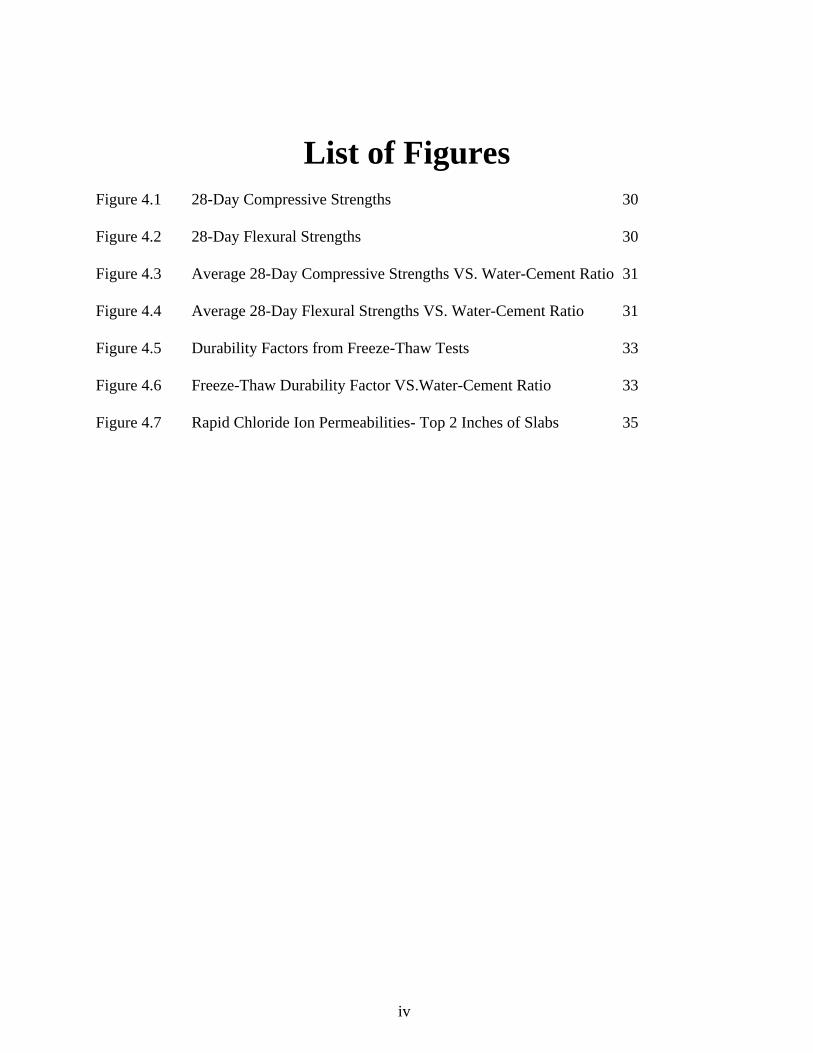
List of Figures Figure 4.1 28-Day Compressive Strengths 30
Figure 4.2 28-Day Flexural Strengths 30
Figure 4.3 Average 28-Day Compressive Strengths VS. Water-Cement Ratio 31
Figure 4.4 Average 28-Day Flexural Strengths VS. Water-Cement Ratio 31
Figure 4.5 Durability Factors from Freeze-Thaw Tests 33
Figure 4.6 Freeze-Thaw Durability Factor VS.Water-Cement Ratio 33
Figure 4.7 Rapid Chloride Ion Permeabilities- Top 2 Inches of Slabs 35
iv
Acknowledgements
The authors express their sincere appreciation for the financial support provided by the
North Dakota Department of Transportation (NDDOT) to conduct this research. The authors also
wish to specially thank Aggregate Industries for supplying the aggregate; Lafarge Inc. from
Grand Forks, ND for supplying cementitious material (cement and fly ash); and GRT, Master
Builders, Brett, and Grace for supplying the admixtures.
The authors wish to thank Mr. Greg Johnson and Mr. Dave Sethre for their
contributions to the research.
v
Chapter 1
Introduction and Literature Review 1.1 Introduction
Durability of concrete materials is one of the major concerns of material engineers
throughout the country, particularly in cold regions such as the State of North Dakota. Previous
research projects sponsored by the North Dakota Department of Transportation (NDDOT) have
investigated the effects of fly ash and dense graded aggregates on the durability characteristics of
concrete pavements and bridge decks. This research is intended to build on previous research
and study the effects of different water reducing-admixtures on the strength and durability of
concrete used for pavements.
Water-reducing admixtures for Portland cement concrete have been used since the
1950’s. Early types of admixtures were used to achieve water reductions of at most 10%. In the
1970’s, new types of admixtures sometimes referred to as “super water reducers” were
introduced. These products were capable of achieving substantially higher water reduction in
concrete. According to the Portland Cement Association, water-reducing admixtures are used
for the following reasons (Ref. 1, pp. 107 - 109):
• To reduce the amount of mixing water needed to produce a given slump
• To reduce the water to cement ratio for a mix
__________
(Ref. 1) Kosmatka, S., Kerkhoff, B., and W. Panarese, “Design and Control of Concrete
Mixtures,” 14th Ed., Portland Cement Association, Skokie, Ill., 2002.
1
• To reduce the cement content of a mix, or
• To increase the slump of a mix.
The objective of this research is to identify the effects of water-reducing admixtures on
the strength and durability characteristics of concrete designed using the current NDDOT
standards and specifications. Four brands of water reducers that are commonly used in the State
of North Dakota were selected for study. Brett, GRT, Grace, and Master Builders supplied the
admixtures for this research. Each company sent two different water reducers and an air-
entraining product. Batches of concrete were then prepared using each water reducer. The
characteristics of the concretes produced were evaluated by performing the following tests on
appropriately prepared specimens:
• Compressive strength (AASHTO T-22)
• Flexural strength (AASHTO T-97)
• Resistance of concrete to rapid freezing and thawing (ASTM C 666)
• Rapid chloride ion permeability (ASTM C 1202)
• Air-void analysis on hardened concrete (ASTM C 457), and
• Resistance of concrete surface to deicing chemicals (ASTM C 672)
2
1.2 Background Information on Water Reducing Admixtures
Type A water-reducing admixtures conforming to ASTM C 494 and AASHTO M194 can
typically reduce the water content of concrete by 5% to 10%. Type F (high range) water
reducing-admixtures can typically reduce the water content by 12% to 30%.
Water reducing admixtures generally produce an increase in the strength of concrete
when the water-cement (w/c) ratio is decreased. For concretes with equivalent cement content,
air content, and slump, the 28-day strength may be increased by 10% to 25% with the addition of
Type A admixtures. Type F admixtures can produce concretes with ultimate compressive
strengths greater than 10,000 psi, increased early strength gain, reduced chloride ion penetration,
and other beneficial characteristics caused by a lower w/c ratio in concrete (Ref. 1, p.108).
Water reducing admixtures have other effects on concrete mixes. For example, they can
increase the rate of slump loss in freshly mixed concrete. Water reducers can also increase the
drying shrinkage of concrete. Type F admixtures can significantly retard the time of set of
concrete (Ref.1, p.110). .
Whiting and Dziedzic (Ref. 2) studied the effects of Type A and Type F water reducers
on concrete properties. They used a control concrete mix prepared with 545 lb/yd3 of cement,
w/c ratio of 0.5, air content of 6% and a slump of 3 to 5 inches. Test mixes were prepared with
Type A water reducers to achieve about an 8% water reduction compared to the control mix, and
with Type F water reducers to achieve about a 16% water reduction compared to the control mix.
These test mixes targeted the same w/c ratio and slump as the control mix. Several additional
test mixes were prepared with increased additions of Type F water reducers to produce a flowing
concrete with a slump of 7 to 9 inches.
3
The various concrete mixes were tested for slump, air loss, setting time, bleeding,
resistance to freezing and thawing, resistance to deicer scaling, air-void analysis, chloride
permeability, drying shrinkage, and compressive strength. This research produced the following
conclusions:
• Initial workabilities of the mixes were adequate, but there was rapid slump loss with time
observed for both types of water reducers.
• Concrete durability with respect to deicing chemicals may be adversely affected by the
use of Type F water reducers when used to produce flowing concretes and there is a short
curing period prior to application of deicing chemicals.
• Non-flowing concretes produced with water reducers appear to be durable under freezing
conditions, but the flowing concretes exhibited problems with respect to freeze-thaw
durability.
• Water reducers appeared to contribute to an increase in drying shrinkage, particularly in
the early stages of curing and with cement containing a moderate tricalcium aluminate
content.
• Compressive strength did not appear to be affected in any consistent way by addition of
water reducers.
• Water reducers had little or no effect on the chloride ion permeability of the concrete.
____________
(Ref . 2) Whiting, D., and W. Dziedzic, “Effects of Conventional and High-Range Water
Reducers on Concrete Properties,” Portland Cement Association., Research and Development
Bulletin RD107T, Skokie, Ill., 1992.
4
Whiting (Ref. 3) evaluated the use of super-water reducers (sometimes called high-range
water reducers) for highway applications. Chapter 10 of Reference 3 is a guide to the use of
super-water reducers (SWR) for highway applications. The following information is contained in
Reference 3:
• “No major changes in concrete mix designs (other than reduction in water-cement ratio)
need be made when using SWR. A small increase in sand content (approximately 5%)
may be useful to avoid a rocky mix. If desired, the total paste content may be increased
to compensate for the volume of water removed from the batch. This may be done by the
use of additional cement, fly ash or other finely ground materials. The water cement ratio
should be maintained, however.”
• “In mixes typical of those used for full-depth pavement and bridge deck construction
having cement contents of 560-660 lb/yd3, SWR can be used to reduce the water/cement
ratios to less than 0.35.”
• The design slump for pavement mixes containing SWR should be in the range of 5-6
inches to maintain workability over the time needed for transport and placement. If
necessary, this slump should be produced by using more SWR rather than increasing the
water content.
• The total dosage of SWR (on a dry solids basis) added to a concrete mix should not
exceed 1.0% by weight of the cement contained in the mix.
__________
(Ref. 3) D. Whiting, “Evaluation of Super-Water Reducers for Highway Applications,” Portland
Cement Association., Research and Development Bulletin RD078.01T, Skokie, Ill., 1981.
5
• When the SWR dosage is between 0.6% and 1.0% (dry solids of admixture to weight of
cement), lab tests should be done to check the effects on setting time and early strength
development.
• Air contents in fresh mixed concrete should be in the range of 7-8%. Lab tests should be
done to check the tendency of SWR to cause rapid air loss in fresh concrete.
1.3 Scope of the Research
Sixteen different concrete mixes were prepared for this research using eight different
water-reducing admixtures. Each supplier provided two water reducers. One was used to
produce two concrete mixes with targeted water-reduction percentages of 5% and 8%, and the
other was used to produce two concrete mixes with targeted water-reduction percentages of 8%
and 12%. In addition, a control mix was prepared without water reducer for comparison
purposes. The control mix was designed based on the NDDOT’s Standards and Specifications
for Road and Bridge Construction, 1997, Volumes 1 and 2.
The performance of each concrete mix was evaluated based on the results of standard
tests conducted on prepared specimens. The methods used for the various tests are described in
Chapter 2, the test results are presented in Chapter 3, the test results are discussed in Chapter 4,
summary and conclusions are included in Chapter 5, and recommendations are given in
Chapter 6.
6
Chapter 2
Materials and Methods 2.1 Chemical Admixtures
The suppliers of the water reducers used for this project were chosen because of their
reputations within the concrete construction industry and because they have an established work
history with the NDDOT. Products were obtained from the following suppliers:
1. Master Builders
2. Brett Admixtures
3. Grace Construction Products
4. GRT Admixtures
Each supplier was asked to send two water reducing admixtures. In addition, they were
asked to send a suitable air-entraining product along with the water reducers. This was done so
that compatible water reducer and air-entraining products would be used for all mixes. All
suppliers graciously donated their products for this study.
Master Builders is one of the nation’s oldest suppliers of chemical additives for
construction purposes. With headquarters in Cleveland, OH and regional offices all over the
U.S., they are able to supply most parts of the country with admixtures. Master Builders’ local
representative sent their Pozzolith 322N, Polyheed 997, and PAVE-AIR products. Pozzolith
322N is a ASTM C 494 Type A admixture suitable for 5 to 10% water reduction. Polyheed 997
is a ASTM C 494 Type A and F admixture suitable for 5 to 15% water reduction. PAVE-AIR is
an air-entraining admixture. (See Section 1.2 for a discussion of the typical properties of Type A
and Type F admixtures.)
7
Brett Admixtures is located in Eden Prairie, MN. They supply various chemical
admixtures for concrete construction. Brett supplied Eucon WR 91, Eucon 37, and AEA-92
products for this study. The Euclid Chemical Company manufactures the Eucon WR 91 and
Eucon 37 admixtures. Eucon WR 91 is a Type A and D water-reducing and set-retarding
admixture. Eucon 37 is water-reducing admixture conforming to ASTM C 494, Types A and F.
AEA-92 is an air-entraining admixture. Specific water reduction ranges for these admixtures
were not stated in the technical literature.
Grace Construction Products is located in Cambridge MA. Grace sent their WRDA-82,
ADVA 140, and Daravair 1400 products for this study. WRDA-82 is a Type A water reducer. It
is suitable for producing a maximum 15% water reduction. ADVA 140 is a Type A and F water
reducer. It is suitable for producing a maximum 40% water reduction. Daravair 1400 is an air-
entraining agent.
GRT Admixtures is located in Eagan, MN. GRT supplied their Polychem 400NC,
Melchem, and Polychem VR admixtures for this research. Polychem 400NC is a Type A water
reducer. The GRT product catalog indicates that Melchem is a Type A and F water reducer.
Polychem VR is an air-entraining admixture. Specific water reduction ranges for the GRT
additives were not stated in the technical literature.
8
2.2 Aggregates
The aggregate source for this research project was the Sheyenne pit. This aggregate is
produced from glacial deposits laid down during the ice age. The pit is located a few miles north
of the town of Sheyenne in north central North Dakota. The pit is owned and operated by
Aggregate Industries, a national supplier of construction materials. The coarse aggregate
obtained from the Sheyenne pit was classified as NDDOT size number 3, with a maximum
particle size of 1 inch. The fine aggregate, or sand, from the Sheyenne pit meets NDDOT
standards. Tables 2.1 and 2.2 contain the gradations and physical properties of the Sheyenne
aggregates along with NDDOT requirements for aggregates. The moisture contents of the
aggregates were measured on a daily basis whenever a batch of concrete was mixed to determine
mix moisture requirements.
2.3 Cement and Fly Ash
The local Grand Forks, ND plant of Lafarge Dakota donated the Type I Portland cement
and the fly ash for this project. The cement was produced at the Alberta, Canada plant. The
cement conforms to ASTM C 150-02a standards. A Class C fly ash was used for this study.
This fly ash, which met ASTM C 618 standards, was produced at the Coal Creek Station in
North Dakota. Physical and chemical properties of the Portland cement and fly ash are
contained in Appendix A.
9
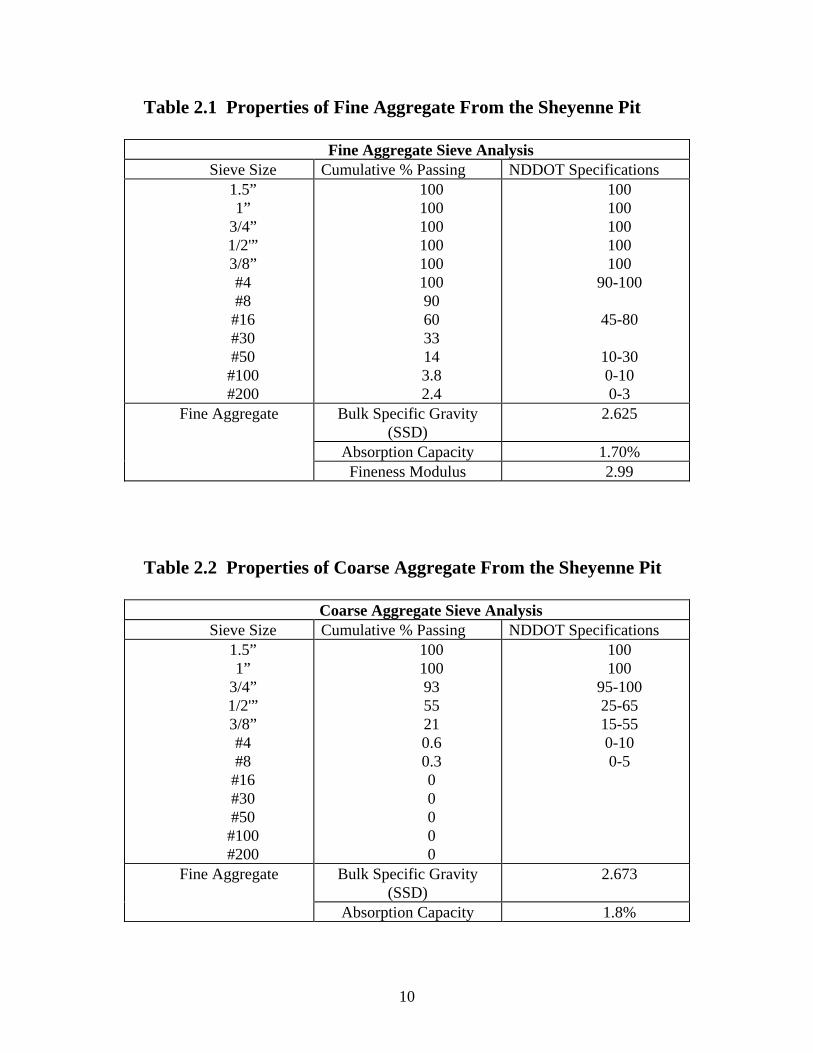
Table 2.1 Properties of Fine Aggregate From the Sheyenne Pit
Fine Aggregate Sieve Analysis Sieve Size Cumulative % Passing NDDOT Specifications
1.5” 1”
3/4” 1/2'” 3/8” #4 #8 #16 #30 #50 #100 #200
100 100 100 100 100 100 90 60 33 14 3.8 2.4
100 100 100 100 100
90-100
45-80
10-30 0-10 0-3
Bulk Specific Gravity (SSD)
2.625
Absorption Capacity 1.70%
Fine Aggregate
Fineness Modulus 2.99
Table 2.2 Properties of Coarse Aggregate From the Sheyenne Pit
Coarse Aggregate Sieve Analysis Sieve Size Cumulative % Passing NDDOT Specifications
1.5” 1”
3/4” 1/2'” 3/8” #4 #8 #16 #30 #50 #100 #200
100 100 93 55 21 0.6 0.3 0 0 0 0 0
100 100
95-100 25-65 15-55 0-10 0-5
Bulk Specific Gravity (SSD)
2.673 Fine Aggregate
Absorption Capacity 1.8%
10
2.4 Mix Design Methodology
All concrete mixes used for this research were designed to have a 1 to 1.5-inch slump and
an air content of approximately 6%. Calculations for the various mix designs were done with an
Excel spreadsheet program developed by Midwest Testing, Inc. This spreadsheet uses concrete
proportioning calculations to generate a volumetric mix design.
The control mix was designed in accordance with current NDDOT standards found in the
NDDOT’s Standard Specifications for Road and Bridge Construction, 1997, Volumes 1 and 2.
The control mix had a w/c ratio of 0.35 and a slump of 1.5 inches. An air-entraining admixture
was used for the control mix, but no water reducer was added. The w/c ratio used for the 5%
water-reduced mixes was 0.34. The w/c ratio used for the 8% water-reduced mixes was 0.33.
And the w/c ratio used for the 12% water-reduced mixes was 0.31. An example of a design
spreadsheet for a mix is contained in Appendix A.
2.5 Concrete Mixing Procedure
A 9 ft3 capacity concrete mixer was used for this study. The aggregates, cement, fly ash,
and water, required for each batch of concrete were weighed out using buckets and a scale
accurate to 0.01 pound. The air-entraining and water-reducing admixtures were measured with
graduated cylinders.
The procedure followed for mixing concrete batches was ASTM C 192-97. The mixing
process was done as follows:
1. Place all of the coarse aggregate in the mixer along with half of the water and the water
reducer.
2. Turn mixer on for approximately 10 seconds to allow rock and water to mix.
11
3. Stop mixer and place half of the fine aggregate and the air-entraining admixture in mixer.
4. Start mixer and slowly add all of the cement and fly ash.
5. Place remaining sand in mixer and use the remaining water to wash constituents from the
inside edges of mixer.
6. Mix materials for 3 minutes.
7. After the 3 minutes of mixing; shut off mixer, cover with a damp cloth, and allow the
concrete to sit for three minutes.
8. After the 3-minute rest, turn mixer back on for 2 minutes.
Once the concrete was completely mixed, it was tested for slump, unit weight,
temperature, and air content. Next, the concrete was cast into cylinders, beams, freeze-thaw
specimens, and slabs for the durability tests.
2.6 Test Methods
The following test methods were used for this research:
Concrete Slump Test - ASTM C 143-00/AASHTO T 119-99
Unit Weight and Yield of Concrete - ASTM C 138-01, AASHTO T 121-97
Air Content of Freshly Mixed Concrete - ASTM C 231-97/AASHTO T 152-01
Concrete Temperature – ASTM C 1064-01
Flexural Strength Testing - ASTM C 78-94, AASHTO T 97-97
Flexural tests on the cured concrete were performed on 1, 7, 14, 28, 56, and 90 days after
the batching day. The dimensions of the beam specimen used for the test were 21”x 6”x 6”.
Test specimens were cured in accordance with ASTM C 192-98. The following equation was
used to calculate the flexural strength:
12
Modulus of Rupture (psi) = Pl/bd2
Where: P is the maximum load (lbs.)
l is the span length (inches)
b is the ave. width (inches)
d is the ave. depth (inches)
Multiple specimens were broken for each test. The average strength of the specimens was
reported as the flexural strength of that mix.
Compressive Strength Testing - ASTM C 39-01, AASHTO T 22-97
Compressive tests on the cured concrete were performed on 1, 3, 7, 14, 28, 56, and 90
days after the batching day. The dimensions of the cylinders were 6” in diameter by 12” in
height. The test specimens were cured in accordance with ASTM C 192-98. Two steel caps
with neoprene inserts were used to support the specimens. The caps conform to ASTM C 1231-
00. The following equation was used to calculate the compressive strength:
Compressive Strength of Concrete (psi) =
Max. Applied Load (lbs)/Cross-sectional Area (in2)
Multiple specimens were broken for each test. The average strength of the specimens was
reported as the compressive strength of that mix.
Rapid Chloride Ion Permeability Test - ASTM C 1202-97
The equipment used for testing was the PROOVE IT system, version 1.3, manufactured
by Germann Instruments, In-Situ Test Systems. The slabs for the test specimens were cured for
a 24-hour period with plastic covering. After this 24-hour period, the slab was separated from
the wood forms and cured for a period of 56 days in the laboratory environment. A 4-inch
13
diameter diamond core drill was used to obtain cores. Three individual cores from each slab
were evaluated to determine a mean permeability for each mix design. Each core was cut into
four slices of 2-in. (+/- 0.125”) thickness using a wet-cut masonry saw. These four slices were
individually tested to obtain permeability data at 2-inch intervals through the depth of the slab.
Resistance of Concrete to Rapid Freezing and Thawing - ASTM C 666-97
For each design mix, two or three 4”x 3”x 16” specimens were cast in the laboratory with
embedded gauge studs at each end in accordance with ASTM C 192. After 24 hours of curing,
the specimens were removed from their molds and placed in a temperature controlled curing
room. After 14 days of curing, the specimens were either placed directly in the testing apparatus
for immediate testing, or placed in a freezer to keep the hydration process dormant until the test
apparatus was available for the next group of specimens.
There was one difference between the ASTM C 666 procedure and the procedure used
for this research. ASTM C 666 specifies that the specimens should be removed from the freeze-
thaw apparatus and tested for fundamental transverse frequency and length change (at most)
every 36 freeze-thaw cycles. For this research, the samples were removed and tested after about
every 50 freeze-thaw cycles. However the full freeze-thaw procedure was run for a total of 300
cycles in accordance with ASTM C 666.
Air-Void Analysis - ASTM C 457-98, procedure B ”modified point count method.”
A concrete specimen was prepared for each concrete mix for microscopic determination
of the air-void system parameters in hardened concrete. One half inch thick specimens were cut
axially from cores obtained in the same manner as the cores used for rapid chloride ion
permeability test.
14
Resistance of Concrete Surface to Deicing Chemicals - ASTM C 672
Two test specimens were prepared for each concrete mix for the deicer test. The
specimens were 13”x 13”x 3” concrete slabs. The specimens were first cured for 14 days and
then they were either subjected to the test right away or placed in a freezer. The specimens were
fitted with a latex caulk rim around their edges. This caulk was approximately 0.5” high. Next,
a 4% sodium chloride solution was placed on the top of the specimen to a depth of
approximately 0.25”. Sodium chloride was used for the test at the request of NDDOT because
this chemical is commonly used in North Dakota. The specimens were then put through 50
freeze-thaw cycles. This was accomplished by moving the specimens in and out of a freezer
room on specially designed carts. The freeze-thaw cycle usually occurred once per day.
15
Chapter 3
Experimental Test Results 3.1 Introduction
Experimental results from tests conducted on seventeen different concrete mixes are
presented in this chapter. Sixteen of the mixes were prepared using eight different commercially
available water-reducing admixtures at two dosage levels each. The results obtained for each
mix include, plastic properties, flexural strength, compressive strength, air-void characteristics,
freeze-thaw resistance, resistance of concrete to deicing chemicals, and concrete permeability.
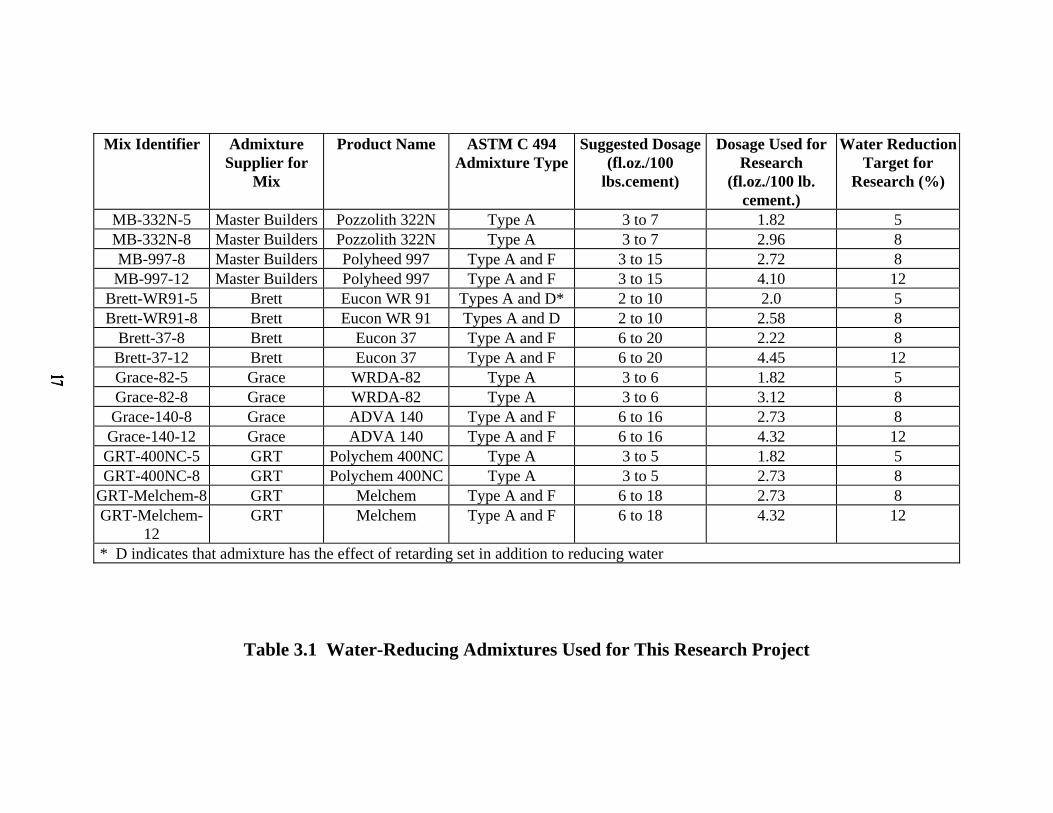
The various types of water reducer admixtures used for this research are listed in Table
3.1. The table lists four different admixture suppliers, the names of their admixtures,
identification codes for the mixes, water reduction targets for the mixes, suggested dosages for
the admixtures, dosages used for this research, and general water reducer range classification for
each admixture. The mix identification code contains the name of the supplier, a product
identifier, and the water reduction target for each mix. For example, MB-322N-5 stands for
Master Builders- Pozzolith 322N-5% water reduction.
3.2 Mix Design Proportions
Approximately 18.4 ft3 of concrete was produced in four 4.6 ft3 batches for each mix.
This amount of concrete was needed to prepare all of the specimens required for the durability
tests. The component proportions for each mix are listed in Tables 3.2 through 3.5. Table 3.2
also contains the plastic properties for the control mix. Detailed mix design spreadsheets for
each mix are contained in the Appendix G
16
Mix Identifier Admixture Supplier for
Mix
Product Name ASTM C 494 Admixture Type
Suggested Dosage(fl.oz./100
lbs.cement)
Dosage Used for Research
(fl.oz./100 lb. cement.)
Water Reduction Target for
Research (%)
MB-332N-5 Master Builders Pozzolith 322N Type A 3 to 7 1.82 5 MB-332N-8 Master Builders Pozzolith 322N Type A 3 to 7 2.96 8 MB-997-8 Master Builders Polyheed 997 Type A and F 3 to 15 2.72 8 MB-997-12 Master Builders Polyheed 997 Type A and F 3 to 15 4.10 12
Brett-WR91-5 Brett Eucon WR 91 Types A and D* 2 to 10 2.0 5 Brett-WR91-8 Brett Eucon WR 91 Types A and D 2 to 10 2.58 8
Brett-37-8 Brett Eucon 37 Type A and F 6 to 20 2.22 8 Brett-37-12 Brett Eucon 37 Type A and F 6 to 20 4.45 12 Grace-82-5 Grace WRDA-82 Type A 3 to 6 1.82 5 Grace-82-8 Grace WRDA-82 Type A 3 to 6 3.12 8 Grace-140-8 Grace ADVA 140 Type A and F 6 to 16 2.73 8 Grace-140-12 Grace ADVA 140 Type A and F 6 to 16 4.32 12 GRT-400NC-5 GRT Polychem 400NC Type A 3 to 5 1.82 5 GRT-400NC-8 GRT Polychem 400NC Type A 3 to 5 2.73 8
GRT-Melchem-8 GRT Melchem Type A and F 6 to 18 2.73 8 GRT-Melchem-
12 GRT Melchem Type A and F 6 to 18 4.32 12
* D indicates that admixture has the effect of retarding set in addition to reducing water
Table 3.1 Water-Reducing Admixtures Used for This Research Project
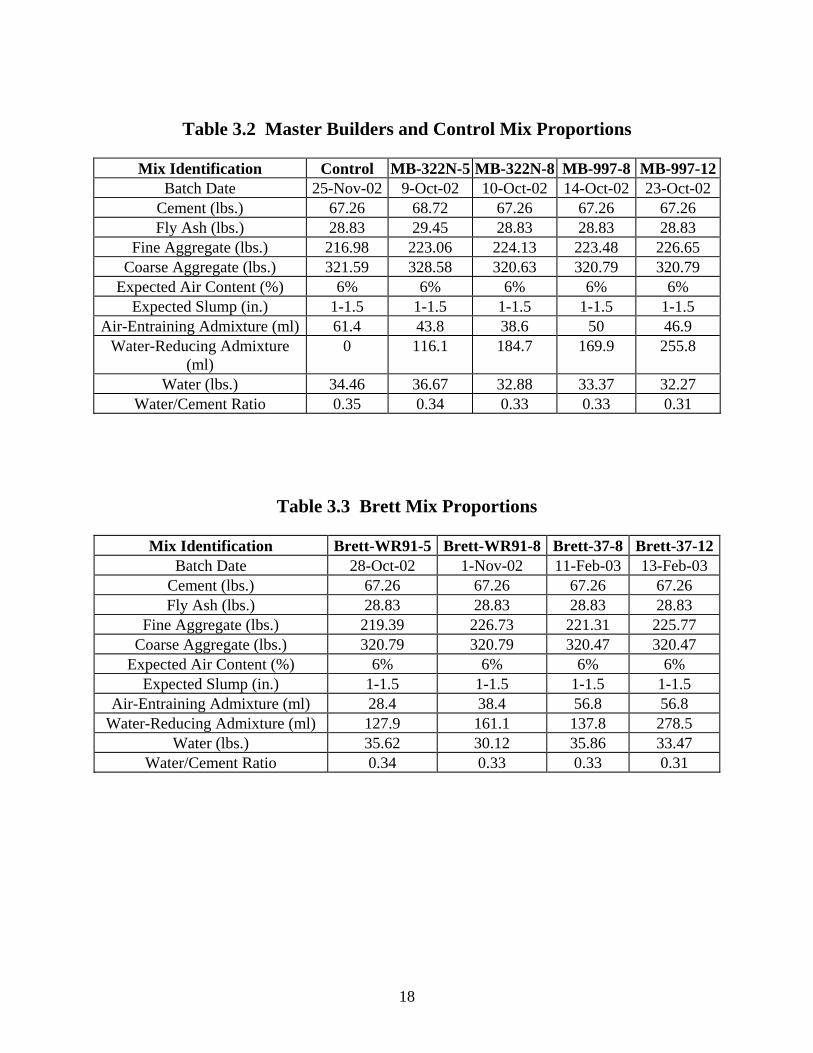
Table 3.2 Master Builders and Control Mix Proportions
Mix Identification Control MB-322N-5 MB-322N-8 MB-997-8 MB-997-12
Batch Date 25-Nov-02 9-Oct-02 10-Oct-02 14-Oct-02 23-Oct-02 Cement (lbs.) 67.26 68.72 67.26 67.26 67.26 Fly Ash (lbs.) 28.83 29.45 28.83 28.83 28.83
Fine Aggregate (lbs.) 216.98 223.06 224.13 223.48 226.65 Coarse Aggregate (lbs.) 321.59 328.58 320.63 320.79 320.79
Expected Air Content (%) 6% 6% 6% 6% 6% Expected Slump (in.) 1-1.5 1-1.5 1-1.5 1-1.5 1-1.5
Air-Entraining Admixture (ml) 61.4 43.8 38.6 50 46.9 Water-Reducing Admixture
(ml) 0 116.1 184.7 169.9 255.8
Water (lbs.) 34.46 36.67 32.88 33.37 32.27 Water/Cement Ratio 0.35 0.34 0.33 0.33 0.31
Table 3.3 Brett Mix Proportions
Mix Identification Brett-WR91-5 Brett-WR91-8 Brett-37-8 Brett-37-12Batch Date 28-Oct-02 1-Nov-02 11-Feb-03 13-Feb-03
Cement (lbs.) 67.26 67.26 67.26 67.26 Fly Ash (lbs.) 28.83 28.83 28.83 28.83
Fine Aggregate (lbs.) 219.39 226.73 221.31 225.77 Coarse Aggregate (lbs.) 320.79 320.79 320.47 320.47
Expected Air Content (%) 6% 6% 6% 6% Expected Slump (in.) 1-1.5 1-1.5 1-1.5 1-1.5
Air-Entraining Admixture (ml) 28.4 38.4 56.8 56.8 Water-Reducing Admixture (ml) 127.9 161.1 137.8 278.5
Water (lbs.) 35.62 30.12 35.86 33.47 Water/Cement Ratio 0.34 0.33 0.33 0.31
18
Table 3.4 Grace Mix Proportions
Mix Identification Grace-82-5 Grace-82-8 Grace-140-8 Grace-140-12
Batch Date 20-Feb-03 21-Feb-03 25-Feb-03 27-Feb-03 Cement (lbs.) 67.26 67.26 67.26 67.26 Fly Ash (lbs.) 28.83 28.83 28.83 28.83
Fine Aggregate (lbs.) 224.74 227.82 224.78 230.84 Coarse Aggregate (lbs.) 320.47 320.47 320.47 320.47
Expected Air Content (%) 6% 6% 6% 6% Expected Slump (in.) 1-1.5 1-1.5 1-1.5 1-1.5
Air-Entraining Admixture (ml) 38.4 39.8 44.0 46.9 Water-Reducing Admixture (ml) 113.7 194.7 170.5 270.0
Water (lbs.) 30.59 29.35 32.39 28.41 Water/Cement Ratio 0.34 0.33 0.33 0.31
Table 3.5 GRT Mix Proportions
Mix Identification GRT-400NC-5 GRT-400NC-8 GRT-Melchem-8
GRT-Melchem-12
Batch Date 2-Apr-03 4-Apr-03 29-Apr-03 6-May-03 Cement (lbs.) 67.26 67.26 67.26 67.26 Fly Ash (lbs.) 28.83 28.83 28.83 28.83
Fine Aggregate (lbs.) 225.81 227.82 232.38 230.84 Coarse Aggregate (lbs.) 323.19 321.91 323.51 321.59
Expected Air Content (%) 6% 6% 6% 6% Expected Slump (in.) 1-1.5 1-1.5 1-1.5 1-1.5
Air-Entraining Admixture (ml) 48.3 48.3 71.0 49.7 Water-Reducing Admixture (ml) 113.7 170.5 170.5 270.0
Water (lbs.) 26.8 27.91 23.83 27.29 Water/Cement Ratio 0.34 0.33 0.33 0.31
19
3.3 Plastic Properties of Mixes
The plastic properties measured for the design mixes include slump, air content, unit
weight, and w/c ratio. The two control variables used for the mixes were slump and air content.
The slump was controlled at 1 to 1.5 inches because this is in the range typically used for
slipform paving. The air content was controlled at approximately 6%. The plastic properties of
the control and water-reducer design mixes are summarized in Table 3.6. Additional detailed
batch data including batch temperatures for the mixes can be found in the Appendix G.
3.4 Flexural Strength Test Results
Flexural strength is an important indicator of concrete quality. The average flexural
strengths measured for the water reducer mixes after curing times of 1, 28, and 90 days are
summarized in Table 3.7. A complete set of flexural strength data, including 1, 7, 14, 28, 56,
and 90 day results is contained in the Appendix B-F.
3.5 Compressive Strength Test Results
Compressive strength is also an important indicator of concrete quality. The average
compressive strengths measured for the water reducer mixes after curing times of 1, 28, and 90
days are summarized in Table 3.8. A complete set of compressive strength data, including 1, 3,
7, 14, 28, 56, and 90 day results is contained in the Appendix B-F.
20
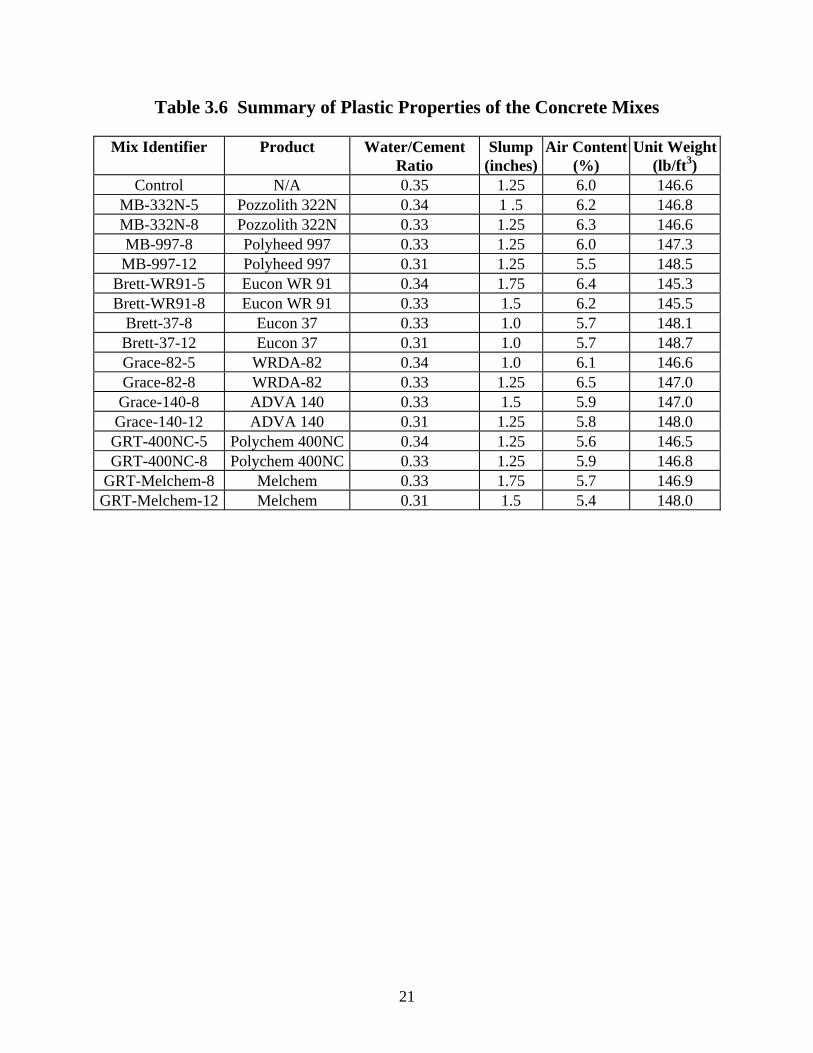
Table 3.6 Summary of Plastic Properties of the Concrete Mixes
Mix Identifier Product Water/Cement Ratio
Slump (inches)
Air Content (%)
Unit Weight(lb/ft3)
Control N/A 0.35 1.25 6.0 146.6 MB-332N-5 Pozzolith 322N 0.34 1 .5 6.2 146.8 MB-332N-8 Pozzolith 322N 0.33 1.25 6.3 146.6 MB-997-8 Polyheed 997 0.33 1.25 6.0 147.3 MB-997-12 Polyheed 997 0.31 1.25 5.5 148.5
Brett-WR91-5 Eucon WR 91 0.34 1.75 6.4 145.3 Brett-WR91-8 Eucon WR 91 0.33 1.5 6.2 145.5
Brett-37-8 Eucon 37 0.33 1.0 5.7 148.1 Brett-37-12 Eucon 37 0.31 1.0 5.7 148.7 Grace-82-5 WRDA-82 0.34 1.0 6.1 146.6 Grace-82-8 WRDA-82 0.33 1.25 6.5 147.0 Grace-140-8 ADVA 140 0.33 1.5 5.9 147.0 Grace-140-12 ADVA 140 0.31 1.25 5.8 148.0 GRT-400NC-5 Polychem 400NC 0.34 1.25 5.6 146.5 GRT-400NC-8 Polychem 400NC 0.33 1.25 5.9 146.8
GRT-Melchem-8 Melchem 0.33 1.75 5.7 146.9 GRT-Melchem-12 Melchem 0.31 1.5 5.4 148.0
21
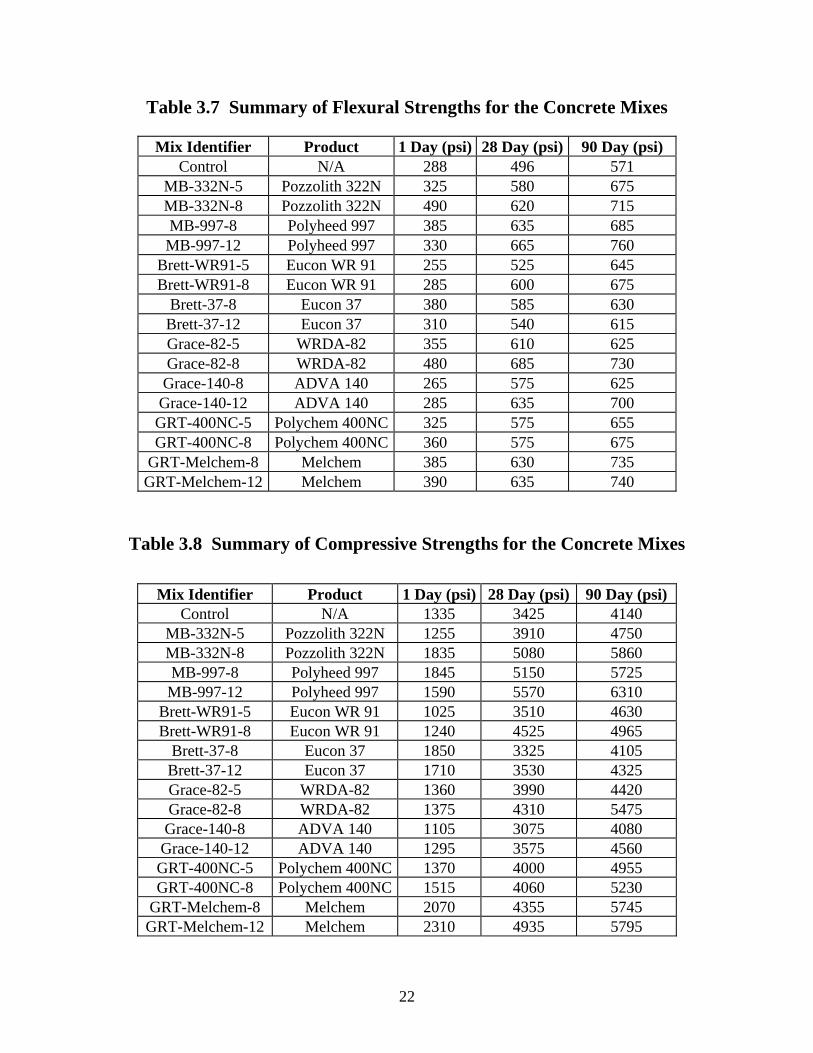
Table 3.7 Summary of Flexural Strengths for the Concrete Mixes
Mix Identifier Product 1 Day (psi) 28 Day (psi) 90 Day (psi) Control N/A 288 496 571
MB-332N-5 Pozzolith 322N 325 580 675 MB-332N-8 Pozzolith 322N 490 620 715 MB-997-8 Polyheed 997 385 635 685 MB-997-12 Polyheed 997 330 665 760
Brett-WR91-5 Eucon WR 91 255 525 645 Brett-WR91-8 Eucon WR 91 285 600 675
Brett-37-8 Eucon 37 380 585 630 Brett-37-12 Eucon 37 310 540 615 Grace-82-5 WRDA-82 355 610 625 Grace-82-8 WRDA-82 480 685 730 Grace-140-8 ADVA 140 265 575 625 Grace-140-12 ADVA 140 285 635 700 GRT-400NC-5 Polychem 400NC 325 575 655 GRT-400NC-8 Polychem 400NC 360 575 675
GRT-Melchem-8 Melchem 385 630 735 GRT-Melchem-12 Melchem 390 635 740
Table 3.8 Summary of Compressive Strengths for the Concrete Mixes
Mix Identifier Product 1 Day (psi) 28 Day (psi) 90 Day (psi) Control N/A 1335 3425 4140
MB-332N-5 Pozzolith 322N 1255 3910 4750 MB-332N-8 Pozzolith 322N 1835 5080 5860 MB-997-8 Polyheed 997 1845 5150 5725
MB-997-12 Polyheed 997 1590 5570 6310 Brett-WR91-5 Eucon WR 91 1025 3510 4630 Brett-WR91-8 Eucon WR 91 1240 4525 4965
Brett-37-8 Eucon 37 1850 3325 4105 Brett-37-12 Eucon 37 1710 3530 4325 Grace-82-5 WRDA-82 1360 3990 4420 Grace-82-8 WRDA-82 1375 4310 5475 Grace-140-8 ADVA 140 1105 3075 4080 Grace-140-12 ADVA 140 1295 3575 4560 GRT-400NC-5 Polychem 400NC 1370 4000 4955 GRT-400NC-8 Polychem 400NC 1515 4060 5230
GRT-Melchem-8 Melchem 2070 4355 5745 GRT-Melchem-12 Melchem 2310 4935 5795
22
3.6 Air-Void Analysis Test Results
Air content in concrete is an important factor relating to durability. Air-void analysis is
done to characterize the arrangement of air-voids in the hardened concrete matrix. The test
involves making a microscopic examination of the surface of a concrete section. Important
parameters determined with the air-void analysis include the total hardened air content, the
specific surface of the voids, and the spacing factor for the voids. Values for these parameters
measured for the control and water-reduced mixes can be found in Table 3.9.
3.7 Freeze-Thaw Test Results
Concrete specimens are subjected to 300 cycles of freezing and thawing for the freeze-
thaw test. Freeze-thaw results are an important indicator of the durability of concrete. Important
results from freeze-thaw tests include the durability factor, the weight loss of specimen, and the
length change of specimen. The averaged values for these parameters measured for the control
and water-reduced mixes are contained in Table 3.10. The complete data set for the freeze-thaw
tests is contained in the Appendix J.
3.8 Resistance of Concrete to Deicing Chemicals Test Results
This test is designed to evaluate the surface durability of cured concrete to common
deicing chemicals. For the test, concrete specimens were covered with a 4% sodium chloride
solution and subjected to 50 cycles of freezing and thawing. Sodium chloride was used at the
request of NDDOT for the test because it is the type of deicing chemical used on highways in
North Dakota. A numerical rating system used for evaluating the surface appearance of each
concrete specimen is explained in Table 3.11.
23
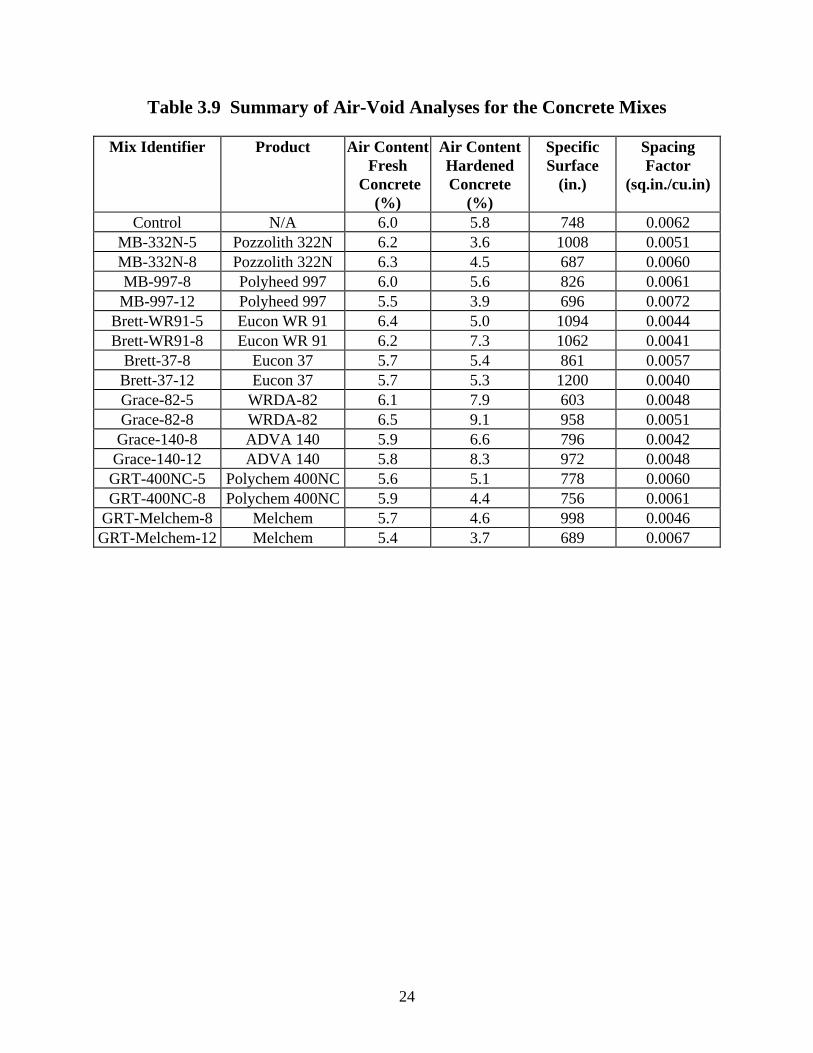
Table 3.9 Summary of Air-Void Analyses for the Concrete Mixes
Mix Identifier Product Air ContentFresh
Concrete (%)
Air Content Hardened Concrete
(%)
Specific Surface
(in.)
Spacing Factor
(sq.in./cu.in)
Control N/A 6.0 5.8 748 0.0062 MB-332N-5 Pozzolith 322N 6.2 3.6 1008 0.0051 MB-332N-8 Pozzolith 322N 6.3 4.5 687 0.0060 MB-997-8 Polyheed 997 6.0 5.6 826 0.0061 MB-997-12 Polyheed 997 5.5 3.9 696 0.0072
Brett-WR91-5 Eucon WR 91 6.4 5.0 1094 0.0044 Brett-WR91-8 Eucon WR 91 6.2 7.3 1062 0.0041
Brett-37-8 Eucon 37 5.7 5.4 861 0.0057 Brett-37-12 Eucon 37 5.7 5.3 1200 0.0040 Grace-82-5 WRDA-82 6.1 7.9 603 0.0048 Grace-82-8 WRDA-82 6.5 9.1 958 0.0051 Grace-140-8 ADVA 140 5.9 6.6 796 0.0042 Grace-140-12 ADVA 140 5.8 8.3 972 0.0048 GRT-400NC-5 Polychem 400NC 5.6 5.1 778 0.0060 GRT-400NC-8 Polychem 400NC 5.9 4.4 756 0.0061
GRT-Melchem-8 Melchem 5.7 4.6 998 0.0046 GRT-Melchem-12 Melchem 5.4 3.7 689 0.0067
24
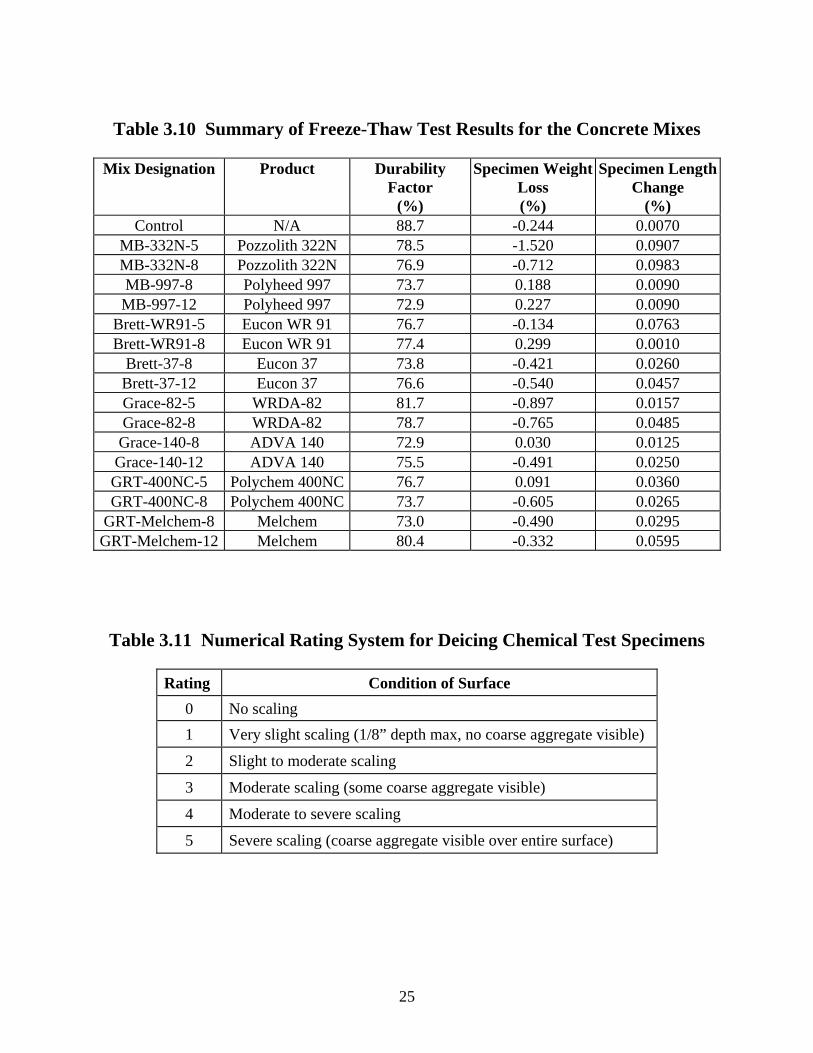
Table 3.10 Summary of Freeze-Thaw Test Results for the Concrete Mixes
Mix Designation Product Durability
Factor (%)
Specimen Weight Loss (%)
Specimen Length Change
(%) Control N/A 88.7 -0.244 0.0070
MB-332N-5 Pozzolith 322N 78.5 -1.520 0.0907 MB-332N-8 Pozzolith 322N 76.9 -0.712 0.0983 MB-997-8 Polyheed 997 73.7 0.188 0.0090 MB-997-12 Polyheed 997 72.9 0.227 0.0090
Brett-WR91-5 Eucon WR 91 76.7 -0.134 0.0763 Brett-WR91-8 Eucon WR 91 77.4 0.299 0.0010
Brett-37-8 Eucon 37 73.8 -0.421 0.0260 Brett-37-12 Eucon 37 76.6 -0.540 0.0457 Grace-82-5 WRDA-82 81.7 -0.897 0.0157 Grace-82-8 WRDA-82 78.7 -0.765 0.0485 Grace-140-8 ADVA 140 72.9 0.030 0.0125 Grace-140-12 ADVA 140 75.5 -0.491 0.0250 GRT-400NC-5 Polychem 400NC 76.7 0.091 0.0360 GRT-400NC-8 Polychem 400NC 73.7 -0.605 0.0265
GRT-Melchem-8 Melchem 73.0 -0.490 0.0295 GRT-Melchem-12 Melchem 80.4 -0.332 0.0595
Table 3.11 Numerical Rating System for Deicing Chemical Test Specimens
Rating Condition of Surface 0 No scaling 1 Very slight scaling (1/8” depth max, no coarse aggregate visible)
2 Slight to moderate scaling
3 Moderate scaling (some coarse aggregate visible)
4 Moderate to severe scaling
5 Severe scaling (coarse aggregate visible over entire surface)
25
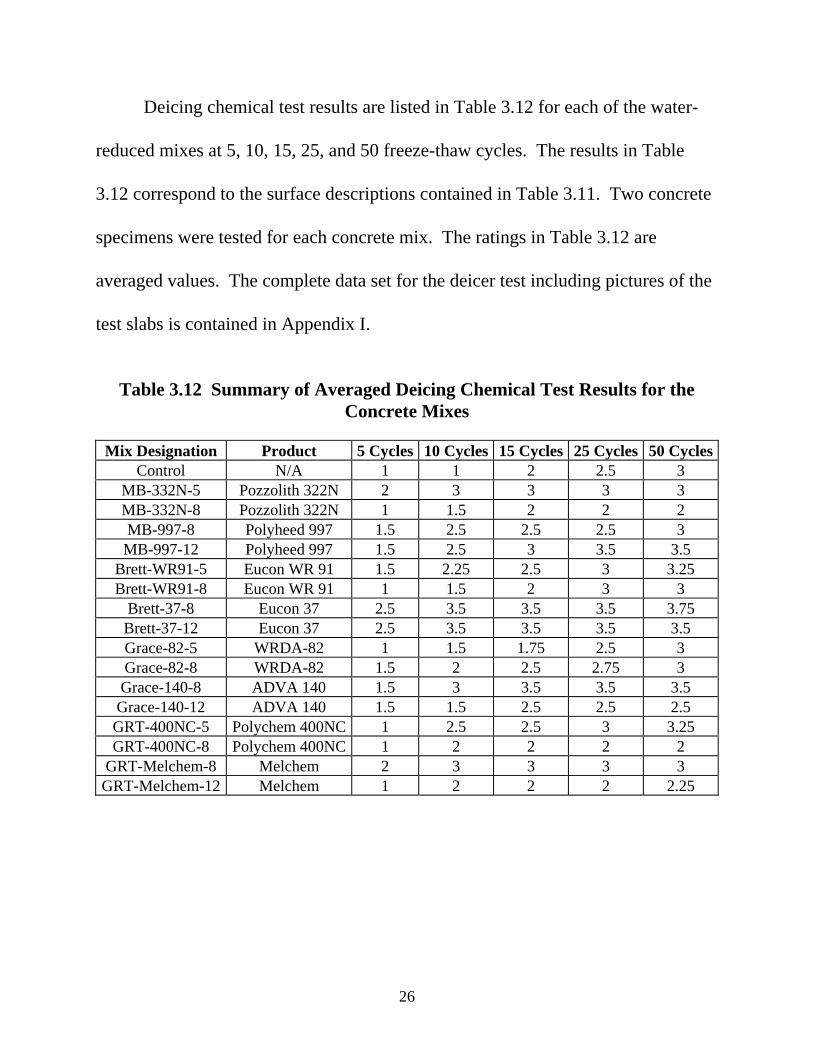
Deicing chemical test results are listed in Table 3.12 for each of the water-
reduced mixes at 5, 10, 15, 25, and 50 freeze-thaw cycles. The results in Table
3.12 correspond to the surface descriptions contained in Table 3.11. Two concrete
specimens were tested for each concrete mix. The ratings in Table 3.12 are
averaged values. The complete data set for the deicer test including pictures of the
test slabs is contained in Appendix I.
Table 3.12 Summary of Averaged Deicing Chemical Test Results for the
Concrete Mixes
Mix Designation Product 5 Cycles 10 Cycles 15 Cycles 25 Cycles 50 CyclesControl N/A 1 1 2 2.5 3
MB-332N-5 Pozzolith 322N 2 3 3 3 3 MB-332N-8 Pozzolith 322N 1 1.5 2 2 2 MB-997-8 Polyheed 997 1.5 2.5 2.5 2.5 3 MB-997-12 Polyheed 997 1.5 2.5 3 3.5 3.5
Brett-WR91-5 Eucon WR 91 1.5 2.25 2.5 3 3.25 Brett-WR91-8 Eucon WR 91 1 1.5 2 3 3
Brett-37-8 Eucon 37 2.5 3.5 3.5 3.5 3.75 Brett-37-12 Eucon 37 2.5 3.5 3.5 3.5 3.5 Grace-82-5 WRDA-82 1 1.5 1.75 2.5 3 Grace-82-8 WRDA-82 1.5 2 2.5 2.75 3 Grace-140-8 ADVA 140 1.5 3 3.5 3.5 3.5 Grace-140-12 ADVA 140 1.5 1.5 2.5 2.5 2.5 GRT-400NC-5 Polychem 400NC 1 2.5 2.5 3 3.25 GRT-400NC-8 Polychem 400NC 1 2 2 2 2
GRT-Melchem-8 Melchem 2 3 3 3 3 GRT-Melchem-12 Melchem 1 2 2 2 2.25
26
3.9 Permeability Test Results
Permeability of concrete as measured by the rapid chloride ion permeability test is based
on the amount of electrical charge passed through a specially prepared concrete specimen during
the testing period. The permeability of the concrete is then classified as high, moderate, low,
very low, or negligible based on the rating system shown in Table 3.13.
Table 3.13 Permeability Rating Chart
Rating Number of Coulombs Passed High (H) > 4,000
Moderate (M) 2,000-4,000
Low (L) 1,000-2,000
Very Low (VL) 100-1,000 Negligible (N) < 100
The permeability test results for the water reducer mixes are contained in Table 3.14.
The table lists the coulombs of current passed and the permeability classification for 2-inch thick
sections cut at depths of 0-2”, 2-4”, 4-6”, and 6-8” from an 8-inch concrete core from a test slab.
The 0-2” section came from the top (finished) portion of the slab. The permeability values
reported in the table are averaged from three test specimens, the complete set of test results are
contained in the Appendix H.
27
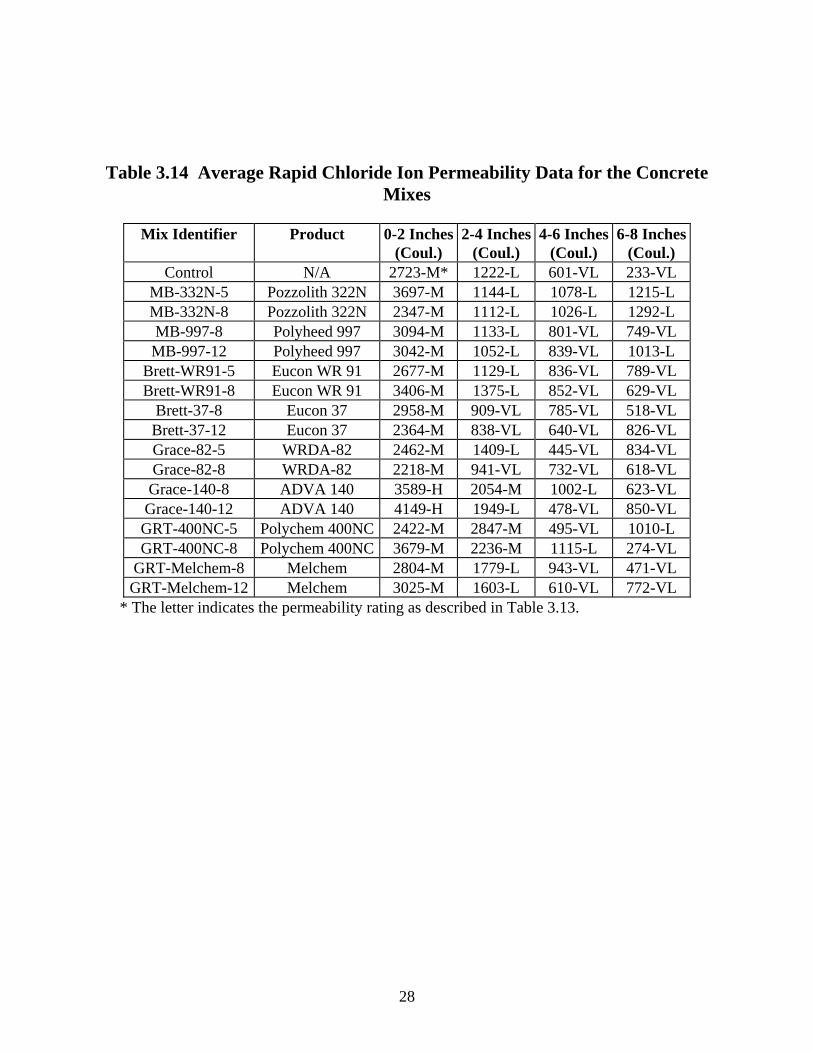
Table 3.14 Average Rapid Chloride Ion Permeability Data for the Concrete Mixes
Mix Identifier Product 0-2 Inches
(Coul.) 2-4 Inches
(Coul.) 4-6 Inches
(Coul.) 6-8 Inches
(Coul.) Control N/A 2723-M* 1222-L 601-VL 233-VL
MB-332N-5 Pozzolith 322N 3697-M 1144-L 1078-L 1215-L MB-332N-8 Pozzolith 322N 2347-M 1112-L 1026-L 1292-L MB-997-8 Polyheed 997 3094-M 1133-L 801-VL 749-VL MB-997-12 Polyheed 997 3042-M 1052-L 839-VL 1013-L
Brett-WR91-5 Eucon WR 91 2677-M 1129-L 836-VL 789-VL Brett-WR91-8 Eucon WR 91 3406-M 1375-L 852-VL 629-VL
Brett-37-8 Eucon 37 2958-M 909-VL 785-VL 518-VL Brett-37-12 Eucon 37 2364-M 838-VL 640-VL 826-VL Grace-82-5 WRDA-82 2462-M 1409-L 445-VL 834-VL Grace-82-8 WRDA-82 2218-M 941-VL 732-VL 618-VL Grace-140-8 ADVA 140 3589-H 2054-M 1002-L 623-VL Grace-140-12 ADVA 140 4149-H 1949-L 478-VL 850-VL GRT-400NC-5 Polychem 400NC 2422-M 2847-M 495-VL 1010-L GRT-400NC-8 Polychem 400NC 3679-M 2236-M 1115-L 274-VL
GRT-Melchem-8 Melchem 2804-M 1779-L 943-VL 471-VL GRT-Melchem-12 Melchem 3025-M 1603-L 610-VL 772-VL
* The letter indicates the permeability rating as described in Table 3.13.
28
Chapter 4
Discussion and Analysis of Results 4.1 Compressive and Flexural Strength Test Results
Water-reducing admixtures generally produce an increase in the strength of concrete as
the w/c ratio is reduced. For concretes of equal cement content, air content, and slump; the 28-
day strength of a water-reduced concrete can be 10% to 25% greater than concrete without water
reducing admixture (Ref. 1).
The 28-day unconfined compressive strengths and 28-day flexural strengths of the
concrete mixes prepared for this study are shown in Figure 4.1 and Figure 4.2 respectively. The
figures show that strengths measured for the water-reduced mixes were generally higher than the
control. A specific identifier for each mix is written below the x-axis in the figures. For each
mix, the identifier indicates the admixture supplier, the type of admixture used, and the
percentage water reduction achieved. See Table 3.1 for more information about the various
admixtures.
It appears that the mixes generally followed the expected trend of increasing strength
with decreasing w/c ratio. The averaged 28-day compressive and 28-day flexural strengths of
the 5%, 8%, and 12% water-reduced mixes are plotted versus w/c ratio in Figure 4.3 and Figure
4.4 respectively. Both figures show a consistent increase in average concrete strength as the w/c
ratio of the mixes decrease. (The w/c ratio for the control mix was 0.35, the w/c ratio for the 5%
water-reduced mixes was 0.34, the w/c ratio for the 8% water-reduced mixes was 0.33, and the
w/c ratio for the 12% water-reduced mixes was 0.31).
29
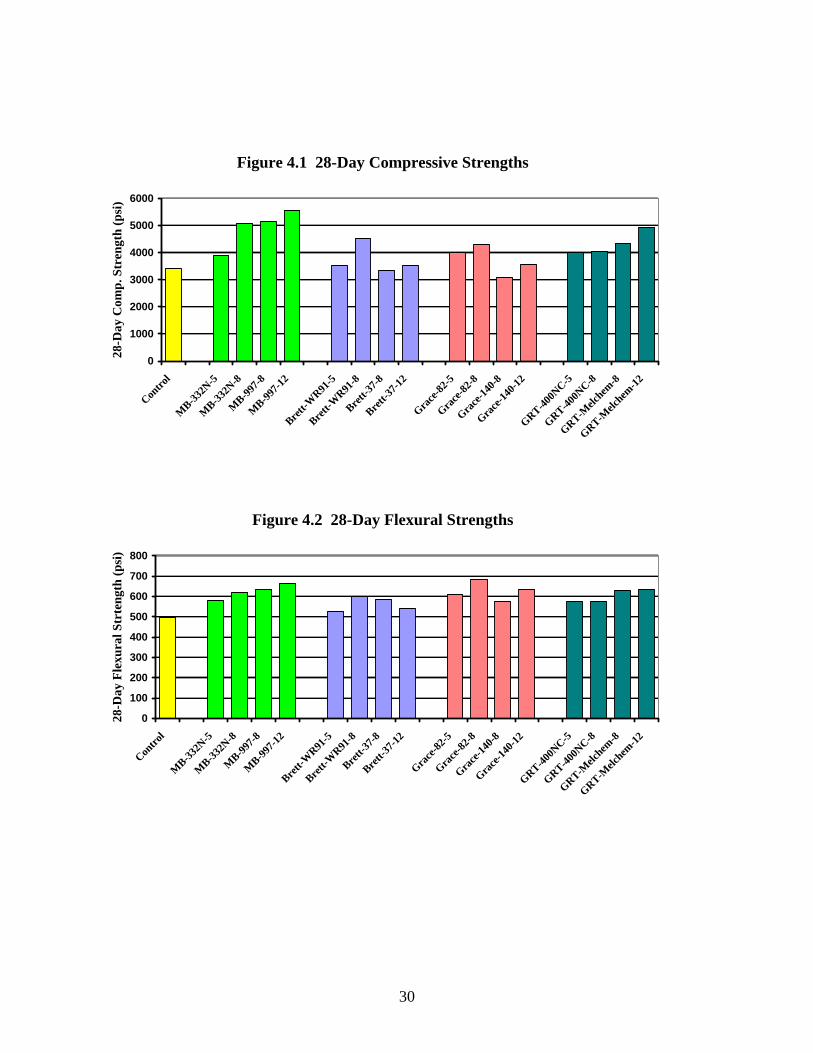
Figure 4.1 28-Day Compressive Strengths
0
1000
2000
3000
4000
5000
6000
Contro
l
MB-33
2N-5
MB-33
2N-8
MB-99
7-8
MB-99
7-12
Brett-W
R91-5
Brett-W
R91-8
Brett-3
7-8
Brett-3
7-12
Grace-
82-5
Grace-
82-8
Grace-
140-8
Grace-
140-1
2
GRT-400N
C-5
GRT-400N
C-8
GRT-Melc
hem-8
GRT-Melc
hem-12
28-D
ay C
omp.
Str
engt
h (p
si)
Figure 4.2 28-Day Flexural Strengths
0
100
200
300
400
500
600
700
800
Contro
l
MB-33
2N-5
MB-33
2N-8
MB-99
7-8
MB-99
7-12
Brett-W
R91-5
Brett-W
R91-8
Brett-3
7-8
Brett-3
7-12
Grace-
82-5
Grace-
82-8
Grace-
140-8
Grace-
140-1
2
GRT-400N
C-5
GRT-400N
C-8
GRT-Melc
hem-8
GRT-Melc
hem-12
28-D
ay F
lexu
ral S
trte
ngth
(psi
)
30
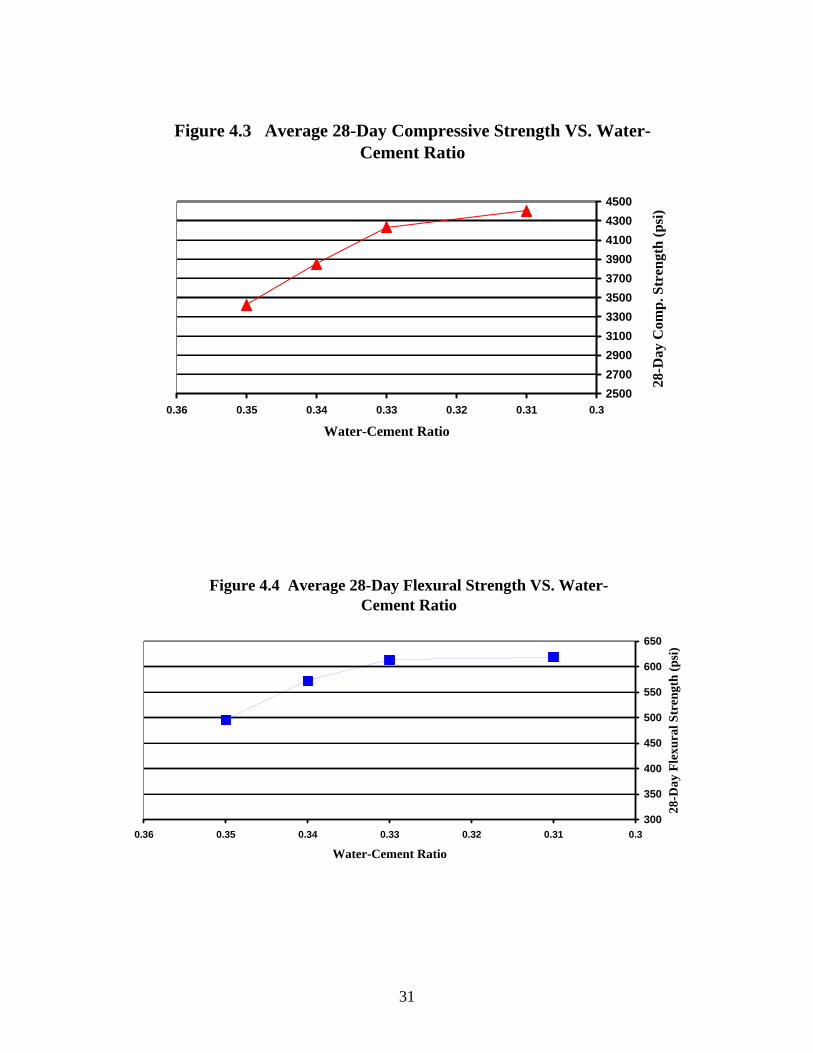
Figure 4.3 Average 28-Day Compressive Strength VS. Water-Cement Ratio
25002700290031003300350037003900410043004500
0.30.310.320.330.340.350.36
Water-Cement Ratio
28-D
ay C
omp.
Str
engt
h (p
si)
Figure 4.4 Average 28-Day Flexural Strength VS. Water-Cement Ratio
300
350
400
450
500
550
600
650
0.30.310.320.330.340.350.36
Water-Cement Ratio
28-D
ay F
lexu
ral S
tren
gth
(psi
)
31
4.2 Freeze-Thaw Durability Test Results
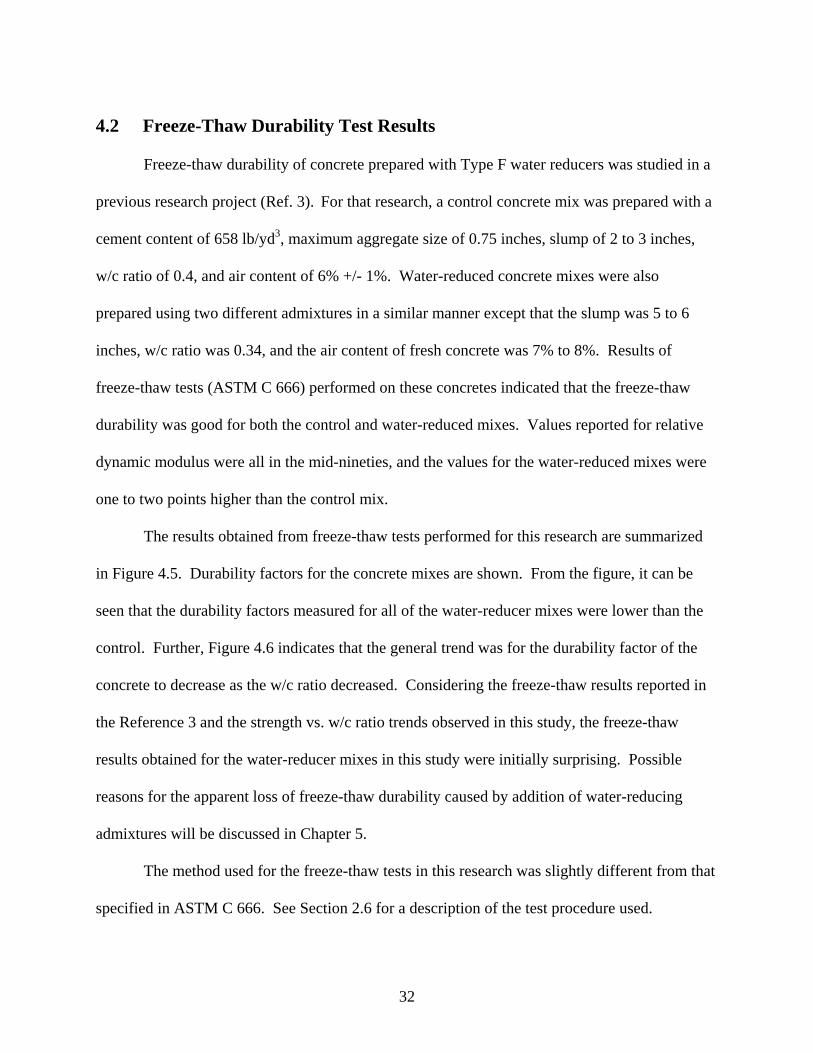
Freeze-thaw durability of concrete prepared with Type F water reducers was studied in a
previous research project (Ref. 3). For that research, a control concrete mix was prepared with a
cement content of 658 lb/yd3, maximum aggregate size of 0.75 inches, slump of 2 to 3 inches,
w/c ratio of 0.4, and air content of 6% +/- 1%. Water-reduced concrete mixes were also
prepared using two different admixtures in a similar manner except that the slump was 5 to 6
inches, w/c ratio was 0.34, and the air content of fresh concrete was 7% to 8%. Results of
freeze-thaw tests (ASTM C 666) performed on these concretes indicated that the freeze-thaw
durability was good for both the control and water-reduced mixes. Values reported for relative
dynamic modulus were all in the mid-nineties, and the values for the water-reduced mixes were
one to two points higher than the control mix.
The results obtained from freeze-thaw tests performed for this research are summarized
in Figure 4.5. Durability factors for the concrete mixes are shown. From the figure, it can be
seen that the durability factors measured for all of the water-reducer mixes were lower than the
control. Further, Figure 4.6 indicates that the general trend was for the durability factor of the
concrete to decrease as the w/c ratio decreased. Considering the freeze-thaw results reported in
the Reference 3 and the strength vs. w/c ratio trends observed in this study, the freeze-thaw
results obtained for the water-reducer mixes in this study were initially surprising. Possible
reasons for the apparent loss of freeze-thaw durability caused by addition of water-reducing
admixtures will be discussed in Chapter 5.
The method used for the freeze-thaw tests in this research was slightly different from that
specified in ASTM C 666. See Section 2.6 for a description of the test procedure used.
32
Figure 4.5 Durability Factors from Freeze-Thaw Tests
0102030405060708090
100
Contro
l
MB-33
2N-5
MB-33
2N-8
MB-99
7-8
MB-99
7-12
Brett-W
R91-5
Brett-W
R91-8
Brett-3
7-8
Brett-3
7-12
Grace-
82-5
Grace-
82-8
Grace-
140-8
Grace-
140-1
2
GRT-400N
C-5
GRT-400N
C-8
GRT-Melc
hem-8
GRT-Melc
hem-12
Dur
abili
ty F
acto
r (%
)
Figure 4.6 Freeze-Thaw Durability Factor VS. Water-Cement Ratio
74
76
78
80
82
84
86
88
90
0.30.310.320.330.340.350.36
Water-Cement Ratio
Dur
abili
ty F
acto
r
33
4.3 Rapid Chloride Ion Permeability Test Results
Rapid chloride ion permeability of concrete prepared with Type F water reducing
admixtures was evaluated in Reference 2. For that research, a control concrete mix was prepared
with a cement content of 545 lb/yd3, a w/c of 0.5, a slump of 3 to 5 inches, and an air content of
6% +/- 1%. Concrete mixes were then prepared with water contents about 16% lower than the
control using three different Type F admixtures. Results from rapid chloride ion permeability
tests (AASHTO T 277) performed on specimens from the top 2 inches of concretes prepared for
this study indicated that the control and water-reducer mixes all exhibited rapid chloride ion
permeabities in the moderate range (i.e., 2000 to 4000 coulombs passed).
The results of rapid chloride ion permeability tests performed for this research are
presented in Figure 4.7. The figure shows the charge passed by specimens cut from the top two
inches of concrete slabs prepared for the control and sixteen water-reducer mixes. The control
and fourteen of the water-reducer mixes exhibited moderate permeability (i.e., 2000 to 4000
coulombs passed). Two of the water-reducer mixes exhibited high permeability (i.e., > 4000
coulombs passed). The rapid chloride ion permeability results obtained for this study are similar
to those contained in Reference 2, however the mixes discussed in Reference 2 exhibited better
ASTM C 666 freeze-thaw durability. Their values for relative dynamic modulus were in the
range of 94% to 98% for the control and water-reducer mixes.
34
Figure 4.7 Rapid Chloride Ion Permeabilities - Top 2 Inches of Water-Reduced Concrete Slabs
010002000300040005000600070008000
Contro
l
MB-33
2N-5
MB-33
2N-8
MB-99
7-8
MB-99
7-12
Brett-W
R91-5
Brett-W
R91-8
Brett-3
7-8
Brett-3
7-12
Grace-
82-5
Grace-
82-8
Grace-
140-8
Grace-
140-1
2
GRT-400N
C-5
GRT-400N
C-8
GRT-Melc
hem-8
GRT-Melc
hem-12
Perm
eabi
lity
(Cou
l. Pa
ssed
)
4.4 Resistance to Deicer Scaling Test Results
Resistance to deicer scaling (ASTM C 672) was also measured for concretes prepared
with Type F water reducing admixtures in the two previous studies discussed above (Refs. 2 and
3). The results from these two studies indicated that after 50 cycles of freezing and thawing, the
water-reducer mixes exhibited very slight to moderate scaling (i.e., ratings of 1 to 3 as per
ASTM C 672).
The results of the deicer scaling tests performed on the water-reducer mixes for this study
are contained in Table 3.12. These results indicate that after 50 cycles of freezing and thawing,
the water-reducer mixes exhibited scaling characteristics ranging from slight-moderate to
moderate-severe (i.e., ratings of 2 to 4 as per ASTM C 672). However there is one difference
between the methods used to conduct the deicer scaling tests, the current study used sodium
chloride as the deicing chemical and the previous studies used calcium chloride. (See Section
2.6 for further discussion of the deicer test method.)
35
4.5 Analysis of Air Void System Test Results
Air-void spacing and air-void size in hardened concrete are two important factors
contributing to freeze-thaw resistance in concrete. Research has shown that in general for a
concrete to have adequate resistance to freezing and thawing, the air-void spacing factor should
not exceed 0.008 inches and the air-void specific surface should be 600 sq in./cu in. or greater
(Ref.1, pg 131).
The results of air-void analyses conducted for this research are contained in Table 3.9.
The results show that (1) all of the air-void spacing factors were less than 0.008 inches and (2)
all of the air-void specific surfaces were greater than 600 sq in./cu in. The results indicate that
for these two parameters, the samples from the control all of the water-reduced mixes were
within acceptable limits for adequate freeze-thaw resistance.
36
Chapter 5
Summary and Conclusions
The objective of this research was to determine the effects of water-reducing admixtures
on the strength and durability characteristics of concrete materials designed based on current mix
design procedures used by the NDDOT per their standards and specifications. Four brands of
water reducers that are commonly used in the State of North Dakota were selected for study.
Brett, GRT, Grace, and Master Builders supplied the admixtures. Each company sent two
different water reducers along with an air-entraining admixture. Batches of concrete were
prepared using each product. The characteristics of the concretes produced were evaluated by
performing the following tests on appropriately prepared specimens:
• Compressive strength (AASHTO T-22)
• Flexural strength (AASHTO T-97)
• Resistance of concrete to rapid freezing and thawing (ASTM C 666)
• Rapid chloride ion permeability (ASTM C 1202)
• Air-void analysis on hardened concrete (ASTM C 457), and
• Resistance of concrete surface to deicing chemicals (ASTM C 672)
One of the water reducers supplied by each company was used to produce two concrete
mixes with targeted water reduction percentages of 5% and 8%, and the other was used to
produce two concrete mixes with targeted water reduction percentages of 8% and 12%.
Thus a total of sixteen different concrete mixes were prepared for this research using
eight different water-reducing admixtures. In addition, a control mix was prepared
without water reducer for comparison purposes. The control mix was designed based on
37
the NDDOT’s Standards and Specifications for Road and Bridge Construction, 1997,
Volumes 1 and 2.
The results obtained from this study for the water-reduced concrete mixes studied are
summarized as follows:
• Results obtained from the strength tests done on the control and water-reducer mixes
prepared for this study appear to be generally consistent with results obtained from
previous research. Compressive and flexural strengths were consistently higher than the
control mix and the strengths tended to increase as the w/c ratio of the concrete
decreased.
• Results obtained from the freeze-thaw tests done for this study indicate that all of the
concrete mixes that contained water-reducing admixtures had significantly lower freeze-
thaw durability compared to the control mix. These freeze-thaw test results do not agree
with results obtained from previous studies.
• Results from the deicer scaling tests obtained for this study generally indicate scaling in
the moderate to moderate/severe range. Previous studies reported results from deicer
scaling tests in the slight/moderate to moderate range.
• Results from rapid chloride ion permeability tests obtained for this study were in the
moderate range for the control and most of the water-reduced mixes. Two of the water-
reduced mixes exhibited permeabilities in the high range.
• For the control and the water reduced mixes, all of the air-void specific surfaces
measured were greater than 600 sq in./cu in. and all of the air-void spacing factors
measured were less than 0.008 inches. The average air-void spacing factor and specific
surface measured for all of the water-reduced mixes were 0.0054 inches and 858 sq in./cu
38
in. respectively. The results indicate that for these two parameters, the samples prepared
from the control mix and all of the water-reduced mixes were within acceptable limits for
adequate freeze-thaw resistance.
In general, the concretes prepared for this study using water-reducing admixtures did not
perform as well as the water-reduced mixes studied in previous research (as reported in Refs. 2
and 3). The major difference between the mix designs used for the current research and previous
research (aside from obvious differences such as sources of cement, aggregate, and water reducer
admixtures) are (1) the current study used 30% fly ash for cement replacement while previous
studies did not use fly ash, (2) the current study used slightly lower w/c ratios for some mixes,
(3) the current study used a target slump of 1.5 inches while the previous studies used target
slumps of 3 to 6 inches, and (4) the current study used lower water reducer dosages than
previous studies to maintain the 1.5-inch target slump.
It is unlikely that fly ash addition had a significant adverse effect on the durability of the
water-reduced concretes. This conclusion is supported by previous research which has shown
that properly air-entrained and cured concrete containing fly ash has similar freeze-thaw
resistance to non-fly ash amended concrete (Ref. 1, pp 66 – 67).
It is also unlikely that the air-void system in the hardened concrete caused the observed
low freeze-thaw durability, since all of the specimens exhibited air-void spacing factors and
specific surface areas generally recognized to be acceptable for good freeze-thaw durability.
This suggests that the problem may have been with the bonding of the cement paste to the
aggregate rather than with formation of the air-voids.
It is more likely that the combined effects produced by using low w/c ratios and low
water-reducer dosages resulted in the poor freeze-thaw durability observed for the water-reduced
39
concrete mixes. The low w/c ratios for the water-reduced mixes were necessary because of the
initial low w/c ratio (0.35) used for the control mix. The low dosages of water-reducing
admixture were necessary to maintain a 1.5-inch target slump in the concrete mixes; and the 1.5-
inch target slump was required for slipform pavement construction.
Table 3.1 contains some information that supports this conclusion. The suggested
dosages (based on manufacturers recommendations) for the various water-reducing admixtures
used for this study are listed in column 5 and the actual dosages used are listed in column 6. In
every case, the dosage used was either below or just slightly above the minimum suggested
dosage for the admixture.
Water-reducing admixtures tend to disperse the cement as concrete is mixed, which can
help to compensate for low water content. But in this study, the amount of admixture added was
limited because the admixture increased the slump. The net result may have been that too little
admixture was added to the mixes to effectively disperse the cement. Thus it may be that the
combination of low w/c ratio and low admixture dosage limited the dispersal and hydration of
cement in the concrete mixes.
Some visual observations made during the compressive strength tests also suggest that
there was a problem with cement activation. It was noticed that many of the specimens broke
around the top rim of the cylinders and that the concrete was crumbling and pulling away from
the aggregate at the point of the break. These observations suggest that the cement paste was not
adhering properly to the aggregate, which could occur if the cement was not properly activated.
40
Chapter 6
Recommendations
The results of this research indicate that the water-reduced concrete mixes studied
exhibited poor freeze-thaw durability. The reason for the poor durability may have been that
there was not enough water and/or water-reducing admixture being added to the mixes. The
following recommendations suggest some possible ways to increase the durability of the water-
reduced mixes.
One possible way of increasing the durability of the water-reduced concretes could be to
redesign the control mix with a higher w/c ratio while maintaining a 1.5-inch slump. If for
example, the w/c ratio of the control mix was increased to 0.40, then the w/c ratios of the water-
reduced mixes could be increased proportionately. Increased durability might be achieved with
more water available to hydrate the cement.
Another way to improve the performance of the water-reduced concrete mixes might be
to use a water-reducing admixture that does not increase the slump of the mix as much as the
additives used for this study. Thus more of the admixture could be added to the concrete while
still maintaining a low slump. This approach could be studied in future research.
A different means of increasing the durability of the water-reduced mixes could be to
increase the target slump for the mixes. Previous research reported in Reference 3 suggests that
initial design slumps for water-reduced concretes used for highway pavement should be in the
range of 5 to 6 inches and that this slump should be obtained by increasing the dosage of water
41
reducer, not by increasing water content. Thus by increasing the allowable slump, more water
reducer could be added to the concrete and the cement would be more effectively activated.
Using a higher slump for the mix design might cause a problem with placing the
concrete. However, a significant amount of initial slump loss is fairly typical of water-reduced
concrete. Thus a higher initial slump could actually help to counter the expected slump loss.
42
Appendix A Sample Mix Spreadsheet
and Material Information
• Sample Mix Spreadsheets • Description of Materials • Cement Properties • Fly Ash Properties
A1
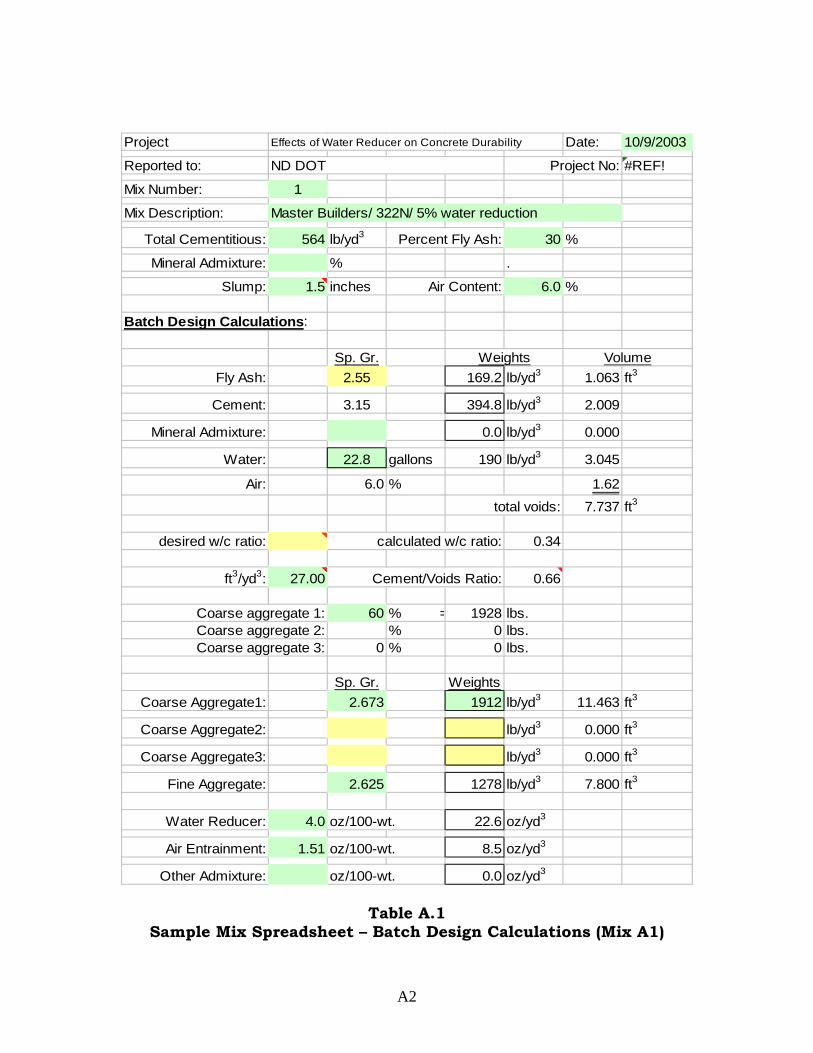
Project Date: 10/9/2003
Reported to: Project No: #REF!
Mix Number: 1
Mix Description:
Total Cementitious: 564 lb/yd3 Percent Fly Ash: 30 %
Mineral Admixture: % .
Slump: 1.5 inches Air Content: 6.0 %
Batch Design Calculations:
Sp. Gr. Weights VolumeFly Ash: 2.55 169.2 lb/yd3 1.063 ft3
Cement: 3.15 394.8 lb/yd3 2.009
Mineral Admixture: 0.0 lb/yd3 0.000
Water: 22.8 gallons 190 lb/yd3 3.045
Air: 6.0 % 1.62
total voids: 7.737 ft3
desired w/c ratio: calculated w/c ratio: 0.34
ft3/yd3: 27.00 Cement/Voids Ratio: 0.66
Coarse aggregate 1: 60 % = 1928 lbs.Coarse aggregate 2: % 0 lbs.Coarse aggregate 3: 0 % 0 lbs.
Sp. Gr. WeightsCoarse Aggregate1: 2.673 1912 lb/yd3 11.463 ft3
Coarse Aggregate2: lb/yd3 0.000 ft3
Coarse Aggregate3: lb/yd3 0.000 ft3
Fine Aggregate: 2.625 1278 lb/yd3 7.800 ft3
Water Reducer: 4.0 oz/100-wt. 22.6 oz/yd3
Air Entrainment: 1.51 oz/100-wt. 8.5 oz/yd3
Other Admixture: oz/100-wt. 0.0 oz/yd3
Effects of Water Reducer on Concrete Durability
ND DOT
Master Builders/ 322N/ 5% water reduction
Table A.1 Sample Mix Spreadsheet – Batch Design Calculations (Mix A1)
A2
Trial Batch Calculations:Moistures: Total Moisture Absorption
Coarse Aggregate 1: 0.5 % 1.8 %
Coarse Aggregate 2: % %
Coarse Aggregate 3: % %
Fine Aggregate: 2.0 % 1.7 %
Trial Batch Weights:27.0 ft3 1.0 ft3 4.7 ft3
169.2 lbs. 6.27 lbs. 29.45 lbs.394.8 lbs. 14.62 lbs. 68.72 lbs.
0.0 lbs. 0.00 lbs. 0.00 lbs.1888 lbs. 69.91 lbs. 328.58 lbs.
0 lbs. 0.00 lbs. 0.00 lbs.0 lbs. 0.00 lbs. 0.00 lbs.
1281 lbs. 47.46 lbs. 223.06 lbs.22.6 oz. 24.71 ml 116.1 ml8.5 oz. 9.33 ml 43.8 ml0.0 oz. 0.00 ml 0.0 ml
-2.5 gallons -0.76 lbs. -3.59 lbs.25.3 gallons 7.80 lbs. 36.67 lbs.
3943.7 lbs. 146.1 lbs. 686.49 lbs.
Tests 1 2 3 4 Water AddedSlump 1 1/2 1 3/4 1 1/4 1 Initial Wt. Air 6.1 6.9 6.0 5.7 Final Wt. Total Wt. 44.04 43.82 44.12 44.6 Net Wt.
Con. Wt. 36.32 36.10 36.40 36.86 Free Water
Unit Wt. 146.45 145.56 146.77 148.63 Add Water
Temp. 71 70 70 70 Total
Yield 26.93 27.09 26.87 26.53 W/C RatioTime 16:15 17:00 17:30 18:15
Total Batch Weight
Coarse Aggregate 1Coarse Aggregate 2
Fine AggregateWater Reducer
Coarse Aggregate 3
Other Admixture
Add Water
Air Entrainment
Free Water
Mineral Admixture
SizeFly AshCement
Table A.2 Sample Mix Spreadsheet – Trial Batch
Calculations and Weights (Mix A1)
A3
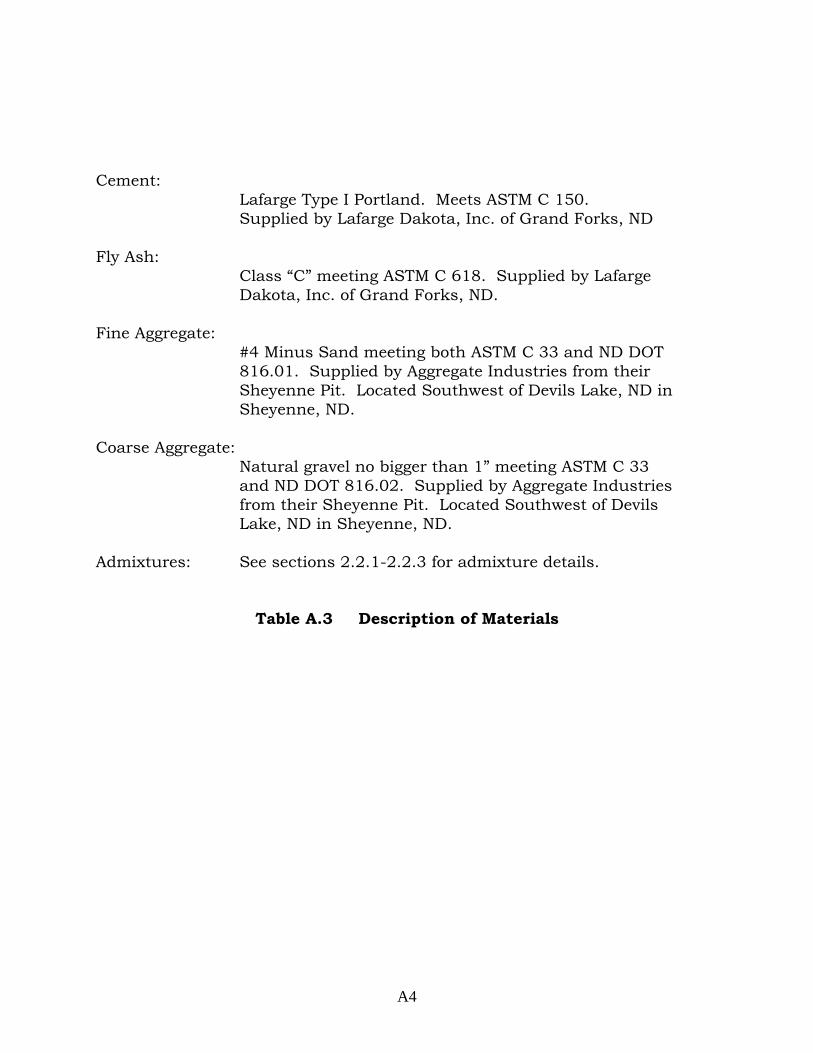
Cement:
Lafarge Type I Portland. Meets ASTM C 150. Supplied by Lafarge Dakota, Inc. of Grand Forks, ND Fly Ash:
Class “C” meeting ASTM C 618. Supplied by Lafarge Dakota, Inc. of Grand Forks, ND.
Fine Aggregate:
#4 Minus Sand meeting both ASTM C 33 and ND DOT 816.01. Supplied by Aggregate Industries from their Sheyenne Pit. Located Southwest of Devils Lake, ND in Sheyenne, ND.
Coarse Aggregate:
Natural gravel no bigger than 1” meeting ASTM C 33 and ND DOT 816.02. Supplied by Aggregate Industries from their Sheyenne Pit. Located Southwest of Devils Lake, ND in Sheyenne, ND.
Admixtures: See sections 2.2.1-2.2.3 for admixture details.
Table A.3 Description of Materials
A4
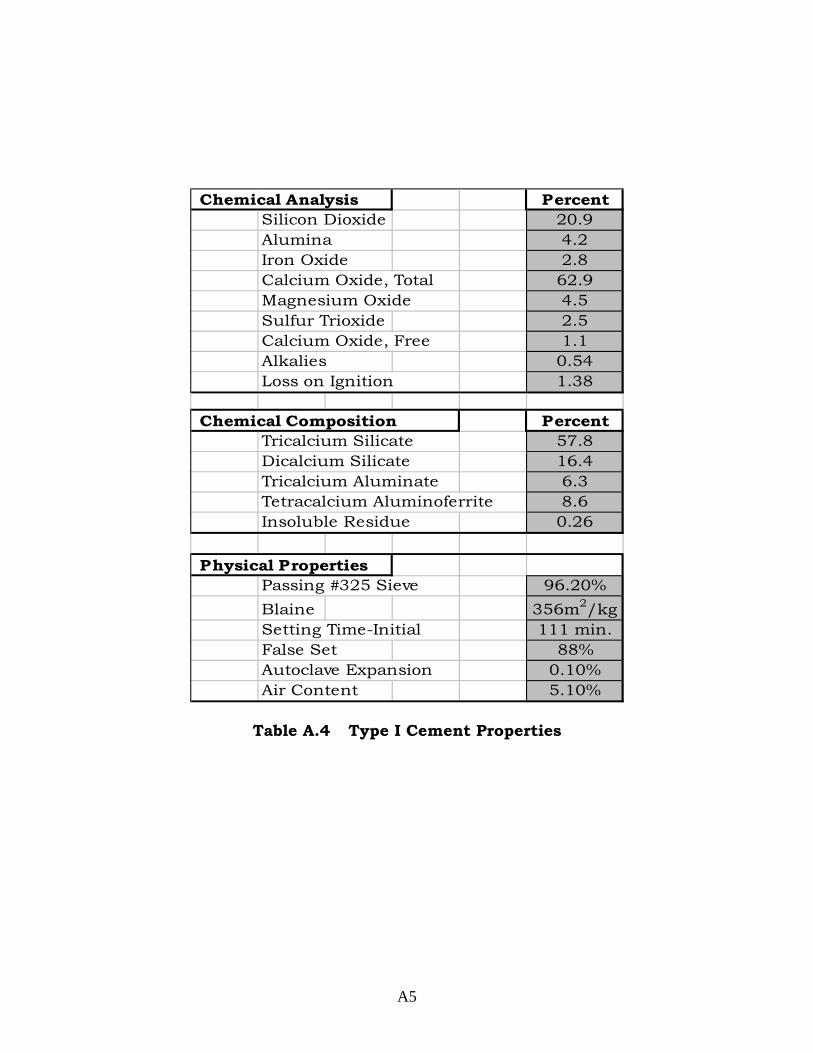
Chemical Analysis PercentSilicon Dioxide 20.9Alumina 4.2Iron Oxide 2.8Calcium Oxide, Total 62.9Magnesium Oxide 4.5Sulfur Trioxide 2.5Calcium Oxide, Free 1.1Alkalies 0.54Loss on Ignition 1.38
Chemical Composition PercentTricalcium Silicate 57.8Dicalcium Silicate 16.4Tricalcium Aluminate 6.3Tetracalcium Aluminoferrite 8.6Insoluble Residue 0.26
Physical PropertiesPassing #325 Sieve 96.20%Blaine 356m2/kgSetting Time-Initial 111 min.False Set 88%Autoclave Expansion 0.10%Air Content 5.10%
Table A.4 Type I Cement Properties
A5
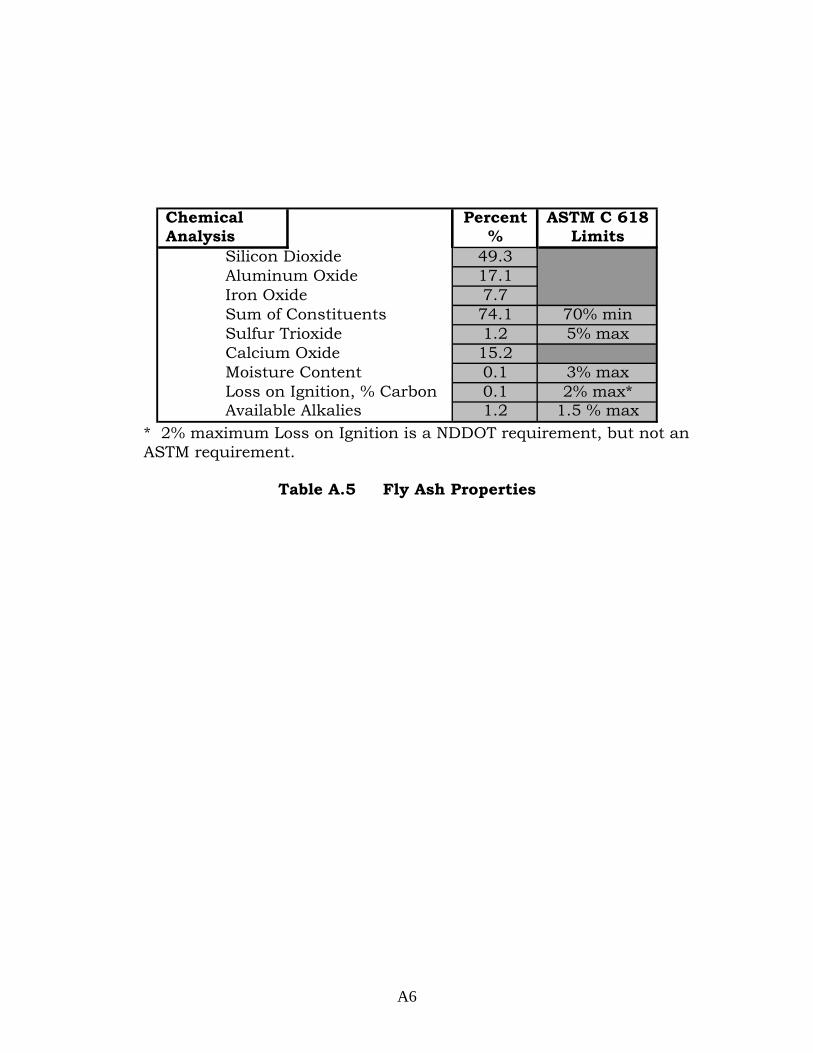
Chemical Percent ASTM C 618 Analysis % Limits
Silicon Dioxide 49.3Aluminum Oxide 17.1Iron Oxide 7.7Sum of Constituents 74.1 70% minSulfur Trioxide 1.2 5% maxCalcium Oxide 15.2Moisture Content 0.1 3% maxLoss on Ignition, % Carbon 0.1 2% max*Available Alkalies 1.2 1.5 % max
* 2% maximum Loss on Ignition is a NDDOT requirement, but not an ASTM requirement.
Table A.5 Fly Ash Properties
A6
Appendix B Control Mix Experimental Data
• Compressive Strength • Flexural Strength • Detailed Strength Data
B1
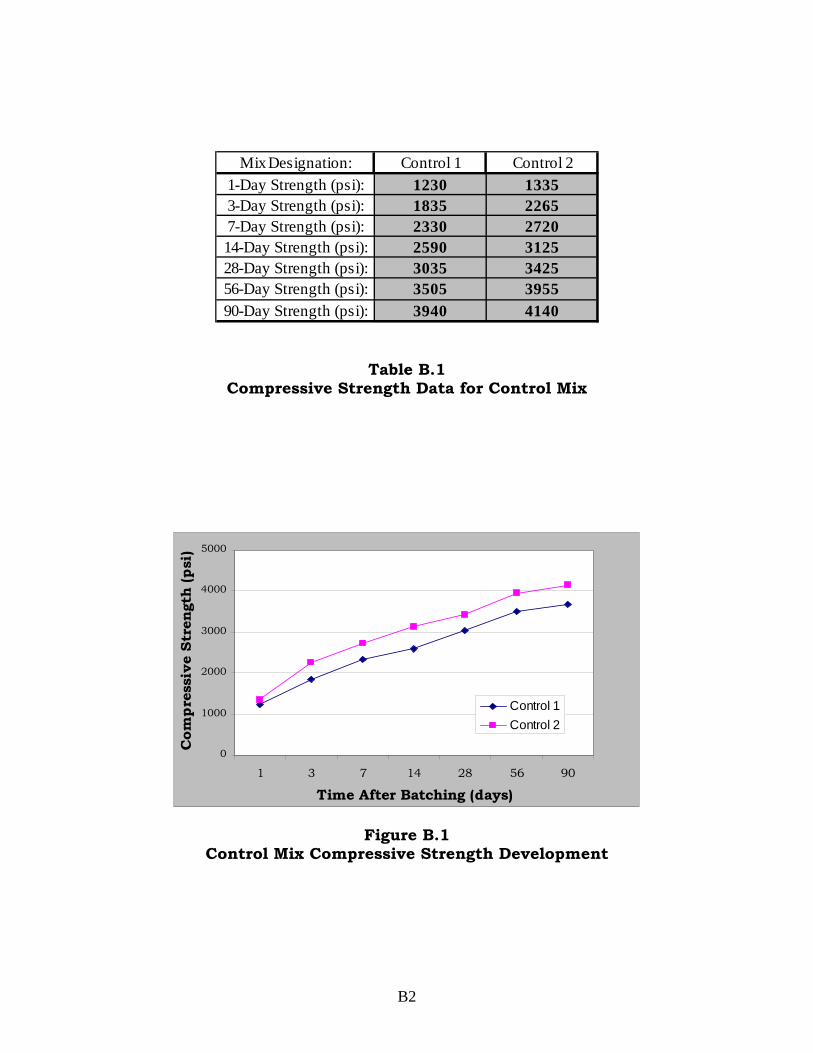
Mix Designation: Control 1 Control 21-Day Strength (psi): 1230 13353-Day Strength (psi): 1835 22657-Day Strength (psi): 2330 272014-Day Strength (psi): 2590 312528-Day Strength (psi): 3035 342556-Day Strength (psi): 3505 395590-Day Strength (psi): 3940 4140
Table B.1 Compressive Strength Data for Control Mix
0
1000
2000
3000
4000
5000
1 3 7 14 28 56 90
Time After Batching (days)
Com
pres
sive
Str
engt
h (p
si)
Control 1Control 2
Figure B.1
Control Mix Compressive Strength Development
B2
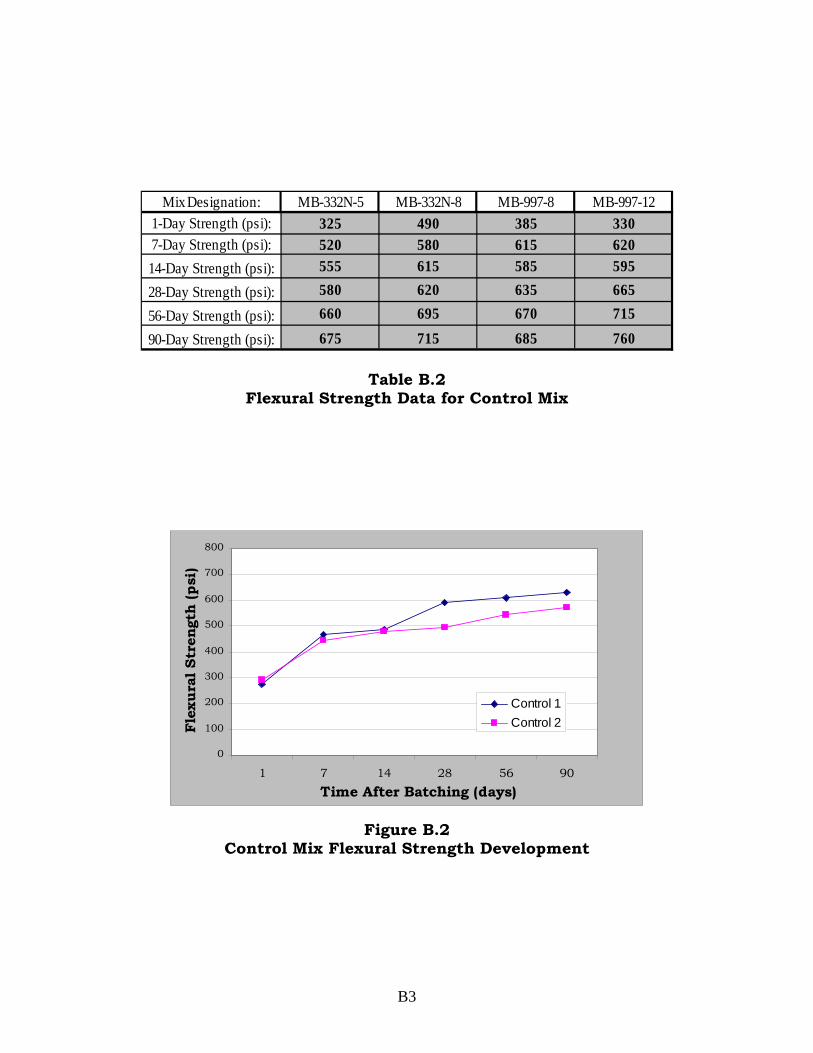
Mix Designation: MB-332N-5 MB-332N-8 MB-997-8 MB-997-121-Day Strength (psi): 325 490 385 3307-Day Strength (psi): 520 580 615 62014-Day Strength (psi): 555 615 585 595
28-Day Strength (psi): 580 620 635 665
56-Day Strength (psi): 660 695 670 715
90-Day Strength (psi): 675 715 685 760
Table B.2 Flexural Strength Data for Control Mix
0
100
200
300
400
500
600
700
800
1 7 14 28 56 90Time After Batching (days)
Flex
ural
Str
engt
h (p
si)
Control 1Control 2
Figure B.2
Control Mix Flexural Strength Development
B3
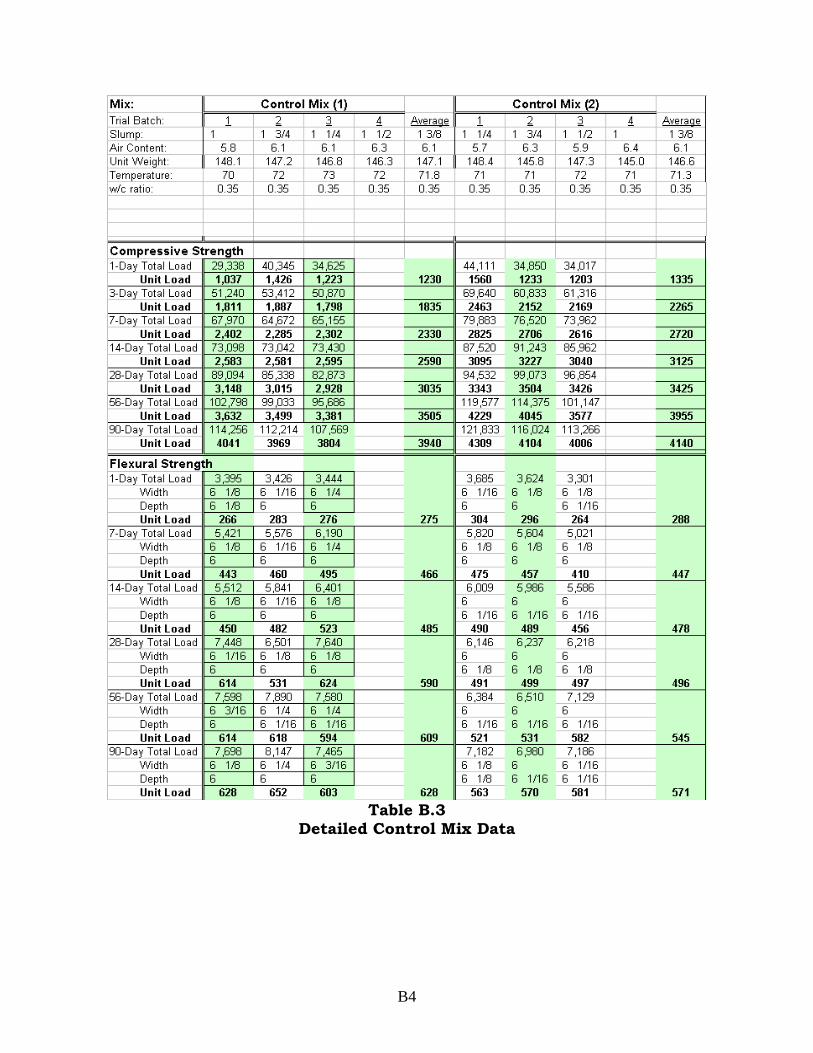
Table B.3
Detailed Control Mix Data
B4
Appendix C Master Builders Experimental Data
• Compressive Strength • Flexural Strength • Detailed Strength Data
C1
Mix Designation: MB-332N-5 MB-332N-8 MB-997-8 MB-997-121-Day Strength (psi): 1255 1835 1845 15903-Day Strength (psi): 2345 3070 3090 3555
7-Day Strength (psi): 3035 3930 3745 4605
14-Day Strength (psi): 3450 4210 4295 4855
28-Day Strength (psi): 3910 5080 5150 5570
56-Day Strength (psi): 4485 5635 5455 5935
90-Day Strength (psi): 4750 5860 5725 6310
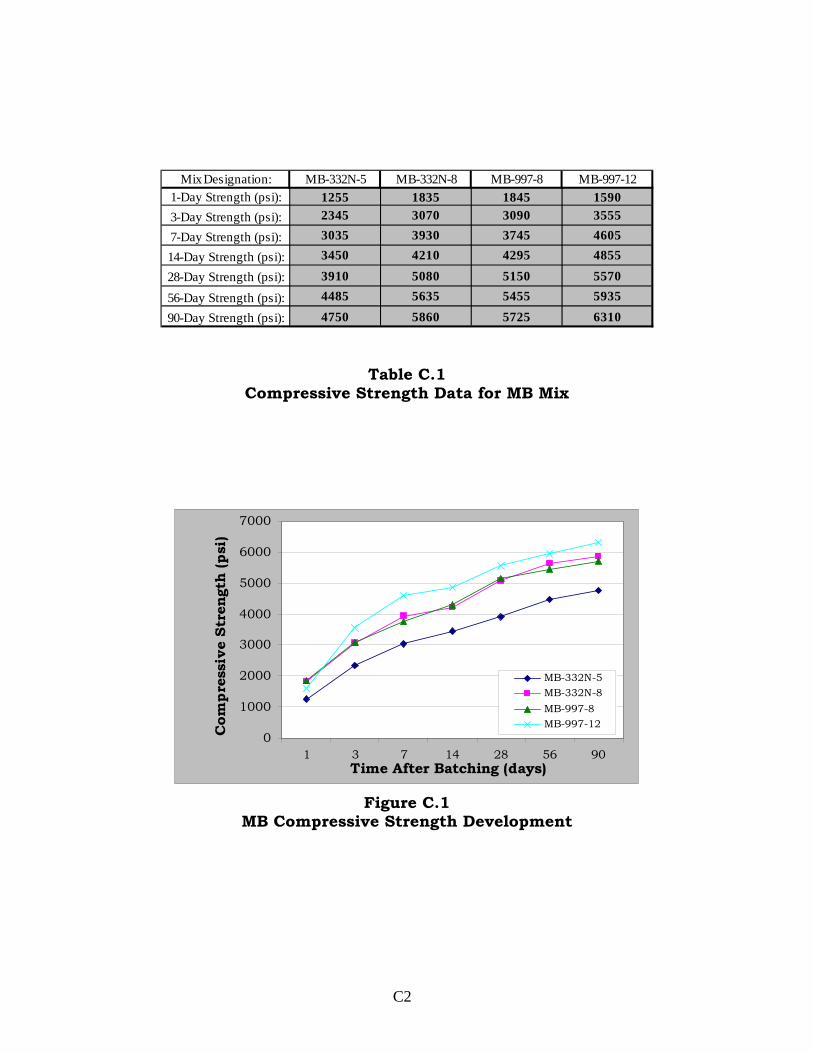
Table C.1 Compressive Strength Data for MB Mix
0
1000
2000
3000
4000
5000
6000
7000
1 3 7 14 28 56 90Time After Batching (days)
Com
pres
sive
Str
engt
h (p
si)
MB-332N-5MB-332N-8MB-997-8MB-997-12
Figure C.1 MB Compressive Strength Development
C2
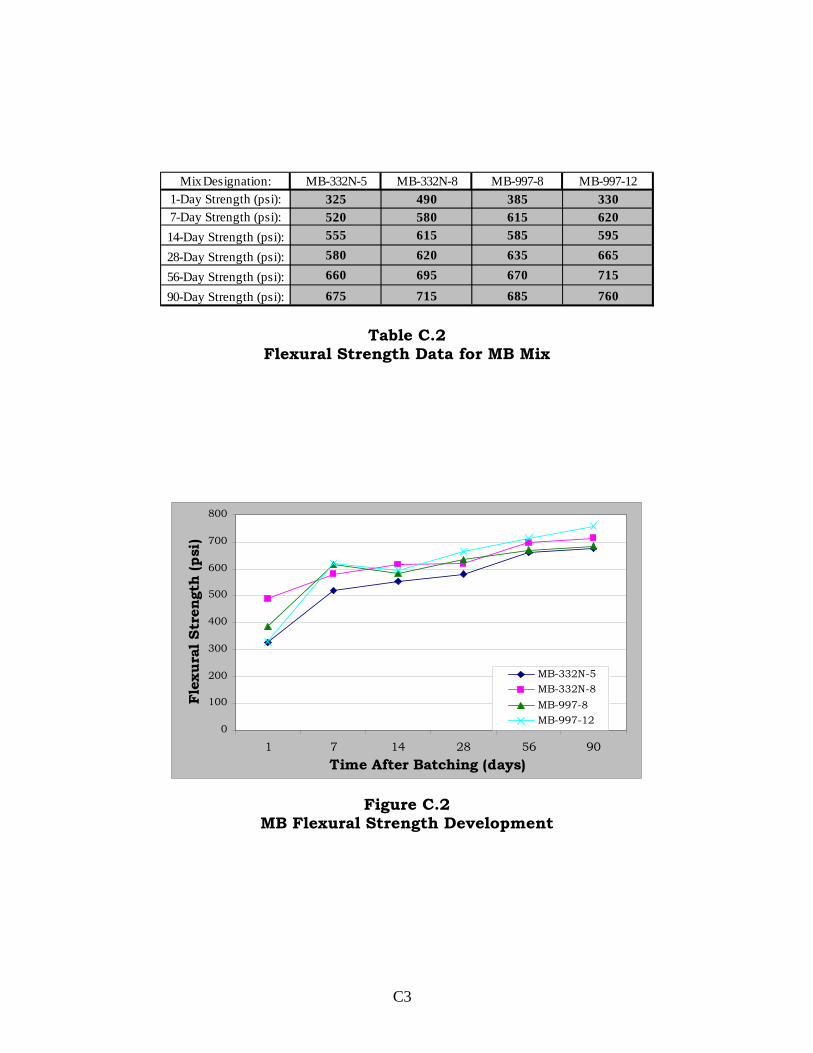
Mix Designation: MB-332N-5 MB-332N-8 MB-997-8 MB-997-121-Day Strength (psi): 325 490 385 3307-Day Strength (psi): 520 580 615 62014-Day Strength (psi): 555 615 585 595
28-Day Strength (psi): 580 620 635 665
56-Day Strength (psi): 660 695 670 715
90-Day Strength (psi): 675 715 685 760
Table C.2 Flexural Strength Data for MB Mix
C3
0
100
200
300
400
500
600
700
800
1 7 14 28 56 90Time After Batching (days)
Flex
ural
Str
engt
h (p
si)
MB-332N-5MB-332N-8MB-997-8MB-997-12
Figure C.2 MB Flexural Strength Development
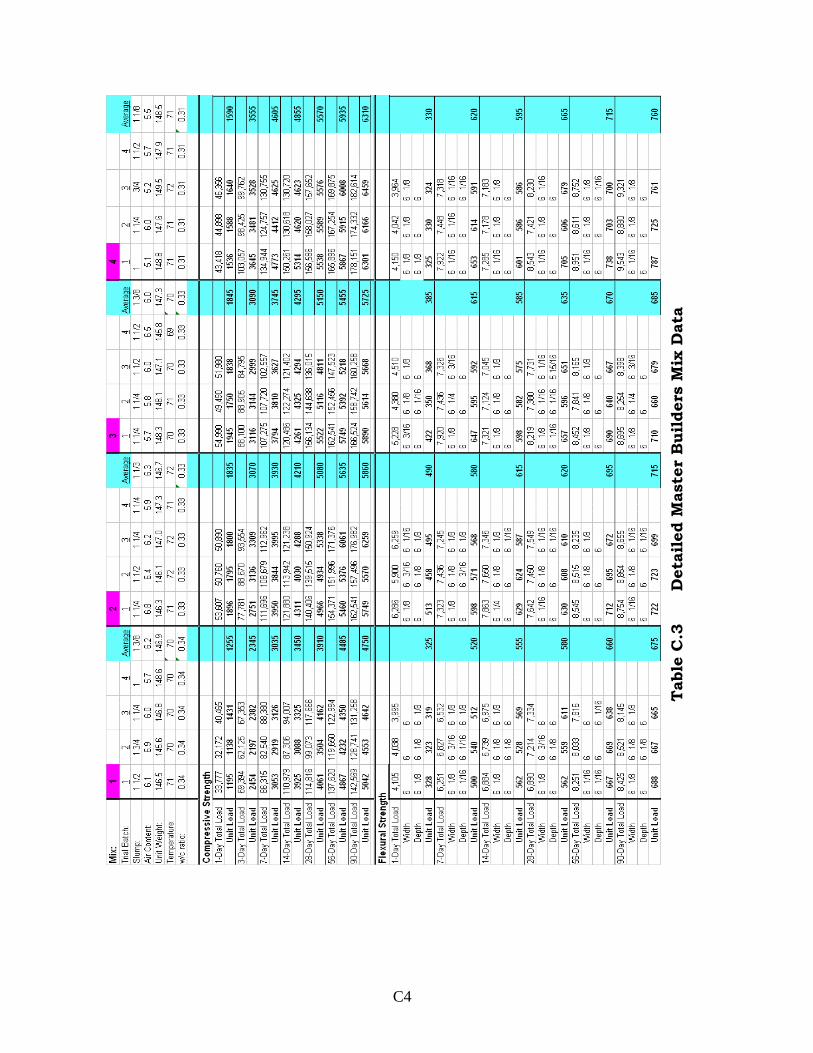
Tabl
e C
.3
D
etai
led
Mas
ter
Bui
lder
s M
ix D
ata
C4

Appendix D Brett Admixtures Experimental Data
• Compressive Strength • Flexural Strength • Detailed Strength Data
D1
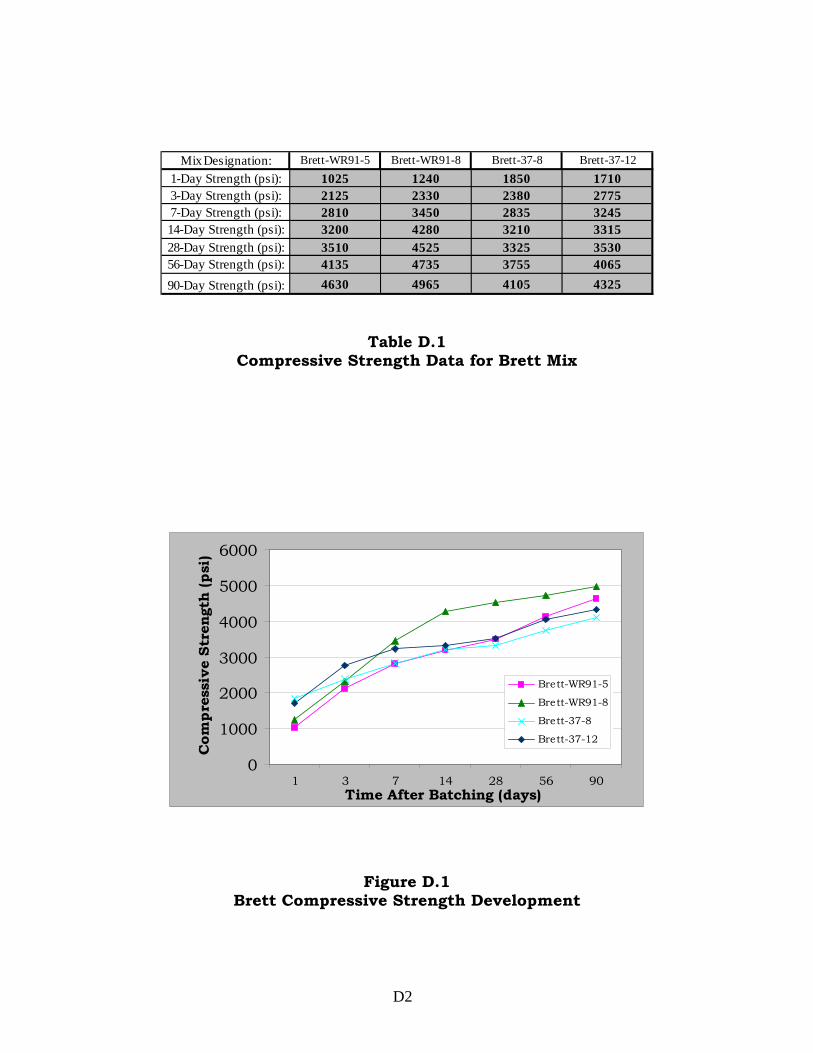
Mix Designation: Brett-WR91-5 Brett-WR91-8 Brett-37-8 Brett-37-121-Day Strength (psi): 1025 1240 1850 17103-Day Strength (psi): 2125 2330 2380 27757-Day Strength (psi): 2810 3450 2835 324514-Day Strength (psi): 3200 4280 3210 331528-Day Strength (psi): 3510 4525 3325 353056-Day Strength (psi): 4135 4735 3755 406590-Day Strength (psi): 4630 4965 4105 4325
Table D.1 Compressive Strength Data for Brett Mix
0
1000
2000
3000
4000
5000
6000
1 3 7 14 28 56 90Time After Batching (days)
Com
pres
sive
Str
engt
h (p
si)
Brett-WR91-5
Brett-WR91-8
Brett-37-8
Brett-37-12
Figure D.1 Brett Compressive Strength Development
D2
Mix Designation: Brett-WR91-5 Brett-WR91-8 Brett-37-8 Brett-37-121-Day Strength (psi): 255 285 380 3107-Day Strength (psi): 470 535 540 52014-Day Strength (psi): 530 560 560 52528-Day Strength (psi): 525 600 585 54056-Day Strength (psi): 610 630 615 61090-Day Strength (psi): 645 675 630 615
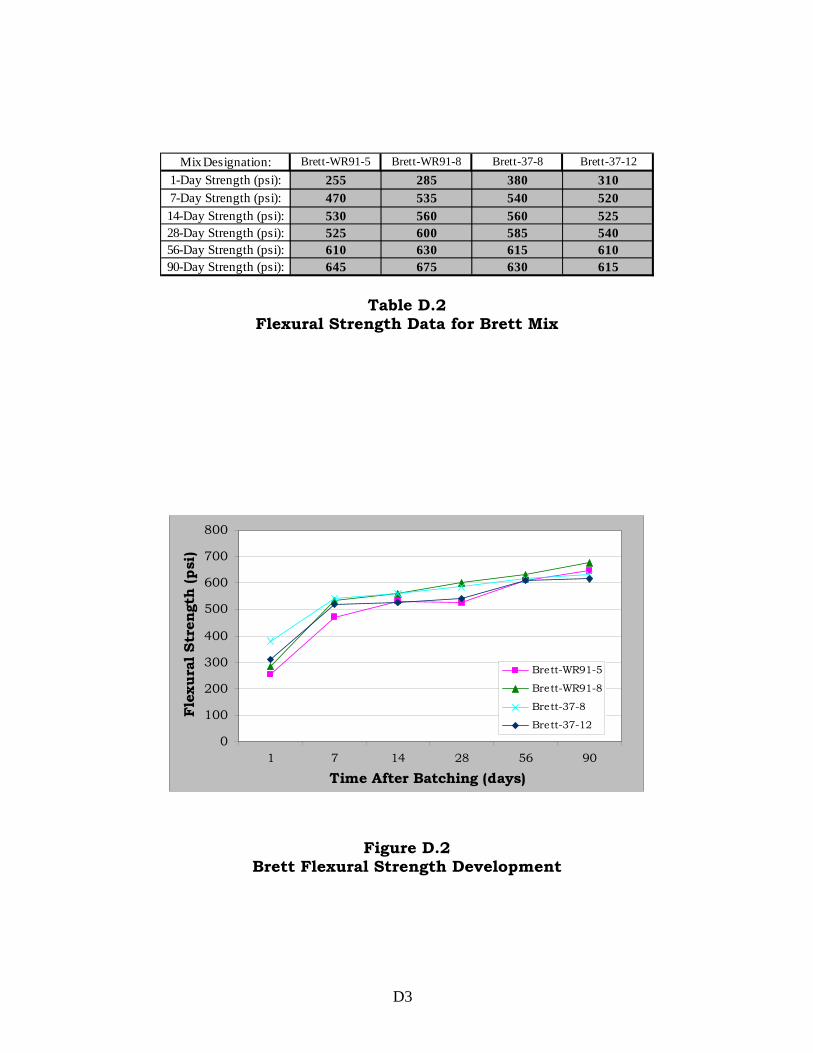
Table D.2
Flexural Strength Data for Brett Mix
0
100
200
300
400
500
600
700
800
1 7 14 28 56 90
Time After Batching (days)
Flex
ural
Str
engt
h (p
si)
Brett-WR91-5
Brett-WR91-8
Brett-37-8
Brett-37-12
Figure D.2 Brett Flexural Strength Development
D3
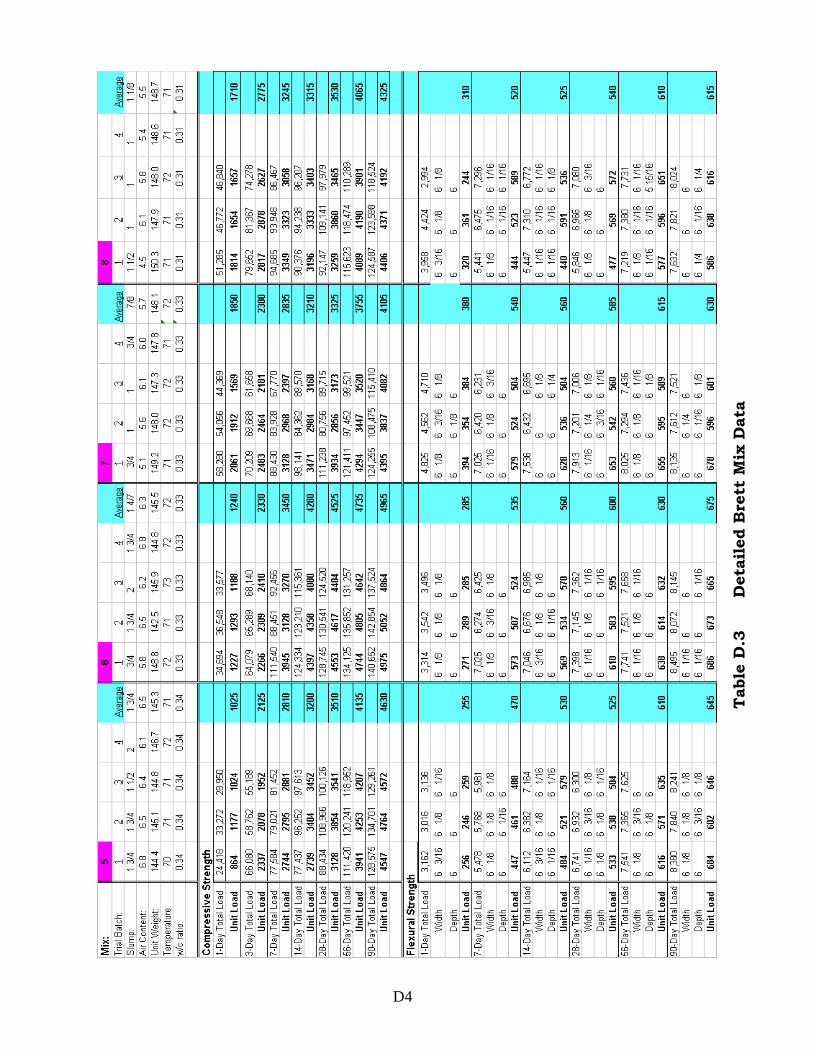
D4
Tabl
e D
.3
D
etai
led
Bre
tt M
ix D
ata
Appendix E GRACE Experimental Data
• Compressive Strength • Flexural Strength • Detailed Strength Data
E1
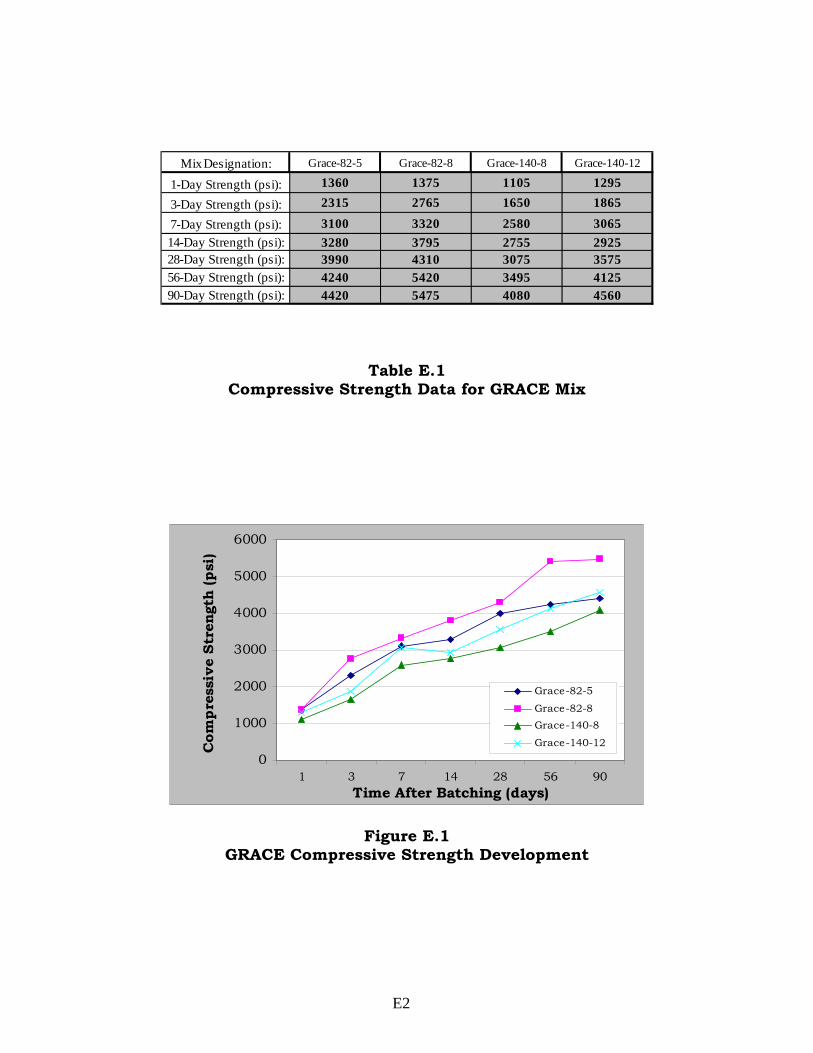
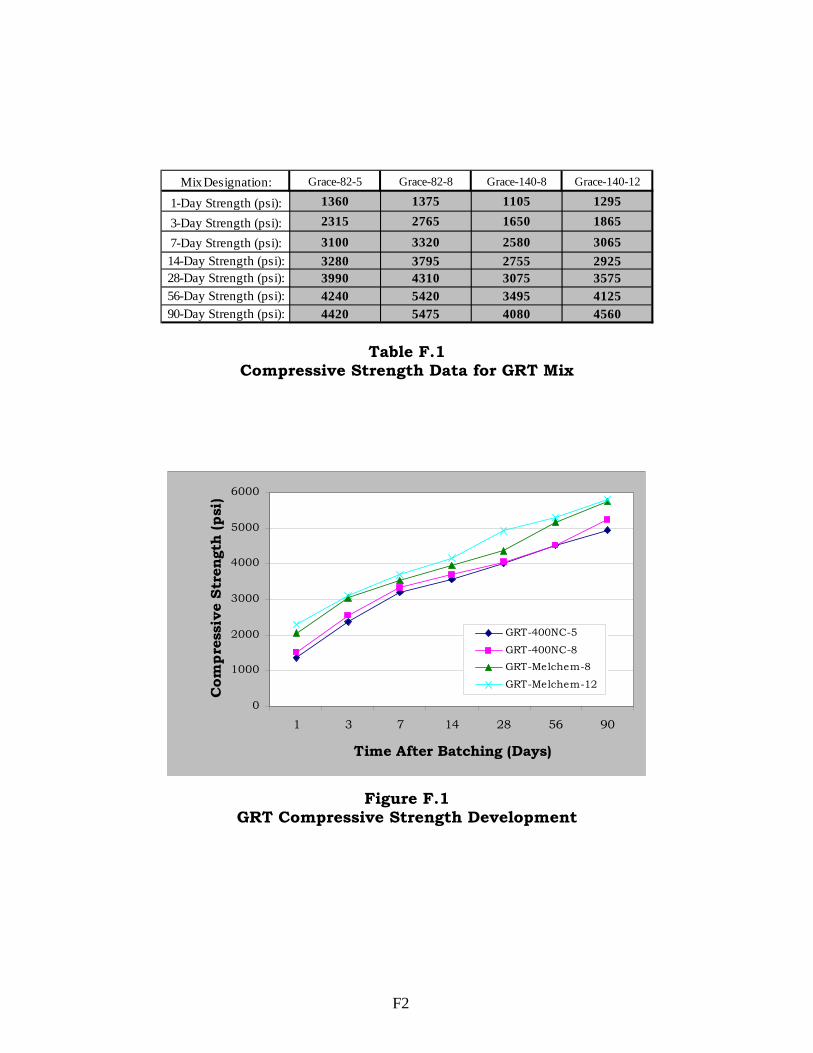
Mix Designation: Grace-82-5 Grace-82-8 Grace-140-8 Grace-140-12
1-Day Strength (psi): 1360 1375 1105 1295
3-Day Strength (psi): 2315 2765 1650 1865
7-Day Strength (psi): 3100 3320 2580 306514-Day Strength (psi): 3280 3795 2755 292528-Day Strength (psi): 3990 4310 3075 357556-Day Strength (psi): 4240 5420 3495 412590-Day Strength (psi): 4420 5475 4080 4560
Table E.1 Compressive Strength Data for GRACE Mix
0
1000
2000
3000
4000
5000
6000
1 3 7 14 28 56 90Time After Batching (days)
Com
pres
sive
Str
engt
h (p
si)
Grace-82-5
Grace-82-8Grace-140-8
Grace-140-12
Figure E.1
GRACE Compressive Strength Development
E2
Mix Designation: Grace-82-5 Grace-82-8 Grace-140-8 Grace-140-12
1-Day Strength (psi): 355 480 265 285
7-Day Strength (psi): 570 525 470 490
14-Day Strength (psi): 595 610 515 560
28-Day Strength (psi): 610 685 575 635
56-Day Strength (psi): 615 690 575 630
90-Day Strength (psi): 625 730 625 700
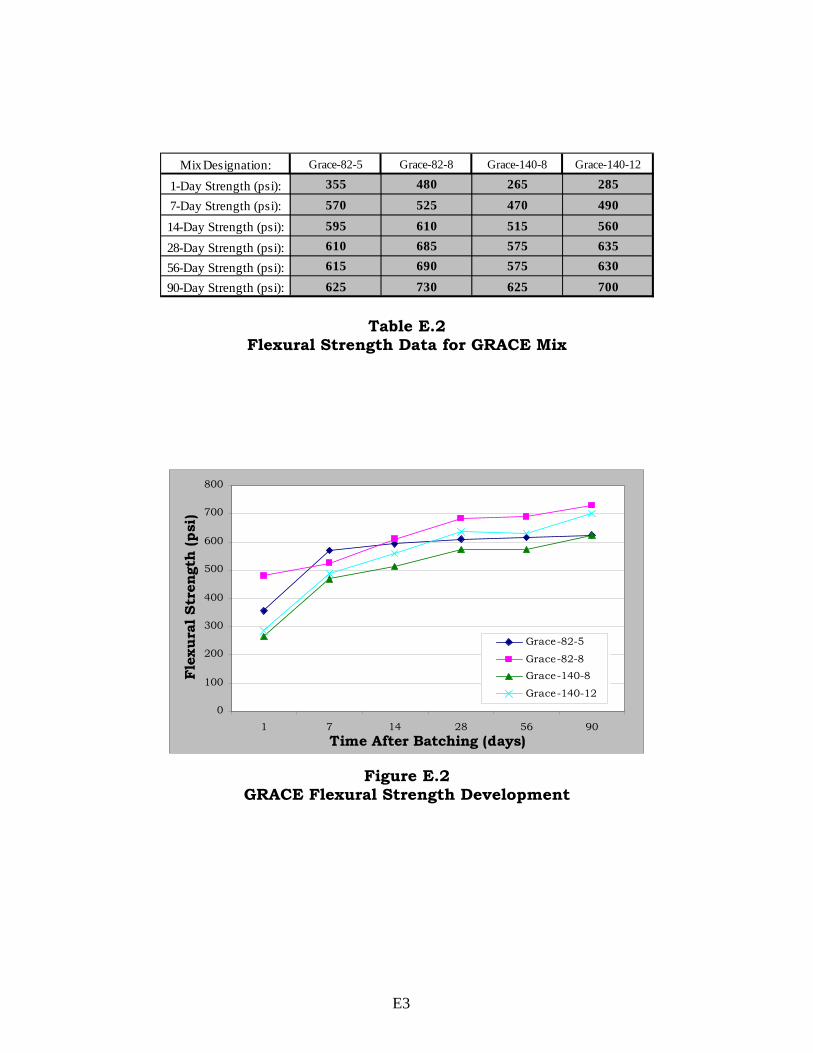
Table E.2 Flexural Strength Data for GRACE Mix
0
100
200
300
400
500
600
700
800
1 7 14 28 56 90Time After Batching (days)
Flex
ural
Str
engt
h (p
si)
Grace-82-5
Grace-82-8Grace-140-8
Grace-140-12
Figure E.2
GRACE Flexural Strength Development
E3
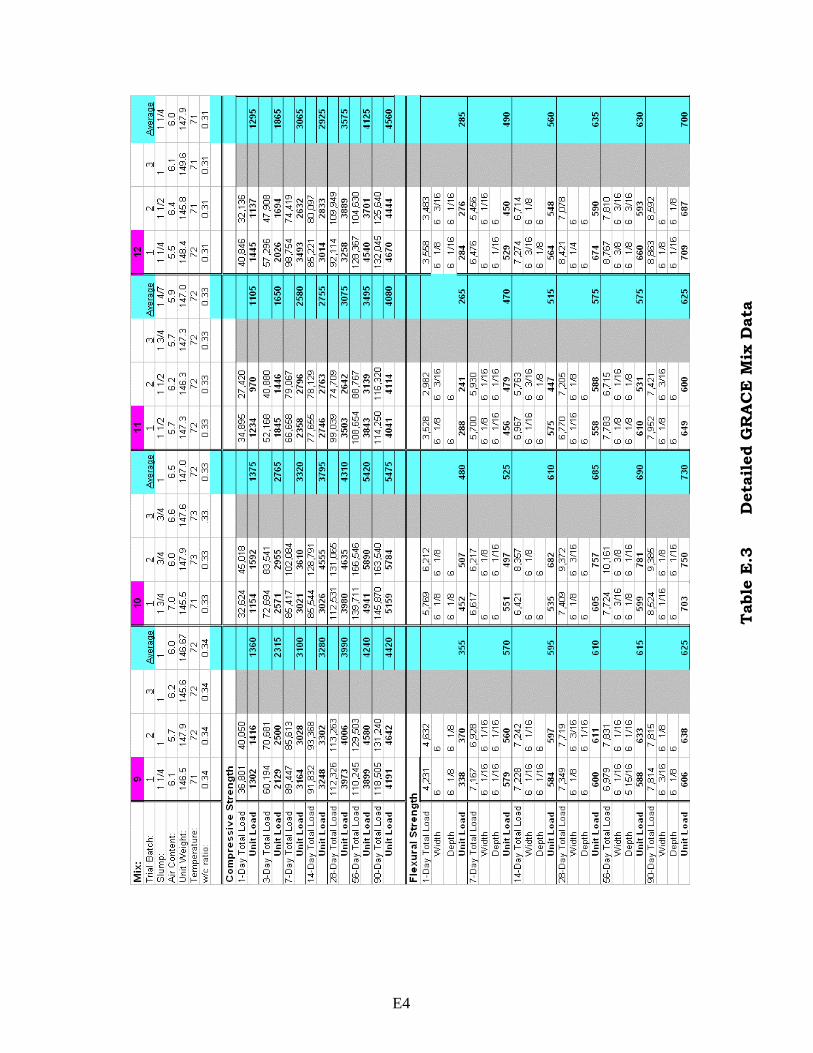
Tabl
e E
.3
D
etai
led
GR
AC
E M
ix D
ata
E4

Appendix F Appendix F GRT Experimental Data GRT Experimental Data
• Compressive Strength • Compressive Strength • Flexural Strength • Flexural Strength
F1
• Detailed Strength Data • Detailed Strength Data
F1
Mix Designation: Grace-82-5 Grace-82-8 Grace-140-8 Grace-140-12
1-Day Strength (psi): 1360 1375 1105 1295
3-Day Strength (psi): 2315 2765 1650 1865
7-Day Strength (psi): 3100 3320 2580 306514-Day Strength (psi): 3280 3795 2755 292528-Day Strength (psi): 3990 4310 3075 357556-Day Strength (psi): 4240 5420 3495 412590-Day Strength (psi): 4420 5475 4080 4560
Table F.1
Compressive Strength Data for GRT Mix
0
1000
2000
3000
4000
5000
6000
1 3 7 14 28 56 90
Time After Batching (Days)
Com
pres
sive
Str
engt
h (p
si)
GRT-400NC-5
GRT-400NC-8GRT-Melchem-8
GRT-Melchem-12
Figure F.1 GRT Compressive Strength Development
F2
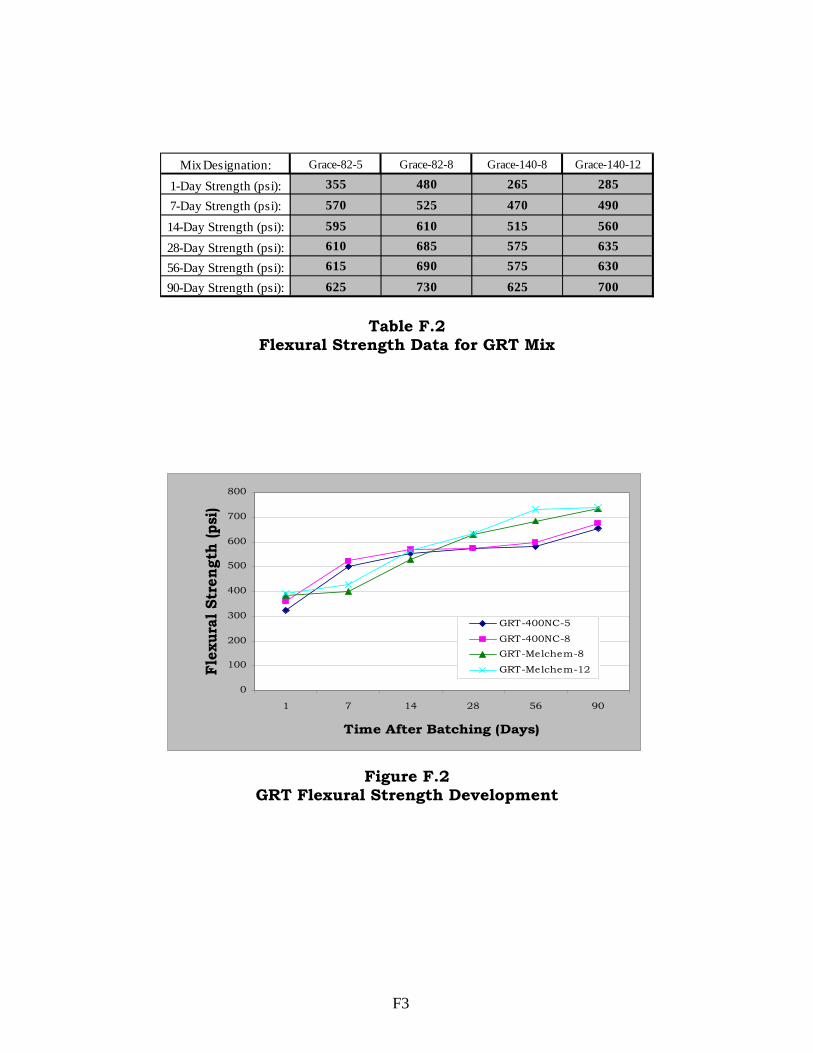
Mix Designation: Grace-82-5 Grace-82-8 Grace-140-8 Grace-140-12
1-Day Strength (psi): 355 480 265 285
7-Day Strength (psi): 570 525 470 490
14-Day Strength (psi): 595 610 515 560
28-Day Strength (psi): 610 685 575 635
56-Day Strength (psi): 615 690 575 630
90-Day Strength (psi): 625 730 625 700
Table F.2 Flexural Strength Data for GRT Mix
0
100
200
300
400
500
600
700
800
1 7 14 28 56 90
Time After Batching (Days)
Flex
ural
Str
engt
h (p
si)
GRT-400NC-5
GRT-400NC-8GRT-Melchem-8
GRT-Melchem-12
Figure F.2
GRT Flexural Strength Development
F3
Tabl
e F.
3
Det
aile
d G
RT
Mix
Dat
a
F4

Appendix G Complete Mix Data
• Control • Master Builders • Brett Admixtures • Grace • GRT
G1
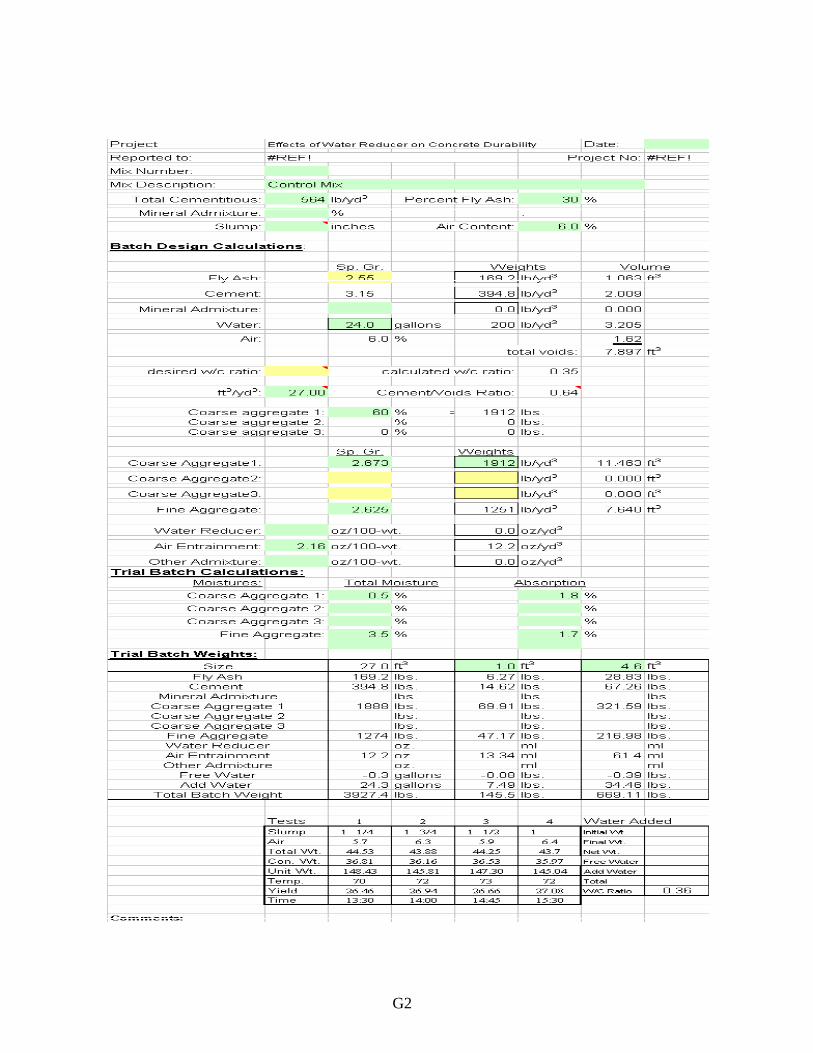
G2
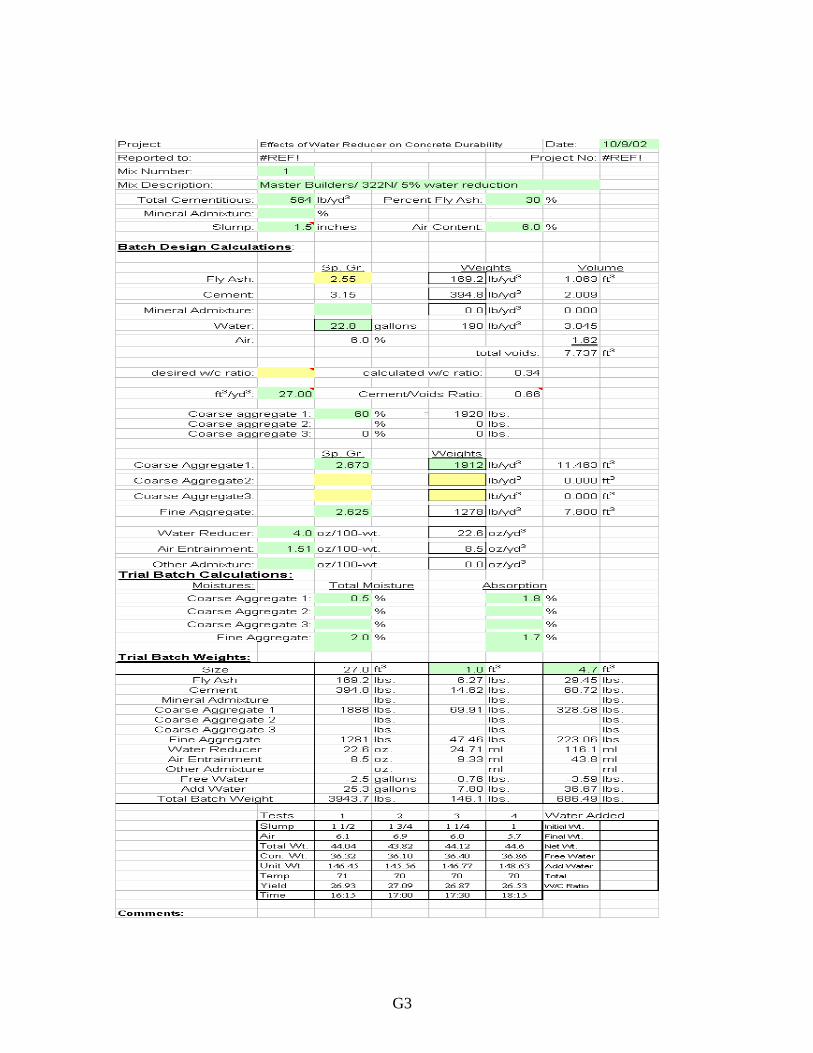
G3
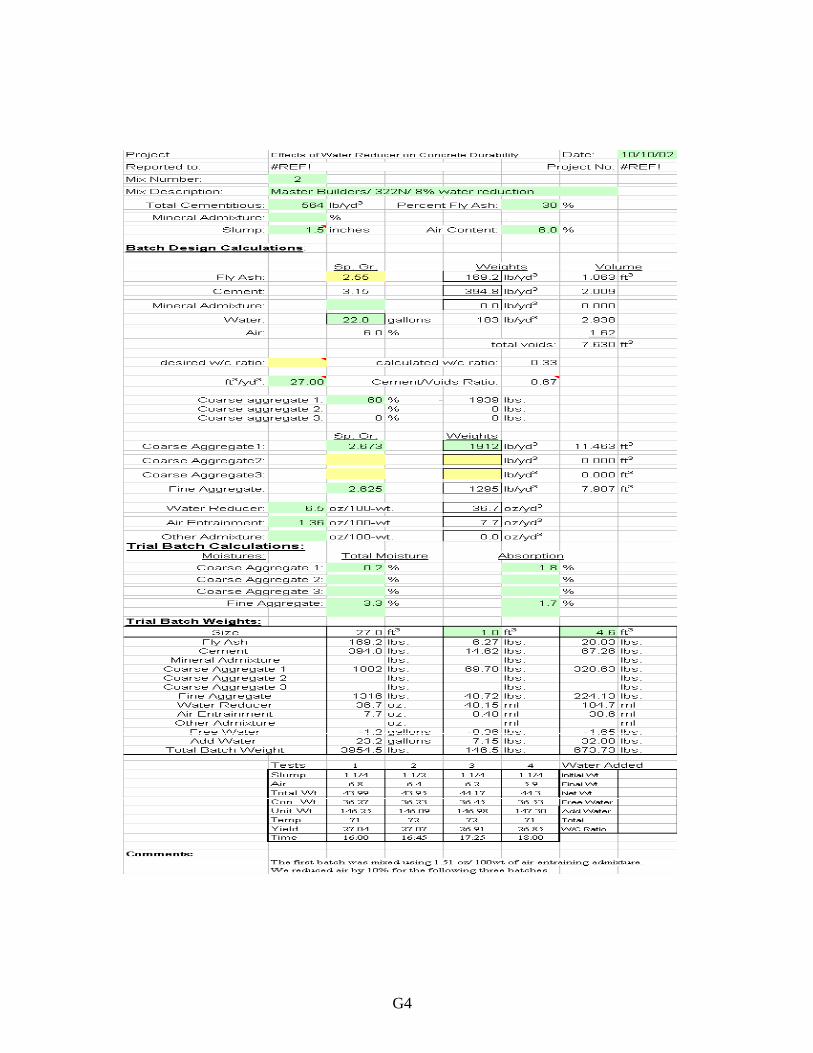
G4
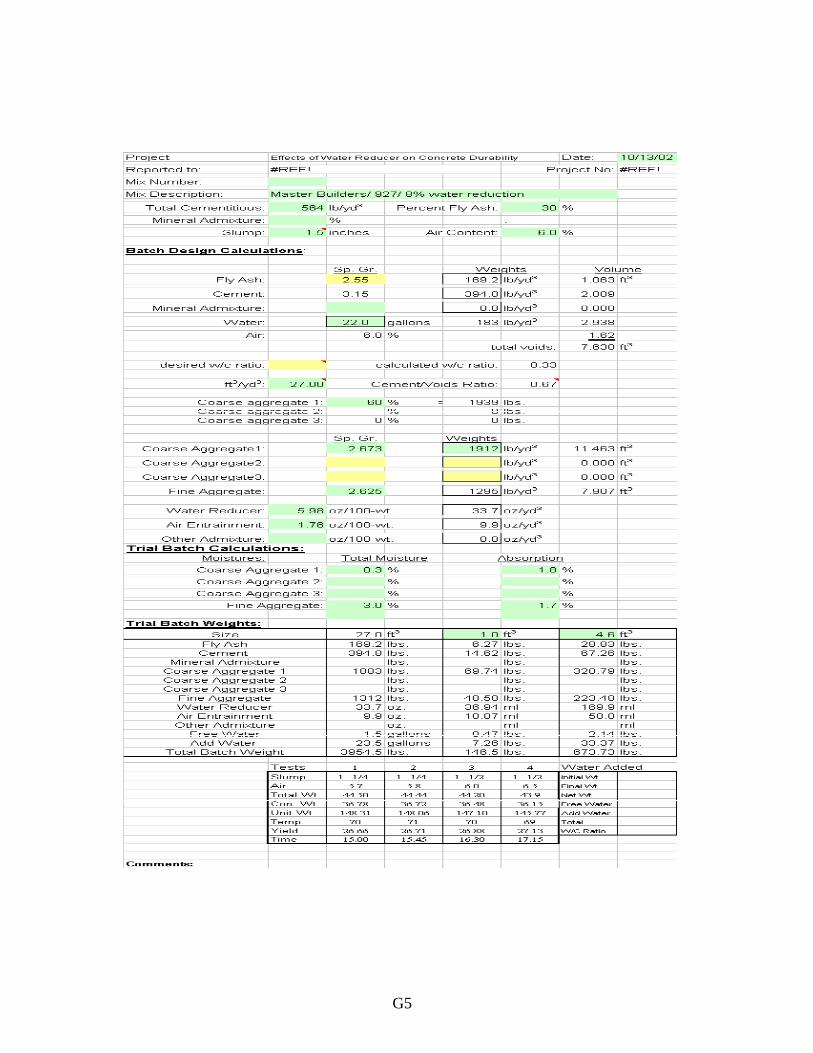
G5
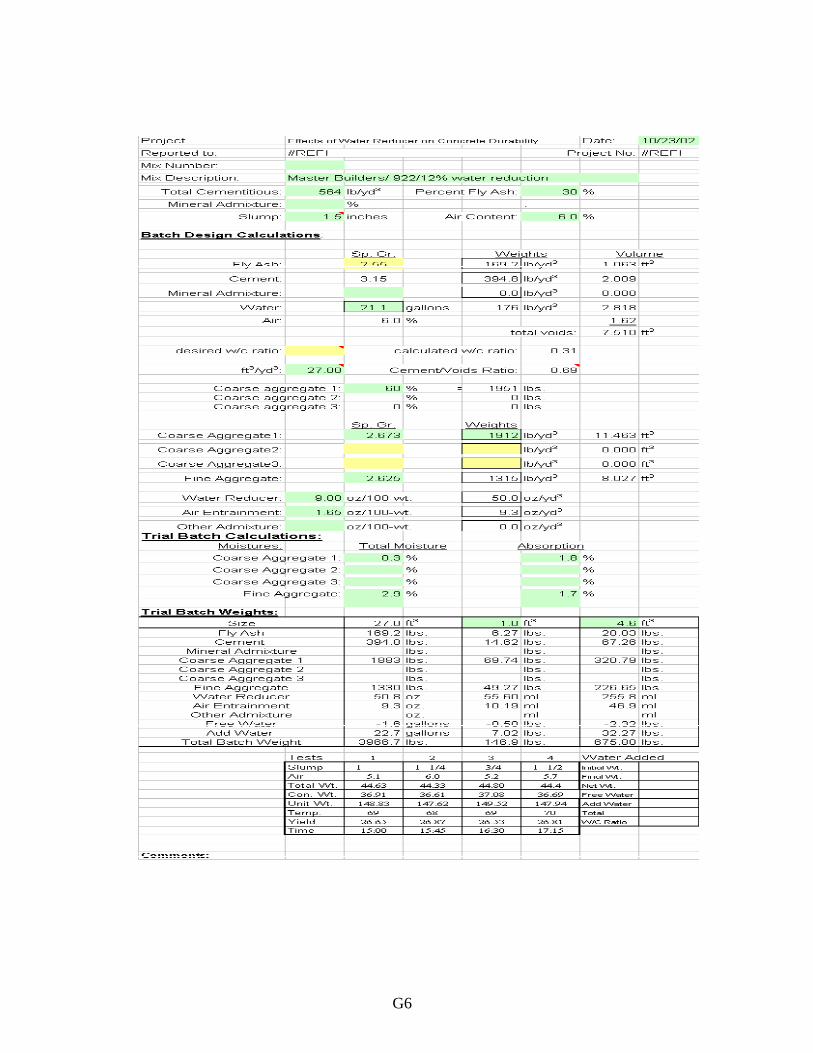
G6
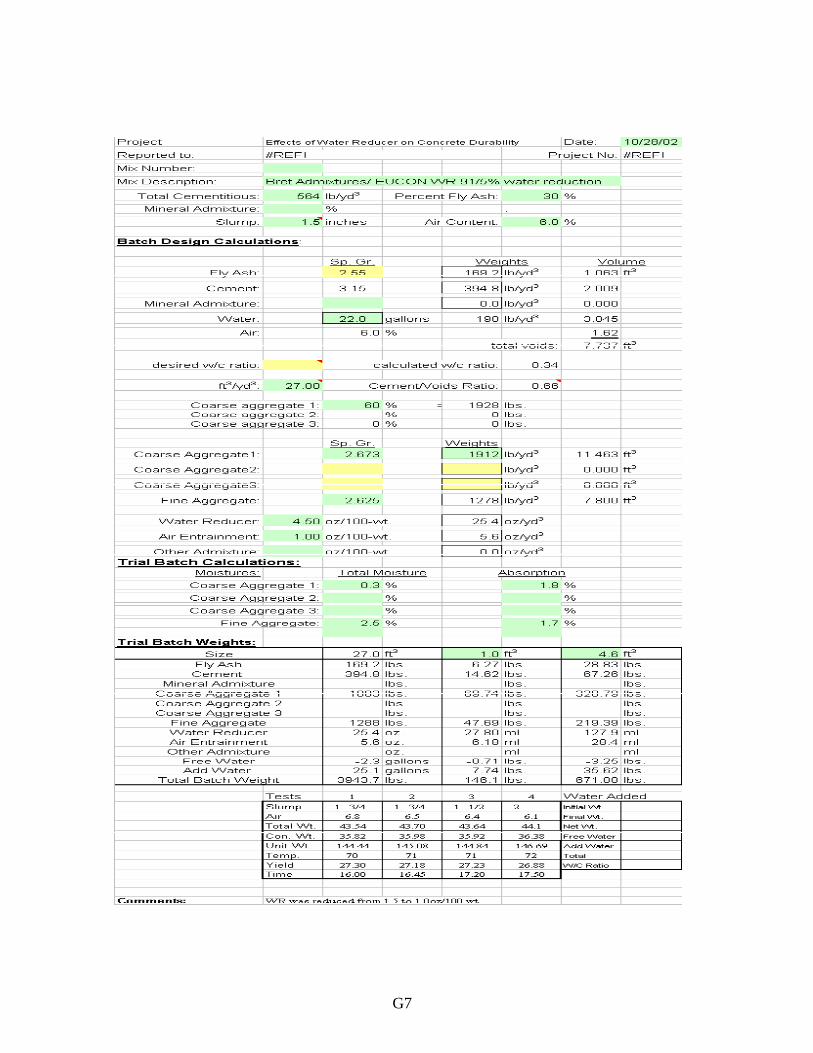
G7
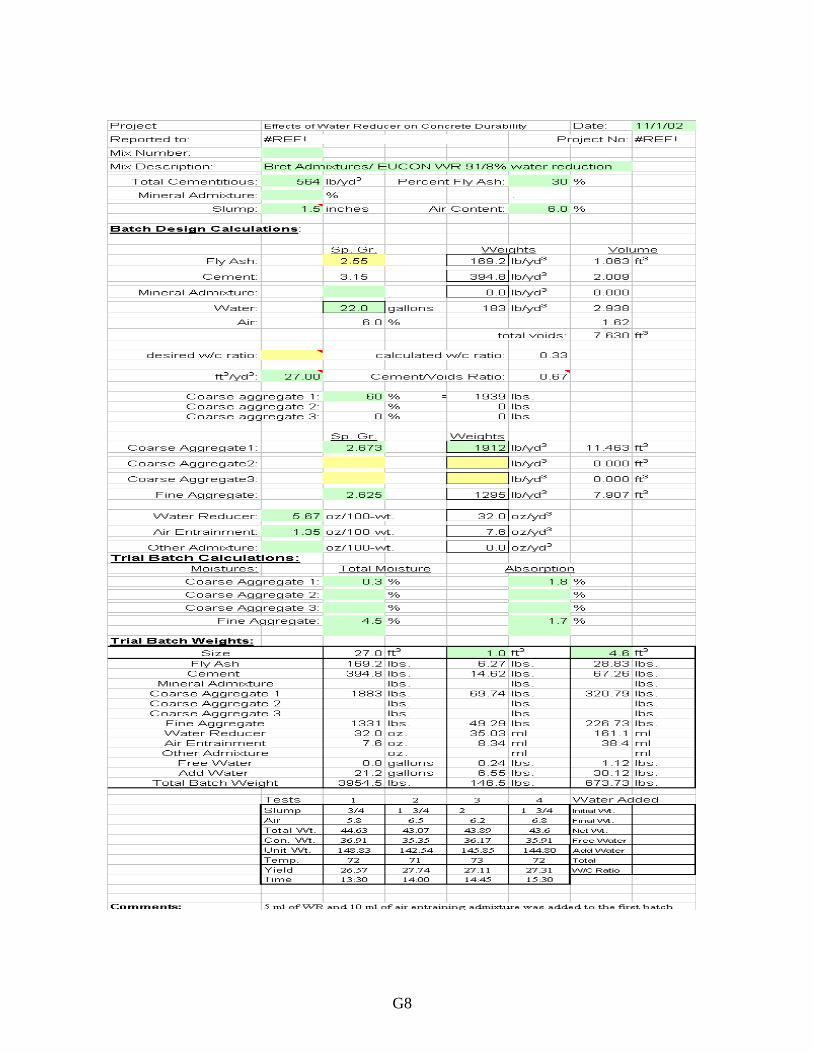
G8
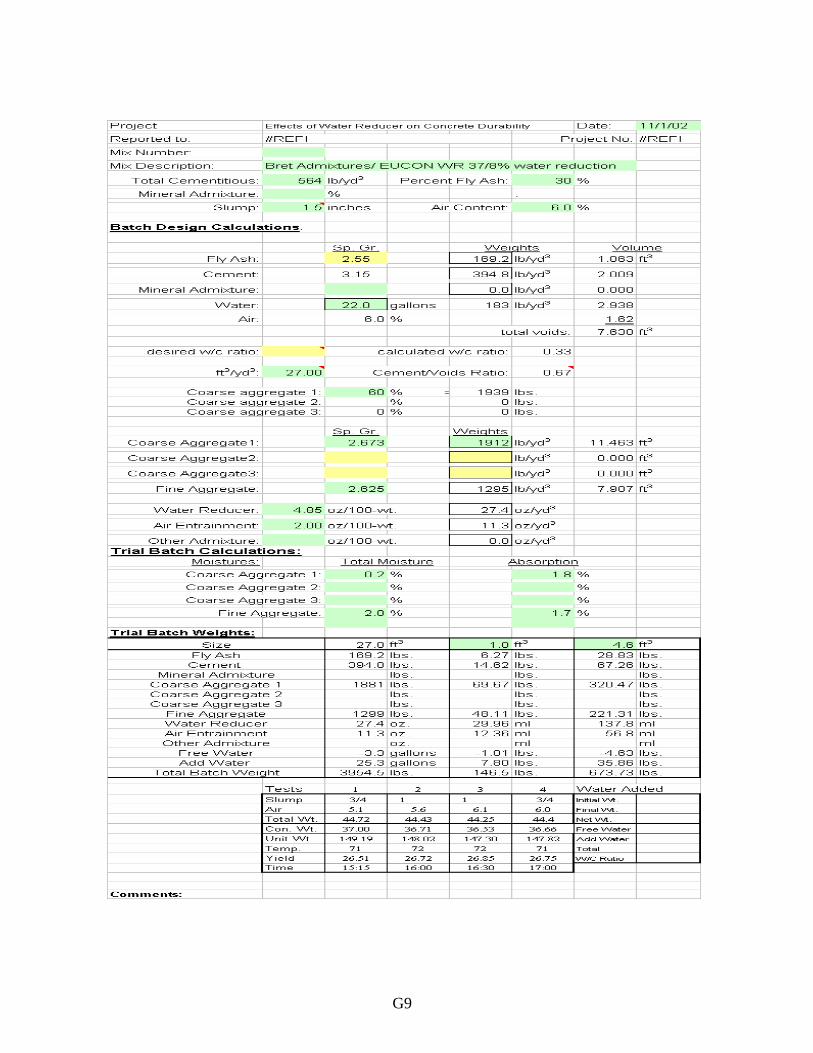
G9
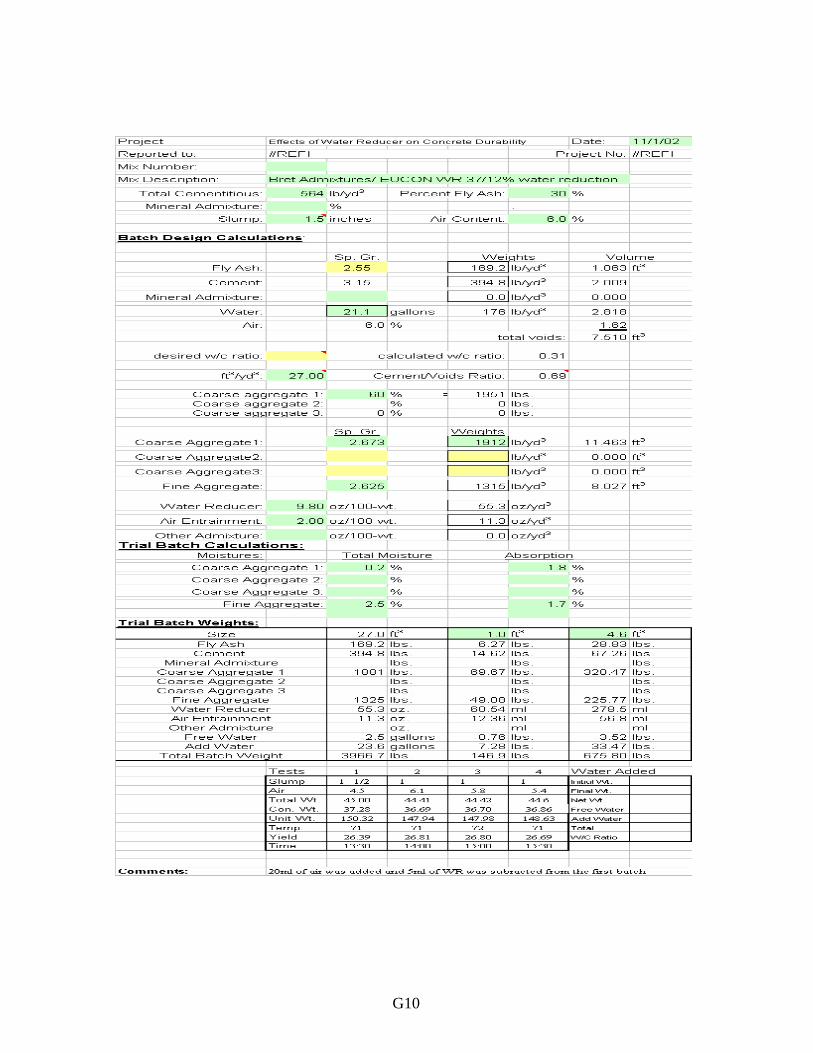
G10
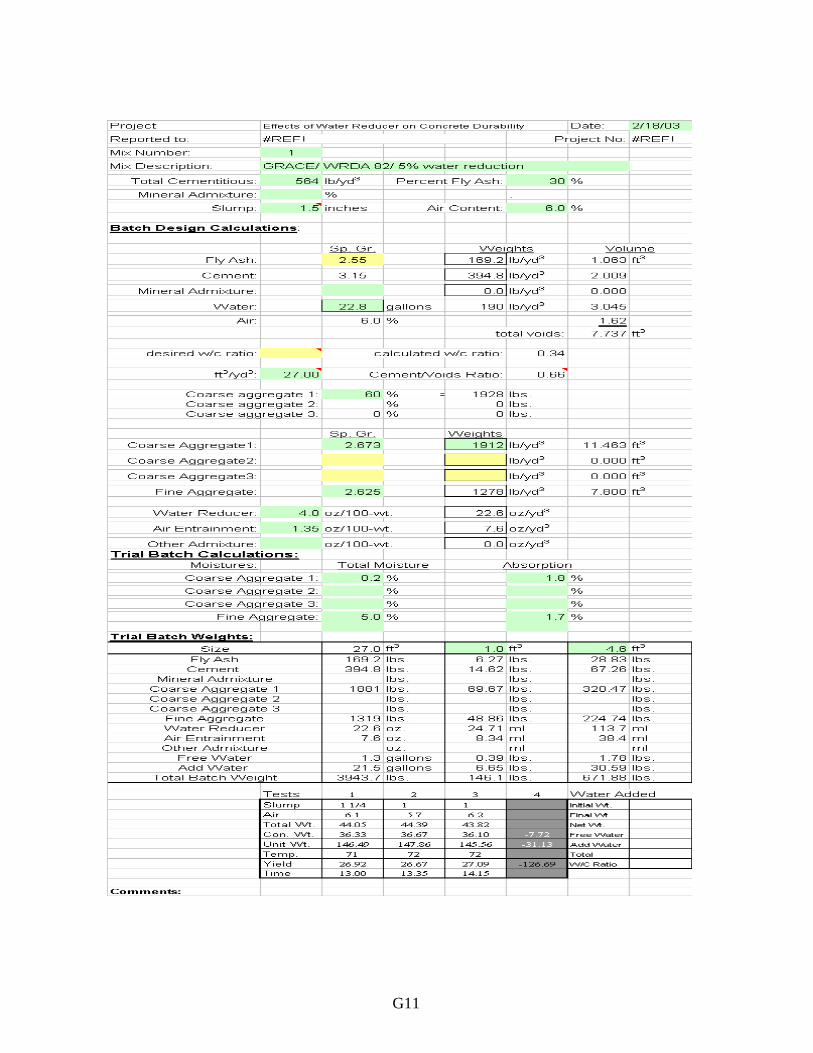
G11
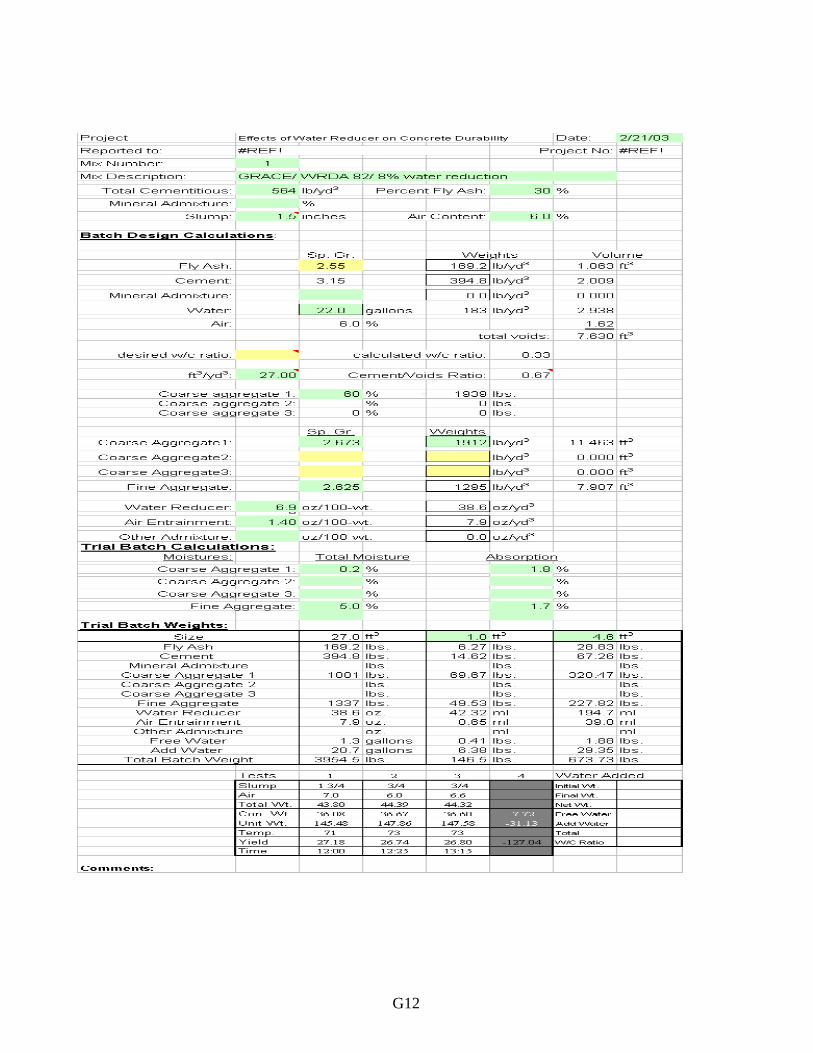
G12
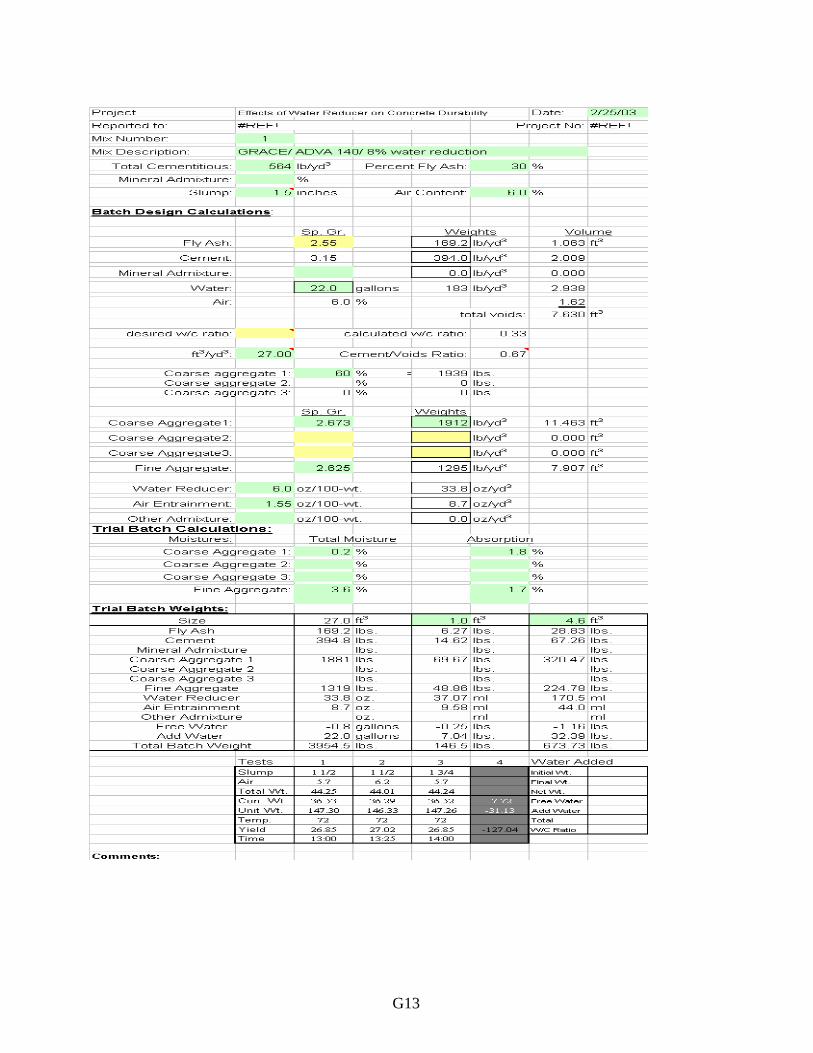
G13
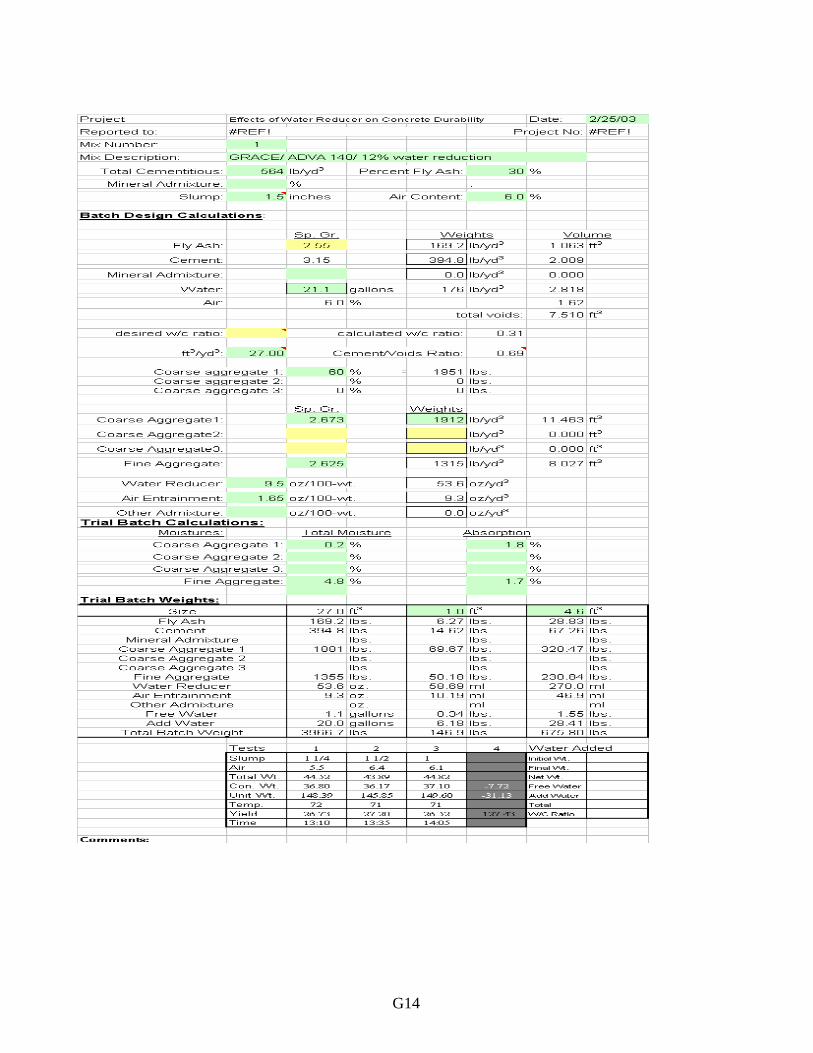
G14
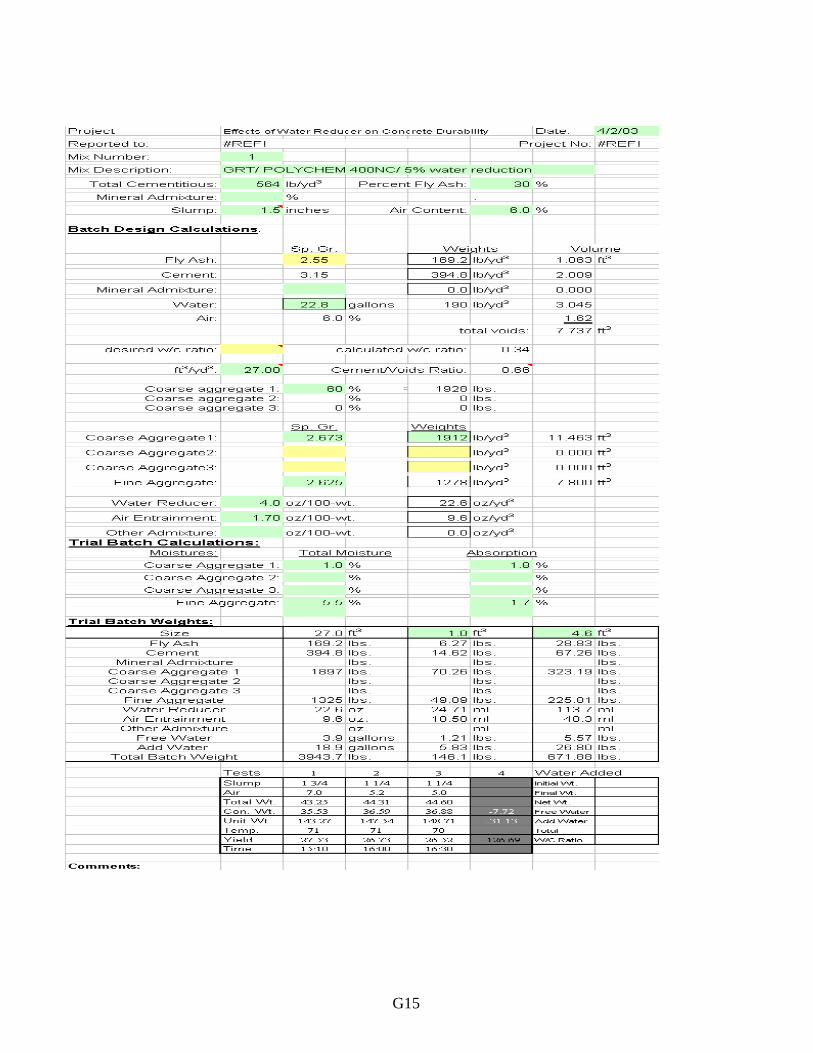
G15
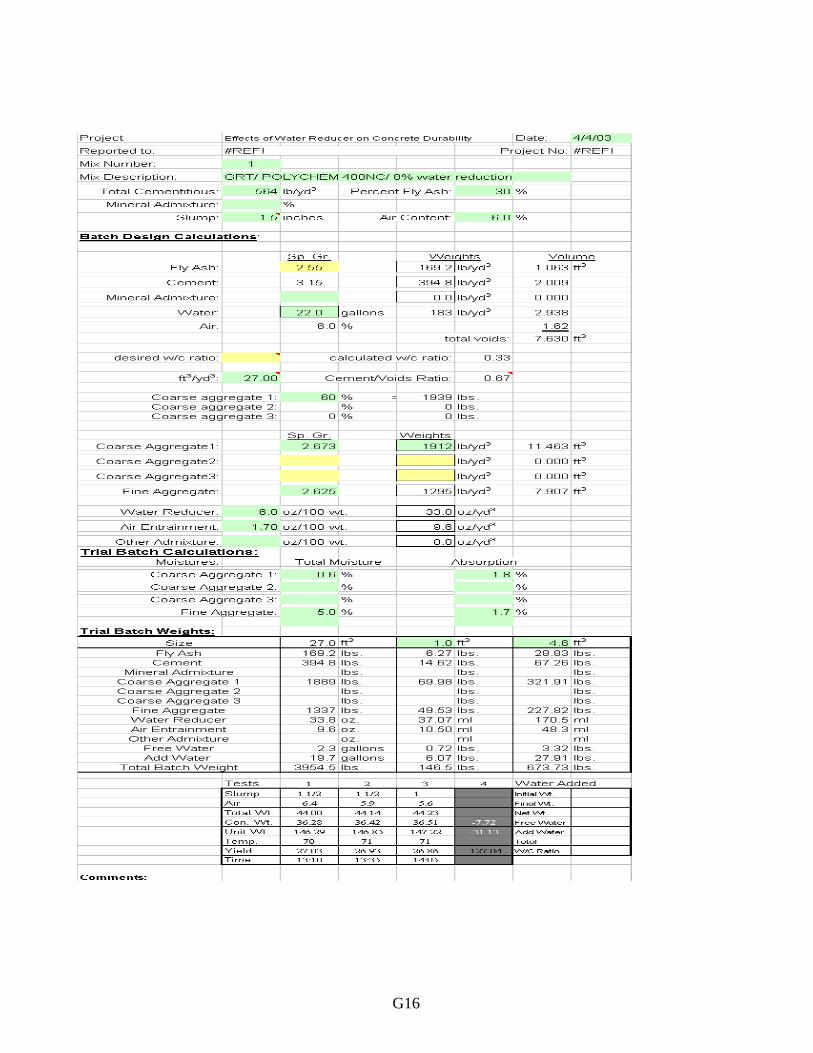
G16
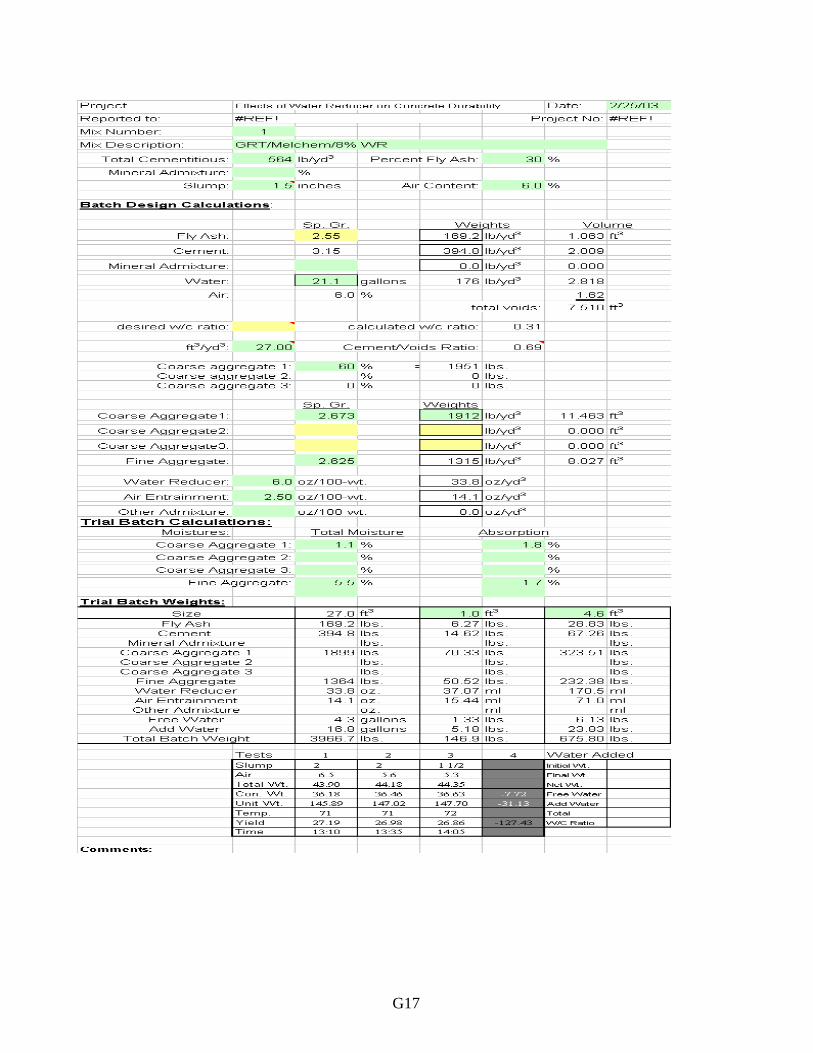
G17
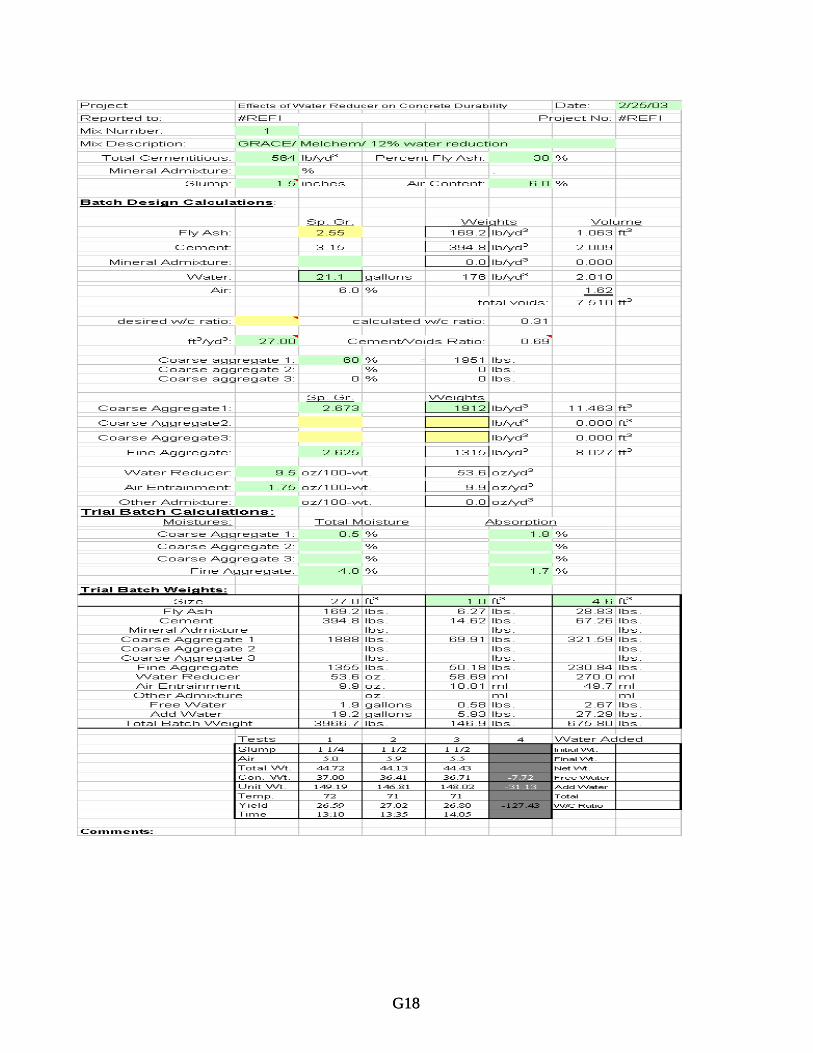
G18
G18
Appendix H Permeability Test Data
• Complete Test Results
H1
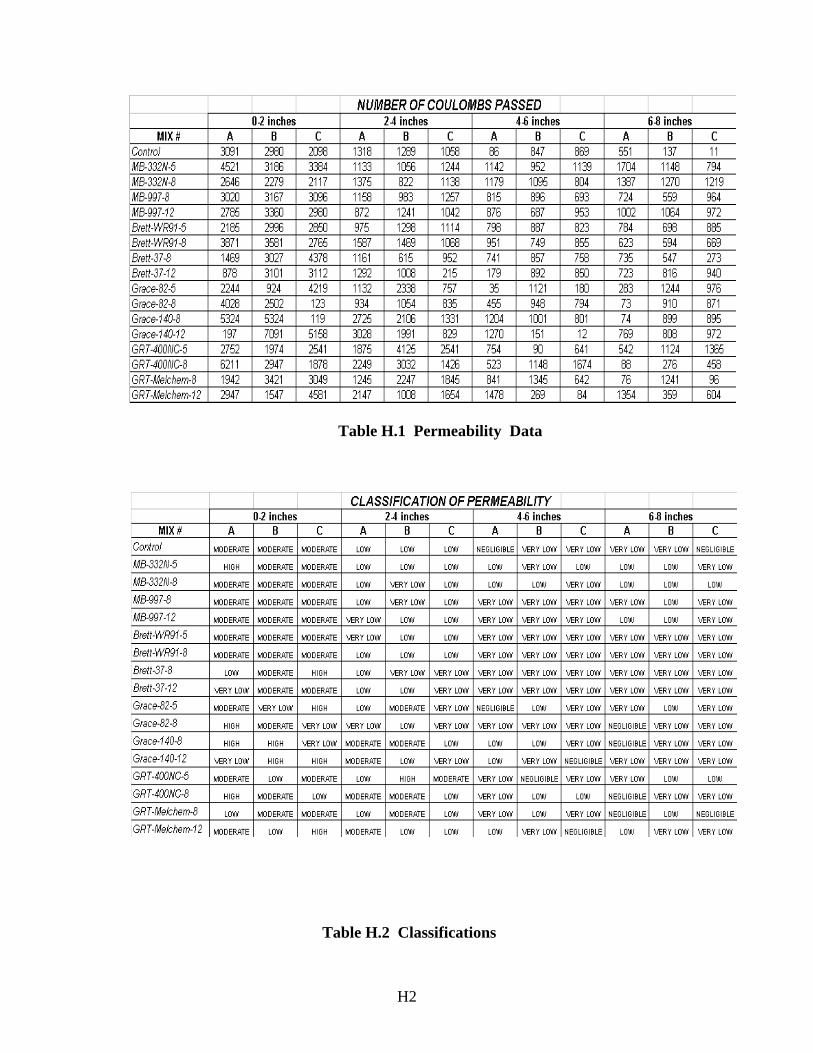
Table H.1 Permeability Data
Table H.2 Classifications
H2

Appendix I Deicing Values
• Scaling from Deicing Chemical Scores • Example Pictures of Each Score
I1
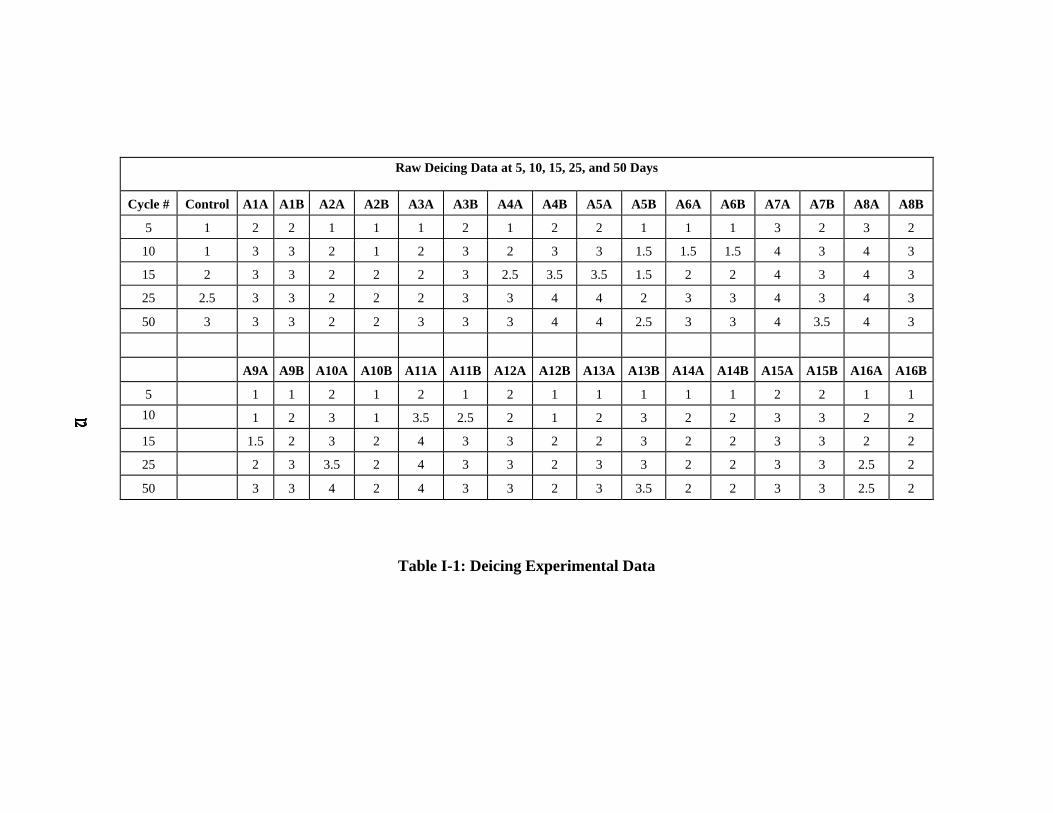
Raw Deicing Data at 5, 10, 15, 25, and 50 Days Cycle # Control A1A A1B A2A A2B A3A A3B A4A A4B A5A A5B A6A A6B A7A A7B A8A A8B
5 1 2 2 1 1 1 2 1 2 2 1 1 1 3 2 3 2
10 1 3 3 2 1 2 3 2 3 3 1.5 1.5 1.5 4 3 4 3
15 2 3 3 2 2 2 3 2.5 3.5 3.5 1.5 2 2 4 3 4 3
25 2.5 3 3 2 2 2 3 3 4 4 2 3 3 4 3 4 3
50 3 3 3 2 2 3 3 3 4 4 2.5 3 3 4 3.5 4 3
A9A A9B A10A A10B A11A A11B A12A A12B A13A A13B A14A A14B A15A A15B A16A A16B
5 1 1 2 1 2 1 2 1 1 1 1 1 2 2 1 110 1 2 3 1 3.5 2.5 2 1 2 3 2 2 3 3 2 2
15 1.5 2 3 2 4 3 3 2 2 3 2 2 3 3 2 2
25 2 3 3.5 2 4 3 3 2 3 3 2 2 3 3 2.5 2
50 3 3 4 2 4 3 3 2 3 3.5 2 2 3 3 2.5 2
Table I-1: Deicing Experimental Data
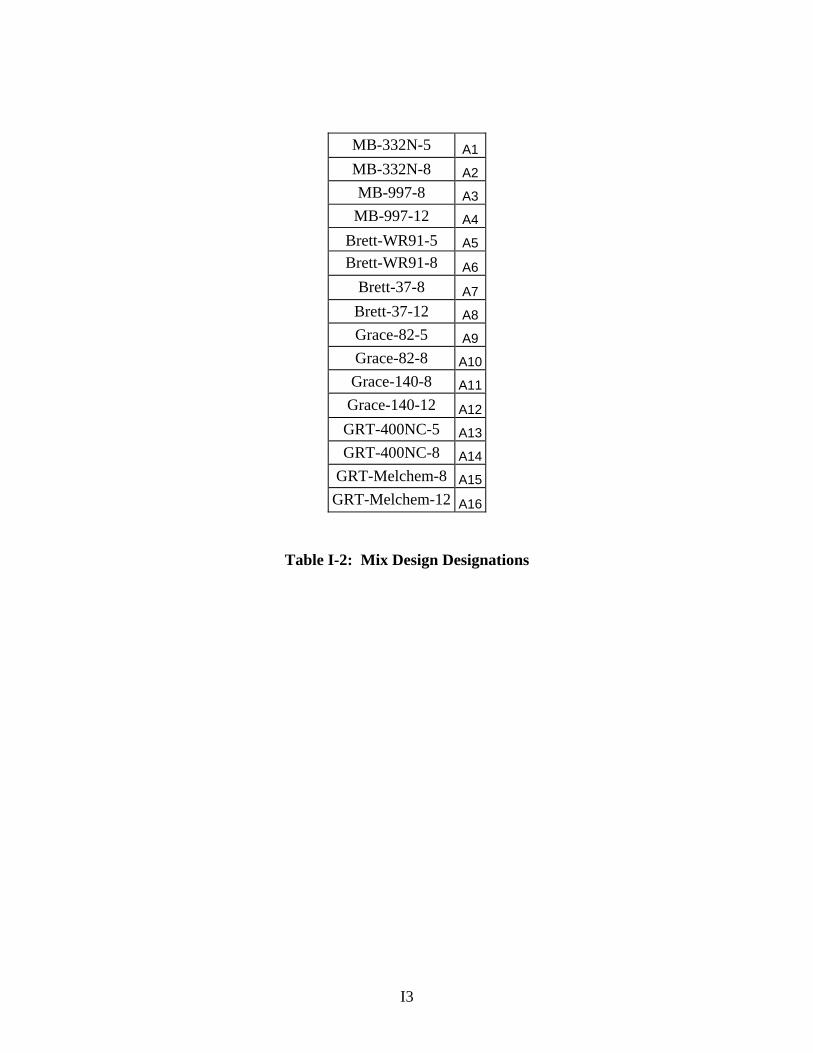
MB-332N-5 A1MB-332N-8 A2MB-997-8 A3MB-997-12 A4
Brett-WR91-5 A5Brett-WR91-8 A6
Brett-37-8 A7Brett-37-12 A8Grace-82-5 A9Grace-82-8 A10Grace-140-8 A11Grace-140-12 A12GRT-400NC-5 A13GRT-400NC-8 A14
GRT-Melchem-8 A15GRT-Melchem-12 A16
Table I-2: Mix Design Designations
I3
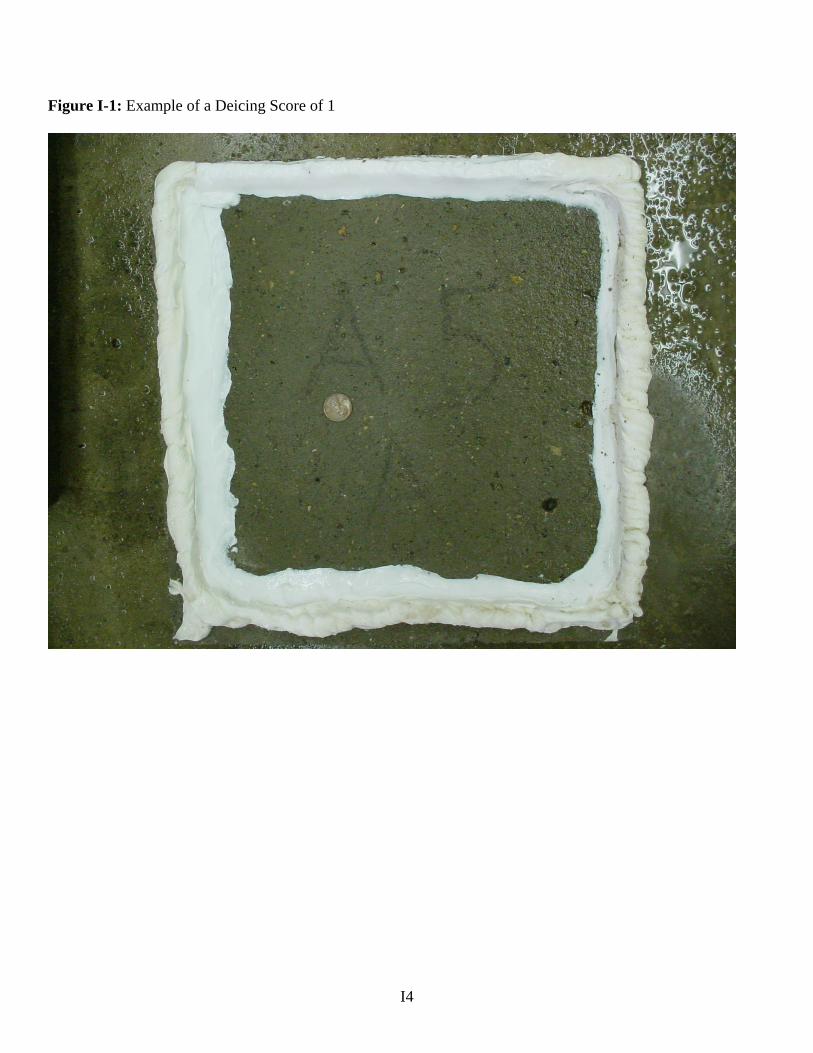
Figure I-1: Example of a Deicing Score of 1
I4
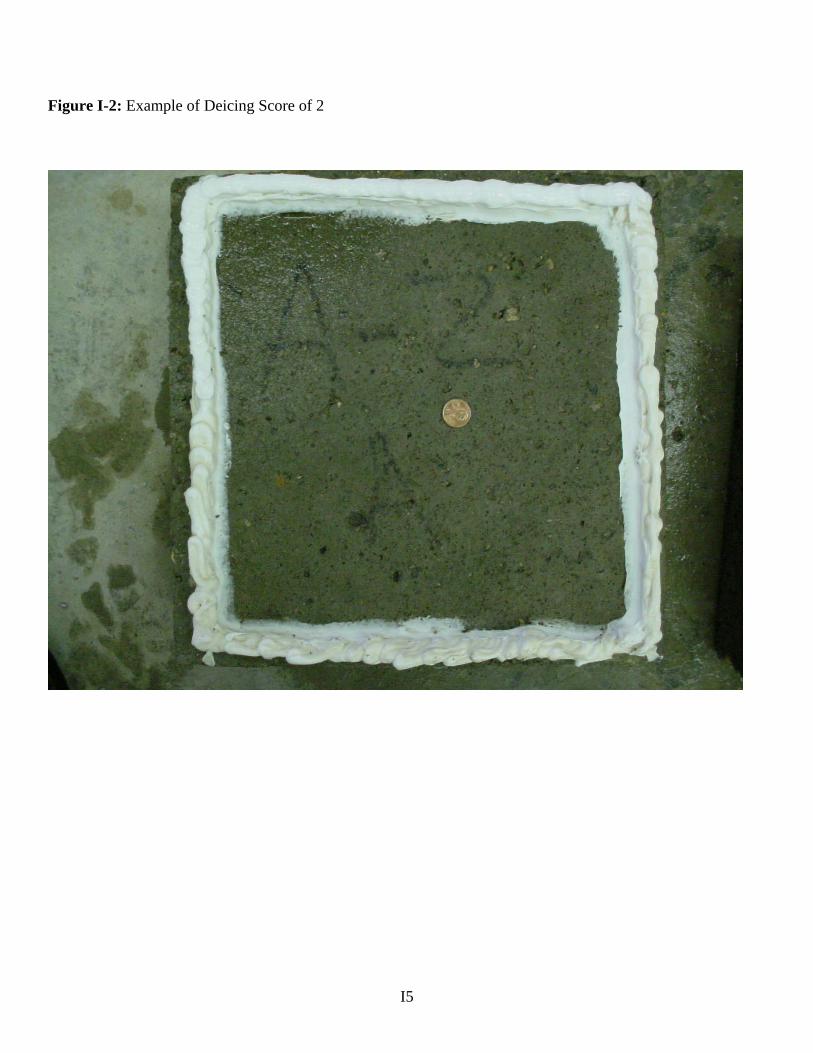
Figure I-2: Example of Deicing Score of 2
I5
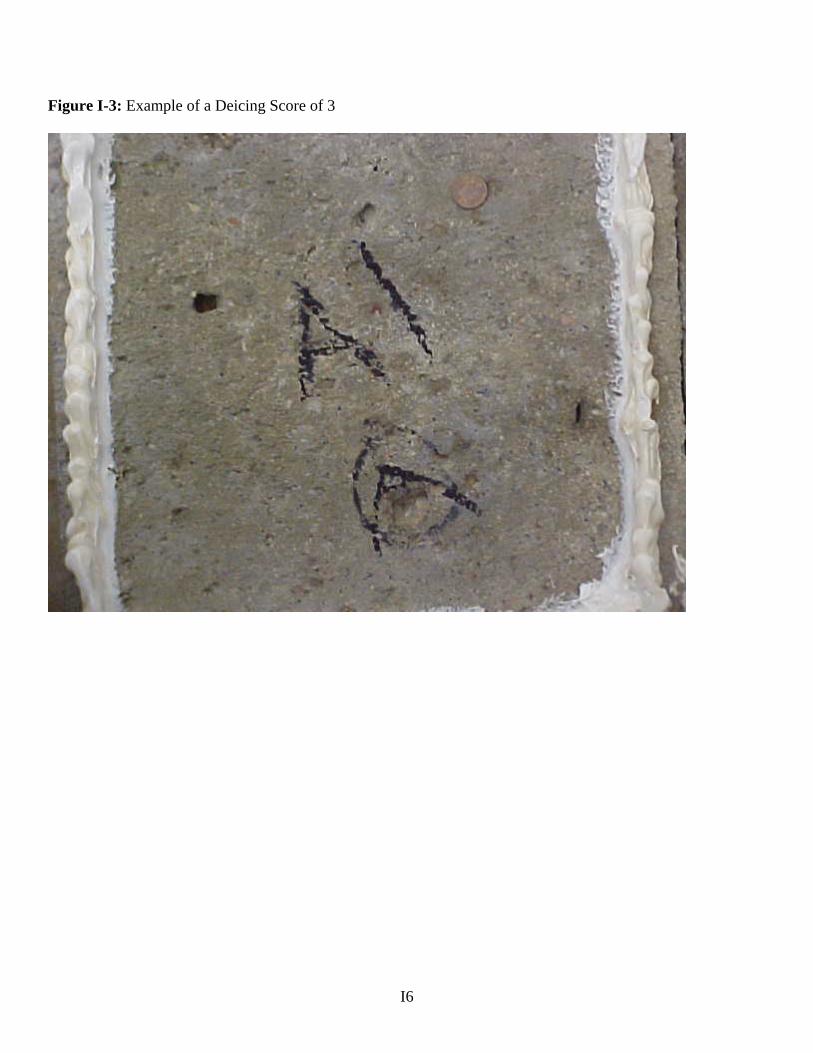
Figure I-3: Example of a Deicing Score of 3
I6
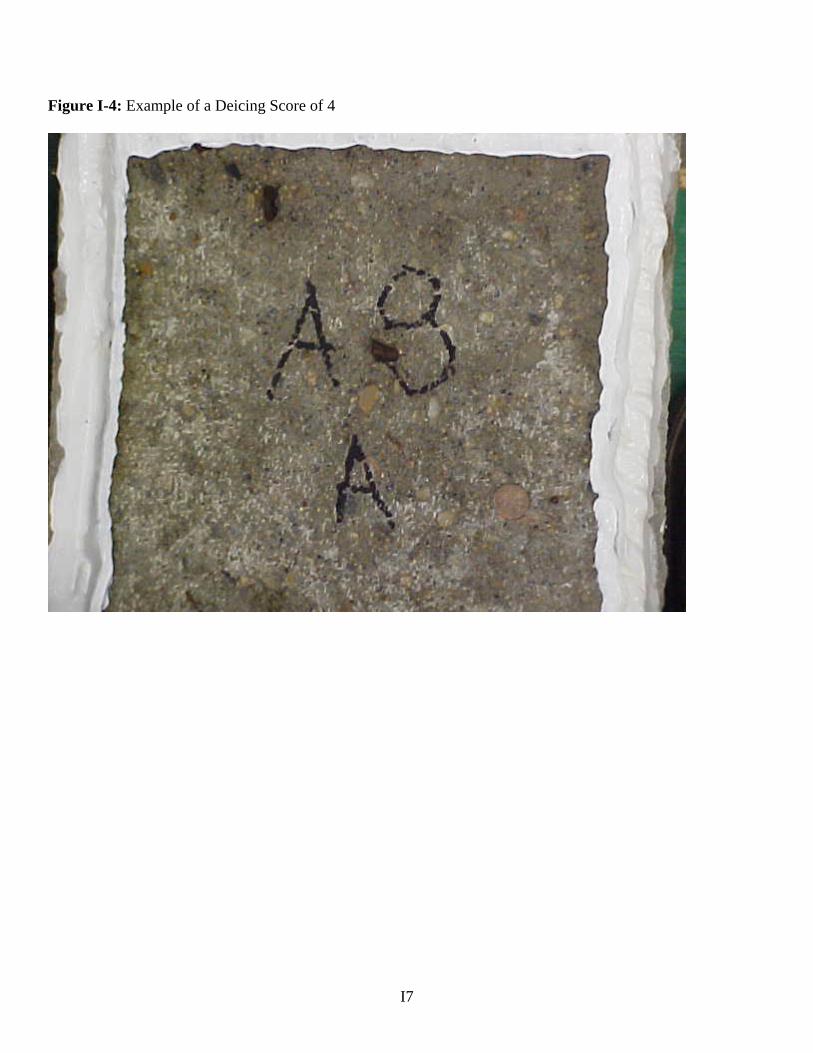
Figure I-4: Example of a Deicing Score of 4
I7
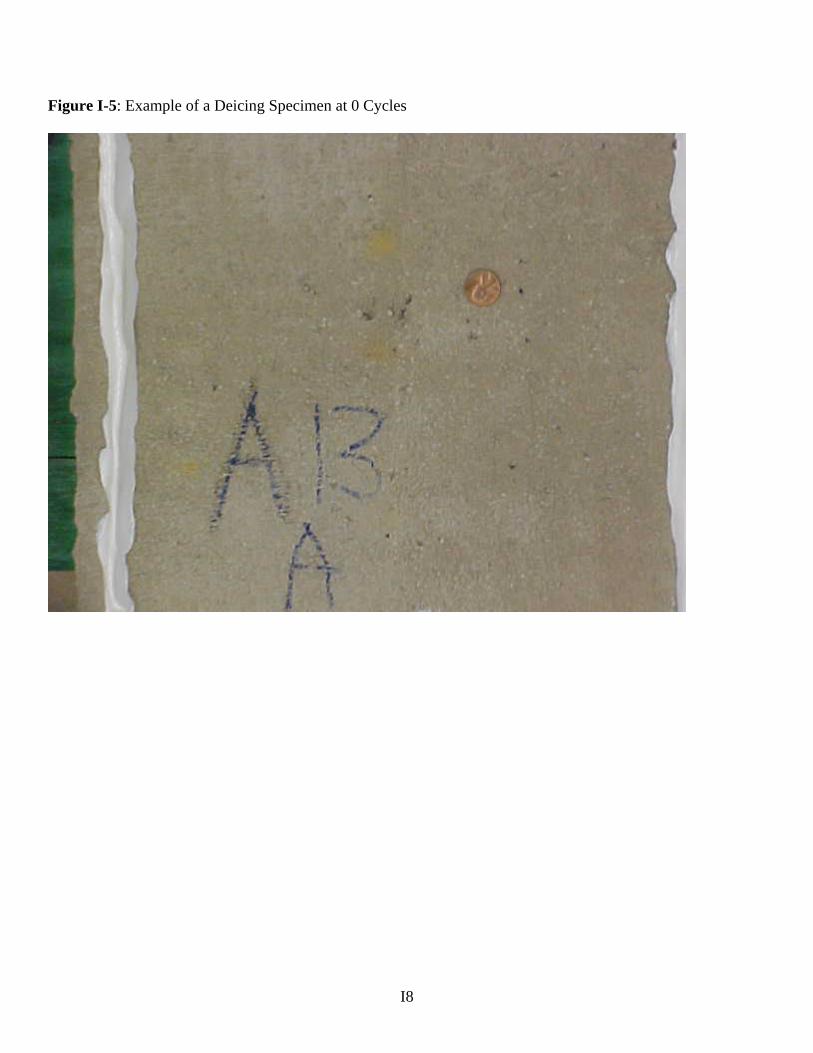
Figure I-5: Example of a Deicing Specimen at 0 Cycles
I8

Appendix J Freeze Thaw Data
• Durability Factor • Specimen Weight Change • Specimen Length Change
J1
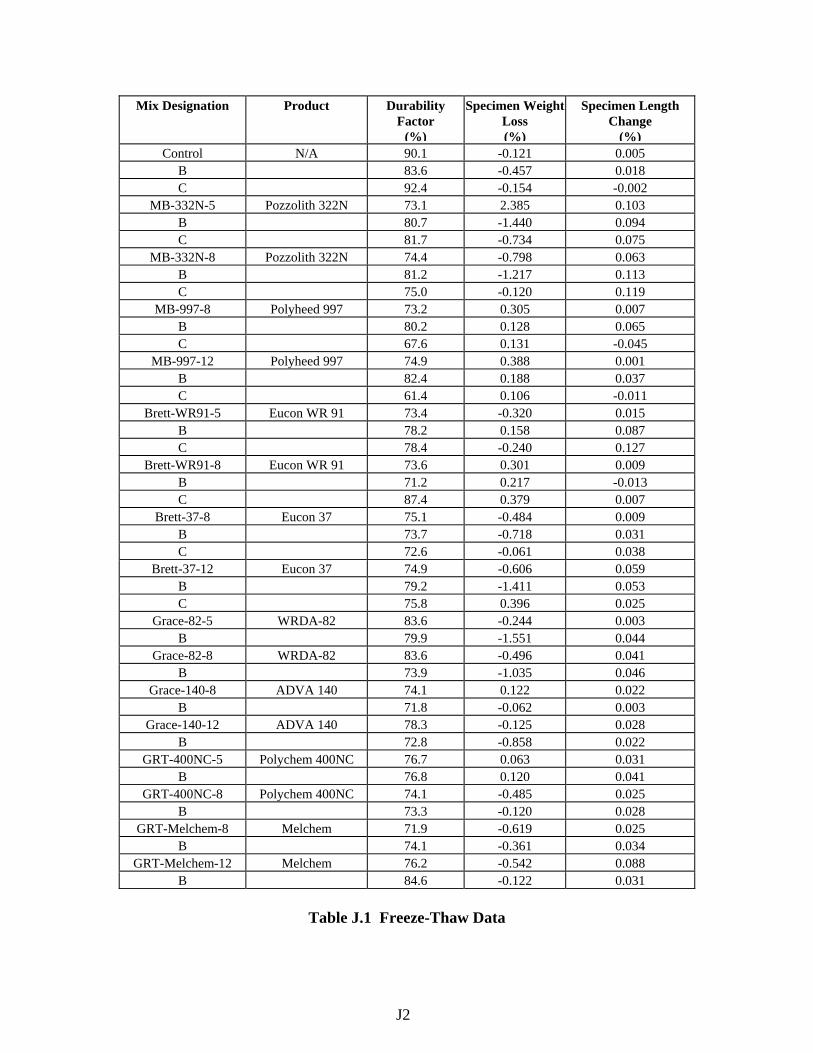
Mix Designation Product Durability Factor
(%)
Specimen Weight Loss (%)
Specimen Length Change
(%) Control N/A 90.1 -0.121 0.005
B 83.6 -0.457 0.018 C 92.4 -0.154 -0.002
MB-332N-5 Pozzolith 322N 73.1 2.385 0.103 B 80.7 -1.440 0.094 C 81.7 -0.734 0.075
MB-332N-8 Pozzolith 322N 74.4 -0.798 0.063 B 81.2 -1.217 0.113 C 75.0 -0.120 0.119
MB-997-8 Polyheed 997 73.2 0.305 0.007 B 80.2 0.128 0.065 C 67.6 0.131 -0.045
MB-997-12 Polyheed 997 74.9 0.388 0.001 B 82.4 0.188 0.037 C 61.4 0.106 -0.011
Brett-WR91-5 Eucon WR 91 73.4 -0.320 0.015 B 78.2 0.158 0.087 C 78.4 -0.240 0.127
Brett-WR91-8 Eucon WR 91 73.6 0.301 0.009 B 71.2 0.217 -0.013 C 87.4 0.379 0.007
Brett-37-8 Eucon 37 75.1 -0.484 0.009 B 73.7 -0.718 0.031 C 72.6 -0.061 0.038
Brett-37-12 Eucon 37 74.9 -0.606 0.059 B 79.2 -1.411 0.053 C 75.8 0.396 0.025
Grace-82-5 WRDA-82 83.6 -0.244 0.003 B 79.9 -1.551 0.044
Grace-82-8 WRDA-82 83.6 -0.496 0.041 B 73.9 -1.035 0.046
Grace-140-8 ADVA 140 74.1 0.122 0.022 B 71.8 -0.062 0.003
Grace-140-12 ADVA 140 78.3 -0.125 0.028 B 72.8 -0.858 0.022
GRT-400NC-5 Polychem 400NC 76.7 0.063 0.031 B 76.8 0.120 0.041
GRT-400NC-8 Polychem 400NC 74.1 -0.485 0.025 B 73.3 -0.120 0.028
GRT-Melchem-8 Melchem 71.9 -0.619 0.025 B 74.1 -0.361 0.034
GRT-Melchem-12 Melchem 76.2 -0.542 0.088 B 84.6 -0.122 0.031
Table J.1 Freeze-Thaw Data
J2