Embed Size (px)
Citation preview

Journal of Modern Applied StatisticalMethods
Volume 8 | Issue 1 Article 29
5-1-2009
Efficiency of Canonical Discriminant Functionversus Mahalanobis Distance in DifferentiatingGroups: Screening Ovarian Cancer in aMultivariate System Analysis Using EnzymeMarkersChinmoy K. BoseNetaji Subhas Chandra Bose Cancer Research Institute, Kolkata, India, [email protected]
Follow this and additional works at: http://digitalcommons.wayne.edu/jmasm
Part of the Applied Statistics Commons, Social and Behavioral Sciences Commons, and theStatistical Theory Commons
This Regular Article is brought to you for free and open access by the Open Access Journals at DigitalCommons@WayneState. It has been accepted forinclusion in Journal of Modern Applied Statistical Methods by an authorized administrator of DigitalCommons@WayneState.
Recommended CitationBose, Chinmoy K. (2009) "Efficiency of Canonical Discriminant Function versus Mahalanobis Distance in Differentiating Groups:Screening Ovarian Cancer in a Multivariate System Analysis Using Enzyme Markers," Journal of Modern Applied Statistical Methods:Vol. 8: Iss. 1, Article 29.Available at: http://digitalcommons.wayne.edu/jmasm/vol8/iss1/29

Journal of Modern Applied Statistical Methods Copyright © 2009 JMASM, Inc. May 2009, Vol. 8, No. 1, 306-315 1538 – 9472/09/$95.00
306
Efficiency of Canonical Discriminant Function versus Mahalanobis Distance in Differentiating Groups: Screening Ovarian Cancer in a Multivariate System
Analysis Using Enzyme Markers
Chinmoy K. Bose Netaji Subhas Chandra Bose Cancer Research Institute, Kolkata, India
Due to its low prevalence, high mortality and uniquely hidden intrapelvic position, ovarian cancer remains a subject of intense interest to researchers. Statistical calculation and new technology both have major roles to play in the effort to screen this cancer at an early stage. Advanced statistics, such as multivariate analysis, remain at the root of screening endeavors. Multivariate analysis has the power to combine many tests and to produce better results in terms high specificity and positive predictive value. Multivariate analysis techniques include Mahalanobis distance (D2), canonical stepwise discriminant function (Z) and Posterior Probability. These may have varied efficacy, but to date comparisons have not been conducted to determine which is best in the context of ovarian cancer screening. Key words: Multivariate analysis, Mahalanobis distance (D2), canonical stepwise discriminant function (Z), posterior probability, ovarian cancer screening, tumor marker.
Introduction With an overall survival rate of 30%, ovarian cancer remains the fifth leading cause of cancer death. This disease, which is neither common nor rare (Bast, 2004), has remained enigmatic amongst gynecological cancers with agonizing prospects. Ovarian cancer is the second most common gynecologic malignancy, and little is known about the progression of its early changes (dysplasia).
Ovarian cancer has the highest mortality rate among gynecologic malignancies (70%) and its mortality rate has not lowered in the last 50 years. Only 25% of cases are diagnosed in an early stage and late case diagnosis survival is very poor. Though tests such as tumor markers and ultrasounds are available, no cost-effective Chinmoy K Bose is a consultant gynecological oncologist presently working in Kolkata, India. He works on ovarian cancer and has special interest in statistical methods like multivariate analysis and non linear dynamics. He has many publications in his subject and publishing a book on endocrine feedback. Email him at: [email protected].
screening method with adequate sensitivity and specificity is available to detect early ovarian cancer.
Combining markers and tests results in higher sensitivity and specificity, thus, many scientists have used multivariate analysis in their experiments. In an ovarian cancer screening system, multivariate stepwise discriminant function analysis is described using different tumor markers, for example, CA125, TPA, IAP, CEA, and ferritin (Yabushita, et al., 1985; LaHousen, et al., 1987). Kobayashi and Terao (1992) combined CA 125, TPA, Ferritin, CEA, AFP and Sialyl Lewis Xi using Mahalanobis distance and were able to decrease both false positive and false negative cases. Bose and Mukherjea (1994) statistically combined several enzymatic tumor markers to increase specificity, positive predictive value (PPV) and to decrease false positive tests.
Other groups described combining multiple markers, but they either combined them in a statistically unacceptable way (Inoue, Fujita, Nakazawa, Ogawa & Tanizawa, 1992), in a simple Euclidian relationship, such as the risk of malignancy Index (RMI, Oram, et al.,1990; Jacobs, et al., 1990) or otherwise (Jacobs, et al.,
BOSE
307
1990). Jacobs, Oram & Bast (1992) used a multivariate system while also using apolipoprotein A1 (down-regulated in cancer); a truncated form of transthyretin (down-regulated) and a cleavage fragment of inter- -trypsin
inhibitor heavy chain H4 (up-regulated). Zhang, Bast, et al. (2004) described the
risk of ovarian cancer (ROC) algorithm. They combined the parameters Serial CA125 assay value, changes in CA125 levels over time and woman’s age, and assay variability by a multivariate based software program, which they called the ROC algorithm. However, they did not describe the actual procedure they followed. They speculated sensitivity 86%, specificity 99.7%, and PPV up to 19% which is encouraging (Menon, et al., 2005). They are now conducting a massive trial on population screening in the UK, which will take another two years to complete.
Timmerman, et al. (2005) combined 12 useful independent prognostic variables in a logistic regression model and found a probability cut off value of 0.10 that gave a sensitivity of 93% and a specificity of 76%. Curling, et al. (1998) conducted a multivariate analysis of DNA ploidy, steroid hormone receptors and CA 125 as prognostic factors in ovarian carcinoma, and Kozak, et al. (2005) used multivariate analysis to greatly improve the detection of early stage ovarian tumors compared to cancer antigen CA125 alone with the help of differential expression of transthyretin (TTR), beta-hemoglobin (Hb), apolipoprotein AI (ApoAI) and transferrin (TF).
Multivariate procedures include Mahalanobis distance (D2), canonical stepwise discriminant function (Z) and Posterior Probability, but no research has been conducted to determine whether they are equally effective in detection systems for screening ovarian cancer using multiple parameters.
Methodology Serum levels of four enzyme makers (placental alkaline phosphatase, lactate dehydrogenase, 5' nucleotidase and Amylase) were measured using a commercially available kit, in 50 ovarian cancer patients and 31 patients with benign gynecological disease before initiation of any
treatment. These were compared with the levels in a control group of 30 healthy women using different multivariate parameters Mahalanobis distance (D2), canonical stepwise discriminant function (Z) and Posterior Probability. The goal was to determine if any difference exists in the power of detection of disease state by these methods and if one is more or most efficient in detecting disease state.
Data for all enzyme levels in different groups were fed into a DIGITAL-VAX 8650 computer using a VMS operating system. BMDP 1990 version software program packages 3D and 7M were used to analyze the data. In BMDP 3D, mean, standard deviation, standard error of mean and pooled T test were used to show significant group differences separately for each enzyme. Sensitivity and specificity for each enzyme were determined at different cut off scores and a Receiver Operator Characteristic Curve (ROC) was prepared to compare the efficacy of individual enzyme.
In the same program, Hotelling’s T2 test, F, p for four enzymes taken together at a time (multivariate analysis) were obtained and were analyzed to observe significant differences between different groups. The F value was observed and, if it significantly exceeded unity, the two groups were assumed to be statistically significantly different.
If a random sample of size n yields the sample value x1, x2, x3,…, xn
1
,n
i
i
xXn=
=
and the sample estimate of variance is
2 2
1
( ),
( 1)
ni
i
x xsn=
−=−
then these are estimates of corresponding population parameters – the population mean μ and the population variance σ2.
In a similar way, multivariate population can be summarized by mean vectors and covariance matrices. These are defined as follows. If there are p variables x1, x2, x3, …, xp and the values of these for the ith individual in a

CANONICAL DISCRIMINANT FUNCTION VERSUS MAHALANOBIS DISTANCE
308
sample are xi1, xi2, xi3, …, xip respectively, then the sample mean of variable j is
1
nij
ji
XX
n=
=
and the sample variance is
22
1
( ).
( 1)
nij j
ji
x xs
n=
−=
−
In addition the sample covariance between variable j and k is defined as
1
( )( ).
( 1)
nij j jk k
jki
x x x xc
n=
− −=
−
The pooled estimate of variance from the two sample n1 and n2 is,
2 22 1 1 2 2
1 2
[( 1) ( 1) ],
( 2)
n s n ssn n
− + −=+ −
the matrix of covariances (C 1 and C 2)
11 12 1
21 22 23
1 2
,p
p p pp
c c cC c c c
c c c
=
the pooled estimate of covariance matrix is
1 1 2 2
1 2
[( 1) ( 1),
( 2)
n C n CCn n
− + −=+ −
and Hotelling’s T2 statistics is defined as
12 1 2 1 2 1 2
1 2
( ) ( ).
( )
n n X X C X XTn n
−− −=+
A significantly large value for these statistics is evidence that the mean vectors are different for the two sample populations. The significance or the lack of significance of T2 is most simply determined by using the null hypothesis case of
equal population means for the transformed statistics.
The analysis of variance (also known as Snedecor’s F or the Fisher-Snedecor F) test is based on the continuous F-distribution, which is a random variate arising as the ratio of two Chi-squared variates:
1
1
2
2
,
Ud
Ud
where U1 and U2 have Chi-square distributions with d1 and d2 degrees of freedom respectively, and U1 and U2 are independent. Thus,
21 2
1 2
( 1)
[( 2) ]
n n p TFn n p+ − −=
+ −
Because T2 is a quadratic form it is scalar, and can be written in as
2 1 21 2 1 2
11 2
( ) ( ),p
i i ik k ki
n nT X X c X Xn n =
= − −+
which is simpler to compute. Here xji is the mean of the variable xi in the jth sample and cik is the element in the ith row and the kth column of the inverse matrix C-1.
BMDP 7M was used for multivariate stepwise canonical discriminant function analysis. To separate the different groups of patients, following simple linear combination was used
1 1 2 2 3 3 4 4.Z K a X a X a X a X= + + + +
Z is the canonical discriminant function of variable enzymes namely X1 = PLAP, X2 = LDH, X3 = 5’N, X4 = Amylase, whereas a1, a2, a3, and a4 are the coefficients of the above variable respectively and K is the constant. Coefficient and constant were determined by using BMDP.
Mahalanobis distance of individuals to group centers can be calculated by the following formula
BOSE
309
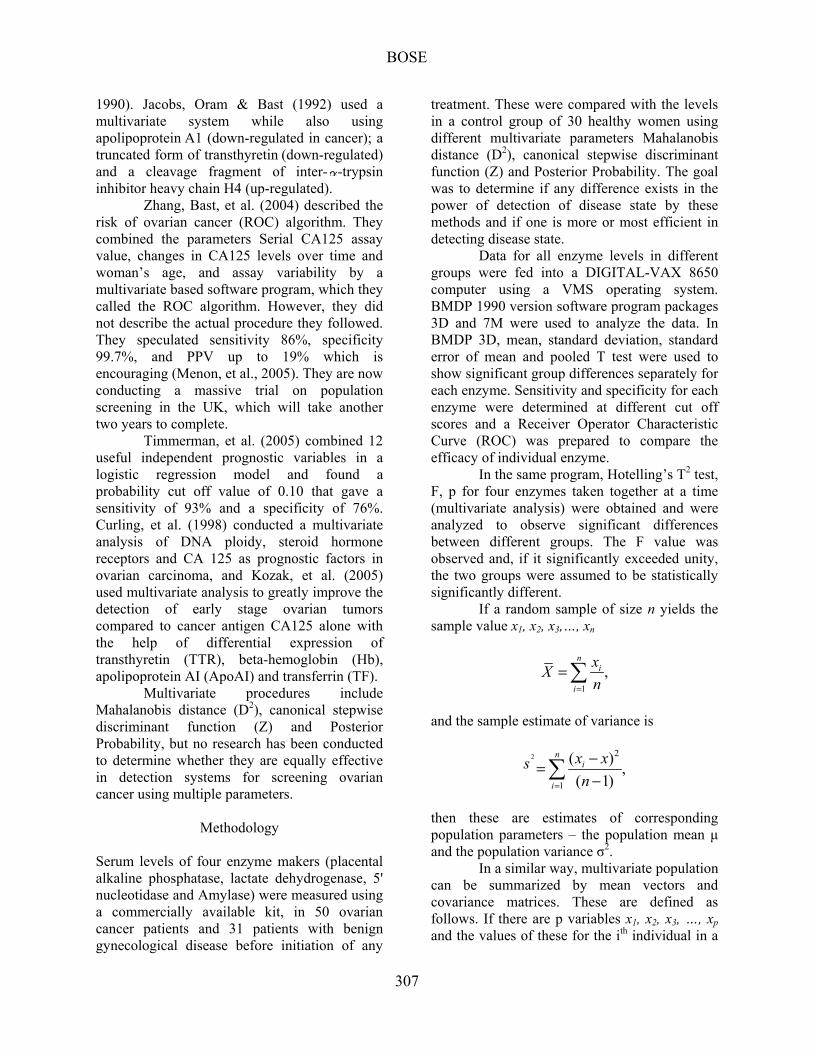
2 ' 1
'
1 1
( ) ( )
( ) ( ),
i i ip p
r ri rs s sir s
D x X C x X
x x c x x
−
= =
= − −
= − −
while the posterior probability is
( : )
( : ) ( )
( : ) ( ) ( : ) ( )
P A PTP PT A P A
P PT A P A P PT NotA P NotA
=
−
where p is probability, A is the abnormality, and PT is the positive test result. Thus, the expression on the left, P (A: PT) is equivalent to the probability P of abnormality A given the positive test result PT. This is described as posterior probability and is in Bayes’ theorem, which relates the conditional and marginal probabilities of stochastic events A and B:
Pr(A B) Pr(BA)Pr(A (A B) Pr(A)
Pr(B)L⏐ ⏐⏐Β) = ∝ |
where L(A|B) is the likelihood of A given fixed B. Each term in Bayes’ theorem has a conventional name. Pr(A) is the prior probability or marginal probability of A. It is prior in the sense that it does not take into account any information about B. Pr(A|B) is the conditional probability of A given B; it is also called the posterior probability because it is derived from or depends upon the specified value of B. Pr(B|A) is the conditional probability of B given A. Pr(B) is the prior or marginal probability of B, and acts as a normalizing constant. The posterior probability is proportional to the prior probability times the likelihood.
Both D2 and PP were determined through the same package. The ROC curve of individual marker enzymes showed LDH to be most sensitive and specific. Thus, LDH was compared with these three multivariate systems in Receiver Operator Characteristic (ROC) chart.
In healthy women discriminant function (Z), Mahalanobis distance (D2) and posterior probability (PP) were determined for each case. Their mean and standard deviation were
compared with the values of corresponding multivariate parameters for each individual in both the benign gynecological disease (BGD) and ovarian cancer group. When plotted with chosen cut-off scores with their corresponding (1−specificity) in x axis and sensitivity in y axis the ROC curve will show comparative efficacy of Z over D2, PP and LDH in terms of largest area under the graph.
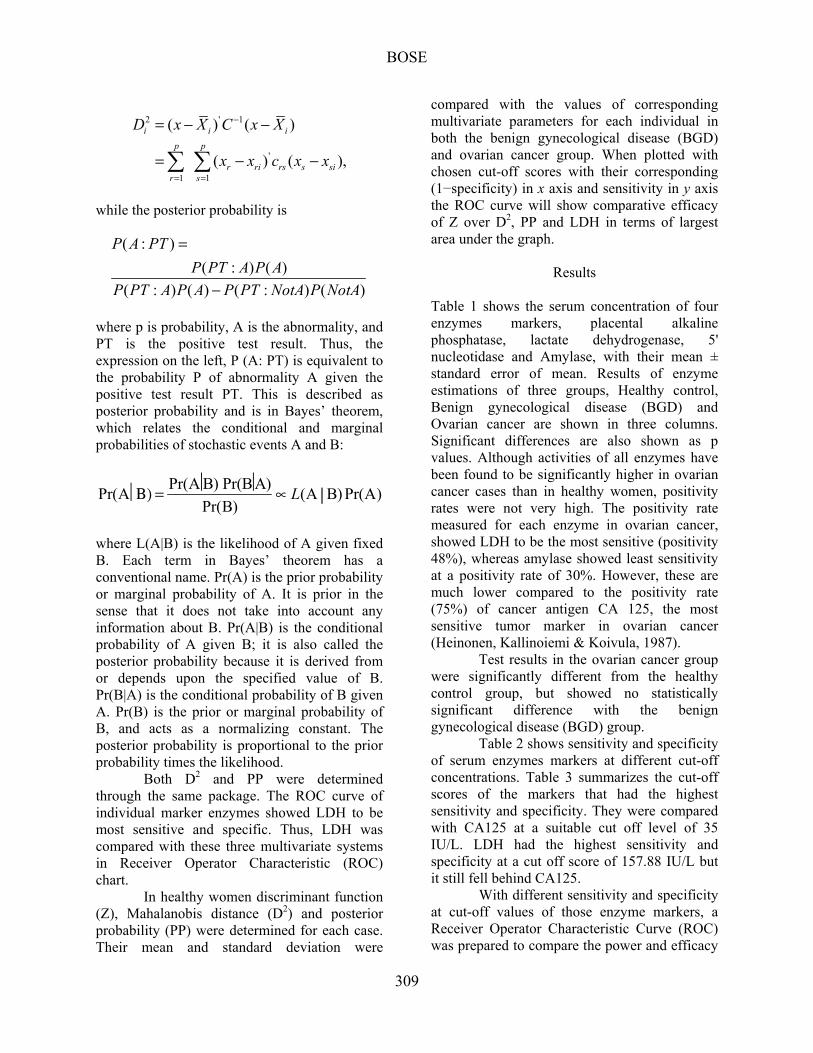
Results Table 1 shows the serum concentration of four enzymes markers, placental alkaline phosphatase, lactate dehydrogenase, 5' nucleotidase and Amylase, with their mean ± standard error of mean. Results of enzyme estimations of three groups, Healthy control, Benign gynecological disease (BGD) and Ovarian cancer are shown in three columns. Significant differences are also shown as p values. Although activities of all enzymes have been found to be significantly higher in ovarian cancer cases than in healthy women, positivity rates were not very high. The positivity rate measured for each enzyme in ovarian cancer, showed LDH to be the most sensitive (positivity 48%), whereas amylase showed least sensitivity at a positivity rate of 30%. However, these are much lower compared to the positivity rate (75%) of cancer antigen CA 125, the most sensitive tumor marker in ovarian cancer (Heinonen, Kallinoiemi & Koivula, 1987).
Test results in the ovarian cancer group were significantly different from the healthy control group, but showed no statistically significant difference with the benign gynecological disease (BGD) group.
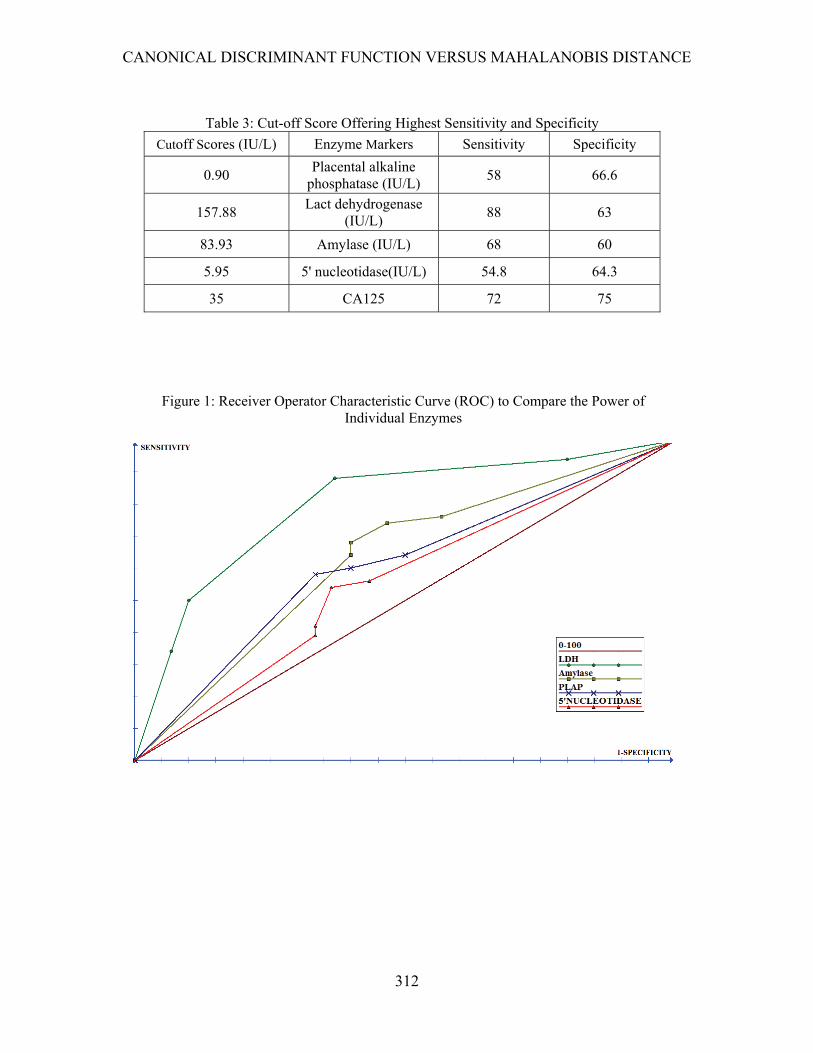
Table 2 shows sensitivity and specificity of serum enzymes markers at different cut-off concentrations. Table 3 summarizes the cut-off scores of the markers that had the highest sensitivity and specificity. They were compared with CA125 at a suitable cut off level of 35 IU/L. LDH had the highest sensitivity and specificity at a cut off score of 157.88 IU/L but it still fell behind CA125.
With different sensitivity and specificity at cut-off values of those enzyme markers, a Receiver Operator Characteristic Curve (ROC) was prepared to compare the power and efficacy

CANONICAL DISCRIMINANT FUNCTION VERSUS MAHALANOBIS DISTANCE
310
of individual enzymes to differentiate between groups in a univariate system (Figure 1).
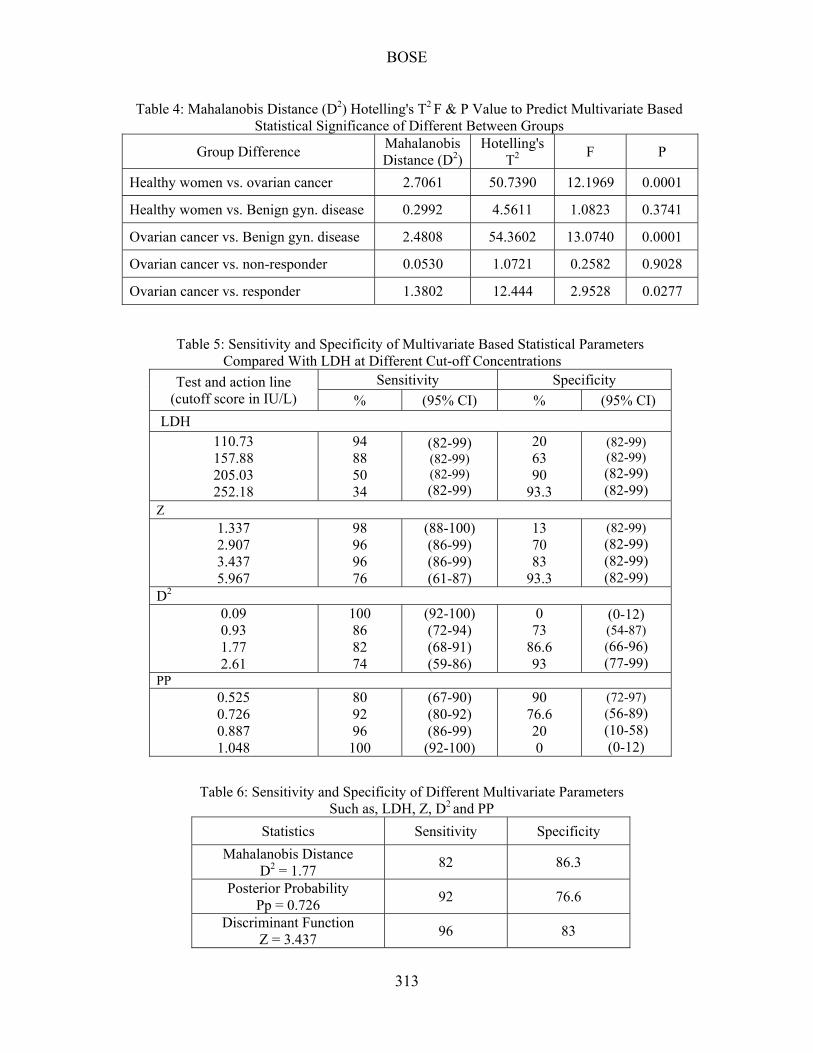
Four serum enzymes are used at a time in multivariate analysis by the BMDP package (program 3D), where a significant group difference was observed between healthy versus ovarian cancer and BGD versus ovarian cancer patients; in healthy versus BGD there was no statistically significant difference (Table 4.). Z, D2 and PP were obtained through program 7M for healthy versus ovarian cancer patients. Sensitivity and specificity of LDH, Z, D2 and PP at different cut-off scores or action lines with their confidence interval (derived from the binomial distribution chart) for healthy women and ovarian cancer cases are shown in Table 5. Table 6 compares sensitivity and specificity of different multivariate parameters such as, LDH, Z, D2 and PP.
The performance of the canonical discriminant function (Z) at various upper limits is illustrated in the ROC chart (Figure 2) and is observed to combine higher levels of sensitivity and specificity than those achieved by Mahalanobis distance (D2), PP and LDH. Table 7 shows the positive and negative predictive values for malignancy of ovary for different levels of Z (cutoff scores 1.377, 2.907. 3.437 and 5.967). A cut-off score of 3.437 produced the best results. No statistically significant group difference was predicted between healthy and BGD, which was corroborated by the determination of Z value.
Conclusion The population screening of ovarian cancer has remained elusive due to low disease prevalence and low positive predictive value of the tests. Some groups are trying to combine different test results in different software packages using algorithms based on multivariate systems of data processing, but many alternatives in this multivariate system exist which are not based on some type of mathematical calculation. As a result, finding more efficacious methods in terms of higher specificity and higher positive predictive value is a priority. This system is applicable in many areas in biology and medicine. This article presented an example of the use of multivariate analysis in ovarian cancer
screening to illustrate the comparative efficacy of stepwise discriminant function (Z) Mahalanobis distance (D’) and posterior probability (PP).
It is expected that this example will be replicated in other experimental circumstances, but will need further verification and establishment of mathematical proof as to why it occurs. In the experiment presented, it was observed that the Multivariate stepwise discriminant function (Z) analysis of enzyme variables establishes an easy quantitative assessment method of the risk of malignancy in the ovary. A Z value with a cut-off score of 3.437 has a higher predictive value and relative risk than LDH, Mahalanobis distance (D2) or posterior probability (PP). This system of combining four enzymes for improvement of ovary screening must be established in clinical practice through further research.
References
Bast, R. C. Jr. (2004). Early detection of ovarian cancer: New technologies in pursuit of a disease that is neither common nor rare. Trans American Clinical Climatological Association, 115, 233-248.
Bose, C. K., & Mukherjea, M. (1994). Enzymatic tumor markers in ovarian cancer: a multiparametric study. Cancer Letters, 77(1), 39-43
Curling, M., Stenning, S., Hudson, C. N., & Watson, J. V. (1998). Multivariate analyses of DNA index, p62c-myc, and clinicopathological status of patients with ovarian cancer. Journal of Clinical Pathology, 51(6), 455-461.
Heinonen, P. K., Kallinoiemi. O. P., & Koivula. T. (1987). Comparison of CA 125 and placental alkaline phosphatase as ovarian tumour markers. Tumori, 73(3), 301-302.
Inoue, M., Fujita, M., Nakazawa, A., Ogawa, H, Tanizawa, O. (1992). Sialyl-Tn, sialyl-Lewis Xi, CA 19-9, CA 125, carcinoembryonic antigen, and tissue polypeptide antigen in differentiating ovarian cancer from benign tumors. Obstetrics and Gynecology, 79, 434-440.
BOSE
311
Table 1: Serum Concentration of Enzymes Markers Mean ± SEM
Enzymes Healthy Control
Benign Gynecological Disease (BGD)
Ovarian Cancer
Placental alkaline phosphatase (IU/L)
0.81± 0.09 1.76 ± 0.47 (P< .0615)
4.47 ± 0.89 (P< .0011)
Lactate dehydrogenase
(IU/L) 157.88 ± 8.61
155.65 ± 7.88 (P< .8497)
255.44 ± 16.19 (P< .0001)
5' nucleotidase (IU/L)
5.94 ± 0.75 5.22 ± 0.42 (P< .4098)
9.13 ± 0.93 (P< .0191)
Amylase (IU/L) 79.1 ± 3.83 77.8 ± 3.38 (P< .6828)
121.54 ± 8.23 (P< .0001)
Table 2: Sensitivity and Specificity of Serum Enzymes Markers at Different Cut-off Concentrations
Test and Action Line (cutoff score in IU/L)
Sensitivity Specificity
LDH 110.73 157.88 205.03 252.18
94 88 50 34
20 63 90
93.3 Amylase
75.25 79.1
83.93 86.76
76 74 68 64
43.3 53.3 60 60
PLAP 0.72 0.81 0.90
64 60 58
50 60
66.6 5’Nucleotidase
5.19 5.94 6.69 7.44
56 54 42 39
56.6 63.6 66.6 66.6
CANONICAL DISCRIMINANT FUNCTION VERSUS MAHALANOBIS DISTANCE
312
Table 3: Cut-off Score Offering Highest Sensitivity and Specificity
Cutoff Scores (IU/L) Enzyme Markers Sensitivity Specificity
0.90 Placental alkaline
phosphatase (IU/L) 58 66.6
157.88 Lact dehydrogenase
(IU/L) 88 63
83.93 Amylase (IU/L) 68 60
5.95 5' nucleotidase(IU/L) 54.8 64.3
35 CA125 72 75
Figure 1: Receiver Operator Characteristic Curve (ROC) to Compare the Power of Individual Enzymes
BOSE
313
Table 4: Mahalanobis Distance (D2) Hotelling's T2 F & P Value to Predict Multivariate Based Statistical Significance of Different Between Groups
Group Difference Mahalanobis Distance (D2)
Hotelling's T2
F P
Healthy women vs. ovarian cancer 2.7061 50.7390 12.1969 0.0001
Healthy women vs. Benign gyn. disease 0.2992 4.5611 1.0823 0.3741
Ovarian cancer vs. Benign gyn. disease 2.4808 54.3602 13.0740 0.0001
Ovarian cancer vs. non-responder 0.0530 1.0721 0.2582 0.9028
Ovarian cancer vs. responder 1.3802 12.444 2.9528 0.0277
Table 5: Sensitivity and Specificity of Multivariate Based Statistical Parameters Compared With LDH at Different Cut-off Concentrations
Test and action line (cutoff score in IU/L)
Sensitivity Specificity
% (95% CI) % (95% CI)
LDH
110.73 157.88 205.03 252.18
94 88 50 34
(82-99) (82-99) (82-99) (82-99)
20 63 90
93.3
(82-99) (82-99) (82-99) (82-99)
Z 1.337 2.907 3.437 5.967
98 96 96 76
(88-100) (86-99) (86-99) (61-87)
13 70 83
93.3
(82-99) (82-99) (82-99) (82-99)
D2 0.09 0.93 1.77 2.61
100 86 82 74
(92-100) (72-94) (68-91) (59-86)
0 73
86.6 93
(0-12) (54-87) (66-96) (77-99)
PP 0.525 0.726 0.887 1.048
80 92 96
100
(67-90) (80-92) (86-99)
(92-100)
90 76.6 20 0
(72-97) (56-89) (10-58) (0-12)
Table 6: Sensitivity and Specificity of Different Multivariate Parameters Such as, LDH, Z, D2 and PP
Statistics Sensitivity Specificity
Mahalanobis Distance D2 = 1.77
82 86.3
Posterior Probability Pp = 0.726
92 76.6
Discriminant Function Z = 3.437
96 83

CANONICAL DISCRIMINANT FUNCTION VERSUS MAHALANOBIS DISTANCE
314
Table 7: Positive and Negative Predictive Value for Different Levels of Z
Z Score Predictive Value (%)
Positive Negative
1.337 91.3 3.7
2.907 91.3 9.6
3.437 84 92
5.967 70 95
Figure 2: Receiver Operator Characteristic Curve (ROC) to Compare the Power of Multivariate Based Statistical Parameters Compared with LDH
BOSE
315
Jacobs, I. J., et al. (1990). A risk of malignancy index incorporating CA 125, ultrasound and menopausal status for the accurate preoperative diagnosis of ovarian cancer. British Journal of Obstetrics and Gynaecology, 97(10), 922-929.
Jacobs, I. J., Oram, D., & Bast, R. C. Jr. (1992).Strategies for improving the specificity of screening for ovarian cancer with tumor-associated antigens CA 125, CA 15-3, and TAG 72.3. Obstetrics and Gynecology, 80(3), Part 1, 396-399.
Kobayashi, H., & Terao, T. (1992). Field trial for the early detection of patients with ovarian cancer. Rinsho Byori, 40(2), 139-145.
Kozak, K. R ., Su, F., Whitelegge, J. P., et al. (2005). Characterization of serum biomarkers for detection of early stage ovarian cancer. Proteomics, 5(17), 4589-4596.
LaHousen, M., Stettner, H., Prckel, J., Urdl, W., & Purstner, P. (1987). The predictive value of a combination of tumor-markers in monitoring patients with ovarian cancer. Cancer, 60(9), 2228-2232.
Menon, U., et al. (2005). Prospective study using the risk of ovarian cancer algorithm to screen for ovarian cancer. Journal of Clinical Oncology, 23(31), 7919-7926.
Oram, D. H., Jacobs, I. J., Brady, J. L., Prys-Davies, A. (1990). Early diagnosis of ovarian cancer. Br J Hosp Med., 44(5), 320-324.
Timmerman, D., Testa, A. C., Bourne, T., et al (2005). Logistic regression model to distinguish between the benign and malignant adnexal mass before surgery: A multicenter study by the International Ovarian Tumor Analysis Group. Journal of Clinical Oncology, 23(34), 8794-8801.
Yabushita, H., et al. (1985). Diagnostic usefulness of stepwise discriminant analysis employing the values of CA 125, TPA, IAP, CEA and Ferritin in sera measured simultaneously for gynecological malignant neoplasm. Nippon Sanka Fujinka Gakki Zasshi, 37(9), 1883-1892.
Zhang, Z., Bast, R. C. Jr., et al. (2004). Three biomarkers identified from serum proteomic analysis for the detection of early stage ovarian cancer. Cancer Research, 64, 5882-5890.