Embed Size (px)
Citation preview
International Journal of Emerging Engineering Research and Technology
Volume 3, Issue 9, September, 2015, PP 55-67
ISSN 2349-4395 (Print) & ISSN 2349-4409 (Online)
*Address for correspondence:
International Journal of Emerging Engineering Research and Technology V3 ● I9 ● September 2015 55
Efficiency of Memory Allocation Algorithms Using Mathematical
Model
*1Ledisi G. Kabari,
2Tamunoomie S. Gogo
1Computer Science Department, Rivers State Polytechnic, Bori, Nigeria 2Computer Science Department, Rivers State Polytechnic, Bori, Nigeria
ABSTRACT
Management of processes by the Operating System is one key area of research in operating systems. This paper
gives a practical demonstration and analyses the efficiency of three major memory allocation algorithms in the
multiple partition contiguous memory allocation scheme using a mathematical model on three different sets of
process sizes in terms of percentage total utilization(TU%), percentage external fragmentation(EF%) and
percentage internal fragmentation(IF%). Result from the analysis shows that best-fit made efficient use of the
available memory space better than that of first-fit and worst-fit.
Keywords: Internal fragmentation, External fragmentation, Memory utilization, Percentage utilization, Total
Utilization
INTRODUCTION
Besides the responsibility of managing processes, the operating system must efficiently manage the
primary memory of the computer. The part of the operating system which handles this responsibility
is called the memory manager. Since every process must have some amount of primary memory in
order to execute, the performance of the memory manager is crucial to the performance of the entire
system. The memory manager is responsible for allocating primary memory to processes and for
assisting the programmer in loading and storing the contents of the primary memory.
Managing the sharing of primary memory and minimizing memory access time are the basic goals of
the memory manager. The real challenge of efficiently managing memory is seen in the case of a
system which has multiple processes running at the same time. Since primary memory can be space-
multiplexed, the memory manager can allocate a portion of primary memory to each process for its
own use. However, the memory manager must keep track of which processes are running in which
memory locations, and it must also determine how to allocate and de-allocate available memory when
new processes are created and when old processes complete execution.
RELATED WORKS
Memory management is the act of managing computer memory at the system level. The essential
requirement of memory management is to provide ways to dynamically allocate portions of memory
to programs at their request, and free it for reuse when no longer needed. This is critical to any
advanced computer system where more than a single process might be underway at any time[1].
In operating systems, memory management is the function responsible for managing the computer's
primary memory [2].
The memory management function keeps track of the status of each memory location, either allocated
or free. It determines how memory is allocated among competing processes, deciding who gets
Ledisi G. Kabari & Tamunoomie S. Gogo “Efficiency of Memory Allocation Algorithms Using
Mathematical Model”
56 International Journal of Emerging Engineering Research and Technology V3 ● I9 ● September 2015
memory, when they receive it, and how much they are allowed. When memory is allocated it
determines which memory locations will be assigned. It tracks when memory is freed or unallocated
and updates the status.
Several methods have been devised that increase the effectiveness of memory management. Virtual
memory systems separate the memory addresses used by a process from actual physical addresses,
allowing separation of processes and increasing the effectively available amount of RAM using
paging or swapping to secondary storage. The quality of the virtual memory manager can have an
extensive effect on overall system performance.
In operating systems, memory management is the function responsible for managing the computer's
primary memory [2].
Dynamic Memory Allocation
The task of fulfilling an allocation request consists of locating a block of unused memory of sufficient
size. Memory requests are satisfied by allocating portions from a large pool of memory called the
heap or free store. At any given time, some parts of the heap are in use, while some are "free"
(unused) and thus available for future allocations.
Several issues complicate the implementation, such as external fragmentation, which arises when
there are many small gaps between allocated memory blocks, which invalidate their use for an
allocation request. The allocator's metadata can also inflate the size of (individually) small allocations.
This is often managed by chunking. The memory management system must track outstanding
allocations to ensure that they do not overlap and that no memory is ever "lost" as a memory leak.
Efficiency
The specific dynamic memory allocation algorithm implemented can impact performance
significantly. A study conducted in 1994 by Digital Equipment Corporation illustrates the overheads
involved for a variety of allocators. The lowest average instruction path length required to allocate a
single memory slot was 52 (as measured with an instruction level profiler on a variety of software)[3].
Memory Management Techniques
There are different memory management techniques that can be used: single contiguous allocation,
Partitioned allocation, Paged memory management or segmented memory management.
Single Contiguous Allocation. Single allocation is the simplest memory management technique. The
entire computer's memory, usually with the exception of a small portion reserved for the operating
system, is available to the single application. MS-DOS is an example of a system which allocates
memory in this way. An embedded system running a single application might also use this technique.
A system using single contiguous allocation may still multitask by swapping the contents of memory
to switch among users. Early versions of the Music operating system used this technique
Partitioned Allocation. Partitioned allocation divides primary memory into multiple memory
partitions, usually contiguous areas of memory. Each partition might contain all the information for a
specific job or task. Memory management consists of allocating a partition to a job when it starts and
unallocating it when the job ends.
Partitioned allocation usually requires some hardware support to prevent the jobs from interfering
with one another or with the operating system. The IBM System/360 used a lock-and-key technique.
Other systems used base and bounds registers which contained the limits of the partition and flagged
invalid accesses. The UNIVAC 1108 storage Limits Register had separate base/bound sets for
instructions and data. The system took advantage of memory interleaving to place what were called
Ledisi G. Kabari & Tamunoomie S. Gogo “Efficiency of Memory Allocation Algorithms Using
Mathematical Model”
International Journal of Emerging Engineering Research and Technology V3 ● I9 ● September 2015 57
the i bank and d bank in separate memory modules [4]. Partitions may be either static that is defined
at Initial Program Load (IPL) or boot time or by the computer operator or dynamic, that is
automatically created for a specific job. IBM System/360 operating System Multiprogramming with a
Fixed Number of Tasks (MFT) is an example of static partitioning, and Multiprogramming with a
Variable Number of Tasks (MVT) is an example of dynamic. MVT and successors use the term
region to distinguish dynamic partitions from static ones in other systems[5].
Partitions may be relocatable using hardware typed memory, like the Burroughs Corporation B5500,
or base and bounds registers like the PDP-10 or GE-635. Relocatable partitions are able to be
compacted to provide larger chunks of contiguous physical memory. Compaction moves "in-use"
areas of memory to eliminate "holes" or unused areas of memory caused by process termination in
order to create larger contiguous free areas[6]. Some systems allow partitions to be swapped out to
secondary storage to free additional memory. Early versions of IBM's Time sharing option (TSO)
swapped users in and out of a single time-sharing partition [7].
Paged Memory Management. Paged allocation divides the computer's primary memory into fixed-
size units called page frames, and the program's virtual address space into pages of the same size. The
hardware memory management unit maps pages to frames. The physical memory can be allocated on
a page basis while the address space appears contiguous.
Usually, with paged memory management, each job runs in its own address space. However, there are
some single address space operating systems that run all processes within a single address space, such
as IBMi, which runs all processes within a large address space, and IBM OS/VS2 SVS, which ran all
jobs in a single 16MiB virtual address space.
Paged memory can be demand-paged when the system can move pages as required between primary
and secondary memory.
Segmented Memory Allocation. Segmented memory is the only memory management technique that
does not provide the user's program with a 'linear and contiguous address space. Segments are areas of
memory that usually correspond to a logical grouping of information such as a code procedure or a
data array. Segments require hardware support in the form of a segment table which usually contains
the physical address of the segment in memory, its size, and other data such as access protection bits
and status (swapped in, swapped out, etc.)
Segmentation allows better access protection than other schemes because memory references are
relative to a specific segment and the hardware will not permit the application to reference memory
not defined for that segment.
It is possible to implement segmentation with or without paging. Without paging support the segment
is the physical unit swapped in and out of memory if required. With paging support the pages are
usually the unit of swapping and segmentation only adds an additional level of security.
Addresses in a segmented system usually consist of the segment id and an offset relative to the
segment base address, defined to be offset zero. The Intel IA-32 (x86) architecture allows a process to
have up to 16,383 segments of up to 4GiB each. IA-32 segments are subdivisions of the computer's
linear address space, the virtual address space provided by the paging hardware [8].
The Multics operating system is probably the best known system implementing segmented memory.
Multics segments are subdivisions of the computer's physical memory of up to 256 pages, each page
being 1K 36-bit words in size, resulting in a maximum segment size of 1MiB (with 9-bit bytes, as
used in Multics). A process could have up to 4046 segments [9].
Ledisi G. Kabari & Tamunoomie S. Gogo “Efficiency of Memory Allocation Algorithms Using
Mathematical Model”
58 International Journal of Emerging Engineering Research and Technology V3 ● I9 ● September 2015
Fragmentation
Memory fragmentation occurs when a system contains memory that is technically free but that the
computer can’t utilize. The memory allocator, which assigns needed memory to various tasks, divides
and allocates memory blocks as they are required by programs; when data is deleted, more memory
blocks are freed up in the system and added back to the pool of available memory. When the
allocator’s actions or the restoration of previously occupied memory segments leads to blocks or even
bytes of memory that are too small or too isolated to be used by the memory pool, fragmentation has
occurred. Fragmentation can take a significant bite out of a computer's free memory and it is often the
cause of frustrating out-of-memory error messages.
Internal Fragmentation (IF) occurs when the memory allocator leaves extra space empty inside of a
block of memory that has been allocated for a client. This usually happens because the processor’s
design stipulates that memory must be cut into blocks of certain sizes -- for example, blocks may be
required to be evenly be divided by four, eight or 16 bytes. When this occurs, a client that needs 57
bytes of memory, for example, may be allocated a block that contains 60 bytes, or even 64. The extra
bytes that the client doesn’t need go to waste, and over time these tiny chunks of unused memory can
build up and create large quantities of memory that can’t be put to use by the allocator. Because all of
these useless bytes are inside larger memory blocks, the fragmentation is considered internal.
External Fragmentation (EF) happens when the memory allocator leaves sections of unused memory
blocks between portions of allocated memory. For example, if several memory blocks are allocated in
a continuous line but one of the middle blocks in the line is freed (perhaps because the process that
was using that block of memory stopped running), the free block is fragmented. The block is still
available for use by the allocator later if there’s a need for memory that fits in that block, but the block
is now unusable for larger memory needs. It cannot be lumped back in with the total free memory
available to the system, as total memory must be contiguous for it to be useable for larger tasks. In
this way, entire sections of free memory can end up isolated from the whole that are often too small
for significant use, which creates an overall reduction of free memory that over time can lead to a lack
of available memory for key tasks.
Fragmentation can become an issue because it builds up over time, creating small and useless blocks
of memory and limiting the amount of a computer’s available free memory. As it progresses,
fragmentation can cause system performance to become slow and sluggish in the short term; in the
long term, fragmentation can shorten the life of a computer or server by 30 percent on average. Of the
two types of fragmentation, internal is more predictable than external because the amount of wasted
space is determined by the memory allocator’s parameters (how big the allocated blocks must be),
which is a constant. In addition, the amount of overall memory lost to internal fragmentation is
usually less than what’s lost to external fragmentation, although it can gradually accumulate. External
fragmentation, on the other hand, is harder to predict because in most cases several processes are
regularly starting and stopping in the system and blocks of memory that are used for varying lengths
of time are freed up in a different order than they were filled, leaving gaps in the available
memory[10].
ANALYSIS OF MEMORY ALLOCATION ALGORITHMS
When allocating processes to a memory under the dynamic allocation strategy, algorithms considered
are first-fit best-fit, worst-fit and next-fit. In this article, we are going to consider three sets of
processes and sizes on a partition of memory. Efficiency of the algorithms is based on its maximum
utilization of memory. Since the holes are not arranged orderly i.e. from small hole to the biggest hole
Ledisi G. Kabari & Tamunoomie S. Gogo “Efficiency of Memory Allocation Algorithms Using
Mathematical Model”
International Journal of Emerging Engineering Research and Technology V3 ● I9 ● September 2015 59
or the biggest hole to the smallest, the worst case of binary search is always adopted. Where the time
complexity is always O(log(n))
First-fit: Looking through the available holes, the process is allocated to the first hole that is big
enough for the process on the queue, since search since not directed (that is; going from a particular
direction) it can go from the end of the list holes or from the beginning of the list of holes.
Best-fit: Searching through the list of available holes, allocate to the smallest hole that is big enough
to accommodate the incoming process.
Worst-fit: This allocates to the process the available process the largest hole irrespective of the
position of the hole.
Next-fit: Follows a sequential form where the available holes are the next hole after allocation.
We analyze these algorithms with a constant memory partition and three sets of processes with
different sizes as shown in table1, table2 and table3.
Table1. Set1 processes and their sizes
S/N PROCESS SIZE (K)
1 P1 212.
2 P2 313.
3 P3 100.
4 P4 200.
5 P5 412.
Table2. Set2 processes and their sizes
S/N PROCESS SIZE (K)
1 P1 313
2 P2 101
3 P3 221
4 P4 234
5 P5 401
Table3. Set3 processes and their sizes
S/N PROCESS SIZE (K)
1 P1 111
2 P2 213
3 P3 314
4 P4 100
5 P5 222
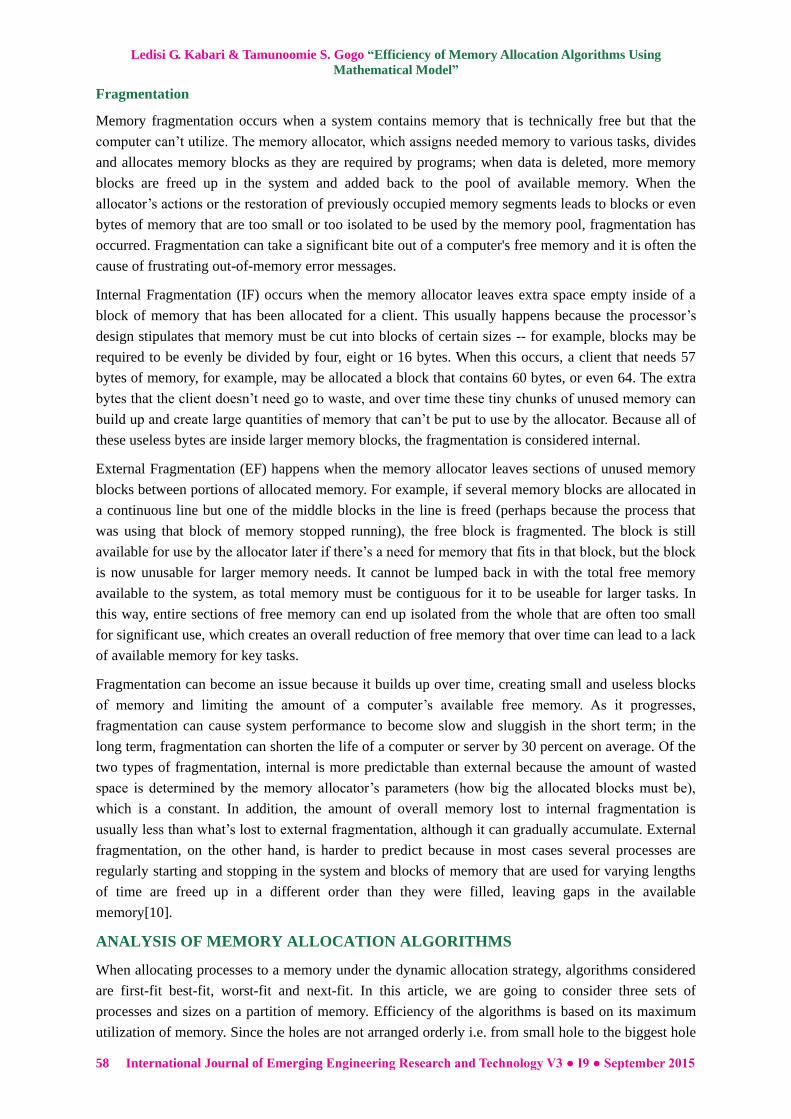
The memory is divided into five segments as given in table4, having a total memory size of 1600 KB.
The operating system (OS) takes 100k and the processes take 1500K. This is shown as memory
partition diagram given in figure1.
Figure1. Memory Partition Diagram
Ledisi G. Kabari & Tamunoomie S. Gogo “Efficiency of Memory Allocation Algorithms Using
Mathematical Model”
60 International Journal of Emerging Engineering Research and Technology V3 ● I9 ● September 2015
Table4. Memory partition
S/N Holes (K)
1 200
2 100
3 400
4 300
5 500
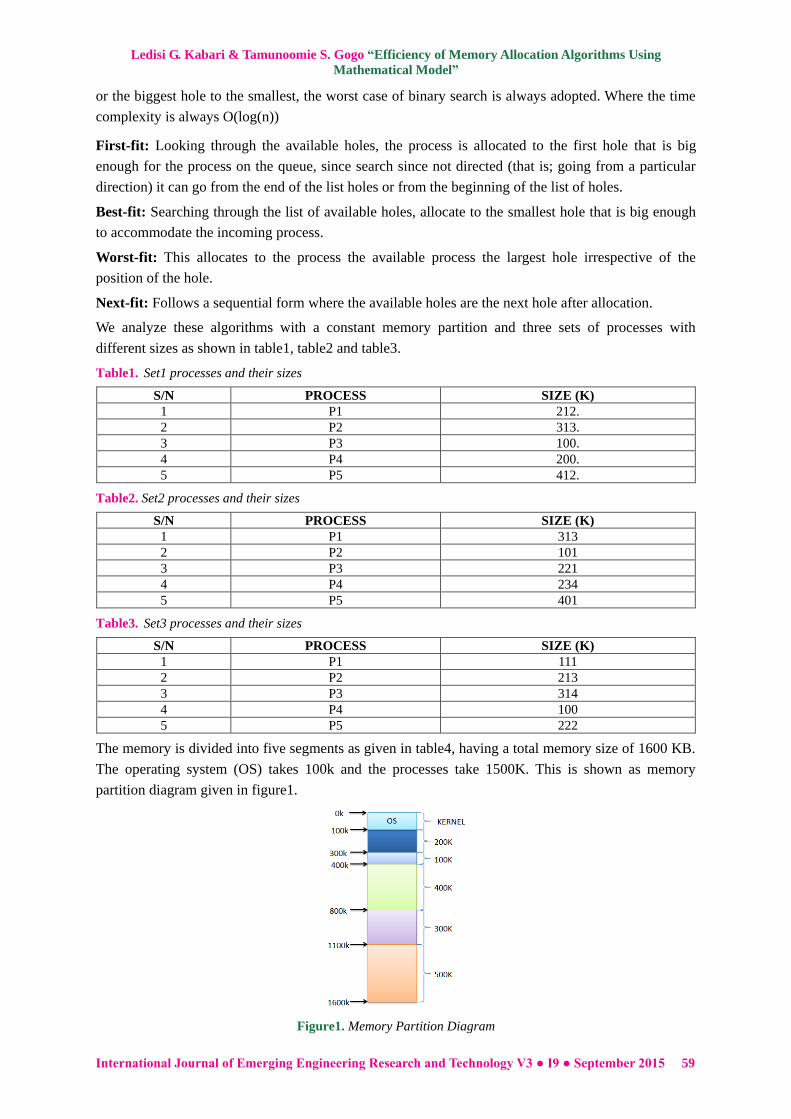
First fit Analysis
First Fit Analysis with Table1. Using table1data set, First fit algorithm will search the memory holes
(blocks) from the upper level of the memory. 200 K 100K 400K 300K 500K. First
take Process P1 having 212K. First hole < P1, Second hole < P1, Third hole >P1: Allocate P1 to
third hole. P1 (212)K hole (400)K i.e. P1 with size 212K goes into hole 400K, IF = (400 – 212)
K = 188K( not used).
Next, take process P2 with size 313K, First hole < P2, Second hole < P2, Third hole < P2, Fourth hole
>P2: Allocate P2 to fourth hole. Put P2 500K i.e. P2 with size 313 goes into hole 500K., IF = (500-
313)K, = 187K(not used). Then take process P3with size 100K, First hole > P3 Allocate. Put P3
200K: Put P3 with size 100K into first hole with size 200K. IF = (200-100)K = 100K.
Next take process P4 with size 200K, P4 goes into hole 200K. IF = (300-200)K, IF= 100K.
Lastly, take process P5: P5 > IF1, P5 > EF2, P5 > IF3, P5 > IF4, P5 > IF5. Hence, cannot be allocated.
Resulting allocation showing Internal Fragmentation (IF), External Fragmentation (EF) and partition
not used are shown in table5.
Table5. First fit IF and EF for Set1 processes and sizes
Process Hole(IF) Unused Partition(EF) Size
1 188K 2 100K
2 187K
3 100K
4 100K
Total 575K 100K
Total allocated memory = (212 + 313 + 100 + 200)K = 625K. Memory not utilized = 1500K – 825K
= 575K. Percentage of memory utilization = 100
1500
825
% = 55% utilization. Percentage Internal
Fragmentation = = 38.33%, IF = 38.33%. Percentage External Fragmentation (EF)
.
Pictorial illustration of first fit memory allocation from set1 processes and sizes is shown in figure2.
Figure2. First fit Memory Allocation with Table1
Ledisi G. Kabari & Tamunoomie S. Gogo “Efficiency of Memory Allocation Algorithms Using
Mathematical Model”
International Journal of Emerging Engineering Research and Technology V3 ● I9 ● September 2015 61
First Fit Analysis with Table2. Taking process P1 with size 313K (P1 = 313K), First hole < P1,
Second hole < P1, Third hole > P1, allocate P1 to third hole with size 400K. IF = (400 - 313) K =
87K.. Taking process P2 with size 101K (P2 = 101K), First hole > P2, allocate P2 to first hole with
size 200K (P2 (101) K hole (200) K). IF = (200 - 101) K = 99K
Taking process P3 with size 221K (P3 = 221K), First hole (IF of 99K) < P3, Second hole (of size
100K) < P3, Third hole (IF of 87K) < P3, Fourth hole (of size 100K) > P3, allocate P3 to fourth hole
(Put P3 hole (300) K). IF = (300 – 221) K = 79K.
Taking process P4 with size 234K (P4 = 234K), First hole (IF of 99K) < P4, Second hole (of size
100K) < P4, Third hole (IF of 87K) < P4, fourth hole (IF of 79K) < P4, allocate P4 last hole of size
500K(Put P4 500K). IF = (500 – 234)K = 266K.
Taking process P5 with size 401K, First hole (IF of 99K) < P5, Second hole (of size 100K) < P5,
Third hole (IF of 87K) < P5, fourth hole (IF of 79K) < P5. P5 cannot be allocated.
Resulting allocation showing Internal Fragmentation (IF) and External Fragmentation (EF) are shown
in table6.
Table6. First Fit IF and EF for Table2 processes and sizes
Process Hole(IF) Unused Partition(EF) Size
1 87K 2 100K
2 99K
3 79K
4 226K
Total 531K 100K
Total allocated (memory used) = (313 + 101 + 221 + 234)K = 869K. Percentage of memory utilization
= = 57.93% utilization. IF = = 35.4%, EF = = 6.67%.
First Fit Analysis with Table3. Taking process P1 with size 111K (P1 = 111K), First hole > P1,
allocate P1 to first hole with size 200K (P1 (111) K hole (200) K). IF = (200 -111) K = 89K.
Taking process P2 with size 213K (P2 = 213K), first hole (IF of size 89K) < P2, Second hole < P2,
Third hole > P2, allocate P2 to third hole with size 400K (Put P2 (213) K hole (400)K). IF = (400 -
213) K = 187K.
Taking process P3 with size 314K (P3= 314K), First hole (IF of size 89) < P3, Second hole < P3,
Third hole(IF of size 187K) < P3, Fourth hole < P3, Fifth hole > P3, allocate P3 to fifth hole of
size 500K(Put P3 hole (500)K) IF = (500 – 314)K = 186K.
Taking process P4 with size 100K(P4 = 100K), First hole(IF of size 89K) < P4, Second hole = P4,
allocate P4 to second hole of size 100K(Put P4 hole 100K. IF = (100 – 100)K = 0K.
Taking process P5with size 222K(P5 = 222K), First hole < P5, Second hole < P5, Third hole > P5,
allocate P5 to hole 300K(Put P4 300K). IF = (300 – 222)K = 78K.
Ledisi G. Kabari & Tamunoomie S. Gogo “Efficiency of Memory Allocation Algorithms Using
Mathematical Model”
62 International Journal of Emerging Engineering Research and Technology V3 ● I9 ● September 2015
Resulting allocation showing Internal Fragmentation (IF) and External Fragmentation (EF) are shown
in table7.
Table7. First Fit IF and EF for Set3 processes and sizes
Process Hole(IF) Unused Partition(EF) Size
1 89K
2 187K
3 186K
4 0K
5 78K
Total 540K
Total allocated = (111 + 213 + 314 + 100 + 222)K = 960K. Percentage of memory utilization =
= 64.00% utilization. IF = 36.00%, EF = = 0%
Best Fit Analysis
Best Fit Analysis with Table1. Allocate to the smallest hole large enough to accommodate the
process. This states that the allocator looks through the available hole with the size of the process,
scan through and allocate the process a hole that is smallest among the available holes. Size of process
= Sp(must be less than or equal to the size of available hole), Size of hole = Sh(must be greater than or
equal to the size of process) and List of holes = Lh(List of available holes in memory is to be
optimized).
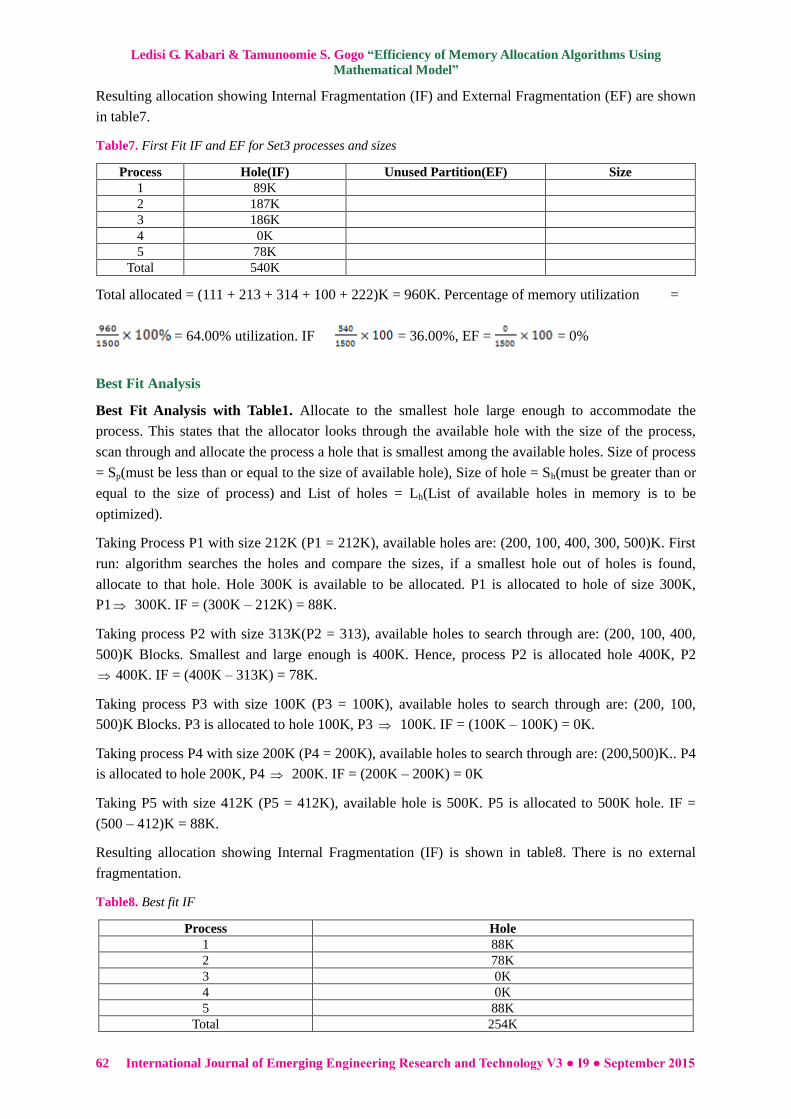
Taking Process P1 with size 212K (P1 = 212K), available holes are: (200, 100, 400, 300, 500)K. First
run: algorithm searches the holes and compare the sizes, if a smallest hole out of holes is found,
allocate to that hole. Hole 300K is available to be allocated. P1 is allocated to hole of size 300K,
P1 300K. IF = (300K – 212K) = 88K.
Taking process P2 with size 313K(P2 = 313), available holes to search through are: (200, 100, 400,
500)K Blocks. Smallest and large enough is 400K. Hence, process P2 is allocated hole 400K, P2
400K. IF = (400K – 313K) = 78K.
Taking process P3 with size 100K (P3 = 100K), available holes to search through are: (200, 100,
500)K Blocks. P3 is allocated to hole 100K, P3 100K. IF = (100K – 100K) = 0K.
Taking process P4 with size 200K (P4 = 200K), available holes to search through are: (200,500)K.. P4
is allocated to hole 200K, P4 200K. IF = (200K – 200K) = 0K
Taking P5 with size 412K (P5 = 412K), available hole is 500K. P5 is allocated to 500K hole. IF =
(500 – 412)K = 88K.
Resulting allocation showing Internal Fragmentation (IF) is shown in table8. There is no external
fragmentation.
Table8. Best fit IF
Process Hole
1 88K
2 78K
3 0K
4 0K
5 88K
Total 254K
Ledisi G. Kabari & Tamunoomie S. Gogo “Efficiency of Memory Allocation Algorithms Using
Mathematical Model”
International Journal of Emerging Engineering Research and Technology V3 ● I9 ● September 2015 63
TIF = Total IF = (IF1 + IF2+ IF3+ IF4+ IF5)K = 0K + 0K + 78K + 88K + 88K = 263K.
Total allocated = (100 + 212 + 200 + 313+412)K. Percentage utilization =
100
1500
1237% =
82.47%. Percentage IF =
100
1500
263
= 17.53%. EF = 0K, %EF = 0%.
Pictorial representation of Best fit memory allocation with table1 is as shown in figure3.
Figure3. Best-fit memory allocation with table1
Best Fit Analysis with Table2. Taking process P1 with size 313K(P1 = 313K), operating system
searches through: (200, 100, 400, 300,500)K. 400K is available to allocate, P1⇒ 400K. IF = 400K –
313K = 87K
Taking process P2 with size 101K(P2= 101K), Search through (200, 100, 300, 500)K Blocks, smallest
and large enough is 200K, P2 200K, IF = 200K – 101K = 99K. Taking Process P3 with size
221K(P3 = 221K), search through (100, 300, 500)K Block, P3 300K. IF = (300-221)K = 79K.
Taking Process P4 with size 234K(P4 = 234K), search through (100, 500)K, P4 500K, IF = (500 –
234K) = 266K. Taking Process P5 with size 401K(P5 = 401K), P5 > (IF1, IF2, IF3, IF4, EF3).
TIF = Total IF = (IF1 + IF2 +IF3 + IF4 )K = 87K + 99K + 79K + 266K = 531K. Total allocated = (313 +
101 + 221 + 234)K = 869K
Percentage utilization = = 57.93%. Percentage IF = = 35.40%. EF =
100K = , EF= 6.66%.
Best Fit Analysis with Table3. Taking process P1 with size 111K(P1 = 111K), search through (200,
100, 400, 300,500)K, 200K is available to be allocated, P1⇒ 200K. IF = 200K – 111K = 89K. Taking
process P2 with size 213K(P2 = 213K), search through (100, 400, 300, 500)K Blocks, smallest and
Ledisi G. Kabari & Tamunoomie S. Gogo “Efficiency of Memory Allocation Algorithms Using
Mathematical Model”
64 International Journal of Emerging Engineering Research and Technology V3 ● I9 ● September 2015
large enough is 300K, P2 300K. IF = 300K – 213K = 87K. Taking process P3 with size 314K( P3 =
314K), search through (100, 400, 500)K Block, P3 400K, IF = (400 - 314)K = 86K. Taking process
P4 with size 100K(P4 = 100K), search through (100, 500)K, P4 100K. IF = (100 – 100K) = 0K.
Taking process P5 with size 222K(P5 = 222K), only 500K available, P5 500K. IF = (500 – 222)K
= 278K. Total IF = TIF = (IF1 + IF2 +IF3 + IF4 + IF5)K = 89k + 87K + 86K + 0K + 278K = 631K. Total
allocated = (111 +213 + 314 + 100 + 222)K. Percentage utilization = =64%. Percentage IF
= = 36% . EF = 0K, %EF= 0%.
Worst-fit Analysis
Worst Fit Analysis with Table1
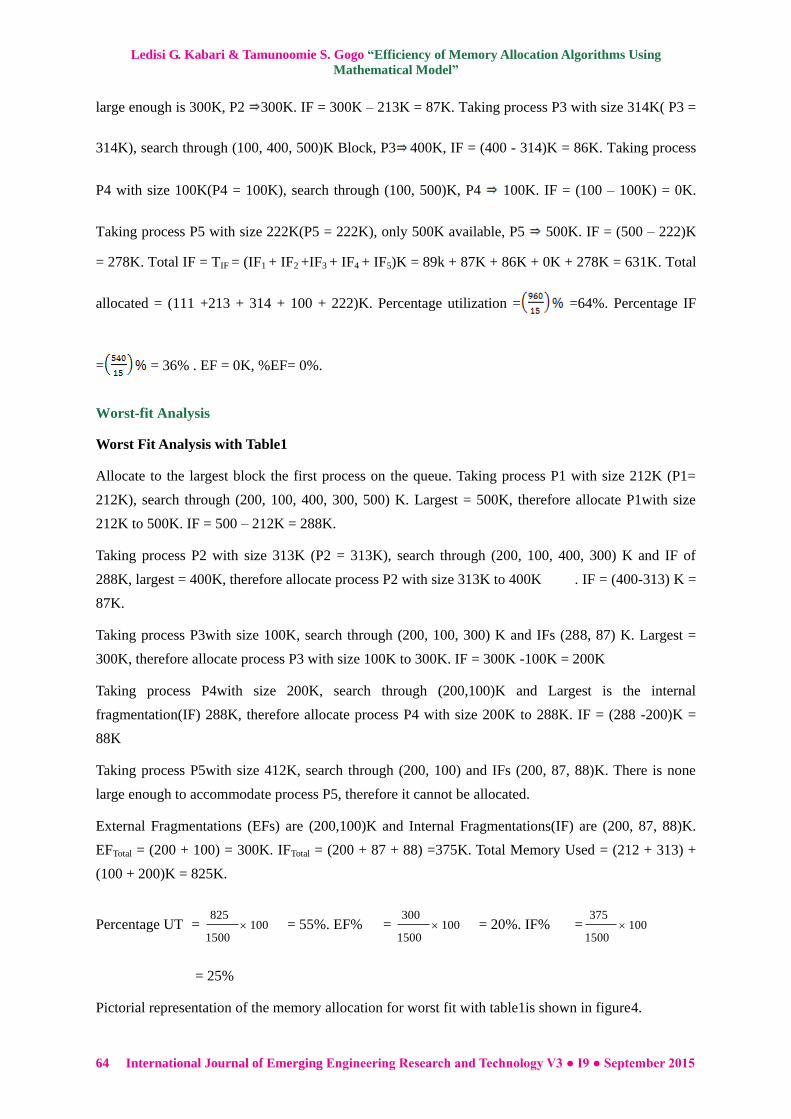
Allocate to the largest block the first process on the queue. Taking process P1 with size 212K (P1=
212K), search through (200, 100, 400, 300, 500) K. Largest = 500K, therefore allocate P1with size
212K to 500K. IF = 500 – 212K = 288K.
Taking process P2 with size 313K (P2 = 313K), search through (200, 100, 400, 300) K and IF of
288K, largest = 400K, therefore allocate process P2 with size 313K to 400K . IF = (400-313) K =
87K.
Taking process P3with size 100K, search through (200, 100, 300) K and IFs (288, 87) K. Largest =
300K, therefore allocate process P3 with size 100K to 300K. IF = 300K -100K = 200K
Taking process P4with size 200K, search through (200,100)K and Largest is the internal
fragmentation(IF) 288K, therefore allocate process P4 with size 200K to 288K. IF = (288 -200)K =
88K
Taking process P5with size 412K, search through (200, 100) and IFs (200, 87, 88)K. There is none
large enough to accommodate process P5, therefore it cannot be allocated.
External Fragmentations (EFs) are (200,100)K and Internal Fragmentations(IF) are (200, 87, 88)K.
EFTotal = (200 + 100) = 300K. IFTotal = (200 + 87 + 88) =375K. Total Memory Used = (212 + 313) +
(100 + 200)K = 825K.
Percentage UT = 1001500
825
= 55%. EF% = 100
1500
300 = 20%. IF% = 100
1500
375
= 25%
Pictorial representation of the memory allocation for worst fit with table1is shown in figure4.
Ledisi G. Kabari & Tamunoomie S. Gogo “Efficiency of Memory Allocation Algorithms Using
Mathematical Model”
International Journal of Emerging Engineering Research and Technology V3 ● I9 ● September 2015 65
Figure4. Worst-fit Allocation Algorithm
Worst Fit Analysis with Table2
Taking process P1 with size 313K (P1 = 313K), search through (200, 100, 400, 300, 500)K. Largest =
500K, allocate P1 with size 313K to 500K. IF = 500 – 313K = 187K.
Taking process P2 with size 102K (P2 = 102K), search through (200, 100, 400, 300) K, IF = 87K.
Largest = 400K. Allocate P2 with size 101K to 400K. IF = (400 – 101) K = 299K.
Taking P3with size 221K (P3 = 221K), search through (200, 100, 300)K and IF = (299, 187)K.
Largest = 300K. Allocate P3 with size 221K to 300K. IF = 300K - 221K = 79K.
Taking process P4 with size 234K, search through (200, 100) K and IFs = (299, 187, 79) K.
Largest IF= 299K. Allocate P4 with size 234K to 299K.IF = (299 – 234)K = 65K. EFs are (200,
100)K, IFs are (187,79, 65)K. EFTotal= (200 + 100) = 300K, IFTotal= (187, 79, 65) = 331K. Total used =
(313 + 101 + 221 + 234)K = 869K.
Percentage Utilization = = 57.93%, Percentage External Fragmentation(EF%) = =
20%. Percentage Internal Fragmentation (IF %) = ×100 = 22.06%.
Worst Fit Analysis with Table3
Taking process P1 with size 111K(P1 = 111K), search through (200, 100, 400, 300, 500)K. Largest =
500K. Allocate P1to 500K. IF = 500 – 111K = 389K.
Taking process P2 with size 213K, search through (200, 100, 400, 300)K and IF (389K). Largest is
400K. Allocate P2 to 213K(P2 00K. IF = (400 – 213)K = 187K.
Ledisi G. Kabari & Tamunoomie S. Gogo “Efficiency of Memory Allocation Algorithms Using
Mathematical Model”
66 International Journal of Emerging Engineering Research and Technology V3 ● I9 ● September 2015
Taking process P3with size 314K, search through (200, 100, 300)K and IF (389, 187)K. Largest is IF
of size 389K. Allocate P3 with size 314K to 389(P3 389K). IF = 389K - 314K = 75K
Taking process P4 with size 100K, search through (200, 100, 300)K and IF(187, 75)K. Largest =
300K. Allocate P4 with size 100K to 300K(P4 300K). IF = (300 – 100)K = 200K. EFs are(200,
100)K, Ifs are(200, 187, 75)K.
EFTotal= (200 + 100) = 300K. IFTotal= (200, 187, 75) = 331K. Total used = (111 + 213 + 314 + 100)K =
869K. Percentage Utilization = ×1 49.2%. EF% = ×100 = 20%. IF% = ×1 = 30.80%.
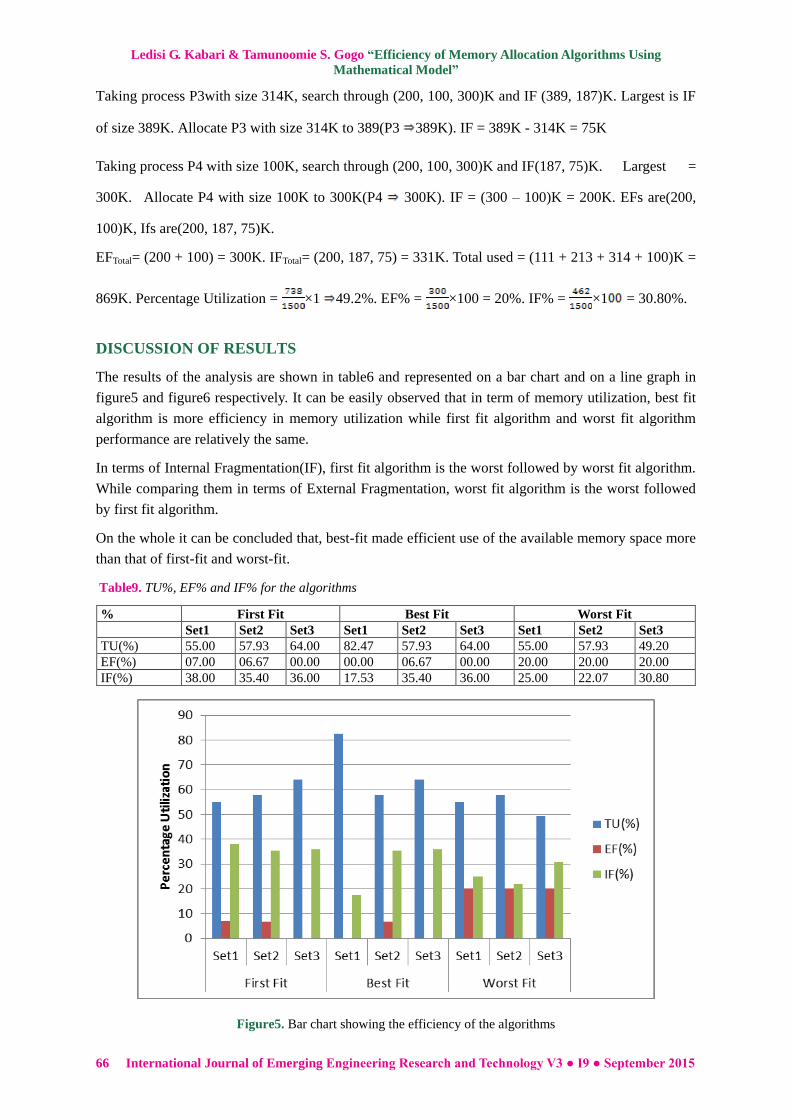
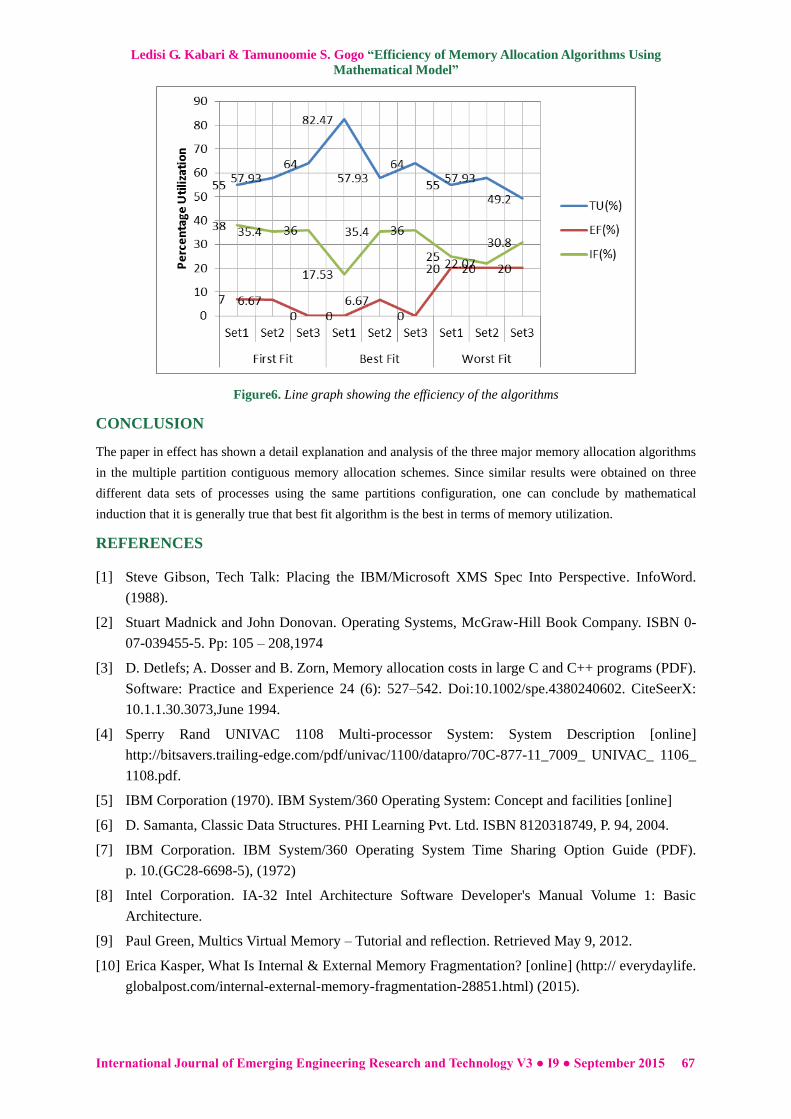
DISCUSSION OF RESULTS
The results of the analysis are shown in table6 and represented on a bar chart and on a line graph in
figure5 and figure6 respectively. It can be easily observed that in term of memory utilization, best fit
algorithm is more efficiency in memory utilization while first fit algorithm and worst fit algorithm
performance are relatively the same.
In terms of Internal Fragmentation(IF), first fit algorithm is the worst followed by worst fit algorithm.
While comparing them in terms of External Fragmentation, worst fit algorithm is the worst followed
by first fit algorithm.
On the whole it can be concluded that, best-fit made efficient use of the available memory space more
than that of first-fit and worst-fit.
Table9. TU%, EF% and IF% for the algorithms
% First Fit Best Fit Worst Fit
Set1 Set2 Set3 Set1 Set2 Set3 Set1 Set2 Set3
TU(%) 55.00 57.93 64.00 82.47 57.93 64.00 55.00 57.93 49.20
EF(%) 07.00 06.67 00.00 00.00 06.67 00.00 20.00 20.00 20.00
IF(%) 38.00 35.40 36.00 17.53 35.40 36.00 25.00 22.07 30.80
Figure5. Bar chart showing the efficiency of the algorithms
Ledisi G. Kabari & Tamunoomie S. Gogo “Efficiency of Memory Allocation Algorithms Using
Mathematical Model”
International Journal of Emerging Engineering Research and Technology V3 ● I9 ● September 2015 67
Figure6. Line graph showing the efficiency of the algorithms
CONCLUSION
The paper in effect has shown a detail explanation and analysis of the three major memory allocation algorithms
in the multiple partition contiguous memory allocation schemes. Since similar results were obtained on three
different data sets of processes using the same partitions configuration, one can conclude by mathematical
induction that it is generally true that best fit algorithm is the best in terms of memory utilization.
REFERENCES
[1] Steve Gibson, Tech Talk: Placing the IBM/Microsoft XMS Spec Into Perspective. InfoWord.
(1988).
[2] Stuart Madnick and John Donovan. Operating Systems, McGraw-Hill Book Company. ISBN 0-
07-039455-5. Pp: 105 – 208,1974
[3] D. Detlefs; A. Dosser and B. Zorn, Memory allocation costs in large C and C++ programs (PDF).
Software: Practice and Experience 24 (6): 527–542. Doi:10.1002/spe.4380240602. CiteSeerX:
10.1.1.30.3073,June 1994.
[4] Sperry Rand UNIVAC 1108 Multi-processor System: System Description [online]
http://bitsavers.trailing-edge.com/pdf/univac/1100/datapro/70C-877-11_7009_ UNIVAC_ 1106_
1108.pdf.
[5] IBM Corporation (1970). IBM System/360 Operating System: Concept and facilities [online]
[6] D. Samanta, Classic Data Structures. PHI Learning Pvt. Ltd. ISBN 8120318749, P. 94, 2004.
[7] IBM Corporation. IBM System/360 Operating System Time Sharing Option Guide (PDF).
p. 10.(GC28-6698-5), (1972)
[8] Intel Corporation. IA-32 Intel Architecture Software Developer's Manual Volume 1: Basic
Architecture.
[9] Paul Green, Multics Virtual Memory – Tutorial and reflection. Retrieved May 9, 2012.
[10] Erica Kasper, What Is Internal & External Memory Fragmentation? [online] (http:// everydaylife.
globalpost.com/internal-external-memory-fragmentation-28851.html) (2015).