Embed Size (px)
DESCRIPTION
As the largest search engine marketing firm, Efficient Frontier has access to tremendous amounts of search engine data. Join them for an overview of the most recent quarterly search engine performance report. Hear how the recession has affected consumer search trends and what we are likely to see in the future.
Citation preview
What’s around the corner? Trends in SEMTrends in SEM
Merinda Peppard
European Marketing Manager
Dr. Siddharth Shah
Director of Business Analytics
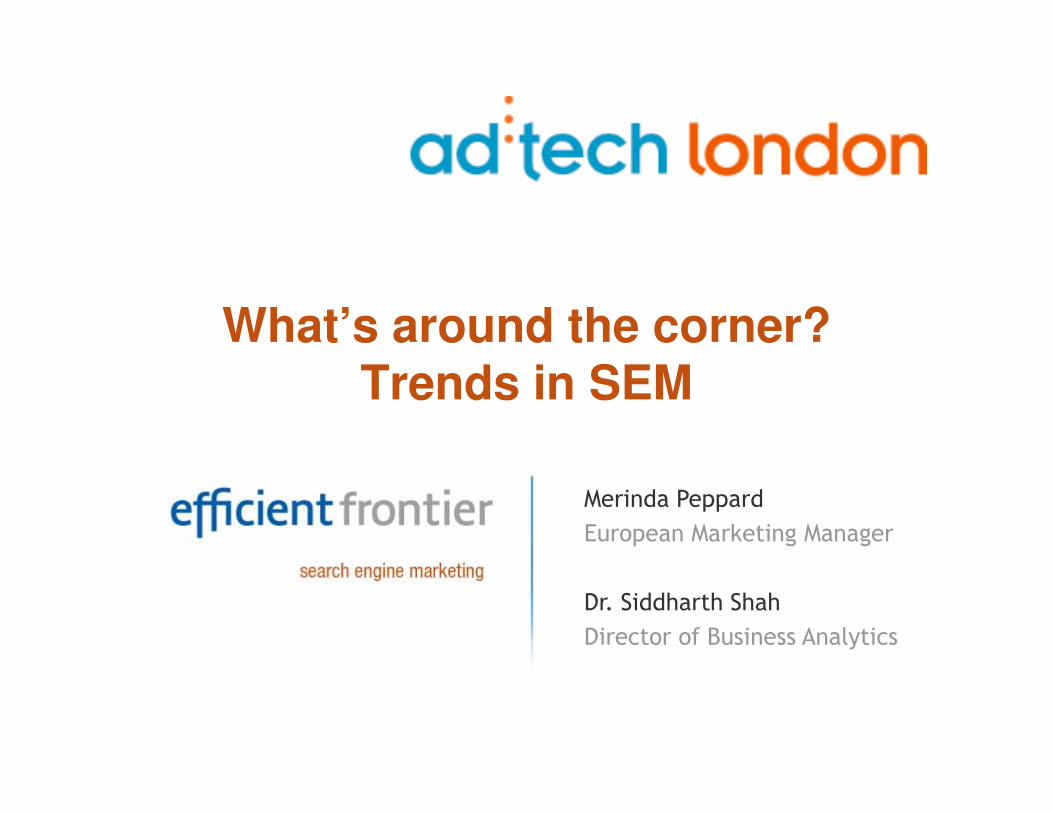
Global Leader in SEM
$750M+ annual spend managed
Largest Search Agency in the UK (spend)
180 employees worldwide
2
275 clients globally / 51 in Europe
40 million active keywords managed
Sunnyvale | NYC | London | Paris | Hamburg | India
Japan & Australia : Licensing Partners
Full Service or Technology Only
Today’s Agenda
• What’s new?
• How does online compare to other advertising?
• Taking a look at Search
• Efficient Frontier UK Search Report• Efficient Frontier UK Search Report
• Efficient Frontier U.S. Search Report
• What does it mean for the UK?
3

What’s New?
4
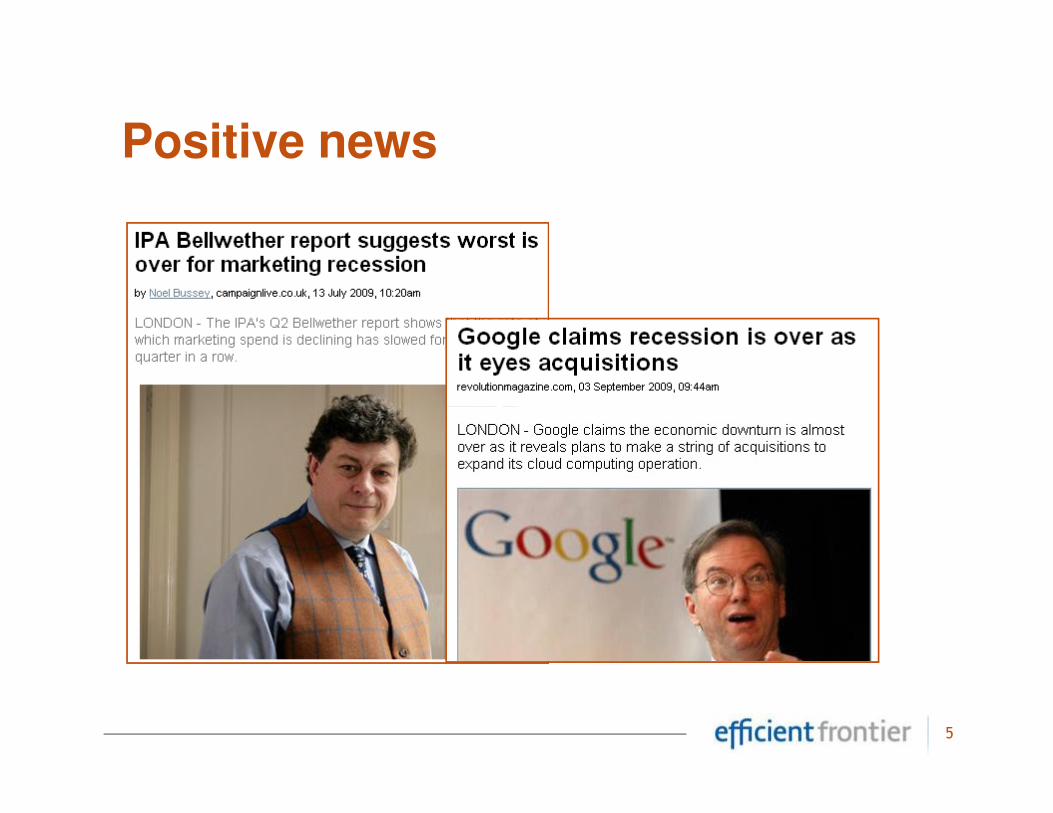
Positive news
5
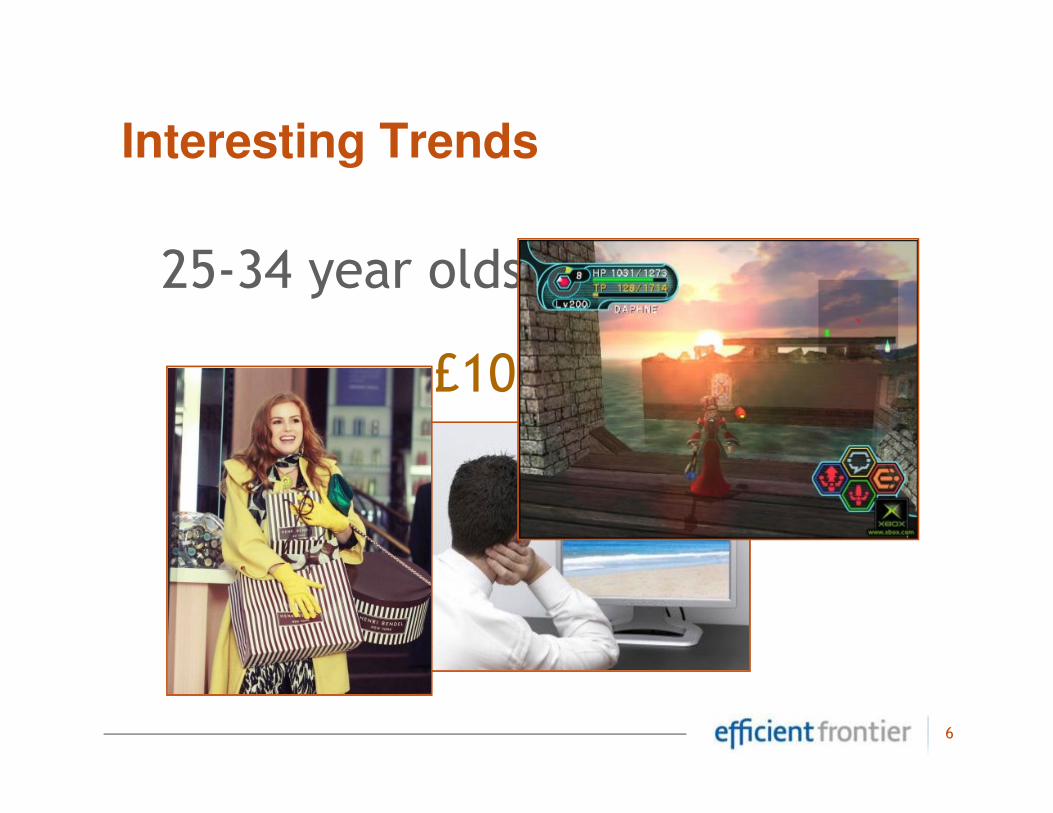
Interesting Trends
£10 more per visit
25-34 year olds
6
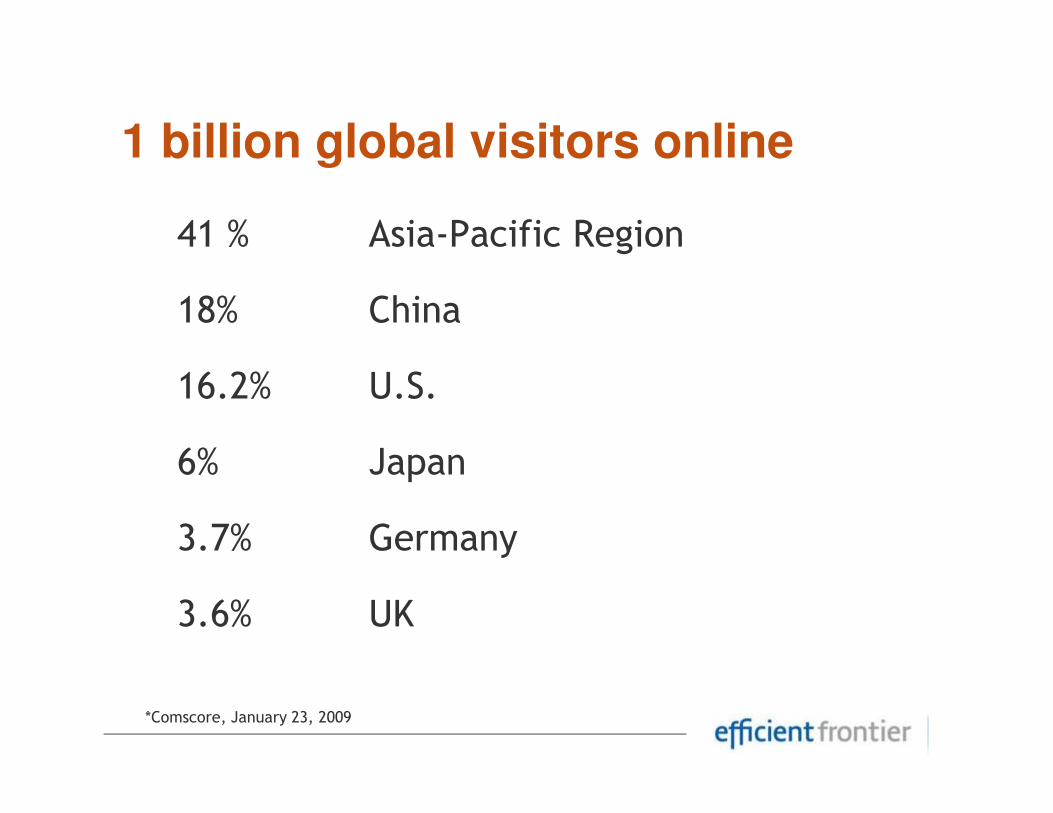
41 % Asia-Pacific Region
18% China
16.2% U.S.
1 billion global visitors online
16.2% U.S.
6% Japan
3.7% Germany
3.6% UK
Source: PricewaterhouseCoopers / Internet Advertising Bureau / WARC
*Comscore, January 23, 2009
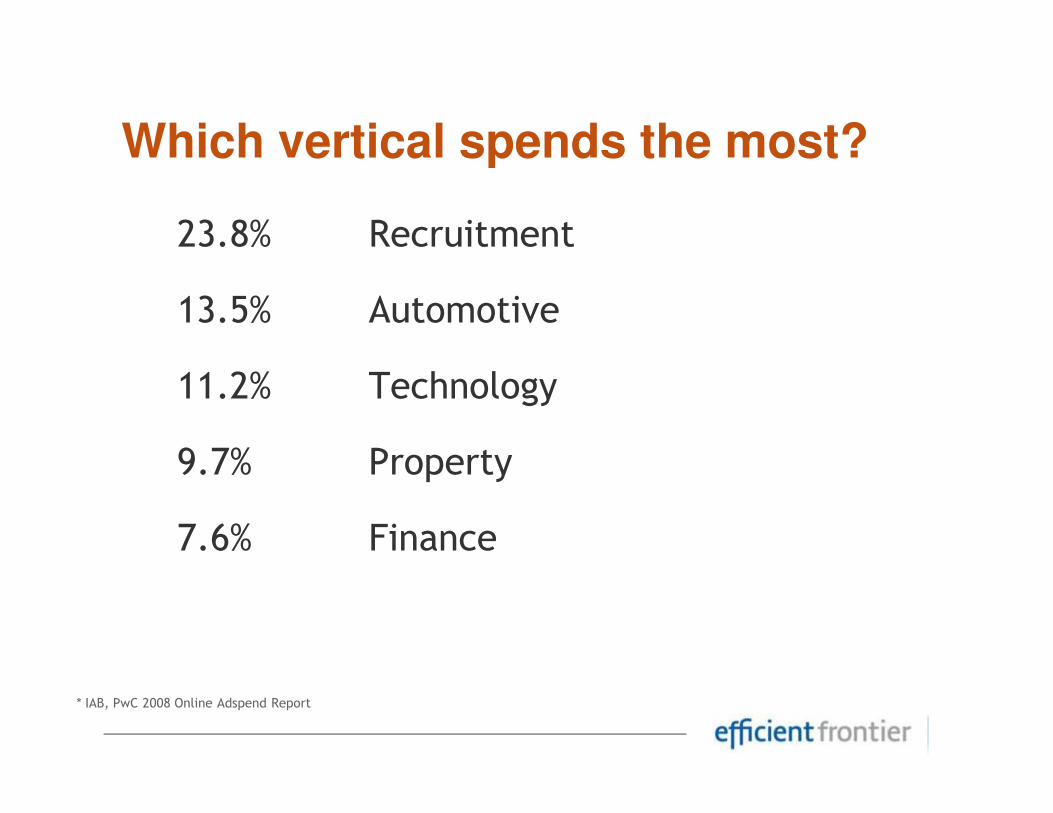
23.8% Recruitment
13.5% Automotive
11.2% Technology
Which vertical spends the most?
11.2% Technology
9.7% Property
7.6% Finance
Source: PricewaterhouseCoopers / Internet Advertising Bureau / WARC
* IAB, PwC 2008 Online Adspend Report
How does online compare to other
advertising?
9
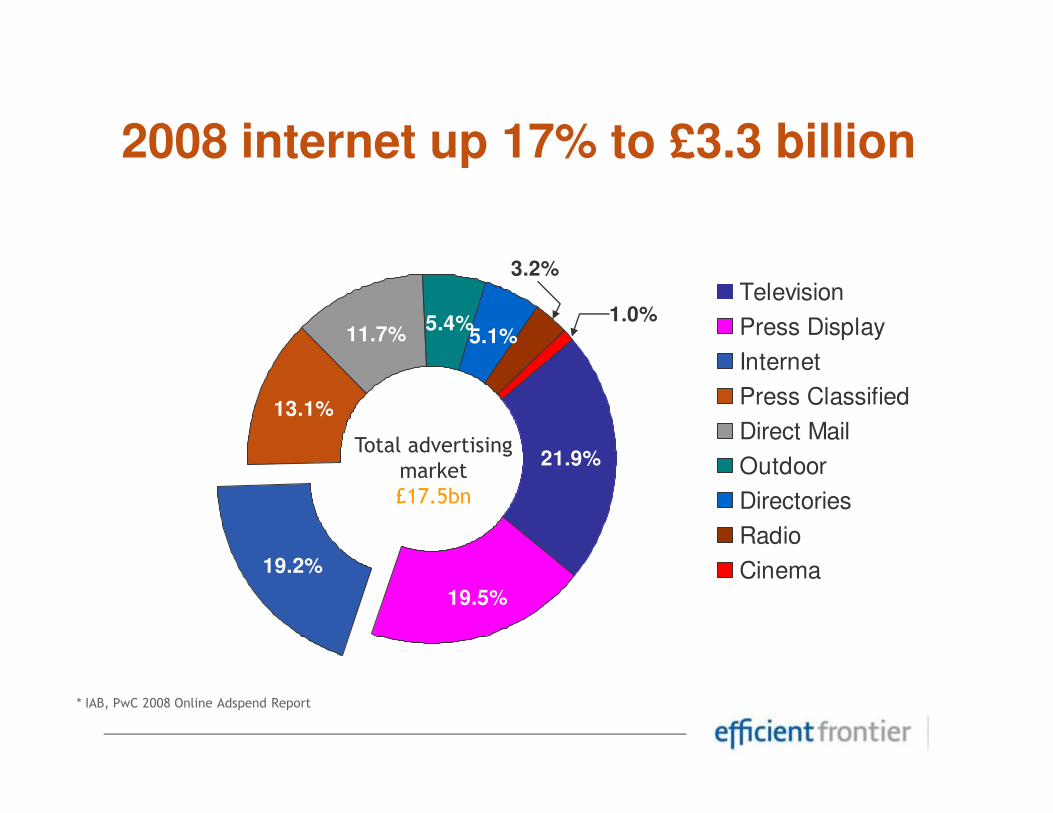
2008 internet up 17% to £3.3 billion
11.7% 5.1%
3.2%
1.0%5.4%
13.1%
Television
Press Display
Internet
Press Classified
Source: PricewaterhouseCoopers / Internet Advertising Bureau / WARC
* IAB, PwC 2008 Online Adspend Report
Total advertisingmarket£17.5bn
21.9%
19.2%
13.1%
19.5%
Press Classified
Direct Mail
Outdoor
Directories
Radio
Cinema
Taking a look at Search
11
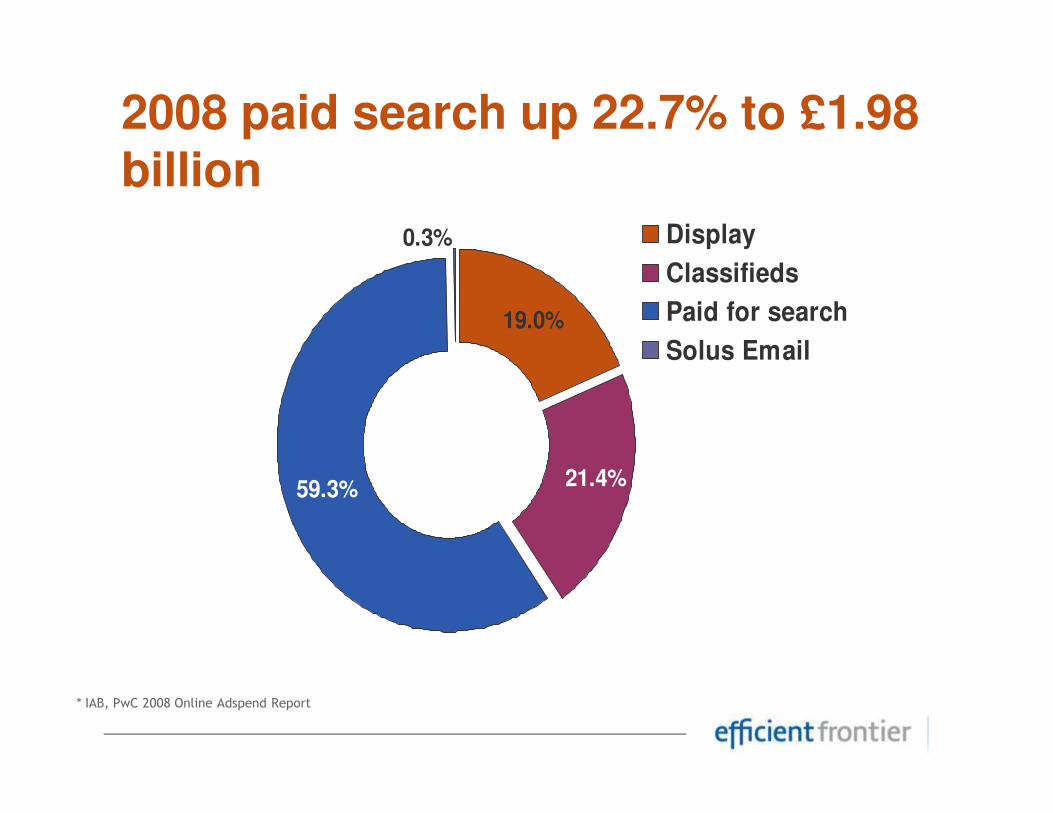
19.0%
0.3% Display
Classifieds
Paid for search
Solus Email
2008 paid search up 22.7% to £1.98 billion
59.3% 21.4%
Source: PricewaterhouseCoopers / Internet Advertising Bureau / WARC
* IAB, PwC 2008 Online Adspend Report
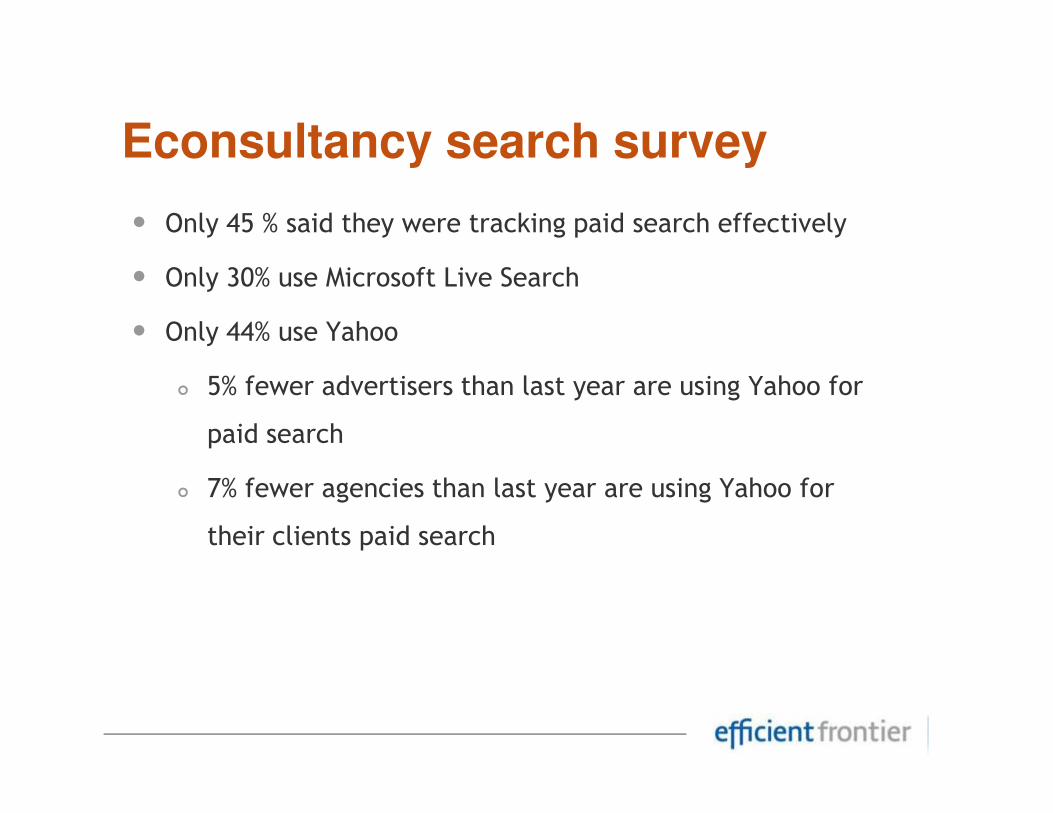
• Only 45 % said they were tracking paid search effectively
• Only 30% use Microsoft Live Search
• Only 44% use Yahoo
� 5% fewer advertisers than last year are using Yahoo for
Econsultancy search survey
paid search
� 7% fewer agencies than last year are using Yahoo for
their clients paid search
Efficient Frontier
UK Search Report
14
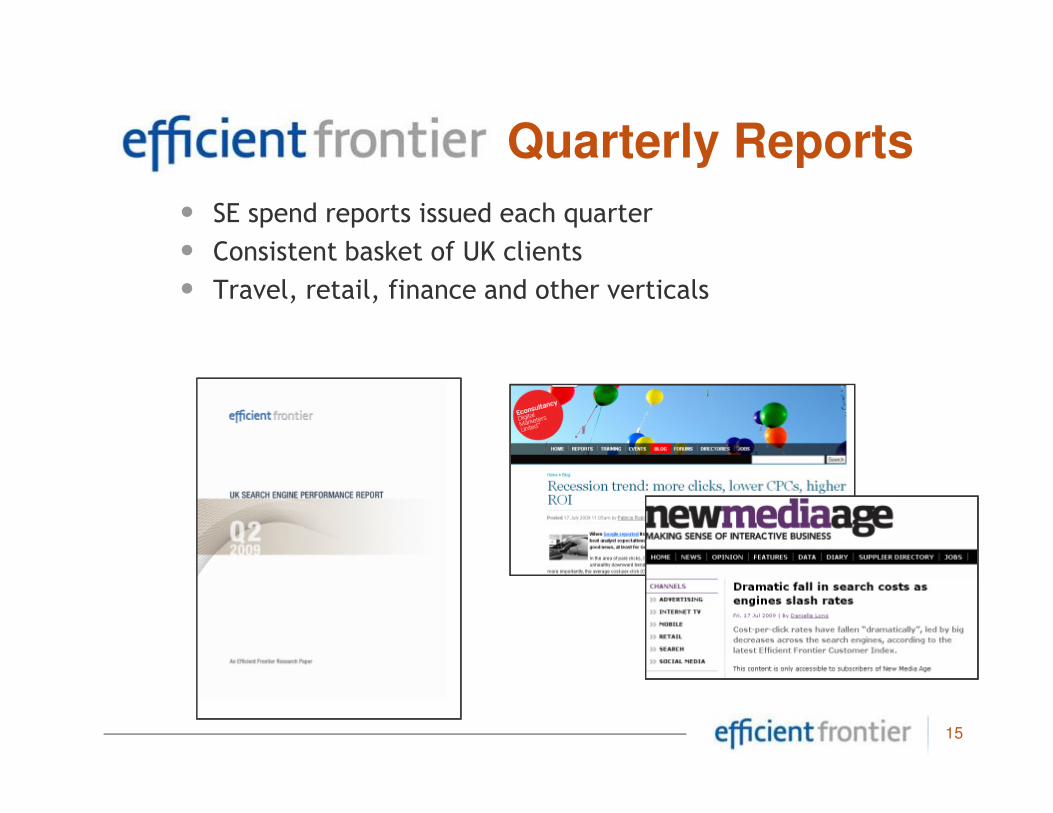
• SE spend reports issued each quarter
• Consistent basket of UK clients
• Travel, retail, finance and other verticals
Quarterly Reports
15
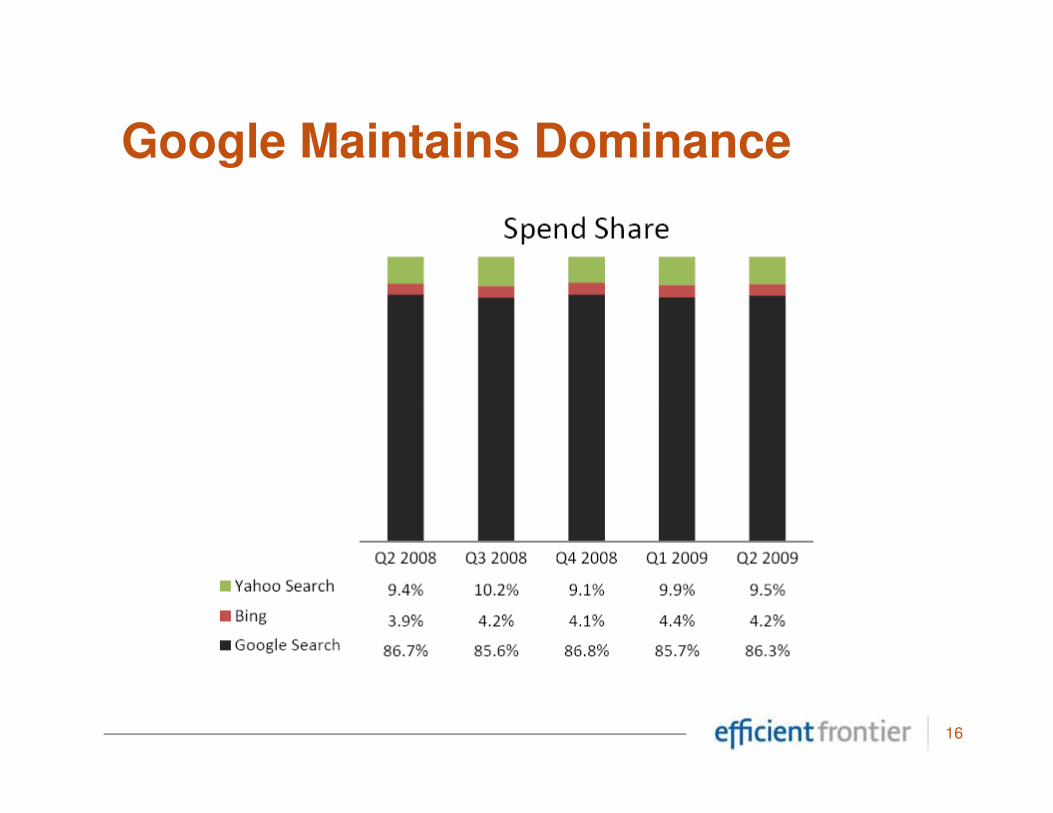
Google Maintains Dominance
16
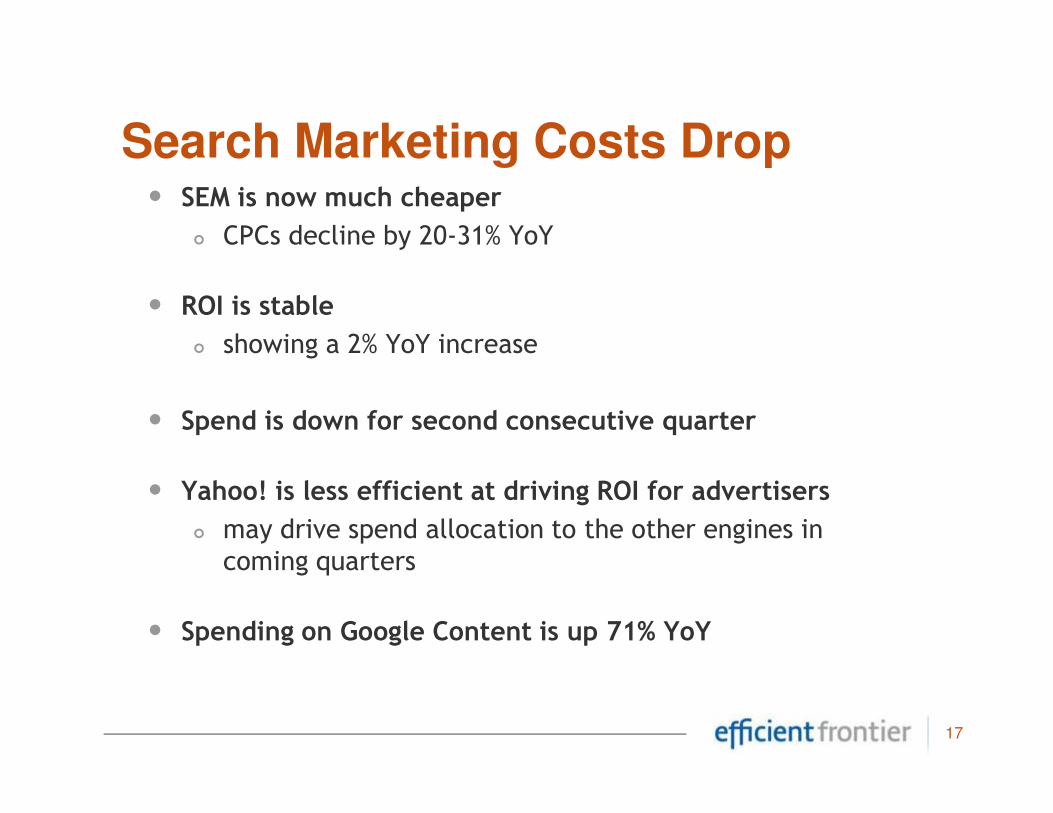
• SEM is now much cheaper
� CPCs decline by 20-31% YoY
• ROI is stable
� showing a 2% YoY increase
• Spend is down for second consecutive quarter
Search Marketing Costs Drop
• Spend is down for second consecutive quarter
• Yahoo! is less efficient at driving ROI for advertisers
� may drive spend allocation to the other engines in coming quarters
• Spending on Google Content is up 71% YoY
17
What does the future hold?
18
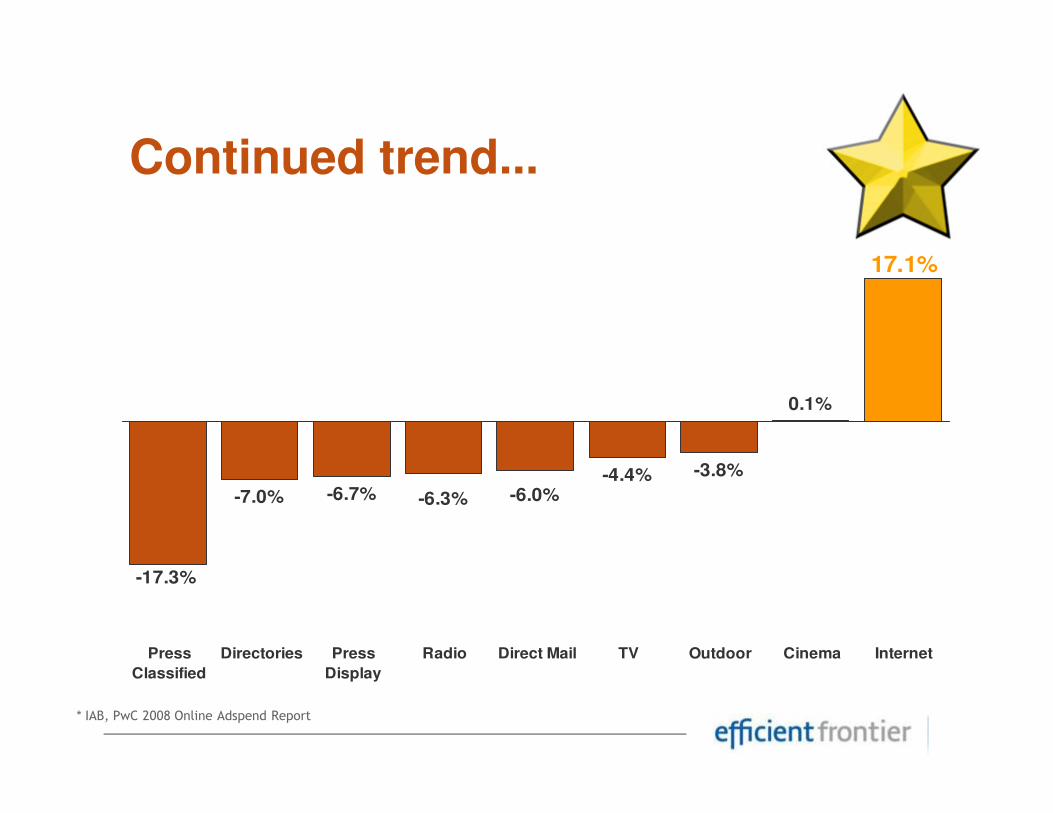
Continued trend...
0.1%
17.1%
-7.0%
-4.4% -3.8%
0.1%
-17.3%
-6.0%-6.3%-6.7%
Press
Classified
Directories Press
Display
Radio Direct Mail TV Outdoor Cinema Internet
* IAB, PwC 2008 Online Adspend Report
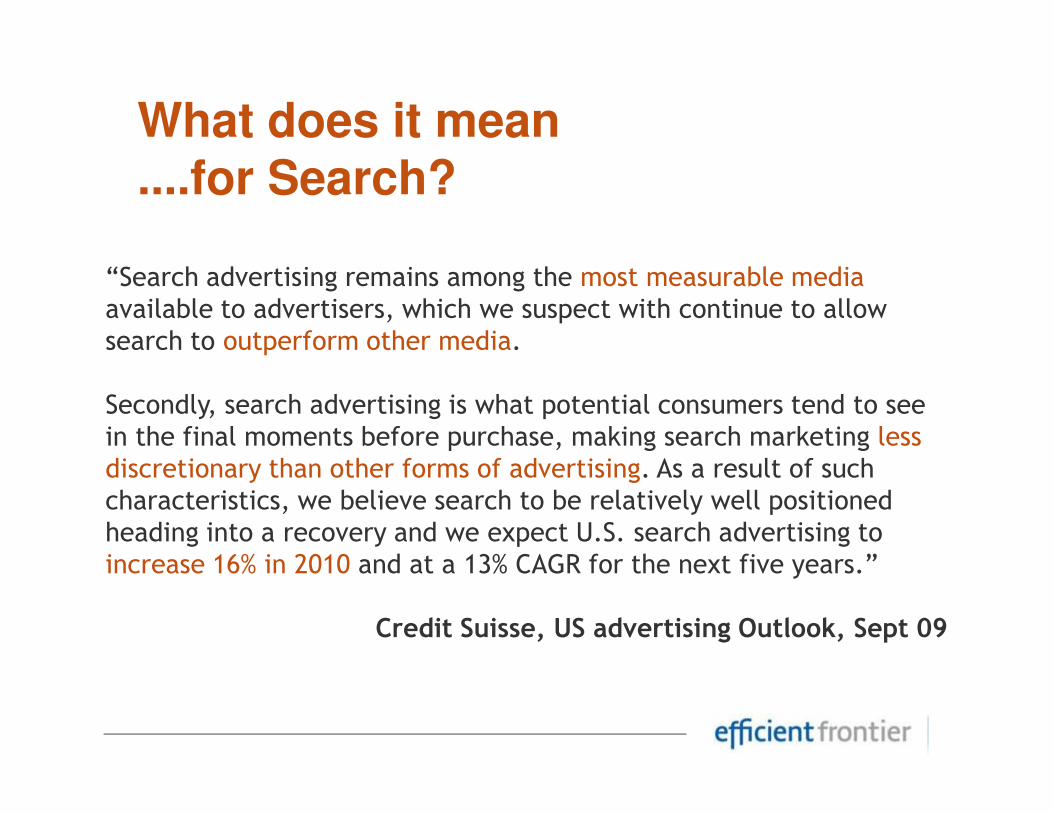
What does it mean....for Search?
“Search advertising remains among the most measurable media available to advertisers, which we suspect with continue to allow search to outperform other media.
Secondly, search advertising is what potential consumers tend to see Secondly, search advertising is what potential consumers tend to see in the final moments before purchase, making search marketing less discretionary than other forms of advertising. As a result of such characteristics, we believe search to be relatively well positioned heading into a recovery and we expect U.S. search advertising to increase 16% in 2010 and at a 13% CAGR for the next five years.”
Credit Suisse, US advertising Outlook, Sept 09
Efficient Frontier
U.S. Search Report
21
• Small shifts in spend trends QoQ
• Bing has increased its Market Share both by spend and clicks
• Increased ROI focus specially from small advertisers
• Travel is hurting
Insights from the US
• Automotive has seen slight recent improvement
• Finance has made a recovery
22
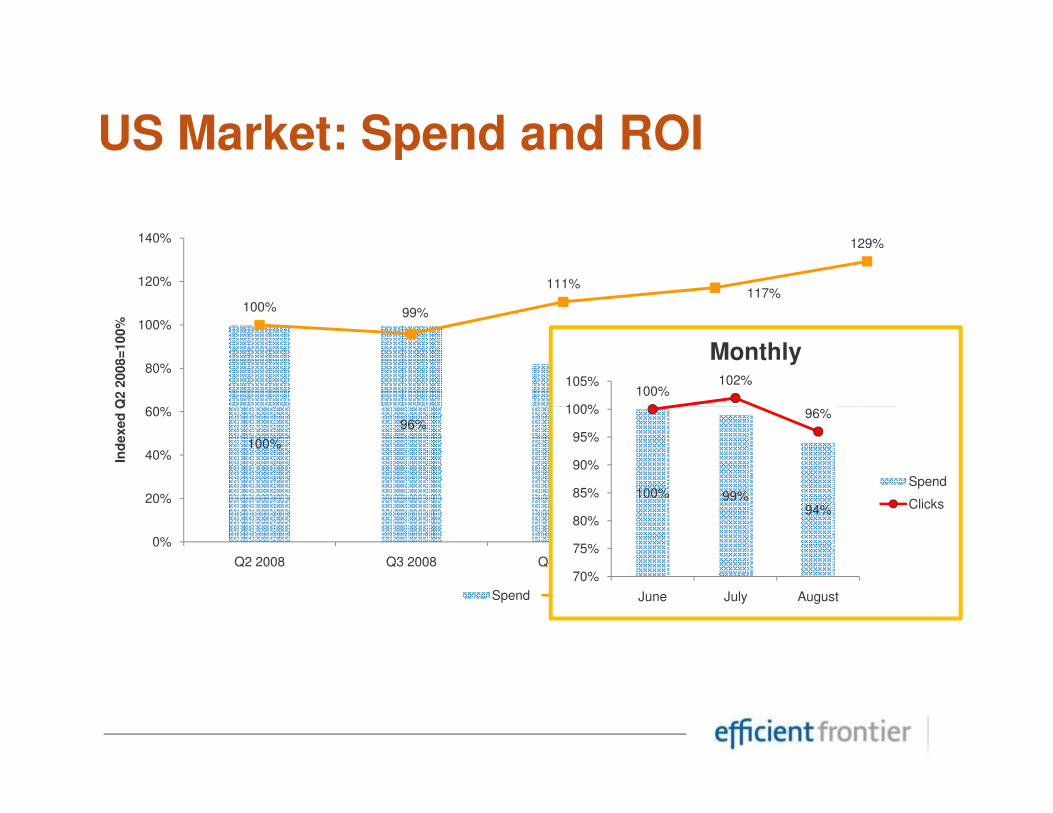
US Market: Spend and ROI
99%100%
111%117%
129%
60%
80%
100%
120%
140%
Q2 2
008=
100%
100%102%
96%100%
105%
Monthly
100%
82%
81%79%
96%
0%
20%
40%
60%
Q2 2008 Q3 2008 Q4 2008 Q1 2009 Q2 2009
Ind
exed
Q2
Spend ROI
100% 99%94%
96%
70%
75%
80%
85%
90%
95%
100%
June July August
Spend
Clicks
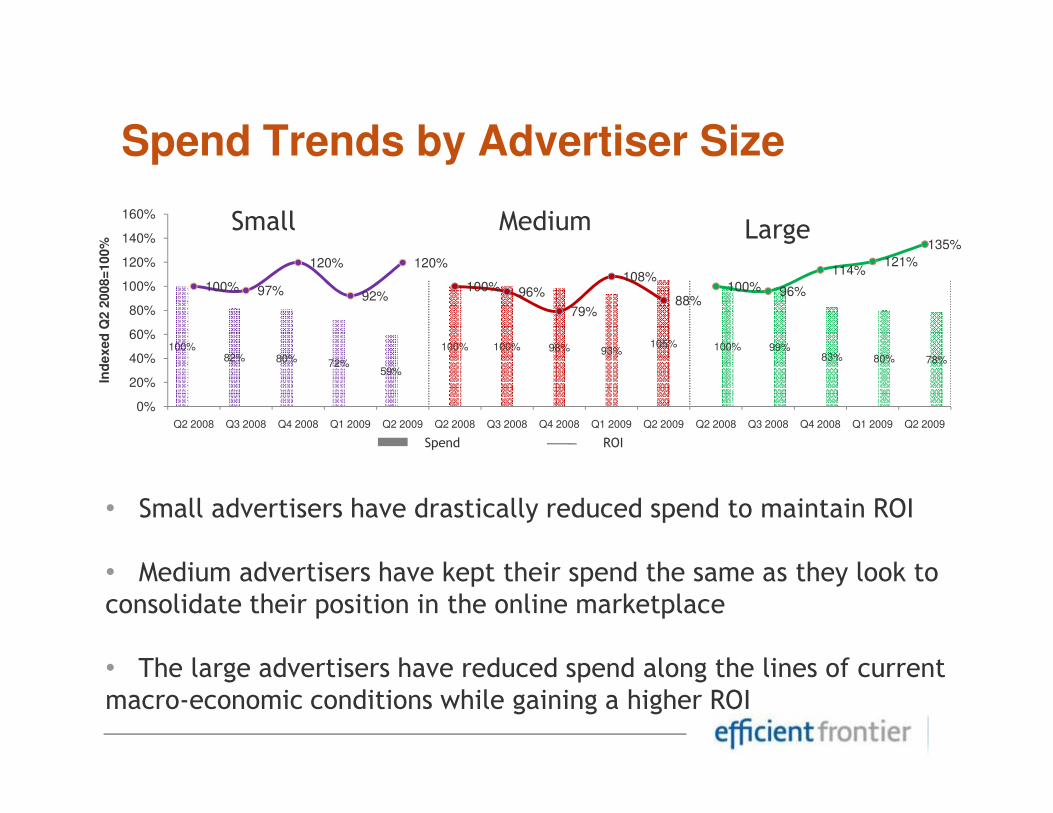
Spend Trends by Advertiser Size
100%82% 80% 72%
59%
100% 100% 98% 93%105% 100% 99%
83% 80% 78%
100% 97%
120%
92%
120%
100% 96%
79%
108%
88%100% 96%
114%121%
135%
0%
20%
40%
60%
80%
100%
120%
140%
160%
Ind
exed
Q2 2
008=
100%
Small Medium Large
• Small advertisers have drastically reduced spend to maintain ROI
• Medium advertisers have kept their spend the same as they look to consolidate their position in the online marketplace
• The large advertisers have reduced spend along the lines of current macro-economic conditions while gaining a higher ROI
0%
Q2 2008 Q3 2008 Q4 2008 Q1 2009 Q2 2009 Q2 2008 Q3 2008 Q4 2008 Q1 2009 Q2 2009 Q2 2008 Q3 2008 Q4 2008 Q1 2009 Q2 2009
Small Adv. Med Adv. Large Adv. Small ROI Med ROI Large ROISpend ROI
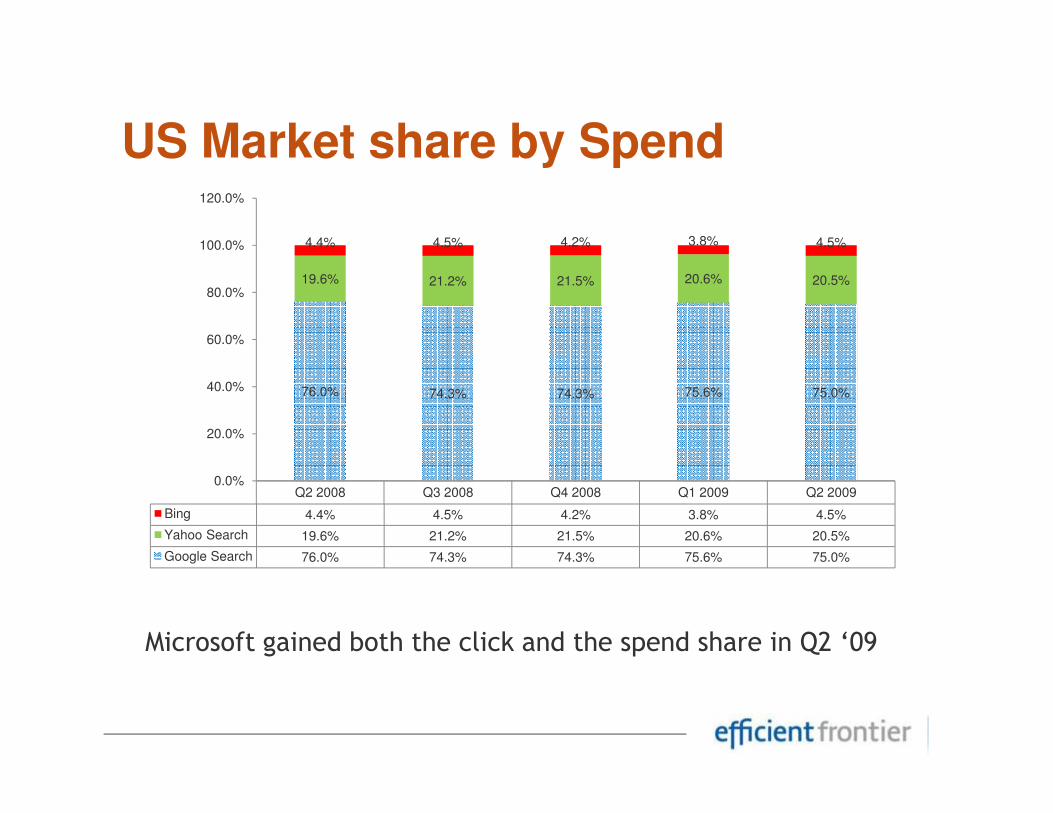
US Market share by Spend
76.0% 74.3% 74.3% 75.6% 75.0%
19.6% 21.2% 21.5% 20.6% 20.5%
4.4% 4.5% 4.2% 3.8% 4.5%
40.0%
60.0%
80.0%
100.0%
120.0%
Q2 2008 Q3 2008 Q4 2008 Q1 2009 Q2 2009
Bing 4.4% 4.5% 4.2% 3.8% 4.5%
Yahoo Search 19.6% 21.2% 21.5% 20.6% 20.5%
Google Search 76.0% 74.3% 74.3% 75.6% 75.0%
0.0%
20.0%
Microsoft gained both the click and the spend share in Q2 ‘09
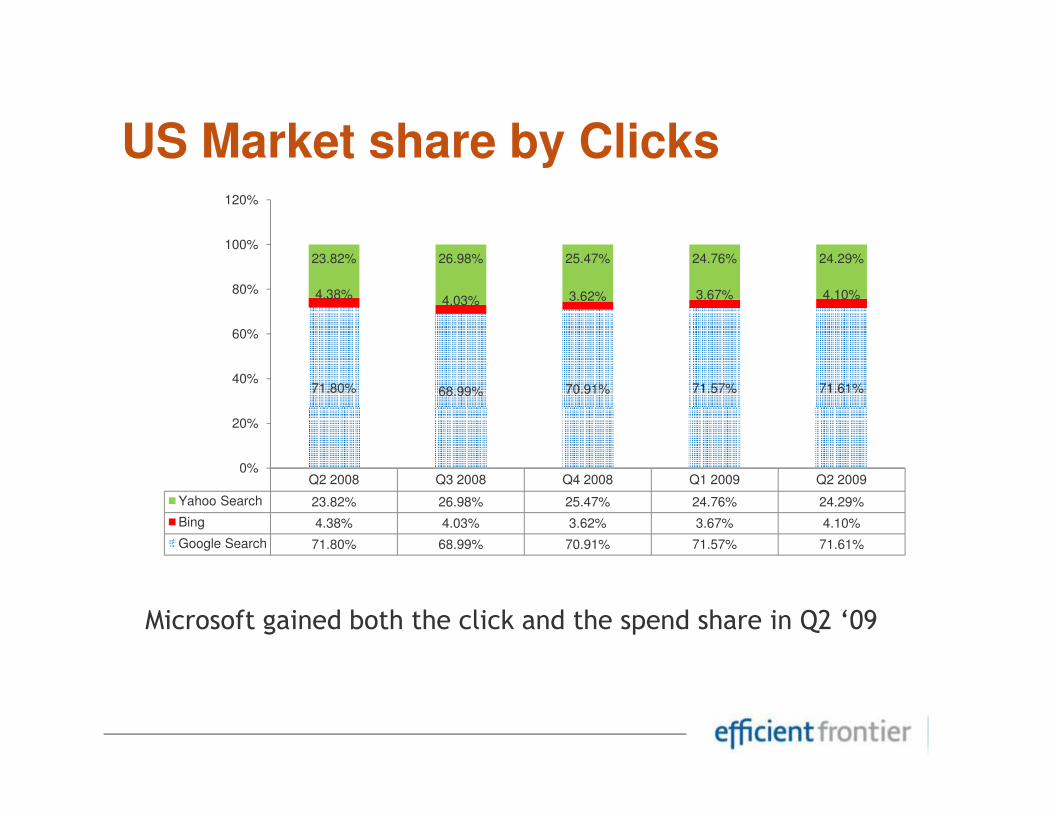
US Market share by Clicks
71.80% 68.99% 70.91% 71.57% 71.61%
4.38% 4.03% 3.62% 3.67% 4.10%
23.82% 26.98% 25.47% 24.76% 24.29%
40%
60%
80%
100%
120%
Q2 2008 Q3 2008 Q4 2008 Q1 2009 Q2 2009
Yahoo Search 23.82% 26.98% 25.47% 24.76% 24.29%
Bing 4.38% 4.03% 3.62% 3.67% 4.10%
Google Search 71.80% 68.99% 70.91% 71.57% 71.61%
0%
20%
Microsoft gained both the click and the spend share in Q2 ‘09
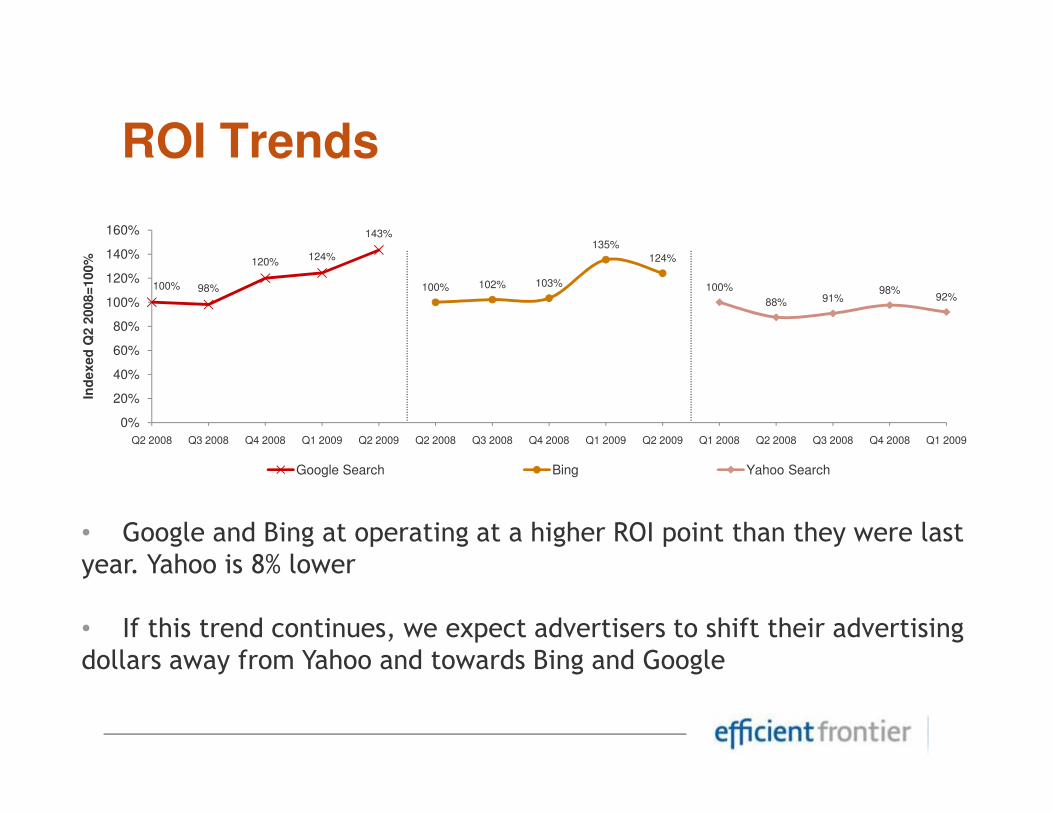
ROI Trends
100% 98%
120%124%
143%
100% 102% 103%
135%
124%
100%
88% 91%98%
92%
20%
40%
60%
80%
100%
120%
140%
160%
Ind
exed
Q2 2
008=
100%
0%
Q2 2008 Q3 2008 Q4 2008 Q1 2009 Q2 2009 Q2 2008 Q3 2008 Q4 2008 Q1 2009 Q2 2009 Q1 2008 Q2 2008 Q3 2008 Q4 2008 Q1 2009
Google Search Bing Yahoo Search
• Google and Bing at operating at a higher ROI point than they were last year. Yahoo is 8% lower
• If this trend continues, we expect advertisers to shift their advertising dollars away from Yahoo and towards Bing and Google
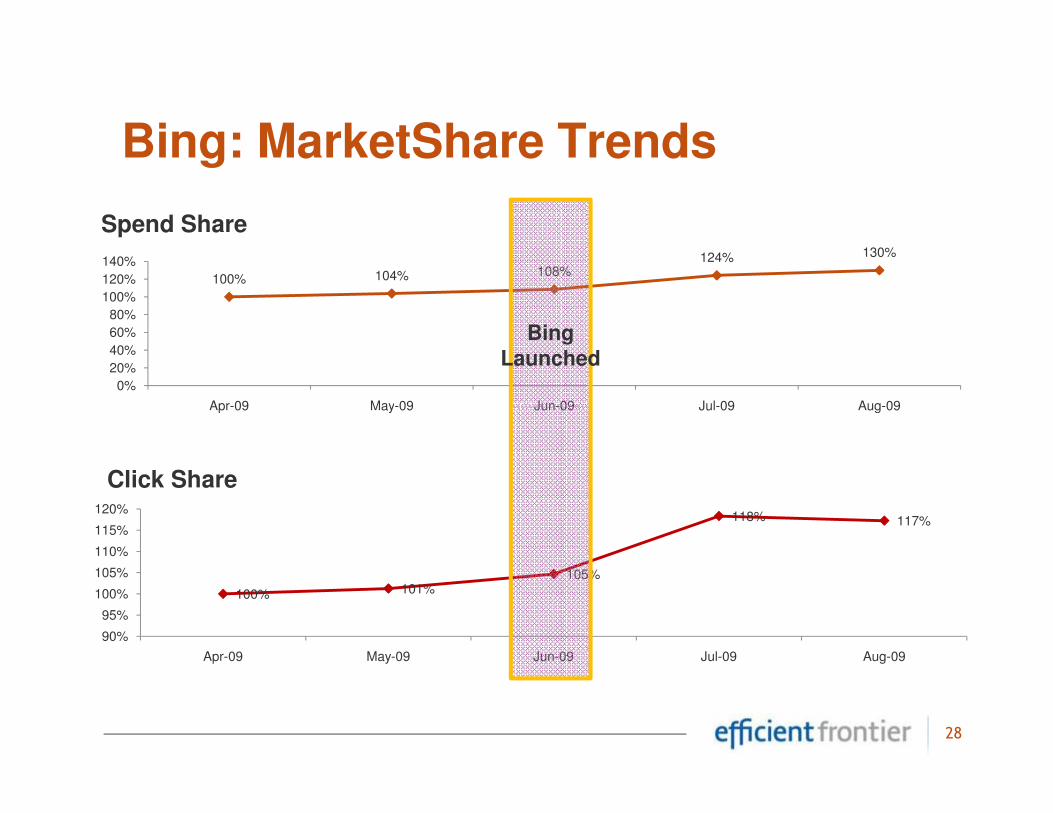
Bing: MarketShare Trends
100% 104% 108%124% 130%
0%
20%
40%
60%
80%
100%
120%
140%
Apr-09 May-09 Jun-09 Jul-09 Aug-09
Spend Share
Bing Launched
28
Apr-09 May-09 Jun-09 Jul-09 Aug-09
100% 101%105%
118% 117%
90%
95%
100%
105%
110%
115%
120%
Apr-09 May-09 Jun-09 Jul-09 Aug-09
Click Share
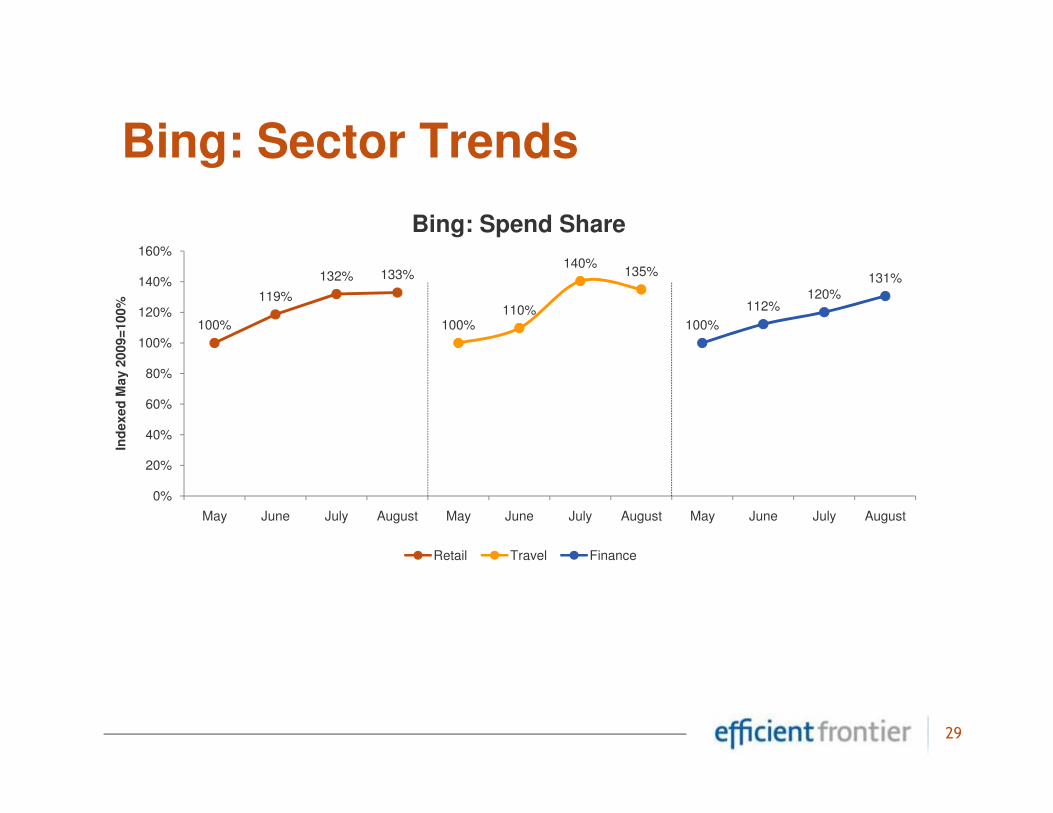
Bing: Sector Trends
100%
119%
132% 133%
100%110%
140%135%
100%
112%120%
131%
60%
80%
100%
120%
140%
160%
Ind
exed
May 2
009=
100%
Bing: Spend Share
29
0%
20%
40%
60%
May June July August May June July August May June July August
Ind
exed
May 2
009=
100%
Retail Travel Finance
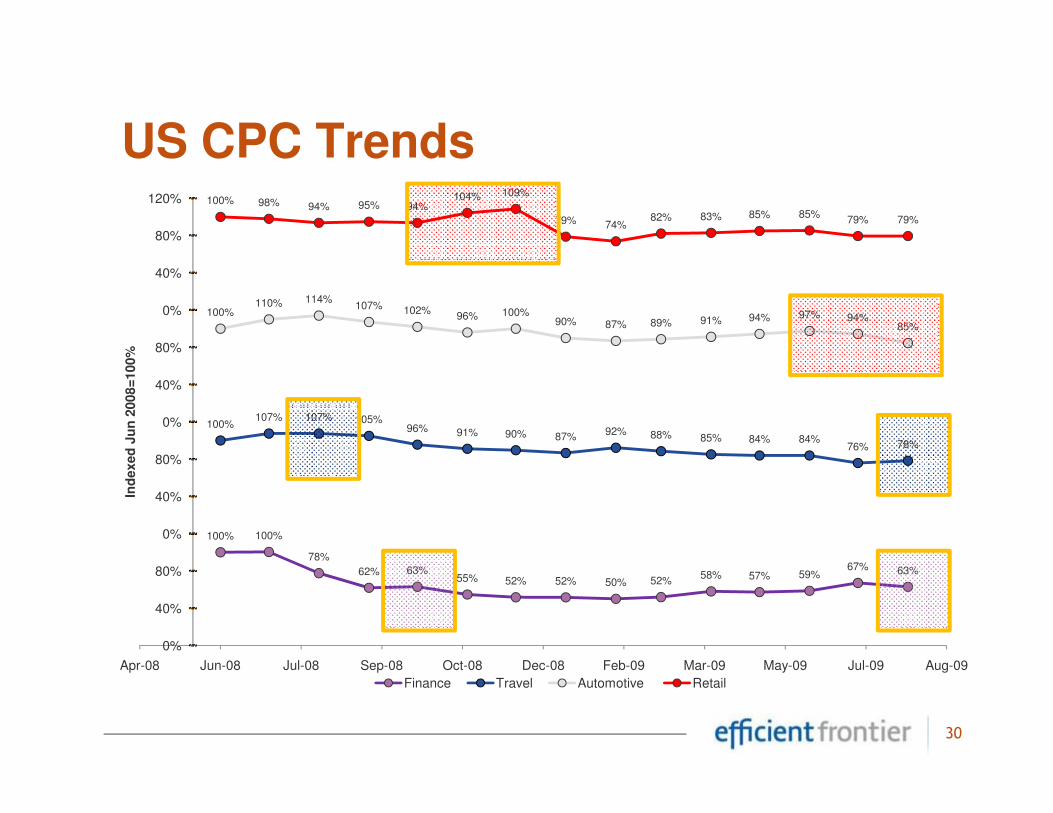
US CPC Trends
100%110% 114%
107% 102%96% 100%
90% 87% 89% 91% 94% 97% 94%85%
100% 98% 94% 95% 94%104% 109%
79% 74%82% 83% 85% 85%
79% 79%
40%
80%
0%
40%
80%
120%
Ind
exed
Ju
n 2
008=
100%
30
100% 100%
78%
62% 63%55% 52% 52% 50% 52%
58% 57% 59%67% 63%
100%107% 107% 105%
96% 91% 90% 87%92% 88% 85% 84% 84%
76% 78%
0%
40%
80%
0%
40%
80%
0%
Apr-08 Jun-08 Jul-08 Sep-08 Oct-08 Dec-08 Feb-09 Mar-09 May-09 Jul-09 Aug-09
Ind
exed
Ju
n 2
008=
100%
Finance Travel Automotive Retail
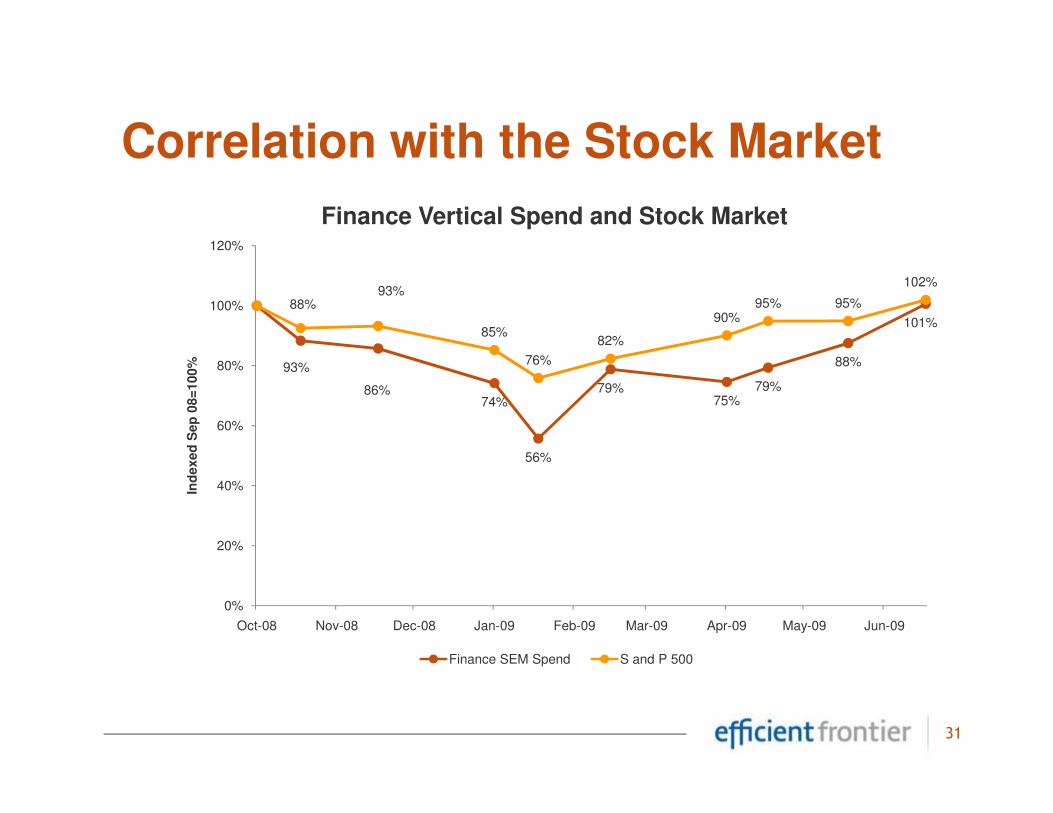
Correlation with the Stock Market
88%
86%74%
79%75%
79%
88%
101%
93%
93%
85%
76%
82%
90%95% 95%
102%
80%
100%
120%
Ind
exed
Sep
08=
100%
Finance Vertical Spend and Stock Market
31
74%
56%
75%
0%
20%
40%
60%
Oct-08 Nov-08 Dec-08 Jan-09 Feb-09 Mar-09 Apr-09 May-09 Jun-09
Ind
exed
Sep
08=
100%
Finance SEM Spend S and P 500
How is September Looking ?
6%
-13%
Retail
Travel
September MoM Spend Change
Weak Travel Sector and Seasonality
Slight bump due to “Back to school”
32
0%
-13%
-15% -10% -5% 0% 5% 10%
Finance
Automotive End of Cash for Clunkers
Flat
What does it mean for the UK?
33
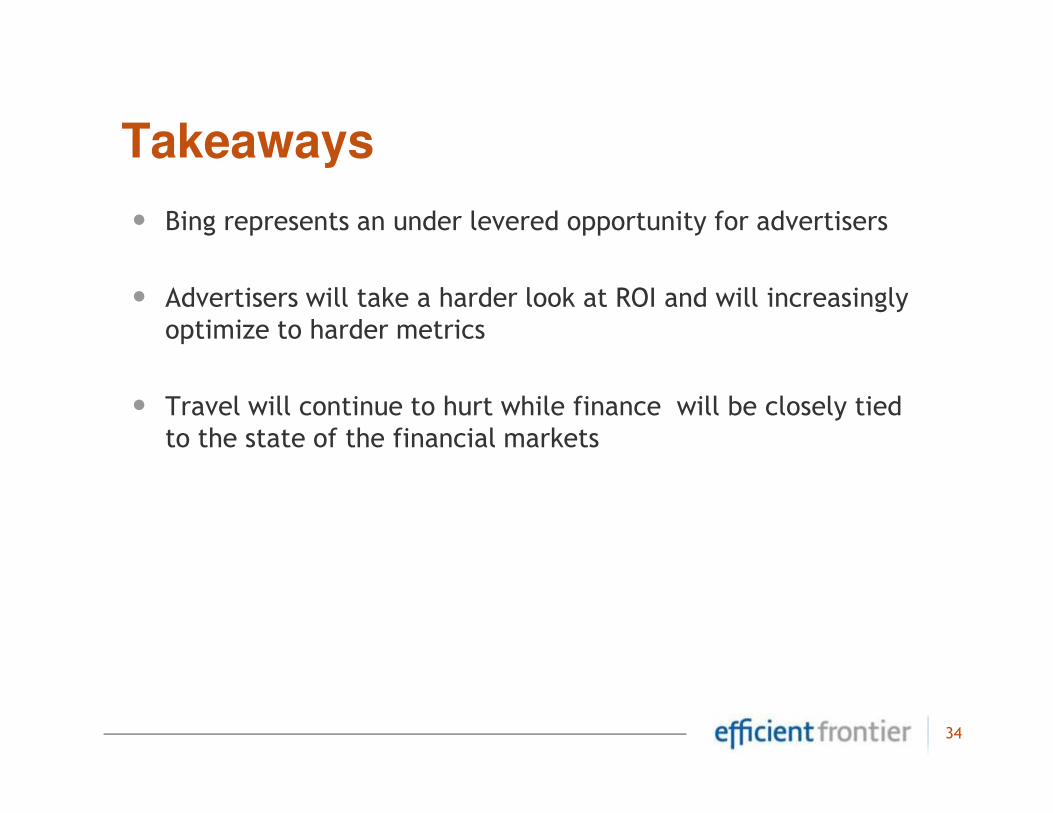
• Bing represents an under levered opportunity for advertisers
• Advertisers will take a harder look at ROI and will increasingly optimize to harder metrics
• Travel will continue to hurt while finance will be closely tied
Takeaways
• Travel will continue to hurt while finance will be closely tied to the state of the financial markets
34
Efficient Frontier Q3 SE Report- published mid October
Join our mailing list!
35
Merinda Peppard
European Marketing Manager
Blog: blog.efrontier.com
Twitter: efrontier