Embed Size (px)
Citation preview
San Jose State University San Jose State University
SJSU ScholarWorks SJSU ScholarWorks
Master's Projects Master's Theses and Graduate Research
2008
Efficient Resource Management Mechanism for 802.16 Wireless Efficient Resource Management Mechanism for 802.16 Wireless
Networks Based on Weighted Fair Queuing Networks Based on Weighted Fair Queuing
Kiran Rangula San Jose State University
Follow this and additional works at: https://scholarworks.sjsu.edu/etd_projects
Part of the Computer Sciences Commons
Recommended Citation Recommended Citation Rangula, Kiran, "Efficient Resource Management Mechanism for 802.16 Wireless Networks Based on Weighted Fair Queuing" (2008). Master's Projects. 83. DOI: https://doi.org/10.31979/etd.9dvp-7fxb https://scholarworks.sjsu.edu/etd_projects/83
This Master's Project is brought to you for free and open access by the Master's Theses and Graduate Research at SJSU ScholarWorks. It has been accepted for inclusion in Master's Projects by an authorized administrator of SJSU ScholarWorks. For more information, please contact [email protected].
CS 298 - Kiran Venkatesh Rangula Final Report
Efficient Resource Management Mechanism for 802.16 Wireless Networks Based on Weighted Fair Queuing
A Writing Project
Presented to
The Faculty of the Department of Computer Science
San Jose State University
In Partial Fulfillment
of the Requirements for the Degree
Master of Science
by
Kiran Venkatesh Rangula
Fall 2008
1

CS 298 - Kiran Venkatesh Rangula Final Report
© 2008
Kiran Venkatesh Rangula
All Rights Reserved
2

CS 298 - Kiran Venkatesh Rangula Final Report
ACKNOWLEDGEMENTS
I would like to thank my advisor, Dr. Robert Chun, whose support has been invaluable to my
work. Dr. Chun has been a key factor in helping me work towards the completion of my work. I very
much appreciate Dr. Agustin Araya’s and John Tong’s participation as thesis committee members. I
would also like to thank Dr. Melody Moh, for guiding me during my initial research. My committee
has provided enlightening insight, guiding and polishing the work presented in this report.
I would also like to thank Alexander Sayenko, who provided me with his WFQ implementation
for the wired NS2 environment and for helping me identify the wireless link identification issues. Also
I would like to acknowledge the RSVP WFQ version written by Marc Greis in my work.
It has been an extremely rewarding experience which I could not have completed alone and am
grateful for your support.
Thank you.
3
CS 298 - Kiran Venkatesh Rangula Final Report
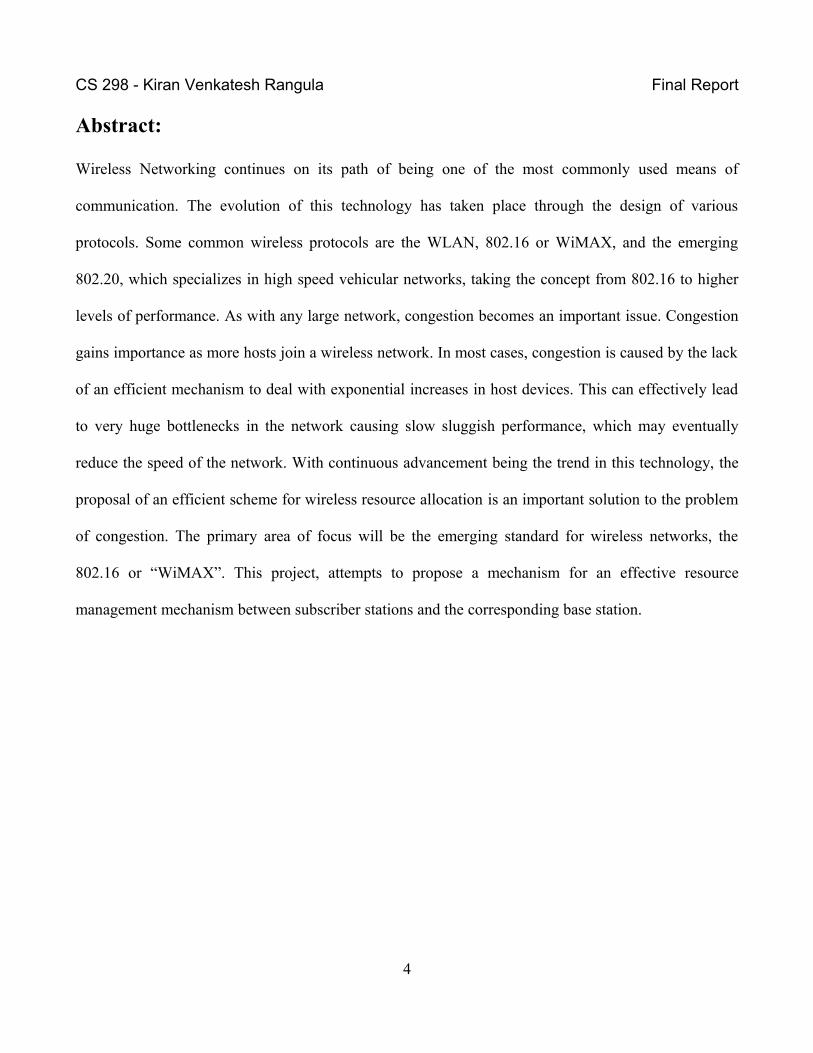
Abstract:
Wireless Networking continues on its path of being one of the most commonly used means of
communication. The evolution of this technology has taken place through the design of various
protocols. Some common wireless protocols are the WLAN, 802.16 or WiMAX, and the emerging
802.20, which specializes in high speed vehicular networks, taking the concept from 802.16 to higher
levels of performance. As with any large network, congestion becomes an important issue. Congestion
gains importance as more hosts join a wireless network. In most cases, congestion is caused by the lack
of an efficient mechanism to deal with exponential increases in host devices. This can effectively lead
to very huge bottlenecks in the network causing slow sluggish performance, which may eventually
reduce the speed of the network. With continuous advancement being the trend in this technology, the
proposal of an efficient scheme for wireless resource allocation is an important solution to the problem
of congestion. The primary area of focus will be the emerging standard for wireless networks, the
802.16 or “WiMAX”. This project, attempts to propose a mechanism for an effective resource
management mechanism between subscriber stations and the corresponding base station.
4
CS 298 - Kiran Venkatesh Rangula Final Report
Table of ContentsPg#
1. Introduction............................................................................................................................ 1.1 Overview of Project…....................................................................................................
1.2 Organization of Report...................................................................................................
91010
2. WiMAX.................................................................................................................................. 2.1 WiMAX PHY Layer........................................................................................................
2.2 WiMAX MAC Layer......................................................................................................2.3 WiMAX QoS Flows........................................................................................................
11131314
3. Research Conducted...............................................................................................................3.1 Next Steps in Signaling.................................................................................................3.2 Contention Resolution...................................................................................................3.3 Multicast Polling...........................................................................................................3.4 Session Description Protocol.........................................................................................3.5 802.50............................................................................................................................
161718202021
4. Network Scheduling...............................................................................................................4.1 Homogeneous Algorithms..............................................................................................4.2 Hybrid Algorithms..........................................................................................................4.3 Opportunistic Algorithms...............................................................................................
22222324
5. Project Outline........................................................................................................................5.1 Plan of Study...................................................................................................................5.2 Software Used.................................................................................................................
242727
6. Queuing Schemes Tested…………………………………………………………………… 6.1 Algorithms Tested............................................................................................................. 6.2 RIO.................................................................................................................................... 6.3 DropTail.............................................................................................................. ………. 6.4 Deficit Round Robin......................................................................................................... 6.5 Gibbens – Kelly Virtual Queue......................................................................................... 6.6 Random Early Marking.....................................................................................................
29292930313232
7. Proposed Queuing Scheme…………………………………………………………………. 33
8. Simulation...............................................................................................................................8.1 Test 1 Scenario...............................................................................................................
4048
5
CS 298 - Kiran Venkatesh Rangula Final Report
Pg#
8.2 Test 2 Scenario...............................................................................................................8.3 Test 3 Scenario...............................................................................................................8.4 Test 4 Scenario...............................................................................................................8.5 Test 5 Scenario...............................................................................................................8.6 Test 6 Scenario...............................................................................................................8.7 Test 7 Scenario………………………………………………………………………...8.8 Simulation Analysis.......................................................................................................
49505152535455
9. Conclusions............................................................................................................................ 67
10.Future Work........................................................................................................................... 67
10. Glossary................................................................................................................................ 68
11. References............................................................................................................................ 70
6
CS 298 - Kiran Venkatesh Rangula Final Report
List of Diagrams
Page#
1. Figure 1. Mesh Network with BS/SS...................................................................................... 11
2. Figure 2. Point to Multi point Networking............................................................................. 12
3. Figure 3. WiMAX and the OSI Model................................................................................... 13
4. Figure 4. WiMAX MAC Layer Message............................................................................... 14
5. Figure 5. Scheduling Classes.................................................................................................. 16
6. Figure 6. NSIS Signaling Design............................................................................................ 18
7. Figure 7. Current Module Design........................................................................................... 24
8. Figure 8. Proposed Module Design........................................................................................ 25
9. Figure 10. RIO Pseudo code.................................................................................................. 30
10. Figure 11. DropTail Pseudo Code........................................................................................ 31
11. Figure 12. NS2 Network Animator (NAM)……………………………………………...... 41
12. Figure 13. NS2 Topography in Trace Analyzer 0.2.69……………………………………. 42
13. Figure 14. NS2 Simulation Run…………………………………………………………… 43
14. Figure 15. RIO vs Modq…………………………………………………………………... 54
15. Figure 16. Random Early Marking vs Modq……………………………………………… 54
16. Figure 17. Gibbens-Kelly Vs Modq………………………………………………………. 55
17. Figure 18. DropTail Vs Modq…………………………………………………………….. 55
18. Figure 19. DRR vs Modq………………………………………………………………….. 56
19. Figure 20. Modq rtPS Flow……………………………………………………………….. 57
20. Figure 21. DRR rtPS Flow………………………………………………………………… 57
21. Figure 21. Basic Modq vs DRR…………………………………………………………… 57
23. Figure 23. BE throughput non Modq……………………………………………………… 58
24. Figure 24. Packets Received by Modq vs DropTail…………………………………... 62
25. Figure 25. Cumulative performance of Modq vs DropTail……………………………… 62
26. Figure 26. Packets Received by Modq vs Gibbens Kelly……………………………….. 63
27. Figure 27. Cumulative performance of Modq vs Gibbens Kelly………………………… 63
7
CS 298 - Kiran Venkatesh Rangula Final Report
Page#
28. Figure 28. Packets Received by Modq vs Random Early Marking………………………. 64
29. Figure 29. Cumulative performance of Modq vs Random Early Marking……………….. 64
30. Figure 30. Packets Received by Modq vs RIO……………………………………………. 65
31. Figure 31. Cumulative performance of Modq vs RIO…………..………………………… 65
8
CS 298 - Kiran Venkatesh Rangula Final Report
List of Tables
1. Table 1. OSI Layer.................................................................................................................
Page#
5
1. Introduction
9
CS 298 - Kiran Venkatesh Rangula Final Report
The networking industry is a fast growing industry. With advances in wireless networks, more and
more people are entering the World Wide Web. As a result of this, managing resources becomes an
important feature of the entire network. Although eliminating congestion as a whole from a network
may prove difficult, it is desirable to keep it to a minimum, especially in newer wireless standards. One
of the most exciting technologies aimed at wireless enhancement is the 802.16 WiMAX protocol. It has
been developed by IEEE as an open standard for deployment. In comparison to 802.11, WiMAX can
generate much higher data rates even at lower speeds, making it an ideal candidate for fast deployment.
Also, being an open standard, it can be used on a large scale without the limitations of proprietary
hardware.
1.1 Overview of Project
This project focuses on providing an improved queuing service for 802.16 based service flows.
Assigning resources in a network is a crucial task that can make or break the network. This project
focuses on the weighted fair queuing (WFQ) model of resource allocation. WFQ uses priorities,
assigned to flows, which in turn provide guaranteed bandwidth. This project tries to improve traffic
flow for congested traffic, by reassigning resources. We use the Network Simulator (NS2), which is
widely used in universities as a basic tool for simulating complex networks and scenarios. The
proposed solution is based on modules designed by Alexander Sayenko [5] and Marc Gries [17], which
have been developed for wired scenarios. Here we attempt to port the same to WiMAX to study the
performance in 802.16. The WiMAX module developed by the Networks and Distributed Systems
Laboratory, Chang Gung University, Taoyuan, Taiwan is used. Working with NS2 is a complex task
which has required a lot of patience, as the simulator consists of numerous inherent flaws which needed
resolution.
10
CS 298 - Kiran Venkatesh Rangula Final Report
1.2 Organization of Report
This report gives a detailed description of all the research that has been conducted, as well as a
description of the underlying algorithm used as well an outline of the design. Section 1, introduces the
WiMAX technology. This includes an introduction to the OSI network layer as well as a description of
the WiMAX MAC layer, as well as the basic working of the WiMAX architecture and an introduction
to the WiMAX service flows. Section (3) gives a brief explanation of all the research that was
conducted. It explains the various forms of resource allocation schemes which give an insight into the
area of resource management. Section (5) gives a brief outline of the 802.16 architecture and how the
queuing scheme interacts with the 802.16 architecture. It also covers the plan of work and some of the
tools utilized. The queuing scheme will be described at a later stage. Section (6) describes the
algorithms used as a part of the testing process. Section 6 gives a detailed explanation of the underlying
core algorithm, Weighted Fair Queuing and Section 7 shows simulation details and results.
2. WiMAX
The 802.16 protocol is based on the OSI Layered Approach which consists of the following 7 layers,
11
CS 298 - Kiran Venkatesh Rangula Final Report
Application Layer Applications that the user interacts with. Applications can vary from authentication to resource management
Presentation Layer Data transformation based on the type of applications communicating and network devices involved to make information readable.
Session Layer Establish sessions/connections between end systems
Transport Layer Provides an interfacing between the upper layers and the lower level layers. Some functions provided are error and flow control operations
Network Layer Establish, maintain and termination of network connections
Data Link Layer Frame level management of data to ensure smooth transmission at layer 1 to avoid any errors in data transmitted
Physical Layer Responsible for the transmission of raw physical data over the networkTable 1. OSI Layer
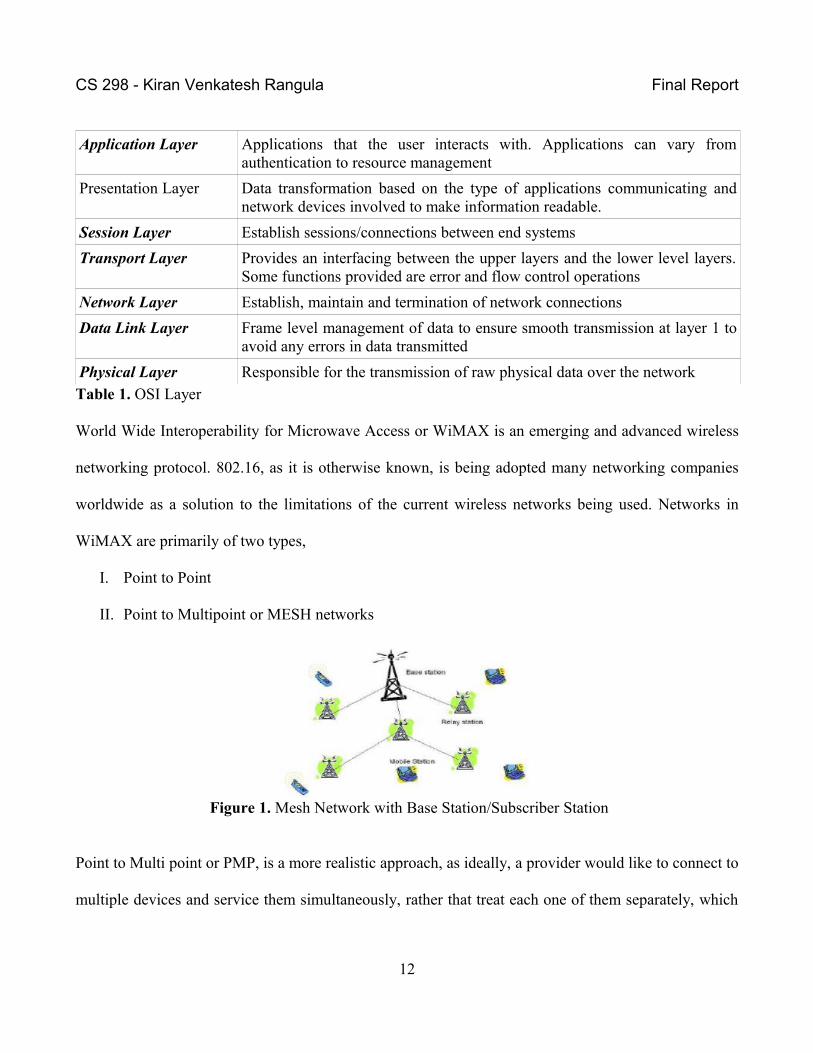
World Wide Interoperability for Microwave Access or WiMAX is an emerging and advanced wireless
networking protocol. 802.16, as it is otherwise known, is being adopted many networking companies
worldwide as a solution to the limitations of the current wireless networks being used. Networks in
WiMAX are primarily of two types,
I. Point to Point
II. Point to Multipoint or MESH networks
Figure 1. Mesh Network with Base Station/Subscriber Station
Point to Multi point or PMP, is a more realistic approach, as ideally, a provider would like to connect to
multiple devices and service them simultaneously, rather that treat each one of them separately, which
12
CS 298 - Kiran Venkatesh Rangula Final Report
would greatly increase the overhead on the overall network.
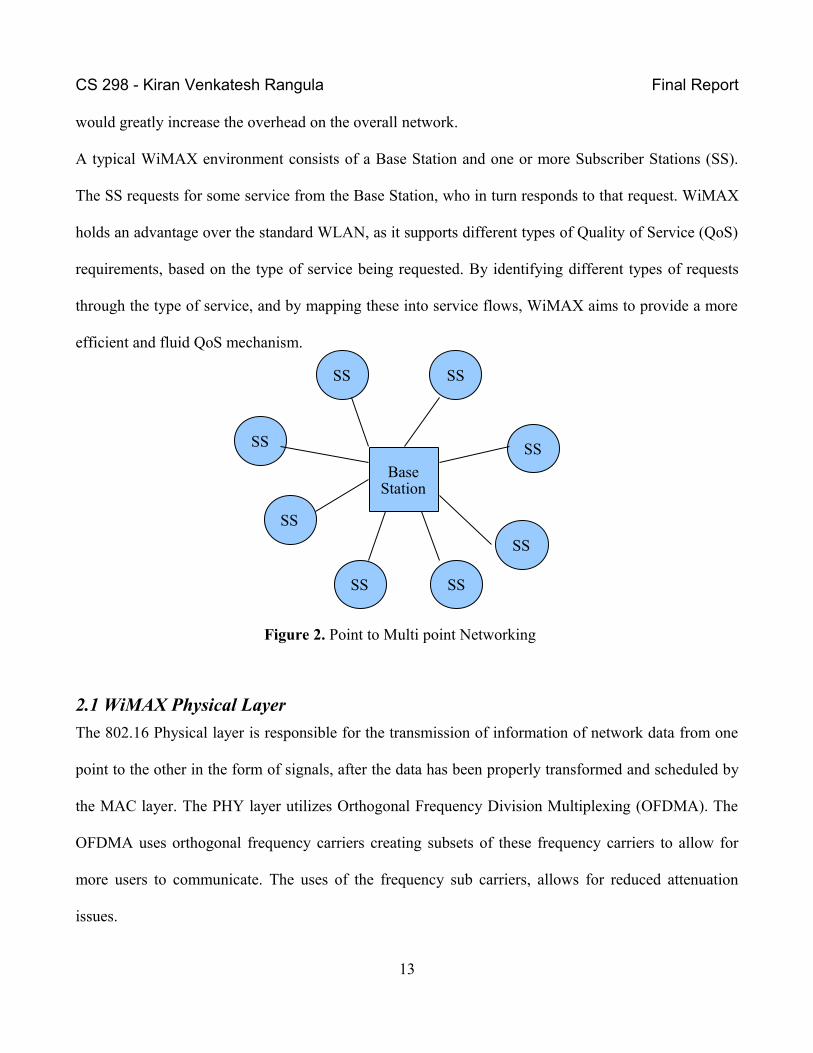
A typical WiMAX environment consists of a Base Station and one or more Subscriber Stations (SS).
The SS requests for some service from the Base Station, who in turn responds to that request. WiMAX
holds an advantage over the standard WLAN, as it supports different types of Quality of Service (QoS)
requirements, based on the type of service being requested. By identifying different types of requests
through the type of service, and by mapping these into service flows, WiMAX aims to provide a more
efficient and fluid QoS mechanism.
Figure 2. Point to Multi point Networking
2.1 WiMAX Physical Layer
The 802.16 Physical layer is responsible for the transmission of information of network data from one
point to the other in the form of signals, after the data has been properly transformed and scheduled by
the MAC layer. The PHY layer utilizes Orthogonal Frequency Division Multiplexing (OFDMA). The
OFDMA uses orthogonal frequency carriers creating subsets of these frequency carriers to allow for
more users to communicate. The uses of the frequency sub carriers, allows for reduced attenuation
issues.
13
SS
SSSS
SS
SS
SS
SS SS
Base Station
CS 298 - Kiran Venkatesh Rangula Final Report
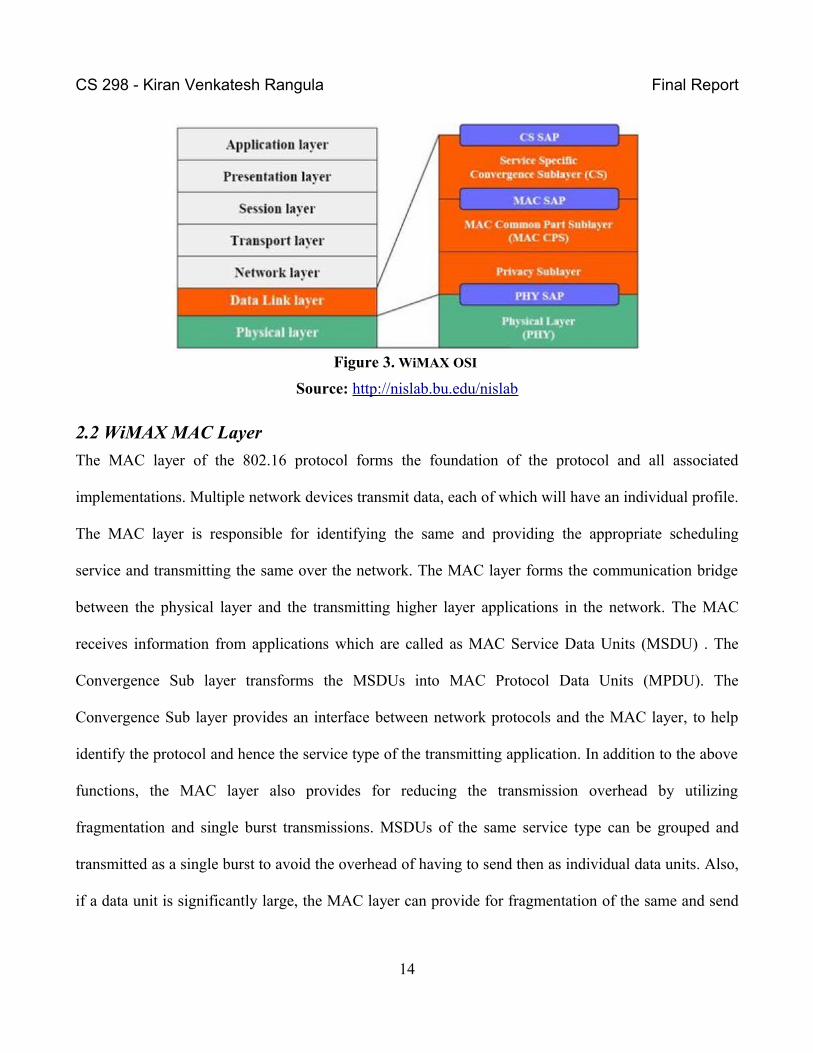
Figure 3. WiMAX OSI
Source: http://nislab.bu.edu/nislab
2.2 WiMAX MAC Layer
The MAC layer of the 802.16 protocol forms the foundation of the protocol and all associated
implementations. Multiple network devices transmit data, each of which will have an individual profile.
The MAC layer is responsible for identifying the same and providing the appropriate scheduling
service and transmitting the same over the network. The MAC layer forms the communication bridge
between the physical layer and the transmitting higher layer applications in the network. The MAC
receives information from applications which are called as MAC Service Data Units (MSDU) . The
Convergence Sub layer transforms the MSDUs into MAC Protocol Data Units (MPDU). The
Convergence Sub layer provides an interface between network protocols and the MAC layer, to help
identify the protocol and hence the service type of the transmitting application. In addition to the above
functions, the MAC layer also provides for reducing the transmission overhead by utilizing
fragmentation and single burst transmissions. MSDUs of the same service type can be grouped and
transmitted as a single burst to avoid the overhead of having to send then as individual data units. Also,
if a data unit is significantly large, the MAC layer can provide for fragmentation of the same and send
14
CS 298 - Kiran Venkatesh Rangula Final Report
them over multiple transmissions.
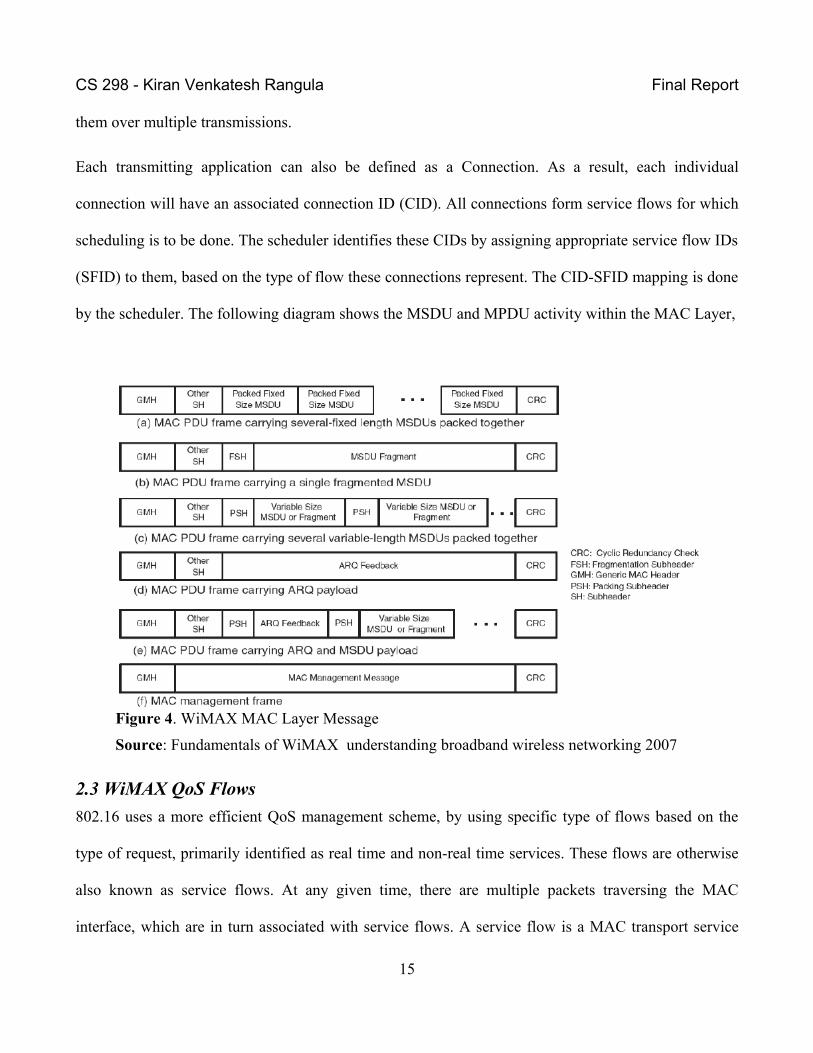
Each transmitting application can also be defined as a Connection. As a result, each individual
connection will have an associated connection ID (CID). All connections form service flows for which
scheduling is to be done. The scheduler identifies these CIDs by assigning appropriate service flow IDs
(SFID) to them, based on the type of flow these connections represent. The CID-SFID mapping is done
by the scheduler. The following diagram shows the MSDU and MPDU activity within the MAC Layer,
Figure 4. WiMAX MAC Layer Message
Source: Fundamentals of WiMAX understanding broadband wireless networking 2007
2.3 WiMAX QoS Flows
802.16 uses a more efficient QoS management scheme, by using specific type of flows based on the
type of request, primarily identified as real time and non-real time services. These flows are otherwise
also known as service flows. At any given time, there are multiple packets traversing the MAC
interface, which are in turn associated with service flows. A service flow is a MAC transport service
15
CS 298 - Kiran Venkatesh Rangula Final Report
that provides unidirectional transport of packets either to uplink packets or to downlink packets. A
service flow is characterized by a set of QoS Parameters such as latency, jitter, and throughput .
Service flows are created based on a per connection basis.
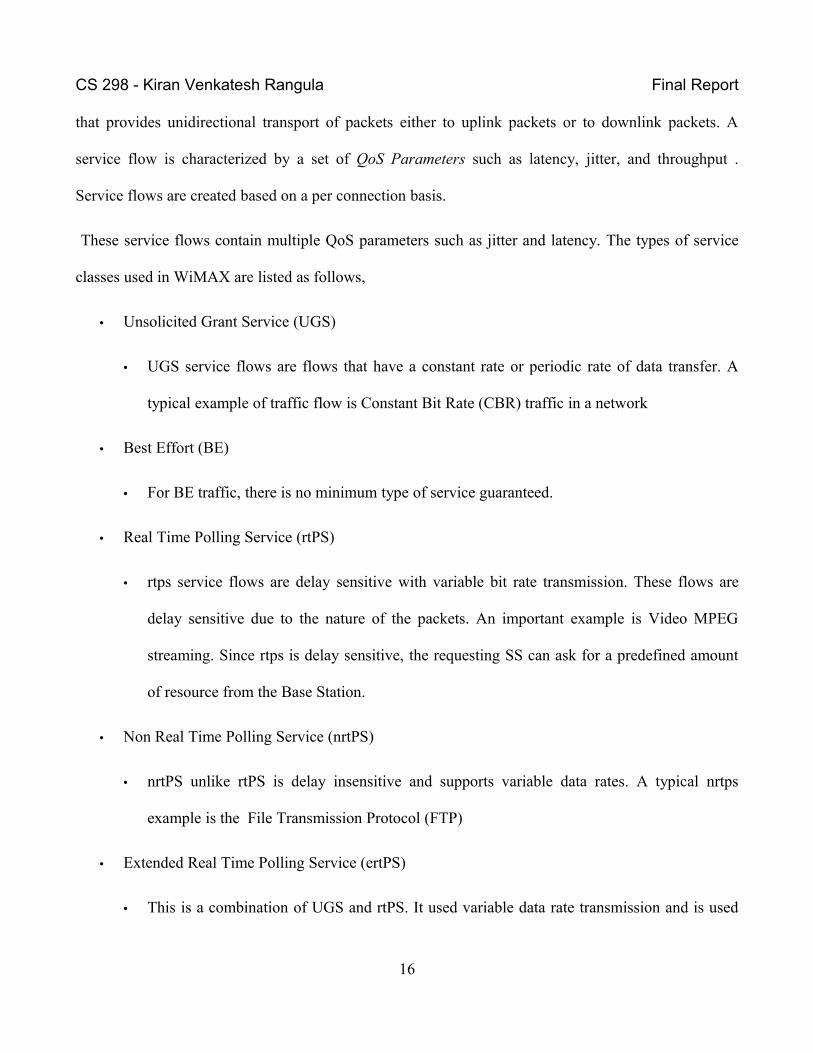
These service flows contain multiple QoS parameters such as jitter and latency. The types of service
classes used in WiMAX are listed as follows,
• Unsolicited Grant Service (UGS)
• UGS service flows are flows that have a constant rate or periodic rate of data transfer. A
typical example of traffic flow is Constant Bit Rate (CBR) traffic in a network
• Best Effort (BE)
• For BE traffic, there is no minimum type of service guaranteed.
• Real Time Polling Service (rtPS)
• rtps service flows are delay sensitive with variable bit rate transmission. These flows are
delay sensitive due to the nature of the packets. An important example is Video MPEG
streaming. Since rtps is delay sensitive, the requesting SS can ask for a predefined amount
of resource from the Base Station.
• Non Real Time Polling Service (nrtPS)
• nrtPS unlike rtPS is delay insensitive and supports variable data rates. A typical nrtps
example is the File Transmission Protocol (FTP)
• Extended Real Time Polling Service (ertPS)
• This is a combination of UGS and rtPS. It used variable data rate transmission and is used
16
CS 298 - Kiran Venkatesh Rangula Final Report
for VoIP traffic, with the use of “silence supression”
Figure 5. Scheduling Classes
Source : Mobile Adhoc and Sensor Systems, 2007. MASS 2007. IEEE International Conference on 8-11 Oct. 2007 Page(s):1 - 9
3. Research Conducted:
As part of the research conducted to propose a solution, various technologies were studied. These
included emerging technologies such as 802.20 which is the next generation high speed vehicular
17
CS 298 - Kiran Venkatesh Rangula Final Report
networks, and also existing implementations such as Contention Resolution, Multi cast Polling, Next
Steps in Signaling (NSIS). Under most scenarios and implementations, these technologies (with the
exception of 802.20), work in conjunction with each other to obtain a common goal.
This aim is to design an effective QOS signaling mechanism which would ultimately lead to efficient
resource management. Since the project is based on 802.16, various scheduling classes were studied,
such as Best Effort, Real Time Polling Service (rtPS), Non – rtPS, Extended – rtPS and Unsolicited
Grant Service. Some of the technologies studied were,
1) NSIS – Next Steps in Signaling
2) CR – Contention Resolution
3) Multicast Polling Mechanism
4) SDP – Session Descriptor Protocol
5) Protocol 802.20
3.1 Next Steps in Signaling:
Nest Step in Signaling is used in order to assure inter domain QoS Signaling between a WiMAX
segment and an external domain. NSIS has been designed to cater to the needs of multiple signaling
applications such as NAT/Firewalls and network management applications. QOS – NSLP, is an
associated mechanism for signaling QOS requirements. The primary goal, of this implementation, was
provide compatibility between a WiMAX and a non WiMAX domain. This implementation, was
essential, as it emphasized on the idea of providing backward compatibility. Although 802.16,
continues to grow in stature, it is always essential to have compatibility with older technologies. This is
an essential feature that should be a part of every new technology. NSIS provides support for multiple
scheduling classes, there by allowing multiple application types to work together. The implementation
18
CS 298 - Kiran Venkatesh Rangula Final Report
also consisted of an Resource Management Function, that handled to allocation of network resources.
The NSIS essentially worked as a translation mechanism for inter domain communication. The NSIS
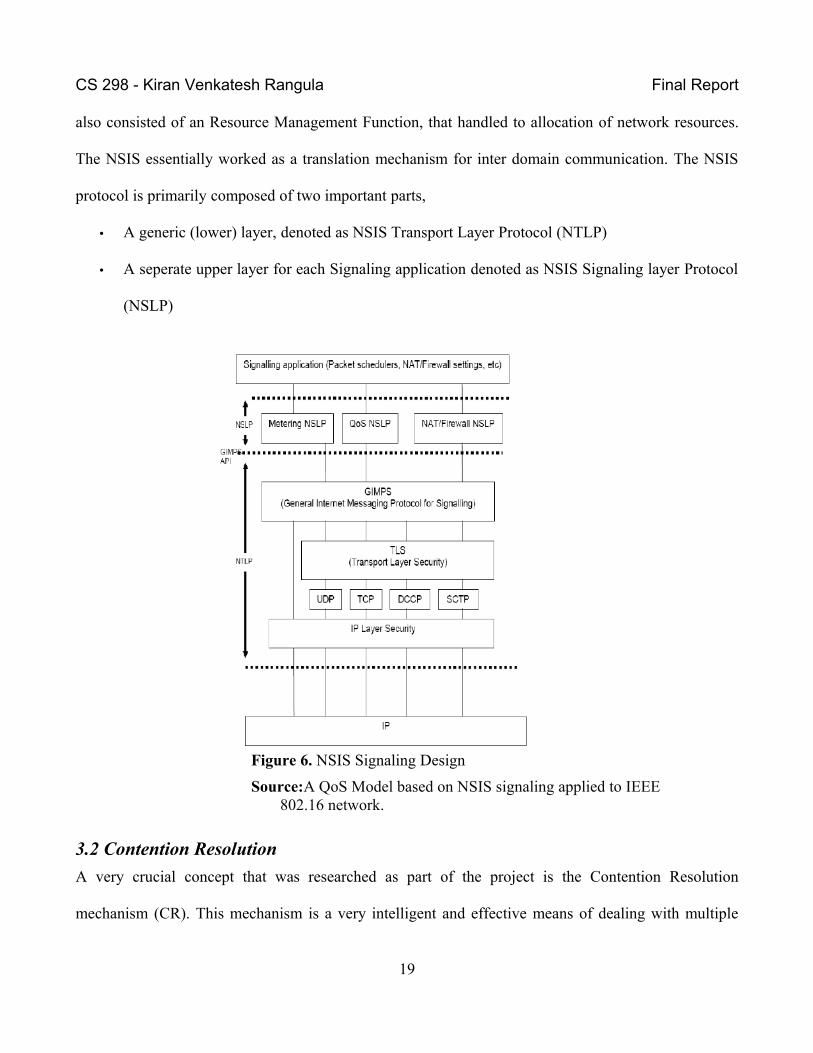
protocol is primarily composed of two important parts,
• A generic (lower) layer, denoted as NSIS Transport Layer Protocol (NTLP)
• A seperate upper layer for each Signaling application denoted as NSIS Signaling layer Protocol
(NSLP)
Figure 6. NSIS Signaling Design
Source:A QoS Model based on NSIS signaling applied to IEEE 802.16 network.
3.2 Contention Resolution
A very crucial concept that was researched as part of the project is the Contention Resolution
mechanism (CR). This mechanism is a very intelligent and effective means of dealing with multiple
19
CS 298 - Kiran Venkatesh Rangula Final Report
Subscriber Stations (SS) competing for resources from the Base Station. CR forms a negotiation
process between the SS and the Base Station, and involves the exchange of messages between both
sides of communication. CR uses the contention resolution algorithm. SS and the Base Station
communicate through contention slots.
In the absence of contention slots, SS will complete with each other for achieving slots. WiMAX
Contention Resolution is based on two values,
• Request Contention Slots
• Back off Start/End Values
CR uses Uplink Channel Descriptor (UCD) messages to communicate requirements between Base
Station and the SS. SS and the BS perform their activities based on Start and end back off values.
These parameters are under the control of the base station and the SS has to abide by them. Once the
SS receive the UCD messages from the BS, it chooses a back off value based on the values specified in
the UCD messages. In case of collision, the SS will wait for this value R before retransmitting. If
repeated collision happens, the value of R is increased by a factor of two. CR is done on a per frame
basis. Each SS sends a request and awaits a response from the BS. If a response is not obtained within a
certain time period, the process is deemed unsuccessful. This concept formed an important part of the
research. It provides for an efficient communication procedure between the SS and the BS. CR allows
for a streamlined approach to resource request. By using a truncated back off algorithm, it makes sure
that the wait time during collisions is not extremely large. CR forms an important part of this research,
as it seems like an ideal choice for resource request. The CR process is decided upon by the BS and is
based on the following two scenarios,
20
CS 298 - Kiran Venkatesh Rangula Final Report
• Static
• Knowing the number of connections before hand. Allows the BS to choose a set of static
parameters
• Adaptive
• A more realistic approach. Connections in reality are constantly being built and torn down.
In a drastically changing environment, adaptive tuning is a better solution. Especially for
VOIP
3.3 Multicast Polling
Multicast polling is an extension of the polling mechanism. It aims at making the entire process of
polling, much faster and more efficient. Multicast polling, allows for a group of SS stations to contact a
base station. This group polling decreases collision in the entire system. But multicast polling, is forced
to use the same back off values as their broadcast counterparts. Multicast polling, groups connections
based on type. But these connections have to work with the same back off values as other existing
connections. Multicast polling forms an important aspect of the research process. It's advantage it's
primary purpose itself. By combining connections in a single group, we can significantly reduce the
overhead on the overall network. An example is creating one Multicast request in comparison with 10
unicast requests. Multicast polling may help in reducing congestion, but most implementations are not
dynamic.
3.4 Session Descriptor Protocol
SDP protocol is used to describe multimedia session parameters. It is used to generate only
descriptor/description messages. SDP works in conjunction with a transport protocol to transmit the
descriptor messages. SDP does not decide on how session parameters are chosen. SDP uses
21
CS 298 - Kiran Venkatesh Rangula Final Report
preconditions, which are a set of predefined attributes, based on which a session is negotiated. The
“Caller” and “Callee”, exchange these precondition parameters It is the responsibility of the
communicating sides to determine, if the attributes meet the predefined threshold. An important feature
of the SDP mechanism is the extension for WiMAX. Since multimedia is an inherent aspect of all
communications, particularly VOIP, SDP forms an important part of providing reliable communication.
SDP works with Proxy Based bandwidth Allocation. This is achieved using SDP/SIP proxy. The proxy
server should preferably be a part of the base station or the maximum a layer 2 hop. The proxy system
makes the CAC decisions. Two important decisions to be made are as follows,
• Tracking of allocated bandwidth (found by looking at all the active connections)
• Tracking of available bandwidth or attainable bandwidth
3.5 802.20
802.20 Or MobiFi is a packet based air interface for IP, designed by the Mobile Broadband Wireless
Access (MBWA) group. An emerging protocol, it aims to be a low cost, always on wireless service.
MobileFi, aims at improving the quality of service over the existing wireless technologies, WLAN and
WiMAX. The primary aim of 802.20 is to remain a low cost mechanism, while providing support for
vehicular speeds of 250 km/hr. 802.20 is still undergoing research, despite development being halted
for some period of time. MobileFi aims to achieve High Mobility and High Bandwidth. Like the
802.16, the 802.20 is also designed on the basis of a layered architecture. The scope of the design for
the 802.20 working group is the PHY, MAC and LLC layers of the protocol. 802.20 will operate in
frequency bands below 3.5 GHz and maintain a peak data rate of 1Mb/s. The primary features of the
802.20 defined are [15],
22
CS 298 - Kiran Venkatesh Rangula Final Report
• IP roaming and handover (at more than 1 Mb/s)
• New MAC and PHY with IP and adaptive antennas
• Optimized for full mobility up to vehicular speeds of 250 km/h
• Operates in licensed bands (below 3.5 GHz)
• Utilizes packet architecture
• Low Latency
Since 802.20 is a packet based network, it will prove efficient in a high demand environment. 802.20
aims to bridge the gap between the following [15],
• Low bandwidth and High Mobility (Cellular Networks)
• High bandwidth and Low Mobility (802.16 Wireless)
The above form of integration will allows for connectivity between home, office and mobile
operations. Since 802.20 aims at providing “always on” connectivity, it will support both real time and
non-real time applications efficiently. In addition to providing support for interoperability roaming and
handover, 802.20 also utilizes Universal Frequency Reuse which can reuse effectively a given
frequency resource in a mobile cellular environment. [15]
4. Network Scheduling:The 802.16 specification has catered to faster data transfer mechanisms. But, the 802.16 has not
provided for a concrete specification towards the development of an efficient scheduling mechanism.
The area of scheduling has been defined as being open to development. An efficient and intelligent
23
CS 298 - Kiran Venkatesh Rangula Final Report
mechanism will allow for multiple service flows to be serviced at the same time, while also reducing
the overhead and congestion issues in the network. Some basic requirements that can be identified as
ideal characteristics for a scheduling algorithm can be listed as follows,
• Prioritize the multiple service flows present at any given time on the network
• Assign Service Flow IDs to individual flows
• Utilize an efficient queuing mechanism for individual flows
• Assign resources based on the priority of the individual flows. These priorities are primarily
based on the type of the service flow and the level of importance
Scheduling algorithms work in conjunction with the Call Admission Control (CAC). The CAC, permits
for a connection to be established only if the predefined QoS parameters can be satisfied, i.e. ensuring
the availability of the minimum amount of services in order to prevent congestion.
A network scheduling algorithm can be primarily categorized into two types,
• Homogeneous Algorithms
• Hybrid Algorithms
4.1 Homogeneous Algorithms
Homogeneous algorithms can be described as standalone implementations, that are not related to any
other form of scheduling algorithms. Some examples of homogeneous algorithms are [7],
• Weighted Round Robin
• Weighted Fair Queuing
• Earliest Deadline First
24
CS 298 - Kiran Venkatesh Rangula Final Report
4.2 Hybrid Algorithms
Hybrid algorithms essentially attempt to combine the characteristics of individual homogeneous/legacy
algorithms to create a more efficient result. By identifying the advantages of the individual algorithms
and making a tradeoff among the negative aspects of the same. Some example of combining algorithms
are as follows [7],
• EDF+WFQ+FIFO
• Employs priority mechanism towards all flows on the network. This allows for the
allocation of bandwidth based on the type of service and level importance associated with
the same [7]
• EDF+WFQ
• Tracks the amount of bandwidth allocated to all the different service classes in the network
and performs dynamic bandwidth allocation on all the service flows [7]
4.3 Opportunistic Algorithms
Another class of algorithms has been described as opportunistic The algorithm considers all QoS
parameters of the type of scheduling service and schedules only one subscriber station. Another version
of the opportunistic algorithm schedules multiple subscriber stations at the same time through the use
of queuing theory [7].
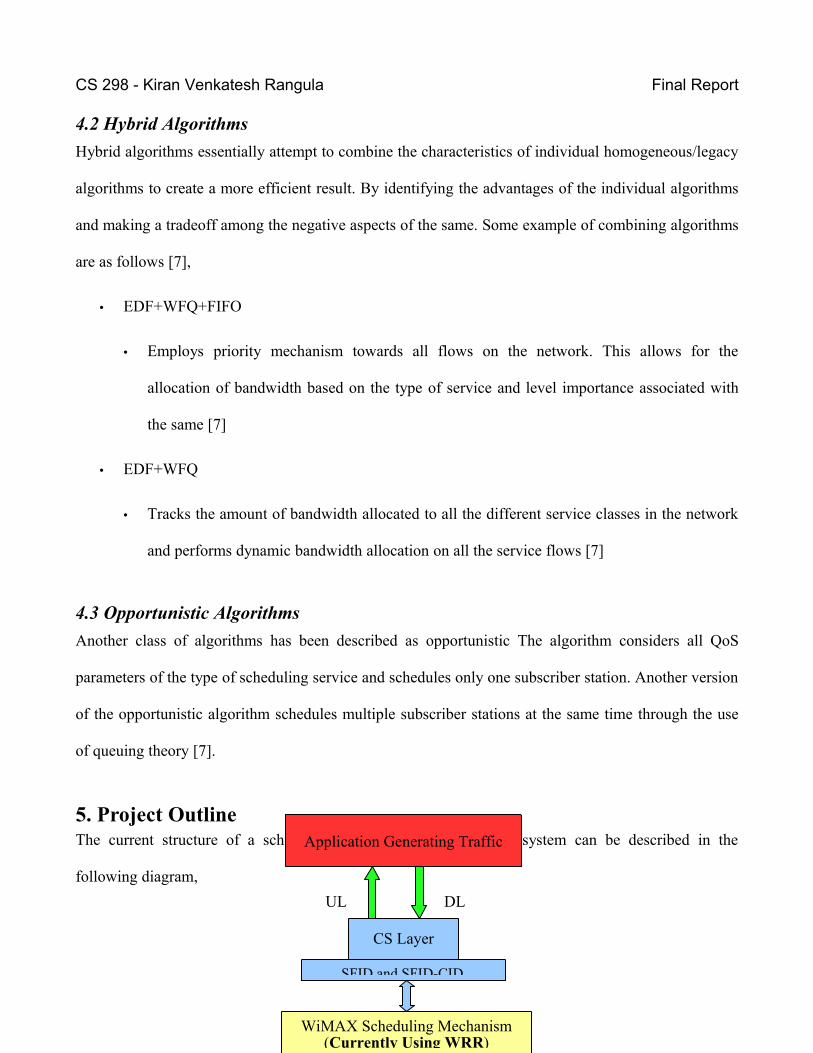
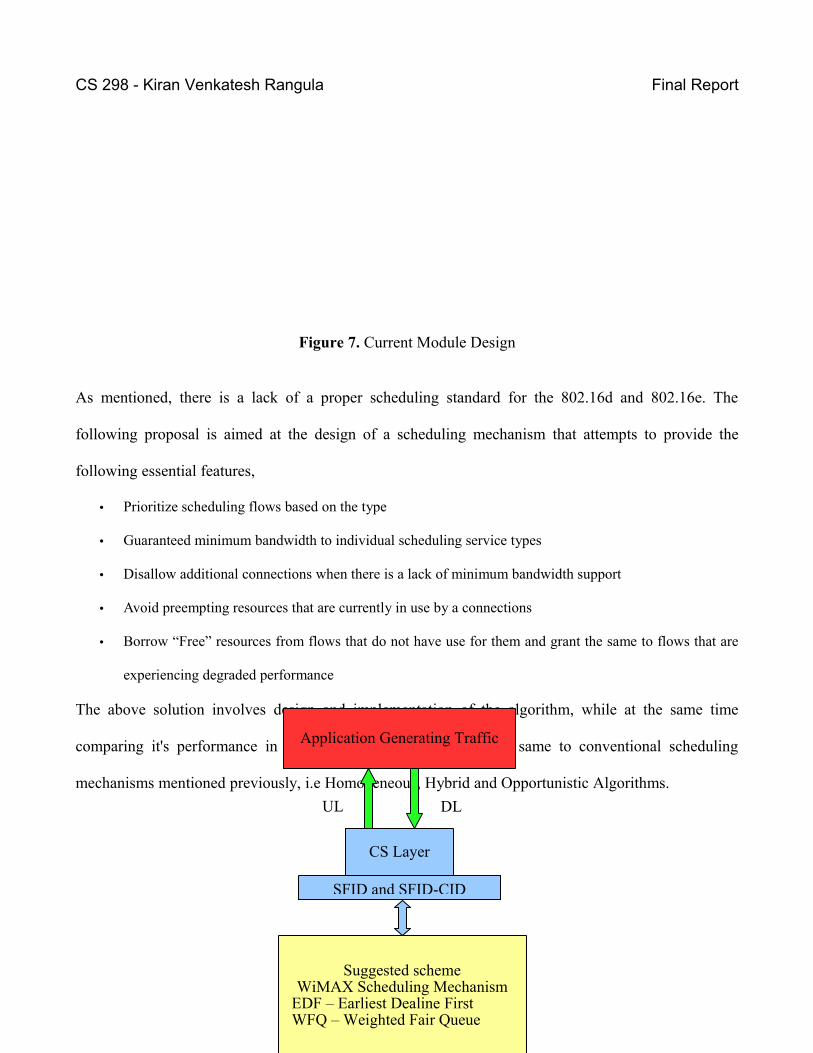
5. Project OutlineThe current structure of a scheduling mechanism in a WiMAX system can be described in the
following diagram,
25
Application Generating Traffic
CS Layer
UL DL
SFID and SFID-CID
WiMAX Scheduling Mechanism(Currently Using WRR)
CS 298 - Kiran Venkatesh Rangula Final Report
Figure 7. Current Module Design
As mentioned, there is a lack of a proper scheduling standard for the 802.16d and 802.16e. The
following proposal is aimed at the design of a scheduling mechanism that attempts to provide the
following essential features,
• Prioritize scheduling flows based on the type
• Guaranteed minimum bandwidth to individual scheduling service types
• Disallow additional connections when there is a lack of minimum bandwidth support
• Avoid preempting resources that are currently in use by a connections
• Borrow “Free” resources from flows that do not have use for them and grant the same to flows that are
experiencing degraded performance
The above solution involves design and implementation of the algorithm, while at the same time
comparing it's performance in terms of QoS and comparing the same to conventional scheduling
mechanisms mentioned previously, i.e Homogeneous, Hybrid and Opportunistic Algorithms.
26
Application Generating Traffic
CS Layer
UL DL
SFID and SFID-CID
Suggested schemeWiMAX Scheduling Mechanism
EDF – Earliest Dealine First WFQ – Weighted Fair Queue
CS 298 - Kiran Venkatesh Rangula Final Report
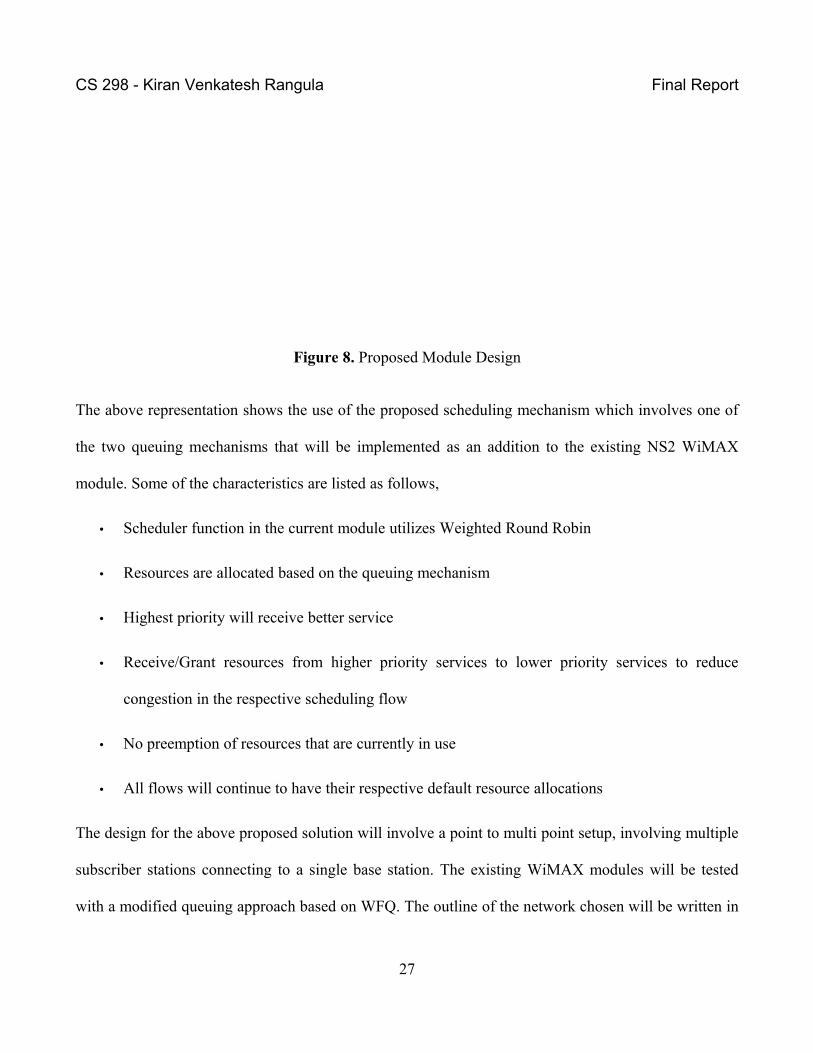
Figure 8. Proposed Module Design
The above representation shows the use of the proposed scheduling mechanism which involves one of
the two queuing mechanisms that will be implemented as an addition to the existing NS2 WiMAX
module. Some of the characteristics are listed as follows,
• Scheduler function in the current module utilizes Weighted Round Robin
• Resources are allocated based on the queuing mechanism
• Highest priority will receive better service
• Receive/Grant resources from higher priority services to lower priority services to reduce
congestion in the respective scheduling flow
• No preemption of resources that are currently in use
• All flows will continue to have their respective default resource allocations
The design for the above proposed solution will involve a point to multi point setup, involving multiple
subscriber stations connecting to a single base station. The existing WiMAX modules will be tested
with a modified queuing approach based on WFQ. The outline of the network chosen will be written in
27
CS 298 - Kiran Venkatesh Rangula Final Report
TCL, along with the traffic specification to be utilized. As part of the design process, existing
scheduling mechanisms will be compared with predetermined traffic specifications to obtain
benchmark results and to eventually compare the same to the proposed queuing scheme. The support
for mobility, was attempted using a modified WiMAX module, developed by the National Institute of
Standards and Technology. This module includes a full mobility test suite. This was not completed as
the mobility suit provided and the WiMAX module for NIST did not have the WiMAX service flows
implemented as yet..
The Queuing algorithm chosen to implement the above solution will be Weighted Fair Queuing.
Essentially, the result will be a hybrid of the WFQ, which implement the proposed idea of borrowing
resources from flows that do not require the same. WFQ has the following features,
• Multiple sessions are created for each connection
• Each session will have an associated Service Flow ID (SFID)
• Each session will have it's own FIFO queue
• A specific array will store the SFIDs
• Virtual Finish Time is calculated for Each session to perform resource management
5.1 Plan Of Work
• Predetermined traffic types for testing which are the WiMAX service flows
• Use of existing scheduler and queuing schemes to generate test data for benchmarking
• Create TCL script to simulate a 40 node subscriber station setup
• Implement Proposed Network Management scheme
28
CS 298 - Kiran Venkatesh Rangula Final Report
• Tested the proposed scheme with the predetermined traffic parameters
• Compared results with benchmark obtained from previous comparison tests
5.2 Software Used
For the purpose of this project the following software tools will be utilized,
• NS2 Network Simulator
• Cygwin
• WiMAX schedulers from existing project modules
• NAM network graphical simulation to generate graph models to present appropriate simulation
results
• Software code will be written in C++
• BloodShed Dev C++ Code Editor
• TCL/TK Version
• Windows XP operating system
The NS2 network simulator is an open source simulation tool, widely used to emulate network
characteristics. The 802.16 module used for the purpose of this project has been developed by the
Networks and Distributed Systems Laboratory, Chang Gung University, Taoyuan, Taiwan. Another
module which is being considered for implementation purposes is the NSIST WiMAX module. The
former contains support for mobility in WiMAX. This would allow testing the proposed scheduling
mechanism under non-stationary Subscriber Station environment. The design of the network will be
29
CS 298 - Kiran Venkatesh Rangula Final Report
specified as a TCL script. The graphical user interface NAM will be utilized to generate a GUI for the
specified network design.
30
CS 298 - Kiran Venkatesh Rangula Final Report
6. Queuing Schemes Tested
6.1 Algorithms Tested
The ModQ version of the WFQ queuing is compared to other queuing schemes under similar test
scenarios to see how it performs against other schemes. The proposed solution aims to maintain a
certain degree of performance against there schemes. The following queuing mechanisms are used to
generate results which are compared to the performance of the proposed scheme. They are listed as
follows,
• RIO
• Random Early Detection with In and Out
• Drop Tail
• Drop Tail/FIFO queueing discipline
• Deficit Round Robin
• Modification to Weighted Round Robin
• Gk
• Gibbens-Kelly Virtual Queuing Scheme
• REM
• Random Early Marking
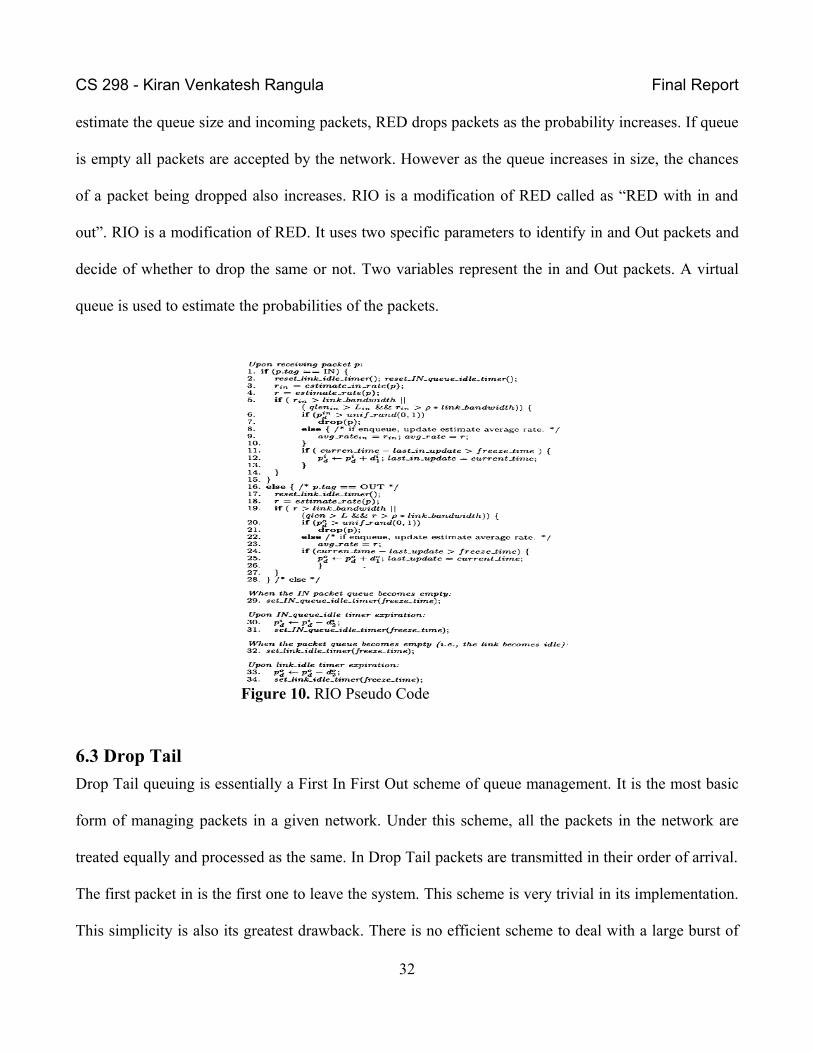
6.2 Random Early Detection with In/Out (RIO)
Random early detection is a queue management scheme. The primary issue with all networks is
congestion. All networks utilize a buffer to control the overall traffic flow. If the network buffer is
overwhelmed by the number of packets arriving, the excessive packets that cannot be accommodated
are all dropped. The RED scheme proposes a solution to the above issue. By using probability to
31
CS 298 - Kiran Venkatesh Rangula Final Report
estimate the queue size and incoming packets, RED drops packets as the probability increases. If queue
is empty all packets are accepted by the network. However as the queue increases in size, the chances
of a packet being dropped also increases. RIO is a modification of RED called as “RED with in and
out”. RIO is a modification of RED. It uses two specific parameters to identify in and Out packets and
decide of whether to drop the same or not. Two variables represent the in and Out packets. A virtual
queue is used to estimate the probabilities of the packets.
Figure 10. RIO Pseudo Code
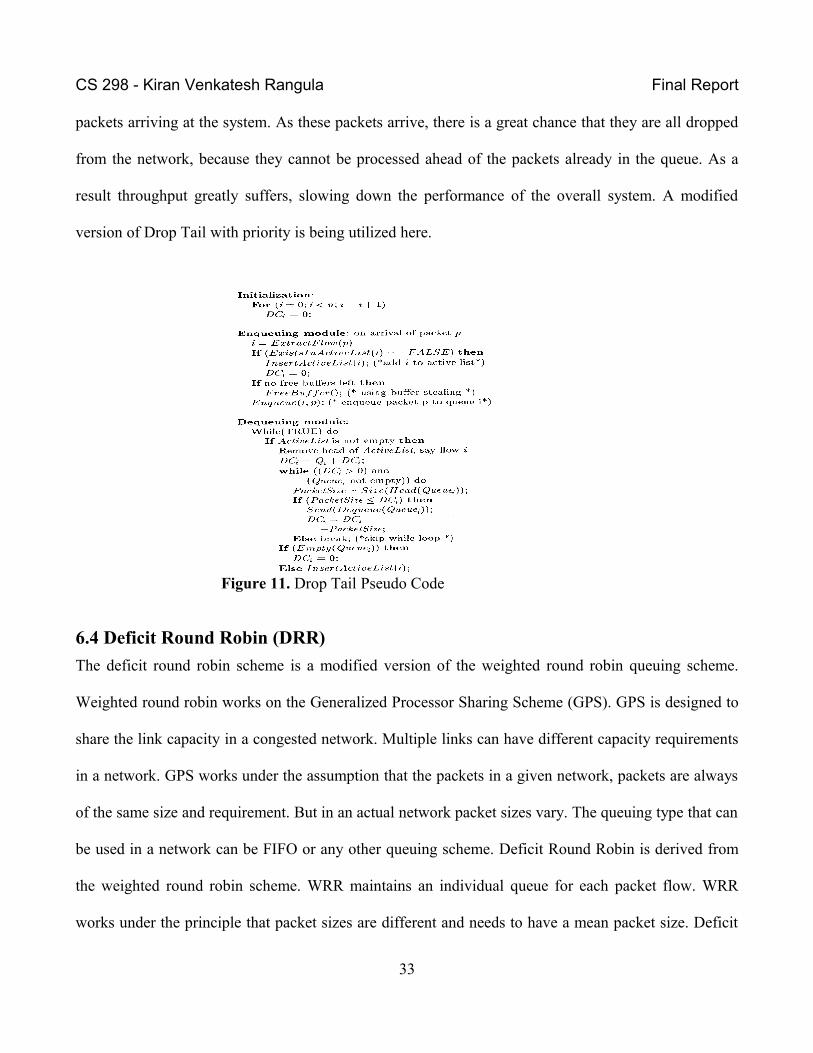
6.3 Drop Tail
Drop Tail queuing is essentially a First In First Out scheme of queue management. It is the most basic
form of managing packets in a given network. Under this scheme, all the packets in the network are
treated equally and processed as the same. In Drop Tail packets are transmitted in their order of arrival.
The first packet in is the first one to leave the system. This scheme is very trivial in its implementation.
This simplicity is also its greatest drawback. There is no efficient scheme to deal with a large burst of
32
CS 298 - Kiran Venkatesh Rangula Final Report
packets arriving at the system. As these packets arrive, there is a great chance that they are all dropped
from the network, because they cannot be processed ahead of the packets already in the queue. As a
result throughput greatly suffers, slowing down the performance of the overall system. A modified
version of Drop Tail with priority is being utilized here.
Figure 11. Drop Tail Pseudo Code
6.4 Deficit Round Robin (DRR)
The deficit round robin scheme is a modified version of the weighted round robin queuing scheme.
Weighted round robin works on the Generalized Processor Sharing Scheme (GPS). GPS is designed to
share the link capacity in a congested network. Multiple links can have different capacity requirements
in a network. GPS works under the assumption that the packets in a given network, packets are always
of the same size and requirement. But in an actual network packet sizes vary. The queuing type that can
be used in a network can be FIFO or any other queuing scheme. Deficit Round Robin is derived from
the weighted round robin scheme. WRR maintains an individual queue for each packet flow. WRR
works under the principle that packet sizes are different and needs to have a mean packet size. Deficit
33

CS 298 - Kiran Venkatesh Rangula Final Report
round robin however does not require for mean packet size to be known.
6.5 Gibbens – Kelly Virtual Queue
Also known as the Gibbens-Kelly algorithm is a virtual queuing mechanism for networks. The network
maintains a virtual queue 'V', having a predetermined fixed capacity “q”. There is also a real queue
“q2”. When the “q” begins to exceed its limits and over flow, all the incoming packets to “q2” are
marked until the “q” is able to accept additional packets. Gk does not work well in a system which
allows for the dropping of packets due to congestion as this would affect the overall throughput, if Gk
had to mark all those packets. The Virtual Queue marking algorithm maintains a virtual buffer, with
capacity and buffer limit some percentage theta of the link's capacity and buffer. The algorithm marks
all packets that arrive at the link from the time a loss occurs in the Virtual Queue, until the time the
Virtual Queue empties.
6.6 Random Early Marking (REM)
Random Early Marking uses the same “marking” philosophy of the Gk algorithm. REM utilizes a link
and source algorithm. The link algorithm decides on what feedback is to be provided. The source
algorithm in turn, decides on how to deal incoming traffic.
34
CS 298 - Kiran Venkatesh Rangula Final Report
7. Proposed Queuing Scheme:
Weighted Fair Queuing:
Weighted Fair Queuing is a network queuing mechanism. It is based on the General Packet Service
mechanism (GPS) and is also comparable to the Packet by packet GPS mechanism (PGPS). The WFQ
principle has been implemented for wired networks on the NS2 platform, but few are available for the
wireless framework of 802.16. WFQ can be referred to as a priority based queuing scheme, were
packets are treated differently based on the priorities assigned to them. WFQ can be considered as an
extension to the Fair Queuing (FQ) scheme. In Fair Queuing, all the flows in a network are assigned
similar bandwidth resources and a FIFO queue is generated per flow to regulate transmission of
information. Since the bandwidth is common to all, an over zealous traffic will cause congestion to
itself, but will not affect the remaining flows. WFQ takes this idea of Fair Queuing one step further, by
introducing the idea of weights or priorities. Assigning specific priorities to the individual flows,
guarantees a certain amount of bandwidth to the individual traffic flows. By prioritizing flows within a
network, multiple flows are able to share the network bandwidth and transmit at the same time. This
allows for the prevention of starvation for the any of the other flows, due to one badly behaved flow.
WFQ works on the basis of two important variables, the Virtual Start Time and the Virtual Finish
Time. These values are assigned to all packets that are a part of the active sessions only as all empty
queues are of no importance. A packet is chosen from the network based on its virtual finish time and
then transmitted. The virtual start and finish times of packet n from session s is calculated as follows,
S(n,s) = max(F(n-1,s), V(A(n,s)))
F(n,s) = S(n,s) + L(n,s)/r(s)
35

CS 298 - Kiran Venkatesh Rangula Final Report
In the above equations, L and A are the length and arrival times of the individual packets. Hence,
shorter the virtual finish time, the faster the completion of packet transmission. Consequently, the
packet with the smallest virtual finish time is chosen for transmission from the queue. WFQ has been
chosen as the basis for the proposed solution, primarily due to the ability of providing weights for the
sessions or flows. These weights can be provided based on the importance of the flows, which in turn
could be based on the type of flow. In addition to providing weights, it also allows multiple sessions to
co exist, making it an ideal choice. Another version of WFQ is the worst case WF2Q.
The pseudo code for WFQ is shown below,
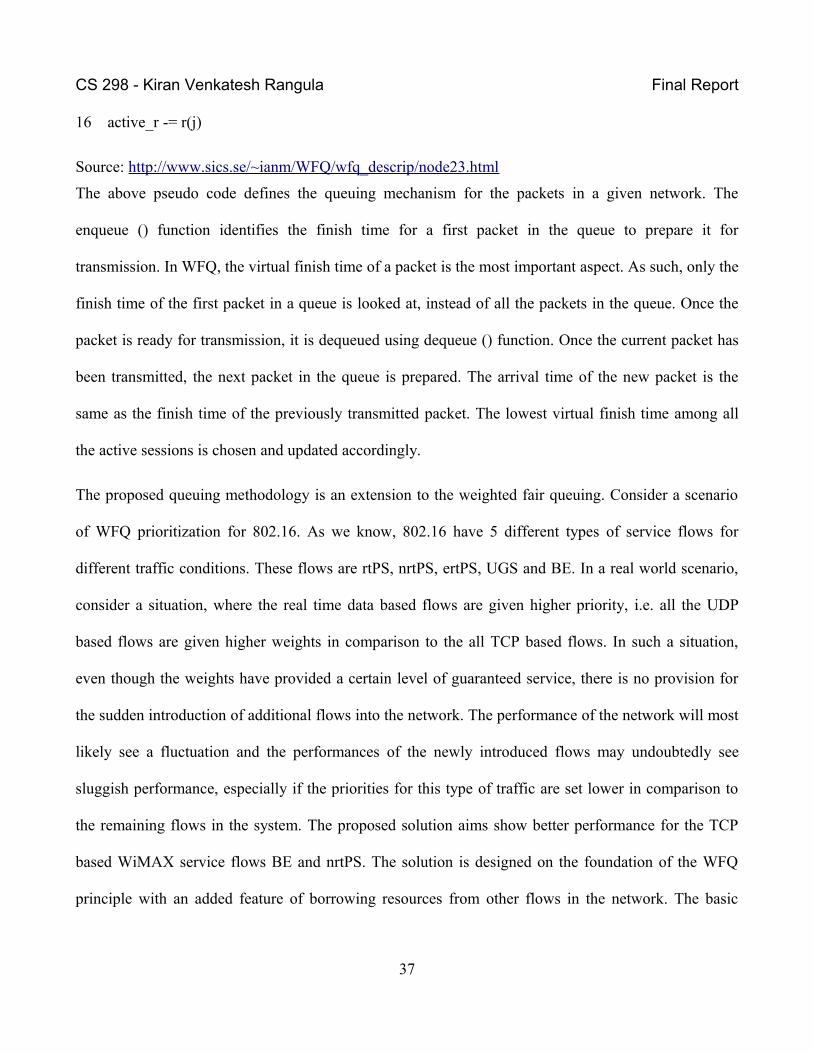
enqueue(packet, i) 1 if not active(i) 2 activate(i) 3 active_r += r(i) 4 if queue(i) is empty 5 F(i) = SF(i) = max(F(i), V(t)) + L / weight 6 else 7 SF(i) += L / weight 8 put(packet, queue(i))
dequeue() 1 i = min(active queues F(i)) 2 packet = get(queue(i)) 3 t += L / r 4 if active(i) 5 F(i) += Lnext / r(i) 6 for ever 7 j = min(active queues SF(j)) 8 tmp_t = prev_t + (SF(j) - V(t)) * active_r / r 9 if tmp_t > t10 V(t) += (t - prev_t) * r / active_r11 prev_t = t12 return packet13 prev_t = tmp_t14 V(t) = SF(j)15 deactivate(j)
36
CS 298 - Kiran Venkatesh Rangula Final Report
16 active_r -= r(j)
Source: http://www.sics.se/~ianm/WFQ/wfq_descrip/node23.html
The above pseudo code defines the queuing mechanism for the packets in a given network. The
enqueue () function identifies the finish time for a first packet in the queue to prepare it for
transmission. In WFQ, the virtual finish time of a packet is the most important aspect. As such, only the
finish time of the first packet in a queue is looked at, instead of all the packets in the queue. Once the
packet is ready for transmission, it is dequeued using dequeue () function. Once the current packet has
been transmitted, the next packet in the queue is prepared. The arrival time of the new packet is the
same as the finish time of the previously transmitted packet. The lowest virtual finish time among all
the active sessions is chosen and updated accordingly.
The proposed queuing methodology is an extension to the weighted fair queuing. Consider a scenario
of WFQ prioritization for 802.16. As we know, 802.16 have 5 different types of service flows for
different traffic conditions. These flows are rtPS, nrtPS, ertPS, UGS and BE. In a real world scenario,
consider a situation, where the real time data based flows are given higher priority, i.e. all the UDP
based flows are given higher weights in comparison to the all TCP based flows. In such a situation,
even though the weights have provided a certain level of guaranteed service, there is no provision for
the sudden introduction of additional flows into the network. The performance of the network will most
likely see a fluctuation and the performances of the newly introduced flows may undoubtedly see
sluggish performance, especially if the priorities for this type of traffic are set lower in comparison to
the remaining flows in the system. The proposed solution aims show better performance for the TCP
based WiMAX service flows BE and nrtPS. The solution is designed on the foundation of the WFQ
principle with an added feature of borrowing resources from other flows in the network. The basic
37
CS 298 - Kiran Venkatesh Rangula Final Report
functioning of the module is described as follows,
• The system consists of priority based flows
• Priorities for the flows are assigned based on some predetermined requirements
• All non best effort service flows are assigned higher priorities
• Traffic transmission begins for some of the flows in the system
• BE traffic are introduced in the following ways
o All flows start at the same time
o Some Flows are introduced late into the simulation
• The BE traffic that exceeds it’s limitation is provided with a borrow option (based on Marc
Gries implementation)
• BE traffic is able to send packets at a minimum loss in comparison to other systems
The WFQ module consists of the following important functions,
void MODQ::enque(Packet *p){}
To identify packets that is ready for transmission from the system. The Dequeue function prepares to
send packets from the queue based on the completion time. It is based on the implementation from
Marc Greis.
Packet* Modq::deque(){ Packet *p;
38
CS 298 - Kiran Venkatesh Rangula Final Report
}
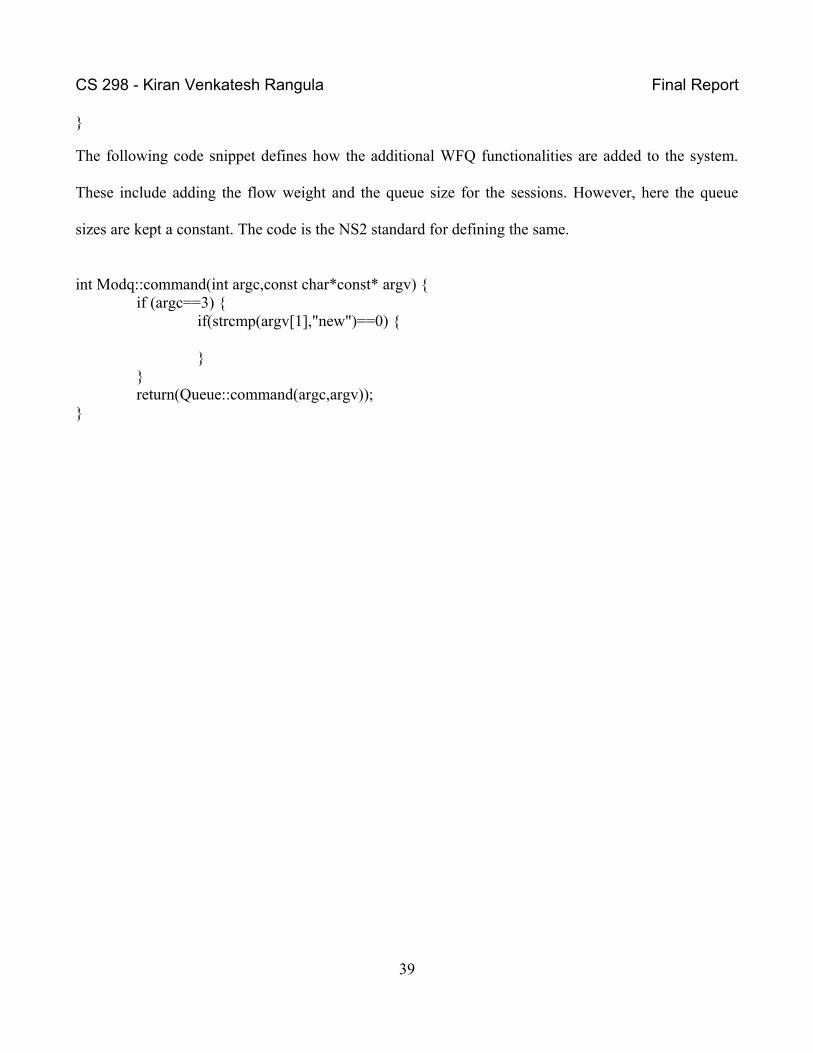
The following code snippet defines how the additional WFQ functionalities are added to the system.
These include adding the flow weight and the queue size for the sessions. However, here the queue
sizes are kept a constant. The code is the NS2 standard for defining the same.
int Modq::command(int argc,const char*const* argv) {if (argc==3) {
if(strcmp(argv[1],"new")==0) {
}}return(Queue::command(argc,argv));
}
39
CS 298 - Kiran Venkatesh Rangula Final Report
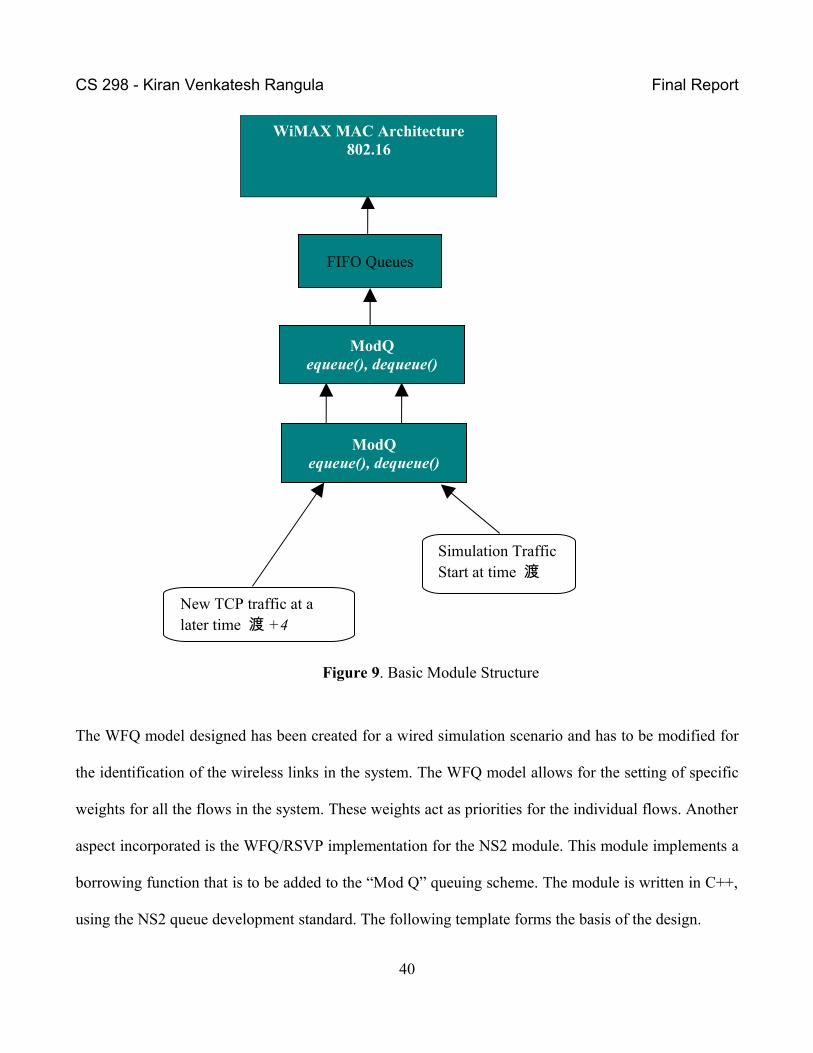
Figure 9. Basic Module Structure
The WFQ model designed has been created for a wired simulation scenario and has to be modified for
the identification of the wireless links in the system. The WFQ model allows for the setting of specific
weights for all the flows in the system. These weights act as priorities for the individual flows. Another
aspect incorporated is the WFQ/RSVP implementation for the NS2 module. This module implements a
borrowing function that is to be added to the “Mod Q” queuing scheme. The module is written in C++,
using the NS2 queue development standard. The following template forms the basis of the design.
40
ModQequeue(), dequeue()
Simulation TrafficStart at time 渡 sec�
ModQequeue(), dequeue()
FIFO Queues
New TCP traffic at a later time 渡 +4
WiMAX MAC Architecture802.16
CS 298 - Kiran Venkatesh Rangula Final Report
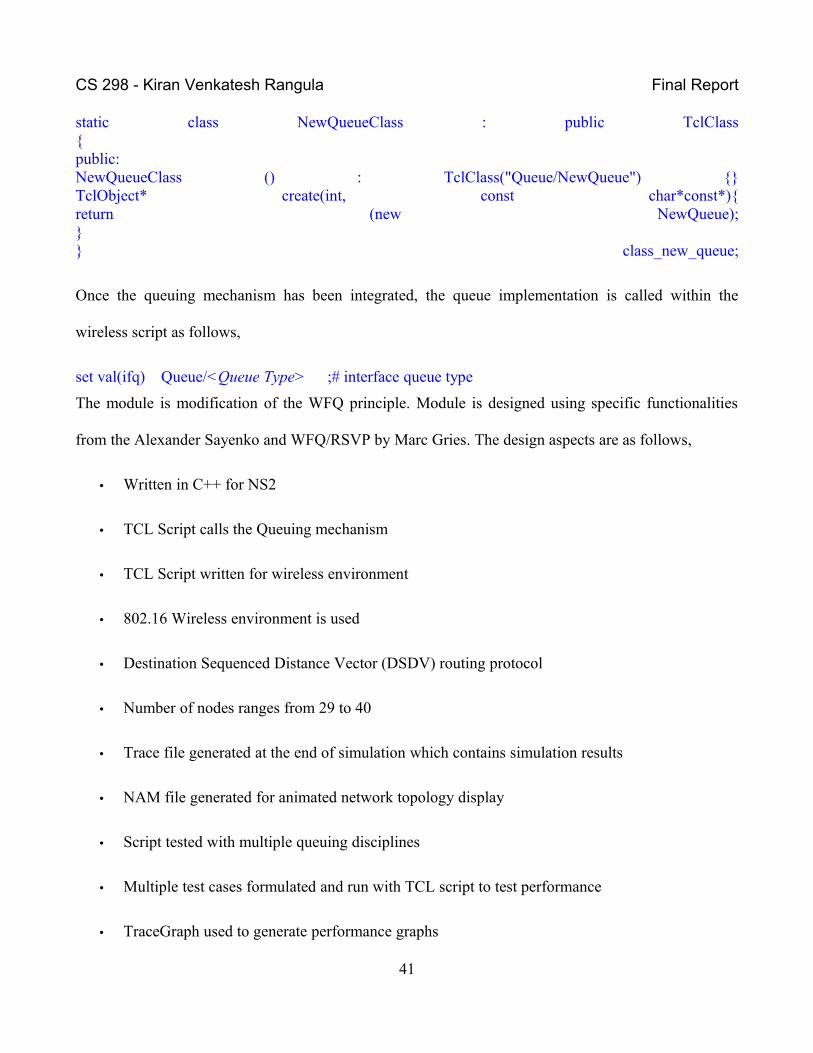
static class NewQueueClass : public TclClass{public:NewQueueClass () : TclClass("Queue/NewQueue") {}TclObject* create(int, const char*const*){return (new NewQueue);}} class_new_queue;
Once the queuing mechanism has been integrated, the queue implementation is called within the
wireless script as follows,
set val(ifq) Queue/<Queue Type> ;# interface queue type
The module is modification of the WFQ principle. Module is designed using specific functionalities
from the Alexander Sayenko and WFQ/RSVP by Marc Gries. The design aspects are as follows,
• Written in C++ for NS2
• TCL Script calls the Queuing mechanism
• TCL Script written for wireless environment
• 802.16 Wireless environment is used
• Destination Sequenced Distance Vector (DSDV) routing protocol
• Number of nodes ranges from 29 to 40
• Trace file generated at the end of simulation which contains simulation results
• NAM file generated for animated network topology display
• Script tested with multiple queuing disciplines
• Multiple test cases formulated and run with TCL script to test performance
• TraceGraph used to generate performance graphs
41
CS 298 - Kiran Venkatesh Rangula Final Report
8. Simulation:
The simulation runs are performed on the NS2 network simulator. NS2 is widely used and supported
by a large number of students and faculty alike. The NS2 version used for testing the modified queuing
scheme is NS-2.29. The NS2 simulator is implemented in primarily in C++ and utilizes Object
Oriented TCL (OTCL). Specifications of the PC on which the simulation is tested is as follows,
Operating System: Windows XP 64 Bit
Processor: Intel Pentium M 1.7 GHz
Memory: 1 Gig of RAM
The NS2 simulator is widely supported and multiple modifications are available for the same. The
network design is implemented in TCL. The TCL script defines the wireless scenario with the Base
Station and Subscriber Station. The scenario uses the WiMAX module to simulate the 802.16
environment for our test cases. The WiMAX ns2 PMP module has been developed by the Networks &
Distributed Systems Laboratory (NDSL) members, Computer Science and Information Engineering,
Chang Gung University, Taoyuan, Taiwan, under advisory of Professor Jenhui Chen [1]. The module
allows us to simulate the point to multi point scenario in NS2 environment. We are attempting to study
the performance of standard algorithms versus the proposed modification. The module supports all the
802.16 service flows. This allows testing the performance of the algorithms under varying conditions.
The simulation uses the DSDV routing protocol with the wireless PHY mac layer implementation. The
packet size of the data transmitted via the flows can be modified within the TCL script. The TCL
network scenario uses a 30 node setup with multiple subscriber stations and a base station. The
42
CS 298 - Kiran Venkatesh Rangula Final Report
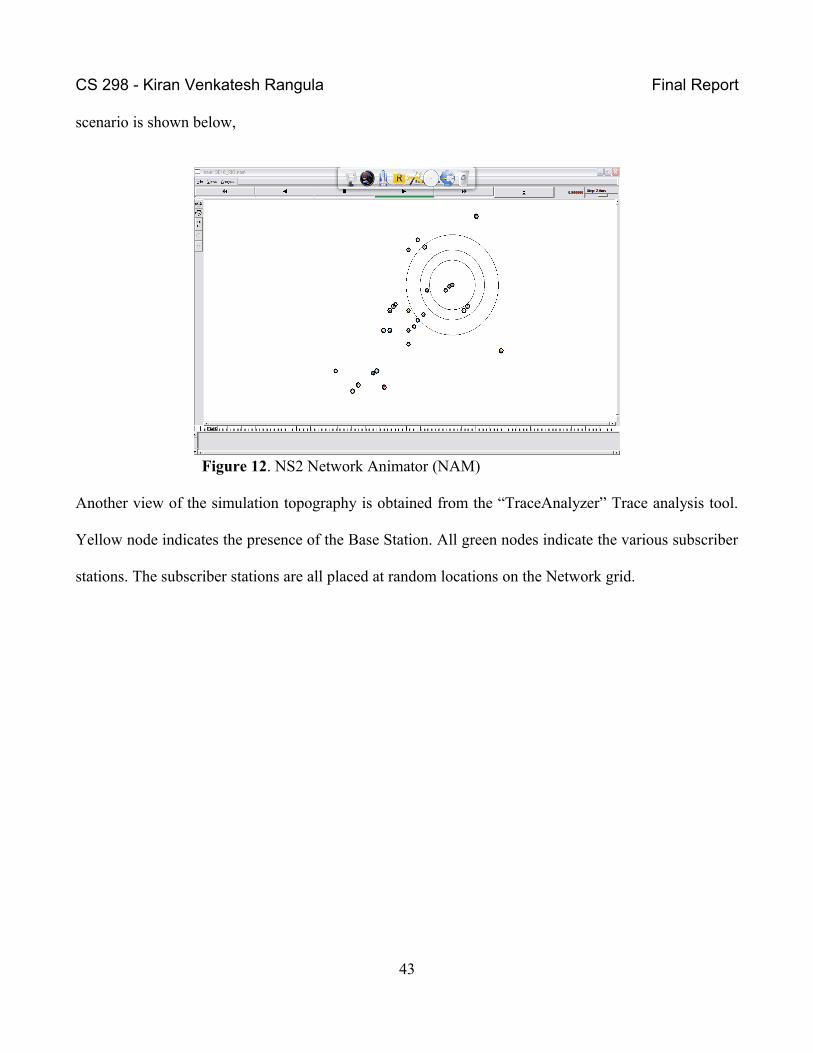
scenario is shown below,
Figure 12. NS2 Network Animator (NAM)
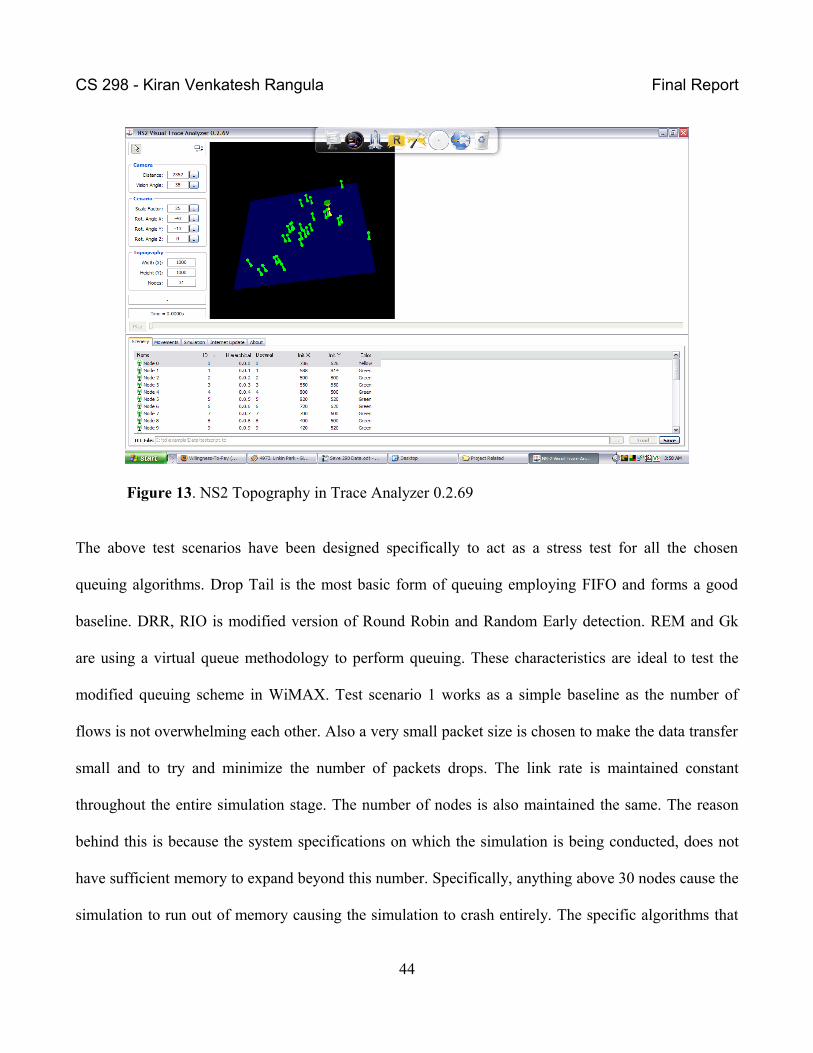
Another view of the simulation topography is obtained from the “TraceAnalyzer” Trace analysis tool.
Yellow node indicates the presence of the Base Station. All green nodes indicate the various subscriber
stations. The subscriber stations are all placed at random locations on the Network grid.
43
CS 298 - Kiran Venkatesh Rangula Final Report
Figure 13. NS2 Topography in Trace Analyzer 0.2.69
The above test scenarios have been designed specifically to act as a stress test for all the chosen
queuing algorithms. Drop Tail is the most basic form of queuing employing FIFO and forms a good
baseline. DRR, RIO is modified version of Round Robin and Random Early detection. REM and Gk
are using a virtual queue methodology to perform queuing. These characteristics are ideal to test the
modified queuing scheme in WiMAX. Test scenario 1 works as a simple baseline as the number of
flows is not overwhelming each other. Also a very small packet size is chosen to make the data transfer
small and to try and minimize the number of packets drops. The link rate is maintained constant
throughout the entire simulation stage. The number of nodes is also maintained the same. The reason
behind this is because the system specifications on which the simulation is being conducted, does not
have sufficient memory to expand beyond this number. Specifically, anything above 30 nodes cause the
simulation to run out of memory causing the simulation to crash entirely. The specific algorithms that
44
CS 298 - Kiran Venkatesh Rangula Final Report
fail with increase in node and data size are Drop Tail, DRR, RIO. ModQ, REM and Gibbens-Kelly
queuing are able to complete their simulation runs, but this is not consistent as the recurrent memory
issues, does not make the data collected to be very consistent. Test Scenario 2 uses to test the
performance of the algorithms when the number of BE flows is increased drastically and also is given
more priority and weight over all the other flows in the system. Test Scenario 3 and 4, increases the
packet sizes to 1000 and then 1500 bytes. Test Scenarios 5 and 6 return focus to BE flows with the
packet sizes increasing from 1000 to 1500 bytes.
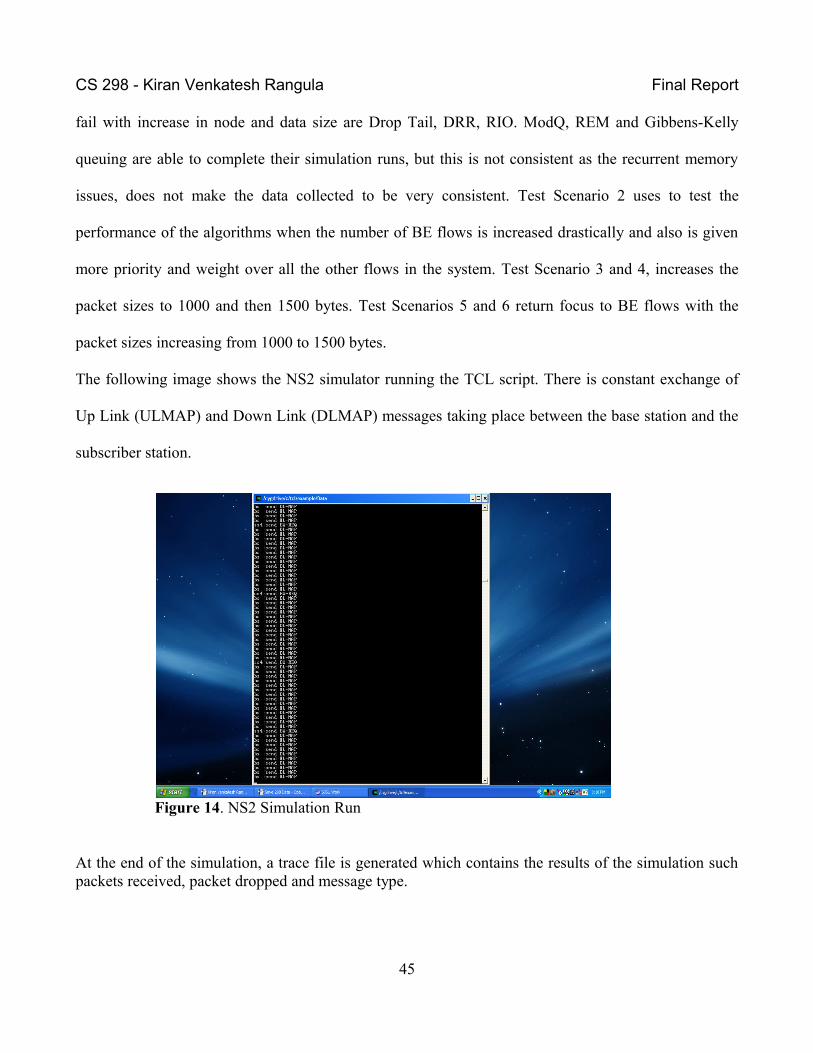
The following image shows the NS2 simulator running the TCL script. There is constant exchange of
Up Link (ULMAP) and Down Link (DLMAP) messages taking place between the base station and the
subscriber station.
Figure 14. NS2 Simulation Run
At the end of the simulation, a trace file is generated which contains the results of the simulation such packets received, packet dropped and message type.
45
CS 298 - Kiran Venkatesh Rangula Final Report
Simulation Setup:
The NS2 simulator is setup depending on the type of network being simulated, i.e. wired or wireless simulation. As WiMAX is a wireless protocol, the Object Oriented TCL (OTCL) script being setup is a wireless format. The setup begins with identifying the different aspects of the wireless network. These include the Physical Layer, the wireless channel, the queuing mechanism, queue length, simulation topography and simulation time. The syntax for setting up the same in the script is shown as follows,
set val(chan) Channel/WirelessChannel ;# Channel typeset val(prop) Propagation/TwoRayGround ;# Radio-propagation modelset val(netif) Phy/WirelessPhy ;# network interface typeset val(mac) Mac/802_16 ;# MAC typeset val(ifq) Queue/Modq ;# calls C++ implementation from queue folder of NS2 for queue typeset val(ll) LL ;# link layer typeset val(ant) Antenna/OmniAntenna ;# antenna modelset val(ifqlen) 1000 ;# max packet in the queueset val(nn) 33 ;# number of mobile nodesset val(rp) DSDV ;# routing protocolset val(x) 1000 ;# X dimension of topographyset val(y) 1000 ;# Y dimension of topographyset val(stop) 30.0 ;# time of simulation end
The data from an NS2 simulation is the final output of the simulation. This trace file contains the results of the simulation such as number of packets received, packets dropped, packets sent etc. This is also obtained from the TCL NS2 setup. In addition to this, we also retrieve a “nam” file which is a animated representation of the simulation itself.
source wf2qutils.tclset ns [new Simulator]set tracefd [open 15_REM.tr w] ;# Trace File nameset namtrace [open 15_REM.nam w] ;# NAM file name
After setting up the initial environment setup, we proceed to create the nodes in the simulation. This includes the base station and the subscriber stations. This includes defining the position of the node in the simulated environment. The syntax is as follows.
set node_(0) [$ns node]$node_(0) set X_ 736$node_(0) set Y_ 626$node_(0) set Z_ 0.0$ns initial_node_pos $node_(0) 20
For the purpose of this simulation, there are 40 such nodes, each with it’s own unique position in the simulation topography. After defining the positions of the nodes, the next step in the setup is to define the individual flows for the individual nodes. These flows can be any of the WiMAX service flows
46
CS 298 - Kiran Venkatesh Rangula Final Report
described earlier. This flow setup defines the flow id, traffic type, connecting node, packet size and link rate. A sample definition for UDP traffic type rtPS is shown below.
set udp2 [new Agent/UDP]$ns attach-agent $node_(3) $udp2set null2 [new Agent/Null]$ns attach-agent $node_(0) $null2$ns connect $udp2 $null2$udp2 set fid_ 2set cbr2 [new Application/Traffic/rtPS]$cbr2 attach-agent $udp1$cbr2 set type_ rtPS$cbr2 set packet_size_ 1000$cbr2 set rate_ 512Kb $cbr2 set random_ false
The trace file generated has the following content,
s 0.000100840 _0_ MAC --- 0 UCD 204 [0 0 ffff0000 0] ------- [0:0 0:0 0 0] r 0.000100897 _6_ MAC --- 0 DLMAP 24 [0 0 ffff0000 0] ------- [0:0 0:0 0 0]
The trace file can read using the following commands executed in the cygwin shell,
cat 15k_REM.tr | grep MAC | grep BE | grep ^r | wc --------(1)cat 15k_REM.tr | grep RTR | grep BE | grep ^D | wc --------(2)
The first command will return the number of received packets for BE traffic type, while the second command returns the dropped packets. The commands are reading the trace file 15k_REM.tr. The file name can be replaced to read the file of choice. The output of the command is as follows,
krangula@USSCADPINTERN /cygdrive/c/Final Build------------(1)$ cat 15k_REM.tr | grep MAC | grep BE | grep ^r | wc 22 374 1672
krangula@USSCADPINTERN /cygdrive/c/Final Build-------------(2)$ cat 15k_REM.tr | grep MAC | grep BE | grep ^D | wc 0 0 0
The above set of outputs show 22 received packets and zero dropped packets. The performance of the simulation largely depends on the hardware. For large number of flows with extremely long running times can be very taxing on the system. The NS 2 version being used here utilizes the scheduler patch released to improve the timing of the simulator runs.
47
CS 298 - Kiran Venkatesh Rangula Final Report
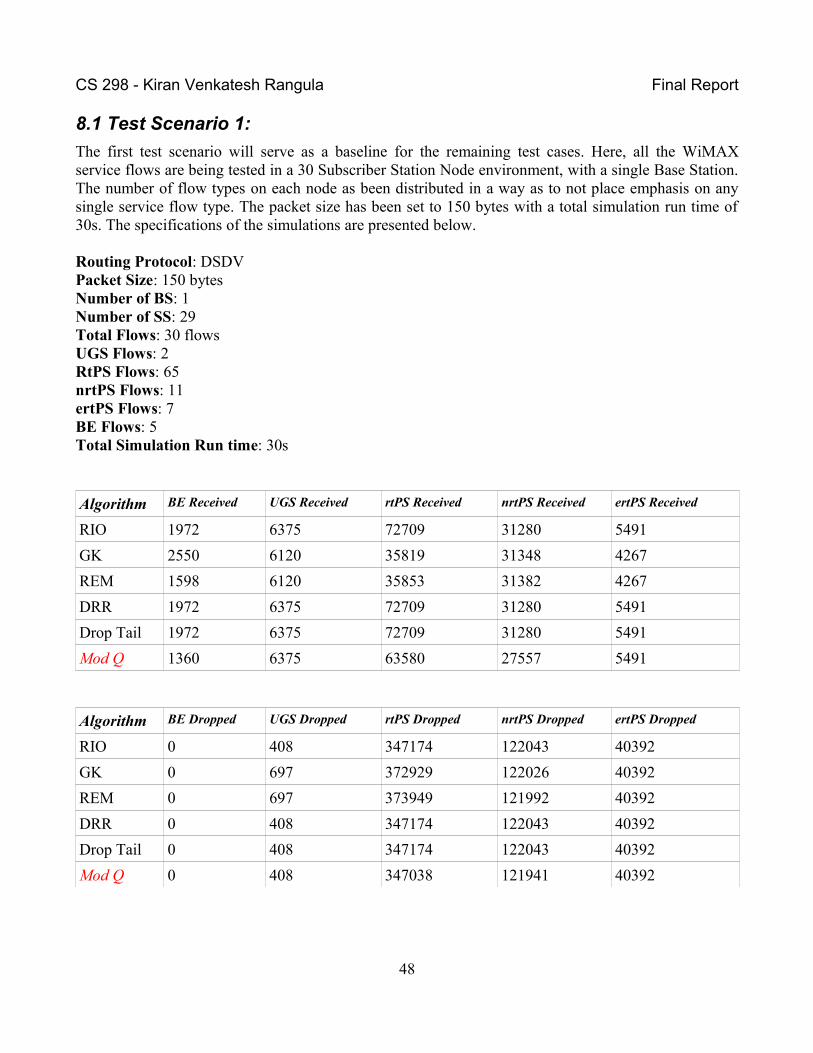
8.1 Test Scenario 1:
The first test scenario will serve as a baseline for the remaining test cases. Here, all the WiMAX service flows are being tested in a 30 Subscriber Station Node environment, with a single Base Station. The number of flow types on each node as been distributed in a way as to not place emphasis on any single service flow type. The packet size has been set to 150 bytes with a total simulation run time of 30s. The specifications of the simulations are presented below.
Routing Protocol: DSDVPacket Size: 150 bytesNumber of BS: 1Number of SS: 29Total Flows: 30 flowsUGS Flows: 2RtPS Flows: 65nrtPS Flows: 11ertPS Flows: 7BE Flows: 5Total Simulation Run time: 30s
Algorithm BE Received UGS Received rtPS Received nrtPS Received ertPS Received
RIO 1972 6375 72709 31280 5491
GK 2550 6120 35819 31348 4267
REM 1598 6120 35853 31382 4267
DRR 1972 6375 72709 31280 5491
Drop Tail 1972 6375 72709 31280 5491
Mod Q 1360 6375 63580 27557 5491
Algorithm BE Dropped UGS Dropped rtPS Dropped nrtPS Dropped ertPS Dropped
RIO 0 408 347174 122043 40392
GK 0 697 372929 122026 40392
REM 0 697 373949 121992 40392
DRR 0 408 347174 122043 40392
Drop Tail 0 408 347174 122043 40392
Mod Q 0 408 347038 121941 40392
48
CS 298 - Kiran Venkatesh Rangula Final Report
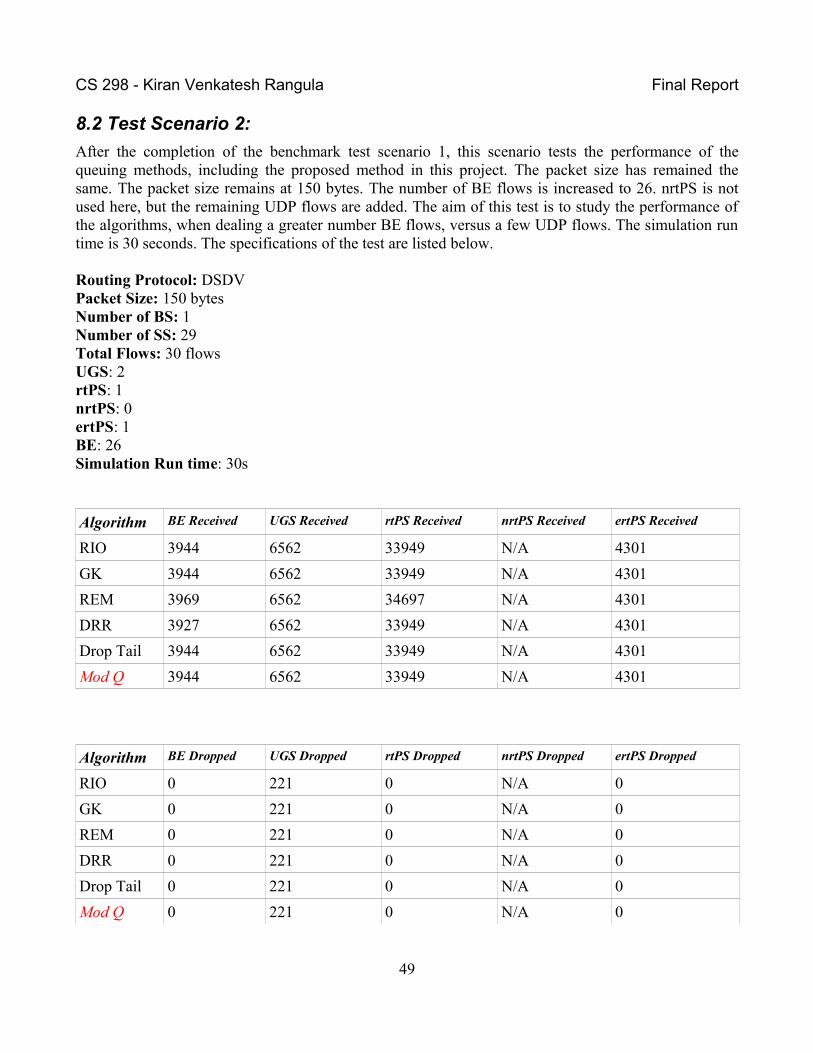
8.2 Test Scenario 2:
After the completion of the benchmark test scenario 1, this scenario tests the performance of the queuing methods, including the proposed method in this project. The packet size has remained the same. The packet size remains at 150 bytes. The number of BE flows is increased to 26. nrtPS is not used here, but the remaining UDP flows are added. The aim of this test is to study the performance of the algorithms, when dealing a greater number BE flows, versus a few UDP flows. The simulation run time is 30 seconds. The specifications of the test are listed below.
Routing Protocol: DSDVPacket Size: 150 bytesNumber of BS: 1Number of SS: 29Total Flows: 30 flowsUGS: 2rtPS: 1nrtPS: 0ertPS: 1BE: 26Simulation Run time: 30s
Algorithm BE Received UGS Received rtPS Received nrtPS Received ertPS Received
RIO 3944 6562 33949 N/A 4301
GK 3944 6562 33949 N/A 4301
REM 3969 6562 34697 N/A 4301
DRR 3927 6562 33949 N/A 4301
Drop Tail 3944 6562 33949 N/A 4301
Mod Q 3944 6562 33949 N/A 4301
Algorithm BE Dropped UGS Dropped rtPS Dropped nrtPS Dropped ertPS Dropped
RIO 0 221 0 N/A 0
GK 0 221 0 N/A 0
REM 0 221 0 N/A 0
DRR 0 221 0 N/A 0
Drop Tail 0 221 0 N/A 0
Mod Q 0 221 0 N/A 0
49

CS 298 - Kiran Venkatesh Rangula Final Report
8.3 Test Scenario 3:
The following scenario uses the same specifications as test scenario 1. The number of flows is no longer emphasized on a single flow. The packet size is increased from 150 bytes to 1500 bytes for all the flows. This will allow us to look at the performance of the algorithm under heavier data load. The packet loss generated will allow us to study how the proposed algorithm is able to handle the data load in comparison with the other queuing schemes.
Routing Protocol: DSDVPacket Size: 1000 bytesNumber of BS: 1Number of SS: 29Total Flows: 30 flowsUGS Flows: 2rtPS Flows: 6nrtPS Flows: 11ertPS Flows: 7BE Flows: 5Simulation Run time: 30s
Algorithm BE Received UGS Received rtPS Received nrtPS Received ertPS Received
RIO 2550 6120 35819 31348 4267
GK 2550 6120 35819 31348 4267
REM 1598 6120 35853 31382 4267
DRR 2550 6120 35819 31348 4267
DropTail 2550 6120 35819 31348 4267
Mod Q 1207 6120 31688 27217 4267
Algorithm BE Dropped UGS Dropped rtPS Dropped nrtPS Dropped ertPS Dropped
RIO 0 697 372929 122026 40392
GK 0 697 372929 122026 40392
REM 0 697 373949 121992 40392
DRR 0 697 372929 122026 40392
DropTail 0 697 372969 122026 40392
Mod Q 0 697 372861 121958 40392
50
CS 298 - Kiran Venkatesh Rangula Final Report
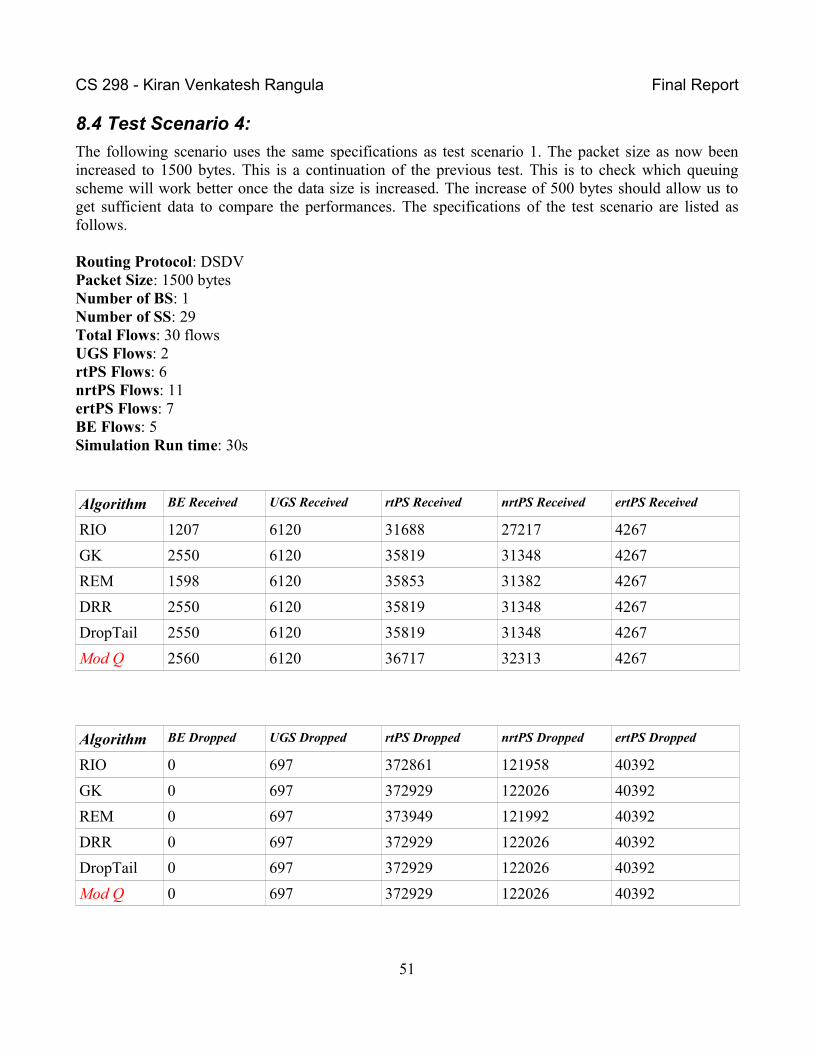
8.4 Test Scenario 4:
The following scenario uses the same specifications as test scenario 1. The packet size as now been increased to 1500 bytes. This is a continuation of the previous test. This is to check which queuing scheme will work better once the data size is increased. The increase of 500 bytes should allow us to get sufficient data to compare the performances. The specifications of the test scenario are listed as follows.
Routing Protocol: DSDVPacket Size: 1500 bytesNumber of BS: 1Number of SS: 29Total Flows: 30 flowsUGS Flows: 2rtPS Flows: 6nrtPS Flows: 11ertPS Flows: 7BE Flows: 5Simulation Run time: 30s
Algorithm BE Received UGS Received rtPS Received nrtPS Received ertPS Received
RIO 1207 6120 31688 27217 4267
GK 2550 6120 35819 31348 4267
REM 1598 6120 35853 31382 4267
DRR 2550 6120 35819 31348 4267
DropTail 2550 6120 35819 31348 4267
Mod Q 2560 6120 36717 32313 4267
Algorithm BE Dropped UGS Dropped rtPS Dropped nrtPS Dropped ertPS Dropped
RIO 0 697 372861 121958 40392
GK 0 697 372929 122026 40392
REM 0 697 373949 121992 40392
DRR 0 697 372929 122026 40392
DropTail 0 697 372929 122026 40392
Mod Q 0 697 372929 122026 40392
51
CS 298 - Kiran Venkatesh Rangula Final Report
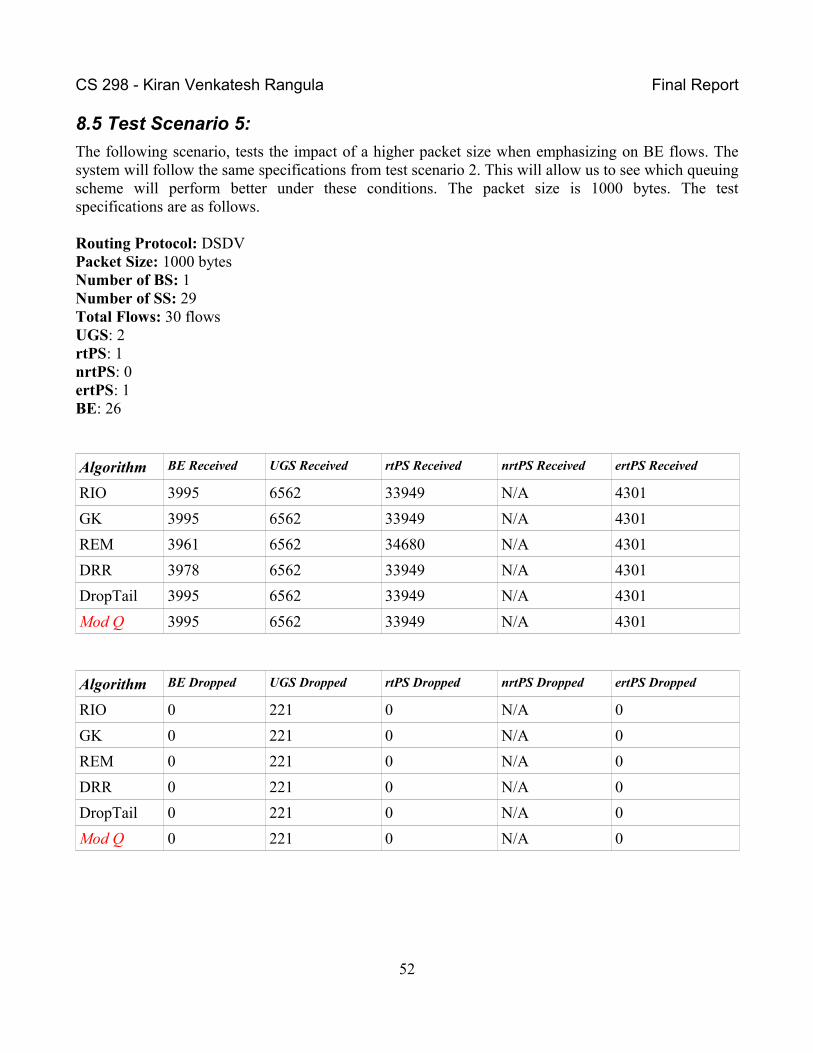
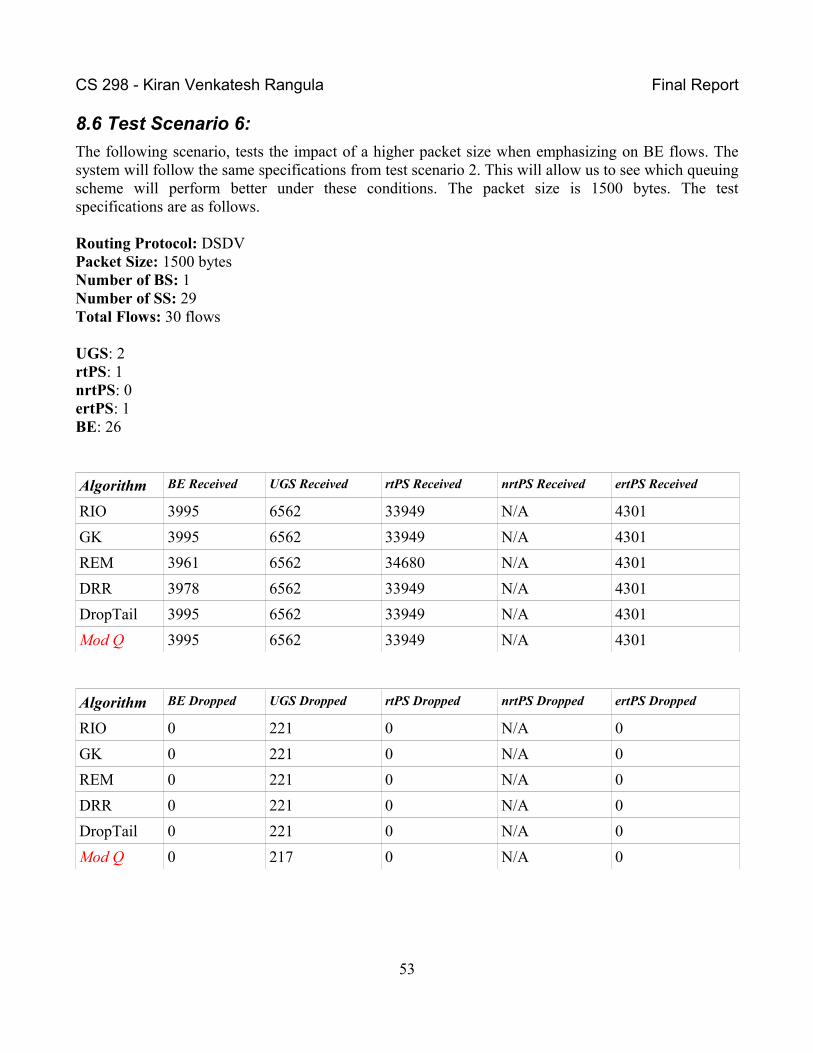
8.5 Test Scenario 5:
The following scenario, tests the impact of a higher packet size when emphasizing on BE flows. The system will follow the same specifications from test scenario 2. This will allow us to see which queuing scheme will perform better under these conditions. The packet size is 1000 bytes. The test specifications are as follows.
Routing Protocol: DSDVPacket Size: 1000 bytesNumber of BS: 1Number of SS: 29Total Flows: 30 flowsUGS: 2rtPS: 1nrtPS: 0ertPS: 1BE: 26
Algorithm BE Received UGS Received rtPS Received nrtPS Received ertPS Received
RIO 3995 6562 33949 N/A 4301
GK 3995 6562 33949 N/A 4301
REM 3961 6562 34680 N/A 4301
DRR 3978 6562 33949 N/A 4301
DropTail 3995 6562 33949 N/A 4301
Mod Q 3995 6562 33949 N/A 4301
Algorithm BE Dropped UGS Dropped rtPS Dropped nrtPS Dropped ertPS Dropped
RIO 0 221 0 N/A 0
GK 0 221 0 N/A 0
REM 0 221 0 N/A 0
DRR 0 221 0 N/A 0
DropTail 0 221 0 N/A 0
Mod Q 0 221 0 N/A 0
52
CS 298 - Kiran Venkatesh Rangula Final Report
8.6 Test Scenario 6:
The following scenario, tests the impact of a higher packet size when emphasizing on BE flows. The system will follow the same specifications from test scenario 2. This will allow us to see which queuing scheme will perform better under these conditions. The packet size is 1500 bytes. The test specifications are as follows.
Routing Protocol: DSDVPacket Size: 1500 bytesNumber of BS: 1Number of SS: 29Total Flows: 30 flows
UGS: 2rtPS: 1nrtPS: 0ertPS: 1BE: 26
Algorithm BE Received UGS Received rtPS Received nrtPS Received ertPS Received
RIO 3995 6562 33949 N/A 4301
GK 3995 6562 33949 N/A 4301
REM 3961 6562 34680 N/A 4301
DRR 3978 6562 33949 N/A 4301
DropTail 3995 6562 33949 N/A 4301
Mod Q 3995 6562 33949 N/A 4301
Algorithm BE Dropped UGS Dropped rtPS Dropped nrtPS Dropped ertPS Dropped
RIO 0 221 0 N/A 0
GK 0 221 0 N/A 0
REM 0 221 0 N/A 0
DRR 0 221 0 N/A 0
DropTail 0 221 0 N/A 0
Mod Q 0 217 0 N/A 0
53
CS 298 - Kiran Venkatesh Rangula Final Report
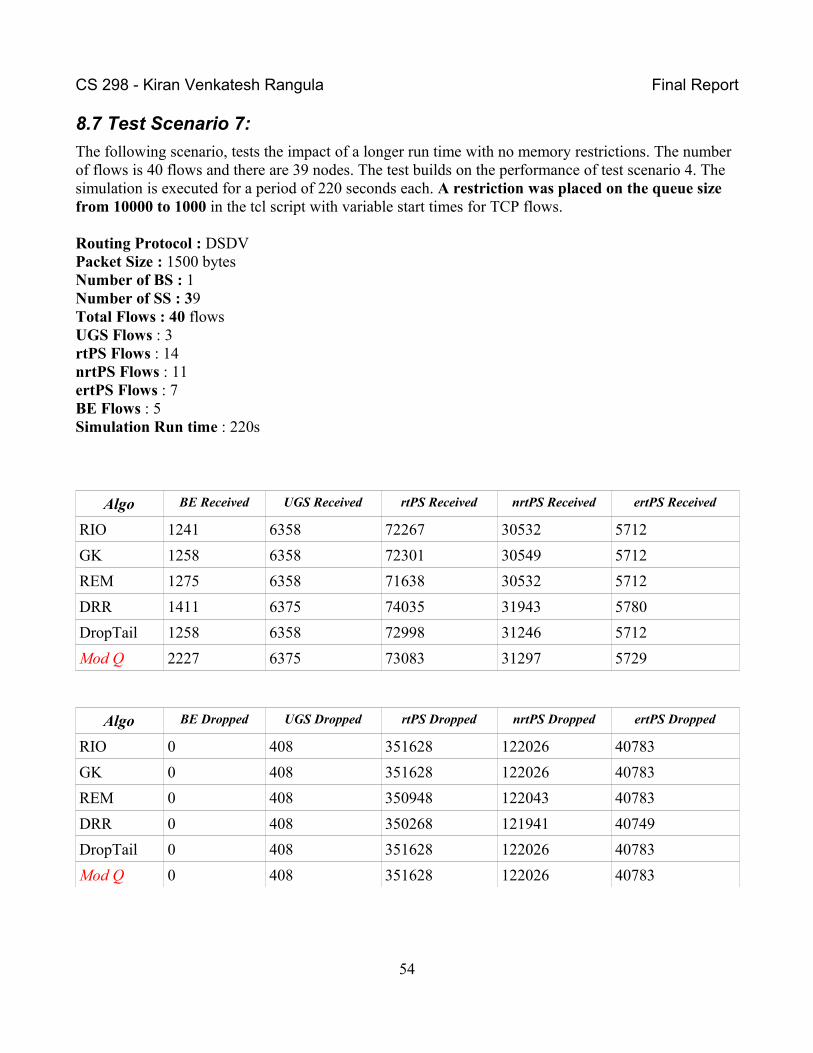
8.7 Test Scenario 7:
The following scenario, tests the impact of a longer run time with no memory restrictions. The number of flows is 40 flows and there are 39 nodes. The test builds on the performance of test scenario 4. The simulation is executed for a period of 220 seconds each. A restriction was placed on the queue size from 10000 to 1000 in the tcl script with variable start times for TCP flows.
Routing Protocol : DSDVPacket Size : 1500 bytesNumber of BS : 1Number of SS : 39Total Flows : 40 flowsUGS Flows : 3rtPS Flows : 14nrtPS Flows : 11ertPS Flows : 7BE Flows : 5Simulation Run time : 220s
Algo BE Received UGS Received rtPS Received nrtPS Received ertPS Received
RIO 1241 6358 72267 30532 5712
GK 1258 6358 72301 30549 5712
REM 1275 6358 71638 30532 5712
DRR 1411 6375 74035 31943 5780
DropTail 1258 6358 72998 31246 5712
Mod Q 2227 6375 73083 31297 5729
Algo BE Dropped UGS Dropped rtPS Dropped nrtPS Dropped ertPS Dropped
RIO 0 408 351628 122026 40783
GK 0 408 351628 122026 40783
REM 0 408 350948 122043 40783
DRR 0 408 350268 121941 40749
DropTail 0 408 351628 122026 40783
Mod Q 0 408 351628 122026 40783
54
CS 298 - Kiran Venkatesh Rangula Final Report
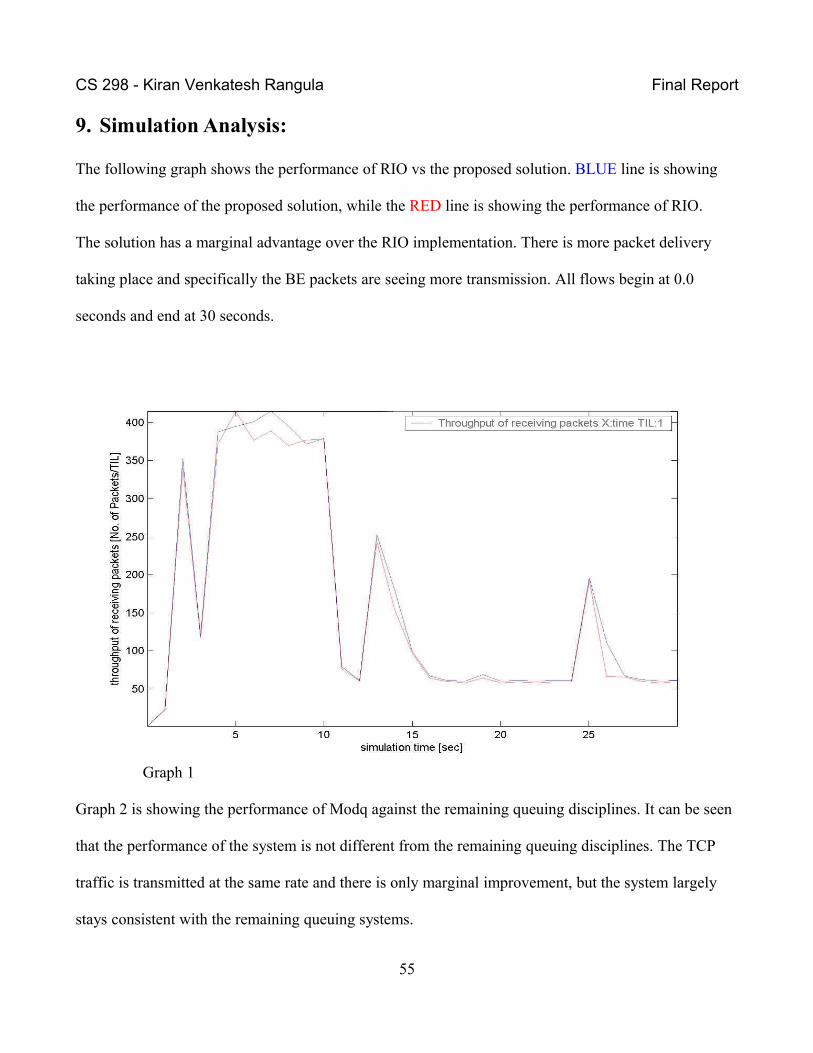
9. Simulation Analysis:
The following graph shows the performance of RIO vs the proposed solution. BLUE line is showing
the performance of the proposed solution, while the RED line is showing the performance of RIO.
The solution has a marginal advantage over the RIO implementation. There is more packet delivery
taking place and specifically the BE packets are seeing more transmission. All flows begin at 0.0
seconds and end at 30 seconds.
Graph 1
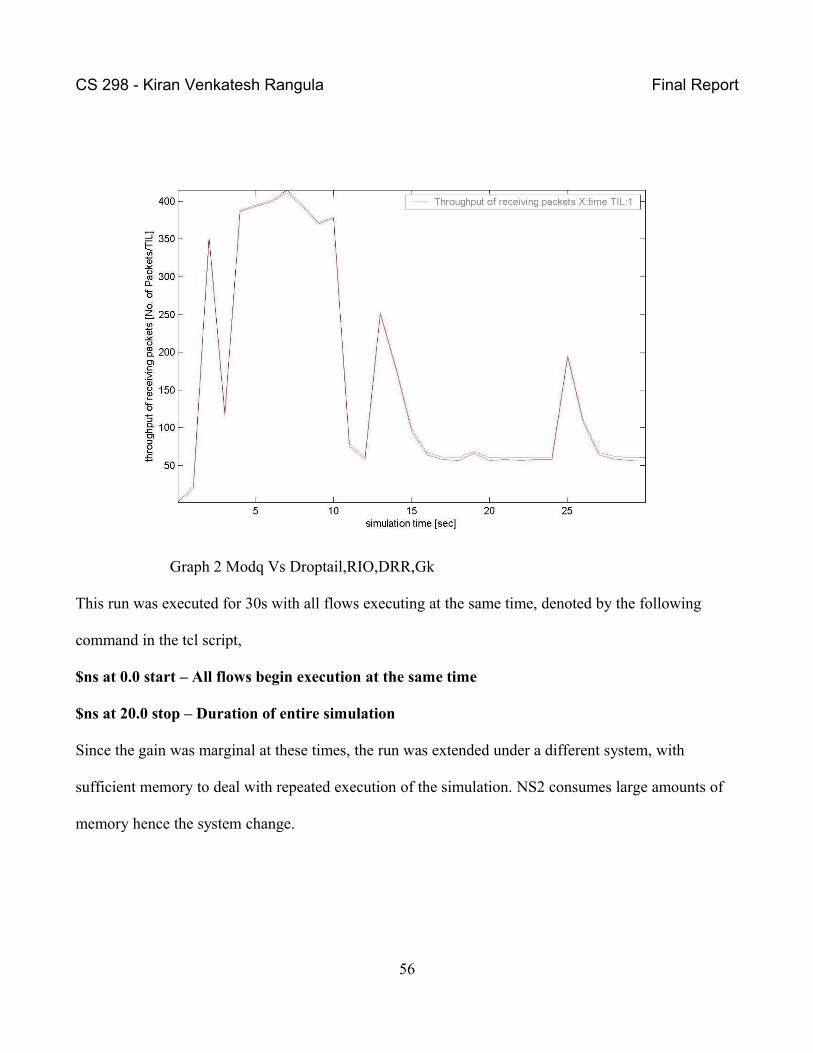
Graph 2 is showing the performance of Modq against the remaining queuing disciplines. It can be seen
that the performance of the system is not different from the remaining queuing disciplines. The TCP
traffic is transmitted at the same rate and there is only marginal improvement, but the system largely
stays consistent with the remaining queuing systems.
55
CS 298 - Kiran Venkatesh Rangula Final Report
Graph 2 Modq Vs Droptail,RIO,DRR,Gk
This run was executed for 30s with all flows executing at the same time, denoted by the following
command in the tcl script,
$ns at 0.0 start – All flows begin execution at the same time
$ns at 20.0 stop – Duration of entire simulation
Since the gain was marginal at these times, the run was extended under a different system, with
sufficient memory to deal with repeated execution of the simulation. NS2 consumes large amounts of
memory hence the system change.
56
CS 298 - Kiran Venkatesh Rangula Final Report
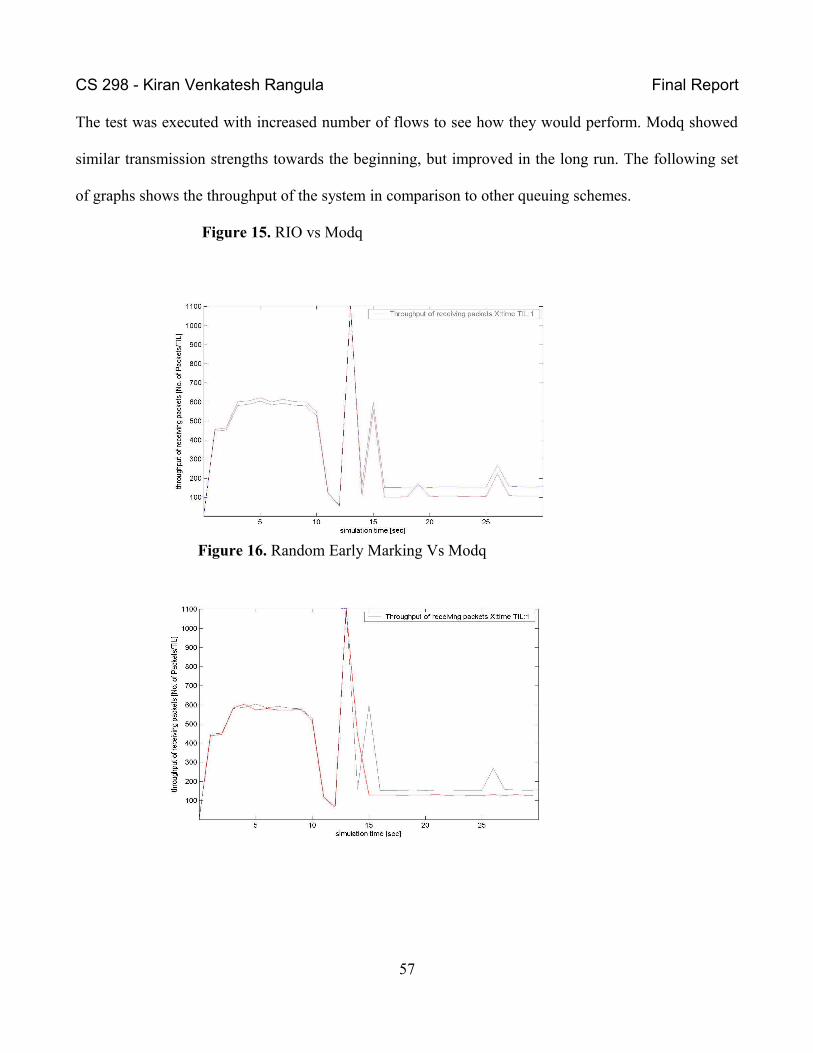
The test was executed with increased number of flows to see how they would perform. Modq showed
similar transmission strengths towards the beginning, but improved in the long run. The following set
of graphs shows the throughput of the system in comparison to other queuing schemes.
Figure 15. RIO vs Modq
Figure 16. Random Early Marking Vs Modq
57
CS 298 - Kiran Venkatesh Rangula Final Report
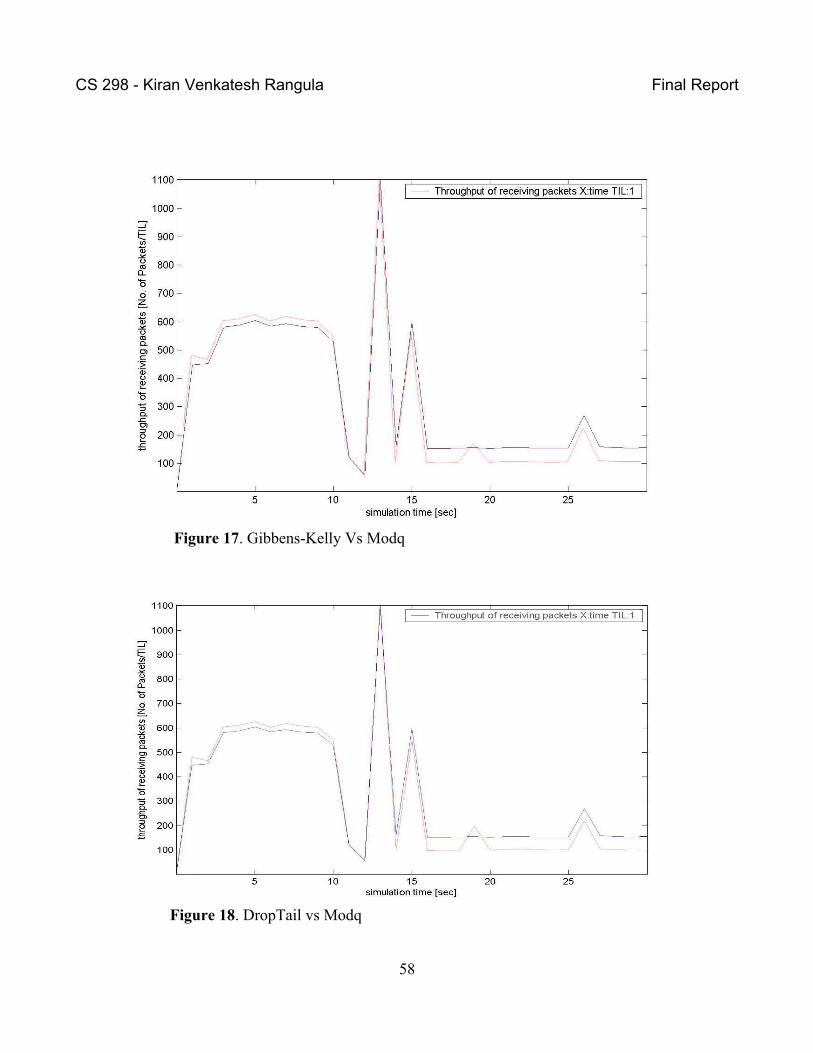
Figure 17. Gibbens-Kelly Vs Modq
Figure 18. DropTail vs Modq
58
CS 298 - Kiran Venkatesh Rangula Final Report
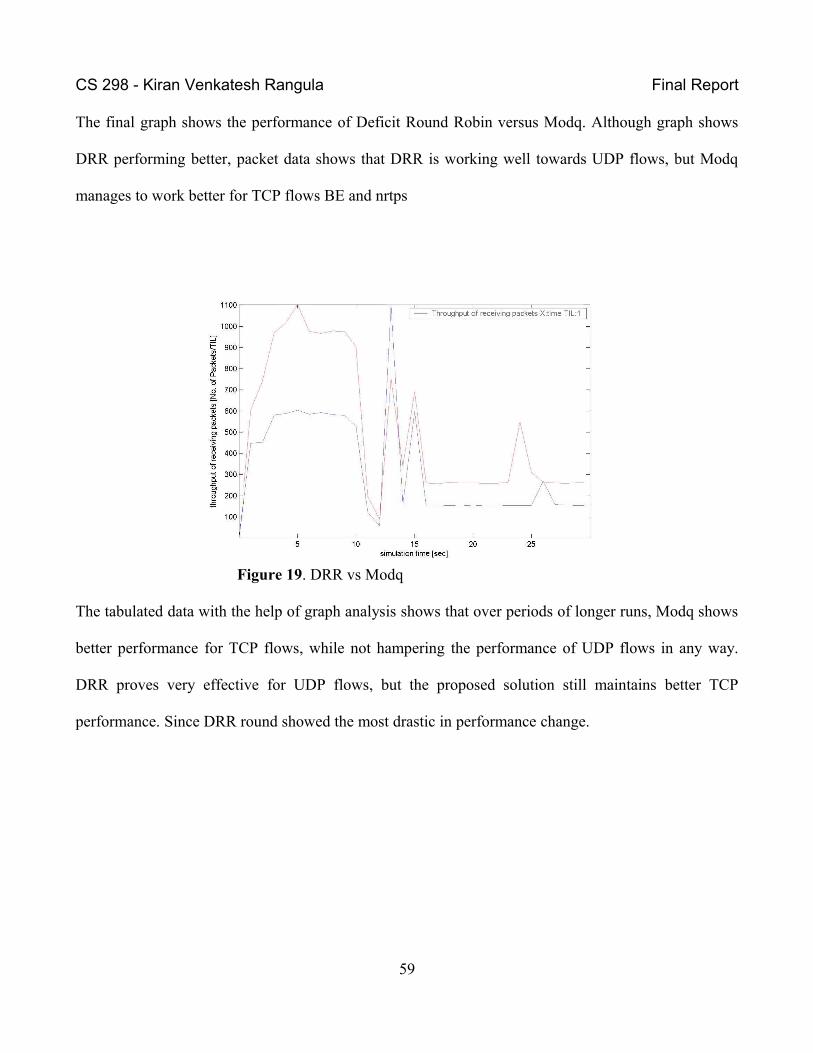
The final graph shows the performance of Deficit Round Robin versus Modq. Although graph shows
DRR performing better, packet data shows that DRR is working well towards UDP flows, but Modq
manages to work better for TCP flows BE and nrtps
Figure 19. DRR vs Modq
The tabulated data with the help of graph analysis shows that over periods of longer runs, Modq shows
better performance for TCP flows, while not hampering the performance of UDP flows in any way.
DRR proves very effective for UDP flows, but the proposed solution still maintains better TCP
performance. Since DRR round showed the most drastic in performance change.
59
CS 298 - Kiran Venkatesh Rangula Final Report
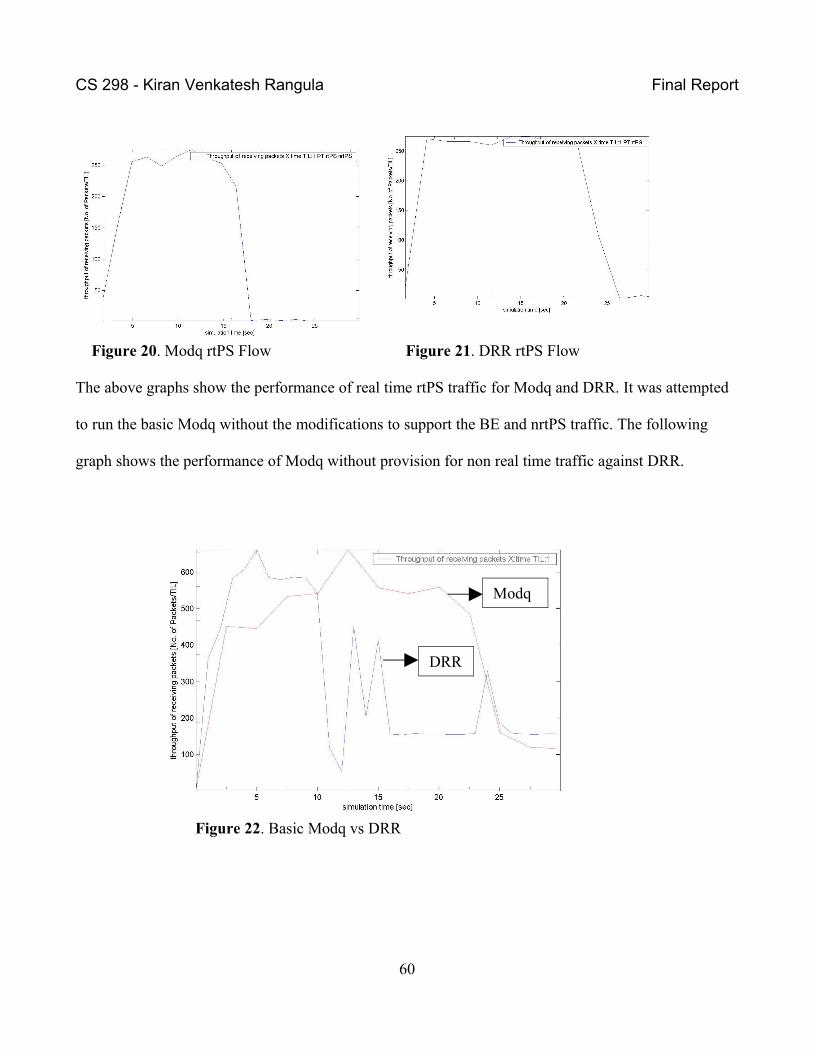
Figure 20. Modq rtPS Flow Figure 21. DRR rtPS Flow
The above graphs show the performance of real time rtPS traffic for Modq and DRR. It was attempted
to run the basic Modq without the modifications to support the BE and nrtPS traffic. The following
graph shows the performance of Modq without provision for non real time traffic against DRR.
Figure 22. Basic Modq vs DRR
60
Modq
DRR
CS 298 - Kiran Venkatesh Rangula Final Report
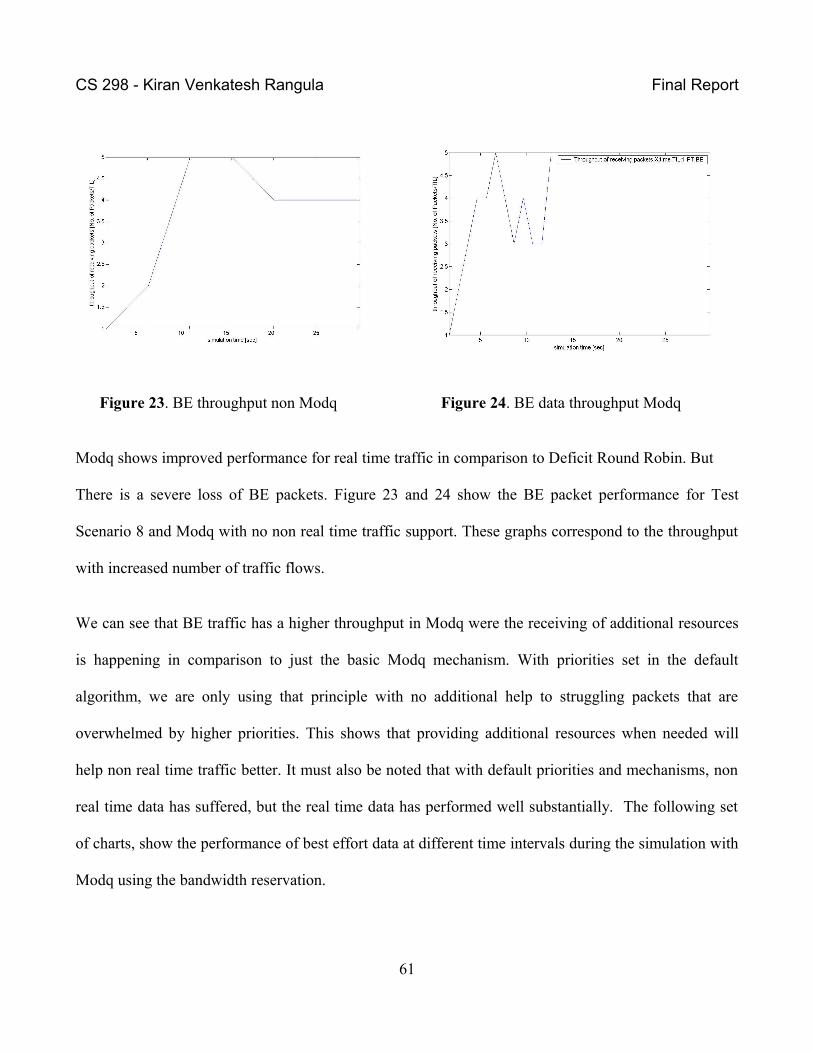
Figure 23. BE throughput non Modq Figure 24. BE data throughput Modq
Modq shows improved performance for real time traffic in comparison to Deficit Round Robin. But
There is a severe loss of BE packets. Figure 23 and 24 show the BE packet performance for Test
Scenario 8 and Modq with no non real time traffic support. These graphs correspond to the throughput
with increased number of traffic flows.
We can see that BE traffic has a higher throughput in Modq were the receiving of additional resources
is happening in comparison to just the basic Modq mechanism. With priorities set in the default
algorithm, we are only using that principle with no additional help to struggling packets that are
overwhelmed by higher priorities. This shows that providing additional resources when needed will
help non real time traffic better. It must also be noted that with default priorities and mechanisms, non
real time data has suffered, but the real time data has performed well substantially. The following set
of charts, show the performance of best effort data at different time intervals during the simulation with
Modq using the bandwidth reservation.
61
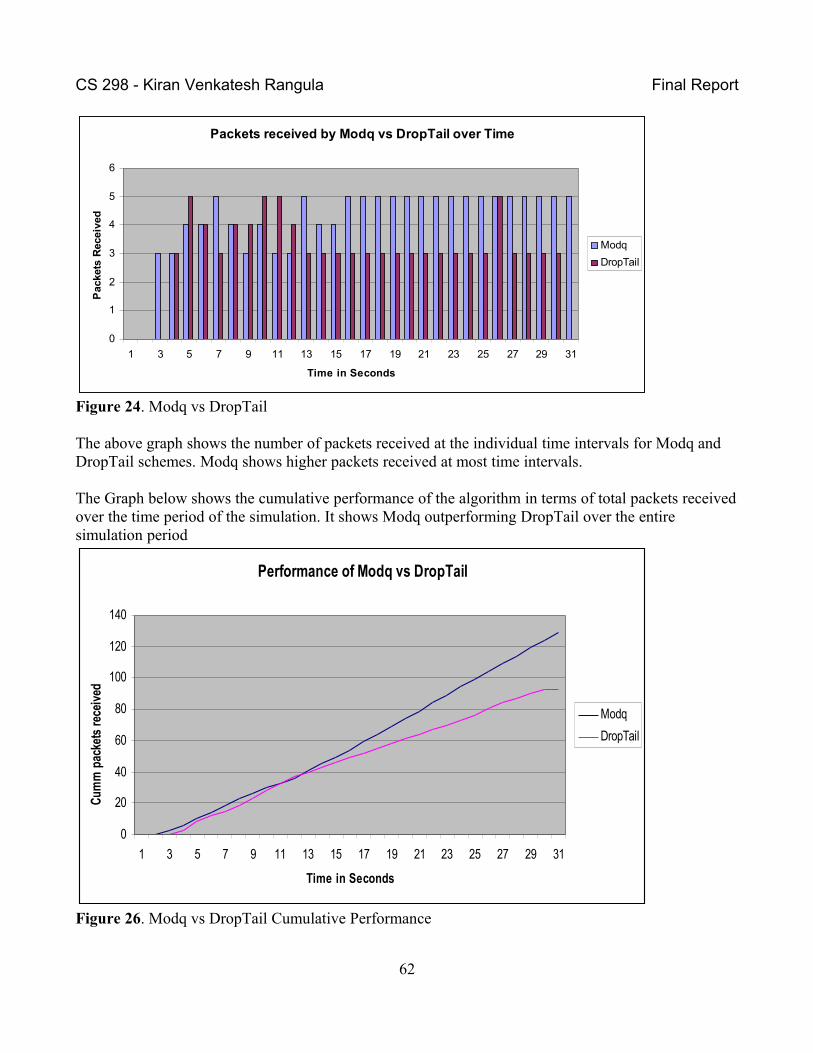
CS 298 - Kiran Venkatesh Rangula Final Report
Packets received by Modq vs DropTail over Time
0
1
2
3
4
5
6
1 3 5 7 9 11 13 15 17 19 21 23 25 27 29 31
Time in Seconds
Pac
kets
Rec
eive
d
Modq
DropTail
Figure 24. Modq vs DropTail
The above graph shows the number of packets received at the individual time intervals for Modq and DropTail schemes. Modq shows higher packets received at most time intervals.
The Graph below shows the cumulative performance of the algorithm in terms of total packets received over the time period of the simulation. It shows Modq outperforming DropTail over the entire simulation period
Performance of Modq vs DropTail
0
20
40
60
80
100
120
140
1 3 5 7 9 11 13 15 17 19 21 23 25 27 29 31
Time in Seconds
Cum
m p
acke
ts re
ceiv
ed
Modq
DropTail
Figure 26. Modq vs DropTail Cumulative Performance
62
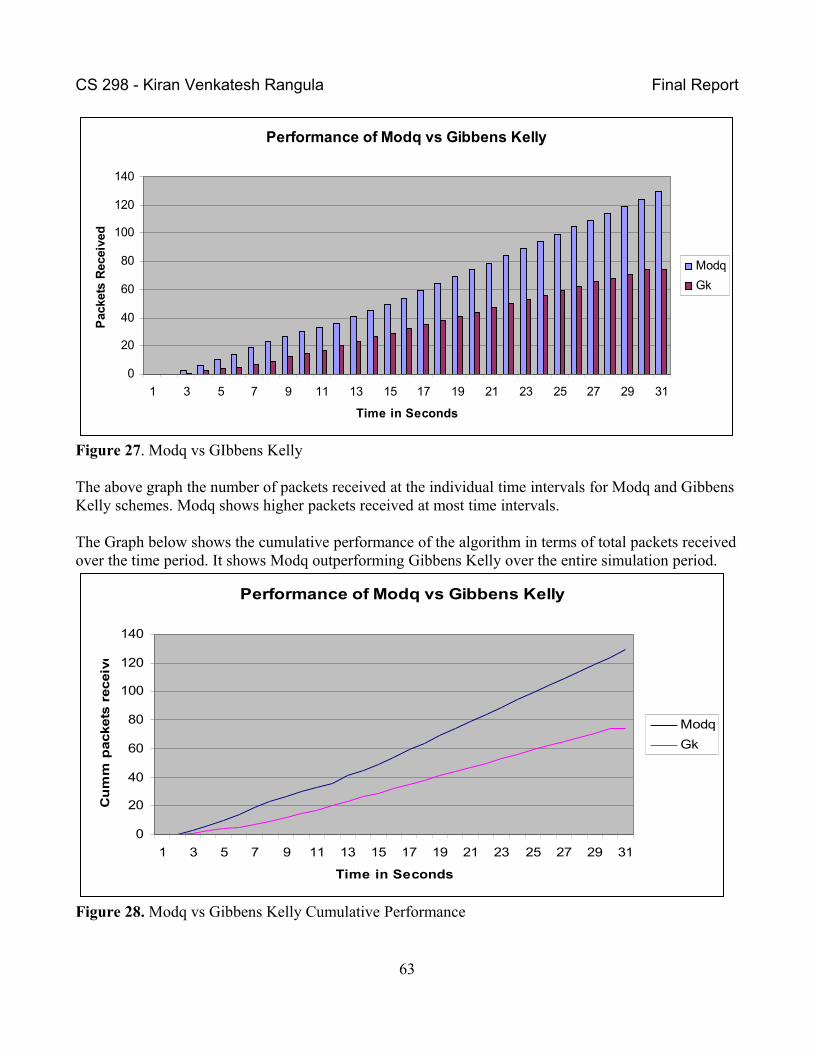
CS 298 - Kiran Venkatesh Rangula Final Report
Performance of Modq vs Gibbens Kelly
0
20
40
60
80
100
120
140
1 3 5 7 9 11 13 15 17 19 21 23 25 27 29 31
Time in Seconds
Pac
kets
Rec
eive
d
Modq
Gk
Figure 27. Modq vs GIbbens Kelly
The above graph the number of packets received at the individual time intervals for Modq and Gibbens Kelly schemes. Modq shows higher packets received at most time intervals.
The Graph below shows the cumulative performance of the algorithm in terms of total packets received over the time period. It shows Modq outperforming Gibbens Kelly over the entire simulation period.
Performance of Modq vs Gibbens Kelly
0
20
40
60
80
100
120
140
1 3 5 7 9 11 13 15 17 19 21 23 25 27 29 31
Time in Seconds
Cu
mm
packets
receiv
ed
Modq
Gk
Figure 28. Modq vs Gibbens Kelly Cumulative Performance
63
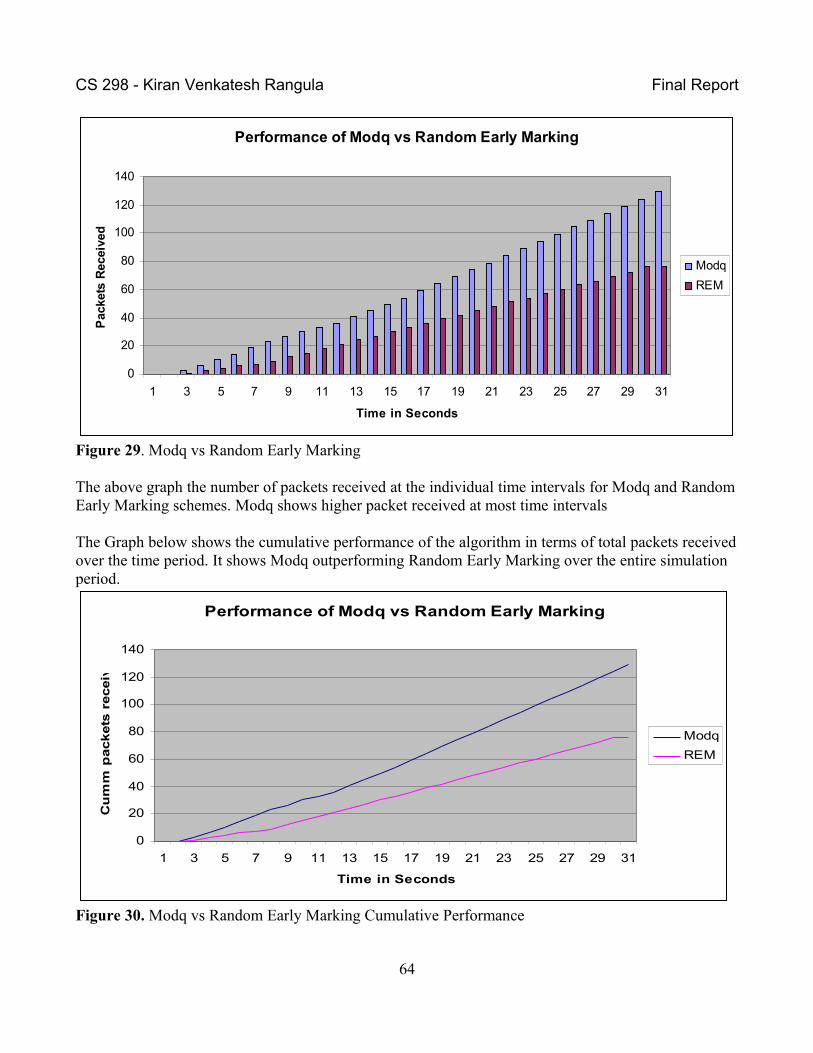
CS 298 - Kiran Venkatesh Rangula Final Report
Performance of Modq vs Random Early Marking
0
20
40
60
80
100
120
140
1 3 5 7 9 11 13 15 17 19 21 23 25 27 29 31
Time in Seconds
Pac
kets
Rec
eive
d
Modq
REM
Figure 29. Modq vs Random Early Marking
The above graph the number of packets received at the individual time intervals for Modq and Random Early Marking schemes. Modq shows higher packet received at most time intervals
The Graph below shows the cumulative performance of the algorithm in terms of total packets received over the time period. It shows Modq outperforming Random Early Marking over the entire simulation period.
Performance of Modq vs Random Early Marking
0
20
40
60
80
100
120
140
1 3 5 7 9 11 13 15 17 19 21 23 25 27 29 31
Time in Seconds
Cu
mm
packets
receiv
ed
Modq
REM
Figure 30. Modq vs Random Early Marking Cumulative Performance
64
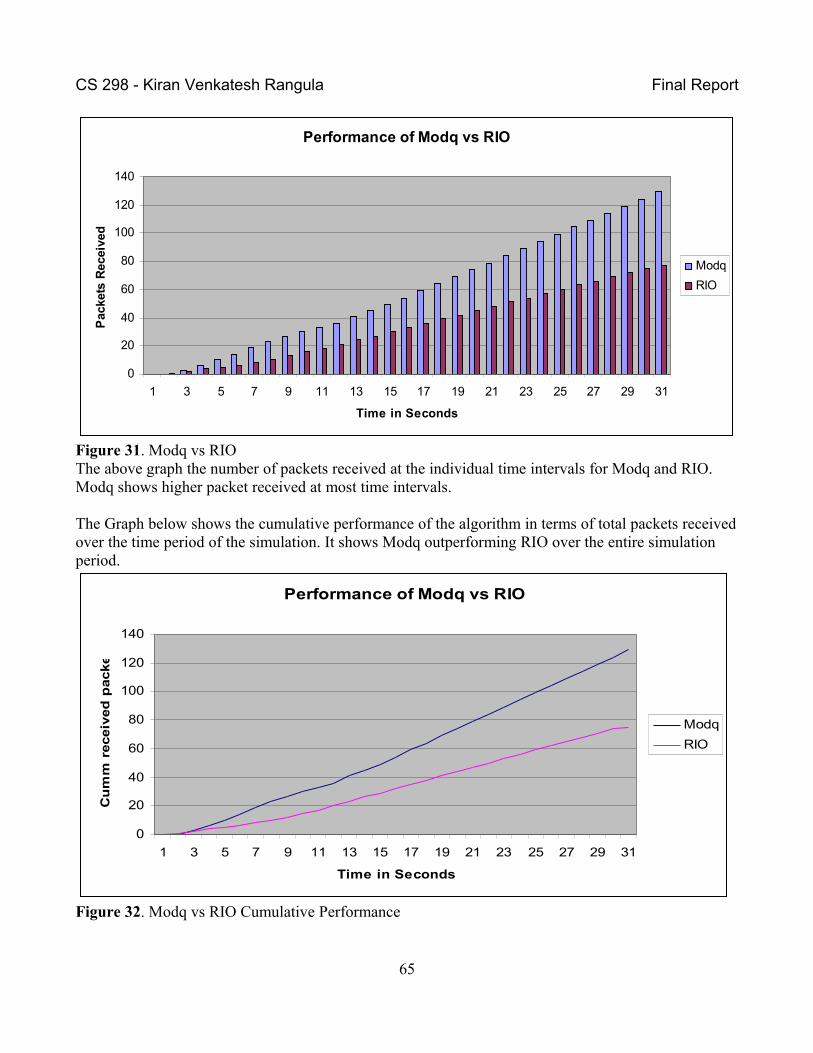
CS 298 - Kiran Venkatesh Rangula Final Report
Performance of Modq vs RIO
0
20
40
60
80
100
120
140
1 3 5 7 9 11 13 15 17 19 21 23 25 27 29 31
Time in Seconds
Pac
kets
Rec
eive
d
Modq
RIO
Figure 31. Modq vs RIOThe above graph the number of packets received at the individual time intervals for Modq and RIO. Modq shows higher packet received at most time intervals.
The Graph below shows the cumulative performance of the algorithm in terms of total packets received over the time period of the simulation. It shows Modq outperforming RIO over the entire simulation period.
Performance of Modq vs RIO
0
20
40
60
80
100
120
140
1 3 5 7 9 11 13 15 17 19 21 23 25 27 29 31
Time in Seconds
Cu
mm
receiv
ed
packets
Modq
RIO
Figure 32. Modq vs RIO Cumulative Performance
65
CS 298 - Kiran Venkatesh Rangula Final Report
The charts show that under larger number of flows where the non real time traffic can get
overwhelmed, Modq is able to steadily transmit more data. At regular intervals in the other queuing
systems, the best effort traffic is not getting many chances to transmit as lower priority traffic. We see
that there is lesser concentration of information received based on the higher prevalence of gaps
between transmissions. In Modq we see data being transmitted steadily over the period of the
simulation, which is shown by the higher concentration of data.
66
CS 298 - Kiran Venkatesh Rangula Final Report
9. ConclusionThe suggested modification to the WFQ principle shows improved performance for low priority
queues. The standard WFQ principle only services flows with higher priority/weights, causing
starvation for lower priority queues. By reserving bandwidth for these starved processes at regular
times, there is an overall improvement in performance on the WiMAX system. The process of TCP
traffic borrowing resources from other flows can however be an improvement in much larger networks,
depending on the overall usage, since the gains seem to be marginal in a much smaller environment.
The usage of WFQ forms a good base, although the varying packet sizes can be an issue in the wireless
environment.
10. Future WorkAs a future concept, it would be interesting to implement a solution that would allow for a network to
utilize multiple queuing schemes within a single network, depending on the situation of the network
congestion. Also, working on a full mobility suite will show how the system will work when put in a
scenario when subscriber stations are entering and leaving the network on a regular basis.
67
CS 298 - Kiran Venkatesh Rangula Final Report
11. Glossary
1. WiMAX – World Wide Interoperability for Microwave Access
1. PHY – Physical Layer
2. MAC – Medium Access Control
3. LLC – Logical Link Control
4. CS – Convergence Sublayer
5. SS – Subscriber Station
6. BS – Base Station
7. QoS – Quality of Service
8. WLAN – Wireless Local Area Network
9. OFDMA - Orthogonal Frequency Division Multiplexing
10. MSDU - MAC Service Data Units
11. MPDU - MAC Protocol Data Units
12. CID – Connection Identifier
13. SFID – Service Flow Identifier
14. UGS – Unsolicited Grant Service
15. BE – Best Effort
16. rtPS – Real Time Polling Service
17. nrtPS – Non Real Time Polling Service
18. ertPS – Extended Real Time Polling Service
19. NSIS – Next Steps in Signaling
20. NSLP – NSIS Signaling Protocol
21. CR – Contention Resolution
22. SDP – Session Description Protocol
23. MBWA – Mobile Broadband Wireless Access
24. EDF – Earliest Deadline First
25. WFQ – Weighted Fair Queuing
26. FIFO – First In First Out
27. WRR – Weighted Round Robin
28. UL – Uplink
68
CS 298 - Kiran Venkatesh Rangula Final Report
29. DL – Downlink
30. NS2 – Network Simulator
31. NAM – Network Animator
69
CS 298 - Kiran Venkatesh Rangula Final Report
12. References[1] C. Eklund, R. B. Marks, K. L. Stanwood, and S. Wang, “IEEE standard 802.16: A Technical Overview of the WirelessMAN Air Interface for Broadband Wireless Access,” IEEE Communications Magazine., 2002.
[2] R. B. Marks, M. Nohara, J. Puthenkulam, and M. Hart, “IEEE 802 tutorial: 802.16 mobile multihop relay,” Website, 2006, ”http://www.ieee802.org/16/sg/mmr/index.html”.
[3] G. Narlikar, G. Wilfong, and L. Zhang, “Designing multihop wireless backhaul networks with delay guarantees,” in Proceedings of Infocom, 2006.
[4] D. Marx, “Graph coloring problems and their applications in scheduling,” Periodica Polytechnica Ser. El. Eng., vol. 48, no. 1-2, pp. 5–10, 2004.
[5] A. Sayenko, O. Alanen, J. Karhula, and T. H¨am¨al¨ainen, “Ensuring the QoS requirements in 802.16 scheduling,” in MSWiM, 2006.
[6] Mobile Broadband Networking Based on IEEE 802.20 Standard. Telecommunications in Modern Satellite, Cable and Broadcasting Services, 2007. ELSIKS 2007. 8th International Conference on26-28 Sept. 2007 Page(s):243 - 246
[7] A Performance Study of Uplink Scheduling Algorithms in Point-to-Multipoint WiMAXNetworks. Thesis (Master, Computing) -- Queen's University, 2007-12-29 18:21:21.521
[8] Multicast polling and efficient VoIP connections in IEEE 802.16 networks. Proceedings of the 10th ACM Symposium on Modeling, Pages: 289 – 295, Year of Publication:2007
[9] Performance Analysis of Scheduling Algorithms for VoIP Services in IEEE 802.16e Systems. Howon Lee*, Taesoo Kwon*, Dong-Ho Cho*, Geunhwi Limt and Yong Changt*Department of Electrical Engineering and Computer Science Korea Advanced Institute of Science and Technology (KAIST), Korea
[10] A QoS Model based on NSIS signaling applied to IEEE 802.16 network. Ciulli, N.Landi, G.Curado, M.Leao, G.Bohnert, T.M.Mitrano, F.Nardini, C.Tamea, G.Consorzio Pisa Ricerche, Pisa
[11] A CALL ADMISSION CONTROL FRAMEWORK FOR VOICE OVER WLANS. YI QIAN, UNIVERSITY OF PUERTO RICO AT MAYAGUEZ. ROSE QINGYANG HU, MISSISSIPPI STATE UNIVERSITY
HSIAO-HWA CHEN, NATIONAL SUN YAT-SEN UNIVERSITY.
70
CS 298 - Kiran Venkatesh Rangula Final Report
[12] Admission Control and Interference-Aware Scheduling in Multi-hop WiMAX NetworksGhosh, Debalina; Gupta, Ashima; Mohapatra, Prasant; Mobile Adhoc and Sensor Systems, 2007. MASS 2007. IEEE Internatonal Conference on 8-11 Oct. 2007 Page(s):1 - 9
[13] An Architecture for SDP Based Bandwidth Resource Allocation with QoS for SIP in IEEE 802.16 Networks . Alexander, M. and Suppan, P. 2006. An architecture for SDP-based bandwidth resource allocation with QoS for SIP in IEEE 802.16 networks. In Proceedings of the 2nd ACM international Workshop on Quality of Service &Amp; Security For Wireless and Mobile Networks (Terromolinos, Spain, October 02 - 02, 2006). Q2SWinet '06. ACM, New York, NY, 75-82.
[14] Multicast Broadcast Services Support in OFDMA-Based WiMAX Systems. Tao Jiang and Weidong Xiang, University of Michigan, Dearborn Hsiao-Hwa Chen, National Cheng Kung University Qiang Ni, Brunel University
[15] Adaptive Contention Resolution for VoIP Services in the IEEE 802.16 Networks.A. Sayenko and 0. Alanen and T. Hamalainen Telecommunication laboratory, MIT department, University of Jyvaskyla, Finland
[17] RSVPns: An Implementation of RSVP for the Network Simulator ns-2. Marc [email protected], Computer Science Department IV, University of Bonn
[16] http://en.wikipedia.org/wiki/802.20
71