Embed Size (px)
Citation preview

Efficient Signal Processing Techniques
towards the Development of EEG based
Brain-Computer Interface (BCI)
1
Presented by:
Dr. A. P. Vinod
Associate Professor, School of Computer Engineering,
Nanyang Technological University (NTU)
Singapore
25 June 2013 Email: [email protected], Web: www.ntu.edu.sg/home/asvinod

About NTU • NTU ranked 47
th in the most prestigious Quacquarelli
Symonds (QS) World University Rankings 2013.
• Ranked 2nd
in the world among Universities below the age
of 50 by QS – 2012/2013.
• Ranked 8
th in the world among Universities below the age
of 50 by Times Higher Education - 2013.
• World’s Biggest Engineering University with 1100 faculty
members in Engineering Schools alone.
•Ranked as the 5th most-cited university with its research output ranked among the top
three Universities globally in Engineering by Essential Science Indicators of Thomson
Reuters.
A fast rising
young University
(25 years old)
Outline Introduction to Brain-computer interface (BCI)
Brain: basic structure and methods for brain signal measurement.
Basic components in BCI.
Electroencephalogram (EEG) based BCI
Challenges in EEG-based BCI
Our contributions towards the development of BCI using:
EEG signals during Motor Imagery (MI)
EEG signals during execution of motor movements
Attention related EEG signals
Conclusions and future work
3

Brain-Computer Interface (BCI) • Direct communication channel between brain and computer.
• Depends on brain activity and bypasses brain’s normal communication pathway of nerves and muscles.
• Transforms brain activity into command signals for controlling
external applications such as a neuroprosthetic device, robotic
arm, computer game, wheel chair control etc.
Promising communication tool for paralyzed patients
4

A recent application of Invasive BCI
Paralyzed woman serves herself coffee after 15 years, using
Invasive BCI controlled robotic arm.
http://neurogadget.com/tag/braingate.
5
Ultimately converts mental tasks into command signals !
Work in Institute for
Brain Science at
Brown University in
Rhode Island (2012).

Basic Working Principles: Brain and BCI BRAIN:
• Neurons, the basic building blocks of brain, are cells that send and
receive electro-chemical signals to and from the brain and nervous
system.
• Brain consists of more than hundred billion neurons, with millions of
connections between them.
• Unique neural activations occur in response to specific actions,
thoughts, emotions etc.
• Brain can be divided into various lobes having unique functional
responsibilities.
6
Structure of neuron
Brain parts and functions

Methods for Brain Signal measurement
7
Single Neuron/
MultiNeuron
Microelectrodes penetrating
Cerebral Cortex
EcoG (ElectroCortigrahic)
Electrode array on cortical surface
Metallic Electrode placed on Scalp
Electroencephalogram (EEG)Functional Near infrared
Spectroscopy (fNIRS)
Spectroscopic method that
uses the near-infrared region
of the electromagnetic
spectrum to measure the
haemodynamic activity of
brain
Brain Signal
measurement
Techniques
Fully-
Invasive
Partially-
Invasive
Non-
Invasive

Brain activity measurements: Why EEG? • Invasive techniques involves surgical interventions and
hence risky.
• Non-invasive methods such as functional-Magnetic Resonance Imaging (fMRI) and MEG is expensive, bulky (not portable) and sensitive to subject movement.
• Non-invasive methods such as EEG and fNIRS are portable, less expensive, insensitive to movement and easy to use.
• EEG is the most economical method for measuring electrical activity of brain.
• High temporal resolution EEG signals can be obtained for various activities such as emotions, body movements, mental tasks, attention etc.
8

EEG measurement
9
Exists inter-national standard for placing electrodes on scalp and each
electrode is named according to its location.
F: frontal, T: temporal, C: central, P: parietal and O : occipital lobes
Left hemisphere is named with odd numbers whereas right with even
numbers.
Conductive gel is applied between scalp and electrodes to reduce the skin
impedance while EEG recording.
Standard measurements
from vertex, inion and
nasion for international
system

Block diagram of EEG based BCI
10
EEG-based BCI uses EEG features to command, control, actuate and
communicate with the world directly by interfacing brain with peripheral devices
and systems.
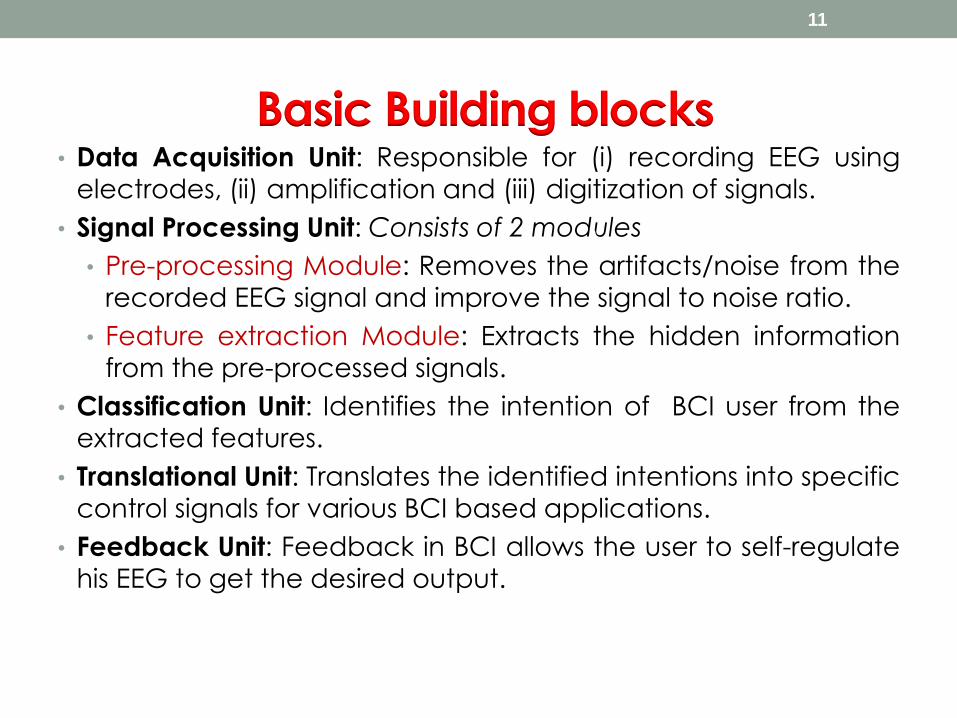
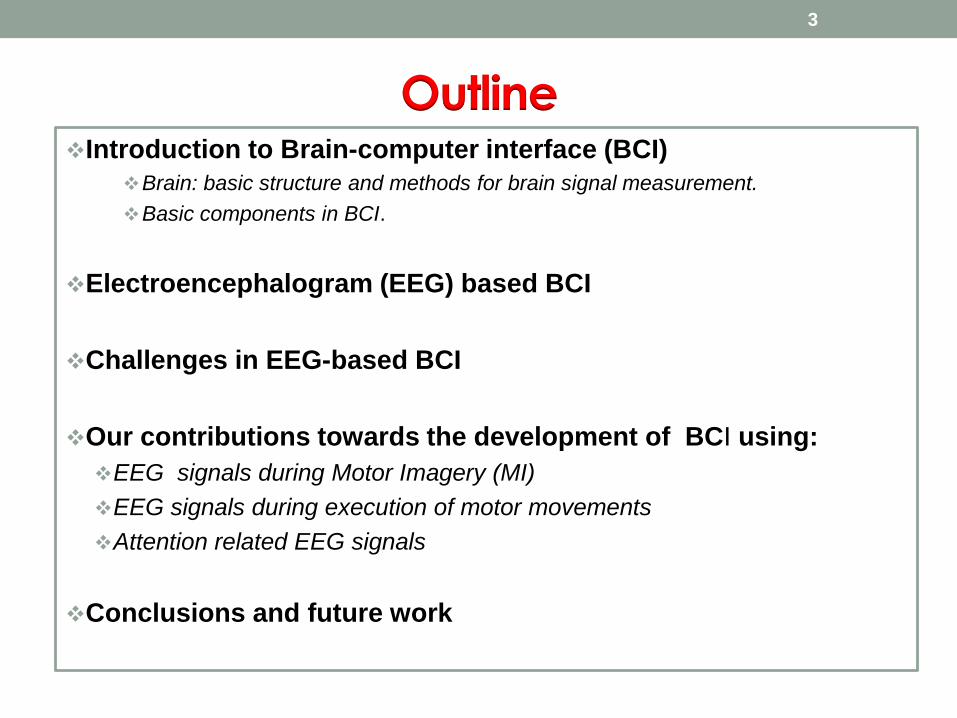
Basic Building blocks • Data Acquisition Unit: Responsible for (i) recording EEG using
electrodes, (ii) amplification and (iii) digitization of signals.
• Signal Processing Unit: Consists of 2 modules
• Pre-processing Module: Removes the artifacts/noise from the
recorded EEG signal and improve the signal to noise ratio.
• Feature extraction Module: Extracts the hidden information from the pre-processed signals.
• Classification Unit: Identifies the intention of BCI user from the
extracted features.
• Translational Unit: Translates the identified intentions into specific
control signals for various BCI based applications.
• Feedback Unit: Feedback in BCI allows the user to self-regulate
his EEG to get the desired output.
11

Challenges and objectives
Challenges: Design of less expensive, simpler and more comfortable data
acquisition techniques.
New sensors/electrodes that can provide higher SNR.
Development of accurate and robust pre-processing and feature
extraction techniques.
Tuning robust machine learning techniques and translational
algorithms.
Design of integration and control protocols for specific applications.
Our Research focus:
Development of Signal Processing Algorithms to extract relevant features
effectively and accurately for EEG-based BCI.
12

Relevant EEG Features
Slow Cortical Potentials (Event-related DC shifts in EEG), P300 (Event-related potential rise (response) that occur 300 ms after a stimuli) , Visually Evoked Potentials (potential changes on occipital EEG in response to a visual stimulus) and event-related de/synchronization (ERD/ERS) etc. are widely used in BCIs.
ERD/ERS: The naturally occuring brain rythms related to movement will undergo change during movement imagination – ERD and ERS.
Amplitude changes in EEG during execution, preparation or imagination
of motor movements (called motor imagery (MI)), that primarily activate the
motor cortex of brain.
ERS: Power increase in EEG during rest phase (neurons fire synchronously).
ERD: Power decrease in EEG, particularly contra lateral to the movement (neurons fire complex and individual patterns during motor imagery)
Challenges: ERD/ERS are highly frequency band dependent (They can occur simultaneouly
at same/different scalp locations).
The frequency bands that best discriminate between any 2 MI tasks (discriminative frequency bands) are subject-dependent.
13

Time courses of ERD/ERS during
MI in 2 subjects
Right hand imagery Left hand Imagery
G. Pfurtscheller, C. Neuper, A. Schlogl and Klaus Lugger, “Separability of EEG Signals recorded During Right and Left Motor Imagery using
Adaptive Autoregressive Parameters,” IEEE Transactions on Rehabilitation Engineering, vol. 6, pp. 316-325, September 1998.
Motor imagery causes amplitude changes in EEG and
they appear in subject-specific frequency bands.
14
9-13 Hz
10-12 Hz

Extraction of MI patterns
Common Spatial Pattern (CSP) is a mathematical procedure for
separating a multivariate signal into additive components which
have max. difference in variance between two windows.
Application of CSP to time-varying multi-channel EEG generates a
new time series, where the difference between two types of signals is
maximized.
The first and last rows of CSP transformed matrix provides maximum discriminative
information between classes.
For Right MI: Low variance in R1 and R2 & High variance in L1 and L2.
For Left MI: Low variance in L1 and L2 & High variance in R1 and R2.
15
Effect of CSP
transformation
on EEG
corresponding
to Right/Left MI

Our Contributions on:
Motor Imagery based BCI
16

Existing Filter Bank Common Spatial Pattern (FBCSP)
Schematic of the Existing FBCSP algorithm
(Mutual information based feature selection and SVM based classifier)
4-8 Hz
8-12 Hz
CSP
CSP
CSP
36-40 Hz
Feature
SelectionClassifier
EE
G S
ign
als
Output
Bandpass filtering Feature Extraction
17
Selection of subject-specific discriminative bands is significant in
Common Spatial Pattern (CSP) operation of MI.

Proposed Discriminative Filter bank Common Spatial Pattern (DFBCSP)
Proposed a discriminative filter bank selection method: Selects 4
filters from a set of 12 filters (parent filter bank ) based on a Fisher ratio
(FR) criterion.
If, SB and SW are between-class and within-class variances of the MI
signal respectively,
Proposed DFBCSP
Filter-1
Filter-2
Filter-3
Filter-4
CSP
CSP
CSP
CSP
Classifier
EE
G S
ign
als
Output
Discriminative
Filter bank (DFB)
Feature Extraction
WB SSFR
SVM
18

Frequency bands selected by DFBCSP
Discriminative frequency bands selected in the DFBCSP algorithm for 5 subjects in
BCI Competition III dataset IVa (Right hand and foot MI)
- Exhibits Inter-subject variability
Kavitha P. Thomas, Cuntai Guan, Lau Chiew Tong, A. P. Vinod and Kai Keng Ang, “A New Discriminative Common Spatial Pattern Method for Motor Imagery Brain-Computer Interfaces,” IEEE Transactions on Biomedical Engineering, vol. 56, no. 11, pp. 2731-2733, November 2009.
19

Comparison of classification
of right hand and foot MI
20

Comparison of classification of right
hand and left hand MI
21

Power Spectral density plots of EEG
Average Power Spectral Density plots of right hand and foot trials for subject
‘av’ in BCI Competition III dataset IVa.
22

More analysis on frequency bands during
MI • Found that the selection of discriminative frequency
bands highly affects the classification accuracy of MI patterns.
• DFBCSP requires multiband filtering to select the subject-specific DFB.
• In order to avoid this multi-band filtering, another method of time-frequency Fisher ratio patterns is proposed.
• Involves the computation Power spectral density (PSD) using STFT of right hand and left hand EEG which gives the Fisher values of frequency points along time domain.
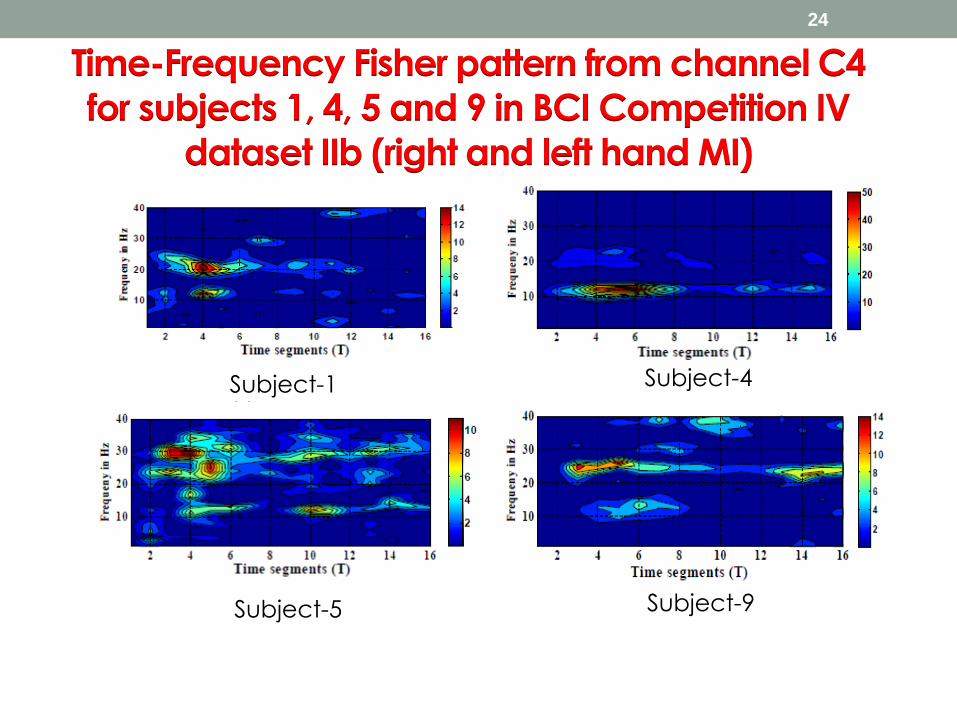
Time-Frequency Fisher pattern from channel C4
for subjects 1, 4, 5 and 9 in BCI Competition IV
dataset IIb (right and left hand MI)
Subject-1 Subject-4
Subject-5 Subject-9
24

Discriminative band selection from
Fisher ratio pattern
10-14 Hz, 8-11 Hz 7-12 Hz, 25-30 Hz 11-17 Hz, 34-39 Hz
Discriminative Weight (DW) values: Sum of the Fisher values for each
frequency component along the time domain in FR pattern.
DW values and estimated bands in 3 subjects in BCI
Competition IV Dataset IIb (right and left hand MI) 25

Inter-session variation of Discriminative
weight (DW) values
Subject-1
Subject-9

Variation of frequency bands over sessions
27
2 most discriminative
frequency bands selected
from DW analysis:
Black: Most discriminative
Band
Red: Second most DFB

Proposed Adaptive Method for tracking the discriminative
bands – To tackle Intra-Subject Variability
Schematic of the Adaptively weighted Spectral Spatial Pattern (AWSSP)
Kavitha P. Thomas, Cuntai Guan, Lau Chiew Tong, A. P. Vinod and Kai Keng Ang, “Adaptive tracking of discriminative frequency components in EEG for a robust Brain- Computer Interface,” Accepted in Journal of Neural Engineering, February 2011.
DDW: Deviation in Discriminative weight (DW) values
28

Classification results of 5 sessions of 9
subjects in BCI Competition IV dataset IIb
SWSSP: Same
filters obtained from
training data (no
updates).
AWSSP-unsup:
Predicted class
label/classifier
output
AWSSP-sup: True
class labels for
weight updation.

Classification results of online data using
the proposed static and adaptive methods
Session Session-1 Session-2
Subject Static Adaptive Static Adaptive
SG 85.83% 92.50% 84.51% 87.50%
SM 84.17% 87.50% 81.66% 88.33%
SS 79.17% 86.67% 74.17% 82.50%
Average 83.05% 88.90% 80.11% 86.11%
In session-1 and session-2, two sets of EEG trials were recorded
which were processed using static and adaptive schemes.

Contributions on:
Movement Execution parameters in EEG
31

Movement execution parameters • Objective
• Electrophysiological brain signals to decode various parameters of
voluntary movement.
• Movement parameters: direction, position, velocity, or acceleration.
• Why? • Higher degrees of freedom for output device movement.
• Precise identification of neural patterns encoding movement or
movement parameters.
• Challenge! • Understanding of the neural substrate for voluntary movements.
• Non-invasive techniques do not provide sufficient signal resolution or
bandwidth.
K. Jerbi, J. R. Vidal, J. Mattout, E. Maby, F. Lecaignard, T. Ossandon, C. M. Hamamé, S. S. Dalal, R.
Bouet, J. P. Lachaux, R. M. Leahy, S. Baillet, L. Garnero, C. Delpuech, and O. Bertrand, "Inferring
hand movement kinematics from MEG, EEG and intracranial EEG: From brain-machine interfaces to
motor rehabilitation," IRBM, vol. 32, pp. 8-18, 2011.
32

Research findings
• Invasive studies in Monkeys and Humans
• Tasks: Planning, Execution of Reaching and Grasping actions, Saccades.
• SUA, MUA, LFP
• Firing pattern of neurons in the primary motor cortex.
• Power modulation in multiple frequency components of LFPs.
• Spatial information : Primary motor + Parietal cortex.
• ECoG: Direction tuning in low frequency (<4 Hz) and Amplitude
modulation in Gamma (60-140 Hz).
P. Georgopoulos, J. F. Kalaska, R. Caminiti, and J. T. Massey, "On the relations between the direction of two-dimensional arm movements and cell
discharge in primate motor cortex," J Neurosci, vol. 2, pp. 1527-37, Nov 1982.
Mehring C, Rickert J, Vaadia E, Cardosa de Oliveira S, Aertsen A, Rotter S. Inference of hand movements from local field potentials in monkey motor
cortex. Nat Neurosci 2003;6(12):1253–4.
Pistohl T, Ball T, Schulze-Bonhage A, Aertsen A, Mehring C. Prediction of arm movement trajectories from ECoG- recordings in humans. J Neurosci Methods
2008;167(1):105–14.
33

• Non-invasive studies in Humans using MEG/EEG • Successfully decoded finer details of movement such as velocity/
direction.
• Tasks: Voluntary hand movements in different directions at different
speeds.
• Identified 3 spectral regions showing Movement related neural
activity.
Low frequency band
(EEG/MEG: <7 Hz)
Intermediate frequency
band
(EEG/MEG: 10–30 Hz)
Broad high-frequency
band
(EEG/MEG: 62–87 Hz)
• Amplitude modulations.
• Movement related
potential (MRP) slow signal
components.
• ERD/ERS.
• Mu and beta rhythms,
across motor cortex.
• Movement related
amplitude increase.
• Neuro-physiological
meaning and mechanisms
underlying this is not clear!!
Waldert S, Preissl H, Demandt E, Braun C, Birbaumer N, Aertsen A, et al. Hand movement direction
decoded from MEG and EEG. J Neurosci 2008;28(4):1000–8.
Salmelin, R., Hämäläinen, M., Kajola, M., Hari, R., 1995. Functional segregation of movement-related
rhythmic activity in the human brain. Neuroimage 2 (4), 237–243.
34

Summary
• Spectral: • Low-frequency components in movement parameter decoding &
reconstruction
• <7 Hz for direction decoding.
• 2-5 Hz for speed decoding.
• Spatial: • Primary & Supplementary motor area.
• Posterior parietal cortex.
• Temporal: • Movement intention, planning, execution, after movement.
35

Requirements • Challenges: Why not a simple low pass filtering?
• Extracting the precise information taking into consideration the inter trial variability.
• Artefact removal, improve SNR.
• Overlapping cognitive information.
• Signal Processing : Optimal information extraction from the raw data. • Tools:
• ICA, PCA, CSP.
• Kalman filter, MLR models.
• Different parameters in time and frequency domains.
• Features localized in time and space from low frequency subbands. • Neural sources:
• Movement Related Potential (MRP).
• ERD/ERS.
• Gamma band activity (25-40 Hz).
• Low frequency EEG.
ICA - Independent Component Analysis
PCA- Principal Component Analysis
CSP – Common Spatial Pattern
MLR – Multiple Linear Regressor
36
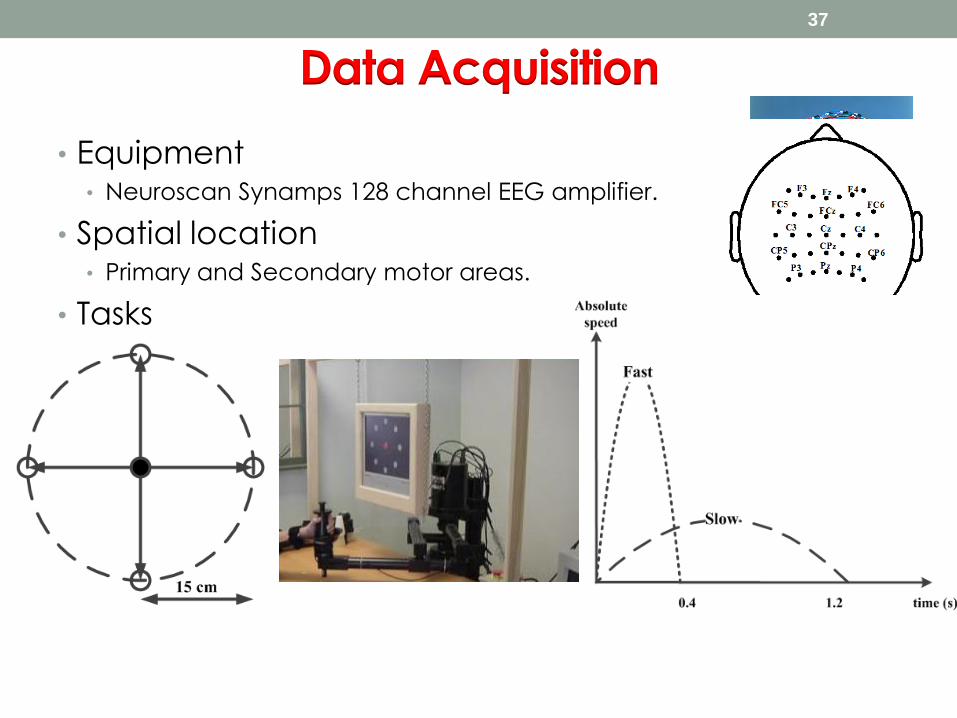
Data Acquisition
• Equipment • Neuroscan Synamps 128 channel EEG amplifier.
• Spatial location • Primary and Secondary motor areas.
• Tasks
37

Wavelet- Common Spatial Pattern • Multi resolution Analysis by DWT
• Octave band filtering using orthonormal wavelet bases followed by
downsampling.
• CSP
• Generates discriminative spatial patterns.
Preprocessed signal H/1 L/1
H/2 L/2
H/3 L/3 L/
4
H/
4 H/
5
L/5
Subband signals
16
8
4
2
20
CSP
freq
M. Vetterli, C. Herley, “Wavelets and filter banks: Theory and design,” IEEE Transactions in Signal Processing, vol. 40, no. 9, pp. 2207-2232, Sep. 1992.
H. Ramoser, J. Muller Gerking, G. Pfurtscheller, “Optimal spatial filtering of single trial EEG during imagined hand movement,” IEEE Transactions on
Rehabilitation Engineering, vol. 8, pp. 441-446, Dec. 2000.
Upper half
Lower half
38

Functional block diagram – Speed Decoding
39
Above method is modified with regularization of CSP for direction analysis.

Results - Directions
56
58
60
62
64
66
68
70
72
74
76
78
D1-D2 D1-D3 D1-D4 D2-D3 D2-D4 D3-D4 Mean
Mea
n C
lass
ific
ati
on
Acc
ura
cies
in
%
Classifications
W-CSP
Reg. W-CSP
SVM
NBPW
FLD
FLD
FLD
FLD
30 35 40 45 50 55 60 65 70 75
Mean Classification Accuracy
FLD Reg. W-CSP with
selected features
FLD Reg. W-CSP
FLD W-CSP with selected
features
FLD W-CSP
NBPW Reg. W-CSP
SVM Reg. W-CSP
D1
D2 D4
D3
40

Direction dependent temporal activations
(<1 Hz range recorded from C1 and Pz)
41

Results - Speeds
0 1 2 3 4 5 6 7 8 9 100
10
20
30
40
50
60
70
80
90
100
Number of subbands used for reconstruction, Lv
Cla
ssif
icat
ion
accu
racy
in %
Average
Sub 1
Sub 2
Sub 3
Sub 4
Sub 5
Sub 6
Sub 7
42
Best accuracy at 5 bands (<7 Hz): 83.7% (between fast and slow movements)

Reconstructing movement speed
Correlation Coefficients
x y abs
M1 0.45 0.31 0.52
M2 0.48 0.42 0.50
43

Moving on…..Neural correlates of movement
execution & imagery
• ECoG • Spatial distribution of local neuronal
population activity during motor
imagery and actual motor
movement are similar.
• fMRI: Imagery : Visual or Kinesthetic
– Spatial overlap : Occipital and Motor areas.
– Primary and secondary visual areas and primary and secondary
motor areas
T. Hanakawa, M. A. Dimyan, and M. Hallett, "Motor planning, imagery, and execution in the distributed
motor network: a time-course study with functional MRI," Cereb Cortex, vol. 18, pp. 2775-88, Dec 2008.
K. J. Miller, G. Schalk, E. E. Fetz, M. den Nijs, J. G. Ojemann, and R. P. N. Rao, "Cortical activity during motor
execution, motor imagery, and imagery-based online feedback," Proceedings of the National Academy of
Sciences, February 16, 2010 2010.
44

Possible Future work No study to date has reported full closed-loop decoding multidimensional imagined
movement activity.
• Goals
• How well motor imagery can replace the information using actual movement execution?
• Real time systems : Subject trained models; adapted to own neural activity for movement encoding using minimum optimal information.
• Detection of 3-D movements
Some Applications
• Assistive technology devices (Stroke rehabilitation)
• Serious computer games
• In automotive control: Thought driven motors, Controlling acceleration/speed, Steering control.
45

Contributions on:
Attention related EEG
46

Attention detection from EEG • Attention is the state of alertness
• Can be estimated using the entropy values of EEG
• Used widely in neurofeedback studies as directly related to cognition
• We have developed an attention driven computer game:
Framework of attention driven game
47
Pre-ProcessingEntropy
Estimation
Attention
Score
Computation
Feedback
Signal Processing Module
Output
Module
EEG data acquisition
using Emotiv Epoc
Neuroheadset
System
Integrator

Gaming interface controlled by EEG (for ADHD
Children) Stage 1: Memorize the displayed numerals and locations
48

Gaming interface controlled by EEG Stage 2: Focus on a point on interface in order to make the attention
score above threshold value
49

Gaming interface controlled by EEG
Stage 3: Display of arrows and selection of answer by keyboard
50

Experimental results • Accuracy of re-filling the matrix improves by practice.
51
Percentage of correctly filled matrix elements in a level-3
Matrix game over 3 days (Total number of trials:30)
Percentage of Correct trials on Day-1, Day-2 and Day-3: 75, 80, 87%
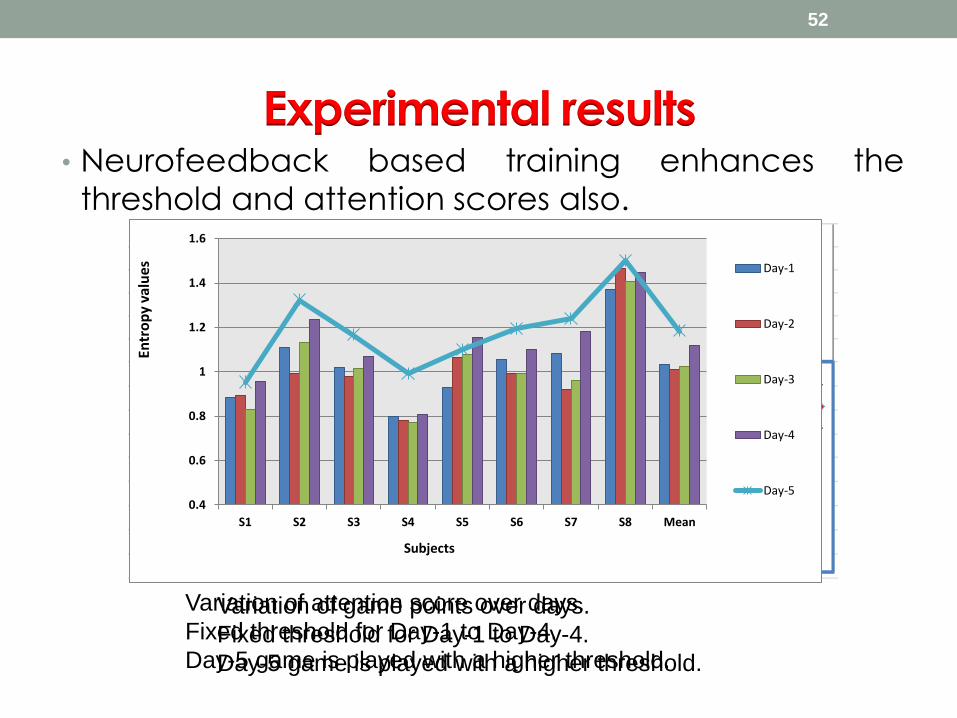
Experimental results • Neurofeedback based training enhances the
threshold and attention scores also.
52
0.4
0.6
0.8
1
1.2
1.4
1.6
S1 S2 S3 S4 S5 S6 S7 S8 Mean
Entr
op
y va
lues
Subjects
Day-1
Day-2
Day-3
Day-4
Day-5
Variation of game points over days.
Fixed threshold for Day-1 to Day-4.
Day-5 game is played with a higher threshold.
Variation of attention score over days.
Fixed threshold for Day-1 to Day-4.
Day-5 game is played with a higher threshold.

Possible future works on attention based BCI
• Neurofeedback has been considered as an effective
treatment approach for enhancing attention and cognitive
skills of children with attention-deficit hyper active disorder (ADHD).
• Planning to extend our studies for developing more interactive
games and use them for treating ADHD children.
53

Call for Papers – International Symposium on Electronic System Design
(ISED 2013), 12-13 December, Singapore (IEEE Computer Society Sponsored)
SYMPOSIUM TRACKS:
•Analog/Mixed-Signal System Design
• Digital System Design and Validation
•Embedded System Design
•Emerging Technology and System Design
•Power Aware System Design
•Software System and Application Design
•Wireless/Wired Communication Systems
Submission deadline: 15 July 2013
Website: http://ised.seedsnet.org/
54

55