Embed Size (px)
Citation preview
1
eFigure 1: Process of identification and selection of studies for inclusion in the review

2
eFigure 2: Publication bias in studies reporting incidence rate of diabetes mellitus in ART-experienced global HIV infected people
3
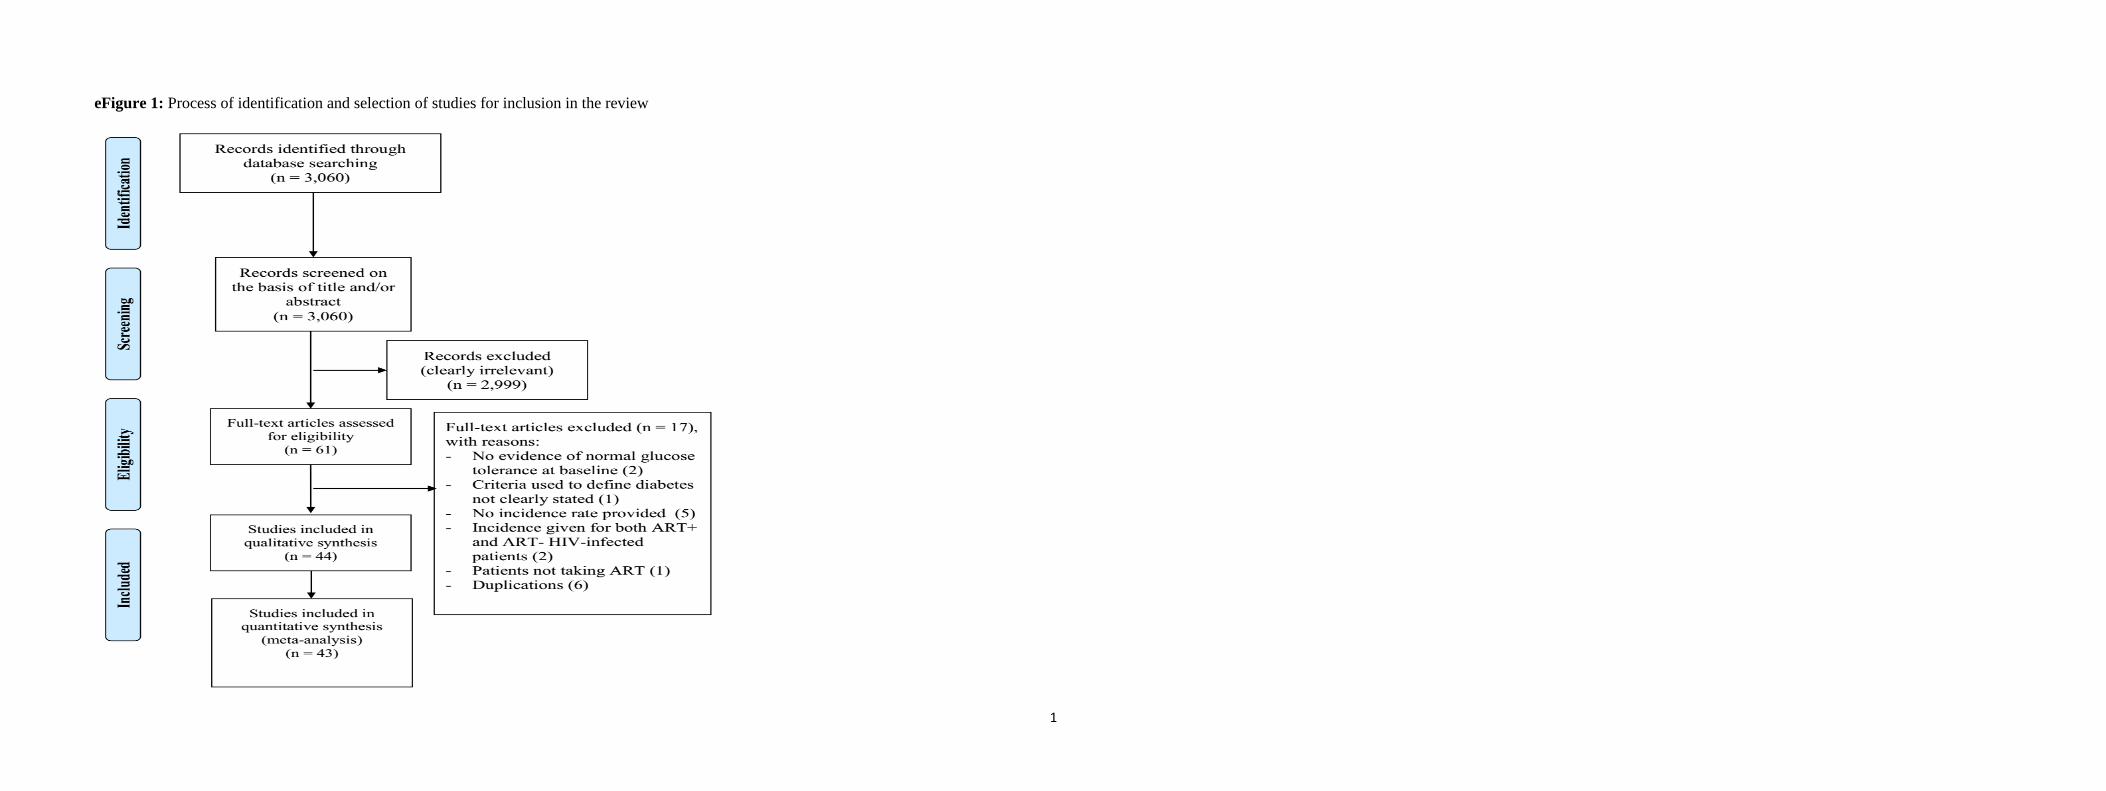
eFigure 3: Publication bias in studies reporting cumulative incidence of diabetes mellitus in ART-experienced global HIV infected people
4
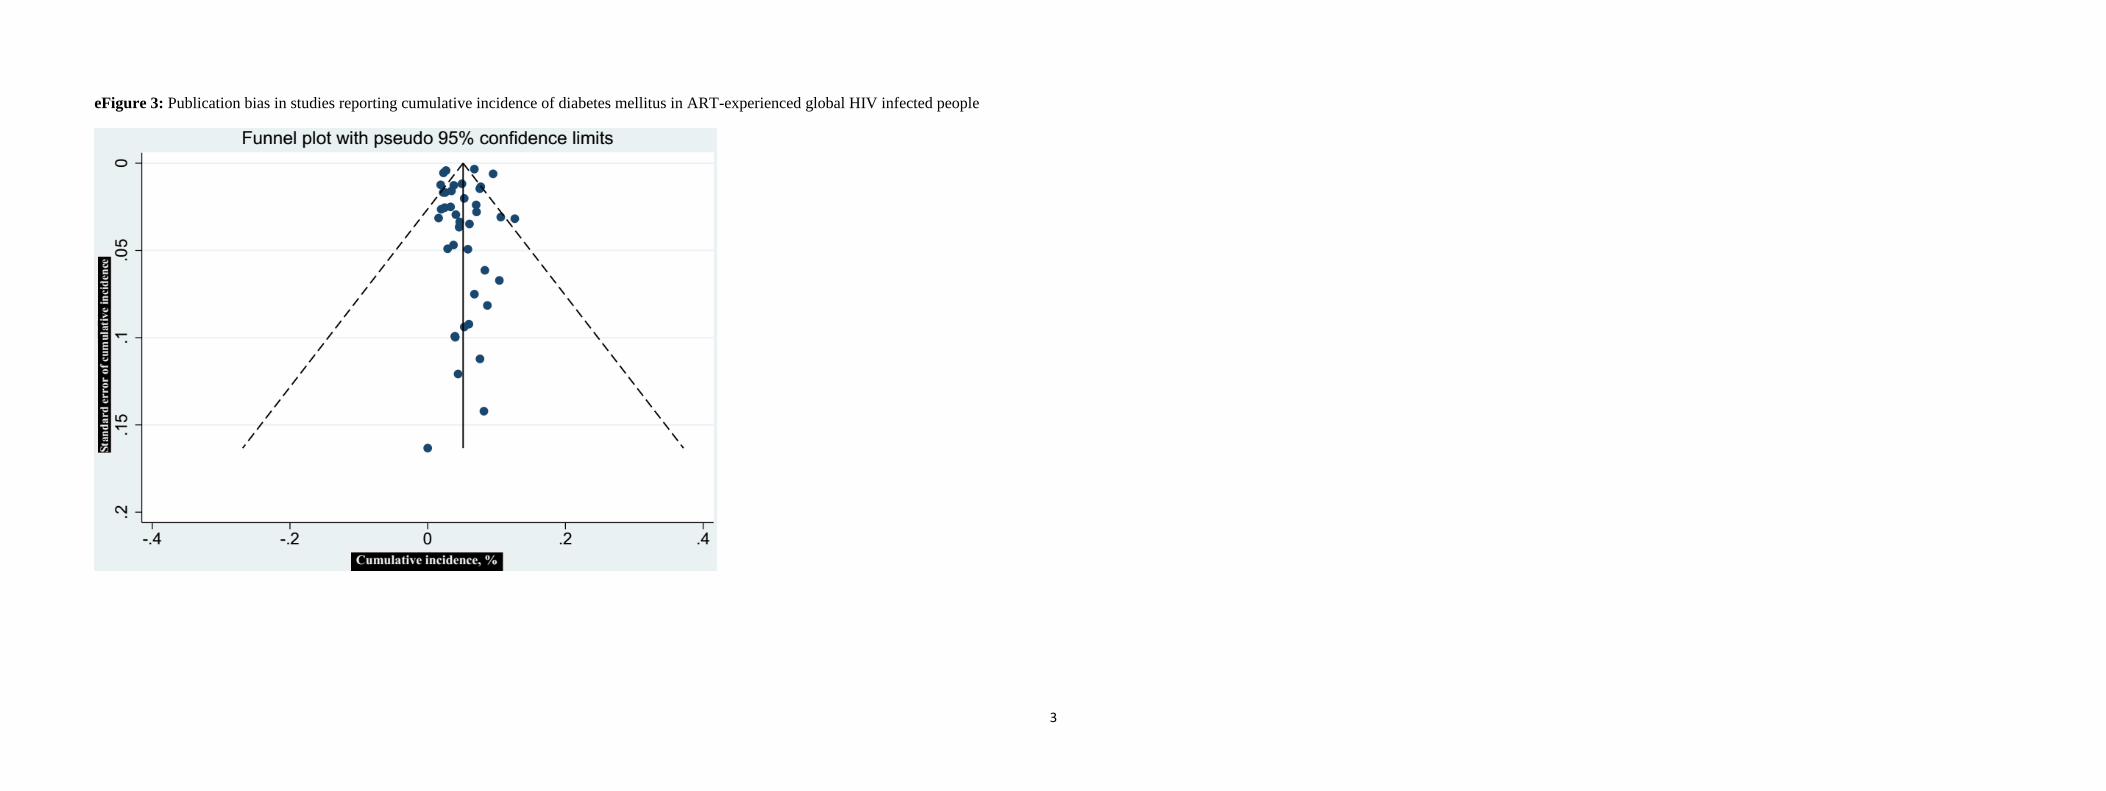
eFigure 4: Publication bias in studies reporting incidence rate of prediabetes conditions in ART-experienced global HIV infected people
5
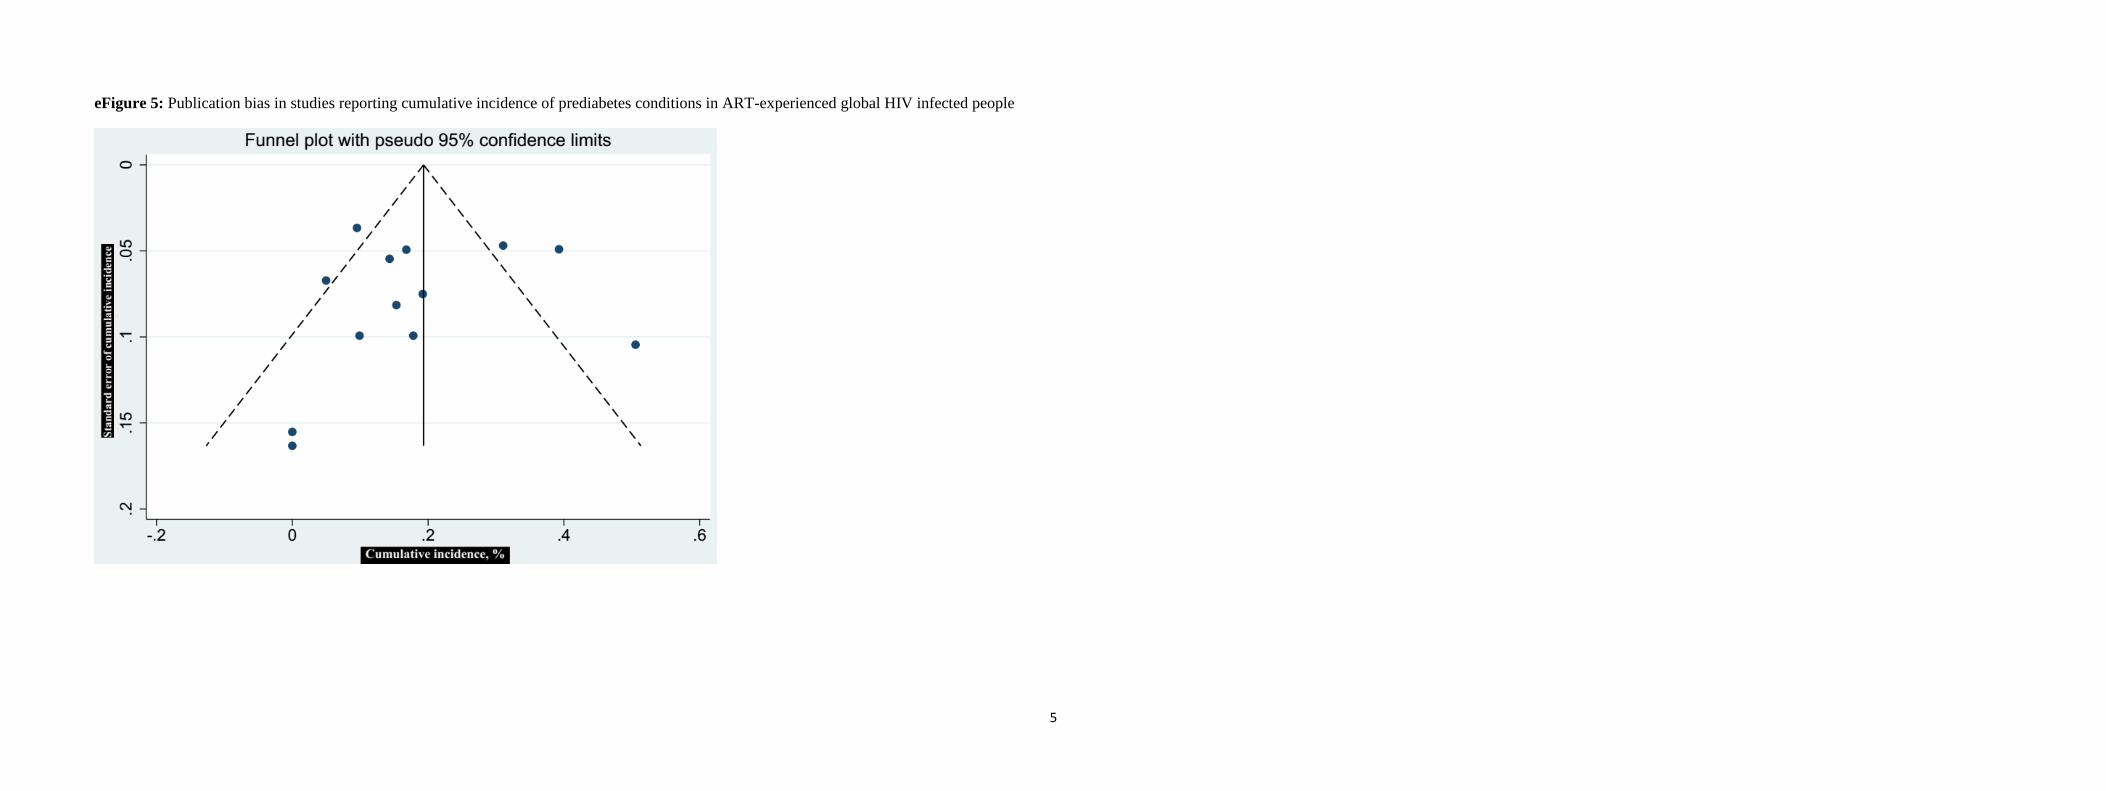
eFigure 5: Publication bias in studies reporting cumulative incidence of prediabetes conditions in ART-experienced global HIV infected people

6
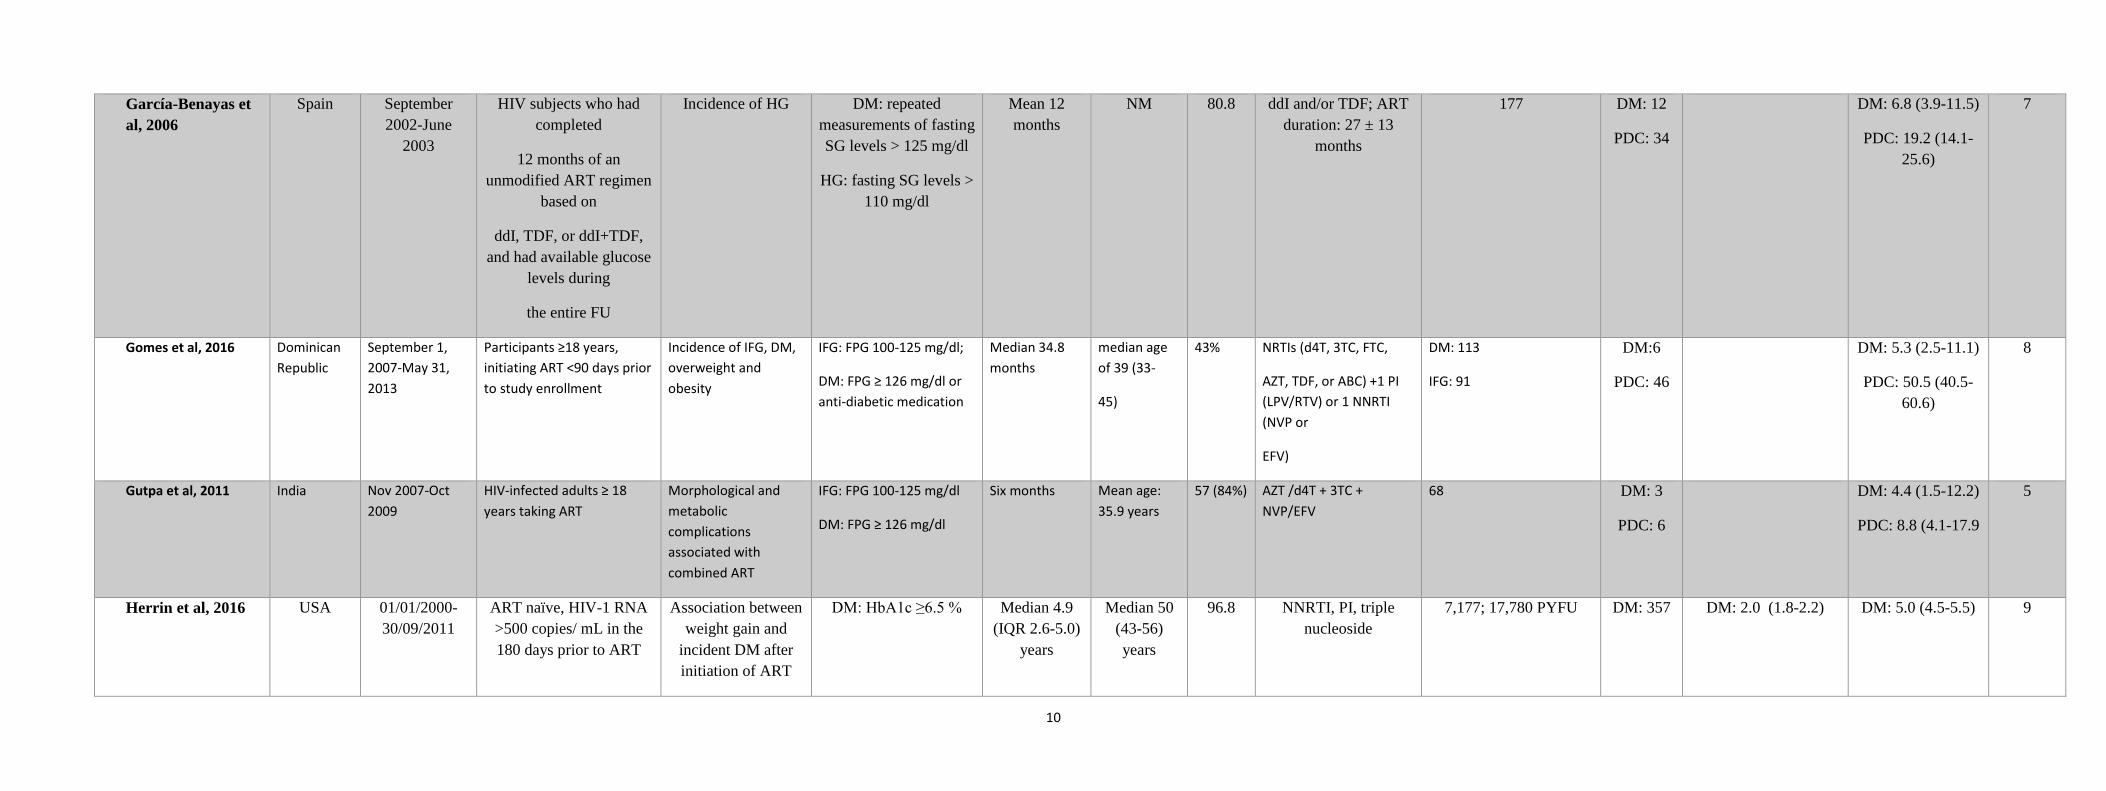
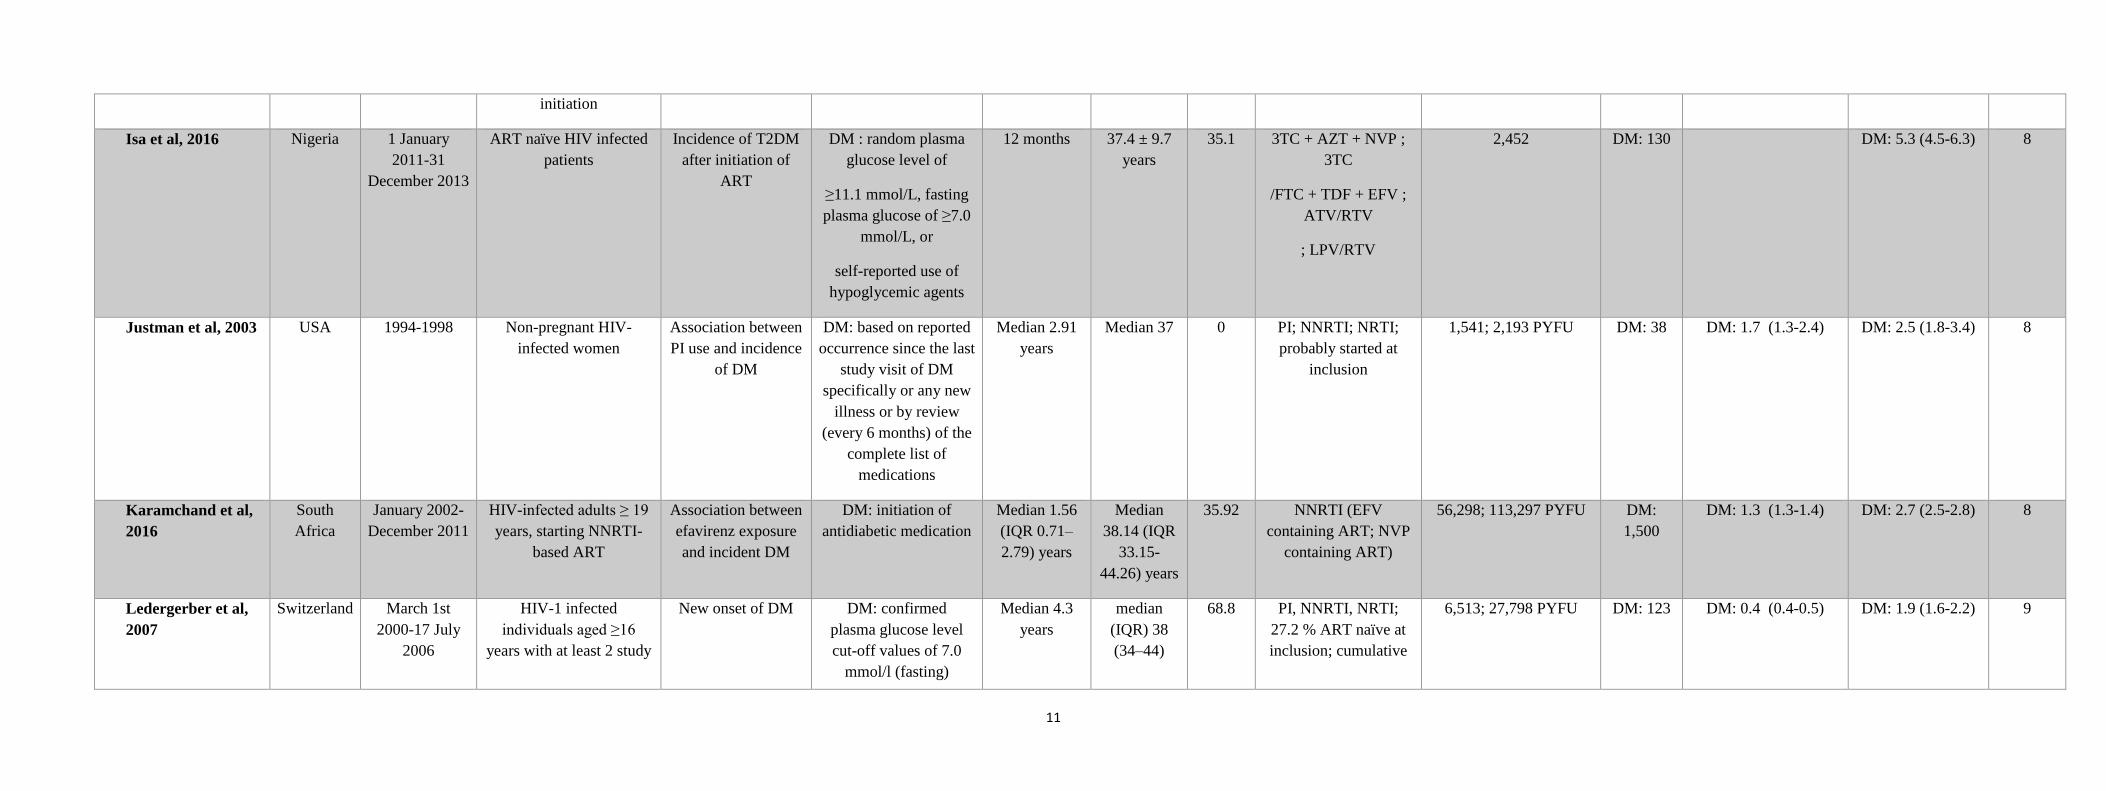
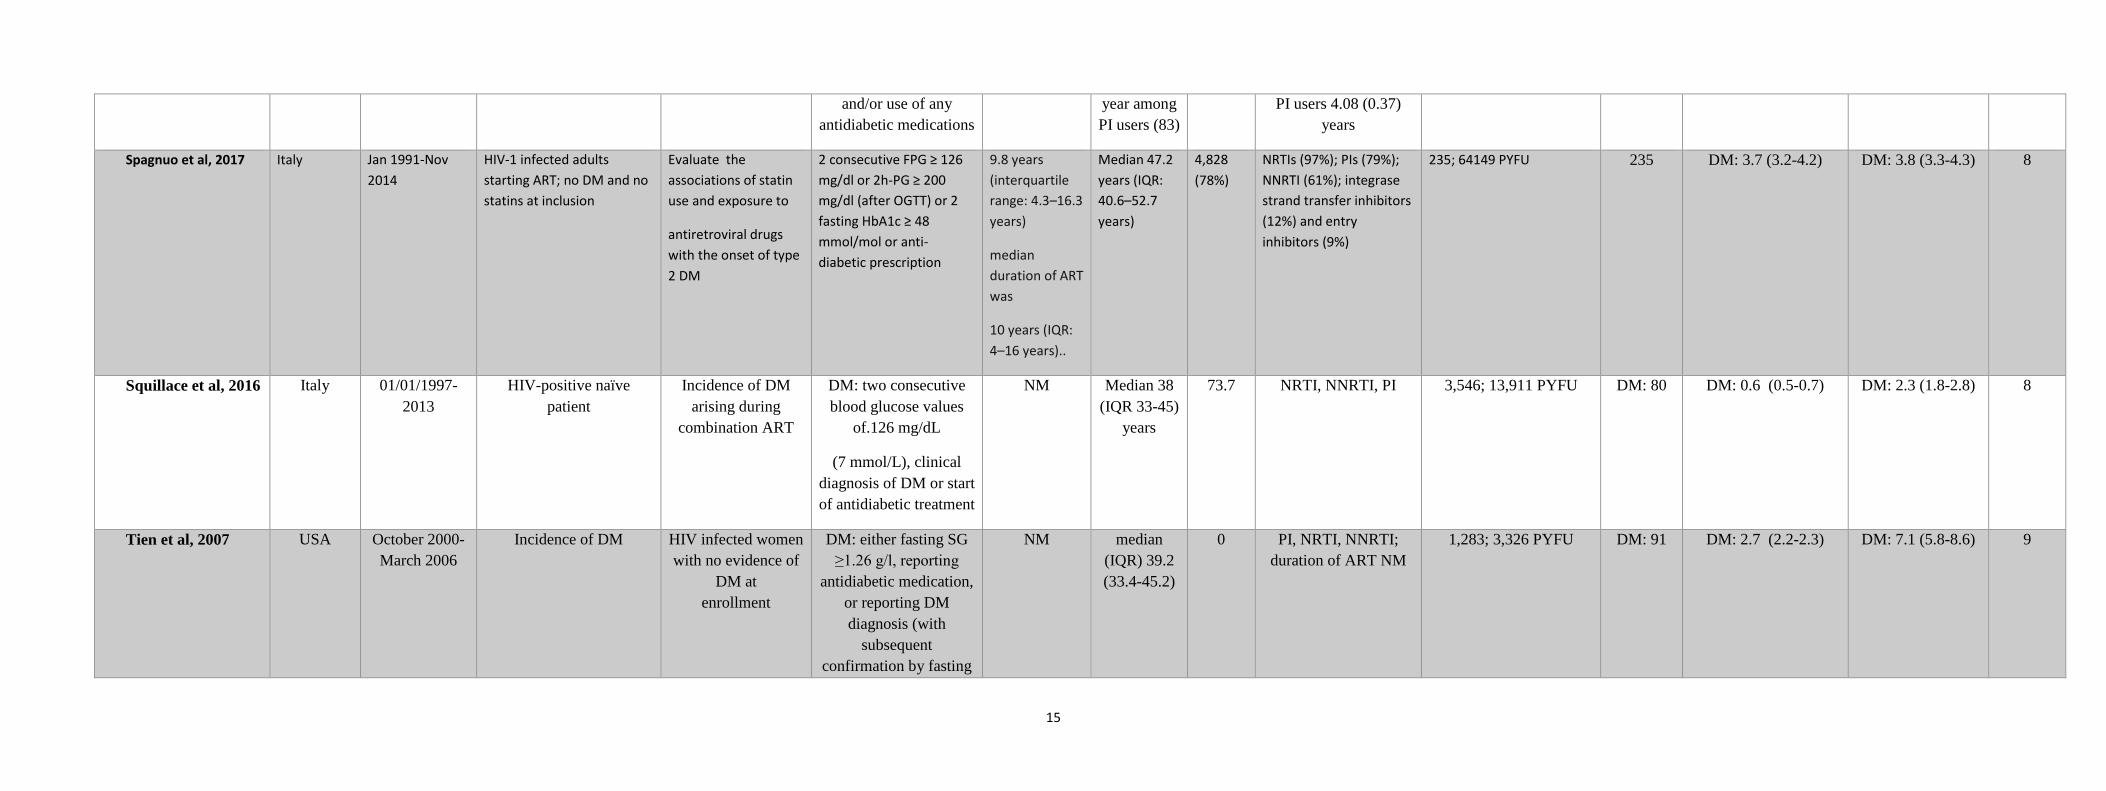
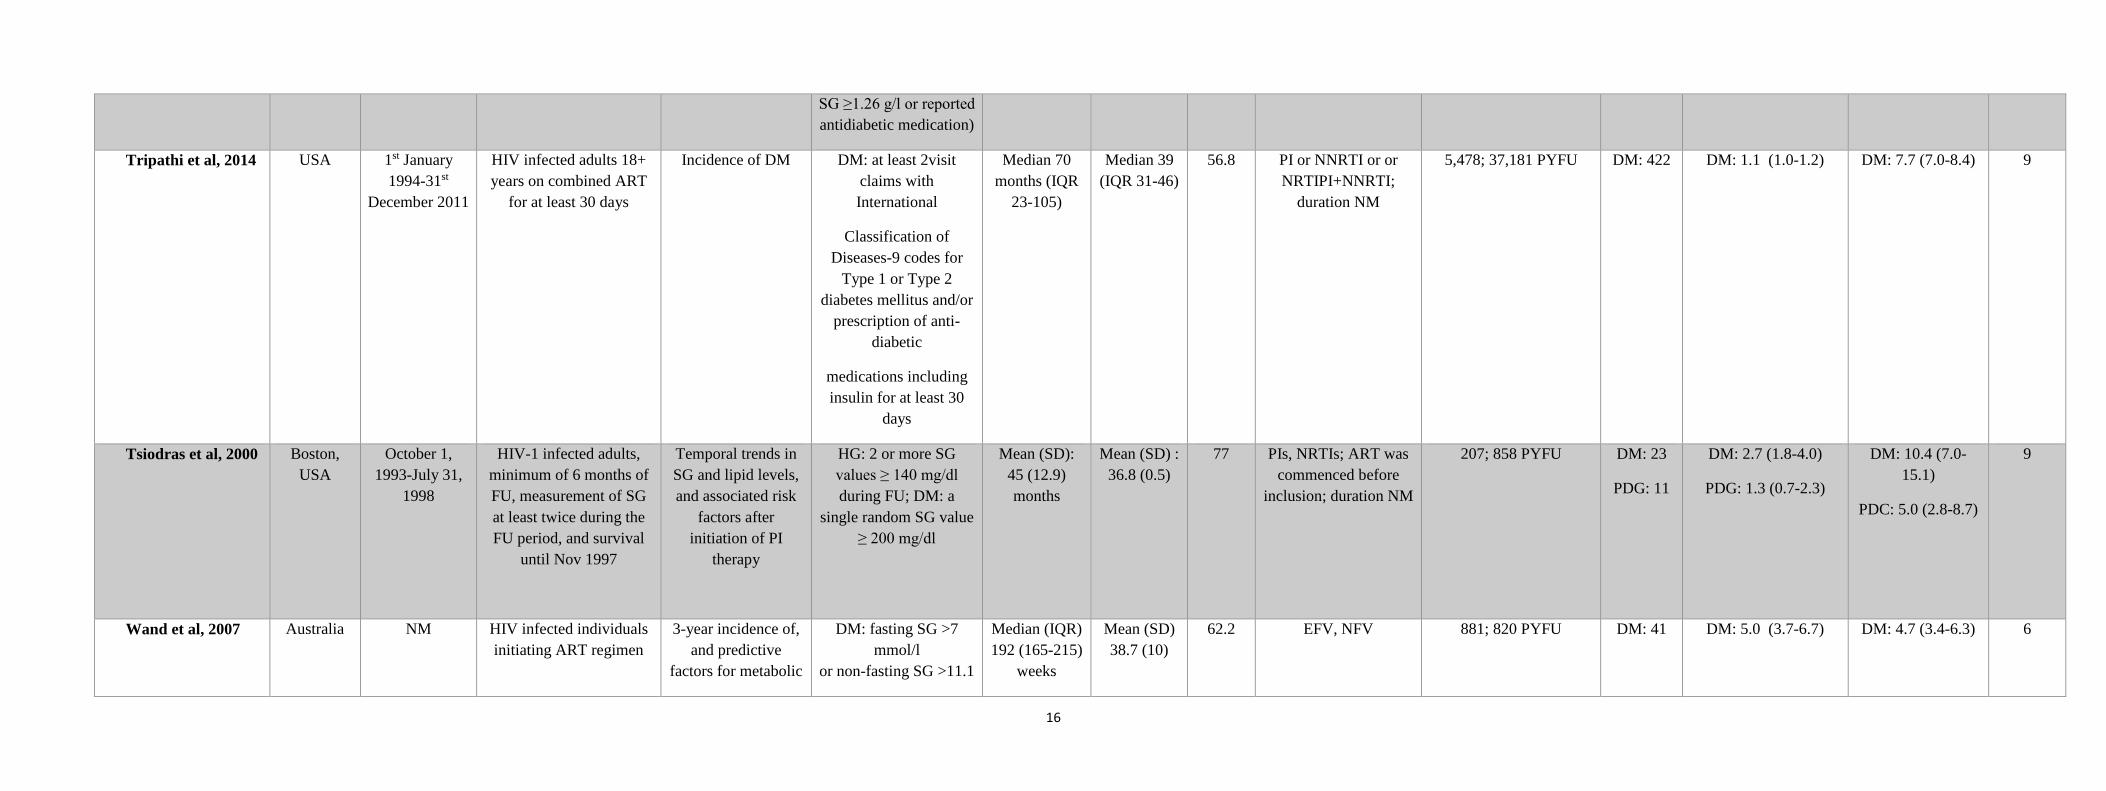
eTable 1: Summary of study findings
Study ID Country Study period Selection criteria Study endpoint(s) Diagnostic criteria Duration of
FU
Age (years) Male
sex (%)
ART regimen Sample size; Total PYFU Cases Incidence rate, for
1000 PYFU (95%CI)
Cumulative
incidence, %
(95%CI)
NOS
score
Araujo et al, 2014 Spain December
2010/December
2011-
December 2013
HIV infected patients
aged 18+ years and
receiving ART
Rates and causes of
insulin resistance
and risk od DM
DM: fasting SG ≥126
mg/dl or reported use of
anti-diabetic medication
Median (after
insulinemia
determination)
35.2 (IQR
19.7-40.9)
months
Mean (IQR)
43.9 (39-49)
75 NNRTI, PI, or other
Cumulative time on
ART mean (IQR)
120.5 (48.6–188)
months
265; 770.8 PYFU DM: 22 DM: 2.9 (1.9-4.3) DM: 8.3 (5.5-12.2) 8
Bala et al, 2016 India January 2010-
January 2011
ART-naïve HIV positive
patients older than 12
years
Metabolic
complications after
initiation of ART
IFG:>100 and <126
g/dl;
DM:≥126 g/dl
1 year NM NM d4T-3TC-EFV; d4T-
3TC-NVP; AZT-3TC-
EFV; AZT-3TC-NVP
101 DM: 4
PDC: 18
DM: 4.0 (1.6-9.7)
PDC: 17.8 (11.6-
26.4)
6
Bastard et al, 2009
French Starting in
1997
HIV patient started on PIs
at inclusion
Incidence and risk
factors for new-onset
DM
DM: fasting SG≥126
mg/dl or 2-h OGTT SG
≥ 200mg/dl on two
occasions or
glycaemia gradually
increasing over these
values and/or
antidiabetic
treatment
9 years FU NM NM PI therapy 643; 4,449 PYFU 7
7
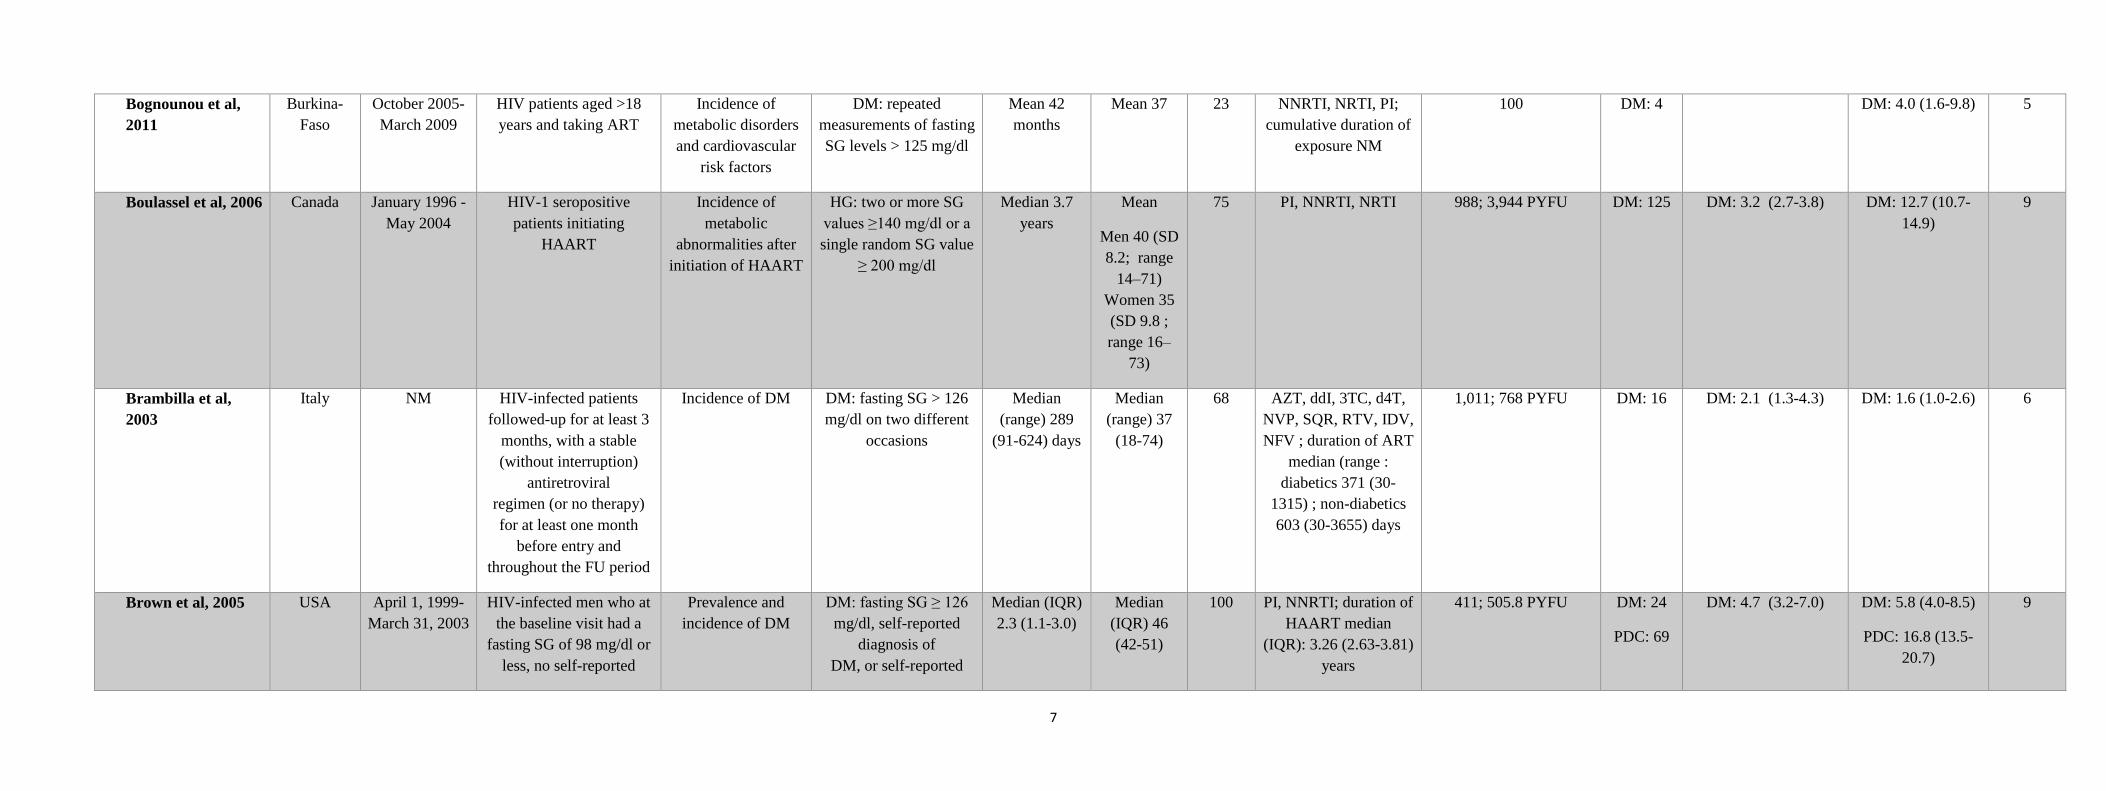
Bognounou et al,
2011
Burkina-
Faso
October 2005-
March 2009
HIV patients aged >18
years and taking ART
Incidence of
metabolic disorders
and cardiovascular
risk factors
DM: repeated
measurements of fasting
SG levels > 125 mg/dl
Mean 42
months
Mean 37 23 NNRTI, NRTI, PI;
cumulative duration of
exposure NM
100 DM: 4 DM: 4.0 (1.6-9.8) 5
Boulassel et al, 2006
Canada January 1996 -
May 2004
HIV-1 seropositive
patients initiating
HAART
Incidence of
metabolic
abnormalities after
initiation of HAART
HG: two or more SG
values ≥140 mg/dl or a
single random SG value
≥ 200 mg/dl
Median 3.7
years
Mean
Men 40 (SD
8.2; range
14–71)
Women 35
(SD 9.8 ;
range 16–
73)
75
PI, NNRTI, NRTI 988; 3,944 PYFU DM: 125 DM: 3.2 (2.7-3.8) DM: 12.7 (10.7-
14.9)
9
Brambilla et al,
2003
Italy NM
HIV-infected patients
followed-up for at least 3
months, with a stable
(without interruption)
antiretroviral
regimen (or no therapy)
for at least one month
before entry and
throughout the FU period
Incidence of DM DM: fasting SG > 126
mg/dl on two different
occasions
Median
(range) 289
(91-624) days
Median
(range) 37
(18-74)
68 AZT, ddI, 3TC, d4T,
NVP, SQR, RTV, IDV,
NFV ; duration of ART
median (range :
diabetics 371 (30-
1315) ; non-diabetics
603 (30-3655) days
1,011; 768 PYFU DM: 16 DM: 2.1 (1.3-4.3) DM: 1.6 (1.0-2.6) 6
Brown et al, 2005 USA April 1, 1999-
March 31, 2003
HIV-infected men who at
the baseline visit had a
fasting SG of 98 mg/dl or
less, no self-reported
Prevalence and
incidence of DM
DM: fasting SG ≥ 126
mg/dl, self-reported
diagnosis of
DM, or self-reported
Median (IQR)
2.3 (1.1-3.0)
Median
(IQR) 46
(42-51)
100 PI, NNRTI; duration of
HAART median
(IQR): 3.26 (2.63-3.81)
years
411; 505.8 PYFU DM: 24
PDC: 69
DM: 4.7 (3.2-7.0) DM: 5.8 (4.0-8.5)
PDC: 16.8 (13.5-
20.7)
9
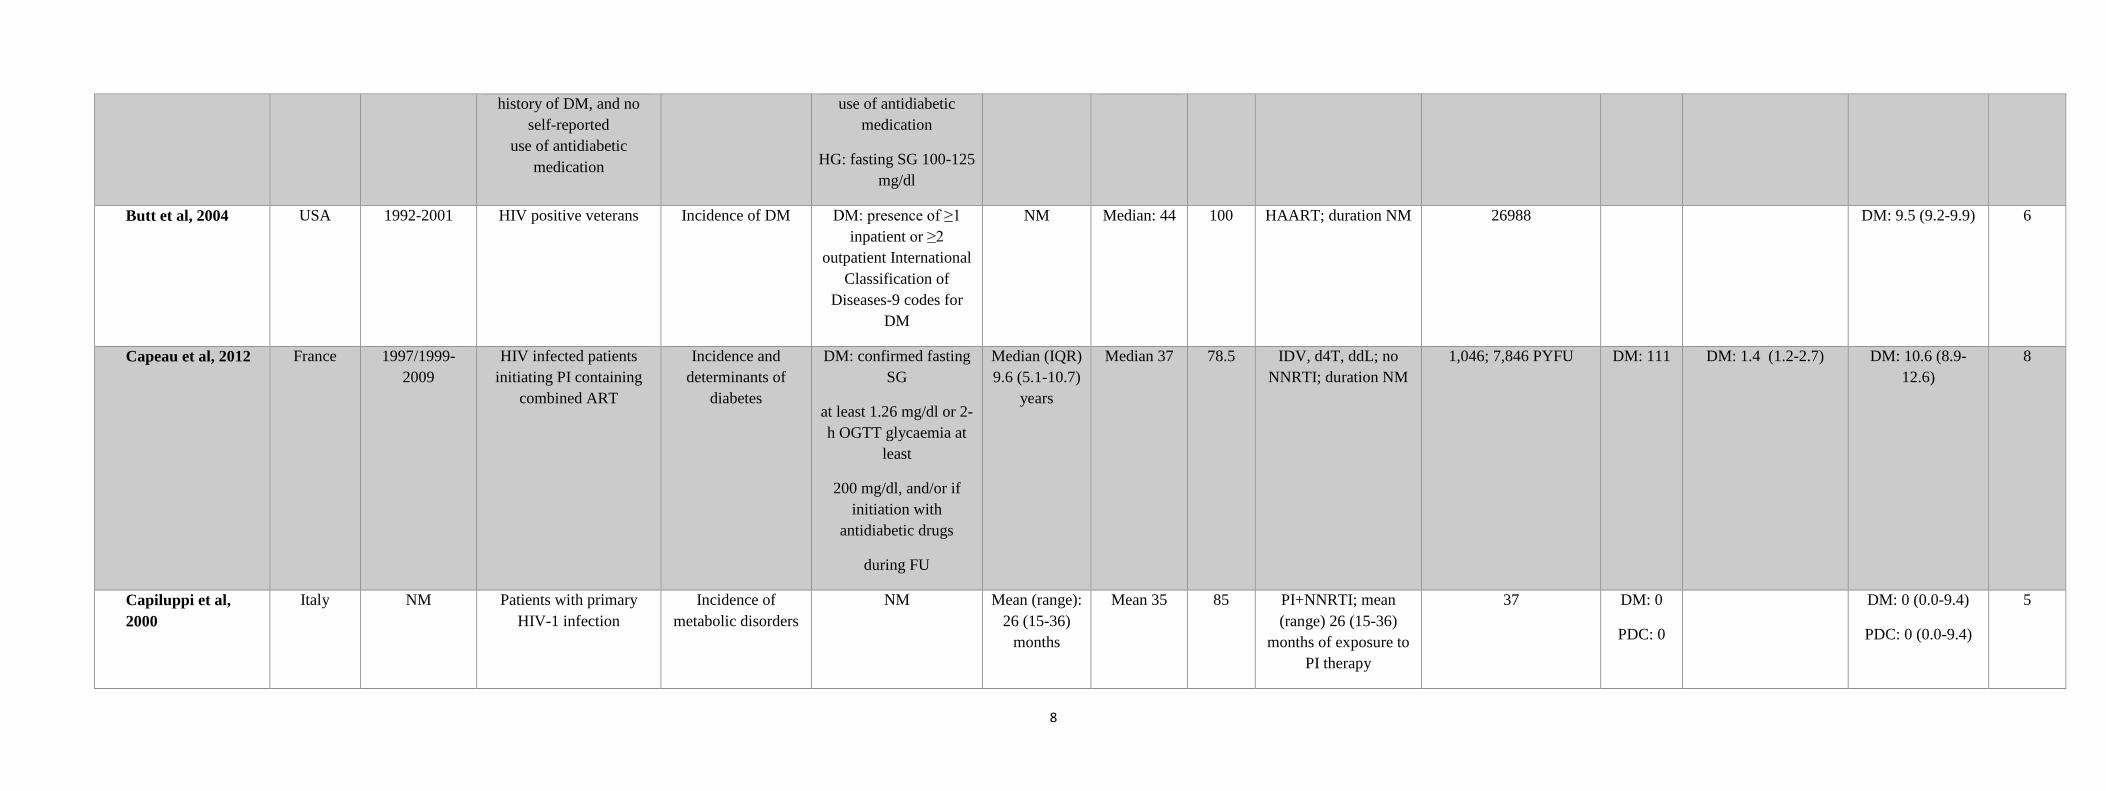
8
history of DM, and no
self-reported
use of antidiabetic
medication
use of antidiabetic
medication
HG: fasting SG 100-125
mg/dl
Butt et al, 2004 USA 1992-2001 HIV positive veterans Incidence of DM DM: presence of ≥1
inpatient or ≥2
outpatient International
Classification of
Diseases-9 codes for
DM
NM Median: 44 100 HAART; duration NM 26988 DM: 9.5 (9.2-9.9) 6
Capeau et al, 2012 France 1997/1999-
2009
HIV infected patients
initiating PI containing
combined ART
Incidence and
determinants of
diabetes
DM: confirmed fasting
SG
at least 1.26 mg/dl or 2-
h OGTT glycaemia at
least
200 mg/dl, and/or if
initiation with
antidiabetic drugs
during FU
Median (IQR)
9.6 (5.1-10.7)
years
Median 37 78.5 IDV, d4T, ddL; no
NNRTI; duration NM
1,046; 7,846 PYFU DM: 111 DM: 1.4 (1.2-2.7) DM: 10.6 (8.9-
12.6)
8
Capiluppi et al,
2000
Italy NM Patients with primary
HIV-1 infection
Incidence of
metabolic disorders
NM Mean (range):
26 (15-36)
months
Mean 35 85 PI+NNRTI; mean
(range) 26 (15-36)
months of exposure to
PI therapy
37 DM: 0
PDC: 0
DM: 0 (0.0-9.4)
PDC: 0 (0.0-9.4)
5
9
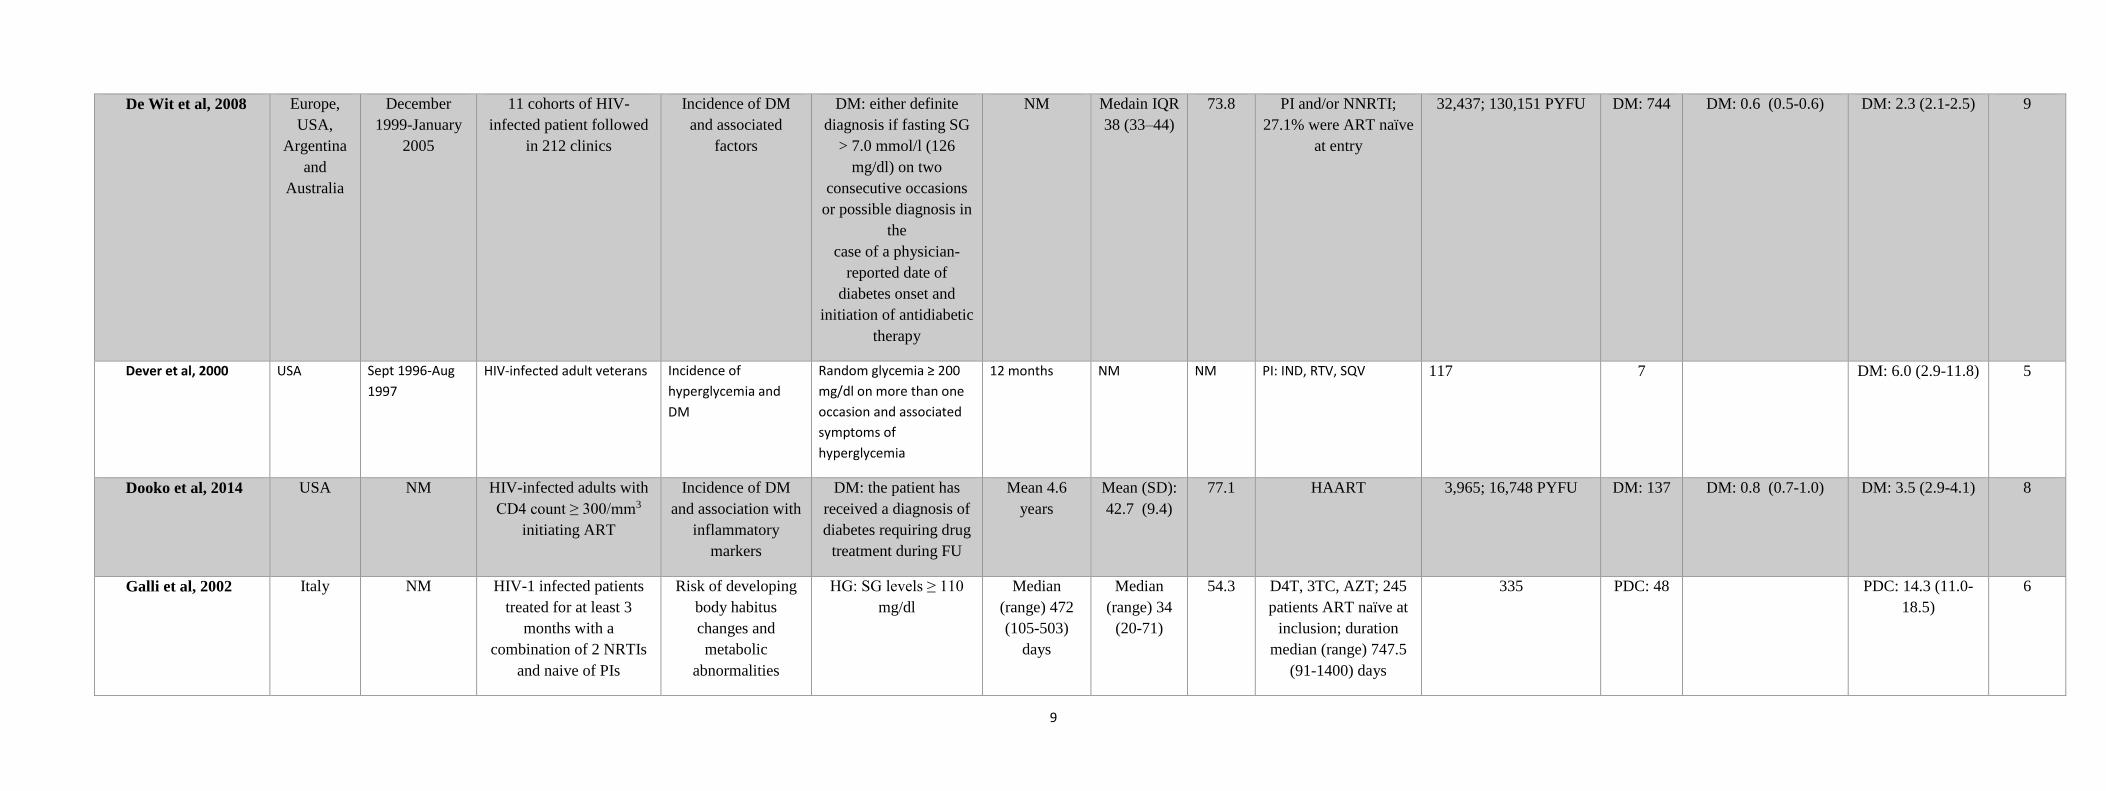
De Wit et al, 2008 Europe,
USA,
Argentina
and
Australia
December
1999-January
2005
11 cohorts of HIV-
infected patient followed
in 212 clinics
Incidence of DM
and associated
factors
DM: either definite
diagnosis if fasting SG
> 7.0 mmol/l (126
mg/dl) on two
consecutive occasions
or possible diagnosis in
the
case of a physician-
reported date of
diabetes onset and
initiation of antidiabetic
therapy
NM Medain IQR
38 (33–44)
73.8
PI and/or NNRTI;
27.1% were ART naïve
at entry
32,437; 130,151 PYFU
DM: 744 DM: 0.6 (0.5-0.6) DM: 2.3 (2.1-2.5) 9
Dever et al, 2000 USA Sept 1996-Aug
1997
HIV-infected adult veterans Incidence of
hyperglycemia and
DM
Random glycemia ≥ 200
mg/dl on more than one
occasion and associated
symptoms of
hyperglycemia
12 months NM NM PI: IND, RTV, SQV 117 7 DM: 6.0 (2.9-11.8) 5
Dooko et al, 2014 USA NM HIV-infected adults with
CD4 count ≥ 300/mm3
initiating ART
Incidence of DM
and association with
inflammatory
markers
DM: the patient has
received a diagnosis of
diabetes requiring drug
treatment during FU
Mean 4.6
years
Mean (SD):
42.7 (9.4)
77.1 HAART 3,965; 16,748 PYFU DM: 137 DM: 0.8 (0.7-1.0) DM: 3.5 (2.9-4.1) 8
Galli et al, 2002 Italy NM HIV-1 infected patients
treated for at least 3
months with a
combination of 2 NRTIs
and naive of PIs
Risk of developing
body habitus
changes and
metabolic
abnormalities
HG: SG levels ≥ 110
mg/dl
Median
(range) 472
(105-503)
days
Median
(range) 34
(20-71)
54.3 D4T, 3TC, AZT; 245
patients ART naïve at
inclusion; duration
median (range) 747.5
(91-1400) days
335 PDC: 48 PDC: 14.3 (11.0-
18.5)
6
10
García-Benayas et
al, 2006
Spain September
2002-June
2003
HIV subjects who had
completed
12 months of an
unmodified ART regimen
based on
ddI, TDF, or ddI+TDF,
and had available glucose
levels during
the entire FU
Incidence of HG DM: repeated
measurements of fasting
SG levels > 125 mg/dl
HG: fasting SG levels >
110 mg/dl
Mean 12
months
NM 80.8 ddI and/or TDF; ART
duration: 27 ± 13
months
177 DM: 12
PDC: 34
DM: 6.8 (3.9-11.5)
PDC: 19.2 (14.1-
25.6)
7
Gomes et al, 2016 Dominican
Republic
September 1,
2007-May 31,
2013
Participants ≥18 years,
initiating ART <90 days prior
to study enrollment
Incidence of IFG, DM,
overweight and
obesity
IFG: FPG 100-125 mg/dl;
DM: FPG ≥ 126 mg/dl or
anti-diabetic medication
Median 34.8
months
median age
of 39 (33-
45)
43% NRTIs (d4T, 3TC, FTC,
AZT, TDF, or ABC) +1 PI
(LPV/RTV) or 1 NNRTI
(NVP or
EFV)
DM: 113
IFG: 91
DM:6
PDC: 46
DM: 5.3 (2.5-11.1)
PDC: 50.5 (40.5-
60.6)
8
Gutpa et al, 2011 India Nov 2007-Oct
2009
HIV-infected adults ≥ 18
years taking ART
Morphological and
metabolic
complications
associated with
combined ART
IFG: FPG 100-125 mg/dl
DM: FPG ≥ 126 mg/dl
Six months Mean age:
35.9 years
57 (84%) AZT /d4T + 3TC +
NVP/EFV
68 DM: 3
PDC: 6
DM: 4.4 (1.5-12.2)
PDC: 8.8 (4.1-17.9
5
Herrin et al, 2016 USA 01/01/2000-
30/09/2011
ART naïve, HIV-1 RNA
>500 copies/ mL in the
180 days prior to ART
Association between
weight gain and
incident DM after
initiation of ART
DM: HbA1c ≥6.5 % Median 4.9
(IQR 2.6-5.0)
years
Median 50
(43-56)
years
96.8 NNRTI, PI, triple
nucleoside
7,177; 17,780 PYFU DM: 357 DM: 2.0 (1.8-2.2) DM: 5.0 (4.5-5.5) 9
11
initiation
Isa et al, 2016 Nigeria 1 January
2011-31
December 2013
ART naïve HIV infected
patients
Incidence of T2DM
after initiation of
ART
DM : random plasma
glucose level of
≥11.1 mmol/L, fasting
plasma glucose of ≥7.0
mmol/L, or
self-reported use of
hypoglycemic agents
12 months 37.4 ± 9.7
years
35.1 3TC + AZT + NVP ;
3TC
/FTC + TDF + EFV ;
ATV/RTV
; LPV/RTV
2,452 DM: 130 DM: 5.3 (4.5-6.3) 8
Justman et al, 2003
USA 1994-1998
Non-pregnant HIV-
infected women
Association between
PI use and incidence
of DM
DM: based on reported
occurrence since the last
study visit of DM
specifically or any new
illness or by review
(every 6 months) of the
complete list of
medications
Median 2.91
years
Median 37
0 PI; NNRTI; NRTI;
probably started at
inclusion
1,541; 2,193 PYFU DM: 38 DM: 1.7 (1.3-2.4) DM: 2.5 (1.8-3.4) 8
Karamchand et al,
2016
South
Africa
January 2002-
December 2011
HIV-infected adults ≥ 19
years, starting NNRTI-
based ART
Association between
efavirenz exposure
and incident DM
DM: initiation of
antidiabetic medication
Median 1.56
(IQR 0.71–
2.79) years
Median
38.14 (IQR
33.15-
44.26) years
35.92 NNRTI (EFV
containing ART; NVP
containing ART)
56,298; 113,297 PYFU DM:
1,500
DM: 1.3 (1.3-1.4) DM: 2.7 (2.5-2.8) 8
Ledergerber et al,
2007
Switzerland March 1st
2000-17 July
2006
HIV-1 infected
individuals aged ≥16
years with at least 2 study
New onset of DM DM: confirmed
plasma glucose level
cut-off values of 7.0
mmol/l (fasting)
Median 4.3
years
median
(IQR) 38
(34–44)
68.8 PI, NNRTI, NRTI;
27.2 % ART naïve at
inclusion; cumulative
6,513; 27,798 PYFU DM: 123 DM: 0.4 (0.4-0.5) DM: 1.9 (1.6-2.2) 9

12
visits and at least 1 year
of follow-up after 1
March 2000
and 11.1 mmol/l
(nonfasting)
duration of exposure
NM
Lichtenstein et al,
2015
USA 2002-2011 HIV infected adults with at
least two visits
Incidence of DM and
association with statin
use
At least one FPG>125
mg/dl or 2h-PG >200
mg/dl or anti-diabetic
medication for at least 30
continuous days
Median of 4.6
years
(interquartile
range: 1.8–9.0)
NM 3661
(78%)
NM 4692 355 DM: 7.6 (6.8-8.4) 8
Lo et al, 2009 Taiwan January 1993-
December 2007
HIV-infected patients
receiving combination
antiretroviral therapy who
made at least
two visits to the study site
and had FU for 1 year or
more after January 1993
Incidence and risk
factors for DM
DM: at least two
separate fasting SG
levels
above 126 mg/dl during
FU
Mean 4.6
years
Median
(IQR) 34
(28-40)
92.1
NRTI, NNRTI, PI;
duration of cumulative
ART NM
824; 3,829 PYFU DM: 50 DM: 1.3 (1.0-1.7) DM: 6.1 (4.6-7.9) 6
Magula et al, 2014 South
Africa
NM HIV adult subjects of
second-generation Zulu
descent
Eligible for ART
Prevalence,
incidence and
predictors of
dysglycemia
WHO definition for
DM, IGT and IFG using
OGTT and HbA1c
24 months NM NM ART duration 24
months
150; 219 PYFU DM: 53
PDC: 23
DM: 5.9 (3.5-9.9)
PDC: 10.0 (7.1-15.3)
DM: 8.7 (5.1-14.3)
PDC: 15.3 (10.4-
22.0)
8
Mehta et al, 2003 USA January 1996-
May 2002
Patients on their first
HAART regimen with at
least one random glucose
before and during ART
Prevalence and
incidence of HG
among HIV-infected
DM: either 2 random
SG levels > 200 mg/dl
or documentation of
Median (IQR)
8.9 (3.9-20.7)
months
Median
(IQR)
69.9 PI; NNRTI; PI+NNRTI 1,149; 1,808 PYFU DM: 47 DM: 2.6 (2.0-3.4) DM: 4.1 (3.1-5.4) 9

13
patients by HCV and
type of HAART
DM in the medical
record
HCV-: 35
(29-40)
HCV+: 39
(34-43)
Narciso et al, 2001
Italy May 1997-
April 2001
Patients diagnosed with
primary HIV infection
Morphologic and
metabolic disorders
in patients treated
with HAART since
primary
HIV infection
HG: at least one fasting
SG value >110 mg/dl
during FU
Median
(range) 19.0
(3-47) months
Median
(range) 31
(18-54)
85.4
IND-AZT-3TC; NEL-
AZT-3TC; IND-d4T-
3TC; EFV-AZT-3TC;
NVP-AZT-3TC
41 PDC: 0 0 (0.0-8.6) 6
Ndona et al, 2012 D R Congo 2004-2008 HIV infected patients Incidence and
predictors of type 2
diabetes
DM: fasting SG levels ≥
126 mg/dl measured on
two consecutive
occasion and/or 2H-
glucose post load
plasma glucose ≥ 200
mg/dl
NM Mean
43±9.2
42.9 Combination of d4T +
3TC, AZT + 3TC +
NVP, or EFV; Mean
duration on ART 25 ±
15 months
49 DM: 4 DM: 8.2 (3.2-19.2) 7
Palacios et al, 2003 Spain From January
1997 to
December 2001
HIV infected patient on
HAART
Risk factors for new
onset DM
DM was defined
according to
international criteria
(1998), they did not
specify
5 years Mean: 48.6
(33-67)
Not
reported
Not clearly reported.
But PI use reported
745 DM: 34
PDC: 71
DM: 4.6 (3.3-6.3)
PDC: 9.5 (7.6-
11.9)
8

14
Pinto Neto et al,
2013
Brazil January 2008-
May 2011
HIV-1 infected adults
(18+ years)visiting an
AIDS outpatient clinic
Cumulative
incidence of
dyslipidemia and
fasting glucose
impairment
IFG: fasting SG levels >
99mg/dl; DM: fasting
SG levels > 126 mg/dl
36 months Median 45
(IQR 37-52)
58.9 NRTI, NNRTI, PI;
duration 36 months
454 DM : 454
PDC :
141
DM : 3.7 (2.4-5.9)
PDC : 31.1 (27.0-
35.5)
8
Putcharoen et al, 2017 Thailand July 1, 1996-
April 30, 2015
HIV-infected adults > 18
years with at least 2 study
visits and a minimum of 1
year of FU on ART and
without DM
Incidence and factors
associated with
developing DM
Two consecutive FPG
>126 mg/dl or reporting
anti-diabetic medication
Median FU 9
(IQR 3.9-14.7)
Median age
at ART
initiation
32.2 (IQR
27.4-37.8)
years
1051
(60.1%)
NNRTI, PI 1,748; 16,274 PYFU DM: 123 DM: 7.6 (6.3-9.0) DM: 7.0 (5.9-8.3) 8
Rasmussen et al, 2012 Denmark 1 January 1996
to 1 January
2010
HIV-infected Danish-borned
individuals aged ≥ 16 years
Risk of DM in HIV-
infected individuals
compared
to that of the general
population
Medical report of anti-
diabetic medication
Median 8.0
(3.4–14.0)
Median 38.7
(32.2–46.6)
2,977
(84.1%)
NM 3,540; 28,342 PYFU 90 DM: 3.2 (2.6-3.9) DM: 2.5 (2.1-3.1) 9
Riyatenet al, 2015 Thailand January 2000-
December 2011
HIV-1 infected patients
aged ≥ 18 years and ART
naive
New-onset DM and
associated factors
DM: confirmed fasting
SG levels ≥ 126mg/dl or
random SG ≥ 200mg/dl
Median
(IQR): 6.9
(4.9-8.2) years
Median
(IQR) 32.5
(28.2-37.7)
24 PI, NNRTI, NRTI 1,594; 10,507 PYFU DM: 53 DM: 0.5 (0.4-0.7) DM: 3.3 (2.6-4.3) 8
Salehian et al, 2005 USA August 1999-
September
2002
HIV positive patients Prevalence and
incidence of DM
DM: fasting SG >126
mg/dl and/or any
random SG >200 mg/dl
at two different times
NM mean
36±2,5
years in non
PI users (18)
and 40±1
70 PI NNRTI
NRTI; ART
commenced before
inclusion mean (SD):
non PI users 2.25 (0.7);
101 DM: 4
PDC: 10
DM: 4.0 (1.6-9.7)
PDC: 9.9 (5.5-
17.3)
8
15
and/or use of any
antidiabetic medications
year among
PI users (83)
PI users 4.08 (0.37)
years
Spagnuo et al, 2017 Italy Jan 1991-Nov
2014
HIV-1 infected adults
starting ART; no DM and no
statins at inclusion
Evaluate the
associations of statin
use and exposure to
antiretroviral drugs
with the onset of type
2 DM
2 consecutive FPG ≥ 126
mg/dl or 2h-PG ≥ 200
mg/dl (after OGTT) or 2
fasting HbA1c ≥ 48
mmol/mol or anti-
diabetic prescription
9.8 years
(interquartile
range: 4.3–16.3
years)
median
duration of ART
was
10 years (IQR:
4–16 years)..
Median 47.2
years (IQR:
40.6–52.7
years)
4,828
(78%)
NRTIs (97%); PIs (79%);
NNRTI (61%); integrase
strand transfer inhibitors
(12%) and entry
inhibitors (9%)
235; 64149 PYFU 235 DM: 3.7 (3.2-4.2) DM: 3.8 (3.3-4.3) 8
Squillace et al, 2016 Italy 01/01/1997-
2013
HIV-positive naïve
patient
Incidence of DM
arising during
combination ART
DM: two consecutive
blood glucose values
of.126 mg/dL
(7 mmol/L), clinical
diagnosis of DM or start
of antidiabetic treatment
NM Median 38
(IQR 33-45)
years
73.7 NRTI, NNRTI, PI 3,546; 13,911 PYFU DM: 80 DM: 0.6 (0.5-0.7) DM: 2.3 (1.8-2.8) 8
Tien et al, 2007 USA October 2000-
March 2006
Incidence of DM HIV infected women
with no evidence of
DM at
enrollment
DM: either fasting SG
≥1.26 g/l, reporting
antidiabetic medication,
or reporting DM
diagnosis (with
subsequent
confirmation by fasting
NM median
(IQR) 39.2
(33.4-45.2)
0 PI, NRTI, NNRTI;
duration of ART NM
1,283; 3,326 PYFU DM: 91 DM: 2.7 (2.2-2.3) DM: 7.1 (5.8-8.6) 9
16
SG ≥1.26 g/l or reported
antidiabetic medication)
Tripathi et al, 2014 USA 1st January
1994-31st
December 2011
HIV infected adults 18+
years on combined ART
for at least 30 days
Incidence of DM DM: at least 2visit
claims with
International
Classification of
Diseases-9 codes for
Type 1 or Type 2
diabetes mellitus and/or
prescription of anti-
diabetic
medications including
insulin for at least 30
days
Median 70
months (IQR
23-105)
Median 39
(IQR 31-46)
56.8 PI or NNRTI or or
NRTIPI+NNRTI;
duration NM
5,478; 37,181 PYFU DM: 422 DM: 1.1 (1.0-1.2) DM: 7.7 (7.0-8.4) 9
Tsiodras et al, 2000 Boston,
USA
October 1,
1993-July 31,
1998
HIV-1 infected adults,
minimum of 6 months of
FU, measurement of SG
at least twice during the
FU period, and survival
until Nov 1997
Temporal trends in
SG and lipid levels,
and associated risk
factors after
initiation of PI
therapy
HG: 2 or more SG
values ≥ 140 mg/dl
during FU; DM: a
single random SG value
≥ 200 mg/dl
Mean (SD):
45 (12.9)
months
Mean (SD) :
36.8 (0.5)
77
PIs, NRTIs; ART was
commenced before
inclusion; duration NM
207; 858 PYFU DM: 23
PDG: 11
DM: 2.7 (1.8-4.0)
PDG: 1.3 (0.7-2.3)
DM: 10.4 (7.0-
15.1)
PDC: 5.0 (2.8-8.7)
9
Wand et al, 2007 Australia NM HIV infected individuals
initiating ART regimen
3-year incidence of,
and predictive
factors for metabolic
DM: fasting SG >7
mmol/l
or non-fasting SG >11.1
Median (IQR)
192 (165-215)
weeks
Mean (SD)
38.7 (10)
62.2
EFV, NFV 881; 820 PYFU DM: 41 DM: 5.0 (3.7-6.7) DM: 4.7 (3.4-6.3) 6

17
syndrome,
cardiovascular
disease and DM
mmol/l in the absence
of
symptoms of diabetes
Wong et al, 2017 USA, Canada Jan 1, 2000-Dec
31, 2013
HIV-infected adults ≥ 18
years initiating ART
Estimate the rates of
first documented
occurrence of
hypertension, DM and
CKD
HbA1c≥6.5% and/or anti-
diabetic medication
Median follow-
up was 4.8
(IQR, 2.8–8.0)
years
NM 72463
(83.5%)
NM 86789; 476176 PYFU 5,881 DM: 12.4 (12.0-12.7) DM: 6.8 (6.6-6.9) 8
Wu et al, 2016 Taiwan 2004-2015 ART-naïve adults without
DM
Incidence of DM
among ART-naïve
HIV adults initiating
ART
DM: fasting glucose
≥126 mg/dL or HbA1C
≥6.5%.
NM NM NM DRV, TDF/3TC, d4T,
ddl
1432; 7632 PYFU 8
Zannou et al, 2009 Benin October 2004-
June 2005
16+ years old HIV
infected, Karmofsky
index > 70%, eligible to
start combination ART
according to WHO
criteria, and consenting to
participate in the study
Incidence of
lipodystrophy and
metabolic
abnormalities, and
associate factors
DM:
fasting SG at 1,26g/l
and above
Median (IQR)
23.2 ( 22.3-
23.7) months
Mean (SD)
38 (9.7)
40.5 NNRTI, NRTI, PI
79; 1,779.25 PYFU DM: 6 DM: 0.3 (0.2-0.7) DM: 7.6 (3.5-15.6) 6
Zhang et al, 2015 China November
2008-January
2010
ART-naïve HIV infected
patients between 18 and
65 years
Incidence of DM
and IFG
Fasting SG levels ≥7.0
mmol/l (126 mg/dl) for
DM, and
Mean 96
weeks
Median
(IQR) 34
(27-41)
74 ZDV+3TC+NVP;
d4T+3TC+NVP;
415; 457.35 PYFU DM: 12
PDC: 163
DM: 2.6 (1.5-4.5)
PDC: 35.6 (31.4-40.1)
DM: 2.9 (1.7-5.0)
PDC: 39.3 (34.7-
44.1)
8
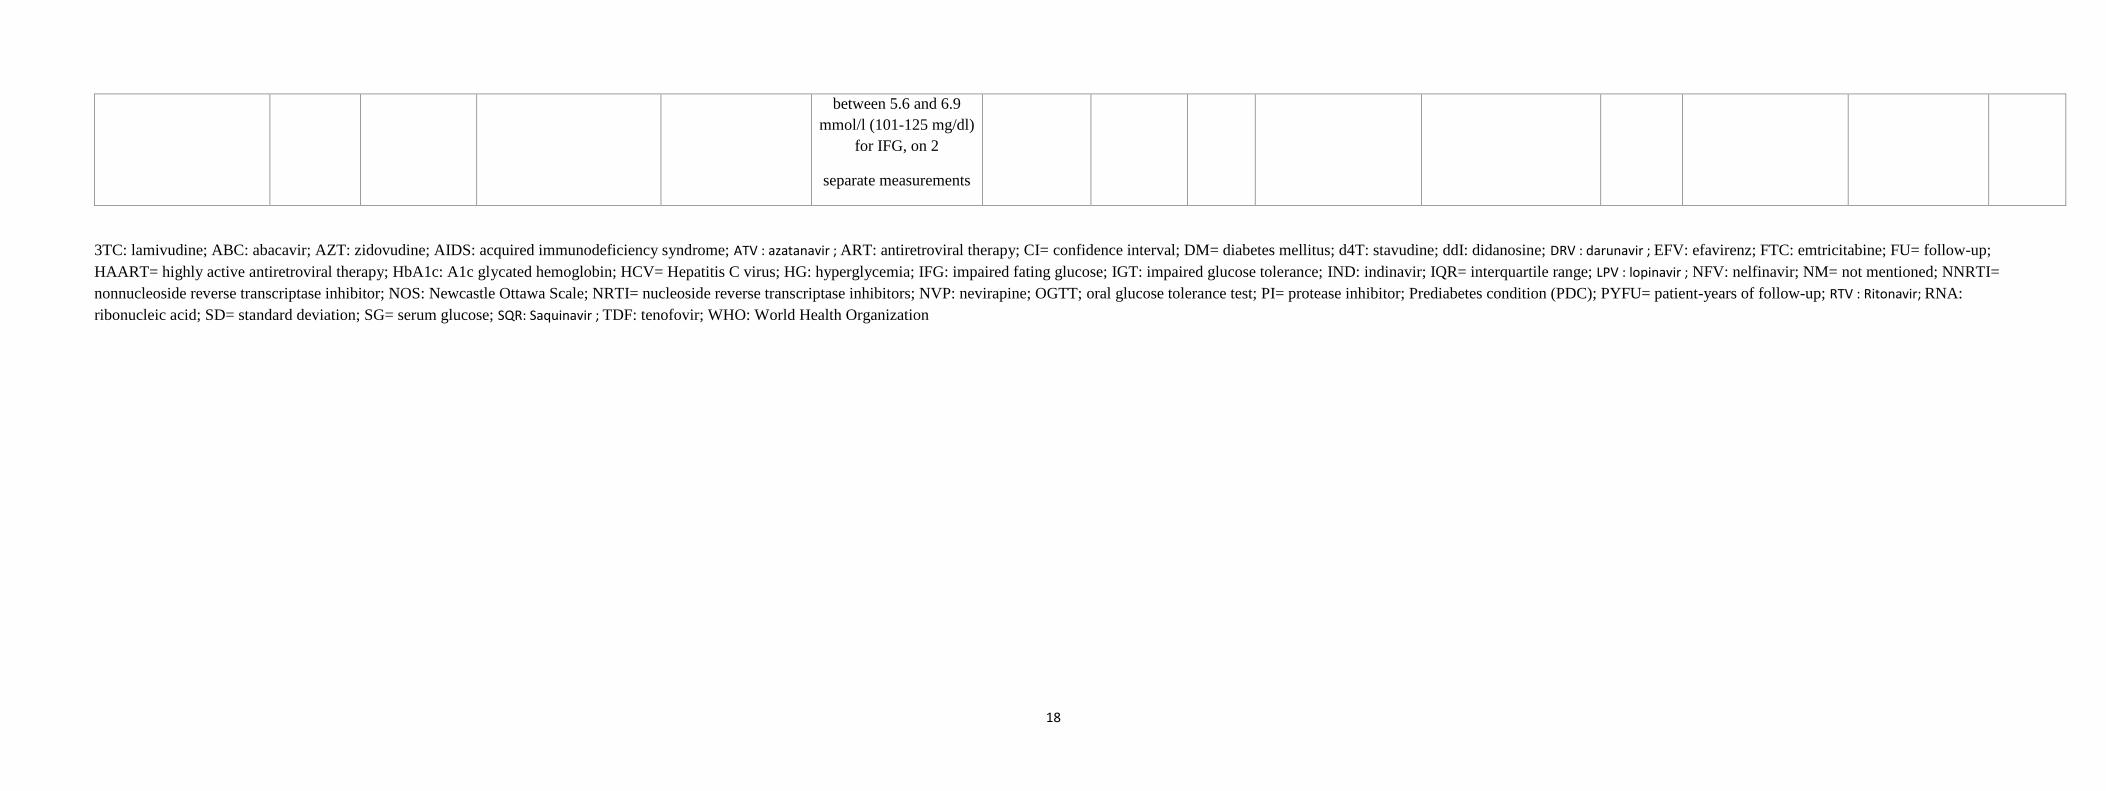
18
between 5.6 and 6.9
mmol/l (101-125 mg/dl)
for IFG, on 2
separate measurements
3TC: lamivudine; ABC: abacavir; AZT: zidovudine; AIDS: acquired immunodeficiency syndrome; ATV : azatanavir ; ART: antiretroviral therapy; CI= confidence interval; DM= diabetes mellitus; d4T: stavudine; ddI: didanosine; DRV : darunavir ; EFV: efavirenz; FTC: emtricitabine; FU= follow-up;
HAART= highly active antiretroviral therapy; HbA1c: A1c glycated hemoglobin; HCV= Hepatitis C virus; HG: hyperglycemia; IFG: impaired fating glucose; IGT: impaired glucose tolerance; IND: indinavir; IQR= interquartile range; LPV : lopinavir ; NFV: nelfinavir; NM= not mentioned; NNRTI=
nonnucleoside reverse transcriptase inhibitor; NOS: Newcastle Ottawa Scale; NRTI= nucleoside reverse transcriptase inhibitors; NVP: nevirapine; OGTT; oral glucose tolerance test; PI= protease inhibitor; Prediabetes condition (PDC); PYFU= patient-years of follow-up; RTV : Ritonavir; RNA:
ribonucleic acid; SD= standard deviation; SG= serum glucose; SQR: Saquinavir ; TDF: tenofovir; WHO: World Health Organization

19
eTable 2: Global and regional incidence of diabetes mellitus among HIV-infected people on antiretroviral therapy
Regions #Studies #Total
PYFU
#Cases Estimate, by
1,000 PYFU
(95%CI)
I², % p-
heterogeneity
p-Egger p-
difference
Incidence rate < 0.001
Global 29 396,496 4,035 13.7 (11.4-16.3) 98.7 < 0.001 0.323 < 0.001*
Intercontinental 1 130,151 744 5.7 (5.3-6.1) - - NE
Africa 3 115,295 1,519 15.9 (4.4-33.9) 94.6 < 0.001 0.817
Americas 12 584,401 7,506 19.1 (15.9-22.6) 96.1 < 0.001 0.013
Europe 7 143,585 677 8.0 (5.4-11.2) 96.4 < 0.001 0.010
South-East Asia 2 26,781 176 6.5 (5.6-7.5) 99.4 < 0.001 NE
Western Pacific 4 12,739 131 19.0 (5.7-39.7) 97.2 < 0.001 0.143
Cumulative
incidence
#Sample
size
Estimate, %
(95%CI)
Global 41 158,456 6,754 4.9 (4.0-5.9) 98.9 < 0.001 0.899 < 0.001
Intercontinental 1 32,437 744 2.3 (2.1-2.5) - - NE < 0.001*
Africa 6 59,128 1,657 5.1 (3.0-7.8) 92.3 < 0.001 0.063
Americas 12 141,467 10,098 6.1 (5.1-7.2) 97.2 < 0.001 0.540
Europe 10 23,075 723 3.8 (2.5-5.2) 95.4 < 0.001 0.234
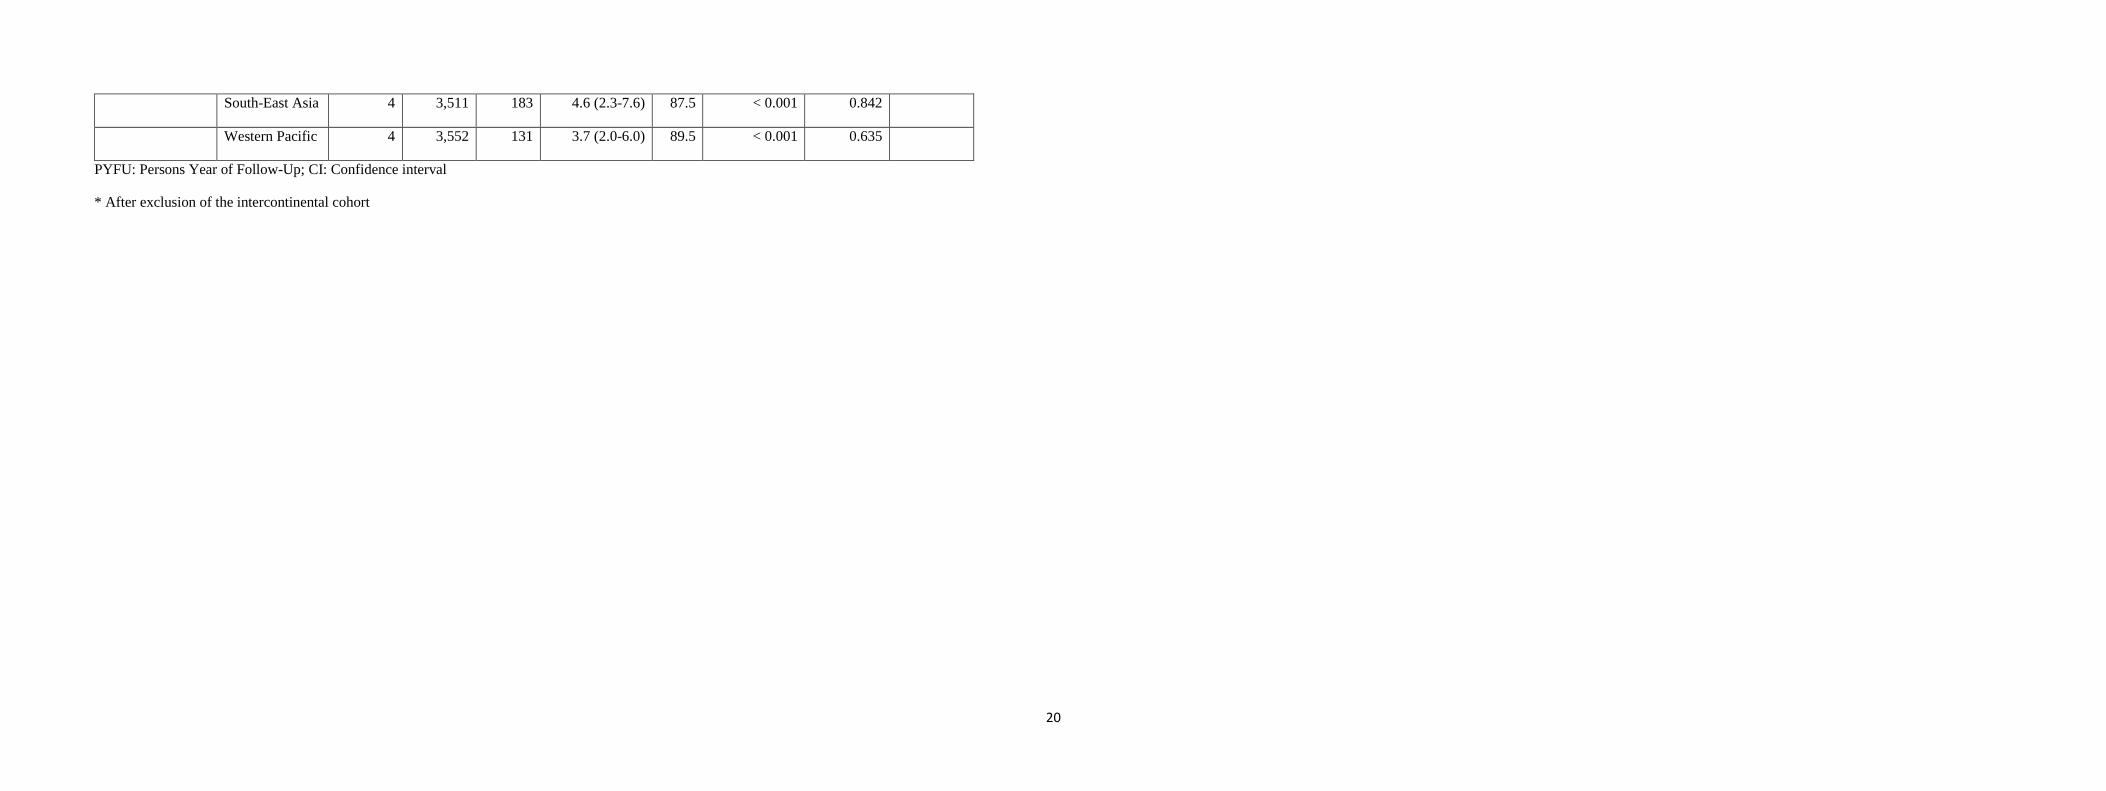
20
South-East Asia 4 3,511 183 4.6 (2.3-7.6) 87.5 < 0.001 0.842
Western Pacific 4 3,552 131 3.7 (2.0-6.0) 89.5 < 0.001 0.635
PYFU: Persons Year of Follow-Up; CI: Confidence interval
* After exclusion of the intercontinental cohort
21
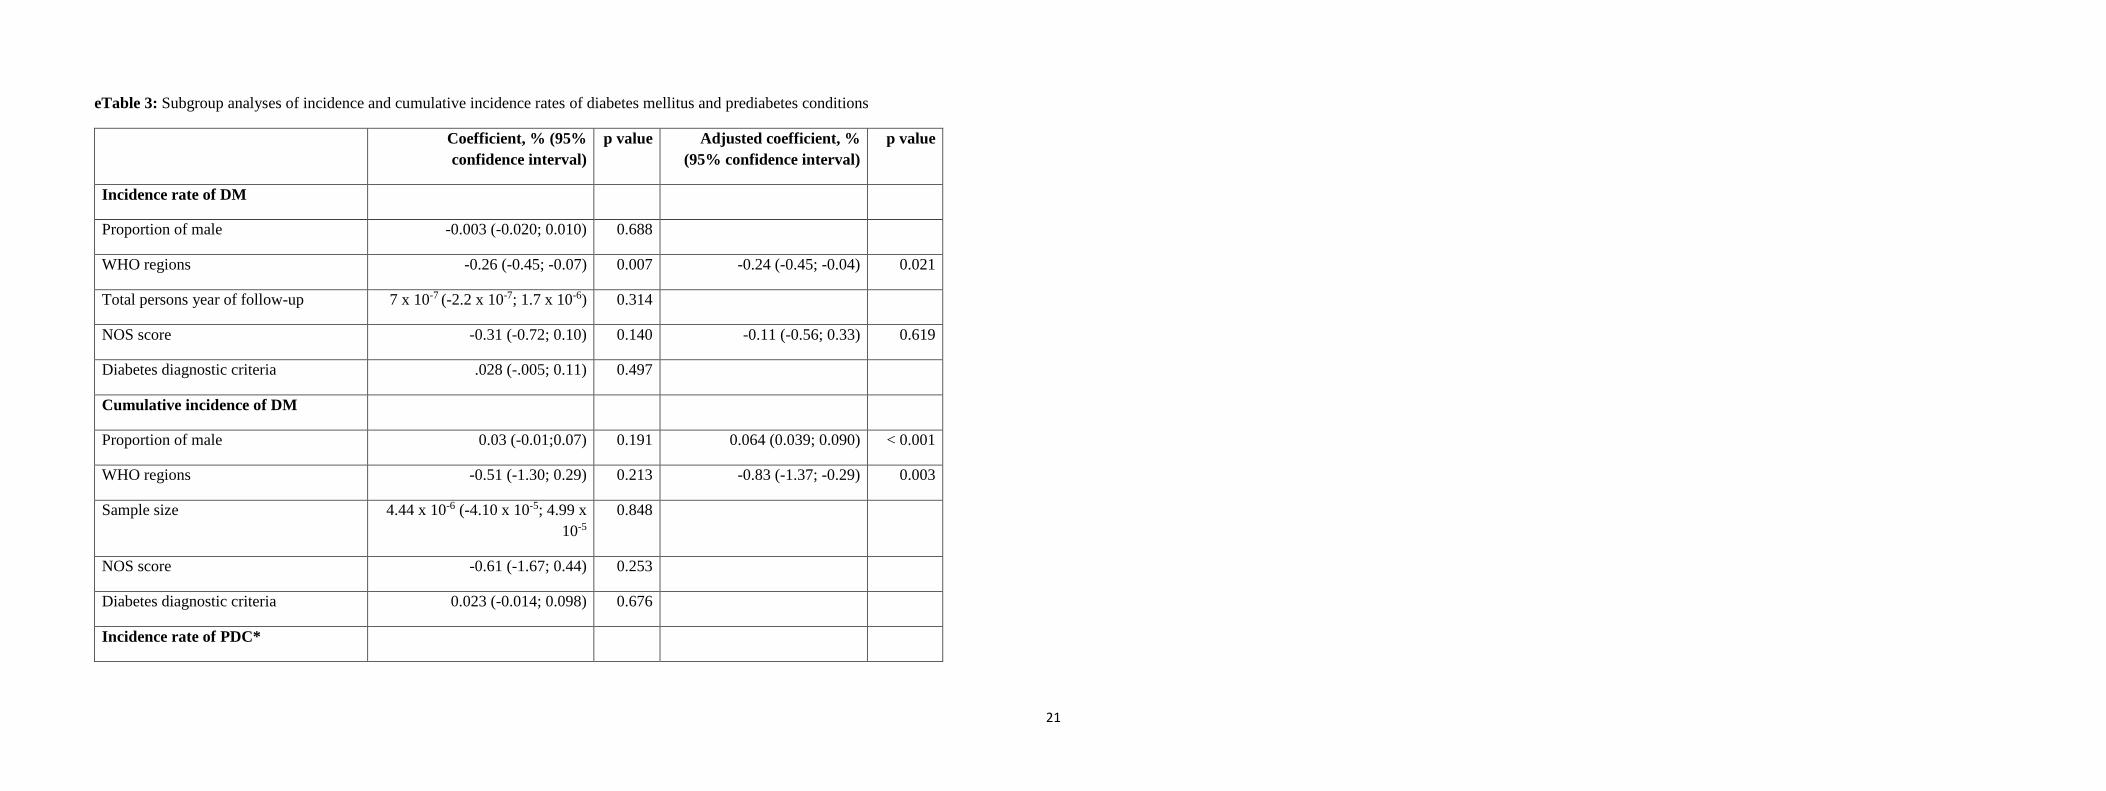
eTable 3: Subgroup analyses of incidence and cumulative incidence rates of diabetes mellitus and prediabetes conditions
Coefficient, % (95%
confidence interval)
p value Adjusted coefficient, %
(95% confidence interval)
p value
Incidence rate of DM
Proportion of male -0.003 (-0.020; 0.010) 0.688
WHO regions -0.26 (-0.45; -0.07) 0.007 -0.24 (-0.45; -0.04) 0.021
Total persons year of follow-up 7 x 10⁻⁷ (-2.2 x 10⁻⁷; 1.7 x 10⁻⁶) 0.314
NOS score -0.31 (-0.72; 0.10) 0.140 -0.11 (-0.56; 0.33) 0.619
Diabetes diagnostic criteria .028 (-.005; 0.11) 0.497
Cumulative incidence of DM
Proportion of male 0.03 (-0.01;0.07) 0.191 0.064 (0.039; 0.090) < 0.001
WHO regions -0.51 (-1.30; 0.29) 0.213 -0.83 (-1.37; -0.29) 0.003
Sample size 4.44 x 10⁻⁶ (-4.10 x 10⁻⁵; 4.99 x
10-5
0.848
NOS score -0.61 (-1.67; 0.44) 0.253
Diabetes diagnostic criteria 0.023 (-0.014; 0.098) 0.676
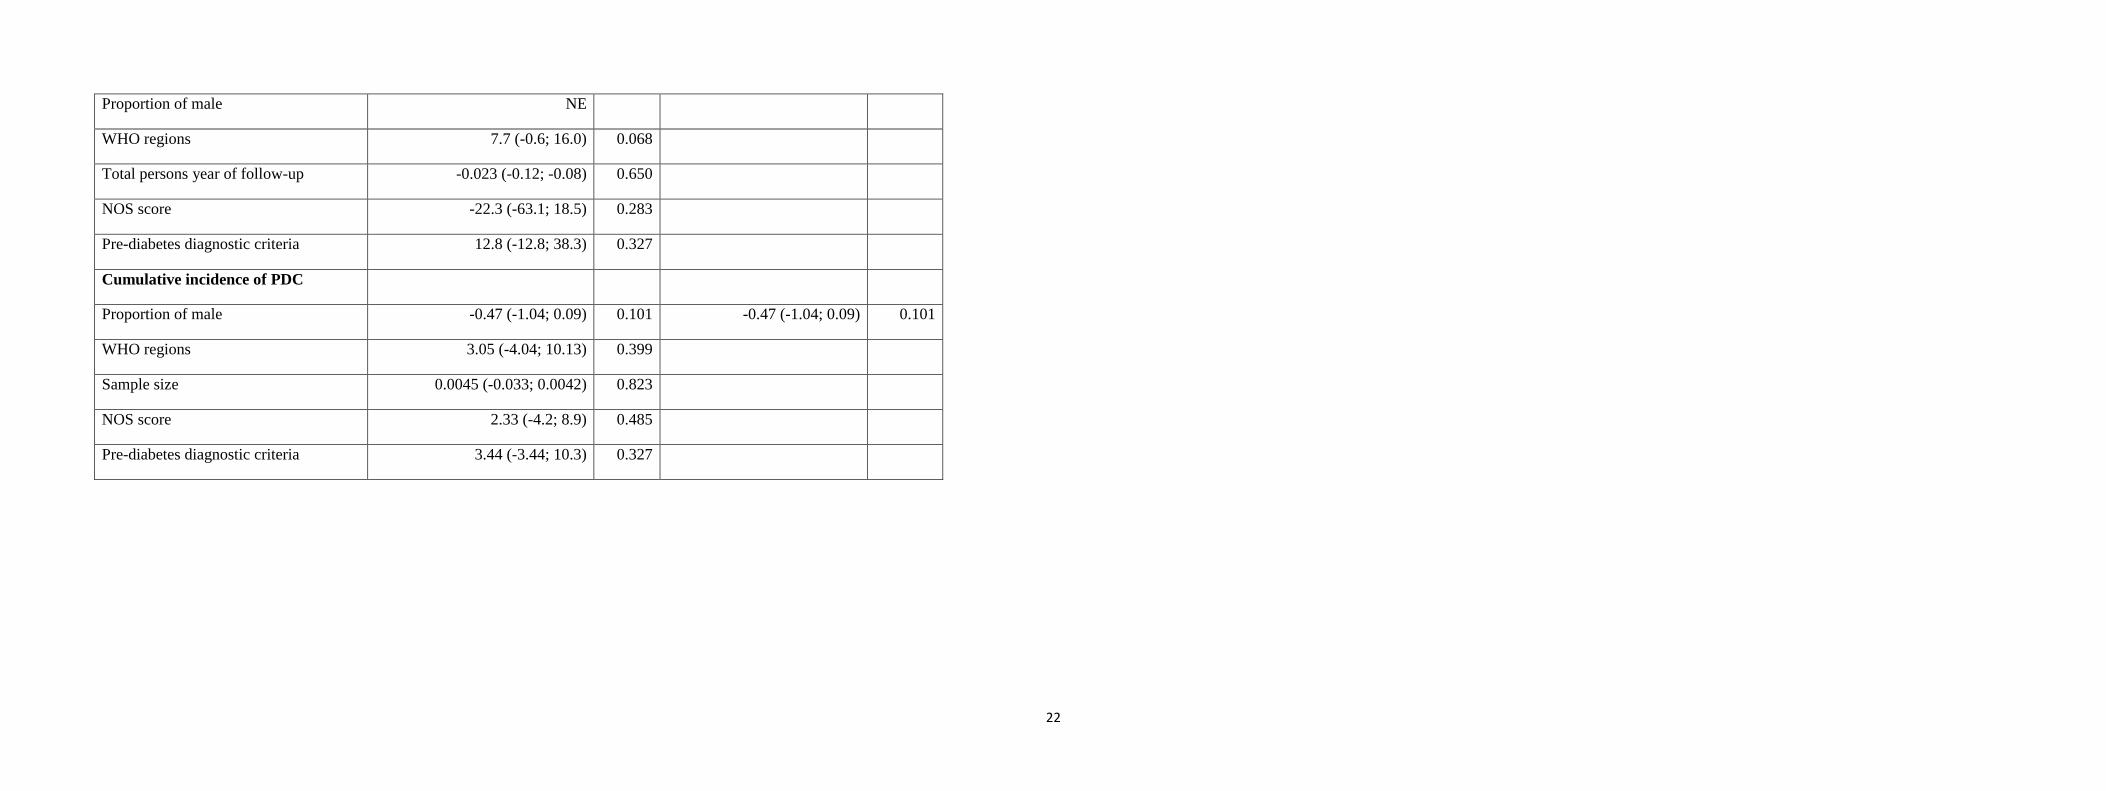
Incidence rate of PDC*
22
Proportion of male NE
WHO regions 7.7 (-0.6; 16.0) 0.068
Total persons year of follow-up -0.023 (-0.12; -0.08) 0.650
NOS score -22.3 (-63.1; 18.5) 0.283
Pre-diabetes diagnostic criteria 12.8 (-12.8; 38.3) 0.327
Cumulative incidence of PDC
Proportion of male -0.47 (-1.04; 0.09) 0.101 -0.47 (-1.04; 0.09) 0.101
WHO regions 3.05 (-4.04; 10.13) 0.399
Sample size 0.0045 (-0.033; 0.0042) 0.823
NOS score 2.33 (-4.2; 8.9) 0.485
Pre-diabetes diagnostic criteria 3.44 (-3.44; 10.3) 0.327

23
eTable 4: Global and regional incidence of prediabetes conditions among HIV-infected people on antiretroviral therapy
Condition Regions #Studies #Total
PYFU
#Cases Estimate, by
PYFU (95%CI)
I², % p-
heterogeneity
p-egger
Incidence rate
Global 3 1,532 197 12.5 (0.0-42.3) 99.4 < 0.001 0.721
Africa 1 216.3 23 10.6 (7.1-15.3) - - -
Americas 1 858 11 1.3 (0.7-2.3) - - -
Western Pacific
Asia
1 457.53 163 35.6 (31.4-40.1) - - -
Cumulative
incidence
#Sample
size
Estimate, %
(95%CI)
Global 13 3,347 640 14.9 (9.1, 21.8) 96.0 < 0.001 0.703
Africa 1 150 23 15.3 (10.4-22.0) - - -
Americas 5 1,278 277 12.0 (3.4, 24.5) 96.9 < 0.001 0.959
Europe 5 1,335 153 7.7 (3.2-13.9) 89.0 < 0.001 0.710
South-East Asia 2 169 24 13.9 (9.0-19.6) 97.2 < 0.001 -
Western Pacific 1 415 163 39.3 (34.7-44.1) - - -
24
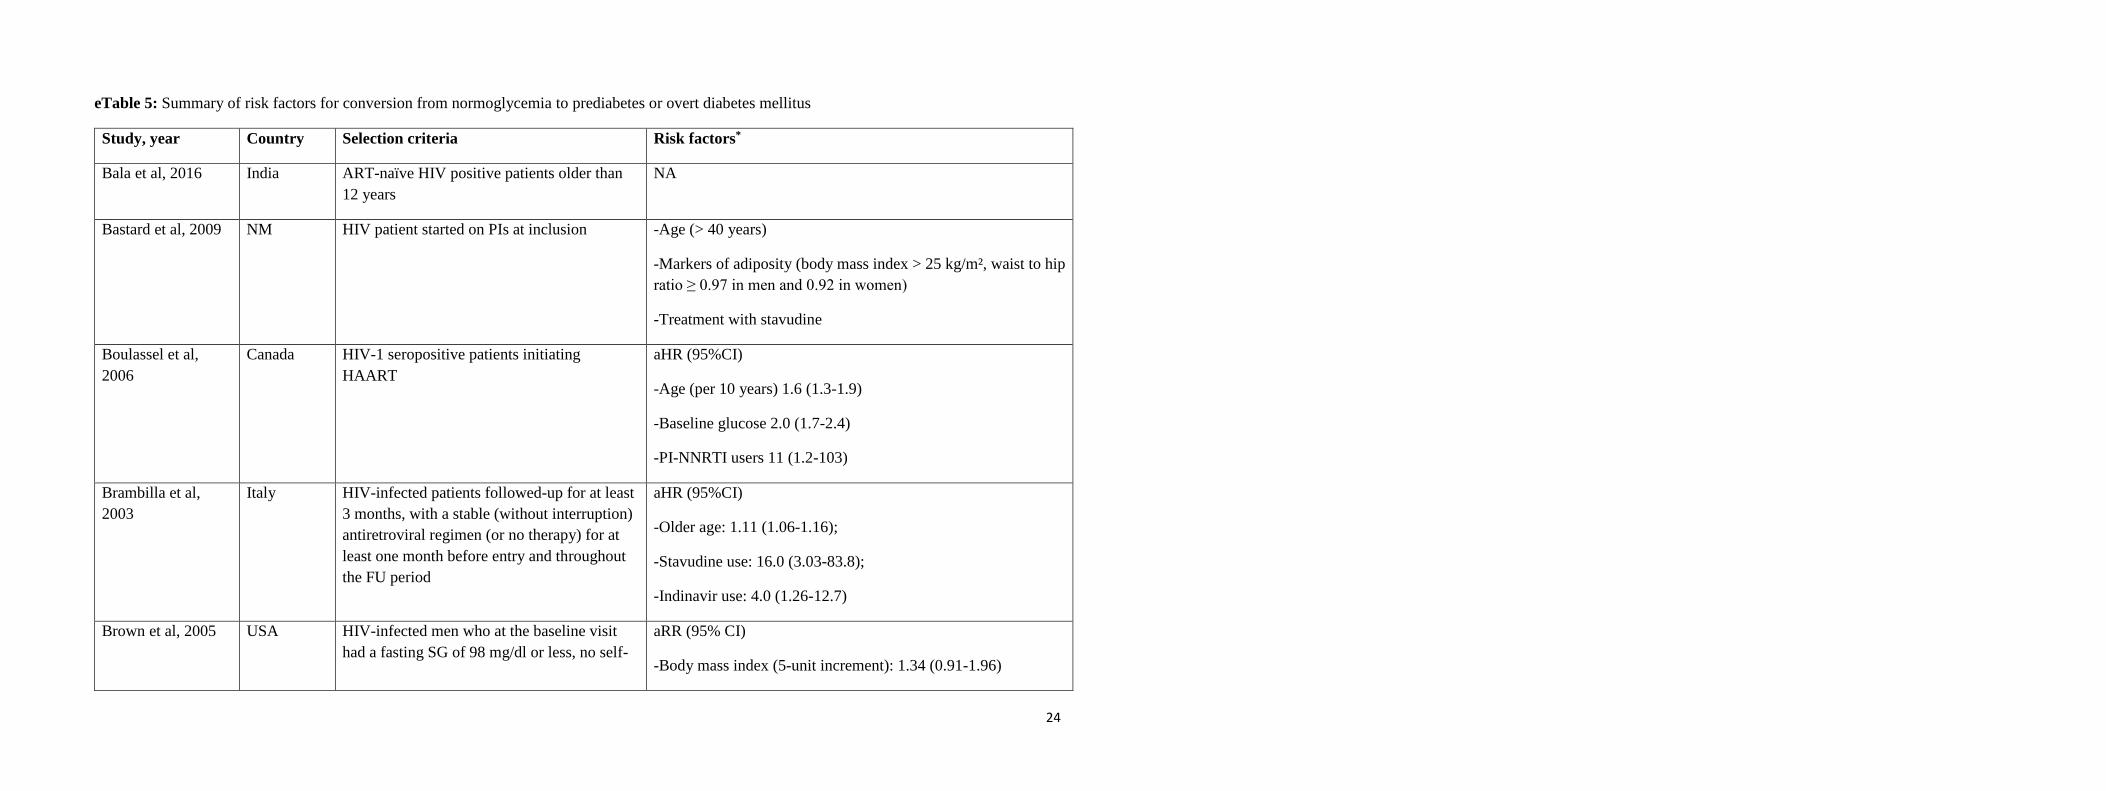
eTable 5: Summary of risk factors for conversion from normoglycemia to prediabetes or overt diabetes mellitus
Study, year Country Selection criteria Risk factors*
Bala et al, 2016 India ART-naïve HIV positive patients older than
12 years
NA
Bastard et al, 2009
NM HIV patient started on PIs at inclusion -Age (> 40 years)
-Markers of adiposity (body mass index > 25 kg/m², waist to hip
ratio ≥ 0.97 in men and 0.92 in women)
-Treatment with stavudine
Boulassel et al,
2006
Canada HIV-1 seropositive patients initiating
HAART
aHR (95%CI)
-Age (per 10 years) 1.6 (1.3-1.9)
-Baseline glucose 2.0 (1.7-2.4)
-PI-NNRTI users 11 (1.2-103)
Brambilla et al,
2003
Italy HIV-infected patients followed-up for at least
3 months, with a stable (without interruption)
antiretroviral regimen (or no therapy) for at
least one month before entry and throughout
the FU period
aHR (95%CI)
-Older age: 1.11 (1.06-1.16);
-Stavudine use: 16.0 (3.03-83.8);
-Indinavir use: 4.0 (1.26-12.7)
Brown et al, 2005 USA HIV-infected men who at the baseline visit
had a fasting SG of 98 mg/dl or less, no self-
aRR (95% CI)
-Body mass index (5-unit increment): 1.34 (0.91-1.96)

25
Study, year Country Selection criteria Risk factors*
reported history of DM, and no self-reported
use of antidiabetic medication
-Age (5-unit increment): 1.31 (1.04-1.64)
-Ritonavir (inducing DM or hyperglycemia): 1.70 (1.08-2.68)
Butt et al, 2004 USA HIV positive veterans aHR (95% CI)
-Age (10-year increments): 1.44 (1.39-1.49)
-African-Americans compared to Caucasians: 1.35 (1.24-1.48)
-Hispanics compared to Caucasians: 1.63 (1.43-1.86)
-Care in HAART era 2.35: (2.01-2.75)
-Drug diagnosis: 0.88 (0.79-0.98)
-HCV*HAART era interaction 1.51 (1.13-2.01)
Capeau et al, 2012 France HIV infected patients initiating PI containing
combined ART
-Age
-BMI
-waist-to-hip ratio
-time-updated lipoatrophy
-Indinavir, stavudine, didanosine
De Wit et al, 2008 Europe,
USA,
Argentina
11 cohorts of HIV-infected patient followed
in 212 clinics
-Stavudine, zidovudine, didanosine, ritonavir, nevirapine
26
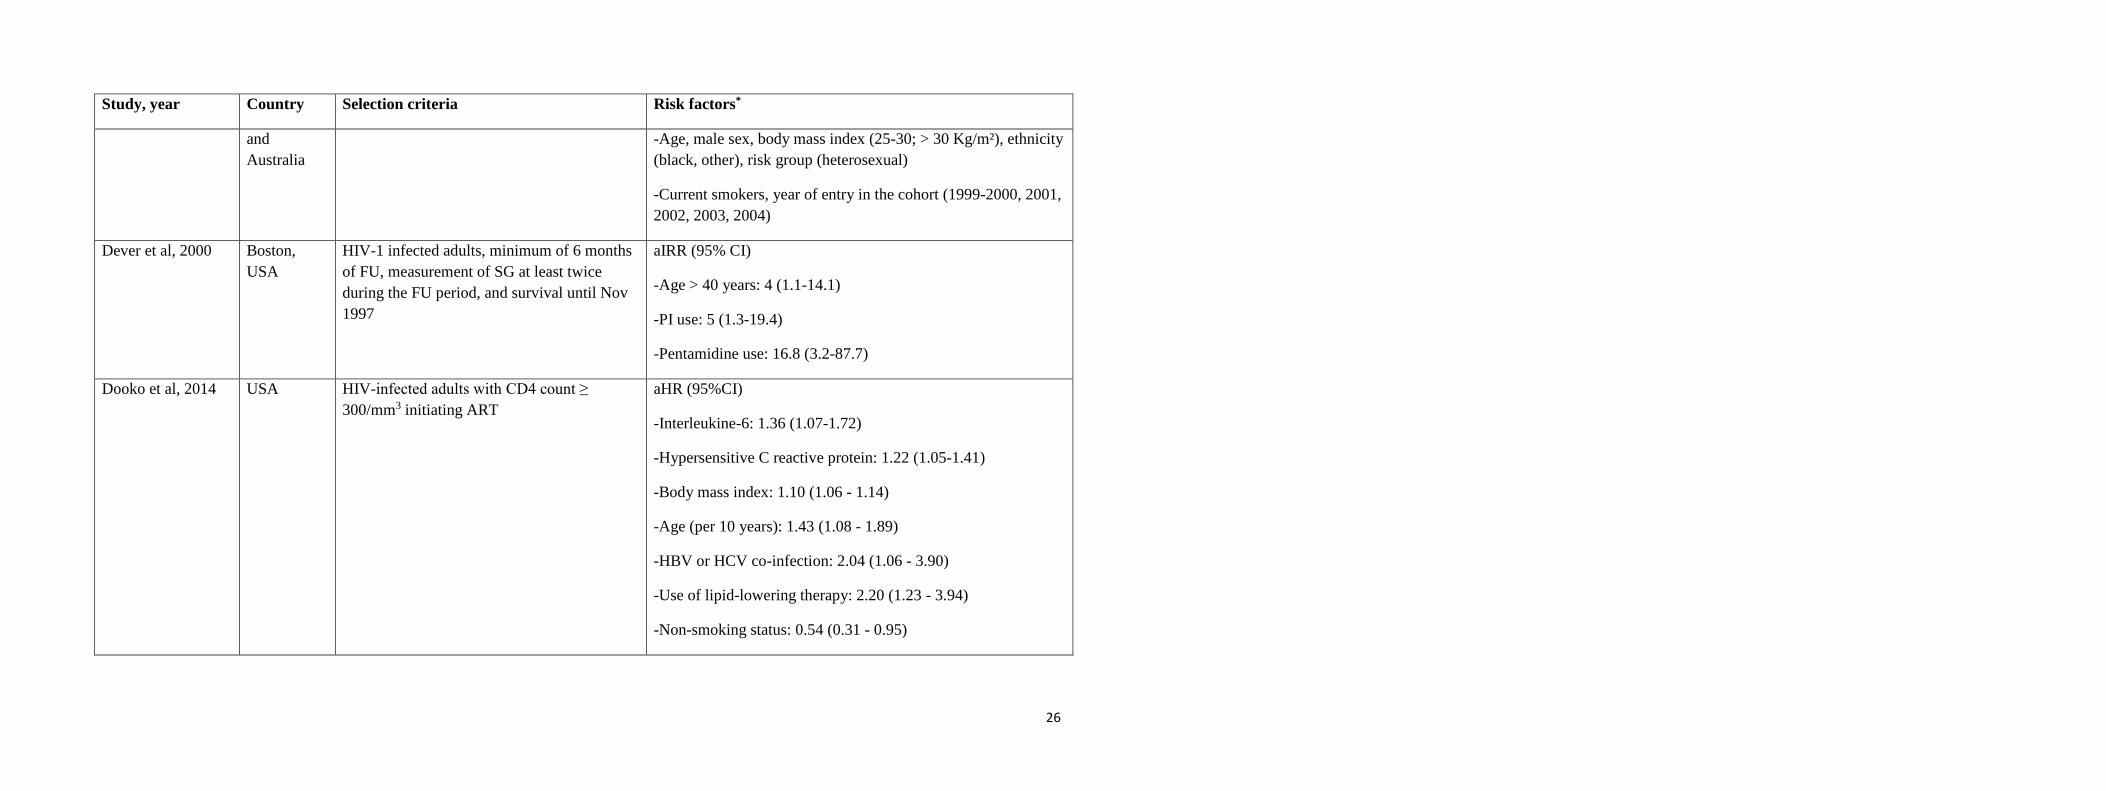
Study, year Country Selection criteria Risk factors*
and
Australia
-Age, male sex, body mass index (25-30; > 30 Kg/m²), ethnicity
(black, other), risk group (heterosexual)
-Current smokers, year of entry in the cohort (1999-2000, 2001,
2002, 2003, 2004)
Dever et al, 2000 Boston,
USA
HIV-1 infected adults, minimum of 6 months
of FU, measurement of SG at least twice
during the FU period, and survival until Nov
1997
aIRR (95% CI)
-Age > 40 years: 4 (1.1-14.1)
-PI use: 5 (1.3-19.4)
-Pentamidine use: 16.8 (3.2-87.7)
Dooko et al, 2014 USA HIV-infected adults with CD4 count ≥
300/mm3 initiating ART
aHR (95%CI)
-Interleukine-6: 1.36 (1.07-1.72)
-Hypersensitive C reactive protein: 1.22 (1.05-1.41)
-Body mass index: 1.10 (1.06 - 1.14)
-Age (per 10 years): 1.43 (1.08 - 1.89)
-HBV or HCV co-infection: 2.04 (1.06 - 3.90)
-Use of lipid-lowering therapy: 2.20 (1.23 - 3.94)
-Non-smoking status: 0.54 (0.31 - 0.95)

27
Study, year Country Selection criteria Risk factors*
Galli et al, 2002 Italy HIV-1 infected patients treated for at least 3
months with a combination of 2 NRTIs and
naive of PIs
aOR (95% CI)
-Age (>34 years): 2.61 (1.27-5.33)
García-Benayas et
al, 2006
Spain HIV subjects who had completed 12 months
of an unmodified ARV regimen based on
didanosine, tenofovir, or didanosine +
tenofovir, and had available glucose levels
during the entire FU
aOR (95% CI)
-Lower baseline weight: 0.70 (0.51-0.97)
-Didanosine + Tenofovir use: 465.1 (1.22-1.95*1011)
Gomes et al, 2016 Dominican
Republic
Participants ≥18 years, initiating ART <90
days prior to study enrollment
Dyslipidemia
Gutpa et al, 2011 Australia HIV infected individuals initiating ART
regimen
aHR (95% CI)
-Metabolic Syndrome at baseline: Adult Treatment Panel-III
4.34 (1.83-10.25); International Diabetes Federation 3.33
(1.35-8.17);
-Metabolic syndrome during follow-up: Adult Treatment Panel-
III: 4.89 (2.22-10.78); International Diabetes Federation: 4.84
(2.20-10.64)
-Body mass index 1.13 (1.04-1.22);
-Hip circumference 1.05 (1.02-1.09)
-Total cholesterol 1.37 (1.01-1.84)
28
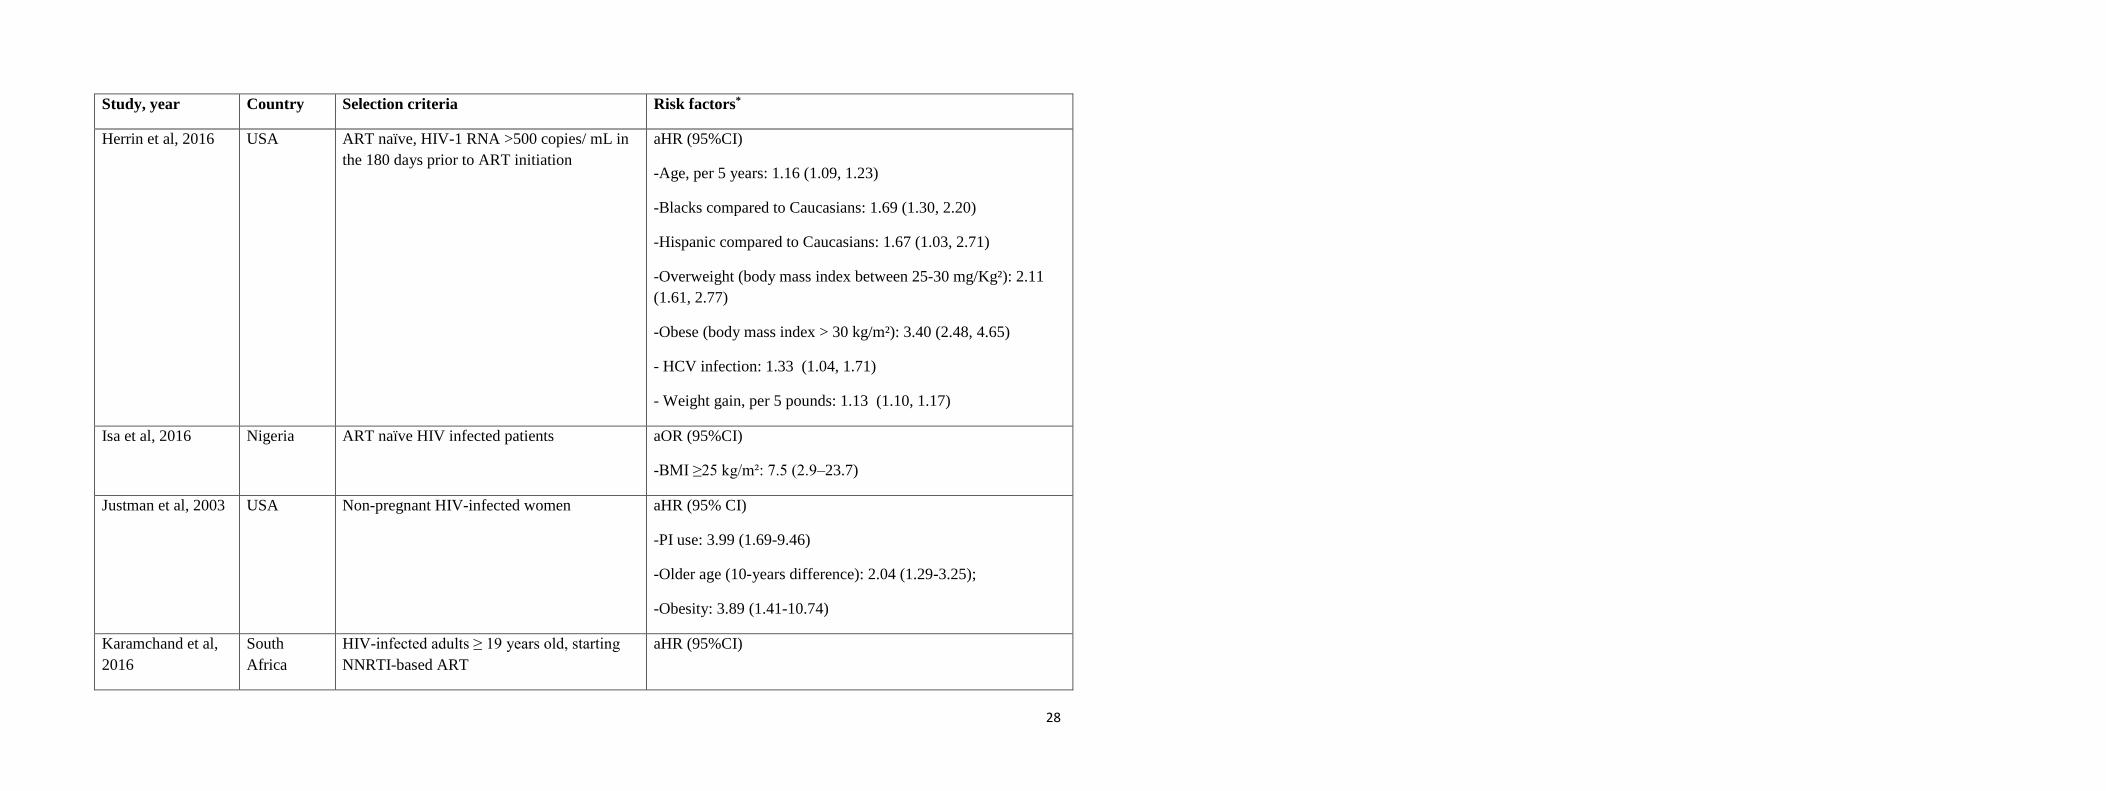
Study, year Country Selection criteria Risk factors*
Herrin et al, 2016 USA ART naïve, HIV-1 RNA >500 copies/ mL in
the 180 days prior to ART initiation
aHR (95%CI)
-Age, per 5 years: 1.16 (1.09, 1.23)
-Blacks compared to Caucasians: 1.69 (1.30, 2.20)
-Hispanic compared to Caucasians: 1.67 (1.03, 2.71)
-Overweight (body mass index between 25-30 mg/Kg²): 2.11
(1.61, 2.77)
-Obese (body mass index > 30 kg/m²): 3.40 (2.48, 4.65)
- HCV infection: 1.33 (1.04, 1.71)
- Weight gain, per 5 pounds: 1.13 (1.10, 1.17)
Isa et al, 2016 Nigeria ART naïve HIV infected patients aOR (95%CI)
-BMI ≥25 kg/m²: 7.5 (2.9–23.7)
Justman et al, 2003
USA Non-pregnant HIV-infected women aHR (95% CI)
-PI use: 3.99 (1.69-9.46)
-Older age (10-years difference): 2.04 (1.29-3.25);
-Obesity: 3.89 (1.41-10.74)
Karamchand et al,
2016
South
Africa
HIV-infected adults ≥ 19 years old, starting
NNRTI-based ART
aHR (95%CI)

29
Study, year Country Selection criteria Risk factors*
-Efavirenz vs Nevirapine: 1.27 (1.10–1.47)
-Zidovudine: 1.35 (1.19–1.52)
-Stavudine: 1.60 (1.38–1.87)
-Exposure to other diabetogenic drugs: 1.53 (1.37–1.70)
- Age (reference 35-44 years old)
19-24 years old: 0.47 (0.27–0.81)
25-34 years old: 0.71 (0.62–0.82)
45-54 years old: 1.38 (1.21–1.56)
≥ 55 years old 1.64 (1.32–2.04)
-Male vs female 1.47 (1.32–1.64)
-Baseline body mass index (reference 25-30 kg/m²)
10-17 kg/m² : 0.33 (0.19–0.56)
18-24 kg/m² 0.61 (0.5-3–0.69)
> 35 kg/m² 1.58 (1.26–1.97)
-Baseline viral load 0-999 1.24 (1.05–1.47)
30
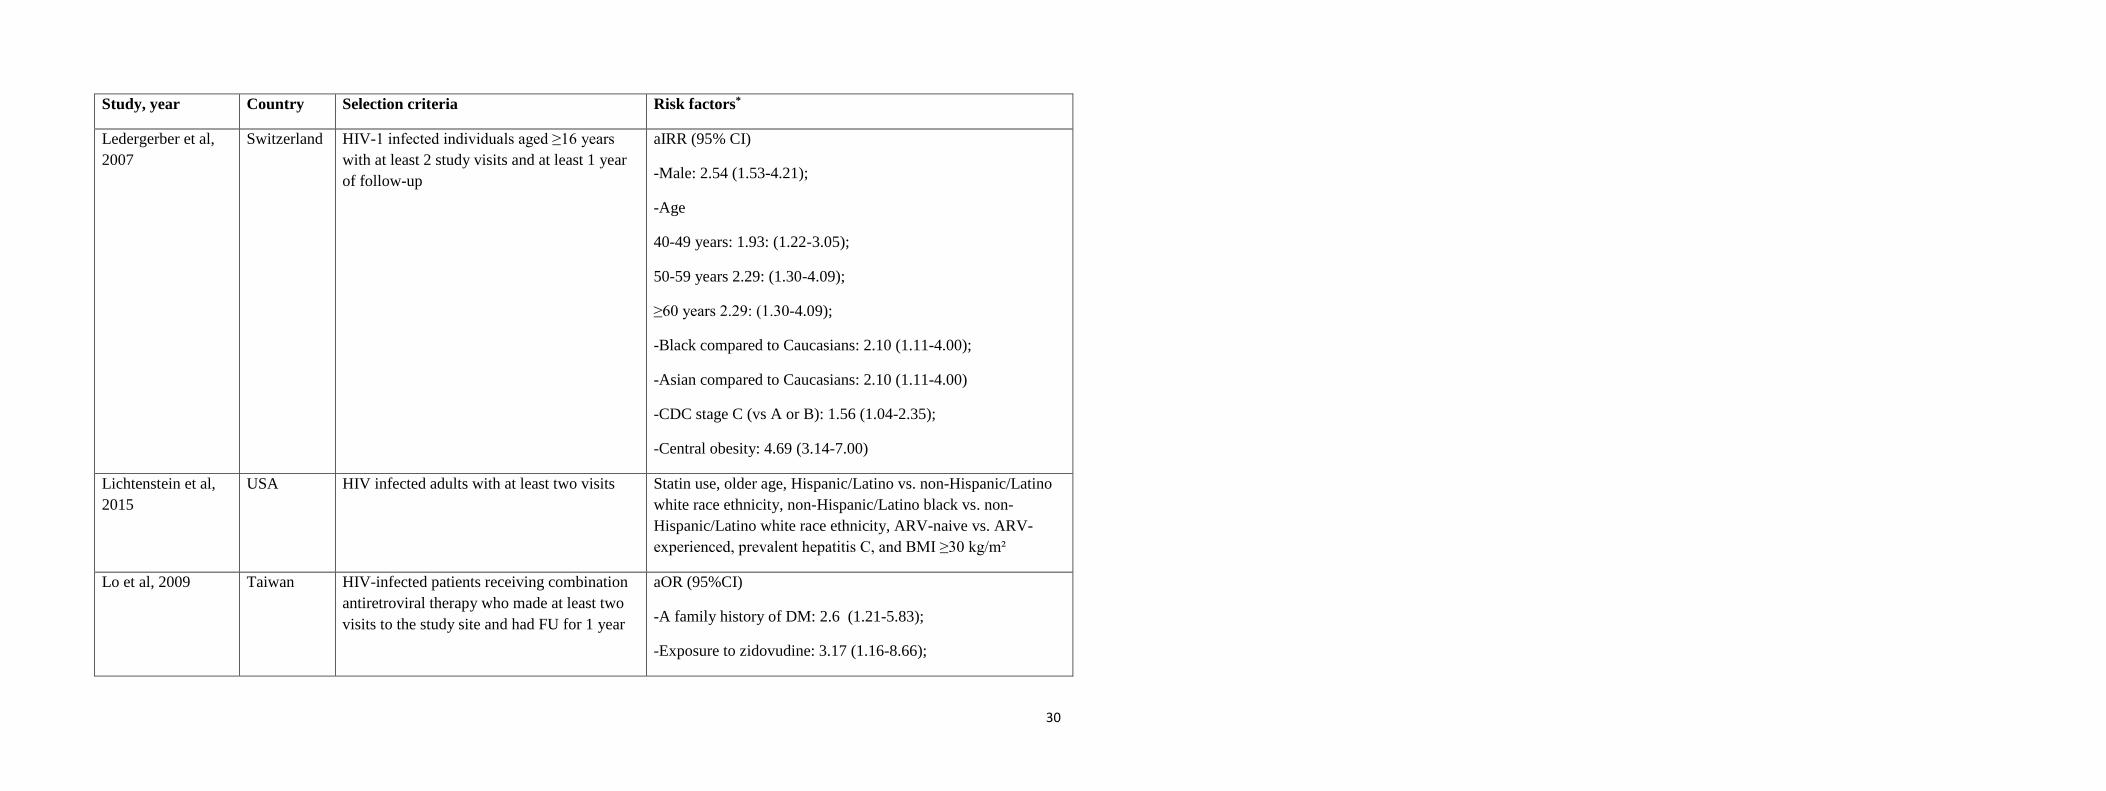
Study, year Country Selection criteria Risk factors*
Ledergerber et al,
2007
Switzerland HIV-1 infected individuals aged ≥16 years
with at least 2 study visits and at least 1 year
of follow-up
aIRR (95% CI)
-Male: 2.54 (1.53-4.21);
-Age
40-49 years: 1.93: (1.22-3.05);
50-59 years 2.29: (1.30-4.09);
≥60 years 2.29: (1.30-4.09);
-Black compared to Caucasians: 2.10 (1.11-4.00);
-Asian compared to Caucasians: 2.10 (1.11-4.00)
-CDC stage C (vs A or B): 1.56 (1.04-2.35);
-Central obesity: 4.69 (3.14-7.00)
Lichtenstein et al,
2015
USA HIV infected adults with at least two visits Statin use, older age, Hispanic/Latino vs. non-Hispanic/Latino
white race ethnicity, non-Hispanic/Latino black vs. non-
Hispanic/Latino white race ethnicity, ARV-naive vs. ARV-
experienced, prevalent hepatitis C, and BMI ≥30 kg/m²
Lo et al, 2009 Taiwan HIV-infected patients receiving combination
antiretroviral therapy who made at least two
visits to the study site and had FU for 1 year
aOR (95%CI)
-A family history of DM: 2.6 (1.21-5.83);
-Exposure to zidovudine: 3.17 (1.16-8.66);
31
Study, year Country Selection criteria Risk factors*
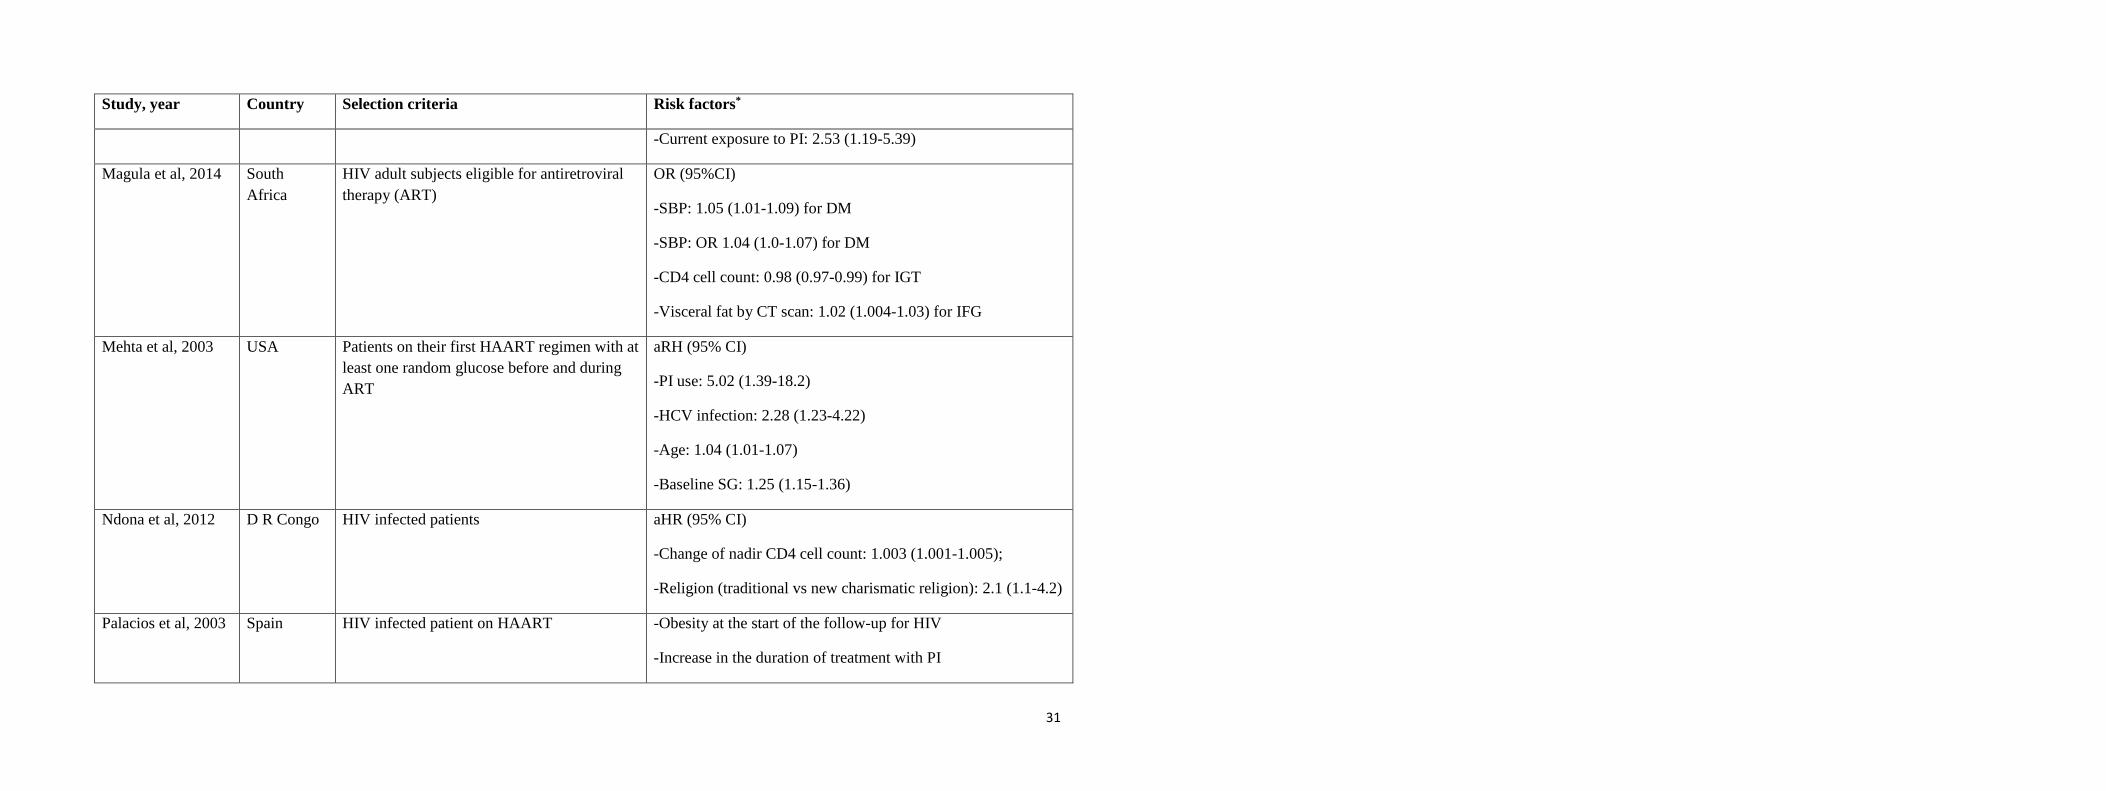
-Current exposure to PI: 2.53 (1.19-5.39)
Magula et al, 2014 South
Africa
HIV adult subjects eligible for antiretroviral
therapy (ART)
OR (95%CI)
-SBP: 1.05 (1.01-1.09) for DM
-SBP: OR 1.04 (1.0-1.07) for DM
-CD4 cell count: 0.98 (0.97-0.99) for IGT
-Visceral fat by CT scan: 1.02 (1.004-1.03) for IFG
Mehta et al, 2003 USA Patients on their first HAART regimen with at
least one random glucose before and during
ART
aRH (95% CI)
-PI use: 5.02 (1.39-18.2)
-HCV infection: 2.28 (1.23-4.22)
-Age: 1.04 (1.01-1.07)
-Baseline SG: 1.25 (1.15-1.36)
Ndona et al, 2012 D R Congo HIV infected patients aHR (95% CI)
-Change of nadir CD4 cell count: 1.003 (1.001-1.005);
-Religion (traditional vs new charismatic religion): 2.1 (1.1-4.2)
Palacios et al, 2003 Spain HIV infected patient on HAART -Obesity at the start of the follow-up for HIV
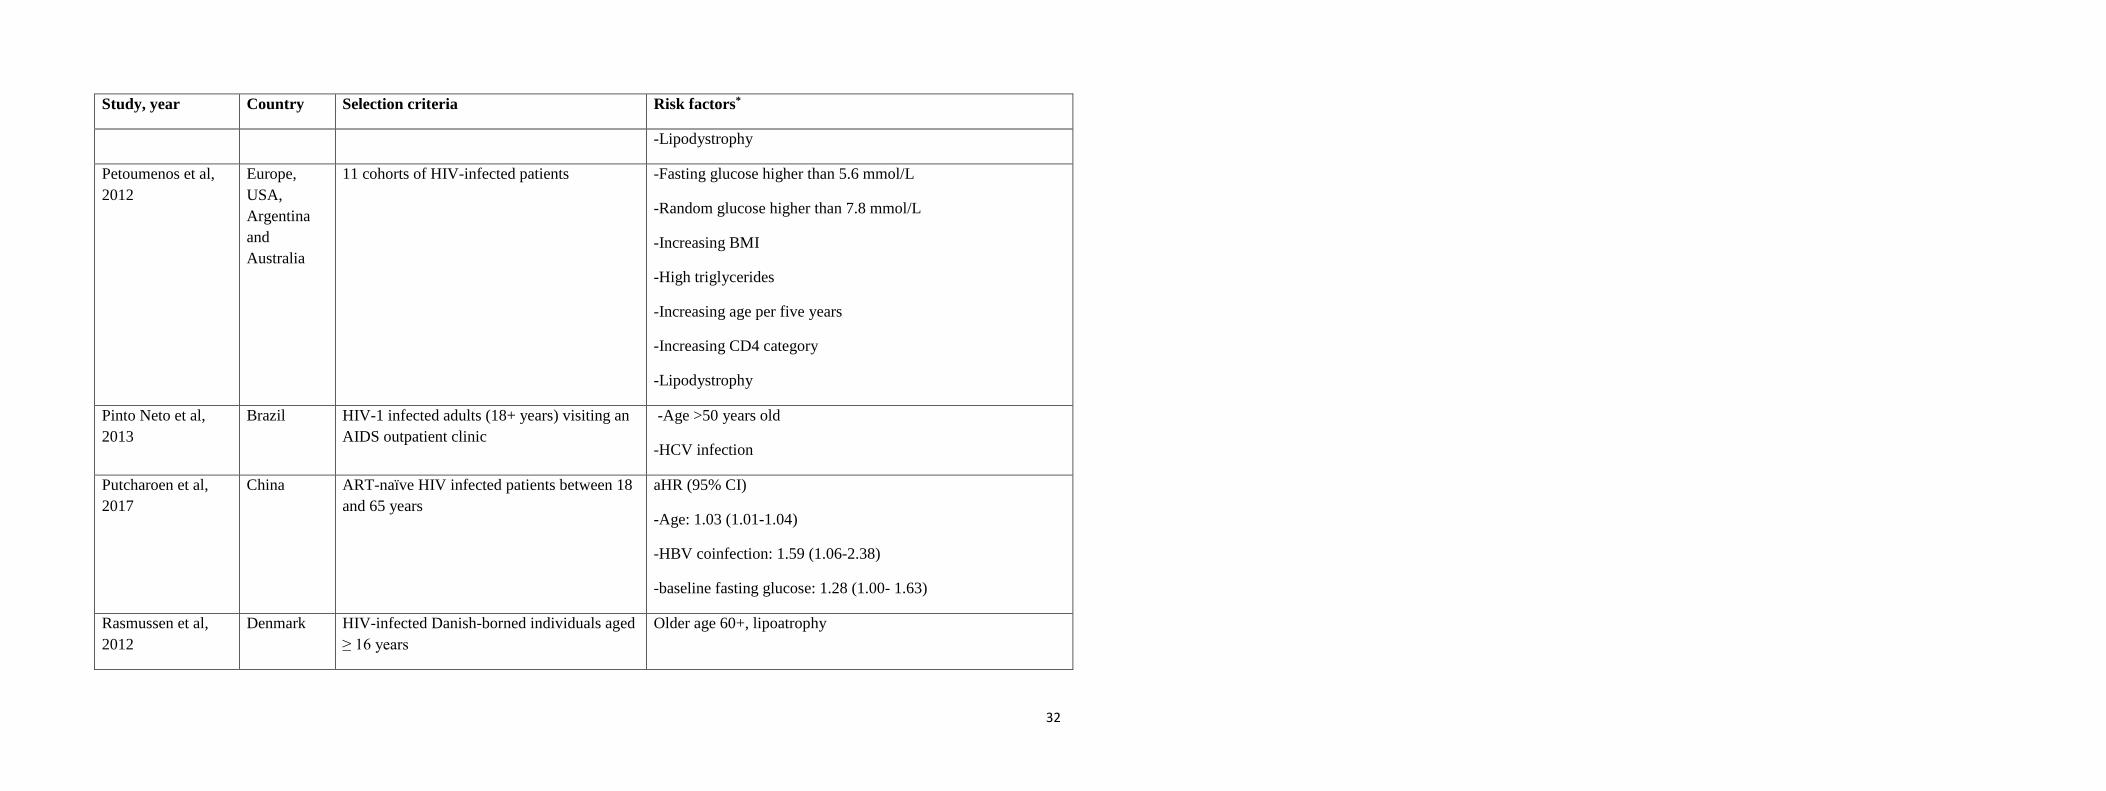
-Increase in the duration of treatment with PI
32
Study, year Country Selection criteria Risk factors*
-Lipodystrophy
Petoumenos et al,
2012
Europe,
USA,
Argentina
and
Australia
11 cohorts of HIV-infected patients -Fasting glucose higher than 5.6 mmol/L
-Random glucose higher than 7.8 mmol/L
-Increasing BMI
-High triglycerides
-Increasing age per five years
-Increasing CD4 category
-Lipodystrophy
Pinto Neto et al,
2013
Brazil HIV-1 infected adults (18+ years) visiting an
AIDS outpatient clinic
-Age >50 years old
-HCV infection
Putcharoen et al,
2017
China ART-naïve HIV infected patients between 18
and 65 years
aHR (95% CI)
-Age: 1.03 (1.01-1.04)
-HBV coinfection: 1.59 (1.06-2.38)
-baseline fasting glucose: 1.28 (1.00- 1.63)
Rasmussen et al,
2012
Denmark HIV-infected Danish-borned individuals aged
≥ 16 years
Older age 60+, lipoatrophy

33
Study, year Country Selection criteria Risk factors*
Riyatenet al, 2015 Thailand HIV-1 infected patients aged ≥ 18 years and
ART naive
aHR (95% CI)
-Age (≥30 years old): 2.7 (1.3-5.7)
-Triglycerides (≥140 mg/dl): 1.8 (1.0-3.1)
-BMI (≥25 kg/m²): 2.7 (1.5-4.7)
-Stavudine + Didanosine: 3.9 (1.7-9.0)
-Zidovudine + Lamuvinde + Efavirenz: 2.2 (1.2-3.8)
-Cumulative exposure to Zidovudine (≥1 year): 2.3 (1.2-4.2)
-Tenofovir + Lamivudine + Efavirenz: 0.1 (0.05-0.5)
-Cumulative exposure to TDF (≥ 1 year): 0.4 (0.2-0.9)
Spagnuolo et al,
2017
USA Incidence of DM aRH (95% CI)
-NRTI exposure (>3 years): 2.64 (1.11–6.32)
-Lamivudine use: (> 1 PYFU reporting use after index): 2.81
(1.33-5.95)
Wong et al, 2017 USA HIV infected adults 18+ years on combined
ART for at least 30 days
aHR (95%CI)
-Female sex: 1.32 (1.06-1.65)
-Age: 1.09 ((1.04-1.15)

34
Study, year Country Selection criteria Risk factors*
-Pre-existing hypertension: 2.01 (1.59–2.55)
-Pre-existing dyslipidemia: 1.71 (1.29–2.26)
-Pre-existing obesity: 1.57 (1.15–2.13)
-PI exposure: 1.29 (1.04–1.61)
Wu et al, 2016 Italy HIV-positive naïve patients aRR (95%CI)
-Triglycerides/high density lipoprotein cholesterol ratio (per 10-
unit rise): 1.63 (1.32–2.01)
-Age (per 10 years): 1.44 (1.06–1.95)
-Body mass index: 30 kg/m2 vs. 25 kg/m2: 4.92 (2.42–10.00)
-Stavudine + Lamivudine vs Tenofovir + Emtricitabine: 6.31
(1.95– 20.40)
-Atazanavir/ritonavir vs. Efavirenz: 3.23 (1.30–7.98)
-Baseline cholesterol 201-239 mg/dL vs. ≤ 200 mg/dL: 2.49
(1.30–4.78)