Embed Size (px)
Citation preview
HSC - EpHMarch 19, 2018
Research Center, Pori / Petri Kobylin, LauriMäenpää, Antti Roine, Kai Anttila
15011-ORC-J 1 (16)
Outotec reserves the right to modify these specifications at any time without prior notice. Copyright © Outotec 2019
17. E - pH (Pourbaix) Diagrams ModuleE - pH diagrams show the thermodynamic stability areas of different species in an aqueoussolution. Stability areas are presented as a function of pH and electrochemical potentialscales. Usually the upper and lower stability limits of water are also shown in the diagramsby dotted lines. Traditionally, these diagrams have been taken from different handbooks1.However, in most handbooks, these diagrams are available only for a limited number oftemperatures, concentrations, and element combinations.
The Eh - pH module (EpH module is used hereafter) in HSC Chemistry allows theconstruction of diagrams in a highly flexible and fast way, because the user can draw thediagrams exactly at the selected temperature and concentration.
The EpH module is based on STABCAL - Stability Calculations for Aqueous Systems -developed by H.H. Haung, at Montana Tech., USA2,3.

HSC - EpHMarch 19, 2018
Research Center, Pori / Petri Kobylin, LauriMäenpää, Antti Roine, Kai Anttila
15011-ORC-J 2 (16)
Outotec reserves the right to modify these specifications at any time without prior notice. Copyright © Outotec 2019
17.1. Introduction
E - pH diagrams are also known as Pourbaix Diagrams, after the author of the famousPourbaix diagram handbook1. The simplest type of these diagrams is based on a chemicalsystem consisting of one element and a water solution, for example, the Mn-H2O system.The system can contain several types of species, such as dissolved ions, condensedoxides, hydroxides, oxides, etc. The E - pH diagram shows the stability areas of thesespecies in the redox potential-pH coordinates.
Usually the redox potential axis is based on the Standard Hydrogen Electrode (SHE) scaledesignated Eh, but other scales can also be used. The redox potential of the systemrepresents its ability to change electrons. The system tends to remove electrons from thespecies when the potential is high (E > 0). These conditions may exist near the anode in anelectrochemical cell, but can also be generated with some oxidizing agents (Cu + H2O2 =CuO + H2O). In reducing conditions, when the potential is low (E < 0), the system is able tosupply electrons to the species, for example, with a cathode electrode or with somereducing agents.
The pH of the system describes its ability to supply protons (H(+a)) to the species. In acidconditions (pH < 7), the concentration of protons is high and in caustic conditions (pH > 7)the concentration of protons is low.
Usually, a large amount of different species exist simultaneously in the aqueous mixtures infixed E - pH conditions. Pourbaix diagrams simplify this situation a lot by showing only thepredominant species whose content is highest in each stability area. The lines in thediagrams represent the E - pH conditions where the content of the adjacent species is thesame in the equilibrium state. However, these species always exist in small amounts onboth sides of these lines and may have an effect on practical applications.
The lines in the diagrams can also be represented with chemical reaction equations. Thesereactions may be divided into three groups according to the reaction types:
1. Horizontal lines. These lines represent reactions that are involved with electrons, butare independent of pH. Neither H(+a) ions nor OH(-a) ions participate in thesereactions.
2. Diagonal lines with either a positive or negative slope. These lines representreactions that are involved with both electrons and H(+a)- and OH(-a) ions.
3. Vertical lines. These lines represent reactions that are involved either with H(+a)- orOH(-a) ions, but are independent of E. In other words, electrons do not participate inthese reactions.
The chemical stability area of the water is shown in the E-pH diagrams by dotted lines.The upper stability limit of water is based on the potential when oxygen generation starts onthe anode. It is specified by the reaction:
2 H2O = O2(g) + 4 H(+a) + 4 e-
The lower stability limit is based on hydrogen formation on the cathode. It is specified by thereaction:
2 H(+a) + 2 e- = H2(g)

HSC - EpHMarch 19, 2018
Research Center, Pori / Petri Kobylin, LauriMäenpää, Antti Roine, Kai Anttila
15011-ORC-J 3 (16)
Outotec reserves the right to modify these specifications at any time without prior notice. Copyright © Outotec 2019
The construction of the diagrams with the HSC Chemistry EpH module is quite a simpletask. However, several aspects must be taken into account when specifying the chemicalsystem and analyzing the calculation results, for example:
1. A basic knowledge of chemistry, aqueous systems and electrochemistry orhydrometallurgy is always needed in order to draw the correct conclusions.
2. The EpH module carries out the calculations using pure stoichiometric substances.In practice, minerals may contain impurity elements and the composition may deviateslightly from the stoichiometric one.
3. There are always some errors in the basic thermochemical data of the species. Thismay have a significant effect on the results, especially if the chemical driving force ofthe reaction is small. Usually small differences between Pourbaix diagrams fromdifferent sources can be explained by the slightly different basic data used.
4. Sometimes data for all existing species is not available from the HSC database orfrom other sources. This will distort the results if the missing species are stable in thegiven conditions. The missing unstable species will have no effect on the results.
5. The EpH module does not take into account the non-ideal behavior of aqueoussolutions. However, in many cases these ideal diagrams give a quite good idea ofthe possible reactions in aqueous solutions, especially if the driving force of thereactions is high.
6. Thermochemical calculations do not take into account the speed of the reactions(kinetics). For example, the formation of the SO4(-2a) ion may be a slow reaction. Inthese cases, metastable diagrams created by removing such species from the systemmay give more consistent results with experimental laboratory results.
Due to these limitations and assumptions, the HSC user must be very careful when drawingconclusions from E - pH diagrams. However, these diagrams can offer extremely valuableinformation when combining the results with experimental work and with a good knowledgeof aqueous chemistry. There is no universal kinetic or thermochemical theory available thatcould entirely substitute traditional experimental laboratory work with pure theoreticalcalculation models.
More information on E - pH diagrams, calculation methods, and applications can be foundin different handbooks, for example, from the Pourbaix Atlas1.
HSC - EpHMarch 19, 2018
Research Center, Pori / Petri Kobylin, LauriMäenpää, Antti Roine, Kai Anttila
15011-ORC-J 4 (16)
Outotec reserves the right to modify these specifications at any time without prior notice. Copyright © Outotec 2019
17.2. Chemical System Specifications
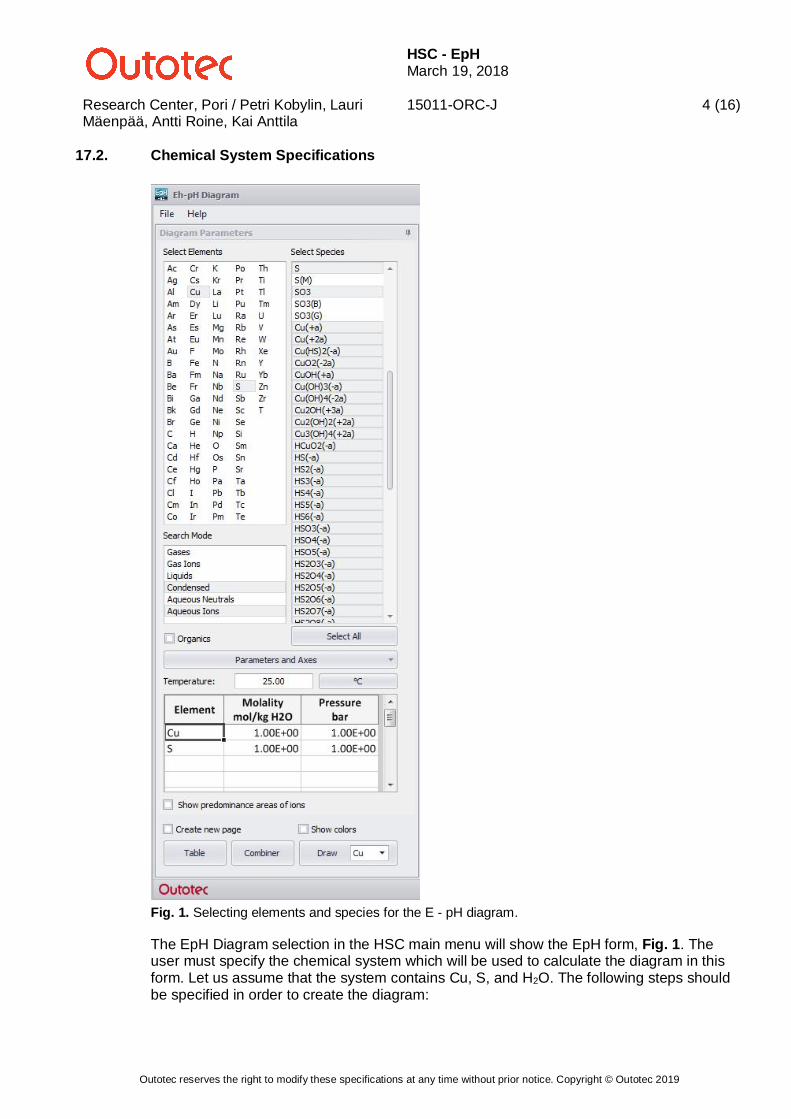
Fig. 1. Selecting elements and species for the E - pH diagram.
The EpH Diagram selection in the HSC main menu will show the EpH form, Fig. 1. Theuser must specify the chemical system which will be used to calculate the diagram in thisform. Let us assume that the system contains Cu, S, and H2O. The following steps shouldbe specified in order to create the diagram:
HSC - EpHMarch 19, 2018
Research Center, Pori / Petri Kobylin, LauriMäenpää, Antti Roine, Kai Anttila
15011-ORC-J 5 (16)
Outotec reserves the right to modify these specifications at any time without prior notice. Copyright © Outotec 2019
1. Select Elements: Select one or more elements from the list. The element chosen firstwill be used as the “main” element in the first diagram, i.e. all species, which areshown in the diagram, will contain this element. The user can easily change the mainelement selection later on in the diagram form, see Fig. 3. Cu has been selected inthis example, but S may be selected as the main element by pressing S in Fig. 3. Upto 7 elements can be selected but it is recommended to use fewer, because a largeamount of elements and species increases calculation time and could cause someother problems. S has been selected in this example. Note: It is not necessary toselect H and O, because these are always automatically included.
2. Search Mode: This selection specifies the type of species which will be collectedfrom the database. It is recommended to use the default selections. Note: Condensed= solid substances, Aqueous Neutrals = dissolved species without charge, AqueousIons = dissolved ions, Gases = gaseous species without charge, Gas Ions = gaseousions, and Liquids = liquid species. Check Organics, if you want to include organicspecies to your system (carbon need to be one of the selected elements).
3. Select Species: Usually you can select all species for the diagram by pressing All.However, in many cases, it is useful to remove unnecessary species from thesystem. This will decrease calculation time and simplify the diagrams. Note: A) Bypressing simultaneously the Ctrl key and clicking with the mouse it is easy to makeany kind of selection. B) By double clicking the species it is possible to see moreinformation on the species. Load CUS25.eph8 file to see the selected species of thisexample.The selection of species is the most critical step in the EpH calculationspecifications. For kinetic reasons the formation especially of large molecules maytake quite a long time in aqueous solutions. For example, the formation of largepolysulfide, sulfate, etc. molecules (S4O6(-2a), HS2O6(-a), HS7O3(-a), ...) may takequite a while. If these are included in the chemical system then they may easilyconsume all the sulfur and the formation of simple sulfides (AgS, Cu2S, ...) willdecrease due to the lack of sulfur. Therefore in some cases large molecules shouldbe rejected from the chemical system.The data on some species may also be unreliable, especially if the reliability class ofthe species in the database is not 1. Such species may be rejected from the chemicalsystem. Note also that it is not recommended to use species with the (ia) suffix, seeChapter 28 (section 28.4.) for details.
4. Temperature: The user must specify at least one temperature for the diagram. Up tofour temperatures may be specified in order to draw combined diagrams, which showthe effect of temperature. The temperatures 25, 50, 75, and 100 °C have beenselected in this example, Fig. 1 and Fig. 2.
5. Draw: Pressing the Table button will show the Diagram specification form, seesection 17.3. and Fig. 2. By pressing Draw in Fig. 2 you will see the default diagram.

HSC - EpHMarch 19, 2018
Research Center, Pori / Petri Kobylin, LauriMäenpää, Antti Roine, Kai Anttila
15011-ORC-J 6 (16)
Outotec reserves the right to modify these specifications at any time without prior notice. Copyright © Outotec 2019
17.3. E - pH Diagram Menu
Fig. 2. Default values for the E - pH diagram (Table button).
The EpH diagram menu shows a summary of the chemical system specifications as well asthe selected default values for the diagram. The fastest way to go forward is to accept allthe default values and press Draw for simple E - pH diagram. Usually at the beginning,there is no need for modifications to the default values. However, it is important tounderstand the meaning of these settings because they may have a strong effect on thediagram. The details of the diagram menu options are explained in the followingparagraphs.
1. File Open
The EpH module can also be used as an independent application; in these cases the datafor the diagram may be read from *.eph8 files by pressing File Open. Normally the systemspecifications are automatically transferred from the system specification sheet to thediagram menu, Fig. 2.
The calculation results may be saved in a *.eph8 file by selecting Save from the file menuand loaded back by selecting Open from the file menu, which causes the diagram to beautomatically recalculated.
2. Table sheet
The selected species and calculated G-data based on the enthalpy, entropy, and heatcapacity values of the HSC database is shown in the Table sheet, Fig. 2. The species arearranged according to elements and species type.
HSC - EpHMarch 19, 2018
Research Center, Pori / Petri Kobylin, LauriMäenpää, Antti Roine, Kai Anttila
15011-ORC-J 7 (16)
Outotec reserves the right to modify these specifications at any time without prior notice. Copyright © Outotec 2019
The published Pourbaix diagrams are often based on G-data which is given in the originalpapers. Note that these G-values can also be calculated from the standard potentialvalues using Equation (1):
= (1)
where n is the charge transferred in the cell reaction, F is the Faraday constant (23045cal/(V·mol)), and E is the standard electrode potential in volts. Note: G-data is temperaturedependent; usually these values are only available at 25 °C in the literature.
Sometimes all the necessary species are not available in the HSC database. These missingspecies can be added to the chemical system specification if the user has the G-values orchemical potential data for these species. The new species may be added by using OwnDatabase, see Chapter 28 (section 28.6).
In some cases it is necessary to remove certain species from the system, e.g. if somekinetic barriers are found to slow down the reaction rate in the experiments.
Table sheet is for the program’s internal use and user should not make any modifications tothis sheet.
3. Temperature
Pourbaix diagrams are drawn at a constant temperature. The user must select onetemperature for the diagram from the list of temperatures, Fig. 2. The actual temperaturevalues can only be changed from the system specification form, Fig. 1. No temperatureselection is needed here for the Combined diagrams.The default G-values in the Species sheet are calculated at the given temperatures.
4. Other parameters
The default values for the Dielectric Constant and G of H2O are automatically calculatedon the basis of the selected temperature and pressure. The calculation of DielectricConstant is based on experimental values4 and water vapor pressure5, which are valid from0 to 373 °C, and from 1 to 5000 bar. Outside this range the Dielectric Constant will beextrapolated.The Ion Strength and Correction Factor constants are automatically calculated by theprogram and usually they do not need to be modified by the user.Criss-Cobble option enables HSC to extrapolate the heat capacity function of the aqueousspecies if this data is not given in the database6, see Chapter 28 (28.4.)
HSC - EpHMarch 19, 2018
Research Center, Pori / Petri Kobylin, LauriMäenpää, Antti Roine, Kai Anttila
15011-ORC-J 8 (16)
Outotec reserves the right to modify these specifications at any time without prior notice. Copyright © Outotec 2019
5. Potential and pH scale ranges
The user may change the default range (Max Eh and Min Eh) for the potential scale as wellas the range of the pH scale (Max pH and Min pH). The scale settings can also be changedby clicking the x- or y-axis on the diagram form. The minimum difference between Min andMax values is 0.2 and there is no upper limit for the difference.
6. Molality and Pressure
The diagrams are calculated using constant molalities (concentrations) for all the elements.The default values may be changed in the table in the bottom right corner of the diagrammenu, see Fig. 2. Molality values are given in mol/kg H2O units.
The total pressure of the system is also given in the Molality table. The EpH module usesthe maximum value given in the Pressure column as the chemical system total pressure. Itis not possible to select a smaller pressure value than the water vapor pressure at theselected temperature. In other words, the total pressure must always be bigger than thewater vapor pressure at the selected temperature. The default value for the pressure is 1bar.
7. Show Predominance Areas of Ions
Selecting Show Predominance Areas of Ions causes the EpH module to calculate twodiagrams for the same system. The first one is a normal E - pH diagram with all species,and the second one is the predominance diagram with only aqueous species. Bothdiagrams are drawn into the same figure; the first diagram in black and the second one inblue. This option is recommended for use only with normal E - pH diagrams (see section17.4.).
8. Draw and Combiner Buttons
Draw starts the calculations and automatically shows the normal Pourbaix diagram.Combiner will show one more menu for combined diagram specifications; see section 17.5.for further details.
9. Other options
The Chart may be printed clicking Print. Data table can be printed by clicking Table andselecting Print from the file menu.
Edit Copy provides normal copy and paste operations, Edit Copy All copies all three sheetsto the clipboard. The worksheet layout may be changed using the Format menu, whichcontains dialogs for column width, row height, font, alignment, and number formats.
Press Exit or select File Exit when you want to return to the system specifications form, Fig.1. The Help menu opens the HSC Help dialog.
10. Example of Normal Pourbaix Diagrams (Cu-S-H2O system)
Accept all the default values and press Draw.

HSC - EpHMarch 19, 2018
Research Center, Pori / Petri Kobylin, LauriMäenpää, Antti Roine, Kai Anttila
15011-ORC-J 9 (16)
Outotec reserves the right to modify these specifications at any time without prior notice. Copyright © Outotec 2019
17.4. Normal E - pH Diagrams
The calculated E - pH diagrams are shown in Fig. 3. In the Diagram window it is possible, forexample, to modify the layout and format of the diagram. The solid black lines show thestability areas of the most stable species on the pH and E scales. The dotted black lines showthe upper and lower stability areas of water, see section 17.1. The stability areas of ions areshown by a blue dotted line if the “Show Predominance Areas of Ions” option has beenselected, see Fig. 2.
1. Main Elements
The E - pH diagrams show only the species that contain the selected main element.The default main element (Cu) must be selected in the system specification form, Fig. 1.However, the active main element can easily be changed in the diagram form by selectingElement inside Draw button, see Fig. 3. for the Cu-S-H2O diagram and Fig. 4 for the S-Cu-H2O diagram. Usually it is useful to check all the diagrams with different main elements toget a better idea of the equilibria.
2. Labels and Lines
The EpH module locates the area labels automatically on the widest point of the stabilityareas. You can easily relocate the labels by dragging them with the mouse cursor ifnecessary. The text of the labels and headings can be modified by inserting the cursor intothe correct location within the text row and then starting to type. You can start the LabelFormat dialog by double clicking the label. This dialog makes it possible to change text andlines properties, such as font, type, size, line width, color, etc.
Note that you cannot delete the default labels, but you can hide these labels by removing allthe text from the label.
HSC - EpHMarch 19, 2018
Research Center, Pori / Petri Kobylin, LauriMäenpää, Antti Roine, Kai Anttila
15011-ORC-J 10 (16)
Outotec reserves the right to modify these specifications at any time without prior notice. Copyright © Outotec 2019
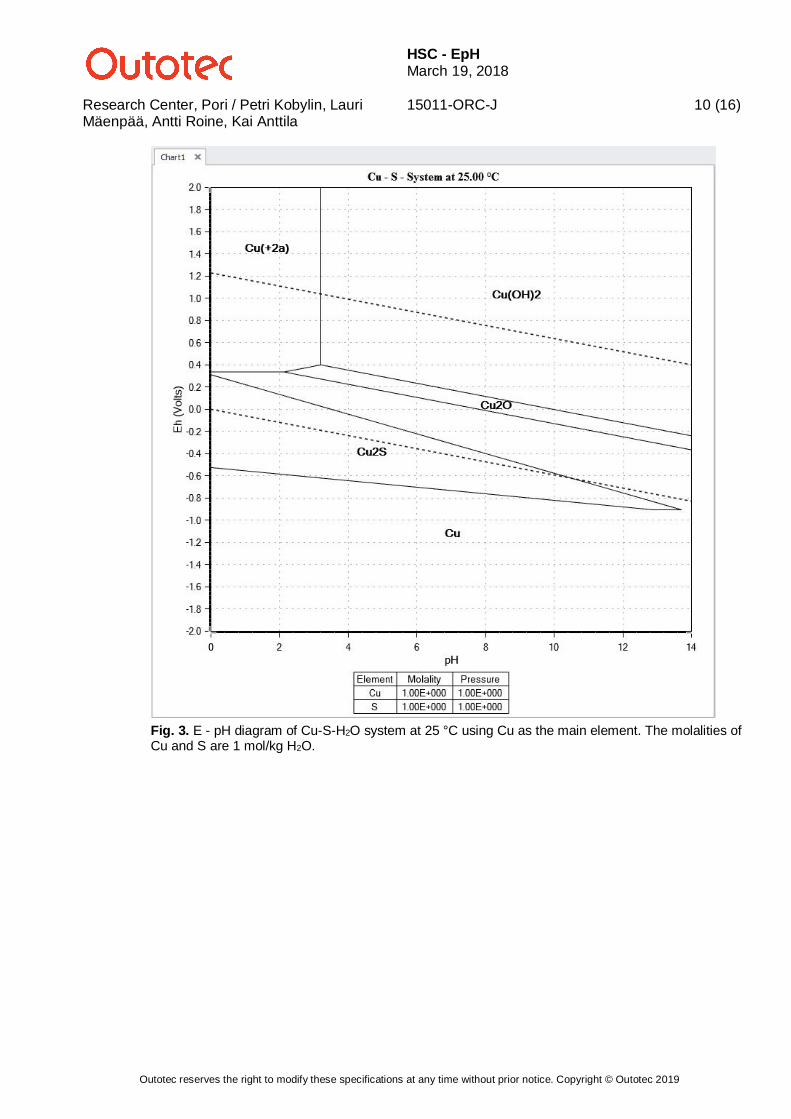
Fig. 3. E - pH diagram of Cu-S-H2O system at 25 °C using Cu as the main element. The molalities ofCu and S are 1 mol/kg H2O.
HSC - EpHMarch 19, 2018
Research Center, Pori / Petri Kobylin, LauriMäenpää, Antti Roine, Kai Anttila
15011-ORC-J 11 (16)
Outotec reserves the right to modify these specifications at any time without prior notice. Copyright © Outotec 2019
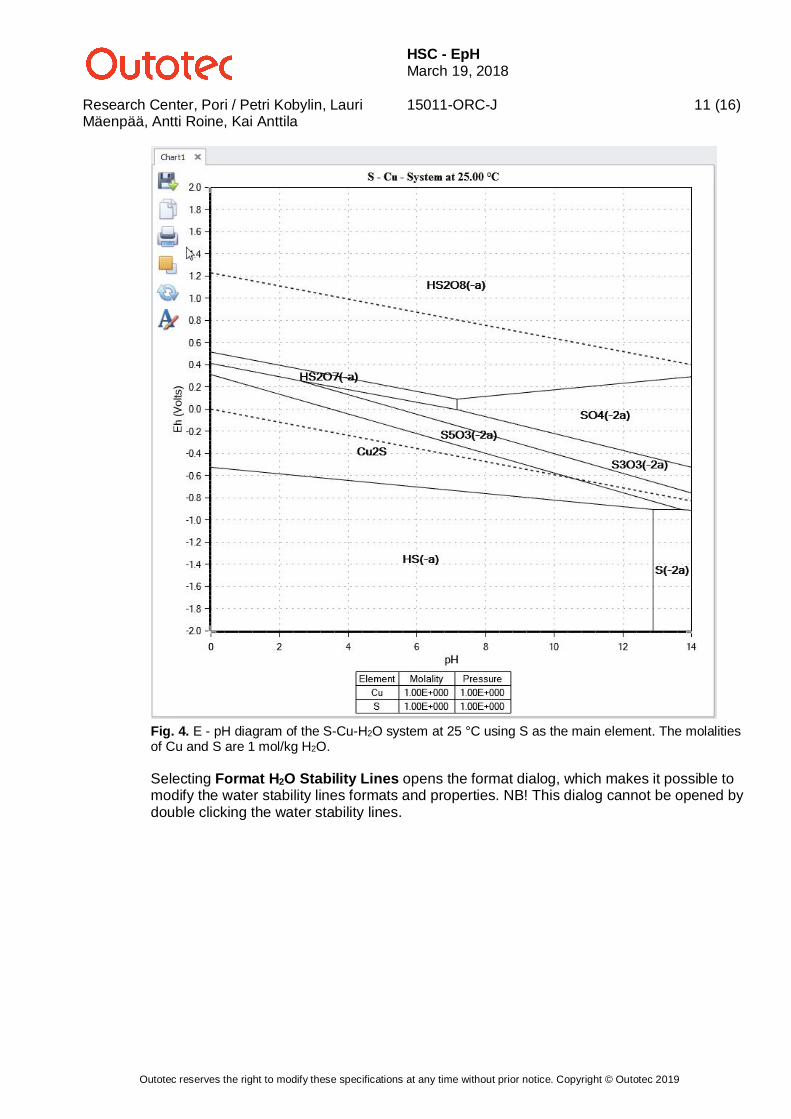
Fig. 4. E - pH diagram of the S-Cu-H2O system at 25 °C using S as the main element. The molalitiesof Cu and S are 1 mol/kg H2O.
Selecting Format H2O Stability Lines opens the format dialog, which makes it possible tomodify the water stability lines formats and properties. NB! This dialog cannot be opened bydouble clicking the water stability lines.
HSC - EpHMarch 19, 2018
Research Center, Pori / Petri Kobylin, LauriMäenpää, Antti Roine, Kai Anttila
15011-ORC-J 12 (16)
Outotec reserves the right to modify these specifications at any time without prior notice. Copyright © Outotec 2019
3. Scales
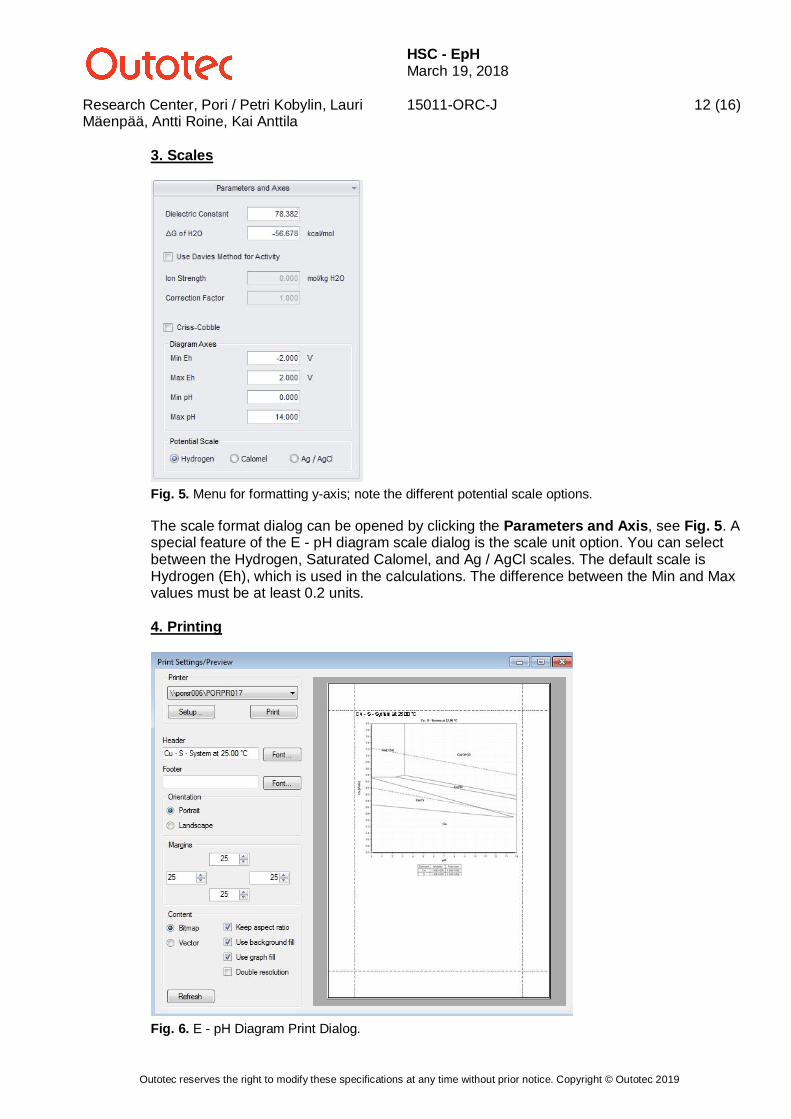
Fig. 5. Menu for formatting y-axis; note the different potential scale options.
The scale format dialog can be opened by clicking the Parameters and Axis, see Fig. 5. Aspecial feature of the E - pH diagram scale dialog is the scale unit option. You can selectbetween the Hydrogen, Saturated Calomel, and Ag / AgCl scales. The default scale isHydrogen (Eh), which is used in the calculations. The difference between the Min and Maxvalues must be at least 0.2 units.
4. Printing
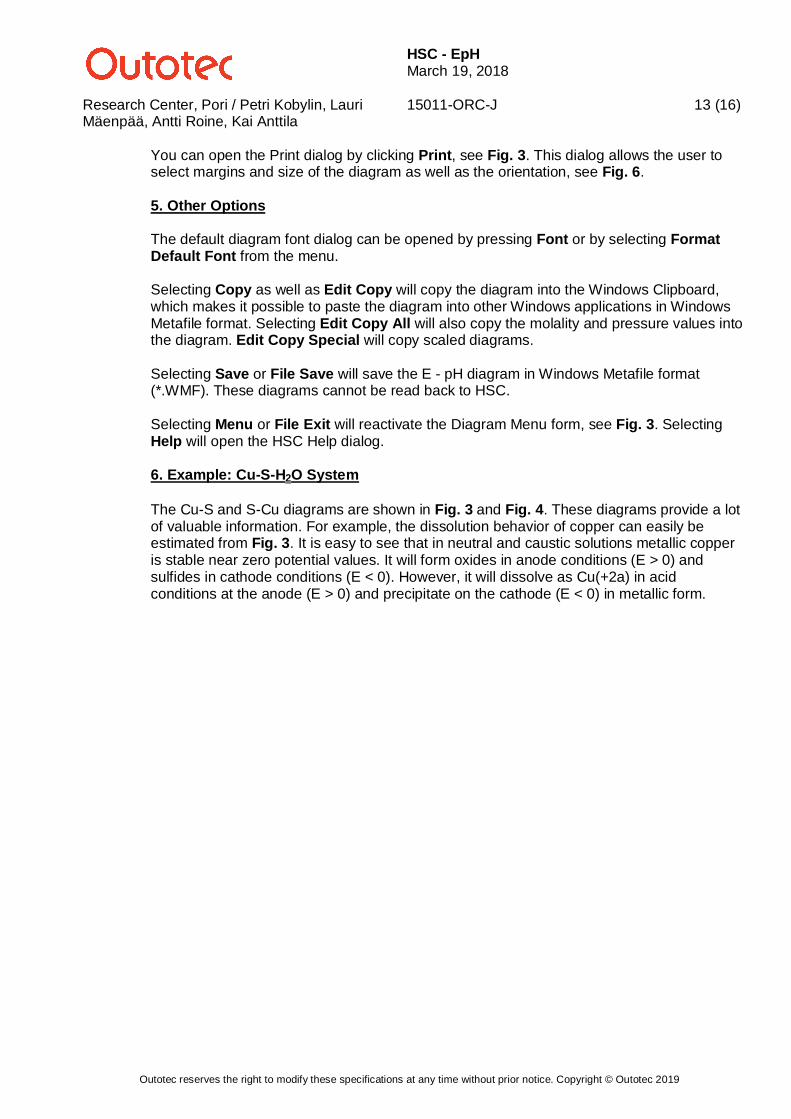
Fig. 6. E - pH Diagram Print Dialog.
HSC - EpHMarch 19, 2018
Research Center, Pori / Petri Kobylin, LauriMäenpää, Antti Roine, Kai Anttila
15011-ORC-J 13 (16)
Outotec reserves the right to modify these specifications at any time without prior notice. Copyright © Outotec 2019
You can open the Print dialog by clicking Print, see Fig. 3. This dialog allows the user toselect margins and size of the diagram as well as the orientation, see Fig. 6.
5. Other Options
The default diagram font dialog can be opened by pressing Font or by selecting FormatDefault Font from the menu.
Selecting Copy as well as Edit Copy will copy the diagram into the Windows Clipboard,which makes it possible to paste the diagram into other Windows applications in WindowsMetafile format. Selecting Edit Copy All will also copy the molality and pressure values intothe diagram. Edit Copy Special will copy scaled diagrams.
Selecting Save or File Save will save the E - pH diagram in Windows Metafile format(*.WMF). These diagrams cannot be read back to HSC.
Selecting Menu or File Exit will reactivate the Diagram Menu form, see Fig. 3. SelectingHelp will open the HSC Help dialog.
6. Example: Cu-S-H2O System
The Cu-S and S-Cu diagrams are shown in Fig. 3 and Fig. 4. These diagrams provide a lotof valuable information. For example, the dissolution behavior of copper can easily beestimated from Fig. 3. It is easy to see that in neutral and caustic solutions metallic copperis stable near zero potential values. It will form oxides in anode conditions (E > 0) andsulfides in cathode conditions (E < 0). However, it will dissolve as Cu(+2a) in acidconditions at the anode (E > 0) and precipitate on the cathode (E < 0) in metallic form.
HSC - EpHMarch 19, 2018
Research Center, Pori / Petri Kobylin, LauriMäenpää, Antti Roine, Kai Anttila
15011-ORC-J 14 (16)
Outotec reserves the right to modify these specifications at any time without prior notice. Copyright © Outotec 2019
17.5. Combined E - pH Diagrams
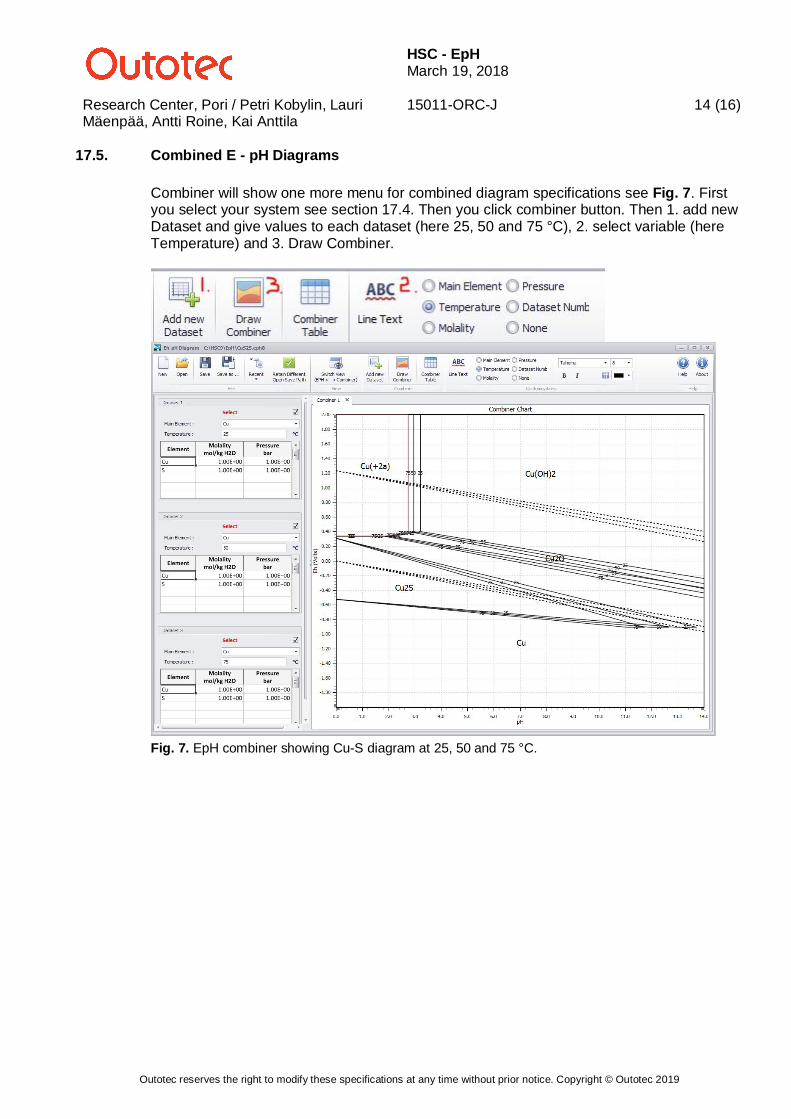
Combiner will show one more menu for combined diagram specifications see Fig. 7. Firstyou select your system see section 17.4. Then you click combiner button. Then 1. add newDataset and give values to each dataset (here 25, 50 and 75 °C), 2. select variable (hereTemperature) and 3. Draw Combiner.
Fig. 7. EpH combiner showing Cu-S diagram at 25, 50 and 75 °C.
HSC - EpHMarch 19, 2018
Research Center, Pori / Petri Kobylin, LauriMäenpää, Antti Roine, Kai Anttila
15011-ORC-J 15 (16)
Outotec reserves the right to modify these specifications at any time without prior notice. Copyright © Outotec 2019
17.6. E - pH Diagrams in Practice
The HSC EpH module enables fast and easy creation of Pourbaix diagrams for the requiredchemical system in user-specified conditions. These diagrams contain the basic informationof the aqueous system in a compact and illustrative form. These diagrams have foundmany applications in corrosion engineering, geochemistry, and hydrometallurgy since thepublication of the famous Pourbaix Atlas handbook1.
In hydrometallurgy, E - pH diagrams may be used, for example, to specify the conditions forselective leaching or precipitation. In corrosion engineering, they may be used to analyzethe dissolution and passivation behavior of different metals in aqueous environments.These diagrams may also be used to illustrate the chemical behavior of different ions inaqueous solutions.
Geochemists use Pourbaix diagrams quite frequently to study the weathering process andchemical sedimentation. The weathering process is used to predict what will happen to amineral exposed to acid oxidizing conditions at high temperature and pressure. Pourbaixdiagrams can also be used to estimate the conditions needed to form certain sedimentsand other minerals7 in the geological past.
Some application examples of the EpH module and Pourbaix diagrams are given inChapter 18.
HSC - EpHMarch 19, 2018
Research Center, Pori / Petri Kobylin, LauriMäenpää, Antti Roine, Kai Anttila
15011-ORC-J 16 (16)
Outotec reserves the right to modify these specifications at any time without prior notice. Copyright © Outotec 2019
17.7. References
1. Pourbaix M: Atlas of Electrochemical Equilibria in Aqueous Solutions. OxfordUniversity Press, U.K., 1966.
2. Haung, H.: Construction of Eh - pH and other stability diagrams of uranium in amulticomponent system with a microcomputer - I. Domains of predominancediagrams. Canadian Metallurgical Quarterly, 28(1989), July-September, pp. 225-234.
3. Haung, H.: Construction of Eh - pH and other stability diagrams of uranium in amulticomponent system with a microcomputer - II. Distribution diagrams. CanadianMetallurgical Quarterly, 28(1989), July-September, pp. 235-239.
4. Archer, D. G., Wang, P.: The Dielectric Constant of Water and Debye-Hückel LimitingLaw Slopes. Journal of Physical Chemistry Reference Data 2(1990), Vol 19, pp. 371-411.
5. CRC Handbook of Chemistry and Physics, 75th Ed., CRC Press, 1995. pp. 6-15 - 6-16.
6. Criss C.M. and Cobble J.W.: The Thermodynamic Properties of High TemperatureAqueous Solutions. V. The Calculation of Ionic Heat Capacities up to 200 °C.Entropies and Heat Capacities above 200 °C. J. Am. Chem. Soc. 86 (1964), pp.5385-91, 90-93.
7. Tayer, L. L. Development and Interpretation of Computer-Generated Potential-pHDiagrams. UMI Dissertation Services, Arizona State University, USA, 1995. pp. 1-25.
8. Barner H.E. and Scheuerman R.V.: Handbook of Thermochemical Data forCompounds and Aqueous Species, John Wiley & Sons Inc., New York, 1978.