Embed Size (px)
Citation preview

University of Nebraska Medical Center University of Nebraska Medical Center
DigitalCommons@UNMC DigitalCommons@UNMC
Theses & Dissertations Graduate Studies
Summer 8-19-2016
EHD1 As a Positive Regulator of Macrophage Colony-Stimulating EHD1 As a Positive Regulator of Macrophage Colony-Stimulating
Factor-1 Receptor Factor-1 Receptor
Luke R. Cypher University of Nebraska Medical Center
Follow this and additional works at: https://digitalcommons.unmc.edu/etd
Part of the Allergy and Immunology Commons, Infectious Disease Commons, Medical Biochemistry
Commons, and the Medical Cell Biology Commons
Recommended Citation Recommended Citation Cypher, Luke R., "EHD1 As a Positive Regulator of Macrophage Colony-Stimulating Factor-1 Receptor" (2016). Theses & Dissertations. 119. https://digitalcommons.unmc.edu/etd/119
This Dissertation is brought to you for free and open access by the Graduate Studies at DigitalCommons@UNMC. It has been accepted for inclusion in Theses & Dissertations by an authorized administrator of DigitalCommons@UNMC. For more information, please contact [email protected].

EHD1 AS A POSITIVE REGULATOR OF MACROPHAGE
COLONY-STIMULATING FACTOR-1 RECEPTOR
By
Luke Cypher
A DISSERTATION
Presented to the Faculty of
The University of Nebraska Graduate College
In Partial Fulfillment of the Requirements
for the Degree of Doctor of Philosophy
Cancer Research
Graduate Program
Under the supervision of Professor Hamid Band
University of Nebraska Medical Center
Omaha, Nebraska
June 23rd, 2016
Supervisory Committee Members
Tammy Kielian, Ph.D.
Joyce Solheim, Ph.D.
Jing Wang, Ph.D.

I would like to dedicate this dissertation to my mother,
Kimberly A. Cypher, Ph.D.

EHD1 AS A POSITIVE REGULATOR OF MACROPHAGE
COLONY-STIMULATING FACTOR-1 RECEPTOR
Luke R. Cypher, Ph.D.
University of Nebraska, 2016
Supervisor: Hamid Band, M.D., Ph.D.
The master regulator of the macrophage development, differentiation,
proliferation, survival, phagocytosis, cytokine secretion, motility, adhesion,
migration, and spreading is the receptor tyrosine kinase (RTK) colony stimulating
factor-1 receptor (CSF-1R). Aberrant CSF-1R signaling is present amongst a
variety of highly prevalent and devastating human diseases in the United States
such as atherosclerosis, cancer, inflammatory bowel disease, arthritis, and
neuro-demyelination/neuro-degeneration. A better understanding of basic
mechanisms that govern macrophage development and function is of vital
importance in treating patients afflicted with these conditions/diseases. CSF-1R
presentation on the macrophage cell surface is a required precursor for CSF1-
induced RTK dimerization (activation) and downstream CSF-1R signaling
cascades. Mechanisms which regulate CSF-1R trafficking are unstudied and
mechanisms of RTK trafficking regulation are poorly understood. The
evolutionarily conserved C-terminal Eps15 Homology Domain (EHD) protein
family consists of vesicular trafficking regulating proteins. However, the role of
EHD proteins in CSF-1R trafficking and signaling has not been studied. I have
utilized primary (non-immortalized) murine/mammalian macrophages under

inducible Ehd1 gene deletion/knockout (EHD1-KO) to explore the role of EHD1 in
CSF-1R trafficking in macrophages. I have discovered an entirely novel function
for EHD1 in anterograde transport and presentation of CSF-1R on the
macrophage cell surface. EHD1-KO macrophages have significantly depleted
total and surface CSF-1R expression (i.e. receptor available for ligand-binding
and subsequently CSF-1R activation/signaling) when compared with control
macrophages. In EHD1-KO macrophages, newly synthesized CSF-1R en route
to the cell surface is essentially shunted to the lysosome and degraded. These
findings reveal an entirely novel and essential role for EHD1 in anterograde
transport/presentation of CSF-1R to the macrophage cell surface.

I
ACKNOWLEDGEMENTS
I sincerely thank Dr. Hamid Band for his foresight, guidance,
understanding, and patience throughout the course of my training to become a
physician scientist. Thank you for believing me and providing me with all the tools
and resources needed for my thesis project.
I thank my graduate committee members: Jenny Wang Ph.D. and Tammy
Kielian Ph.D. for all of their advice and evaluation during my time as a Ph.D.
student and Joyce Solheim Ph.D. whose door was always open.
To Richard Stanley, my Ph.D. would have been impossible without your
detailed and transparent protocols. Your method’s sections taught me
macrophage cell culture. Thank You
To Adam Hoppe’s laboratory from South Dakota State University (SDSU).
It has been a joy to work with your lab. I greatly appreciate your flexibility and
willingness to work with me on macrophage/CSF-1R imaging. The insight,
knowledge, and technical savvy your lab brought to my project was invaluable,
and I thank you for it.
To all the current and former members of the Hamid Band laboratory. I will
always remember the times we shared and friendships formed—Cheers!

II
TABLE OF CONTENTS
ACKNOWLEDGEMENTS ...................................................................................... I
TABLE OF CONTENTS ....................................................................................... II
LIST OF FIGURES ............................................................................................... V
LIST OF TABLES .............................................................................................. VIII
LIST OF ABBREVIATIONS ................................................................................. IX
CHAPTER 1: INTRODUCTION ............................................................................ 1
The monocyte/macrophage cell lineage .................................................... 2
CSF-1R as the master regulator of macrophages ..................................... 4
C-terminal Eps15 Homology Domain (EHD) containing proteins ............... 6
Mouse models to study EHD proteins ........................................................ 7
Hypothesis ................................................................................................. 9
CHAPTER 2: MATERIALS & METHODS ........................................................... 28
Materials .................................................................................................. 29
Mouse Models ......................................................................................... 30
Bone Marrow-Derived Macrophages (BMDMs) ....................................... 31
Fluorescence Activated Cell Sorting (FACS) ........................................... 31
Quantitative Real-Time-PCR (qRT-PCR) ................................................. 32
Immunoblotting (IB) ................................................................................. 32
Immunofluorescence (IF) ......................................................................... 33
3H-thymidine incorporation assay of cellular proliferation ........................ 34
CFSE dye dilution assays to access macrophage proliferation ............... 34

III
Macrophage CSF1-induced spreading assay .......................................... 35
Macrophage CSF1-induced migration assay ........................................... 35
[35S]-methionine/cysteine metabolic labeling of CSF-1R ......................... 35
Immunoprecipitation (IP) .......................................................................... 36
Statistics .................................................................................................. 36
CHAPTER 3: RESULTS ..................................................................................... 52
Expression of EHD proteins in Ehd1-WT and Ehd1-null BMDMs ............ 53
Deletion of EHD1 in BMDMs leads to reduced CSF1-induced responses53
Deletion of EHD1 in BMDMs leads to reduced CSF-1R signaling ........... 54
Reduced surface CSF-1R expression in EHD1-KO BMDMs ................... 55
EHD1 inducible deletion in BMDMs ......................................................... 55
Inducible deletion of EHD1 in BMBMs from Ehd1fl/ fl; CreERT2 mice. ......... 56
Tamoxifen is not toxic to BMDMs in vitro ................................................. 57
Inducible EHD1-KO results in reduced CSF1-induced macrophage
functions .................................................................................................. 58
EHD1-KO BMDMs have reduced CSF-1R signaling ............................... 59
CSF-1R internalization and degradation are similar in EHD1-KO BMDMs
................................................................................................................. 60
Reduced surface CSF-1R expression in EHD1-KO BMDMs ................... 60
EHD1 deletion results in depletion of CSF-1R protein in BMDMs ............ 61
EHD1 functions to transport newly synthesized CSF-1R to the cell surface
................................................................................................................. 61
CSF-1R was found localizes to this EHD1+/GM130+ compartment ......... 63
IV
Newly synthesized CSF-1R transits to lysosomes for degradation in
EHD1-KO BMDMs ................................................................................... 64
CHAPTER 4: DISCUSSION & CONCLUSION ................................................. 125
Discussion ............................................................................................. 126
Conclusion ............................................................................................. 133
BIBLIOGRAPHY ............................................................................................... 138

V
LIST OF FIGURES
Figure 1.1. Macrophages in human disease. 16
Figure 1.2. The origins of tissue macrophages. 18
Figure 1.3. Model of how CSF-1R controls macrophage tissue density. 20
Figure 1.4. CSF-1R signaling governs macrophage biology. 22
Figure 1.5. C-terminal Eps15 homology domain (EHD) proteins. 24
Figure 1.6. Regulation of endocytic transport by EHD proteins. 26
Figure 2.1. Genotyping analysis. 42
Figure 2.2. BMDMs from freshly isolated bone marrow. 44
Figure 2.3. BMDMs with inducible EHD1 deletion. 46
Figure 2.4. 3H-thymidine incorporation assays for cell proliferation. 48
Figure 2.5. CFSE dye dilution assays to assess macrophage proliferation. 50
Figure 3.1. BMDMs defined by F4/80+ flow cytometry staining. 67
Figure 3.2. EHD family expression in Ehd1-WT and Ehd1-null BMDMs. 69
Figure 3.3. 3H-thymidine proliferation assay using BMDMs. 71
Figure 3.4. CFSE assays using Ehd1-WT and Ehd1-null BMDMs. 73
Figure 3.5. CFSE population differences in Ehd1-WT and Ehd1-null BMDMs. 75
Figure 3.6. Ehd1-null BMDMs have reduced CSF1-induced cellular spreading. 77
Figure 3.7. CSF-1 stimulation induces CSF-1R signaling. 79
Figure 3.8. Ehd1-null BMDMs have decreased surface CSF-1R expression upon
CSF-1 deprivation. 81
Figure 3.9. F4/80+ Control and EHD1-KO BMDMs. 83

VI
Figure 3.10. EHD family expression in control and inducible EHD1-KO
BMDMs. 85
Figure 3.11. Lack of CSF-1 response alteration due to TAM treatment. 87
Figure 3.12. Lack of apoptosis toxicity of TAM in BMDMs. 89
Figure 3.13. EHD1 deletion results in reduced proliferation. 91
Figure 3.14. EHD1-KO BMDMs have reduced CSF1-induced proliferation. 93
Figure 3.15. CFSE population model in BMDMs. 95
Figure 3.16. EHD1 deletion results in reduced spreading. 97
Figure 3.17. EHD1-KO BMDMs have reduced migration. 99
Figure 3.18. EHD1-KO BMDMs have decreased pERK downstream CSF-1R
signaling. 101
Figure 3.19. EHD1 deletion has no significant effect on activated CSF-1R
internalization. 103
Figure 3.20. EHD1 deletion has no significant effect on activated CSF-1R
degradation. 105
Figure 3.21. EHD1-KO BMDMs have reduced surface CSF-1R expression. 107
Figure 3.22. EHD1 deletion in BMDMs results in reduced surface CSF-1R
expression. 109
Figure 3.23. EHD1 deletion in BMDMs leads to a reduction in total CSF-1R,
demonstrated by immunoblotting. 111
Figure 3.24. EHD1-KO BMDMs have reduced total CSF-1R using IF. 113
Figure 3.25. EHD1 deletion does not affect CSF-1R synthesis. 115

VII
Figure 3.26. EHD1-KO deletion reduces transport of newly synthesized CSF-1R
to the cell surface. 117
Figure 3.27. CSF-1R co-localizes to a EHD1+/GM130+ compartment. 119
Figure 3.28. EHD1-KO BMDMs have increased CSF-1R lysosomal
degradation. 121
Figure 3.29. EHD1-KO BMDMs shunt CSF-1R to the lysosome. 123
Figure 4.1. Working model of the novel EHD1 function in CSF-1R delivery and
display on the macrophage cell surface. 136

VIII
LIST OF TABLES
Table 1.1. Modulation of the protein expression by CSF-1. 11
Table 1.2. Relationship of EHD proteins to human disease. 13
Table 2.1. Genotypes of mice used in this study. 38
Table 2.2. Genotyping PCR primer sequences. 39
Table 2.3. Real-time PCR primer sequences. 40

IX
LIST OF ABBREVIATIONS
BACE1 Beta-Secretase 1
Baf-A1 Bafilomycin A1
BMDMs Bone Marrow Derived Macrophages
BSA Bovine Serum Albumin
CCR Chemokine CC Receptor;
CSF-1 Colony-Stimulating Factor-1
CSF-1R Colony-Stimulating Factor-1 Receptor
CNS Central Nervous System
EE Early Endosome
EGF Epidermal Growth Factor
EGFR Epidermal Growth Factor Receptor
EHD1 Eps-15 Homology Domain-containing protein 1
EHD1-KO EHD1-Knockout
EHD2 Eps-15 Homology Domain-containing protein 2
EHD3 Eps-15 Homology Domain-containing protein 3
EHD4 Eps-15 Homology Domain-containing protein 4
FACS Fluorescence Activated Cell Sorting
GM130 Golgi Matrix Protein, 130kDa

X
GM-CSF Granulocyte/Macrophage Colony-Stimulating Factor
HSC Hemopoietic Stem Cell
IB Immunoblotting
IF Immunofluorescence
IP Immunoprecipitation
IL Interleukin
iNKT invariant Natural Killer T
LAMP1 Lysosomal associated membrane protein 1
LC Langerhans Cell
LCMV Lymphocytic Choriomeningitis Virus
LE Late Endosome
LPS Lipopolysaccharide
M-CSF Macrophage-Colony-Stimulating Factor
MF Macrophage
mG Microglia
MICAL-L1 Microtubule associated monooxygenase, Calpoin & LIM
domain containing protein 1
OC Osteoclast
PBS Phosphate Buffered Saline

XI
PFA Paraformaldehyde
PI Propidium Iodide
qRT-PCR Quantitative Real-Time-PCR
RT Room Temperature
RTK Receptor Tyrosine Kinase
SC Synoviocytes
SE Sorting Endosome
TAM 4-Hydroxytamoxifen
TAMΦ Tumor Associated Macrophage
VEGF Vascular Endothelial Growth Factor
VEGFR Vascular Endothelial Growth Factor Receptor
VSV Vesicular Stomatitis Virus
WASH Wiskott-Aldrich syndrome protein & Scar Homologue

1
CHAPTER 1: INTRODUCTION
The material covered in the following chapter is the topic of the following published article:
Luke R. Cypher, Timothy Alan Bielecki, Oluwadamilola Adepegba, Lu Huang, An Wei, Fany Iseka, Haitao Luan, Eric Tom, Matthew D. Storck, Adam D. Hoppe, Vimla Band, Hamid Band. CSF-1 receptor signalling is governed by pre-requisite EHD1 mediated receptor display on the macrophage cell surface.
(Accepted for Publication: Cellular Signalling, Available online 17 May 2016)

2
The monocyte/macrophage cell lineage
Cells of the monocyte/macrophage lineage play fundamental roles in
integrating the two major arms (innate and adaptive) immune system. Colony-
stimulating factor-1 receptor (CSF-1R) signaling is essential for the development
of the cells of the monocyte-macrophage lineage by mediating the proliferation
and differentiation of myeloid progenitors into mature, fully functional
macrophages (1). CSF-1R signaling has been demonstrated to instruct
hematopoietic stem cells (HSCs) to differentiate into macrophages via myeloid-
lineage transcription factor PU.1, providing a mechanism for the immune system
to increase macrophage numbers during infection/inflammation (2).
Abnormalities in the development of this cell lineage are incompatible with an
efficient and healthy immune system (3–5).
Macrophages also play pivotal roles in wound repair and the removal of
apoptotic cells. Phagocytosis and subsequent removal of necrotic tissues by
macrophages is an important part of normal human physiology. In wound repair,
macrophages function in the production of the new extracellular matrix. The
mechanism by which macrophages help produce this extracellular matrix is via
macrophage arginase which allows the conversion of arginine to ornithine. This
conversion is necessary to make collagen—an essential building block for
reconstruction of damaged tissues (6).
Of clinical relevance, macrophages are also known to be present in

3
common in human diseases (Figure 1.1). More specifically, macrophages are
known to be involved in immunological diseases (7–9) such as rheumatoid
arthritis, inflammatory bowel disease, and demyelinating neurological diseases
(10–12). Additionally, macrophages also play key homeostatic roles in non-
immune diseases such as atherosclerosis and cancer (13–15).
In the context of cancer, macrophages are key players in
regulating/maintaining the tumor microenvironment and are known as Tumor-
Associated Macrophages (TAMΦ). TAMΦs take part in a positive feedback loop
involving tumor cells. Briefly, the tumor cells secrete CSF-1, which attracts and
maintains TAMΦs along with a combination of other growth factors. TAMΦs in
return secrete Epidermal Growth Factor (EGF) and Vascular Endothelial Growth
Factor (VEGF) which promotes survival of the tumor cells. Specifically, EGF
promotes the growth of the tumor directly, and VEGF promotes vascularization of
the neoplastic tissue (16).
Given their relatively short life span yet relatively constant numbers in
circulation and tissues under homeostasis, and a rapid and sometimes marked
increase in numbers in the face of infection or inflammation, macrophages need
to be continuously produced to match the body’s needs. CSF-1R signaling is
essential for this process to occur (17). It is also known that critical proliferative
signals generated by CSF-1R occur when the receptor has been internalized and
is in the endocytic recycling compartment (18). However, mechanisms which
regulate CSF-1R trafficking have not been studied. A better understanding of
basic mechanisms that govern macrophage biology/CSF-1R signaling is of vital
4
importance regarding treatment of patients afflicted with these conditions.
CSF-1R as the master regulator of macrophages
CSF-1R signaling that is essential for appropriate macrophage
development and population maintenance (Figures 1.2 and 1.3) is controlled by
binding and subsequent activation of the receptor by CSF-1. CSF1-induced CSF-
1R signaling has also been shown directly to regulate the physiological functions
of macrophages such as proliferation, differentiation, spreading, migration,
phagocytosis, and cytokine secretion (Figure 1.4). Furthermore, CSF-1R
signaling also controls universal transcription of the macrophage genome and
subsequent protein expression (19). Hence, if CSF-1R does not directly regulate
macrophage function, the receptor indirectly regulates macrophage biology due
regulation of cellular protein expression (Table 1.1).
CSF-1R, like all receptor tyrosine kinases (RTKs), is synthesized in the
endoplasmic reticulum, glycosylated/matured in the Golgi apparatus, and then
transported to the cell surface where it can become activated via binding of
ligand (CSF-1). Transport of newly synthesized receptor is a prerequisite step in
RTK/CSF-1R activation and signaling (20). Furthermore, if CSF-1R does not
make it to the cell surface or is not oriented on the plasma membrane correctly, it
cannot bind ligand and become activated (signal).
Similarly, to other RTKs, ligand binding of CSF-1 (M-CSF) or IL-34
activates CSF-1R by inducing conformational changes, dimerization, and trans-
phosphorylation, leading to the association of key cytoplasmic signaling

5
intermediates. Signal transduction cascades are activated, including the PI3-
kinase/AKT, Ras/Erk, and Rho/Rac pathways (21, 22). Transcription occurs
downstream of these signaling pathways dictating changes in macrophage
biology.
When CSF-1 binding of CSF-1R occurs at the macrophage’s surface
(RTK activation) endocytic internalization of CSF-1R occurs (18, 23).
Endocytosed RTKs are targeted to the lysosome, which our laboratory and
others have demonstrated to be dependent on CBL-family proteins and ESCRT
complexes (20, 24–26). Also, ligand-stimulated and internalized RTKs can transit
through an endocytic recycling pathway (27). These alternate fates of
internalized RTKs are of a high biological interest as their balance determines the
magnitude and duration of signaling in response to ligand-induced stimulation
(28). Furthermore, activated RTKs continue to signal in endosomes and indeed
may require endocytosis to transduce specific signals (20). CSF-1R signaling at
the cell surface is known to induce phosphorylation of the STAT3 pathway
specifically and not the Erk and Akt pathways. However, once internalized, CSF-
1R signaling from the endosome results in phosphorylation of the Erk and Akt
pathways (18).
After newly synthesized receptor has been transported to the cell surface,
it will undergo constitutive recycling if CSF-1 activation does not occur. CSF-1R
is known to undergo constitutive recycling at a rate of 4 molecules/cell/s at
steady state (29). The combinatory effects of the rate of receptor internalization,
constitutive recycling, and degradation determine the half-life (t1/2) of an RTK.

6
CSF-1R has one of the fastest turnover rates ( t1/2 < 1 hour) of any known RTK
(25). Trafficking of CSF-1R happens extremely fast. In contrast, EGFR has one
of the slowest turnover rates (t1/2 > 24 hours). The rapid turnover rate of CSF-1R,
as compared to other RTKS, is an important caveat which must be taken into
account when trying to understand the biology of the receptor.
C-terminal Eps15 Homology Domain (EHD) containing proteins
The four members of C-terminal Eps15-homology domain-containing
(EHD) protein family have emerged recently emerged as regulators of endocytic
traffic of cell surface receptors (30). EHD proteins are characterized by highly
related primary amino acid sequences amongst family members and similar
domain structure. The domains are composed of a nucleotide-binding G-domain,
coiled-coiled regions that form a membrane lipid-binding domain, an EH domain
(67-86% homology, Figure 1.5A), and a C-terminus that mediates interactions
with partner proteins by binding to asparagine-proline-phenylalanine (NPF)-
containing motifs (Figure 1.5B). In vitro studies have suggested EHD proteins
function in a manner similar to the protein dynamin—as scission proteins to
promote vesicular budding and membrane tubulation (Figure 1.5C). Furthermore,
EHD1 has been linked to the cellular endocytic recycling compartment (Figure
1.6). These studies have shown EHD proteins to be involved in the recycling of
immune-relevant receptors such as MHC class I, MHC class II, β1 integrins (30).
Furthermore, EHD proteins have been correlated with various human diseases
(Table 1.2). However, the role of EHD proteins in CSF-1R trafficking and

7
signaling has not been studied.
Mouse models to study EHD proteins
Our laboratory has previously used individual and combined gene deletion
approaches in mice to discover physiological roles of EHD proteins in vivo. EHD1
deletion on a mixed C57BL/6 and 129Sv background is partially embryonic lethal
and associated with defective spermatogenesis and lens developmental defects.
EHD1 deletion is fully embryonic lethal on a predominantly C57BL/6 background
and related to defective neural tube closure due to lack of ciliogenesis and
altered Hedgehog signaling (31–33). EHD1-null mice also exhibit a skeletal
myopathy (34, 35). EHD4-null mice exhibit reduced testes size and male fertility
while EHD3-null mice are normal (36); however, EHD3/EHD4-null mice show
high early neonatal lethality and develop rapidly progressive renal thrombotic
microangiopathy (37). Further analyses of EHD3-null mice have revealed a
pivotal role of EHD3 in regulating cardiac membrane excitability and rhythm (38).
Consistent with these physiological functions, EHD proteins have been found to
regulate trafficking to the cell surface of non-RTK receptors, such as
Sodium/Calcium (Ca2+) exchanger L-type Ca2+ channel type 1.2 (39) and
voltage-gated T-type Ca2+channels CaV3.1, and CaV3.2 (40) in cardiomyocytes,
and feeling protein Fer1L1 in skeletal muscle cells (34, 35). Currently, little is
known about the physiological roles of EHD proteins. EHD-regulated endocytic
traffic of other receptors characterized in cellular models, including transferrin
receptor (41), MHC class I (42), β1 integrin (43), cadherin 23 (44), L1/Ng-CAM

8
(45), and surface protease BACE1 (46). Similarly, the functional importance of
EHD1 and EHD4 localization to the neuromuscular junction (47) remains unclear.
In contrast to non-RTK receptors, less is known about the roles of EHD
proteins in RTK traffic. EHD4 expression was found to be upregulated by
neurotrophin stimulation of neuronal cultures, and knockdown studies showed
that EHD4 was required for the post-stimulation retrograde traffic of neurotrophin
receptor TrkA (48). We have observed an increased cytoplasmic and reduced
surface localization of vascular growth factor receptor 2 (VEGF2) in glomerular
endothelial cells of EHD3/EHD4 double knockout mice with a glomerular disease,
suggesting a potential role of EHD proteins in facilitating the surface mobilization
of RTKs. At present, no role of EHD proteins in CSF-1R traffic or monocyte-
macrophage function is known.
To establish a biological system in which the functions of endocytic
recycling can be examined in vivo as well as ex vivo, our laboratory has focused
on four highly conserved proteins of the Eps15-homology domain-containing
(EHD) protein family. By creating constitutive as well as inducible mouse
knockout (KO) models, our laboratory aims to uncover previously unanticipated
roles of these proteins in physiological processes. To elucidate the roles of EHD
protein-dependent endocytic recycling in the macrophages, I initiated studies
using mouse macrophages, given the critical duties of the endocytic machinery in
basic macrophage biology, including phagocytosis, endocytic internalization of
foreign antigens or antigen/antibody complexes, antigen processing and display
on the surface, and other roles (49, 50). Mutations of endocytic regulatory

9
proteins in genetic immune disorders, such as Chediak-Higashi Syndrome (51)
and familial lymphohistiocytosis (52) significantly affect macrophage function.
Hypothesis
I hypothesize that EHD1 orchestrates optimal CSF-1R expression and
signaling in macrophages. Furthermore, EHD1 regulates macrophage CSF-1R
surface expression via control of CSF-1R transport to the cell surface, thus
permitting stabilization of the dimerized form of the receptor by CSF-1
(activation). This hypothesis will be explored using primary murine bone marrow-
derived macrophages (BMDMs) from constitutive and inducible EHD knockout
mice. Using an array of biochemistry, immunofluorescence, and Fluorescence
Activated Cell Sorting (FACS) analysis, I will characterize the physiological
functions of EHD1 in the context of CSF-1R signaling in macrophages
responses. Furthermore, I will seek to describe a mechanism behind any
differences detected between control and EHD1-KO macrophages.

10
CHAPTER 1: TABLES

11
Table 1.1. Modulation of the protein expression by CSF-1.

12
Table 1.1. Modulation of protein expression by CSF-1. CSF-1 up-regulates
human monocyte expression of the P2X7 extracellular ATP receptor that
regulates DCs and macrophage inflammatory functions, including intracellular
bacterial killing, and favors the generation of cytokines that stimulate T helper 2
responses. Independently of LPS, CSF-1 induces monocytes to express a variety
of cytokines and immunologically relevant cell surface molecules.
Used with permission (7)

13
Table 1.2. Relationship of EHD proteins to human disease.

14
Table 1.2. Relationship of EHD proteins to human disease. The table
highlights known correlation between EHD proteins and human diseases using
fold increase or decrease of the corresponding EHD protein to a given human
disease.
Used with permission (30)

15
CHAPTER 1: FIGURES

16
Figure 1.1. Macrophages in human disease.

17
Figure 1.1. Macrophages in human disease. Involvement of CSF1-regulated
mononuclear phagocytes in immunity and inflammation. By regulating the
development and activation of mononuclear phagocytes, CSF-1 contributes to
immunity to viral, bacterial and fungal infections and increases the efficiency of
vaccination (e.g. Sendai virus and glioma vaccines). The involvement of specific
macrophage populations is shown. CSF-1 is also involved in promoting and
sustaining inflammation in several diseases (e.g. Alzheimer’s disease, systemic
lupus erythematosus, arthritis and obesity) and in the regulation of TAMΦs in
enhancing tumor progression and metastasis (not shown). Although most studies
have been performed in rodents, for illustrative purposes this information is
depicted on a human body.
Used with permission (7)

18
Figure 1.2. The origins of tissue macrophages.

19
Figure 1.2. The origins of tissue macrophages. Developmental origin of tissue
macrophages in the mononuclear phagocyte system. Embryonic macrophages
from the yolk sac and fetal liver self-renew in homeostatic conditions and are
driven by M-CSF (CSF-1) or GM-CSF. Inflammatory macrophages of embryonic
origin also self-renew.
Used with permission (53)

20
Figure 1.3. Model of how CSF-1R controls macrophage tissue density.

21
Figure 1.3. Model of how CSF-1R controls macrophage tissue density. CSF-
1R signaling controls the proliferation of tissue macrophages. Constant secretion
of CSF-1 by tissue stroma and consumption by macrophages maintains
population density just below the CSF-1R signaling threshold required for
proliferation (A). Steady state death/ migration (B) or disappearance during
inflammation (C) increases available CSF-1 without necessarily changing
production of CSF-1, thereby allowing proliferation to restore normal density.
Elevated CSF-1 secretion stimulates cells to proliferate to higher tissue density
than normal (D), but can also stimulate monocyte recruitment via macrophage
chemokine production (E). Recruitment likely requires a higher threshold of CSF-
1R signaling than proliferation, but this remains to be established. Other factors,
such as IL-4, can allow macrophages to proliferate independently of CSF-1
thereby increasing macrophage numbers when CSF-1 is limiting and without a
concurrent increase in monocyte recruitment (F).
Used with permission (54)

22
Figure 1.4. CSF-1R signaling governs macrophage biology.

23
Figure 1.4. CSF-1R signaling governs macrophage biology. Signaling
pathways regulated by colony-stimulating factor-1 receptor (CSF-1R) in myeloid
cells. Binding of Colony-stimulating factor-1 (CSF-1) stabilizes a dimeric form of
the CSF-1R and leads to activation of the CSF-1R kinase, its tyrosine
phosphorylation, and the direct association of signaling molecules with the
receptor through their phosphotyrosine-binding domains. The precise
involvement of the Ras–MEK–MAPK pathway in the CSF1-regulated proliferation
and differentiation of myeloid cells is not clear, but Raf-1 seems to signal
independently of this pathway. Differences in signaling pathways are also
expected to exist between macrophage progenitor cells and macrophages.
Used with permission and modified (17)

24
Figure 1.5. C-terminal Eps15 homology domain (EHD) proteins.

25
Figure 1.5. Domain architecture, conservation, and function of C-terminal
Eps15 homology domain (EHD) proteins. (A) The EHD proteins, comprised of
534–543 amino acids, each contain two helical regions, a conserved ATP-
binding domain, a linker region and an EH domain localized to the C-terminus of
the protein. (B) Comparison of the amino acid sequence identity of full-length
EHD proteins. (C) Proposed model of EHD protein function. Cytoplasmic
localized EHD proteins bind ATP and dimerize. EHD dimerization causes the
formation of a membrane binding site and the EHD proteins associate with
tubular membranes, where they undergo further oligomerization. Upon ATP
hydrolysis, the membranes are destabilized, leading to scission of vesicles
containing concentrated cargo/receptors, thus facilitating vesicular transport.
Used with permission (30)

26
Figure 1.6. Regulation of endocytic transport by EHD proteins.

27
Figure 1.6. Regulation of endocytic transport by EHD proteins. Internalized
receptors reach the sorting or early endosome (EE) and are trafficked through
one of at least four pathways. Receptors slated for degradation are sorted to EE
microdomains containing EHD4, Rab5, and Rabenosyn-5 and transported to late
endosomes and lysosomes. Other internalized proteins, such as the Shiga toxin,
are carried from EE to the Golgi via an EHD3 and/or EHD1-dependent retrograde
pathway. Receptors that recycle back to the plasma membrane can do so
directly from EE in a poorly defined manner that requires the function of Rab4
(fast recycling). Alternatively, many receptors are first directed to the perinuclear
endocytic recycling compartment and then shuttled to the plasma membrane
(slow recycling). Slow recycling requires the following function of multiple
regulators including Rab5, Rab11, Rab8a, their effectors (Rabenosyn-5, Rab11-
FIP2, and MICAL-L1, respectively), and EHD proteins.
Used with permission (30)

28
CHAPTER 2: MATERIALS & METHODS
The material covered in the following chapter is the topic of the following published article:
Luke R. Cypher, Timothy Alan Bielecki, Oluwadamilola Adepegba, Lu Huang, An Wei, Fany Iseka, Haitao Luan, Eric Tom, Matthew D. Storck, Adam D. Hoppe, Vimla Band, Hamid Band. CSF-1 receptor signalling is governed by pre-requisite EHD1 mediated receptor display on the macrophage cell surface.
(Accepted for Publication: Cellular Signalling, Available online 17 May 2016)

29
Materials
Bovine Serum Albumin (cat. # A7906-100G), Paraformaldehyde (cat. #
158127-500G), Triton X-100 (cat. # 93418), and 4-hydroxytamoxifen (cat. #
T176-10MG) were from Sigma-Aldrich (St. Louis, MO). Propidium Iodide staining
solution (cat. # 00-6990-42) was from eBiosciences. Hema staining solutions
(cat. # 23-123919) were from Fisher. 3H-thymidine (cat. # 2407001, 2.0Ci/mmol)
was from MP Biomedical and [35S] (cat. # NEG772007MC, 1175 Ci/mmol) was
from Perkin Elmer. Bafilomycin A1 (cat. # 196000) was from MilliPore. EDTA-free
protease inhibitor cocktail (cat. # 4693159001) was from Roche, ECL
development reagent (cat. # 32106) was from Thermo-Scientific. Recombinant
CSF-1 (catalog # 315-02) was from Peprotech (Rocky Hill, NJ). CFSE (cat. #
C34554) and RPMI-1640 (cat. # SH30027.02) were from ThermoFisher
Scientific. Penicillin/streptomycin (cat. # 15140-122) and Fetal Bovine Serum
(cat. # 10427-028; lot # 1662765A120-01) were from Life Technologies.
Antibodies: Brilliant Violet 711 conjugated anti-CSF-1R and anti-CSF-1R, AFS98
(cat. # 135515) were from Biolegend; anti-CSF-1R C-20 (cat. # sc-692), anti-
CSF-1R G-17 (cat. # sc-31638) anti-HSC70 (cat. #sc-7298), and anti-LAMP1
1D4B (cat. # sc-19992) were from Santa Cruz Biotechnology; anti-EHD1 (cat. #
ab109311) was from Abcam; anti-β-Actin (cat. # A5316) was from Sigma-Aldrich;
anti-pErk42/44 (cat. # 9101) was from Cell Signaling Technology; F4/80-APC,
BM8 (cat. # 17-4801-82) and anti-GM130 (cat. # 610822) were from BD
Biosciences; CD16/32 (cat. # 14-0161), and APC-conjugated anti-Annexin V (cat.
# 17-8007-72) were from eBiosciences; a polyclonal rabbit antibody recognizing

30
EHD1 and EHD4 was generated in-house was described previously (45).
Secondary fluorochrome-conjugated antibodies were from Life Technologies.
Mouse Models
Ehd1-null mice were maintained on mixed 129; B6 background (36).
Single nucleotide polymorphism (SNP) analysis (DartMouse, Lebanon, NH)
revealed these to have ~70% contribution from the C57Bl/6 genome (Figure 2.1).
Ehd1-WT (wild type), Ehd1-het (heterozygous), and Ehd1-null (homozygous null)
mice were generated by mating Ehd1-het mice. Mice used in this study are
named according to Table 2.1. Breeders were maintained on high-fat chow (#
2019, Harlan Laboratories Inc., Madison, WI). Genomic DNA was extracted from
embryonic yolk sacs or adult tail tips with proteinase K digestion, isopropanol
precipitation and used for genotyping as described previously (Rainey et al.,
2010).
To conditionally delete Ehd1, Ehd1flox/flox (Ehd1fl/fl mice in a
predominantly C57BL/6 background (33, 36) were crossed with tamoxifen-
inducible CreERT2 expressing mice from Jackson Laboratories
(Gt(ROSA)26Sortm1(cre/ERT2)Tyj; strain 008463) to generate Ehd1fl/fl; CreERT2 mice.
Genotypes were confirmed by subjecting tail clip DNA to qRT-PCR analysis
using the KAPA Mouse Genotyping kit (KAPA Biosystems) and primer pairs
described in Table 2.2. Mice were treated humanely according to the National
Institutes of Health (NIH) and The University of Nebraska Medical Center
guidelines. Animal studies were pre-approved by the Institutional Animal Care

31
and Use Committee (#07-061-FC12).
Bone Marrow-Derived Macrophages (BMDMs)
Bone marrow was harvested from 8-12 week old mice by removing the
femur bones, cutting the ends, and flushing with ice-cold PBS. Red blood cells
were lysed with solute-free H2O, and the bone marrow was plated on tissue
culture coated dishes for 16 hours to allow mature/non-progenitor cells to attach.
The non-adherent progenitor population was collected by pipetting and re-plated
in 15-cm Petri dishes (non-tissue culture treated). Cells were then incubated for 6
days in BMDM media (RPMI w/ 15% FBS, 10% L929 supernatant and 1%
penicillin/streptomycin) at 37oC and 5% CO2 to produce differentiated bone
marrow-derived macrophages (BMDMs). Culture media was changed every 2
days and cells were cultured for longer than 30 days. To assess the impact of
EHD1 deletion, Ehd1fl/fl; CreERT2 BMDMs were either cultured in regular medium
(wildtype EHD1 expression) or medium containing 200 nM 4-hydroxytamoxifen
(TAM) for 4 days to induce EHD1 deletion. This protocol was based on the initial
time course and titration studies to determine optimal culture conditions. An
illustration of BMBM preparation is displayed in Figure 2.2 and for inducible gene
deletion in Figure 2.3.
Fluorescence Activated Cell Sorting (FACS)
BMDMs were washed with ice-cold PBS and blocked for 10 minutes for
non-specific binding with CD16/32 (Fc Blocker) and then incubated with
32
appropriate antibodies at a dilution of 1:400 and put in the dark and on ice for
30min. Cells were then pelleted, washed with PBS twice, and suspended in 400
µl of 0.1% BSA/PBS, put on ice, and protected from light.
Quantitative Real-Time-PCR (qRT-PCR)
RNA was isolated from BMDMs cultured on 10-cm tissue culture plates
using the Trizol reagent, and 1 µg of total RNA was reverse transcribed using the
QuantiTect Reverse Transcription Kit (QIAGEN). 10% volume of the reaction of
the ensuing cDNA was used with QuantiTect SYBR Green qRT-PCR Kit
(QIAGEN) for qRT-PCR of mouse CSF-1R, using the primer sequences in Table
2.3. GAPDH was used as a control, and changes in CSF-1R were calculated
using the threshold cycle method (55). Each reaction was performed in triplicate
in a volume of 50 µL with primers at a final concentration of 250 nM.
Immunoblotting (IB)
Immunoblotting/Western blotting was performed as described (36). Briefly,
BMDMs were washed with ice-cold PBS and lysed in ice-cold Triton X-100 lysis
buffer (0.5% Triton X-100, 50 mM Tris pH 7.5, 150 mM sodium chloride, and
EDTA-free protease inhibitor cocktail). The lysates were vortexed, centrifuged at
13,000 rpm for 30 minutes at 4o C, and supernatants collected. Protein
quantification was done by using a Thermo Scientific-Pierce Bicinchoninic acid
(BCA) assay (cat. # 23225). 40 μg of lysate protein per sample was resolved by
SDS/PAGE and transferred to a PVDF membrane (Millipore, cat. # IPVH00010).

33
The membranes were blocked in TBS/1% Bovine Serum Albumin (BSA),
incubated with the appropriate primary antibodies diluted in TBS-0.1% Tween 20
(BIO-RAD, cat. # 161-0781) overnight at 4°C. Next, membranes were washed in
TBS-0.1% Tween (3 times for 10 minutes) followed by a 1-hour incubation with
HRP-conjugated secondary antibody at room temperature. The membrane was
washed in TBS-0.1% Tween (3 times for 10 minutes) each and ECL-based
detection performed.
Immunofluorescence (IF)
Imaging using immunofluorescence was performed as previously
described (56) with minor modifications. BMDMs were cultured on glass
coverslips and fixed with 2% PFA/PBS for 5 min to assess the cell surface CSF-
1R signals (57). Cells were fixed and permeabilized in methanol for 10 minutes at
-20oC to evaluate total CSF-1R. The cells were then blocked with 1% BSA/PBS
for 30 minutes and incubated with primary antibodies in 1% BSA/PBS overnight.
Cells were then washed with PBS (three times), BMDMs incubated with the
appropriate fluorochrome-conjugated secondary antibody for 45 minutes at room
temperature (RT), washed and mounted using Fluoromount-G (Southern
Biotech, Cat. # 0100-01) or VECTASHEILD mounting medium (Vector
Laboratories, Cat. # H-1400 and H-1500). Images were acquired using a
LeicaCTR4000 inverted microscope equipped with a QICAM 12-bit color camera,
12V 100 W halogen lamp, QCapture software and 60x oil lens (For CSF-1R) and
a Zeiss 710 Meta Confocal Laser Scanning microscope (Carl Zeiss) using a 63×

34
objective with a numerical aperture of 1.0 and appropriate filters. Merged
fluorescence pictures were generated and analyzed using ZEN® 2012 software
from Carl Zeiss.
3H-thymidine incorporation assay of cellular proliferation
BMDMs were deprived of CSF-1 for 16 hours and plated in 48-well plates
at 10,000 cells/well and allowed to attach overnight at 37ºC, 5% CO2. Cells were
then treated with 30 ng/mL CSF-1 and allowed to proliferate for 2, 4 or 6 days.
Cells were pulsed with 4 µCi/well of 3H-Thymidine for the last 6 hours of the
assay. Radioactivity incorporated into DNA was collected by washing the cells
with 10% TCA per well followed by 300 µl per well 0.2 N NaOH at room
temperature to dissolve DNA. Each sample was transferred into vials with 5 mL
of scintillation fluid and counts per minute (c.p.m.) were recorded with a
scintillation counter. The protocol for 3H-thymidine incorporation assay of cellular
proliferation is summarized in Figure 2.4.
CFSE dye dilution assays to access macrophage proliferation
Macrophages were cultured with recombinant CSF-1 (30 ng/mL) for 2, 4,
or 6 days post initial CFSE population staining (Day 0) according to the
manufacturer’s protocol. Dilution of CFSE fluorescence as an indicator of cell
division was assessed via flow cytometry, and the geometric means of the
histograms were used to evaluate the degree of cell division in response to CSF-
1. The protocol for CFSE dye dilution assay to access macrophage proliferation

35
is summarized in Figure 2.5.
Macrophage CSF1-induced spreading assay
BMDMs without (Control) or with (EHD1-KO) TAM were plated on
coverslips and allowed to attach for 2 days. The BMDMs were then deprived of
CSF-1 for 16 hours and then stimulated with 100 ng/mL CSF-1 for 10 minutes.
Cells were fixed for 10 minutes with 4% PFA, washed with PBS (3 times for 10
minutes), and stained using phalloidin-488 (ThermoFisher Scientific, cat. #
A12381). ImageJ software was used to quantify the surface area of
macrophages.
Macrophage CSF1-induced migration assay
BMDMs were deprived of CSF-1 for 4 hours and placed in the upper
chambers of 5 µm pore inserts (Corning, cat. # 3421) at 1x10⁵ cells per chamber
in 100 µl RPMI without CSF-1. Cells were then allowed to migrate towards CSF-1
(30 ng/mL) for 3 hours at 37°C. Cells on the bottom surface of membranes were
fixed with 100% methanol and stained with HEMA for 5 minutes. Cells were
visualized under a bright field microscope at 20x. Migrated cells were counted in
10 fields per insert, and the total number of migrated cells was calculated for
control and EHD1-KO BMDMs.
[35S]-methionine/cysteine metabolic labeling of CSF-1R
BMDMs were seeded at 5x10⁶ cells/10-cm plate in CSF1-containing

36
medium and cultured for 16 hours. The cells were washed and incubated in
methionine/cysteine-free RMPI-1640 medium supplemented with 15% FBS and
30 ng/mL recombinant CSF-1 for 30 minutes at 37oC and pulsed with 0.1 mCi of
[35S] for 15 minutes at 37oC. Cells were then washed and incubated with regular
culture medium containing a 20-fold excess of unlabeled methionine/cysteine for
0, 15, 30, and 60 minutes of chase.
Immunoprecipitation (IP)
Cells were rinsed with ice-cold PBS and immediately lysed in ice-cold
Triton X-100 lysis buffer with EDTA-free protease inhibitor cocktail. Anti-CSF-1R
immunoprecipitations were carried out using 500 μg samples of cleared lysate
protein and anti-CSF-1R (C-20) antibody followed by exposure to Protein-A
Sepharose beads. Samples were resolved by SDS/PAGE (8%). Gels were fixed,
dried, and incubated with Auto-Fluor (National Diagnostics, cat. # LS-315) to
amplify [35S] signals. Radiography was performed after films were exposed to the
dried gels at -80oC in metal cassettes with intensifying screens.
Statistics
P-values were calculated by using an unpaired Student’s t-test and the
threshold of significance is p<0.05. Data are shown graphically as means ± SEM
(error bars).

37
Chapter 2: Tables

38
Table 2.1. Genotypes of mice used in this study.
Strain Designation Genotype
Ehd1-WT Ehd1+/+
Ehd1-null Ehd1-/-
Control Ehd1fl/fl; CreERT2
EHD1-KO Ehd1fl/fl; CreERT2 (+TAM)

39
Table 2.2. Genotyping PCR primer sequences.
Target Forward primer 5 - 3’ Reverse primer 5 - 3'
Ehd1-WT AAGTCAGAAGACAACTTTCTGGAGTTCCCT
TCCAGGGCCCACATGGTAGAAGGAGAGAGT
Ehd1-null AAGTCAGAAGACAACTTTCTGGAGTTCCCT
GCTCCGGTCTTGGACTTCACCAGCATTTAG
Ehd1fl/fl AAGTCAGAAGACAACTTTCTGGAGTTCCCT
TCCAGGGCCCACATGGTAGAAGGAGAGAGT
CreERT2 GCGGTCTGGCAGTAAAAACTATC
GTGAAACAGCATTGCTGTCACTT

40
Table 2.3. Real-time PCR primer sequences.
Target Forward 5’ - 3’ Reverse 5’ - 3’
CSF-1R GCAGTACCACCATCCACTTGTA GTGAGACACTGTCCTTCAGTGC
EHD1 AGGACAGCCGCAAAGTCATA ACTGGACAGCATCAGCATCA
EHD2 CTTGTTTTCCTTCCCGAACA CAACGACCTAGTGAAACGGG
EHD3 TCATGCCTGGAAAATCCTGT GATTTCGACAACAAGCCCAT
EHD4 CGGCAAACCACTGTAAGACC GCATCAGCATCATCGACAGT
GAPDH TTGATGGCAACAATCTCCAC CGTCCCGTAGACAAAATGGT

41
CHAPTER 2: FIGURES

42
Figure 2.1. Genotyping analysis.

43
Figure 2.1. Genotyping analysis. Genotyping analysis of Ehd1-WT and Ehd1-
null mice in comparison to the Jackson Laboratory C57BL/6J reference strain
was carried out by DartMouse, Lebanon, NH using 1449 SNP Illumina Bead
Chip. Each SNP output is color coded. Red represents C57Bl/6, blue represents
heterozygous (B6 x 129), and yellow represents 129Sv. All analyzed mice (Ehd1-
WT and Ehd1-null) correspond to approximately mid-70% C57BL/6 background.

44
Figure 2.2. BMDMs from freshly isolated bone marrow.

45
Figure 2.2. BMDMs from Freshly Isolated bone marrow. Bone marrow was
harvested from 8-12 week old mice by removing the femur bones, cutting the
ends, and flushing with ice-cold PBS. Cells were then incubated for 6 days in
BMDM media [RPMI w/ 15% FBS, 10% L929 supernatant (58) 1%
penicillin/streptomycin] to produce bone marrow-derived macrophages (BMDMs).
If inducible deletion was needed when using Ehd1fl/fl; CreERT2 BMDMs, cells were
cultured in regular medium (wildtype EHD1 expression) or medium containing
200 nM 4-hydroxytamoxifen (TAM) for an additional 4 days to induce EHD1
deletion (EHD1-KO).

46
Figure 2.3. BMDMs with inducible EHD1 deletion.

47
Figure 2.3. BMDMs with inducible EHD1 deletion. Ehd1fl/fl mice on a
predominantly C57BL/6 background (33, 36) were crossed with tamoxifen-
inducible CreERT2 expressing mice from Jackson Laboratories
(Gt(ROSA)26Sortm1(cre/ERT2)Tyj; strain 008463) to generate Ehd1fl/fl; CreERT2 mice.
Bone marrow was harvested from 8-12 week old mice by removing the femur
bones, cutting the ends, and flushing with ice-cold PBS. Cells were then
incubated for 6 days in BMDM media [RPMI w/ 15% FBS, 10% L929 supernatant
(58) 1% penicillin/streptomycin] to produce bone marrow-derived macrophages
(BMDMs). If inducible deletion was needed when using Ehd1fl/fl; CreERT2 BMDMs,
cells are further cultured in regular medium (wildtype EHD1 expression) or
medium containing 200 nM 4-hydroxytamoxifen (TAM) for an additional 4 days to
induce EHD1 deletion (EHD1-KO).

48
Figure 2.4. 3H-thymidine incorporation assays for cell proliferation.

49
Figure 2.4. 3H-thymidine incorporation assays for cell proliferation. BMDMs
were deprived of CSF-1 for 16 hours and plated in 48-well tissue culture plates at
10,000 cells per well and allowed to attach overnight at 37 ºC, 5% CO2. Cells
were then treated with 30 ng/mL CSF-1 and allowed to proliferate for 2, 4 or 6
days. Cells were pulsed with 4 µCi/well of 3H-thymidine for the last 6 hours of the
assay. Radioactivity incorporated into DNA was collected by washing the cells
with 10% TCA per well followed by 300 µl per well 0.2 N NaOH at room
temperature to dissolve DNA. Each sample was transferred into vials with 5 mL
of scintillation fluid and counts per minute (c.p.m.) were recorded with a
scintillation counter. Macrophages were cultured with recombinant CSF-1 (30
ng/mL) for 2, 4 or 6 days post initial CFSE population staining (Day 0) according
to manufacturer’s protocol. Dilution of CFSE fluorescence as an indicator of cell
division was assessed via flow cytometry, and the geometric means of the
histograms were used to evaluate the degree of cell division in response to CSF-
1.
50
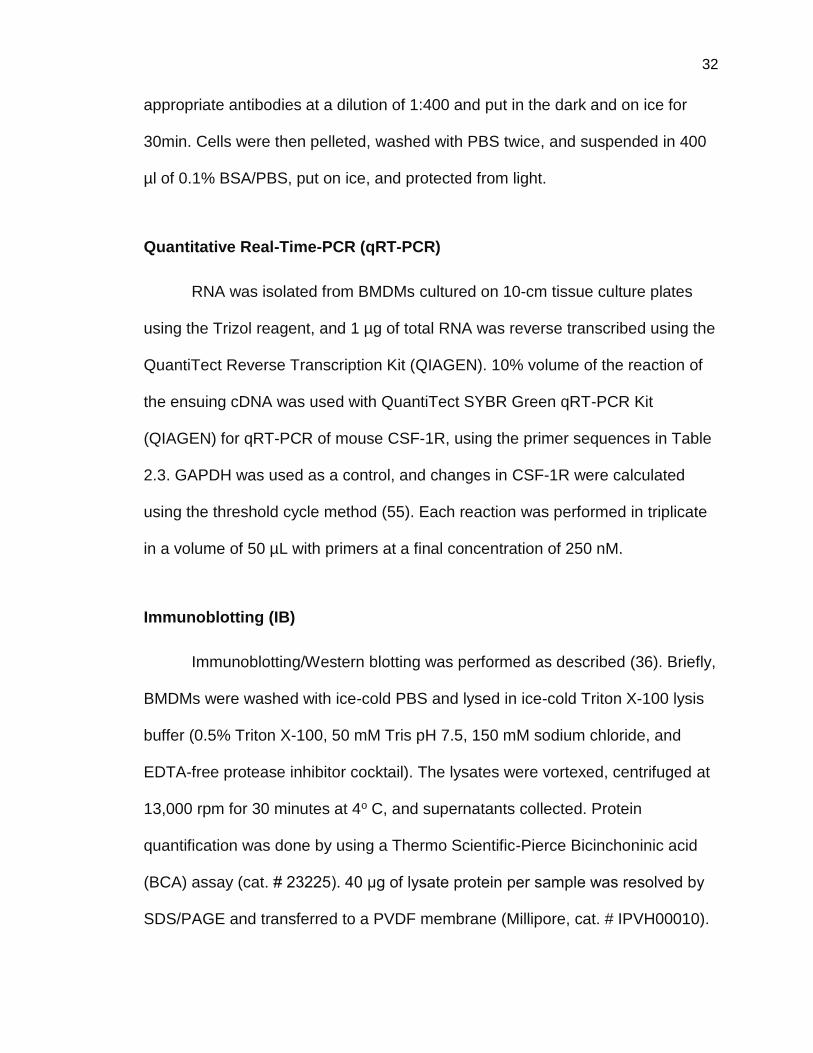
Figure 2.5. CFSE dye dilution assays to assess macrophage proliferation.

51
Figure 2.5 CFSE dye dilution assays to access macrophage proliferation.
After initial homogeneous labeling of the cell population at day 0 with the CFSE
dye, cells were stimulated (30ng/mL CSF-1) to proliferate. Upon cell division,
decreasing fluorescence (theoretically half) of the parent cell’s fluorescence is
retained by each daughter population. Equal dye distribution dilution upon cell
subsequent cellular divisions created different subpopulations, and when
analyzed by flow cytometry the relative percentages of the original population in
each subpopulation were determined. Note: lower MFI = more cellular
proliferation.

52
CHAPTER 3: RESULTS
The material covered in the following chapter is the topic of the following published article:
Luke R. Cypher, Timothy Alan Bielecki, Oluwadamilola Adepegba, Lu Huang, An Wei, Fany Iseka, Haitao Luan, Eric Tom, Matthew D. Storck, Adam D. Hoppe, Vimla Band, Hamid Band. CSF-1 receptor signalling is governed by pre-requisite EHD1 mediated receptor display on the macrophage cell surface.
(Accepted for Publication: Cellular Signalling, Available online 17 May 2016)

53
Expression of EHD proteins in Ehd1-WT and Ehd1-null BMDMs
To assess the potential role of EHD proteins in the context of CSF-1R, I
chose to use primary BMDMs as these cells recapitulate in vitro the requirement
of CSF1R-mediated signals for appropriate development and function (59). Flow
cytometry analysis of mature macrophage marker F4/80 (58) confirmed the
expected homogeneous differentiation of bone marrow progenitors into BMDMs
when cultured in CSF1-containing medium (Figure 3.1).
To assess EHD levels in BMDMs and to assure Ehd1-deletion, qRT-PCR
and immunoblotting were performed for EHD family members. qRT-PCR
revealed that Ehd1-WT BMDMs express EHD1 and EHD4 mRNA but not
significant levels of EHD2 or EHD3 (Figure 3.2). Ehd1-null BMDMs had the same
profile as Ehd1-WT BMDMs with the exception that Ehd1-null BMDMs had
undetectable EHD1 mRNA expression (Figure 3.2). Western blot analysis of
EHD1 and EHD4 expression confirmed the qRT-PCR results (Figure 3.2).
Neither qRT-PCR nor Western blot analyses revealed a significant compensatory
increase in the expression of EHD family members when EHD1 was deleted
(Figure 3.2). These initial analyses provided a basis to explore a potential role of
EHD1 in regulating CSF-1R signaling and traffic.
Deletion of EHD1 in BMDMs leads to reduced CSF1-induced
responses
To assess implications of inducible EHD1 deletion on CSF1-induced

54
cellular responses, I first compared the CSF1-induced proliferation of BMDMs
using two separate methods: 3H-thymidine incorporation and CFSE dye dilution
assays. Both of these assays have previously been used to assess macrophage
proliferation in response to CSF-1 [54, 55]. Both 3H-thymidine incorporation and
CFSE dye dilution proliferation assays showed a significant deficit in CSF1-
induced macrophage proliferation in the Ehd1-null population of BMDMs (Figures
3.3-3.5).
As stimulation through CSF-1R is known to correlate with rapid
macrophage spreading (62), I next conducted a spreading assay to examine the
impact of EHD1 deletion on macrophage cellular spreading. Ehd1-WT and Ehd1-
null BMDMs were deprived of CSF-1 for 16 hours and then stimulated with CSF-
1 for 10 minutes. The cells were then fixed and stained (Phalloidin-488) to
assess the extent of cell spreading by quantifying the surface area of individual
macrophages in both Ehd1-WT and Ehd1-null BMDMs. Ehd1-null BMDMs
exhibited reduced spreading in response to CSF-1 stimulation (Figure 3.6).
Collectively, these results indicate that Ehd1-deletion in BMDMs impairs the
CSF1-induced macrophage phenotype.
Deletion of EHD1 in BMDMs leads to reduced CSF-1R signaling
I next sought to determine the effect of EHD1 deficiency on CSF-1R
signaling activation of the ERK pathway since macrophage proliferation is known
to be mediated by this pathway (17). The levels of pERK upon CSF-1 stimulation
were significantly lower in Ehd1-null as compared to Ehd1-WT BMDMs (Figure

55
3.7). Thus, Ehd1-deletion results in decreased CSF1-induced CSF-1R signaling
in macrophages.
Reduced surface CSF-1R expression in EHD1-KO BMDMs
CSF-1R display at the cell surface is essential for CSF-1R
activation/signaling by CSF-1 (17). Given the results above and the known role of
EHD1 in the endocytic trafficking of cellular surface receptors (41–47), I next
sought to determine if absence of EHD1 alters cell surface CSF-1R expression in
BMDMs.
Since BMDMs require CSF-1 for in vitro culture, surface levels of CSF-1R
are low under steady state conditions due to continuous activation and lysosomal
degradation of ligand-activated CSF-1R (25, 29). Therefore, I assessed the cell
surface CSF-1R levels at 16 hours following the removal of CSF-1 from the
culture medium (CSF-1 deprivation) in order to allow the newly synthesized CSF-
1R to accumulate at the cell surface. As expected, Ehd1-WT surface CSF-1R
levels increased to a high level. In contrast, accumulation of cell surface CSF-1R
on Ehd1-null BMDMs was significantly less after 16 hours CSF-1 deprivation
(Figure 3.8). Thus, EHD1 deletion in BMDMs results in decreased surface CSF-
1R expression.
EHD1 inducible deletion in BMDMs
Our initial analysis thus far of BMDMs derived from whole-body Ehd1-null
mice showed that EHD1 and EHD4 are expressed in BMDMs and that loss of

56
EHD1 led to reduced CSF-1R signaling, CSF-1R surface levels, cell proliferation,
and cellular spreading (Figures 3.1-3.8). Thus, EHD1 functions as a positive
regulator of CSF-1R signaling in macrophages.
While our existing Ehd1-null mice provide a reasonable approach, I sought
to eliminate any macrophage developmental bias in the whole body Ehd1-null
mice. Moreover, I used BMDMs isolated from Ehd1fllfl; CreERT2 mice without
(Control) and with (EHD1-KO) tamoxifen (TAM) treatment to confirm my findings
that Ehd1 is a positive regulator of CSF-1R signaling in macrophages.
Inducible deletion of EHD1 in BMBMs from Ehd1fl/ fl; CreERT2 mice.
To determine if deletion of inducible EHD1 deletion had a functional
impact in BMDMs, I first assessed whether or not EHD1-KO bone marrow
progenitors could be differentiated into BMDMs and subsequently have EHD1
deletion induced by TAM treatment in vitro. Ehd1fl/fl; CreERT2 BMDMs cultured
in the absence or presence of TAM were stained with F4/80 antibody and
analyzed via Facilitated Analysis Cell Sorting (FACS). Greater than 99% of
BMDMs without (Control) and with (EHD1-KO) TAM treatment stained positive
for F4/80+ (Figure 3.9). Thus, these results demonstrate the ability of bone
marrow from Ehd1fl/fl; CreERT2 mice to differentiate into mature macrophages.
Next, to confirm EHD family expression in BMDMs from Ehd1fl/ fl; CreERT2
mice without (Control) and with (EHD1-KO), qRT-PCR was carried out. BMDMs
from Ehd1fl/ fl; CreERT2 mice without (Control) and with (EHD1-KO) expressed

57
EHD1 and EHD4 mRNA but did not express significant levels of EHD2 or EHD3
(Figure 3.10A). Furthermore, BMDMs cultured in the presence (EHD1-KO) of
TAM showed undetectable EHD1 mRNA expression (Figure 3.10A). Thus, these
data confirmed an efficient and effective knockout of EHD1 (EHD1-KO) with TAM
treatment. Western blot analysis of EHD1 and EHD4 expression confirmed the
qRT-PCR results of a successful EHD1-KO (Figure 3.10B). Neither qRT-PCR nor
Western blot analyses revealed a significant compensatory increase in the
expression of other EHD family members when EHD1 is deleted (Figure 3.10).
These findings solidified our initial findings of EHD family protein expression in
BMDMs using whole-body Ehd1-null mice.
Tamoxifen is not toxic to BMDMs in vitro
I next performed control experiments to verify that any phenotypic effects I
observed using EHD1-KO BMDMs were bona fide effects of EHD1 deletion and
not effects of tamoxifen treatment. To exclude the possibility that reduced CSF-1
elicited biological responses in tamoxifen-induced EHD1-KO BMDMs were not
due to incidental toxicity of tamoxifen, as observed in previously reported
systems (63), I cultured BMDMs from Ehd1fl/fl mice (lacking CreERT2), with or
without TAM, and assessed their CSF1-induced proliferation using the CFSE dye
dilution assay. Untreated vs. TAM-treated Ehd1fl/fl BMDMs exhibited comparable
proliferative responses to CSF-1 (Figure 3.11), indicating TAM treatment did not
alter in vitro BMDM CSF-1R signaling.
To further control for possible toxic side-effects of TAM treatment, I

58
assessed apoptosis with Annexin V and propidium iodide (PI) staining using
Ehd1fl/fl BMDMs cultured with or without TAM. The double staining with Annexin
V and PI was analyzed by flow cytometry and did not reveal any significant
differences in the percentage of apoptotic cells in Ehd1fl/fl BMDMs cultured with
or without TAM (Figure 3.12). These assays showed a lack of TAM treatment
toxicity or attenuation of CSF1-induced CSF-1R signaling responses in BMDMs.
Inducible EHD1-KO results in reduced CSF1-induced
macrophage functions
To assess the role of EHD1 in macrophage CSF1-induced cellular
responses, I assayed the effects of CSF1-induced proliferation on BMDMs
derived from Ehd1fl/fl; CreERT2 mice without (Control) and with (EHD1-KO) TAM
treatment. I used two independent methods to assess macrophage proliferation
as with my initial studies using BMDMs from Ehd1-null mice: 3H-thymidine
incorporation and CFSE dye dilution assays. Both assays showed EHD1-KO
macrophages had significantly reduced proliferative responses when stimulated
with CSF-1 (Figures 3.13-3.15). These findings confirmed my initial findings
using BMDMS from Ehd1-WT and Ehd1-null mice.
Next, I sought to examine the impact of EHD1 deletion on CSF1-induced
macrophage functional response. BMDMs cultured without (Control) or with
(EHD1-KO) TAM were subjected to a spreading assay. EHD1-KO BMDMs
exhibited reduced spreading in response to CSF-1 stimulation (Figure 3.16).
These findings confirmed my initial findings using BMDMS from Ehd1-WT and

59
Ehd1-null mice.
To further assess the impact of EHD1 deletion on CSF1-induced
macrophage functional responses, I conducted a trans-well migration. This
migration assay is a well-established way to assess macrophages response to
CSF-1 stimulation (64). Compared to the control group, EHD1-KO BMDMs
showed a significant reduction in migration (Figure 3.17).
Collectively, these results demonstrated that EHD1-KO in BMDMs leads
to a significant deficit in CSF1-induced cellular responses. Furthermore, EHD1
appears to mediate CSF1-induced macrophage function via regulation of CSF-
1R signaling. These findings solidified my initial findings using Ehd1-WT and
Ehd1-null BMDMS.
EHD1-KO BMDMs have reduced CSF-1R signaling
Next, I assessed the effects of EHD1-KO on CSF-1R signaling
downstream activation of the MAPK pathway, which is known to modulate
cellular proliferation (65, 66). After 16 hours of CSF-1 deprivation, the total CSF-
1R levels were lower in the EHD1-KO compared to Control BMDMs (Figure 3.18;
0-time points). Commensurate with diminished CSF-1R, accumulation of pERK in
EHD1-KO BMDMs was significantly lower than in control BMDMs (Figure 3.18).
These findings suggest diminished CSF-1R signaling is a consequence of EHD1
absence in macrophages and is likely due to decreased total CSF-1R protein.
These findings solidify our findings using Ehd1-WT and Ehd1-null BMDMS.

60
CSF-1R internalization and degradation are similar in EHD1-KO
BMDMs
Since EHD1 has thus far been primarily characterized as a regulator of the
recycling back to the cell surface of previously internalized cell surface receptors
(30), I wished to determine if the post-endocytic traffic of CSF-1R may also be
regulated by EHD1. CSF-1 stimulation of BMDMs is known to induce rapid CSF-
1R internalization (~5 minutes), transport to macropinosomes (~5–15 minutes)
and lysosomal degradation (~30 minutes) (23, 25, 57). Both Control and EHD1-
KO macrophages were deprived of CSF-1 for 16 hours followed by stimulation
with CSF-1 and both surface and total CSF-1R expression was assessed by
immunofluorescence microscopy. No apparent difference in the kinetics of CSF-
1R internalization (Figures 3.19) or degradation (Figure 3.20) was observed
between Control and EHD1-KO BMDMs. However, consistent with experiments
using Ehd1-WT and Ehd1-null BMDMs, a markedly lower surface and total CSF-
1R levels were seen in EHD1-KO BMDMs prior to CSF-1 addition (16 hours after
CSF-1 deprivation).
Reduced surface CSF-1R expression in EHD1-KO BMDMs
To further understand the decreased surface CSF-1R expression
observed in EHD1-KO BMDMs (Figure 3.19), I assessed the cell surface CSF-1R
levels using flow cytometry after 2, 4, 8 or 16 hours of CSF-1 deprivation. Initially,
low CSF-1R surface levels increased steadily over time in Control BMDMs;
however, surface CSF-1R in EHD1-KO BMDMs accumulated at a significantly

61
lower rate. Surface expression of CSF-1R was considerably less at all-time
points following CSF-1 deprivation in EHD1-KO as compared to Control BMDMs
(Figures 3.21 and 3.22). Thus, loss of EHD1 leads to reduced CSF-1R present at
the cell surface in BMDMs available for activation by CSF-1. These findings
agree with my initial findings using Ehd1-WT and Ehd1-null BMDMS.
EHD1 deletion results in depletion of CSF-1R protein in BMDMs
To investigate the mechanism responsible for reduced cell surface
expression of CSF-1R on EHD1-KO BMDMs, I first examined (by western
blotting) the accumulation of total cellular CSF-1R protein after CSF-1 was
removed from the culture medium. Ehd1fl/fl; CreERT2 BMDMs grown in regular
CSF1-containing medium without (Control) or with (EHD1-KO) TAM treatment
were deprived of CSF-1 for 2, 4, 8 or 16 hours. At the given time-points, cells
were lysed and subsequently analyzed by immunoblotting for total CSF-1R
levels. Notably, EHD1-KO BMDMs showed a significant and substantial
reduction in the total CSF-1R protein levels at each CSF-1 deprivation time point
(Figures 3.23 and 3.24). Thus, EHD1-KO BMDMs are characterized by reduced
total CSF-1R.
EHD1 functions to transport newly synthesized CSF-1R to the
cell surface
Given the reduction in surface and total CSF1R in EHD1-KO BMDMs, I
carried out qRT-PCR analysis to assess the levels of CSF-1R mRNA expression

62
(synthesis) in Control and EHD1-KO BMDMs. Ehd1fl/fl; CreERT2 BMDMs cultured
without (Control) or with (EHD1-KO) TAM were harvested under steady state
culture conditions (with CSF-1) or 16 hours after CSF-1 removal from the culture
medium. The CSF-1R mRNA levels increased nearly 50% when control BMDMs
cultured under steady-state conditions (with CSF-1) were changed to CSF1-free
medium for 16 hours. CSF-1R mRNA levels were not significantly different in
EHD1-KO compared to those of Control BMDMs (Figure 3.25). Thus, I concluded
the reduction in total CSF-1R levels in EHD1-KO BMDMs was not likely due to a
defect in CSF-1R synthesis.
To more rigorously assess if EHD1 deletion affects CSF-1R protein
synthesis and/or its post-translational maturation and transport to the cell
surface, I performed metabolic pulse labeling with [35S]-methionine/cysteine.
Under these conditions, newly synthesized and mature CSF-1R that reaches the
cell surface will bind CSF-1, undergo immediate activation, be targeted for
degradation in the lysosome, and result in a reduction in radioactive signals of
mature CSF-1R at later time points of the chase experiment. Equal amounts of
lysates collected at various time points were subjected to anti-CSF-1R
immunoprecipitation to visualize the immature and mature CSF-1R polypeptides.
The signals of immature CSF-1R synthesized during pulse-labeling (time 0) were
comparable between control and EHD1-KO BMDMs (Figure 3.26; lower band),
thus excluding any alteration in the rate of protein synthesis as a determinant of
the observed reduced total CSF-1R levels in EHD1-KO cells previously seen in
Figure 3.23.

63
Analysis at various times during chase showed that the conversion of
immature CSF-1R to a higher molecular weight, a fully glycosylated form known
to be generated in the Golgi (17) was similar to a majority of immature forms
converting to mature forms by 30 min of chase (Figure 3.26). Notably, mature
CSF-1R signals in control BMDMs were sharply lower by 60 min of chase,
reflecting its arrival at the cell surface and subsequent CSF1-induced
internalization and degradation (Figure 3.26) (26). In contrast, the mature CSF-
1R signals remained high, and nearly unaltered, at 60 min of the chase in EHD1-
KO BMDMs (Figure 3.26), indicative of a block in the surface transport of newly
synthesized and mature CSF-1R. These observations support the conclusion
that EHD1 is required at a post-Golgi glycosylation step in the surface transport
of the newly synthesized and fully glycosylated CSF-1R.
CSF-1R was found localized to this EHD1+/GM130+ compartment
Given the results of pulse-chase analyses, I sought to determine if EHD1
co-localizes with CSF-1R at the Golgi apparatus. Three-color confocal imaging
was performed on fixed and permeabilized BMDMs previously cultured without
(Control) or with (EHD1-KO) TAM for 2, 4, 8, and 16 hours after removal of CSF-
1 to allow CSF-1R synthesis and accumulation. In control BMDMs, a pool of
EHD1 co-localizes with the Golgi marker GM130, and a pool of CSF-1R was
found localize to this EHD1+/GM130+ compartment (Figure 3.27). As expected,
no EHD1 staining was detected in BMDMs rendered EHD1-KO by culture in the
presence of TAM (Figure 3.27). The EHD1-KO BMDMs also exhibited a pool of

64
CSF-1R localized to GM130+ Golgi compartment, with lower CSF-1R signals
near the cell surface (Figure 3.27).
These results, together with those of the metabolic pulse-chase, support
the conclusion that EHD1 is involved in directing the Golgi-localized (newly
synthesized) CSF-1R to the cell surface.
Newly synthesized CSF-1R transits to lysosomes for
degradation in EHD1-KO BMDMs
In view of a block in the post-Golgi transport of CSF-1R to the cell surface
in EHD1-KO BMDMs, combined with reduced total CSF-1R levels without any
alterations in its initial synthesis and glycosylation, I hypothesized that EHD1 was
required for the efficient sorting of Golgi-localized CSF-1R towards the cell
surface, and that absence of this mechanism resulted in CSF-1R transit to the
lysosome for degradation. BMDMs cultured in the absence (Control), or presence
(EHD1-KO) of TAM were switched from regular to CSF1-free medium for 4 hours
either in the absence or presence of lysosomal proton pump blocker Bafilomycin
A1 (Baf-A1). Western blot analysis demonstrated the expected lower levels of
total CSF-1R observed previously in EHD1-KO vs. control BMDMs cultured in the
absence of Baf-A1 (Figure 3.28; first and third lanes).
The inclusion of Baf-A1 led to a dramatic and statistically significant
increase in CSF-1R levels in EHD1-KO BMDMs compared to the no Baf-A1
control, and nearly approaching the levels in Control BMDMs (Figure 3.28).
These results suggest that CSF-1R rapidly transits from the Golgi to the

65
lysosome in EHD1-KO BMDMs and undergoes degradation.
To further demonstrate this proposed mechanism, I carried out confocal
imaging of Control and EHD1-KO BMDMs cultured for 4 hours in Baf-A1.
BMDMs from both groups were stained for CSF-1R and LAMP1 (a lysosomal
marker). In contrast to a small pool of CSF-1R that localized in LAMP1+
lysosomes in control BMDMs, a significantly higher level of co-localization
between CSF-1R and LAMP1 was seen in EHD1-KO BMDMs (Figure 3.29).
Overall, these results support the conclusion that EHD1 helps in the
transport of CSF-1R from a Golgi sorting compartment to the cell surface.
Furthermore, CSF-1R is shunted to the lysosome in EHD1-KO BMDM, resulting
in lysosomal degradation of the receptor.

66
CHAPTER 3: FIGURES

67
Figure 3.1. BMDMs defined by F4/80+ flow cytometry staining.

68
Figure 3.1. BMDMs defined by F4/80+ flow cytometry staining. BMDMs were
stained on day 6 of bone marrow culture from Ehd1-WT and Ehd1-null mice for
mature macrophage marker F4/80.

69
Figure 3.2. EHD family expression in Ehd1-WT and Ehd1-null BMDMs.

70
Figure 3.2. EHD family expression in Ehd1-WT and Ehd1-null BMDMs. (A)
Quantitative real-time-PCR analysis of EHD family proteins in BMDMs. Data was
normalized to GAPDH and was expressed as a fold change with EHD1
expression in Ehd1-WT BMDMs set to 1. (B) Lysate from Ehd1-WT and Ehd1-
null BMDMs. Immunoblotting was for EHD1, EHD4, and HSC70. Note specific
deletion of EHD1 protein in BMDMs matured from Ehd1-null mice, but not from
Ehd1-WT mice. Representative data from 3 separate biological replicates are
shown (mean ± SEM; * = p < 0.05, n.s. = not significant).

71
Figure 3.3. 3H-thymidine proliferation assay using BMDMs.

72
Figure 3.3. 3H-thymidine proliferation assay using BMDMs. BMDM
proliferation as measured by 3H-thymidine incorporation. Ehd1-WT and Ehd1-null
BMDMs were stimulated with CSF-1 at 0, 15, 30 or 60 ng/mL for 3 days.
Representative data from 3 separate biological replicates are shown (mean ±
SEM; * = p < 0.05, n.s. = not significant).
.

73
Figure 3.4. CFSE assays using Ehd1-WT and Ehd1-null BMDMs.

74
Figure 3.4. CFSE assays using Ehd1-WT and Ehd1-null BMDMs. (A) BMDM
proliferation as measured by CFSE dye dilution assay. Ehd1-WT and Ehd1-null
BMDMs were stained with CFSE dye (day 0) and subsequently stimulated with
30 ng/mL recombinant CSF-1 for 3, 5, or 7 days. (B) Quantification of Mean
Fluorescence Intensity (MFI) CFSE dye dilution assay from Figure 3.4B. MFI fold
change was normalized relative to Control BMDMs. Representative data from 3
separate biological replicates are shown (mean ± SEM; * = p < 0.05).

75
Figure 3.5. CFSE population differences in Ehd1-WT and Ehd1-null BMDMs.

76
Figure 3.5. CFSE population differences in Ehd1-WT and Ehd1-null BMDMs.
BMDM proliferation as measured by CFSE dye dilution assay. Ehd1-WT and
Ehd1-null BMDMs were stained with CFSE dye (day 0) and subsequently
stimulated with 30 ng/mL recombinant CSF-1 for 3 days. Then population
modeling of cell population divisions was carried out using software available
through the Flow Cytometry Core Facility. The percentages in the red boxes
indicate the percentage of the population in the highest generation.
Representative data from 3 separate biological replicates are shown.

77
Figure 3.6. Ehd1-null BMDMs have reduced CSF1-induced cellular spreading.

78
Figure 3.6. Ehd1-null BMDMs have reduced CSF1-induced cellular
spreading. Cells were starved of CSF-1 overnight and then stimulated with 100
ng/mL CSF-1 for 10 minutes. Fixation and staining was performed with phalloidin
(actin stain). Representative data from 3 separate biological replicates are
shown.

79
Figure 3.7. CSF-1 stimulation induces CSF-1R signaling.

80
Figure 3.7. CSF-1 stimulation induces CSF-1R signaling. Reduced CSF1-
induced pERK levels in Ehd1null BMDMs. Ehd1-WT and Ehd1-null BMDMs were
CSF1-deprived for 16 hours and subsequently stimulated for 10 minutes with 100
ng/mL CSF-1 for 3, 10, 30,90, and 270 minutes. 40 µg aliquots of sample protein
lysate were immunoblotted with the indicated antibodies. Representative data
from 3 separate biological replicates are shown.

81
Figure 3.8. Ehd1-null BMDMs have decreased surface CSF-1R expression upon CSF-1 deprivation.
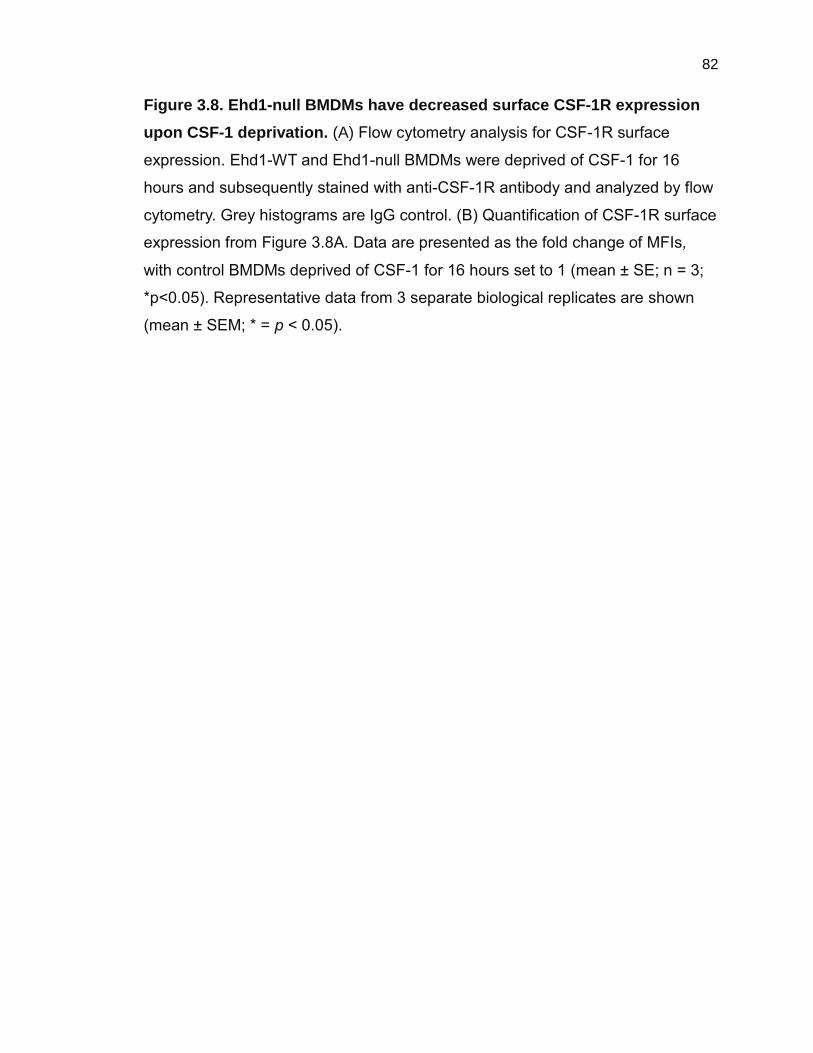
82
Figure 3.8. Ehd1-null BMDMs have decreased surface CSF-1R expression
upon CSF-1 deprivation. (A) Flow cytometry analysis for CSF-1R surface
expression. Ehd1-WT and Ehd1-null BMDMs were deprived of CSF-1 for 16
hours and subsequently stained with anti-CSF-1R antibody and analyzed by flow
cytometry. Grey histograms are IgG control. (B) Quantification of CSF-1R surface
expression from Figure 3.8A. Data are presented as the fold change of MFIs,
with control BMDMs deprived of CSF-1 for 16 hours set to 1 (mean ± SE; n = 3;
*p<0.05). Representative data from 3 separate biological replicates are shown
(mean ± SEM; * = p < 0.05).
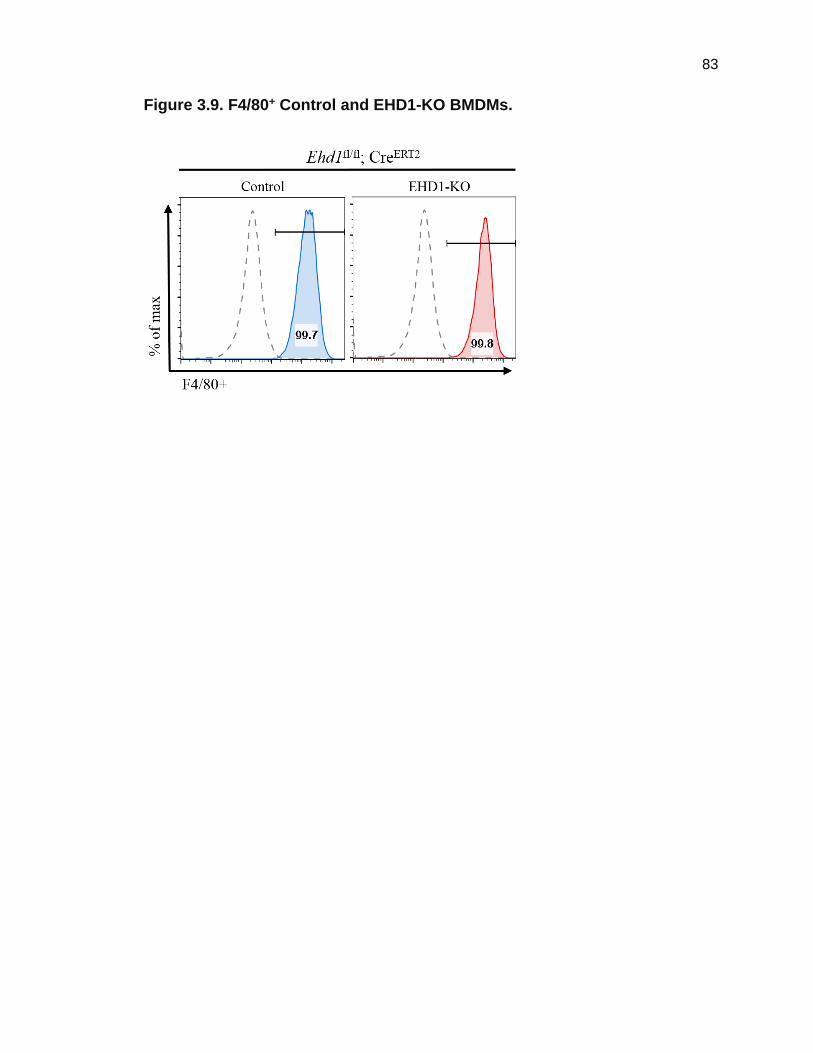
83
Figure 3.9. F4/80+ Control and EHD1-KO BMDMs.

84
Figure 3.9. F4/80+ Control and EHD1-KO BMDMs. BMDMs were stained on
day 10 of bone marrow culture from Ehd1fl/fl
CreERT2 mice for mature macrophage
marker F4/80 and analyzed by flow cytometry.

85
Figure 3.10. EHD family expression in control and inducible EHD1-KO BMDMs.

86
Figure 3.10. EHD family expression in control and inducible EHD1-KO
BMDMs. Quantitative real-time-PCR analysis of EHD family proteins in BMDMs.
Data was normalized to GAPDH and was expressed as a fold change with EHD1
expression in Ehd1fl/fl
CreERT2 BMDMs –TAM set to 1 (n = 3). (C) Lysate from
Ehd1fl/fl
and Ehd1fl/fl
CreERT2 BMDMs cultured for 4 days -/+TAM. Note specific
deletion of EHD1 protein in BMDMs matured from Ehd1fl/fl
CreERT2 mice, but not
from Ehd1fl/fl
mice. Representative data from 3 separate biological replicates are
shown (mean ± SEM; * = p < 0.05, n.s. = not significant).

87
Figure 3.11. Lack of CSF-1 response alteration due to TAM treatment.

88
Figure 3.11. Lack of CSF-1 response alteration due to TAM treatment. (A)
BMDMs from Ehd1fl/f
mice -/+TAM were labeled with CFSE and allowed to
proliferate for 4 days in the presence of 30 ng/mL CSF-1 (B) Quantification of
CFSE dye dilution assay from Figure 3.11A; CFSE MFI normalized to Ehd1fl/fl
BMDMs +TAM. Representative data from 3 separate biological replicates are
shown (mean ± SEM; n.s. = not significant).
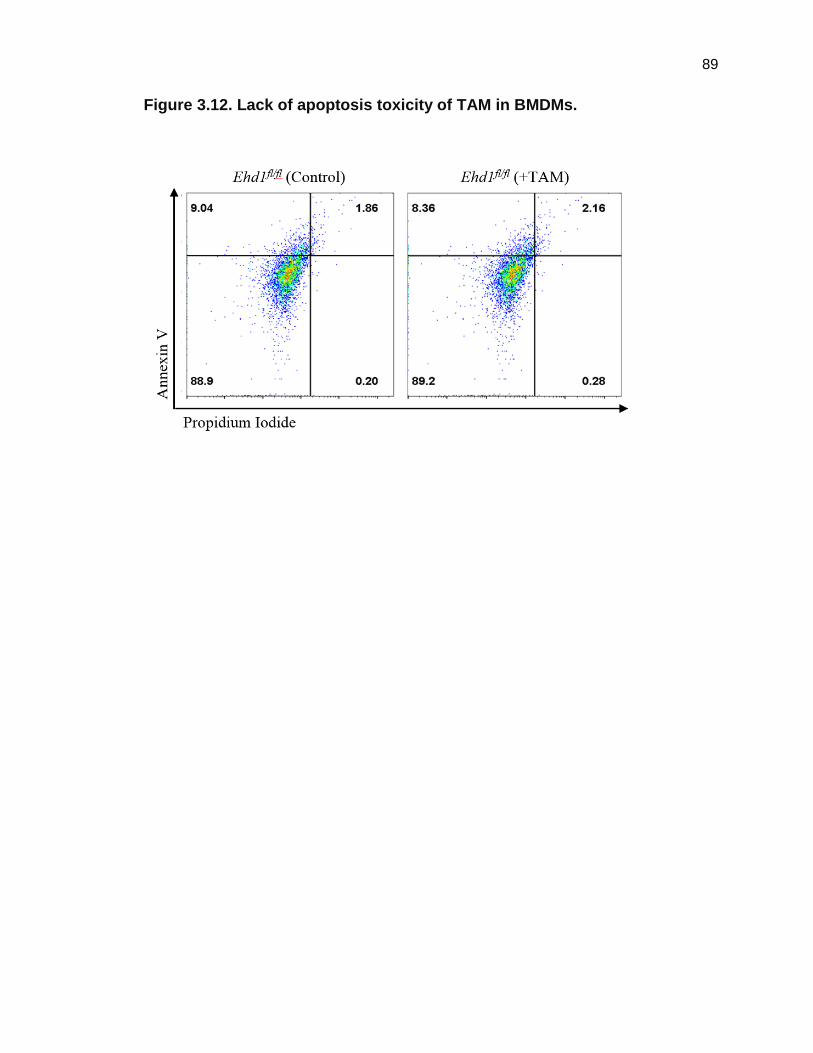
89
Figure 3.12. Lack of apoptosis toxicity of TAM in BMDMs.

90
Figure 3.12. Lack of apoptosis toxicity of TAM in BMDMs. Ehd1fl/fl
BMDMs
cultured with or without TAM were stained with anti-Annexin V and propidium
iodide followed by flow cytometry analysis to assess the proportion of apoptotic
cells. Representative data from 3 separate biological replicates are shown.

91
Figure 3.13. EHD1 deletion results in reduced proliferation.

92
Figure 3.13. EHD1 deletion results in reduced proliferation. (A) BMDM
proliferation via 3H-thymidine incorporation. Ehd1fl/fl; CreERT2 BMDMs cultured
without (Control) or with (EHD1-KO) TAM were stimulated with CSF-1 at 0, 15,
30 or 60 ng/mL for 2, 4 or 6 days. Representative data from 3 separate biological
replicates are shown (mean ± SD; *p<0.05, n.s. = not significant).

93
Figure 3.14. EHD1-KO BMDMs have reduced CSF1-induced proliferation.

94
Figure 3.14. EHD1-KO BMDMs have reduced CSF1-induced proliferation.
(A) BMDMs proliferation with CFSE (dye dilution assay). Ehd1fl/fl; CreERT2
BMDMs were previously cultured without (Control) or with (EHD1-KO) TAM were
stained with CFSE dye (day 0) and then stimulated with 30 ng/mL recombinant
CSF-1 for 2, 4, or 6 days. (B) Quantification of Mean Fluorescence Intensity
(MFI) CFSE from Figure 3.15B. MFI fold change was normalized relative to
control BMDM population. Representative data from 3 separate biological
replicates are shown (mean ± SEM; * = p < 0.05).
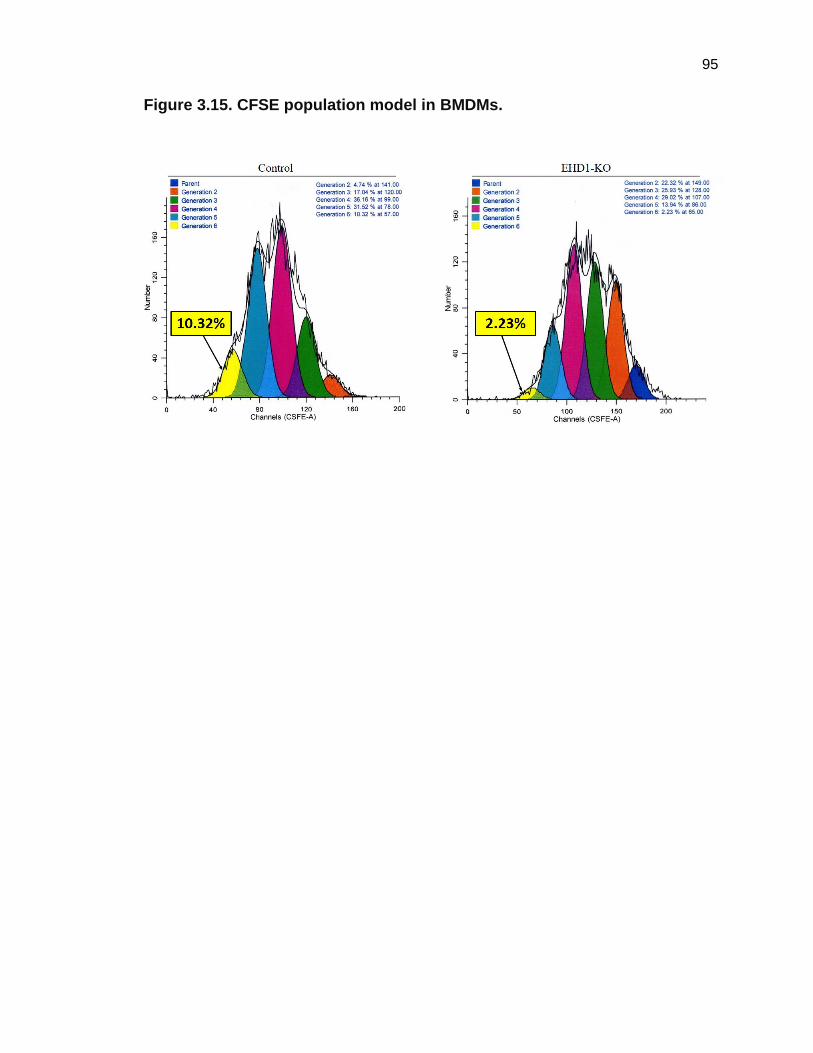
95
Figure 3.15. CFSE population model in BMDMs.

96
Figure 3.15. CFSE population model in BMDMs. BMDMs proliferation was
monitored with the CFSE dye dilution assay. Ehd1fl/fl; CreERT2 Control or EHD1-
KO BMDMs were stained with CFSE dye (day 0) and then stimulated with 30
ng/mL recombinant CSF-1 for 5 days. Software available at the UNMC Flow
Cytometry facility was used to model the populations according to the number of
divisions each BMBM populations had undergone. Representative data from 3
separate biological replicates are shown.

97
Figure 3.16. EHD1 deletion results in reduced spreading.

98
Figure 3.16. EHD1 deletion results in reduced spreading. (A) Microscopy
analysis of CSF1-induced macrophage cell spreading. Ehd1fl/fl; CreERT2 BMDMs
were cultured without (Control) or with (EHD1-KO) TAM, CSF-1 deprived for 16
hours, and subsequently stimulated with 100 ng/mL CSF-1 for 10 minutes. Cells
were then fixed, permeabilized, and stained for polymerized actin using
conjugated phalloidin—488 followed by confocal microscopy. (B) Quantification
of cellular spreading (Figure 3.16A) via calculating cell surface area
(corresponding to phalloidin staining) using ImageJ software. 100 cells were
counted for 3 independent experiments. Cell surface area was normalized to
control BMDM population. Representative data from 3 separate biological
replicates are shown (mean ± SEM; *p<0.05).

99
Figure 3.17. EHD1-KO BMDMs have reduced migration.

100
3.17. EHD1-KO BMDMs have reduced migration. (A) Transwell migration
assay. Ehd1fl/fl; CreERT2 BMDMs cultured without (Control) or with (EHD1-KO)
TAM were deprived of CSF-1 for 4 hours and allowed to migrate towards CSF-1
(30 ng/mL) in the lower chamber of Boyden Transwell chambers. Filters were
HEMA stained and photographed at 20x. (B) Quantification of migration assays
from Figure 3.17A. Total cells migrated were normalized to control BMDM
population. Representative data from 3 separate biological replicates are shown
(mean ± SEM; *p<0.05).

101
Figure 3.18. EHD1-KO BMDMs have decreased pERK downstream CSF-1R signaling.

102
3.18. EHD1-KO BMDMs have decreased pERK downstream CSF-1R
signaling. (a) Reduced CSF1-induced pERK levels in EHD1-KO BMDMs.
Ehd1fl/fl; CreERT2 BMDMs were deprived of CSF-1 for 16 hours and then
stimulated with 100ng/mL CSF-1 for 10 minutes. 40 µg aliquots of sample protein
lysate were immunoblotted with the indicated antibodies. (b) The quantification of
Figure 3.18A is shown. The relative levels of pERK signals were normalized to
HSC70 and expressed as a fold change by setting the control BMDM population
stimulated with CSF-1 for 10 minutes at 1. Representative data from 3 separate
biological replicates are shown (mean ± SEM; *p<0.05).

103
Figure 3.19. EHD1 deletion has no significant effect on activated CSF-1R internalization.

104
Figure 3.19. EHD1 deletion has no significant effect on activated CSF-1R
internalization. (A) No impact of EHD1 deletion on ligand-induced
downregulation of surface CSF-1R. Ehd1fl/fl; CreERT2 BMDMs cultured without
(Control) or with (EHD1-KO) TAM were deprived of CSF-1 for 16 hours and
stimulated with 100 ng/mL CSF-1 for 0, 2.5, 5 or 10 minutes were fixed and
stained for surface CSF-1R followed by immunofluorescence microscopy
analysis. (B) Quantification of the data in Figure 3.19A is displayed.
Representative data from 3 separate biological replicates are shown (mean ±
SD; *p<0.05, n.s. = not significant).

105
Figure 3.20. EHD1 deletion has no significant effect on activated CSF-1R degradation.

106
Figure 3.20. EHD1 deletion has no significant effect on activated CSF-1R
degradation. BMDMs were prepared as in 3.28A and stimulated with CSF-1 for
0, 2.5, 5, 10 or 30 minutes. Cells were fixed, permeabilized, and stained for total
CSF-1R and imaged using immunofluorescence microscopy. (B) Quantification
of the data in Figure 3.20A is displayed. Representative data from 3 separate
biological replicates are shown (mean ± SEM; *p<0.05, n.s. = not significant).

107
Figure 3.21. EHD1-KO BMDMs have reduced surface CSF-1R expression.

108
3.21 EHD1-KO BMDMs have reduced surface CSF-1R expression. (A) Live-
cell flow cytometry analysis. Ehd1fl/fl; CreERT2 BMDMs were cultured without
(Control) or with (EHD1-KO) TAM were switched from CSF1-containing to CSF1-
free medium for 2, 4, 8, or 16 hours and live cells were stained with anti-CSF-1R
antibody followed by flow cytometry analysis. Grey histograms are IgG control.
(B) Quantification of CSF-1R surface expression from Figure 3.21A is shown.
Data are presented as the fold change of MFIs, with control BMDMs deprived of
CSF-1 for 16 hours set to 1. Representative data from 3 separate biological
replicates are shown (mean ± SD; *p<0.05).
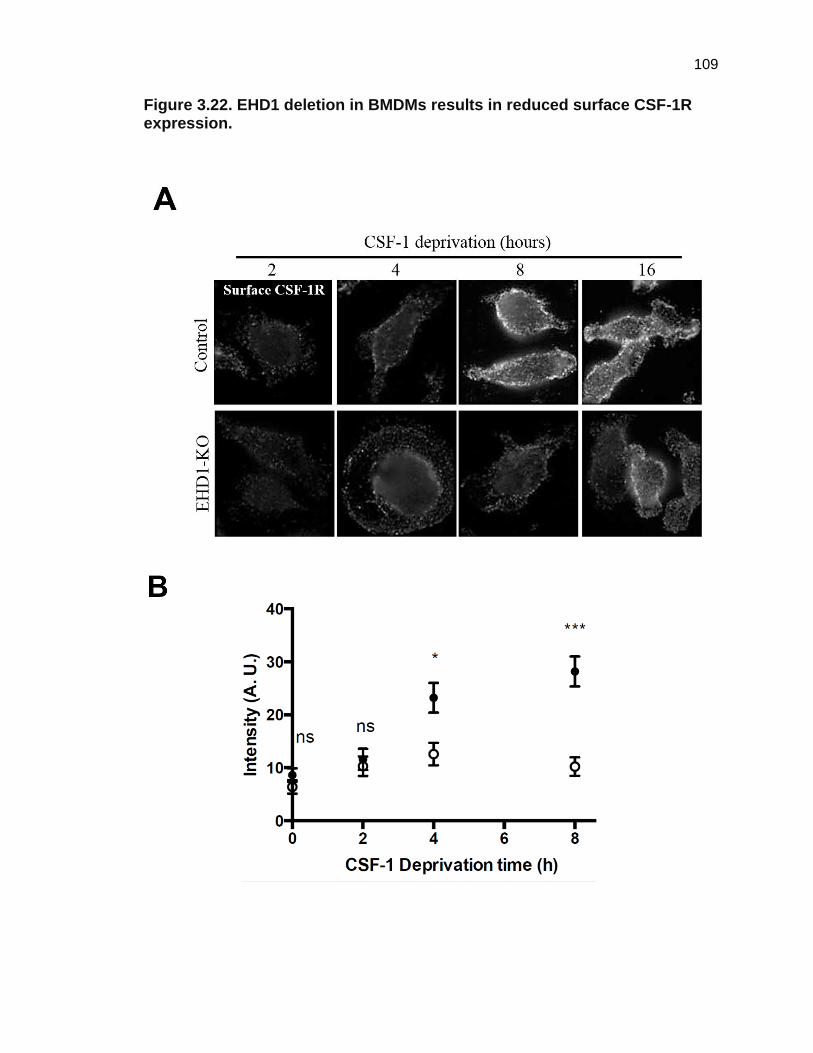
109
Figure 3.22. EHD1 deletion in BMDMs results in reduced surface CSF-1R expression.
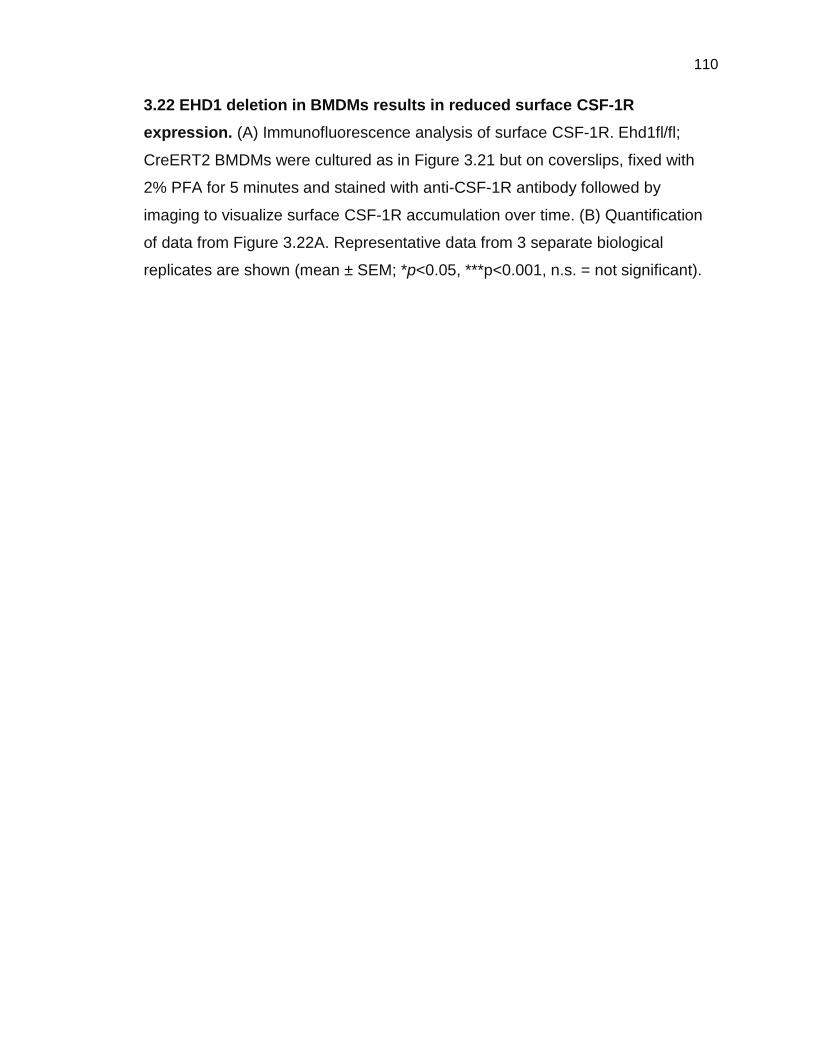
110
3.22 EHD1 deletion in BMDMs results in reduced surface CSF-1R
expression. (A) Immunofluorescence analysis of surface CSF-1R. Ehd1fl/fl;
CreERT2 BMDMs were cultured as in Figure 3.21 but on coverslips, fixed with
2% PFA for 5 minutes and stained with anti-CSF-1R antibody followed by
imaging to visualize surface CSF-1R accumulation over time. (B) Quantification
of data from Figure 3.22A. Representative data from 3 separate biological
replicates are shown (mean ± SEM; *p<0.05, ***p<0.001, n.s. = not significant).

111
Figure 3.23. EHD1 deletion in BMDMs leads to a reduction in total CSF-1R, demonstrated by immunoblotting.

112
3.23 EHD1 deletion in BMDMs leads to a decrease in total CSF-1,
demonstrated using immunoblotting. (A) Ehd1fl/fl; CreERT2 BMDMs cultured
without (Control) or with (EHD1-KO) TAM were switched from CSF1-containing
to CSF1-free medium for 2, 4, 8 or 16 hours, and 40 µg aliquots of lysate protein
were analyzed by immunoblotting with anti-CSF-1R (upper), anti-EHD1 (to show
EHD1 deletion) and anti-HSC70 (loading control). (B) Quantification of CSF-1R
signals from data in Figure 3.23A. The CSF-1R band pixels were quantified from
scanned blots using ImageJ software, normalized based on HSC70 and
expressed as a fold change by setting total CSF-1R from control BMDMs
deprived of CSF-1 for 16 hours to 1. Representative data from 3 separate
biological replicates are shown (mean ± SEM; *p<0.05, n.s. = not significant).

113
Figure 3.24. EHD1-KO BMDMs have reduced total CSF-1R using IF.

114
Figure 3.24. EHD1-KO BMDMs have reduced total CSF-1R using IF. (A)
Analysis of total CSF-1R using immunofluorescence microscopy. BMDMs
cultured as in A but on coverslips were fixed, permeabilized, and stained for with
anti-CSF-1R antibody to visualize total CSF-1R. (B) Quantification of data from
Figure 3.24A. Representative data from 3 separate biological replicates are
shown (mean ± SD; *p<0.05, **p<0.01, n.s. = not significant).

115
Figure 3.25. EHD1 deletion does not affect CSF-1R synthesis.

116
Figure 3.25. EHD1 deletion does not affect CSF-1R synthesis. EHD1 deletion
does not affect CSF-1R mRNA expression. RNA was isolated from Ehd1fl/fl;
CreERT2 BMDMs cultured without (Control) or with (EHD1-KO) TAM were grown
under steady state conditions (with CSF-1) and without CSF-1 for 16 hours,
harvested, and quantitative qRT-PCR was performed. Data were normalized to
GAPDH and expressed as a fold change relative to CSF-1R mRNA expression of
control BMDMs at steady state. Representative data from 3 separate biological
replicates are shown (mean ± SEM; n.s. = not significant).
.

117
Figure 3.26. EHD1-KO deletion reduces transport of newly synthesized CSF-1R to the cell surface.

118
Figure 3.26. EHD1-KO reduces transport of newly synthesized CSF-1R to
the cell surface. Metabolic pulse-labelling to show unaltered translation and
maturation with a block of surface transport of newly synthesized CSF-1R in
EHD1-KO BMDMs. Ehd1fl/fl; CreERT2 BMDMs cultured without (Control) or with
(EHD1-KO) TAM were metabolically pulse-labeled with [35S] for 15 min and
subjected to chase in unlabeled methionine/cysteine-enriched medium in the
presence of CSF-1 for the indicated times followed by cell lysis. 40 µg aliquots of
sample lysates were subjected to anti-CSF-1R immunoprecipitation followed by
autoradiography. Lower band: immature/non-glycosylated CSF-1R; upper band:
mature/fully glycosylated CSF-1R. Note comparable lower band signals at time 0
and similar rates of conversion to the upper band; however, the mature upper
band signals are lost in control BMDMs but remain intact in EHD1-KO BMDMs.
Representative data from 3 separate biological replicates are shown.

119
Figure 3.27. CSF-1R co-localizes to a EHD1+/GM130+ compartment.

120
Figure 3.27 CSF-1R co-localizes to a EHD1+/GM130+ compartment.
Confocal immunofluorescence. Co-localization of EHD1 with CSF-1R at the Golgi
apparatus. Ehd1fl/fl; CreERT2 BMDMs cultured without (Control) or with (EHD1-KO)
TAM were switched from CSF1-containing medium to CSF1-free medium for 2,
4, 8 or 16 hours and subsequently fixed, permeabilized and stained for CSF-1R
(green), EHD1 (Red) and GM130-Golgi marker (Blue) and analyzed by confocal
microscopy. Representative data from 3 separate biological replicates are
shown.

121
Figure 3.28. EHD1-KO BMDMs have increased CSF-1R lysosomal degradation.

122
Figure 3.28. EHD1-KO BMDMs have increased CSF-1R lysosomal
degradation. (A) Western blot analysis to show recovery of total CSF-1R levels
in EHD1-KO BMDMs upon inhibition of lysosomal degradation. Ehd1fl/fl; CreERT2
BMDMs cultured without (Control) or with (EHD1-KO) TAM were switched from
CSF1-containing medium to CSF1-free medium for 4 hours in the absence (-Baf-
A1) or presence (+Baf-A1) of lysosomal inhibitor: Baf-A1, 100 nM. 40 µg aliquots
of sample protein lysates were immunoblotted for total CSF-1R (Top), HSC70
(central; loading control) and EHD1 (bottom; to show EHD1 deletion). (B)
Quantification of total CSF-1R signals from Figure 3.29A. Data were normalized
to HSC70 signals and expressed as a fold change relative to values for the
control BMDM population without Baf-A1 treatment. Representative data from 3
separate biological replicates are shown (mean ± SEM; *p<0.05, n.s. = not
significant).

123
Figure 3.29. EHD1-KO BMDMs shunt CSF-1R to the lysosome.

124
Figure 3.29. EHD1-KO BMDMs shunt CSF-1R to the lysosome. (A)
Representative confocal immunofluorescence image showing co-localization of
CSF-1R in LAMP1+ lysosomes of EHD1-KO BMDMs upon lysosome inhibition
via Baf-A1. Ehd1fl/fl; CreERT2 BMDMs cultured without (Control) or with (EHD1-
KO) TAM were switched from CSF1-containing to CSF1-free medium for 4 hours
in the presence of 100 nM Baf-A1. Cells were fixed, permeabilized, and stained
for analysis utilizing immunofluorescence: CSF-1R (red) and LAMP1 (green);
merged pictures on right show co-localization (yellow). (B) Quantification of CSF-
1R and LAMP1 co-localization from Figure 3.29A. Co-localization of CSF-1R and
LAMP1 fluorescence signals was assessed in 50 cells each in 3 independent
experiments to determine the co-localization coefficient ± SEM (n = 150).
Representative data from 3 separate biological replicates are shown (mean ±
SEM; *p<0.05).

125
CHAPTER 4: DISCUSSION & CONCLUSION
The material covered in the following chapter is the topic of the following published article:
Luke R. Cypher, Timothy Alan Bielecki, Oluwadamilola Adepegba, Lu Huang, An Wei, Fany Iseka, Haitao Luan, Eric Tom, Matthew D. Storck, Adam D. Hoppe, Vimla Band, Hamid Band. CSF-1 receptor signalling is governed by pre-requisite EHD1 mediated receptor display on the macrophage cell surface.
(Accepted for Publication: Cellular Signalling, Available online 17 May 2016)

126
Discussion
The CSF-1R is essential for the development and diverse functions of the
monocyte-macrophage lineage, which includes specialized tissue-specific cells
such as microglia in the central nervous system (CNS) (67). Abnormal CSF1R-
dependent macrophage functions resulting from aberrant CSF-1R dependent
signaling contribute to a variety of human diseases (7, 15, 68, 69). A pre-
requisite for all CSF1R-mediated macrophage functions is the delivery and
display of the receptor at the cell surface. This requirement of macrophage cell
surface presentation of CSF-1R is due to the initial activation step of ligand
(CSF-1) stabilization of the dimerized form of the receptor tyrosine kinase (17).
Without this key initial step, CSF-1R signaling cannot occur and macrophage
biology will be compromised. Mechanisms that govern the post-synthesis
maturation and traffic of CSF-1R to the macrophage cell surface are therefore
biologically pivotal. Furthermore, understanding these mechanisms will likely lead
to the development of effective therapies and treatments of devastating human
conditions aimed at targeting the inhibition of CSF-1R signaling.
In this dissertation, I have used primary bone marrow-derived
macrophages (BMDMs) from constitutive and inducible knockout mouse models
to provide evidence that EHD1, a member of the EHD protein family of endocytic
recycling regulators, serves a novel and critical role in ensuring Golgi-to-cell
surface traffic of CSF-1R. I show that this novel gate-keeper function of EHD1
helps direct the post-synthesis traffic itinerary of CSF-1R away from an alternate
fate of delivery to lysosomes where it is degraded. My experiments demonstrate

127
that EHD1-dependent cell surface transport of CSF-1R ensures subsequent
ligand-induced CSF-1R signaling and macrophage functional activation. EHD1, a
member of the EHD family of endocytic recycling regulators, has only previously
been shown to function in receptor recycling and retrograde traffic from the early
endosome to the Golgi. I report in this dissertation a new critical function for
EHD1 in the presentation of CSF-1R upon the macrophage cell surface. This
novel gate-keeper function of EHD1 helps direct the post-synthesis traffic
itinerary of CSF-1R away from an alternate fate of delivery to lysosomes where it
is degraded. My data demonstrate that EHD1 functions in the cell surface
transport of CSF-1R—ensuring subsequent ligand-induced cellular activation.
Furthermore, a novel function for EHD1 as a positive regulator of basal post-
synthetic CSF-1R traffic to the cell surface has been revealed. Previously known
only to function in recycling of internalized receptors back to the cell surface (41–
47) these findings define a new role for a member of the entire EHD protein
family,.
To investigate the role of EHD1 in the context of CSF-1R signaling in
macrophages, I chose the physiologically relevant model (due to CSF-1R
dependence in vitro) of primary bone-marrow derived macrophages (BMDMs)
from constitutive Ehd1-null mice as well as a novel inducible EHD1 deletion
mouse model only available in our laboratory. We engineered constitutive and
inducible EHD1-deletion mouse models. The inducible deletion has been
engineered such that the incorporation of a tamoxifen-inducible CreERT2 allele
allows inducible deletion of Ehd1fl/fl under controlled conditions of TAM treatment.

128
Using the BMDMs from our laboratories’ constitutive EHD1 deletion
mouse model, the initial analysis showed that BMDMs only express EHD1 and
EHD4 and not significant levels of EHD2 or EHD3. Furthermore, BMDMs derived
from constitutive Ehd1-null as compared to EHD1-WT mice were found to have a
significant impairment of CSF-1R surface expression, CSF-1 induced CSF-1R
signaling, and subsequent downstream CSF1-mediated macrophage functional
effects.
Due to the noticeable decrease in total levels of CSF-1R apparent on
initial Western blots (Figure 3.7) after starvation of CSF-1 in EHD1-null BMDMs, I
suspected the decreases in macrophage signaling and function might simply be
due to less CSF-1R available to bind CSF-1 on the macrophage cell surface. All
receptor tyrosine kinases (RTK) signaling begins with proper delivery and display
of the receptor at the cell surface. If an RTK is not oriented properly at the cell
surface, the receptor cannot bind ligand, be activated, signal, and produce
downstream effects (20).
A potential effect on macrophage development in constituative Ehd1-null
mice due to defective cytokine signals and niche elements cannot be ruled out.
Due to initial results using EHD1-null BMDMs from constitutively EHD1-deleted
mice, I utilized EHD1-KO BMDMs to assure the effects observed were not due to
abnormalities in bone marrow development. I conducted a series of experiments
with inducible EHD1-KO compared to Control BMDMs to assess macrophage
surface and total CSF-1R protein levels under conditions of CSF-1 removal from
the culture media (CSF-1 deprivation). Analysis of surface and total levels of

129
CSF-1R protein under conditions of CSF-1 deprivation was performed using a
combination of flow cytometry (Figures 3.8 and 3.21), Western blotting (Figure
3.23), metabolic pulse-chase (Figure 3.26), and immunofluorescence imaging of
non-permeabilized (Figure 3.22) or permeabilized BMDMs (Figures 3.24 and
3.27). This combination of experiments demonstrated an overall reduction in
CSF-1R levels when EHD1 was deleted and a clear impairment in the ability of
newly synthesized CSF-1R to be transported to the cell surface.
There are two possible mechanisms behind the change in macrophage
biology I had observed (decreased total CSF-1R). When a cell has less total
protein, either less of the protein is being made by the cell or the cell is degrading
the protein at a higher rate. I excluded the possibility that the EHD1-KO BMDMs
were making less of CSF-1R by conducting qRT-PCR and metabolic pulse-chase
labeling of newly synthesized CSF-1R with [35S] (Figures 3.25 and 3.26).
Previous studies have also shown that reduced surface expression of
CSF-1R can result from defective glycosylation. Reduced surface CSF-1R
expression resulting from defects in glycosylation of the receptor is seen upon
expression of the HIV protein NEF, which inhibits glycosylation through
incompletely understood mechanisms involving NEF activation of the SRC-family
tyrosine kinase HCK as well as through HCK-independent mechanisms (70, 71).
Naturally occurring loss-of-function mutations of CSF-1R have been identified in
patients with hereditary diffuse leukoencephalopathy with spheroids (HDLS), and
most of these mutations result in reduced CSF-1R protein expression (12). In
both of the cases above, CSF-1R glycosylation in the Golgi is defective. In
130
contrast, metabolic pulse-chase studies showed that immature CSF-1R was fully
converted into a mature form (fully glycosylated; higher molecular weight) in
EHD1-KO BMDMs with essentially the same kinetics as in control cells (Figure
3.26). CSF-1R mRNA expression is under the regulation of several transcription
factors (19). However, transcriptional expression was unchanged. Similarly, a
potential block in CSF-1R translational and subsequent maturation of the
receptor (glycosylation) was excluded via metabolic pulse-chase analysis (Figure
3.26). Thus, decreased CSF-1R production was ruled out as a potential
mechanism for decreased CSF-1R signaling and macrophage function when
EHD1 is absent from the cell.
These findings clearly pointed to the possibility that post-synthetic
transport of CSF-1R after its Golgi processing was defective in EHD1-KO
BMDMs. Consistent with this idea, I observed that CSF-1R co-localizes with a
cohort of CSF-1 in the Golgi compartment stained for GM130 (Golgi marker)
(Figure 3.27). Our metabolic pulse-chase studies carried out in the presence of
CSF-1 exposed the newly synthesized CSF-1R to its ligand, which promotes its
rapid degradation (71). While this was clearly seen in control BMDMs, the mature
band of CSF-1R remained intact for the duration of the experiment (Figure 3.26),
supporting the conclusion that this cohort of CSF-1R did not reach the cell
surface, consistent with our flow cytometry (Figure 3.8 and 3.21) and confocal
imaging (Figure 3.22) analyses. When combined with the reduction in total CSF-
1R levels in EHD1-KO BMDMs, these results led to the idea that lack of EHD1
allows CSF-1R traffic from the Golgi to a compartment where it is degraded.

131
Since other RTKs are degraded in lysosomes (20, 25) and a variety of
receptors are known to traffic from the Golgi to the lysosome directly (72, 73), I
considered the possibility that CSF-1R is alternatively sorted into the lysosome in
EHD1-KO BMDMs where it is degraded. Our Western blotting analyses
demonstrating that CSF-1R protein accumulates in EHD1-KO BMDMs when in
the presence of Baf-A1 (Figure 3.28), together with confocal imaging of Baf-A1
treated BMDMs (Figure 3.29), support this mechanism. It is of obvious interest to
assess if the EHD1-dependent CSF-1R traffic pathway I describe is also
important for other RTKs or represents a more restricted adaptation for CSF-1R.
How the balance of these pathway operates and whether it is tunable during
development, differentiation or functional responses of macrophage-lineage or
other cells will be of considerable interest, especially in the context of human
diseases in which inhibition of CSF-1R signaling would likely be desired (7, 13,
16, 74).
Although a novel role for EHD1 has been revealed in vitro, it will
undoubtably be necessary further to investigate the physiological requirement of
EHD1 for CSF1R-dependent generation of macrophage lineage cells in vivo. The
question of whether or not EHD1 is essential to generate CSF1R signaling in vivo
to help maintain monocyte-macrophage lineage under homeostasis and to help
switch to monocyte-skewed hematopoiesis during immunological stress will need
to be answered. In vivo analyses of tissue macrophages using an HSC-intrinsic
inducible EHD1 deletion (chimeric mice utilizing Ehd1fl/fl; CreERT2 bone marrow)
mouse model would be one way to answer these lingering questions directly. The

132
impact of EHD1 deletion in vivo on CSF-1R signaling needs to be verified to
determine if the findings presented in this dissertation point to a physiologically
relevant pathway of biological macrophage regulation. Using a chimeric
approach with utilizing Ehd1fl/fl; CreERT2 bone marrow would allow selective EHD1
deletion in hematopoietic lineages alone using a chimeric approach (Sieweke &
Allen, 2013). Using tamoxifen treatment of live mice, the analysis could be done
of peripheral blood (blood cell analyzer and blood smears) and spleens (FACS
and immunohistochemistry) to changes in the development and function of the
monocyte-macrophage lineage.
A CSF-1R specific inducible system could also be of great value when
assessing the role of EHD1 in CSF-1R signaling in vivo. Tamoxifen-inducible
deletion via a CSF-1R specific deletion is currently available through Jackson
Laboratories. However, the background of the CSF-1R inducible Cre mouse is
FVB. Since Ehd1fl/fl mice are predominantly C57BL/6 background (Bhattacharyya
et al., 2016; Rainey et al., 2010), the appropriate backcrosses would take an
inconvenient amount of time. In contrast, the bone marrow chimeric model
proposed previously could be carried out with existing mouse models.
Targeting of CSF-1R signaling as a treatment of disease has made its way
into clinical trials and has thus far been conducted regarding either inhibiting the
receptor after activation or blocking receptor activation by using via an antibody
that binds CSF-1R and inhibits CSF-1 binding (68). The decreased surface
expression resulting from EHD1 deletion suggested a new target enabling the
result of blocking CSF-1R signaling. Further studies will be conducted in order to

133
elucidate the mechanism of EHD1 further in the transport of CSF-1R to the
macrophage cell surface due to the number of cells in the human body which
express EHD1. Due to potential off-target effects, EHD1 alone is not a viable
target of CSF-1R signaling inhibition. However, the possibility of blocking CSF-
1R transport to the macrophage cell surface is an attractive possible target. This
project encourages the pursuit of further studies aimed at understanding of the
mechanisms governing receptor tyrosine kinase presentation.
Conclusion
In conclusion, my findings show that exit of fully glycosylated, mature,
CSF-1R from the Golgi is a regulated process under the control of two competing
sorting procedures: a dominant EHD1-dependent pathway to facilitate its traffic to
the cell surface and an alternate pathway to lysosomes for degradation. My
findings support the conclusion that EHD1-dependent CSF1R transport, from the
Golgi to the cell surface, are of key significance in determining the ultimate level
of CSF-1R signaling (Figures 3.7 and 3.18) and downstream biological
responses (Figures 3.3-3.6; 3.13-3.17). Collectively, the data from this study
reveals a novel function for EHD1 in the exit of unstimulated CSF-1R from the
Golgi apparatus to the macrophage cell surface for physiological activation of the
receptor (Figure 4.1).
The stage has been set for more in-depth studies of EHD proteins in other
macrophage functions such as antigen presentation through MHC class I and
MHC class II, processing of pathogens/antigens, and macrophage-assisted

134
pathologies. These findings will also serve as a basis for future studies aimed at
uncovering the importance of the EHD proteins in trafficking of receptors on the
cell surface in normal immune physiology and disease.

135
CHAPTER 4: FIGURES

136
Figure 4.1. Working model of the novel EHD1 function in CSF-1R delivery and display on the macrophage cell surface.

137
Figure 4.1. Working model of the EHD1 function in CSF-1R delivery and
display on the macrophage cell surface. EHD1-dependent post-Golgi sorting
of newly synthesized CSF-1R in BMDMs directs the receptor towards the cell
surface and away from the lysosome. In EHD1-expressing BMDMs, the surface
delivery dominates. In the absence of EHD1, the lysosomal delivery is dominant,
resulting in lower surface CSF-1R and reduced CSF1R-dependent cellular
activation together with increased CSF-1R delivery to the lysosome for
degradation.

138
BIBLIOGRAPHY

139
1. Shima, M., Teitelbaum, S. L., Holers, V. M., Ruzicka, C., Osmack, P., and
Ross, F. P. (1995) Macrophage-colony-stimulating factor regulates
expression of the integrins alpha 4 beta 1 and alpha 5 beta 1 by murine
bone marrow macrophages. Proc. Natl. Acad. Sci. U. S. A. 92, 5179–83
2. Rieger, M. A, Hoppe, P. S., Smejkal, B. M., Eitelhuber, A. C., and
Schroeder, T. (2009) Lineage Choice. Science. 325, 217–218
3. Weidenbusch, M., and Anders, H. J. (2012) Tissue microenvironments
define and get reinforced by macrophage phenotypes in homeostasis or
during inflammation, repair and fibrosis. J. Innate Immun. 4, 463–477
4. Mosser, D. M., and Zhang, X. (2008) Activation of murine macrophages.
Curr. Protoc. Immunol. Chapter 14, Unit 14.2
5. Shi, C., and Pamer, E. G. (2011) Monocyte recruitment during infection
and inflammation. Nat. Rev. Immunol. 11, 762–74
6. Stein, M., Keshav, S., Harris, N., and Gordon, S. (1992) Interleukin 4
potently enhances murine macrophage mannose receptor activity: a
marker of alternative immunologic macrophage activation. J. Exp. Med.
176, 287–292
7. Chitu, V., and Stanley, E. R. (2006) Colony-stimulating factor-1 in immunity
and inflammation. Curr. Opin. Immunol. 18, 39–48
8. Hamilton, J. A. (2008) Colony-stimulating factors in inflammation and
autoimmunity. Nat. Immunol. 23, 533–544
9. Pollard, J. W. (2009) Trophic macrophages in development and disease.

140
Nat. Rev. Immunol. 9, 259–70
10. Toh, M. L., Bonnefoy, J. Y., Accart, N., Cochin, S., Pohle, S., Haegel, H.,
De Meyer, M., Zemmour, C., Preville, X., Guillen, C., Thioudellet, C.,
Ancian, P., Lux, A., Sehnert, B., Nimmerjahn, F., Voll, R. E., and Schett, G.
(2014) Bone- and cartilage-protective effects of a monoclonal antibody
against colony-stimulating factor 1 receptor in experimental arthritis.
Arthritis Rheumatol. 66, 2989–3000
11. Bogie, J. F. J., Stinissen, P., and Hendriks, J. J. A. (2014) Macrophage
subsets and microglia in multiple sclerosis. Acta Neuropathol. 128, 191–
213
12. Sundal, C., Fujioka, S., Van Gerpen, J. A., Wider, C., Nicholson, A. M.,
Baker, M., Shuster, E. A., Aasly, J., Spina, S., Ghetti, B., Roeber, S.,
Garbern, J., Tselis, A., Swerdlow, R. H., Miller, B. B., Borjesson-Hanson,
A., Uitti, R. J., Ross, O. A., Stoessl, A. J., Rademakers, R., Josephs, K. A.,
Dickson, D. W., Broderick, D., and Wszolek, Z. K. (2013) Parkinsonian
features in hereditary diffuse leukoencephalopathy with spheroids (HDLS)
and CSF1R mutations. Park. Relat. Disord. 19, 869–877
13. Aikawa, Y., Katsumoto, T., Zhang, P., Shima, H., Shino, M., Terui, K., Ito,
E., Ohno, H., Stanley, E. R., Singh, H., Tenen, D. G., and Kitabayashi, I.
(2010) PU.1-mediated upregulation of CSF1R is crucial for leukemia stem
cell potential induced by MOZ-TIF2. Nat. Med. 16, 580–585, 1p following
585
14. Qian, B.-Z., Li, J., Zhang, H., Kitamura, T., Zhang, J., Campion, L. R.,

141
Kaiser, E. A., Snyder, L. A., and Pollard, J. W. (2011) CCL2 recruits
inflammatory monocytes to facilitate breast-tumour metastasis. Nature.
475, 222–5
15. Laoui, D., van Overmeire, E., de Baetselier, P., van Ginderachter, J. A.,
and Raes, G. (2014) Functional relationship between tumor-associated
macrophages and macrophage colony-stimulating factor as contributors to
cancer progression. Front. Immunol. 5, 1–15
16. Hernandez, L., Smirnova, T., Kedrin, D., Wyckoff, J., Zhu, L., Stanley, E.
R., Cox, D., Müller, W. J., Pollard, J. W., Rooijen, N. Van, and Segall, J. E.
(2009) The EGF/CSF-1 paracrine invasion loop can be triggered by
heregulin ß1 and CXCL12. Cancer Res. 69, 3221–3227
17. Pixley, F. J., and Stanley, E. R. (2004) CSF-1 regulation of the wandering
macrophage: Complexity in action. Trends Cell Biol. 14, 628–638
18. Huynh, J., Kwa, M. Q., Cook, A. D., Hamilton, J. A., and Scholz, G. M.
(2012) CSF-1 receptor signalling from endosomes mediates the sustained
activation of Erk1/2 and Akt in macrophages. Cell. Signal. 24, 1753–1761
19. Friedman, a D. (2007) Transcriptional control of granulocyte and monocyte
development. Oncogene. 26, 6816–6828
20. Goh, L. L. K., and Sorkin, A. (2013) Endocytosis of receptor tyrosine
kinases. Cold Spring Harb. Perspect. …. 5, a017459
21. Wei, S., Nandi, S., Chitu, V., Yeung, Y.-G. Y.-G., Yu, W., Huang, M.,
Williams, L. T. T., Lin, H., and Stanley, E. R. R. (2010) Functional overlap
but differential expression of CSF-1 and IL-34 in their CSF-1 receptor-

142
mediated regulation of myeloid cells. J. Leukoc. Biol. 88, 495–505
22. Liu, H., Leo, C., Chen, X., Wong, B. R., Williams, L. T., Lin, H., and He, X.
(2012) The mechanism of shared but distinct CSF-1R signaling by the non-
homologous cytokines IL-34 and CSF-1. Biochim. Biophys. Acta - Proteins
Proteomics. 1824, 938–945
23. Li, W., and Stanley, E. R. (1991) Role of dimerization and modification of
the CSF-1 receptor in its activation and internalization during the CSF-1
response. EMBO J. 10, 277–88
24. Mohapatra, B., Ahmad, G., Nadeau, S., Zutshi, N., An, W., Scheffe, S.,
Dong, L., Feng, D., Goetz, B., Arya, P., Bailey, T. a., Palermo, N.,
Borgstahl, G. E. O., Natarajan, A., Raja, S. M., Naramura, M., Band, V.,
and Band, H. (2013) Protein tyrosine kinase regulation by ubiquitination:
Critical roles of Cbl-family ubiquitin ligases. Biochim. Biophys. Acta. 1833,
122–139
25. Lee, P. S. W., Wang, Y., Dominguez, M. G., Yeung, Y. G., Murphy, M. A.,
Bowtell, D. D. L., and Stanley, E. R. (1999) The Cbl protooncoprotein
stimulates CSF-1 receptor multiubiquitination and endocytosis, and
attenuates macrophage proliferation. EMBO J. 18, 3616–3628
26. Wang, Y., Yeung, Y. G., and Stanley, E. R. (1999) CSF-1 stimulated
multiubiquitination of the CSF-1 receptor and of Cbl follows their tyrosine
phosphorylation and association with other signaling proteins. J. Cell.
Biochem. 72, 119–134
27. Roepstorff, K., Grandal, M. V., Henriksen, L., Knudsen, S. L. J., Lerdrup,

143
M., Grøvdal, L., Willumsen, B. M., and Van Deurs, B. (2009) Differential
effects of EGFR ligands on endocytic sorting of the receptor. Traffic. 10,
1115–1127
28. Jopling, H. M., Howell, G. J., Gamper, N., and Ponnambalam, S. (2011)
The VEGFR2 receptor tyrosine kinase undergoes constitutive endosome-
to-plasma membrane recycling. Biochem. Biophys. Res. Commun. 410,
170–176
29. Guilbert, L. J., and Stanley, E. R. (1986) The interaction of 125I-colony-
stimulating factor-1 with bone marrow-derived macrophages. J. Biol.
Chem. 261, 4024–4032
30. Naslavsky, N., and Caplan, S. (2010) EHD proteins: key conductors of
endocytic transport. Trends Cell Biol. 21, 122–131
31. George, M., Rainey, M. A., Naramura, M., Ying, G., Harms, D. W.,
Vitaterna, M. H., Doglio, L., Crawford, S. E., Hess, R. A., Band, V., and
Band, H. (2010) Ehd4 is required to attain normal prepubertal testis size
but dispensable for fertility in male mice. Genesis. 48, 328–342
32. Arya, P., Rainey, M. A., Bhattacharyya, S., Mohapatra, B. C., George, M.,
Kuracha, M. R., Storck, M. D., Band, V., Govindarajan, V., and Band, H.
(2015) The endocytic recycling regulatory protein EHD1 Is required for
ocular lens development. Dev. Biol. 408, 1–15
33. Bhattacharyya, S., Rainey, M. A., Arya, P., Dutta, S., George, M., Storck,
M. D., McComb, R. D., Muirhead, D., Todd, G. L., Gould, K., Datta, K.,
Waes, J. G., Band, V., and Band, H. (2016) Endocytic recycling protein

144
EHD1 regulates primary cilia morphogenesis and SHH signaling during
neural tube development. Sci. Rep. 6, 20727
34. Posey, A. D., Pytel, P., Gardikiotes, K., Demonbreun, A. R., Rainey, M.,
George, M., Band, H., and McNally, E. M. (2011) Endocytic recycling
proteins EHD1 and EHD2 interact with Fer-1-like-5 (Fer1L5) and mediate
myoblast fusion. J. Biol. Chem. 286, 7379–7388
35. Posey, A. D., Swanson, K. E., Alvarez, M. G., Krishnan, S., Earley, J. U.,
Band, H., Pytel, P., McNally, E. M., and Demonbreun, A. R. (2014) EHD1
mediates vesicle trafficking required for normal muscle growth and
transverse tubule development. Dev. Biol. 387, 179–190
36. Rainey, M. A., George, M., Ying, G., Akakura, R., Burgess, D. J., Siefker,
E., Bargar, T., Doglio, L., Crawford, S. E., Todd, G. L., Govindarajan, V.,
Hess, R. A., Band, V., Naramura, M., and Band, H. (2010) The endocytic
recycling regulator EHD1 is essential for spermatogenesis and male fertility
in mice. BMC Dev. Biol. 10, 37
37. George, M., Rainey, M. A., Naramura, M., Foster, K. W., Holzapfel, M. S.,
Willoughby, L. L., Ying, G., Goswami, R. M., Gurumurthy, C. B., Band, V.,
Satchell, S. C., and Band, H. (2011) Renal thrombotic microangiopathy in
mice with combined deletion of endocytic recycling regulators EHD3 and
EHD4. PLoS One. 6, e17838
38. Curran, J., Makara, M. A., Little, S. C., Musa, H., Liu, B., Wu, X., Polina, I.,
Alecusan, J. S., Wright, P., Li, J., Billman, G. E., Boyden, P. A., Gyorke, S.,
Band, H., Hund, T. J., and Mohler, P. J. (2014) EHD3-dependent

145
endosome pathway regulates cardiac membrane excitability and
physiology. Circ. Res. 115, 68–78
39. Gudmundsson, H., Curran, J., Kashef, F., Snyder, J. S., Smith, S. A.,
Vargas-Pinto, P., Bonilla, I. M., Weiss, R. M., Anderson, M. E., Binkley, P.,
Felder, R. B., Carnes, C. A., Band, H., Hund, T. J., and Mohler, P. J.
(2012) Differential regulation of EHD3 in human and mammalian heart
failure. J. Mol. Cell. Cardiol. 52, 1183–1190
40. Curran, J., Musa, H., Kline, C. F., Makara, M. A., Little, S. C., Higgins, J.
D., Hund, T. J., Band, H., and Mohler, P. J. (2015) Eps15 homology
domain-containing protein 3 regulates cardiac T-type Ca2+ channel
targeting and function in the atria. J. Biol. Chem. 290, 12210–12221
41. Rapaport, D., Auerbach, W., Naslavsky, N., Pasmanik-Chor, M., Galperin,
E., Fein, A., Caplan, S., Joyner, A. L., and Horowitz, M. (2006) Recycling to
the plasma membrane is delayed in EHD1 knockout mice. Traffic. 7, 52–60
42. Caplan, S., Naslavsky, N., Hartnell, L. M., Lodge, R., Polishchuk, R. S.,
Donaldson, J. G., and Bonifacino, J. S. (2002) A tubular EHD1-containing
compartment involved in the recycling of major histocompatibility complex
class I molecules to the plasma membrane. EMBO J. 21, 2557–2567
43. Jović, M., Naslavsky, N., Rapaport, D., Horowitz, M., and Caplan, S. (2007)
EHD1 regulates beta1 integrin endosomal transport: effects on focal
adhesions, cell spreading and migration. J. Cell Sci. 120, 802–814
44. Sengupta, S., George, M., Miller, K. K., Naik, K., Chou, J., Cheatham, M.
A., Dallos, P., Naramura, M., Band, H., and Zheng, J. (2009) EHD4 and
146
CDH23 are interacting partners in cochlear hair cells. J. Biol. Chem. 284,
20121–20129
45. Yap, C. C. C., Lasiecka, Z. M., Caplan, S., and Winckler, B. (2010)
Alterations of EHD1/EHD4 protein levels interfere with L1/NgCAM
endocytosis in neurons and disrupt axonal targeting. J. Neurosci. 30,
6646–6657
46. Buggia-Prevot, V., Fernandez, C. G., Udayar, V., Vetrivel, K. S., Elie, A.,
Roseman, J., Sasse, V. A., Lefkow, M., Meckler, X., Bhattacharyya, S.,
George, M., Kar, S., Bindokas, V. P., Parent, A. T., Rajendran, L., Band,
H., Vassar, R., and Thinakaran, G. (2013) A Function for EHD Family
Proteins in Unidirectional Retrograde Dendritic Transport of BACE1 and
Alzheimer’s Disease Aβ Production. Cell Rep. 5, 1552–1563
47. Koles, K., Messelaar, E. M., Feiger, Z., Yu, C. J., Andrew, C., and Rodal, A
(2015) The EHD protein Past1 controls postsynaptic membrane
elaboration and synaptic function. Mol. Biol. Cell. 26, 1–31
48. Shao, Y., Akmentin, W., Toledo-Aral, J. J., Rosenbaum, J., Valdez, G.,
Cabot, J. B., Hilbush, B. S., and Halegoua, S. (2002) Pincher, a pinocytic
chaperone for nerve growth factor/TrkA signaling endosomes. J. Cell Biol.
157, 679–691
49. Basha, G., Omilusik, K., Chavez-Steenbock, A., Reinicke, A. T., Lack, N.,
Choi, K. B., and Jefferies, W. A (2012) A CD74-dependent MHC class I
endolysosomal cross-presentation pathway. Nat. Immunol. 13, 237–245
50. Guermonprez, P., Saveanu, L., Kleijmeer, M., Davoust, J., Van Endert, P.,

147
and Amigorena, S. (2003) ER-phagosome fusion defines an MHC class I
cross-presentation compartment in dendritic cells. Nature. 425, 397–402
51. Lozano, M. L., Rivera, J., Sánchez-Guiu, I., and Vicente, V. (2014)
Towards the targeted management of Chediak-Higashi syndrome.
Orphanet J. Rare Dis. 9, 132
52. Sieni, E., Cetica, V., Hackmann, Y., Coniglio, M. L., Da Ros, M., Ciambotti,
B., Pende, D., Griffiths, G., and Arico, M. (2014) Familial hemophagocytic
lymphohistiocytosis: When rare diseases shed light on immune system
functioning. Front. Immunol. 5, 1–19
53. Fejer, G., Sharma, S., and Gyory, I. (2015) Self-renewing macrophages - A
new line of enquiries in mononuclear phagocytes. Immunobiology. 220,
169–174
54. Jenkins, S. J., and Hume, D. A. (2014) Homeostasis in the mononuclear
phagocyte system. Trends Immunol. 35, 358–367
55. Schmittgen, T. D., and Livak, K. J. (2008) Analyzing real-time PCR data by
the comparative CT method. Nat. Protoc. 3, 1101–1108
56. Bailey, T. A., Luan, H., Tom, E., Bielecki, T. A., Mohapatra, B., Ahmad, G.,
George, M., Kelly, D. L., Natarajan, A., Raja, S. M., Band, V., and Band, H.
(2014) A kinase inhibitor screen reveals protein kinase C-dependent
endocytic recycling of ErbB2 in breast cancer cells. J. Biol. Chem. 289,
30443–30458
57. Lou, J., Low-Nam, S. T., Kerkvliet, J. G., and Hoppe, A. D. (2014) Delivery
of CSF-1R to the lumen of macropinosomes promotes its destruction in

148
macrophages. J. Cell Sci. 127, 5228–5239
58. Weischenfeldt, J., and Porse, B. (2008) Bone marrow-derived
macrophages (BMM): Isolation and applications. Cold Spring Harb. Protoc.
3, pdb.prot5080–pdb.prot5080
59. Tushinski, R. J., Oliver, I. T., Guilbert, L. J., Tynan, P. W., Warner, J. R.,
and Stanley, E. R. (1982) Survival of mononuclear phagocytes depends on
a lineage-specific growth factor that the differentiated cells selectively
destroy. Cell. 28, 71–81
60. Simoncic, P. D., Bourdeau, A., Lee-Loy, A., Rohrschneider, L. R.,
Tremblay, M. L., Stanley, E. R., and McGlade, C. J. (2006) T-cell protein
tyrosine phosphatase (Tcptp) is a negative regulator of colony-stimulating
factor 1 signaling and macrophage differentiation. Mol. Cell. Biol. 26, 4149–
60
61. Stanley, E. R. (1976) Factors regulating macrophage production and
growth: identity of colony- stimulating factor and macrophage growth factor.
J. Exp. Med. 143, 631–647
62. Yeung, Y. G., and Stanley, E. R. (2003) Proteomic Approaches to the
Analysis of Early Events in Colony-stimulating Factor-1 Signal
Transduction. Mol.Cell Proteomics. 2, 1143–1155
63. Yanagita, M., Higashi, A., Ikawa, T., Muramatsu, M., Economides, A. N.,
and Kawamoto, H. (2009) Response to Comment on “Direct Hematological
Toxicity and Illegitimate Chromosomal Recombination Caused by the
Systemic Activation of CreERT2.” J. Immunol. 183, 2891–2892

149
64. Pixley, F. J. (2012) Macrophage migration and its regulation by CSF-1. Int.
J. Cell Biol. 2012, 501962
65. Wimmer, R., and Baccarini, M. (2010) Partner exchange: Protein-protein
interactions in the Raf pathway. Trends Biochem. Sci. 35, 660–668
66. Liao, R. S., Ma, S., Miao, L., Li, R., Yin, Y., and Raj, G. V. (2013) Androgen
receptor-mediated non-genomic regulation of prostate cancer cell
proliferation. Transl. Androl. Urol. 2, 187–196
67. Hume, D. A. (2008) Differentiation and heterogeneity in the mononuclear
phagocyte system. Mucosal Immunol. 1, 432–441
68. Hume, D. A., and MacDonald, K. P. A. (2012) Therapeutic applications of
macrophage colony-stimulating factor-1 (CSF-1) and antagonists of CSF-1
receptor (CSF-1R) signaling. Blood. 119, 1810–1820
69. Jeffery, J. J., Lux, K., Vogel, J. S., Herrera, W. D., Greco, S., Woo, H.-H.,
Abushahin, N., Pagel, M. D., and Chambers, S. K. (2014) Autocrine
inhibition of the c-fms proto-oncogene reduces breast cancer bone
metastasis assessed with in vivo dual-modality imaging. Exp. Biol. Med.
239, 404–413
70. Hassan, R., Suzu, S., Hiyoshi, M., Takahashi-Makise, N., Ueno, T.,
Agatsuma, T., Akari, H., Komano, J., Takebe, Y., Motoyoshi, K., and
Okada, S. (2009) Dys-regulated activation of a Src tyroine kinase Hck at
the Golgi disturbs N-glycosylation of a cytokine receptor Fms. J. Cell.
Physiol. 221, 458–468
71. Hiyoshi, M., Suzu, S., Yoshidomi, Y., Hassan, R., Harada, H., Sakashita,

150
N., Akari, H., Motoyoshi, K., and Okada, S. (2008) Interaction between Hck
and HIV-1 Nef negatively regulates cell surface expression of M-CSF
receptor. Blood. 111, 243–250
72. Gomez, T. S., Gorman, J. A., Artal-Martinez de Narvajas, A., Koenig, A.
O., and Billadeau, D. D. (2012) Trafficking defects in WASH-knockout
fibroblasts originate from collapsed endosomal and lysosomal networks.
Mol. Biol. Cell. 23, 3215–3228
73. Tu, C., Ortega-Cava, C. F., Chen, G., Fernandes, N. D., Cavallo-Medved,
D., Sloane, B. F., Band, V., and Band, H. (2008) Lysosomal cathepsin B
participates in the podosome-mediated extracellular matrix degradation
and invasion via secreted lysosomes in v-Src fibroblasts. Cancer Res. 68,
9147–9156
74. Strachan, D. C., Ruffell, B., Oei, Y., Bissell, M. J., Coussens, L. M., Pryer,
N., and Daniel, D. (2013) CSF1R inhibition delays cervical and mammary
tumor growth in murine models by attenuating the turnover of tumor-
associated macrophages and enhancing infiltration by CD8(+) T cells.
Oncoimmunology. 2, e26968