Embed Size (px)
Citation preview
ENVIRONMENTALHEALTH PERSPECTIVES
Note to readers with disabilities: EHP will provide a 508-conformant version of this article upon final publication. If you require a 508-conformant version before then, please contact [email protected]. Our staff will work with you to assess and meet your accessibility needs within 3 working days.
http://www.ehponline.org
ehpAssociations of Cognitive Function Scores with Carbon Dioxide, Ventilation, and Volatile Organic Compound Exposures in Office Workers: A Controlled Exposure
Study of Green and Conventional Office Environments
Joseph G. Allen, Piers MacNaughton, Usha Satish, Suresh Santanam, Jose Vallarino, and John D. Spengler
http://dx.doi.org/10.1289/ehp.1510037
Received: 4 April 2015Accepted: 12 October 2015
Advance Publication: 26 October 2015
Environ Health Perspect DOI: 10.1289/ehp.1510037 Advance Publication: Not Copyedited
1
Associations of Cognitive Function Scores with Carbon Dioxide,
Ventilation, and Volatile Organic Compound Exposures in Office
Workers: A Controlled Exposure Study of Green and Conventional
Office Environments
Joseph G. Allen1, Piers MacNaughton1, Usha Satish2, Suresh Santanam3, Jose Vallarino1, and
John D. Spengler1
1Exposure, Epidemiology & Risk Program, Department of Environmental Health, Harvard T.H.
Chan School of Public Health, Boston, Massachusetts, USA; 2Psychiatry and Behavioral
Sciences, SUNY-Upstate Medical School, Syracuse, New York, USA; 3Industrial Assessment
Center, Center of Excellence, Syracuse University, Syracuse, New York, USA
Address correspondence to Joseph G. Allen, Harvard T.H. Chan School of Public Health, 401
Park Drive, Landmark Center, 404-L, Boston, MA 02215 USA. Telephone: 617-384-8475. E-
mail: [email protected]
Short running title: Green buildings and cognitive function
Acknowledgments: We thank the study participants for volunteering and the reviewers of this
manuscript for their insights that helped improve the manuscript. This research was supported by
a gift from United Technologies to the Center for Health and the Global Environment at the
Harvard T.H. Chan School of Public Health. Dr. Allen’s time was primarily supported by faculty
startup funds, Dr. Spengler’s time was primarily funded by his endowed chair, and Mr.
MacNaughton’s time was supported by NIEHS environmental epidemiology training grant
5T32ES007069-35. United Technologies Research Center provided limited input during the

Environ Health Perspect DOI: 10.1289/ehp.1510037 Advance Publication: Not Copyedited
2
study design phase (support for adding a control day and adding a third CO2 test level). United
Technologies was not involved in the data collection, data analysis, data interpretation, data
presentation, or drafting of the manuscript.
Competing financial interests: The authors declare they have no financial interests.
Environ Health Perspect DOI: 10.1289/ehp.1510037 Advance Publication: Not Copyedited
3
ABSTRACT
Background: The indoor built environment plays a critical role in our overall well-being, both
due to the amount of time we spend indoors (~90%) and the ability of buildings to positively or
negatively influence our health. The advent of sustainable design or green building strategies
reinvigorated questions regarding the specific factors in buildings that lead to optimized
conditions for health and productivity.
Objective: To simulate indoor environmental quality (IEQ) conditions in “Green” and
“Conventional” buildings and evaluate the impacts on an objective measure of human
performance – higher order cognitive function.
Methods: Twenty-four (24) participants spent 6 full work days (9 a.m. – 5 p.m.) in an
environmentally controlled office space, blinded to test conditions. On different days, they were
exposed to IEQ conditions representative of Conventional (high volatile organic compound
(VOC) concentration) and Green (low VOC concentration) office buildings in the U.S.
Additional conditions simulated a Green building with a high outdoor air ventilation rate (labeled
Green+) and artificially elevated carbon dioxide (CO2) levels independent of ventilation.
Results: On average, cognitive scores were 61% higher on the Green building day and 101%
higher on the two Green+ building days than on the Conventional building day (p<0.0001).
VOCs and CO2 were independently associated with cognitive scores.
Conclusions: Cognitive function scores were significantly better in Green+ building conditions
compared to the Conventional building conditions for all nine functional domains. These
findings have wide ranging implications because this study was designed to reflect conditions
that are commonly encountered every day in many indoor environments.
Environ Health Perspect DOI: 10.1289/ehp.1510037 Advance Publication: Not Copyedited
4
INTRODUCTION
The increasing cost of energy in the 1970s led to a change in building practices throughout the
United States, as buildings were increasingly constructed to be airtight and energy efficient. This
is reflected in decreasing air exchange rates in homes and buildings. For homes, beginning
around this time period, typical air exchange rates began decreasing from approximately 1 air
change per hour (ACH) to approximately 0.5 ACH (Chan et al. 2003; Hodgson et al. 2000;
ASHRAE 2013). Homes built in the past decade are designed to be even more energy-efficient
and therefore can be even tighter (0.1 - 0.2 ACH; Allen et al. 2012; ASHRAE 2013). The 100+
year story of ventilation in buildings is more complicated, and neatly summarized recently by
Persily (2015). Persily describes the original ASHRAE 62 standard, issued in 1973, and the
many subsequent iterations (e.g. ASHRAE 62.1 applies to commercial buildings), demonstrating
the evolving nature of our understanding regarding the relationship between ventilation rate and
acceptable indoor air quality. Similar to the story with homes, commercial ventilation
requirements were lowered in the early 1980’s, largely as an energy-conservation measure
(Persily 2015).
With these design changes comes the potential for negative consequences to indoor
environmental quality (IEQ), as decreased ventilation can lead to increased concentration of
indoor pollutants. Building-related illnesses and sick building syndrome (SBS) were first
reported in the 1980s as ventilation rates decreased (Riesenberg and Arehart-Treichel 1986),
with significant annual costs and productivity losses due to health symptoms attributable to the
indoor environment (Fisk et al. 1997). A few factors of the indoor and work environment have
been found to be associated with occupant health. These include environmental measures, such
as humidity; building factors, such as ventilation rate; workspace factors, such as the presence of
Environ Health Perspect DOI: 10.1289/ehp.1510037 Advance Publication: Not Copyedited
5
chemical-emitting materials; and personal factors, such as job stress, allergies, and gender
(Mendell 1993; Wargocki et al. 2000; Bornehag et al. 2005; Hedge 2009; Hedge and Gaygen
2010; Nishihara 2014).
The IEQ problems that arose from conventional buildings with a tight envelope contributed to
the advent of sustainable design or “green” building rating systems (e.g. U.S. Green Building
Council’s Leadership in Energy and Environmental Design (LEED®)). These rating systems aim
to reduce the environmental footprint of buildings and improve occupant health by providing
design credits to new and existing buildings for adopting green design, operation, and
maintenance. Different levels of ratings for the building are then awarded based on the number
of acquired credits (e.g., silver, gold, platinum) (USGBC 2014). Many design credits are aimed
at energy efficiency and environmental performance, but also include guidelines for improving
ventilation and filtration, using low-emitting materials, controlling indoor chemical and pollutant
sources, improving thermal and lighting conditions, and offering daylight views to building
occupants (USGBC 2014). Compared to conventional buildings, environmental measurements in
green buildings show lower concentrations of several key pollutants including particles, nitrogen
dioxide, VOCs, and allergens (Colton et al. 2014; Jacobs et al. 2014; Noris et al. 2013). However,
these reductions generally did not extend to CO2 or air exchange rate, demonstrating the
influence of energy efficiency on green building operation and design. Green buildings were
associated with improved IEQ, and have been associated with reductions in self-reported
symptoms in people inhabiting the buildings, and with improved productivity in home, school,
and office settings (Colton et al. 2014; NRC 2007; Singh et al. 2010). However, an important
limitation of these studies is the reliance on subjective outcome measures, such as surveys, that
have the potential for bias because participants are aware of their status (i.e. green or control). To
Environ Health Perspect DOI: 10.1289/ehp.1510037 Advance Publication: Not Copyedited
6
our knowledge, no studies have been conducted in green buildings to date where participants are
blinded to their building condition (Allen et al. 2015).
We designed this study to objectively quantify the impact of indoor environmental on higher
order cognitive function, a driver of real-world productivity in office workers. We simulated low
VOC (“Green”) and high VOC (“Conventional”) building conditions, both at the ASHRAE
standard ventilation rate. Recognizing that technological advances in mechanical systems opens
the possibility of increasing ventilation rates without sacrificing energy efficiency, we also tested
another building condition that introduced higher rates of ventilation to the Green building
condition. This condition is labeled Green+. Last, we were motivated by the recent findings by
Satish et al. that CO2 may be a direct pollutant, and not just an indicator of ventilation (2012),
and therefore estimated associations of full workday exposure to CO2 on cognitive function
holding all other variables constant.
METHODS
Study Design
This is a study undertaken in a controlled office environment to estimate the effect of several
indoor environmental quality parameters on an objective measure of cognitive function. We
utilized a double-blinded study design that includes repeated measures of cognitive function on
the same individual, characterization of potential confounding IEQ variables, and mid-week
testing to avoid Monday/Friday effects. All participants received the same exposures on each
day, with exposures varying each day.
Environ Health Perspect DOI: 10.1289/ehp.1510037 Advance Publication: Not Copyedited
7
Study Population
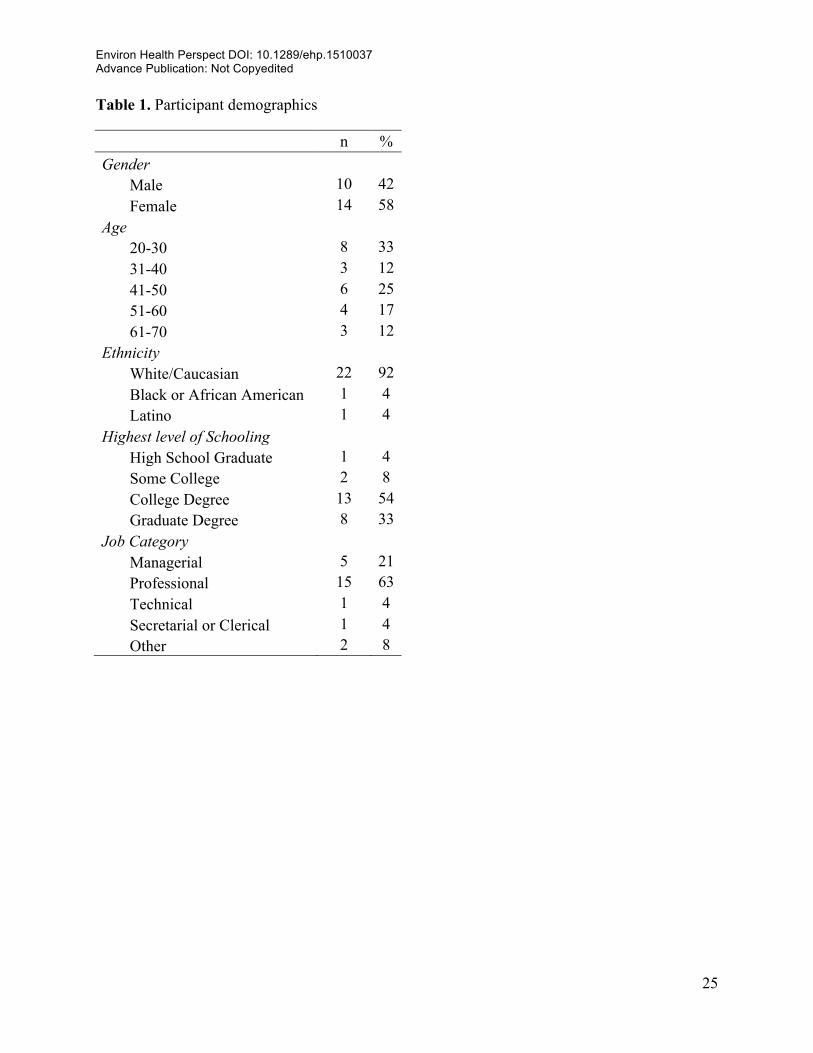
24 professional-grade employees (architects, designers, programmers, engineers, creative
marketing professionals, managers) in the Syracuse area participated in a six day longitudinal
study of cognitive performance and building conditions (Table 1). Six additional people were
originally recruited as backups but were not enrolled in the study. Participants were recruited
through emails to local businesses. The study population was restricted to non-sensitive persons
by excluding current smokers and people with asthma (due to testing indoor air quality),
claustrophobia or schizophrenia (due to this being a laboratory experiment where participants are
required to remain in the TIEQ). The participants were relocated to the Willis H. Carrier Total
Indoor Environmental Quality (TIEQ) Laboratory at the Syracuse Center of Excellence (CoE)
for six days over the course of two weeks in November of 2014. The study protocol was
reviewed and approved by the Harvard T.H. Chan School of Public Health Institutional Review
Board. SUNY Upstate Medical and Syracuse University ceded their review to Harvard’s IRB. All
participants signed informed consent documents and were compensated $800.
Participants reported to the CoE on Tuesday, Wednesday and Thursday, at 9 a.m., for two
consecutive weeks. The CoE has two nearly identical office environments located adjacent to one
another as part of the TIEQ Lab, each with 12 cubicles. The rooms are similarly constructed and
have identical building materials (e.g., carpeting, cubicles, painting, computers). Environmental
conditions, described in the following sections, were designed to be consistent in the two rooms.
On the first day participants were randomly assigned to a cubicle in the TIEQ Lab for the
duration of the study. Participants were requested to spend the entire work day in the simulated
office environments performing their normal work activities. They were provided with
computers, internet access, and an area for private telephone calls and printing. A 45-minute
Environ Health Perspect DOI: 10.1289/ehp.1510037 Advance Publication: Not Copyedited
8
lunch break was given between 12:00-12:45 (Room 1) or 12:15-1:00pm (Room 2). A limited
selection of food was provided, served and eaten in a room adjacent to the two simulated office
environment rooms. Participants then returned to the simulated office environment to continue
their work. Cognitive testing was initiated at 3:00 p.m. each day, after which the participants
completed the daily surveys and left the TIEQ Lab. Participants were blinded to test conditions,
as were the analysts performing the cognitive function assessment. Participants were not given
any instructions on how to spend their time in the evenings or on the Mondays before starting the
test period.
Indoor Environment Simulation
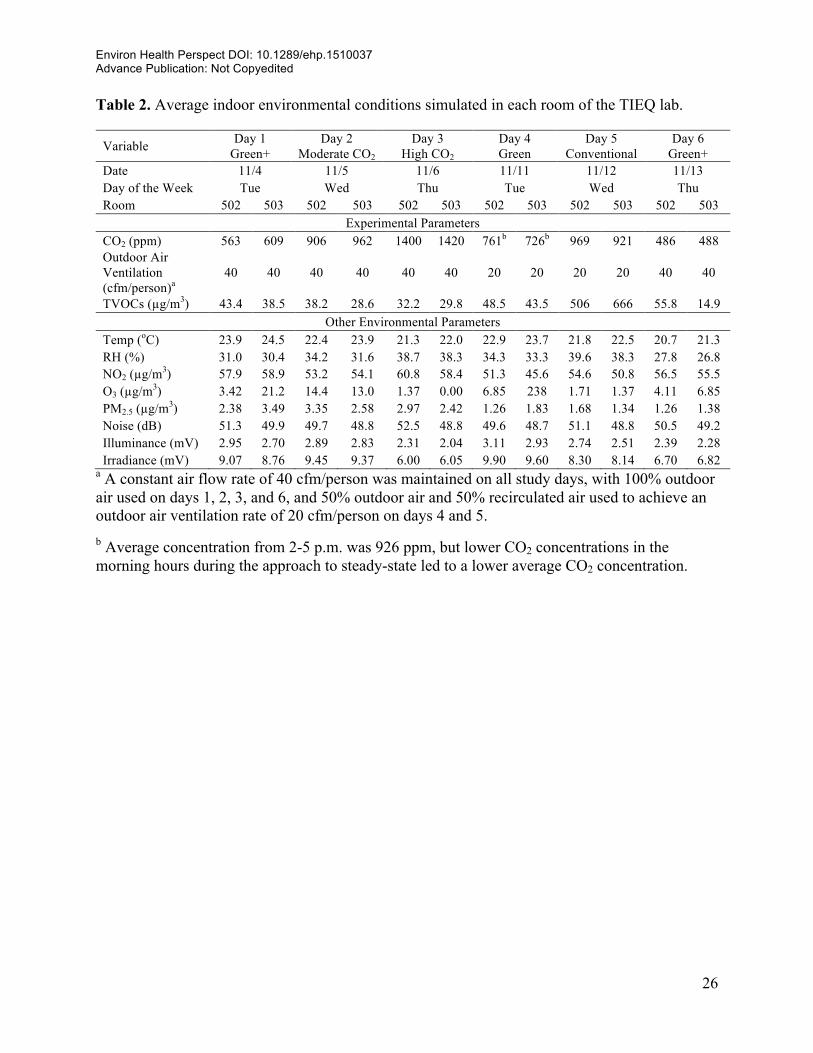
The different environmental simulations in the TIEQ Lab on each day were designed to evaluate
commonly encountered conditions and guidance values (Table 2). The three test parameters that
were experimentally controlled were ventilation with outdoor air, CO2, and VOCs. We selected
two outdoor air ventilation rates for this study: 20 cfm/person and 40 cfm/person. LEED®
specifies that mechanically ventilated spaces must meet ventilation rates under ASHRAE 62.1,
or local equivalent, whichever is more stringent (USGBC 2014; ASHRAE 2013). Many local
building codes use the previous ASHRAE standard of 20 cfm/person, which corresponds to an
indoor CO2 concentration of 945 ppm. Therefore, 20 cfm/person was the ventilation rate we used
for the Green and Conventional simulation days because it reflects the minimum required
ventilation rate for both green buildings (through LEED®) and conventional buildings (through
ASHRAE). We also sought to evaluate the impact of a doubling of that minimum rate to 40
cfm/person (labeled Green+ days), which corresponds to an approximate steady-state CO2
concentration of 550 ppm. To ensure blinding, air movement was maintained at 40 cfm per
person on all study days, with 100% outdoor air ventilation used on Green+ days and moderate
Environ Health Perspect DOI: 10.1289/ehp.1510037 Advance Publication: Not Copyedited
9
and high CO2 days, and a mix of 50% outdoor air and 50% recirculated air used on the Green
and Conventional days to achieve 20 cfm outdoor air ventilation per person.
For the assessment of the independent association of CO2 on cognitive function, outdoor air
ventilation rate held constant at 40 cfm/person while CO2 was added to the chambers to reach
three steady-state CO2 concentrations. The first target was 550 ppm (Green+, Days 1 and 6). The
second target, 945 ppm, was selected to reflect a level that would be expected at the previously
described ASHRAE minimum recommended ventilation rate of 20 cfm outdoor air/person. The
third target, 1400 ppm, was selected to represent a higher, but not uncommon, concentration of
CO2 found in indoor environments (1400 ppm is the maximum observed 8-hour time-weighted-
average CO2 concentration in the USEPA BASE dataset (USEPA 1998)). On Days 2 and 3,
where the independent effects of CO2 were tested, CO2 was added from a cylinder of ultra-pure
CO2 (at least 99.9999% pure) to the TIEQ Lab supply air at the rate needed to maintain
steady-state CO2 concentrations of 945 ppm and 1,400 ppm. Since CO2 concentrations are
impacted by occupancy and mixing impact concentrations, a technician monitored CO2 in real-
time and adjusted the emission rate accordingly to keep CO2 concentrations constant. During
Days 4 and 5 (Green and Conventional), injection of pure CO2 was not needed to reach the
target CO2 concentrations because of the reduced outdoor ventilation rate. A protocol was
established to ensure participant safety in the event that there were unexpected deviations. CO2
was monitored in real-time at a high-spatial resolution in the test rooms, using three different
and independently calibrated monitors. A technician seated next to the CO2 shut-off valves
monitored the CO2 concentrations during the entire test period. The protocol called for
immediately canceling of the testing if CO2 concentrations exceeded preset thresholds that
were set well-below occupational health limits (2,500 ppm; one-half of the Threshold Limit
Environ Health Perspect DOI: 10.1289/ehp.1510037 Advance Publication: Not Copyedited
10
Value set by the American Conference of Governmental Industrial Hygienists (ACGIH 2015)).
No deviations from protocol occurred during the study.
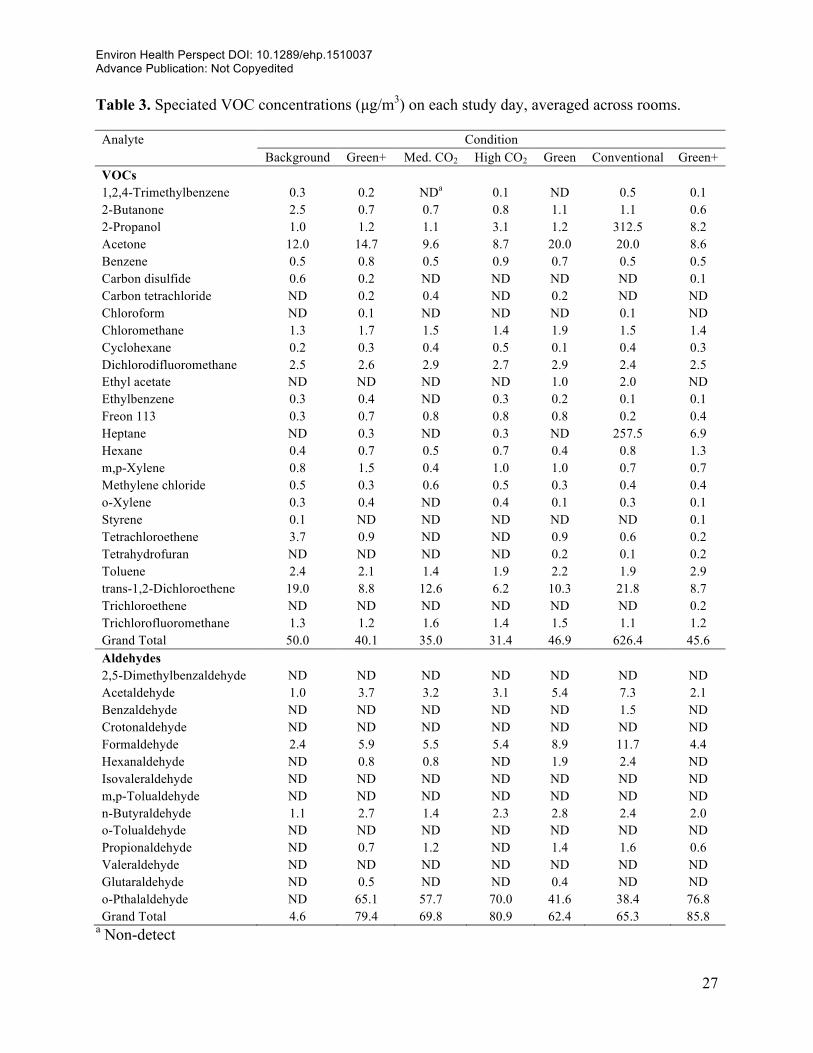
The TIEQ Lab was constructed with low-VOC materials, and low levels of VOCs were
confirmed by pre-testing (Table 3). To simulate a Conventional office space with higher VOCs,
we placed VOC sources in the diffuser that supplied air to each cubicle area before the
participants arrived on Day 5. We selected a target total VOC (TVOC) level of 500 µg/m3 based
on the LEED® Indoor Air Quality Assessment credit limit, as measured using EPA method TO-
15 (USGBC 2014). The diffusers are built into the floor of the TIEQ Lab and there were no
visible indicators of these sources for the participants to observe. We selected a mix of non-odor
sources to simulate VOC-emitting materials that are commonly found in office building and
which cover four indoor VOC source categories including building materials (56 in2 exposed
edge melamine, 56 in2 exposed edge particle board, 64 in2 vinyl mat), adhesives [80 in2 duct
tape, 80 in2 packing tape (exposed)], cleaning products (1 oz. multi-surface cleaner, 4 multi-
surface wipes, 144 in2 recently dry-cleaned cloth), and office supplies (4 dry erase markers, 1
open bottle of whiteout).
Environmental Monitoring
The study team characterized the TIEQ Lab on each test day for a wide range of IEQ indicators:
CO2, temperature, relative humidity, barometric pressure, sound levels, VOCs, aldehydes, NO2,
O3, PM2.5, and light. Netatmo Weather Stations were installed in each cubicle to measure
temperature, humidity, carbon dioxide concentrations in parts per million (ppm), and sound
levels (in decibels) every 5 minutes for each participant. They were calibrated to 0 and 3000 ppm
of CO2 using calibration gases and validated using a calibrated TSI Q-Trak (model 7575). In
addition, the Netatmos were tested with 400 and 1000 ppm calibration gas at the end of the study
Environ Health Perspect DOI: 10.1289/ehp.1510037 Advance Publication: Not Copyedited
11
to determine if the sensors drifted during the two week period. Duplicate measures of CO2 were
collected in each room using a TSI Q-Trak model 7575 and two K-33 data loggers. Summa
canisters were used to detect overall levels of 62 common VOCs in a randomly selected
workstation in each room for each of the study days (Table 3). An additional sample was
collected in a third randomly selected cubicle each day. Samples were analyzed by ALS
Laboratories according to EPA method TO-15. 36 VOCs were not detected in any of the samples.
In each room a monitoring station was placed at the far end of the room from the entrance to
monitor additional IEQ parameters. The station included a) a TSI SidePak AM510 personal
aerosol monitor to measure particulate matter 2.5 microns in diameter or smaller (PM2.5) , b) an
integrated filter sample for gravimetric analysis of PM2.5 and elemental composition, c) an 8-hour
integrated active air sample (0.4 L/min flow rate) analyzed for 14 aldehydes by ALS Analytical
Laboratories using EPA method TO-11, d) a passive NO2 badge (8-hour time-weighted average;
model X-595, Assay Technology; OSHA method 182), e) a passive sampling badge for ozone O3
(8-hour time-weighted average; model X-586, Assay Technology; OSHA Method 214), and e)
illuminance and irradiance measures using an IL1400 radiometer/powermeter with SEL-
033/Y/W and SEL-033/F/W detectors. VOC, aldehyde, NO2, O3, and integrated PM2.5 samples
had at least one blank and one duplicate for every 10 samples. Samples were blank corrected for
analyses. All duplicate measures were within 15% of each other, and an average of the two was
used for subsequent analyses.
An ambient air monitoring system was installed on the roof of the CoE to measure PM2.5, O3,
and NO2 using the same procedures and equipment as the indoor stations to establish the
potential influence of outdoor contaminants on the indoor environment. Outdoor temperature,
humidity, solar radiation, and wind speed/direction data was obtained from the CoE weather
Environ Health Perspect DOI: 10.1289/ehp.1510037 Advance Publication: Not Copyedited
12
station located on the roof of the building. Baseline (i.e. prior to occupancy) measurements of all
IEQ parameters were collected in the TIEQ Lab one month before the actual study.
Cognitive Function Assessment
The cognitive assessment was performed daily using the Strategic Management Simulation
(SMS) software tool, which is a validated, computer-based test, designed to test the effectiveness
of management-level employees through assessments of higher-order decision making (Streufert
et al. 1988; Breuer et al. 2003; Satish et al. 2004). At the start of the 1.5 hour test, participants
were given a brief, 1-page description of the scenario that they were about to participate in during
the test. They were then logged onto a standardized desktop computer station at the TIEQ Lab
using a unique identifier. Participants were not allowed to use their own computers and were
instructed to turn off all other devices prior to the assessment. The simulation was then initiated.
Participants were exposed to diverse situations based on real-world equivalent challenges (e.g.
handling a township in the role of a mayor or emergency coordinator). These scenarios are
designed to capture participants’ standard response pattern. The software allows flexibility in
approach; participants can choose to make a decision or form a plan at any time in response to any
stimulus from the program. The absence of requirements or stated demands allows the participant
the freedom to strategize and take initiative in his or her typical cognitive style. Based on the
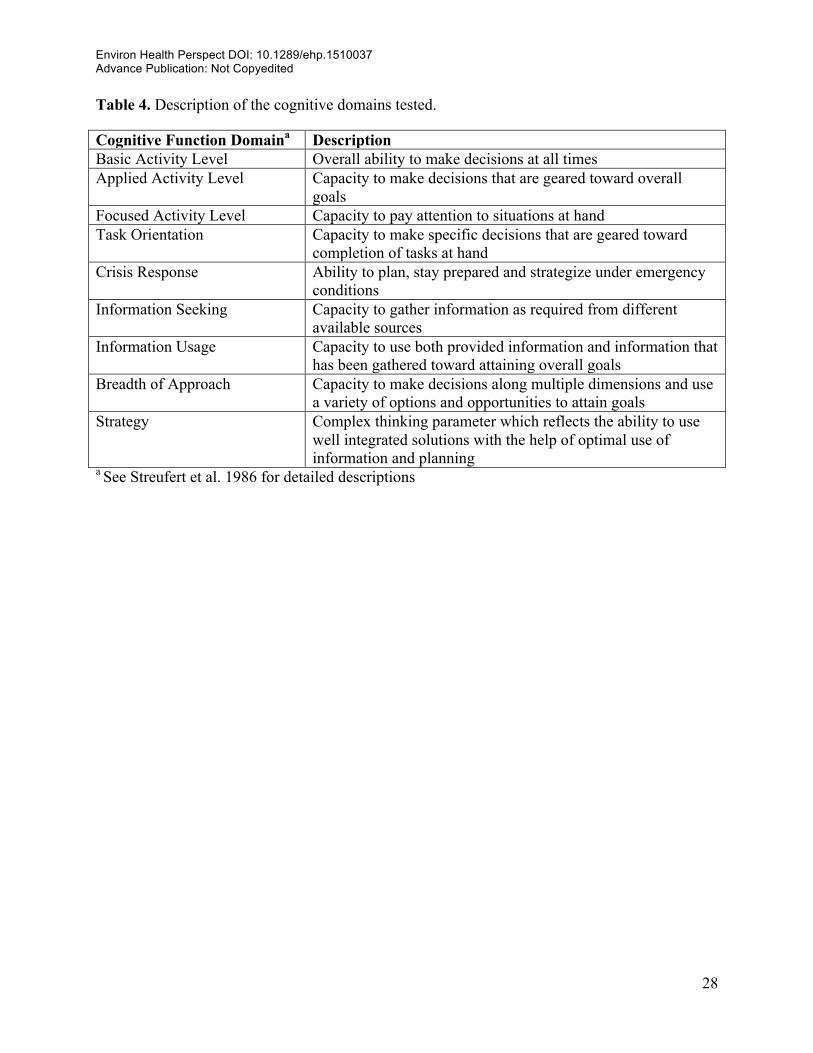
participant’s actions, plans, responses to incoming information, and use of prior actions and
outcomes, the SMS software computes scores for nine cognitive factors (Table 4).
A technician trained in administering this test was present to provide standardized instructions
and periodically answer any questions from participants. Parallel scenarios (i.e., equivalent
scenarios) were used from one day to the next, which allow retesting individuals without
potential bias due to experience and learning effects (Swezey et al. 1998). Parallel scenarios have
Environ Health Perspect DOI: 10.1289/ehp.1510037 Advance Publication: Not Copyedited
13
correlation coefficients between 0.68 and 0.94 for the scores on these cognitive function domains
(Streufert et al. 1988).
Statistical Analyses
Generalized additive mixed effect models were used to test associations between environmental
exposures and cognitive function while controlling for the correlated-nature of the repeat
measures. In the model, the most specific exposure was assigned to each participant, whether it
be cubicle-level (CO2), room-level (VOCs), or lab-level (ventilation). Participant ID was treated
as a random intercept to control for confounding by individual characteristics. The residuals were
normally distributed and homoscedastic for all models (data not shown). We used penalized
splines to graphically assess linearity in the associations between environmental exposures and
cognitive scores. SMS scores are often compared to normative data from other uses of the SMS
software (e.g. Satish et al. 2012). Since we did not have access to normative data, we instead
used our study population as the reference group. Based on the analysis, cognitive scores were
normalized by Conventional (Table 5), Green (Figure 1) or Green+ (Figure 2) scores to allow for
comparisons across cognitive function domains, each of which has a unique scale in their raw
form. The scores were normalized for each cognitive domain by dividing all scores by the
average score during the normalizing condition. The statistical significance of our results is not
affected by normalization. Given the multiple comparisons tested in this analysis, p-values below
0.001 were considered statistically significant according to a Bonferroni correction. Analyses
were performed using the open-source statistical package R version 3.0.0 (R Project for
Statistical Computing, Vienna, Austria).
Environ Health Perspect DOI: 10.1289/ehp.1510037 Advance Publication: Not Copyedited
14
RESULTS
Green Building and Cognitive Function
The TVOC levels were constant at <50 µg/m3 on all study days except the Conventional building day
when levels increased to 506–666 µg/m3 depending on the room. The compounds that increased in
concentration include but are not limited to formaldehyde, benzaldehyde, acetaldehyde, heptane, and
2-propanol. Heptane and 2-propanol had the largest increases of the compounds sampled (Table
3). Total aldehyde concentrations were primarily driven by o-Pthalaldehyde and remained
relatively constant on all study days.
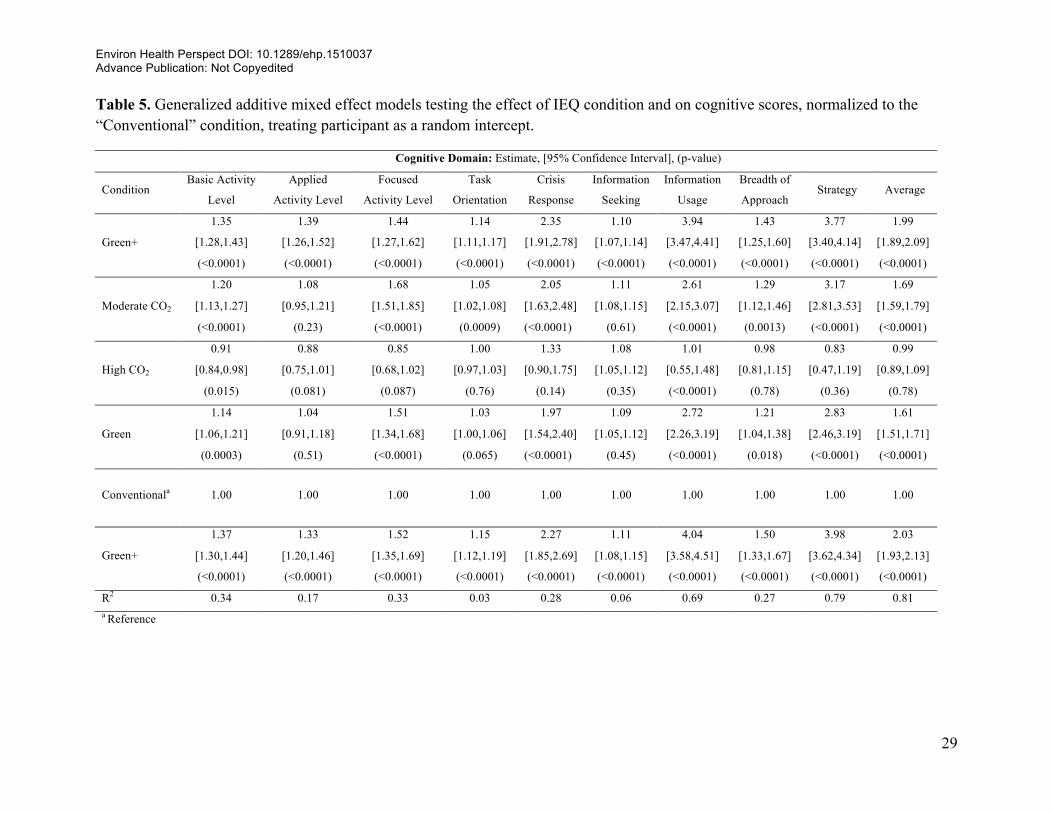
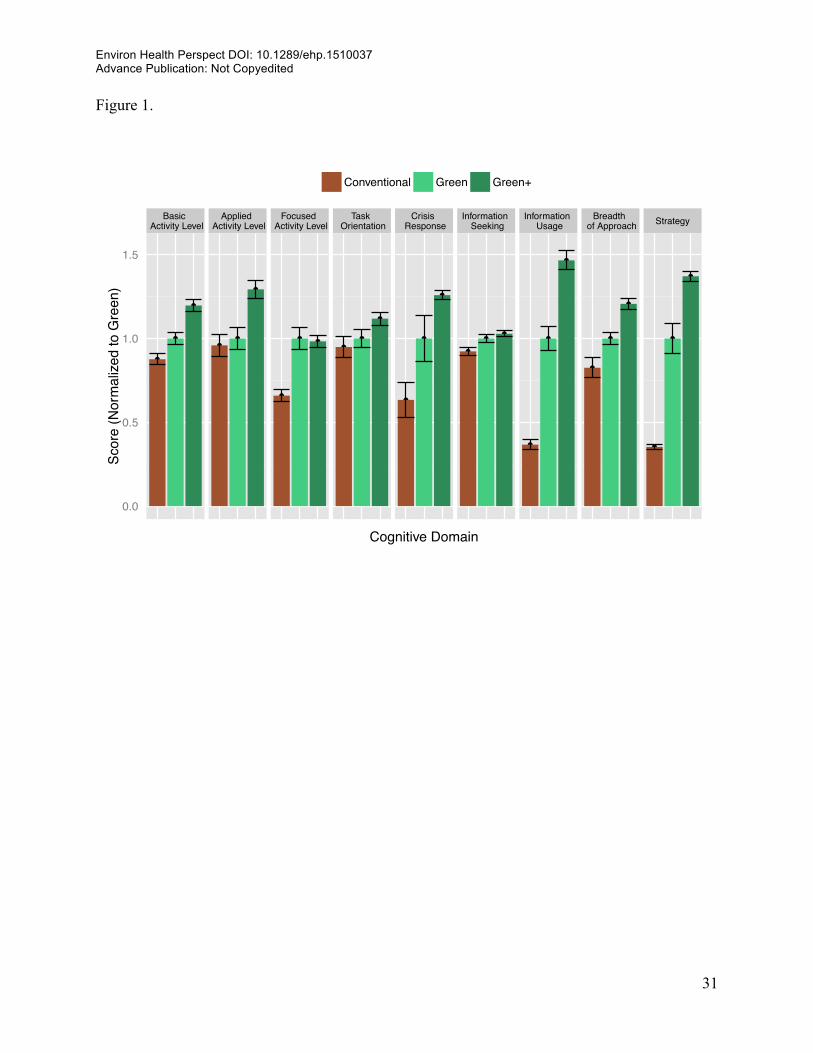
Cognitive function scores were higher in Green building conditions compared to the
Conventional building condition for all nine functional domains (Figure 1). On average,
cognitive scores were 61% higher on the Green building day and 101% higher on the two
Green+ building days than on the Conventional building day. The largest effects were seen for
Crisis Response, Information Usage, and Strategy, all of which are indicators of higher level
cognitive function and decision-making (Streufert 1986). For Crisis Response, scores were 97%
higher for the Green condition compared to Conventional, and 131% higher comparing Green+
and Conventional. For Information Usage, scores in the Green and Green+ conditions were
172% and 299% higher than Conventional, respectively. And for Strategy, which tests the
participants’ ability to plan, prioritize and sequence actions, the Green and Green+ day scores
were 183% and 288% higher than on the Conventional day (Table 5).
The raw cognitive scores for each domain were normalized to the conventional condition and
modeled by study day controlling for participant (Table 5). The repeat simulation of the Green+
day (Day 6), which was added to the study as a quality control measure, showed similar
cognitive function scores: p-values for the null hypothesis of no difference between the two days
Environ Health Perspect DOI: 10.1289/ehp.1510037 Advance Publication: Not Copyedited
15
ranging from 0.27 for Strategy (normalized scores of 3.77 and 3.98, respectively) to 0.73 for
Crisis Response (normalized scores of 2.35 and 2.27). The Green+ condition had statistically
significantly higher cognitive function scores than the Conventional condition in all domains
(p<0.0001). The Green condition had higher scores than the Conventional condition in all
domains, five of which were statistically significant.
Participants scored higher on the Green+ days than the Green day in eight of nine domains,
resulting in a 25% increase in scores on average when outdoor air ventilation rates were
increased. Cognitive scores were 20% higher on the Green+ days than the moderate CO2 day
when CO2 levels were higher (p-value < 0.0001) and 5% higher on the moderate CO2 day than
the Green day when outdoor air ventilation was reduced (p-value = 0.12). These estimates and p-
values were produced by rerunning the “average” model in Table 5 with the Green condition as
the reference category (data not shown).
The model of the average scores in Table 5 has a high R2 value of 0.81 indicating that a
significant amount of the variability in cognitive scores is explained by these indoor environment
test conditions, leaving only 19% of the variability to be explained by all other potential intra-
personal drivers of cognitive function such as diet, previous night sleep quality, and mood. For
the specific domains of cognitive function, the R2 range from 0.03 to 0.79.
Carbon Dioxide and Cognitive Function
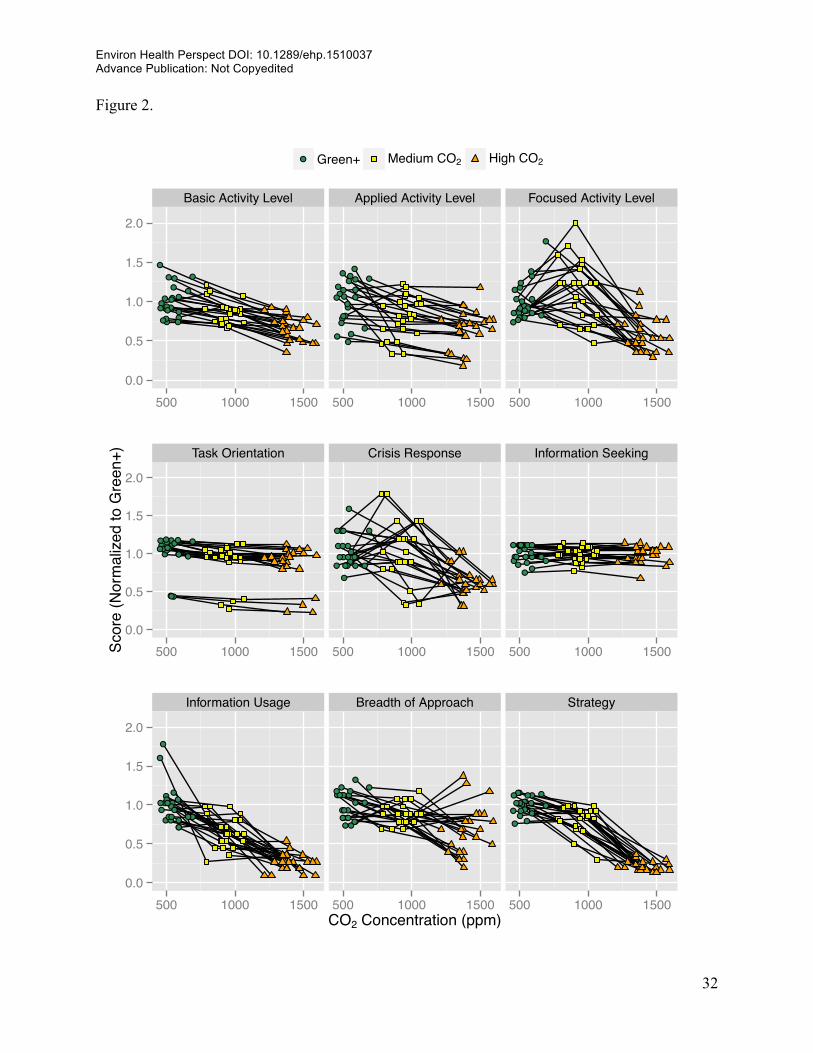
The effect of CO2 on cognitive function scores, while holding all other parameters constant, is
depicted in Figure 2. Because the air in each room was not completely mixed, there was some
variability in CO2 levels between cubicles. Each line represents the change in an individual’s
CO2 exposure and cognitive scores from one condition to the next, normalized by the average
Environ Health Perspect DOI: 10.1289/ehp.1510037 Advance Publication: Not Copyedited
16
CO2 exposure across all participants during the Green+ conditions. For seven of the nine
cognitive function domains, average cognitive scores decreased at each higher level of CO2
(Table 5). Cognitive function scores were 15% lower for the moderate CO2 day (~945 ppm) and
50% lower on the day with CO2 concentrations around 1400 ppm than on the two Green+ days
(Table 5, dividing the average Green+ estimate by the moderate CO2 and high CO2 estimate
respectively). The exposure-response between CO2 and cognitive function is approximately
linear across the concentrations used in this study; however, whether the largest difference in
scores is between the Green+ conditions and the moderate CO2 condition or the moderate CO2
condition and the high CO2 condition depends on the domain (Figure 2).
Ventilation rate, CO2, and TVOCs were modeled separately from study day to capture the
independent effect of each factor on cognitive function scores, averaged across all domains. A
statistically significant increase in scores was associated with ventilation rate, CO2 and TVOCs
(p<0.0001 for all three parameters). On average, a 400 ppm increase in CO2 was associated with
a 21% decrease, a 20 CFM increase in outdoor air per person was associated with an 18%
increase, and a 500 µg/m3 increase in TVOCs was associated with a 13% decrease in a typical
participant’s cognitive scores across all domains after adjusting for participant (data not shown).
While other environmental variables were not experimentally modified, some did vary over the
course of the study (Table 2). While there was a high degree of consistency in IEQ between the
two rooms, ozone was significantly higher in one of the chambers on the Green day. Cognitive
scores were 4% higher in the room with high ozone on this day, after accounting for baseline
cognitive performance in the two rooms. These IEQ parameters were added to the model with
the experimentally controlled variables and were not found to be significantly associated with
cognitive function at the 0.05 significance level.
Environ Health Perspect DOI: 10.1289/ehp.1510037 Advance Publication: Not Copyedited
17
DISCUSSION
Green Buildings and Health
We found a significant increase in cognitive function scores when people spent a full day in a
Green building compared to an environment designed to simulate a Conventional building by
elevating VOC concentrations. The study was designed to represent typical conditions observed
in many buildings; we did not include extreme exposures or choose uncommon VOC sources.
Further, we selected our target levels of VOCs, ventilation rates and CO2 to be above and below
the standards in LEED®, ASHRAE, and EPA BASE study in order to evaluate how these
common standards and guidelines perform (USGBC 2014, ASHRAE 2013b, USEPA 1998). Our
findings indicate that there may be benefits to meeting the LEED® VOC guideline of 500 µg/m3
and enhancing ventilation rates beyond the minimum requirement under ASHRAE.
The “Conventional” building simulation parameters in our study were based on the USEPA
BASE study, which plausibly represent the upper end of performance for “typical” buildings in
the U.S. in the 1990s because the owners were willing to participate in the study, introducing
potential self-selection bias, and larger, “non-problem” buildings were preferentially recruited
(Persily 2004). Therefore, the extent to which BASE buildings represent typical conventional
buildings is unknown. Our findings show impacts above the 95th percentile of CO2 (945 ppm)
and the mean VOC concentration in the BASE study (450 µg/m3); however, a larger proportion
of the buildings in the BASE study would likely exceed these targets if “problem” buildings
were included in the recruitment process.
The VOC levels on the Conventional and Green/Green+ days straddle both the LEED® TVOC
guidance concentration of 500 µg/m3 and the BASE mean concentration of 450 µg/m3. The common
VOC sources that were added to the rooms during the Conventional building day led to increases in a
Environ Health Perspect DOI: 10.1289/ehp.1510037 Advance Publication: Not Copyedited
18
range of VOCs. Previous testing with the SMS tool showed that two hours of painting, which
exposed participants to VOCs, was associated with reductions in 3 of the 5 domains investigated
(Satish et al., 2013). The lower TVOC concentrations (yet larger number of sources) in this study
were associated with statistically significant decrements in decision-making performance in 5 of
the 9 domains.
Carbon Dioxide and Ventilation
Carbon dioxide concentration in indoor environments has long been used as an indicator of
ventilation and a proxy for indoor air quality (ASHRAE 2013). However, this conventional
thinking is being challenged as the evidence mounts for CO2 as a direct pollutant, not just a
marker for other pollutants (Satish et al. 2012). We found statistically significant declines in
cognitive function scores when CO2 concentrations were increased to levels that are common in
indoor spaces (approximately 950 ppm). In fact, this level of CO2 is considered acceptable
because it would satisfy ASHRAE’s ventilation rate guidance for acceptable indoor air quality.
Larger differences were seen when CO2 was raised to 1400 ppm.
Satish et al. used the SMS tool to test the effect of CO2 exposures on the cognitive function of 22
participants, using a controlled chamber and injection of ultra-pure CO2 (Satish et al. 2012).
They reported impacts on 7 of 9 cognitive function domains with increasing CO2 concentrations.
The SMS tool was also used to test the relationship between ventilation rate and cognitive
function among 16 participants (Maddalena et al. 2014). Participants scored significantly lower
on 8 of 9 domains at low ventilation rates (12.5 cfm of outdoor air/person). In contrast to our
current study, these studies had 1) a single experimental parameter; 2) half-day or shorter
exposures; 3) multiple experimental conditions per day; 4) atypical exposure targets (2500 ppm
of CO2 and 12.5 cfm outdoor air/person); and 5) primarily students and college-age adults.
Environ Health Perspect DOI: 10.1289/ehp.1510037 Advance Publication: Not Copyedited
19
Despite these differences, our study found similar changes in cognitive scores from a unit change
in CO2 or outdoor air ventilation. Associations were consistent a) in all three study populations,
indicating that knowledge workers and students are equally impacted by CO2 and outdoor air
ventilation, and b) at different exposure durations, indicating that even short exposures are
associated with cognitive function. Given the similarities in findings, there may not be a
desensitization or compensatory response from prolonged exposure. More research is necessary
to investigate the presence or lack of these responses.
The CO2 exposure levels used in this study are also comparable to those seen in a variety of
indoor locations. Assessment of public housing units in Boston found median CO2 levels to be
809 ppm in conventional apartments and 1204 ppm in the newly constructed LEED® platinum
apartments (Colton et al. 2014). Corsi et al. (2002) reported CO2 concentrations > 1000 ppm in
66% of 120 classrooms in Texas, and Shendell et al. (2004) measured CO2 concentrations >1000
ppm in 45% of 435 classrooms in Washington and Idaho, and reported that higher CO2
concentrations were associated with increases in student absences.
Strengths and Limitations
The study design has several notable strengths. These include: repeat measures of cognitive
function on the same individual for control of between-subject variability, characterization of
the TIEQ Lab for potential environmental confounders, repeat testing of the same condition
nine days apart on different days of the week, mid-week testing to avoid potential
Monday/Friday bias, participants and cognitive function analysts blinded to test condition, and
the use of an objective measure of cognitive function.
Environ Health Perspect DOI: 10.1289/ehp.1510037 Advance Publication: Not Copyedited
20
The SMS tool is an objective assessment tool, unlike self-reported metrics, and thus less
susceptible to the participant’s environmental perceptions. Extensive work has been dedicated
to testing the validity of the SMS software; correlations between scores on these tests and other
measures of productivity such as income at age and job level at age exceed 0.6 (Streufert et al.
1988). The correlations are stronger with the more strategic domains, such as strategy,
information usage, and crisis response, than domains pertaining to activity, such as information
search and activity level. The domains that were impacted the most by the exposures in this
study are the same ones that are the most closely related with other measures of productivity
(Streufert et al. 1988). Lastly, the close agreement in scores on the two Green+ conditions
suggests that a) the study is internally valid, b) there are no learning effects associated with the
test, and c) day of the week (Tuesday v. Thursday) is not a potential confounding variable.
The potential for confounding or effect modification by parameters measured or otherwise is
reduced by the use of the controlled environment and repeated measures on each participant.
By testing on subsequent days, it is possible that effects from one condition were reflected
in the scores on the next day. The environmental factors that were not experimentally modified
exhibited some variability due to changes in outdoor conditions and participant behavior. In
particular, ozone levels fluctuated significantly between some IEQ conditions (Table 2).
Environmental factors other than outdoor air ventilation, CO2 and VOCs were not statistically
significant predictors of cognitive scores, but this does not rule out the possibility of uncontrolled
confounding by these factors. The environmental conditions on each of the study days met design
criteria. During one day (Day 4), CO2 levels were lower in the morning than the afternoon,
which influenced the reported mean concentration. The CO2 levels on this day were similar to the
moderate CO2 and Conventional conditions (Day 5) during the time leading up to and during the
Environ Health Perspect DOI: 10.1289/ehp.1510037 Advance Publication: Not Copyedited
21
cognitive test (926 ppm from 2-5p.m.). This study used a controlled environment to individually
control certain contaminants. Assessments in actual office environments are important to
confirm the findings in a non-controlled setting.
CONCLUSION
Office workers had significantly improved cognitive function scores when working in Green and
Green+ environments compared to a Conventional one. Exposure to CO2 and VOCs at levels
found in Conventional office buildings was associated with lower cognitive scores compared to
levels in a Green building. Using low emitting materials, which is common practice in Green
buildings, reduces in-office VOC exposures. Increasing the supply of outdoor air not only lowers
exposures to CO2 and VOCs, but also exposure to other indoor contaminants. Green building
design that optimizes employee productivity and energy usage will require adopting energy
efficient systems and informed operating practices to maximize the benefit to human health
while minimizing energy consumption. This study was designed to reflect indoor office
environments in which large numbers of the population work every day. These exposures should be
investigated in other indoor environments, such as homes, schools and airplanes, where
decrements in cognitive function and decision-making could have significant impacts on
productivity, learning and safety.
Environ Health Perspect DOI: 10.1289/ehp.1510037 Advance Publication: Not Copyedited
22
REFERENCES
Allen J, MacNaughton P, Laurent J, Flanigan S, Eitland E, and J Spengler. 2015. Green Buildings and Health. Current Environmental Health Reports. 2(3): 250-258.
ACGIH. 2015. Guide to Occupational Exposure Values. American Conference of Governmental Industrial Hygienists (ACGIH). Cincinnati, OH.
ASHRAE. 2013. 2013 ASHRAE Handbook—Fundamentals [SI Edition]. Atlanta, GA: American Society of Heating, Refrigerating, and Air-Conditioning Engineers, Inc.
ASHRAE Standard 62.1-2013. 2013. Ventilation for Acceptable Indoor Air Quality. Atlanta, GA: American Society of Heating, Refrigerating and Air-Conditioning Engineers, Inc.
Allen J, MacIntosh D, Saltzman L, Baker B, Matheson J, Recht J, Minegishi T, Fragala M, Myatt T, Spengler J, Stewart J, McCarthy J. 2011. Elevated Corrosion Rates and Hydrogen Sulfide in Homes with ‘Chinese Drywall’. Science of the Total Environment, 426: 113-119.
Breuer K, & Satish U. 2003. Emergency Management Simulations: An Approach to the Assessment of Decision-making Processes in Complex Dynamic Crisis Environments. In N. A. Press (Ed.), From Modeling to Managing Security: A Systems Dynamics Approach (J.J. G, ed). (pp. 145–156). Norway.
Colton M, MacNaughton P, Vallarino J, Kane J, Bennett-Fripp M, Spengler J, & Adamkiewicz G. 2014. Indoor Air Quality in Green Vs Conventional Multifamily Low- Income Housing. Environmental Science & Technology, 48(14), 7833-7833.
Corsi RL, Torres VM, Sanders M, & Kinney KA. 2002. Carbon dioxide levels and dynamics in elementary schools: results from the TESIAS study. Proceedings from Indoor Air 2002, vol. 1.
Fisk WJ, & Rosenfeld AH. 1997. Estimates of Improved Productivity and Health from Better Indoor Environments. Indoor Air, 7(3), 158-172. doi: 10.1111/j.1600-0668.1997.t01-1-00002.x
Hedge A & Gaygen DE. 2010. Indoor Environment Conditions and Computer Work in an Office. HVAC&R Research Journal, 16 (2), 123-138.
Hedge A. 2009. Indoor Environmental Quality, Health and Productivity. Environmental Research Journal, 4 (1/2).
Jacobs DE, Ahonen E, Dixon SL, Dorevitch S, Breysse J, Smith, J, Levavi P. 2014. Moving Into Green Healthy Housing. Journal of Public Health Management and Practice, 1. doi: 10.1097/PHH.0000000000000047
Environ Health Perspect DOI: 10.1289/ehp.1510037 Advance Publication: Not Copyedited
23
Maddalena R, Mendell M, Eliseeva K, Chan W, Sullivan D, Russell M, Satish U, Fish w. 2014 Effects of ventilation rate per person and per floor area on perceived air quality, sick building syndrome symptoms, and decision-making. Indoor Air. doi: 10.1111/ina.12149
Mendell, MJ. 1993. Non-‐Specific Symptoms In Office Workers: A Review And Summary Of The Epidemiologic Literature. Indoor Air, 3(4), 227-236. doi: 10.1111/j.1600-0668.1993.00003.x
Nishihara N, Wargocki P, Tanabe S. 2014. Cerebral blood flow, fatigue, mental effort, and task performance in offices with two different pollution loads. Building and Environment 71: 153-164. DOI: 10.1016/j.buildenv.2013.09.018
Noris F, Adamkiewicz G, Delp W, Hotchi T, Russell M, Singer BC, Fisk WJ. 2013. Indoor environmental quality benefits of apartment energy retrofits. Building and Environment, 68, 170-178. doi: 10.1016/j.buildenv.2013.07.003
NRC. 2007. Green schools attributes for health and learning. Washington, DC.
Persily A and Gorfain J. 2004. “Ventilation data from the Environmental Protection Agency Building Assessment Survey and Evaluation (BASE) Study.” National Institute of Standards and Technology, U.S. Department of Commerce. NISTIR 7145.
Persily A. 2015. Challenges in developing ventilation and indoor air quality standards: The story of ASHRAE Standard 62. Building and Environment, 91, 61-69.
Riesenberg DE, Arehart-Treichel J. 1986. "Sick building" syndrome plagues workers, dwellers.
JAMA 255:3063-3063.
Satish U, Cleckner L, & Vasselli J. 2013. Impact of VOCs on decision making and productivity. Intelligent Buildings International, 5(4), 213-220. doi: 10.1080/17508975.2013.812956
Satish U, Mendell MJ, Shekhar K, Hotchi T, Sullivan D, Streufert S, & Fisk, WJ. 2012. Is CO2 an indoor pollutant? Direct effects of Low-to-moderate CO2 concentrations on human decision-making performance. Environmental Health Perspectives, 120(12), 1671.
Satish U, Streufert S, Dewan M, & Voort S. 2004. Improvements in Simulated Real-world Relevant Performance for Patients with Seasonal Allergic Rhinitis: Impact of Desloratadine. Allergy, 59(4), 415-420.
Shendell DG, Prill R, Fisk WJ, Apte MG, Blake D & Faulkner D. 2004. Associations between classroom CO2 concentrations and student attendance in Washington and Idaho. Indoor Air, 14, 333-341.
Singh A, Syal M, Grady SC, & Korkmaz S. 2010. Effects of green buildings on employee health and productivity. American journal of public health, 100(9), 1665. doi: 10.2105/AJPH.2009.180687
Environ Health Perspect DOI: 10.1289/ehp.1510037 Advance Publication: Not Copyedited
24
Streufert S & Swezey R. 1986. “Complexity, managers, and organizations.” Organizational and occupational psychology, Development Psychology Series. Academic Press. ISBN: 0126733708, 9780126733709.
Streufert S, Pogash R, & Piasecki M. 1988. Simulation-based assessment of managerial competence: reliability and validity. Personnel Psychology, 41(3), 537-557. doi: 10.1111/j.1744-6570.1988.tb00643.x
Streufert S, Pogash RM, Gingrich D, Kantner A, Lonardi L, Severs W, Roache J. 1993. Alcohol and Complex Functioning. Journal of Applied Social Psychology, 23(11), 847-866. doi: 10.1111/j.1559-1816.1993.tb01009.x
U.S. Green Building Council (USGBC). 2014. LEED v4 - User Guide. Washington D.C. http://www.usgbc.org/resources/leed-v4-user-guide
U.S. Environmental Protection Agency (USEPA). 1998. Building Assessment Survey and Evaluation. Retrieved 1/22, 2015, from http://www.epa.gov/iaq/base/study_overview.html
Environ Health Perspect DOI: 10.1289/ehp.1510037 Advance Publication: Not Copyedited
25
Table 1. Participant demographics
n % Gender Male 10 42 Female 14 58 Age 20-30 8 33 31-40 3 12 41-50 6 25 51-60 4 17 61-70 3 12 Ethnicity White/Caucasian 22 92 Black or African American 1 4 Latino 1 4 Highest level of Schooling High School Graduate 1 4 Some College 2 8 College Degree 13 54 Graduate Degree 8 33 Job Category Managerial 5 21 Professional 15 63 Technical 1 4 Secretarial or Clerical 1 4 Other 2 8
Environ Health Perspect DOI: 10.1289/ehp.1510037 Advance Publication: Not Copyedited
26
Table 2. Average indoor environmental conditions simulated in each room of the TIEQ lab.
Variable Day 1 Green+
Day 2 Moderate CO2
Day 3 High CO2
Day 4 Green
Day 5 Conventional
Day 6 Green+
Date 11/4 11/5 11/6 11/11 11/12 11/13 Day of the Week Tue Wed Thu Tue Wed Thu Room 502 503 502 503 502 503 502 503 502 503 502 503
Experimental Parameters CO2 (ppm) 563 609 906 962 1400 1420 761b 726b 969 921 486 488 Outdoor Air Ventilation (cfm/person)a
40 40 40 40 40 40 20 20 20 20 40 40
TVOCs (µg/m3) 43.4 38.5 38.2 28.6 32.2 29.8 48.5 43.5 506 666 55.8 14.9 Other Environmental Parameters
Temp (oC) 23.9 24.5 22.4 23.9 21.3 22.0 22.9 23.7 21.8 22.5 20.7 21.3 RH (%) 31.0 30.4 34.2 31.6 38.7 38.3 34.3 33.3 39.6 38.3 27.8 26.8 NO2 (µg/m3) 57.9 58.9 53.2 54.1 60.8 58.4 51.3 45.6 54.6 50.8 56.5 55.5 O3 (µg/m3) 3.42 21.2 14.4 13.0 1.37 0.00 6.85 238 1.71 1.37 4.11 6.85 PM2.5 (µg/m3) 2.38 3.49 3.35 2.58 2.97 2.42 1.26 1.83 1.68 1.34 1.26 1.38 Noise (dB) 51.3 49.9 49.7 48.8 52.5 48.8 49.6 48.7 51.1 48.8 50.5 49.2 Illuminance (mV) 2.95 2.70 2.89 2.83 2.31 2.04 3.11 2.93 2.74 2.51 2.39 2.28 Irradiance (mV) 9.07 8.76 9.45 9.37 6.00 6.05 9.90 9.60 8.30 8.14 6.70 6.82
a A constant air flow rate of 40 cfm/person was maintained on all study days, with 100% outdoor air used on days 1, 2, 3, and 6, and 50% outdoor air and 50% recirculated air used to achieve an outdoor air ventilation rate of 20 cfm/person on days 4 and 5. b Average concentration from 2-5 p.m. was 926 ppm, but lower CO2 concentrations in the morning hours during the approach to steady-state led to a lower average CO2 concentration.
Environ Health Perspect DOI: 10.1289/ehp.1510037 Advance Publication: Not Copyedited
27
Table 3. Speciated VOC concentrations (µg/m3) on each study day, averaged across rooms.
Analyte Condition Background Green+ Med. CO2 High CO2 Green Conventional Green+ VOCs 1,2,4-Trimethylbenzene 0.3 0.2 NDa 0.1 ND 0.5 0.1 2-Butanone 2.5 0.7 0.7 0.8 1.1 1.1 0.6 2-Propanol 1.0 1.2 1.1 3.1 1.2 312.5 8.2 Acetone 12.0 14.7 9.6 8.7 20.0 20.0 8.6 Benzene 0.5 0.8 0.5 0.9 0.7 0.5 0.5 Carbon disulfide 0.6 0.2 ND ND ND ND 0.1 Carbon tetrachloride ND 0.2 0.4 ND 0.2 ND ND Chloroform ND 0.1 ND ND ND 0.1 ND Chloromethane 1.3 1.7 1.5 1.4 1.9 1.5 1.4 Cyclohexane 0.2 0.3 0.4 0.5 0.1 0.4 0.3 Dichlorodifluoromethane 2.5 2.6 2.9 2.7 2.9 2.4 2.5 Ethyl acetate ND ND ND ND 1.0 2.0 ND Ethylbenzene 0.3 0.4 ND 0.3 0.2 0.1 0.1 Freon 113 0.3 0.7 0.8 0.8 0.8 0.2 0.4 Heptane ND 0.3 ND 0.3 ND 257.5 6.9 Hexane 0.4 0.7 0.5 0.7 0.4 0.8 1.3 m,p-Xylene 0.8 1.5 0.4 1.0 1.0 0.7 0.7 Methylene chloride 0.5 0.3 0.6 0.5 0.3 0.4 0.4 o-Xylene 0.3 0.4 ND 0.4 0.1 0.3 0.1 Styrene 0.1 ND ND ND ND ND 0.1 Tetrachloroethene 3.7 0.9 ND ND 0.9 0.6 0.2 Tetrahydrofuran ND ND ND ND 0.2 0.1 0.2 Toluene 2.4 2.1 1.4 1.9 2.2 1.9 2.9 trans-1,2-Dichloroethene 19.0 8.8 12.6 6.2 10.3 21.8 8.7 Trichloroethene ND ND ND ND ND ND 0.2 Trichlorofluoromethane 1.3 1.2 1.6 1.4 1.5 1.1 1.2 Grand Total 50.0 40.1 35.0 31.4 46.9 626.4 45.6 Aldehydes 2,5-Dimethylbenzaldehyde ND ND ND ND ND ND ND Acetaldehyde 1.0 3.7 3.2 3.1 5.4 7.3 2.1 Benzaldehyde ND ND ND ND ND 1.5 ND Crotonaldehyde ND ND ND ND ND ND ND Formaldehyde 2.4 5.9 5.5 5.4 8.9 11.7 4.4 Hexanaldehyde ND 0.8 0.8 ND 1.9 2.4 ND Isovaleraldehyde ND ND ND ND ND ND ND m,p-Tolualdehyde ND ND ND ND ND ND ND n-Butyraldehyde 1.1 2.7 1.4 2.3 2.8 2.4 2.0 o-Tolualdehyde ND ND ND ND ND ND ND Propionaldehyde ND 0.7 1.2 ND 1.4 1.6 0.6 Valeraldehyde ND ND ND ND ND ND ND Glutaraldehyde ND 0.5 ND ND 0.4 ND ND o-Pthalaldehyde ND 65.1 57.7 70.0 41.6 38.4 76.8 Grand Total 4.6 79.4 69.8 80.9 62.4 65.3 85.8
a Non-detect
Environ Health Perspect DOI: 10.1289/ehp.1510037 Advance Publication: Not Copyedited
28
Table 4. Description of the cognitive domains tested.
Cognitive Function Domaina Description Basic Activity Level Overall ability to make decisions at all times Applied Activity Level Capacity to make decisions that are geared toward overall
goals Focused Activity Level Capacity to pay attention to situations at hand Task Orientation Capacity to make specific decisions that are geared toward
completion of tasks at hand Crisis Response Ability to plan, stay prepared and strategize under emergency
conditions Information Seeking Capacity to gather information as required from different
available sources Information Usage Capacity to use both provided information and information that
has been gathered toward attaining overall goals Breadth of Approach Capacity to make decisions along multiple dimensions and use
a variety of options and opportunities to attain goals Strategy Complex thinking parameter which reflects the ability to use
well integrated solutions with the help of optimal use of information and planning
a See Streufert et al. 1986 for detailed descriptions
Environ Health Perspect DOI: 10.1289/ehp.1510037 Advance Publication: Not Copyedited
29
Table 5. Generalized additive mixed effect models testing the effect of IEQ condition and on cognitive scores, normalized to the “Conventional” condition, treating participant as a random intercept.
Cognitive Domain: Estimate, [95% Confidence Interval], (p-value)
Condition Basic Activity
Level
Applied
Activity Level
Focused
Activity Level
Task
Orientation
Crisis
Response
Information
Seeking
Information
Usage
Breadth of
Approach Strategy Average
Green+
1.35 1.39 1.44 1.14 2.35 1.10 3.94 1.43 3.77 1.99
[1.28,1.43] [1.26,1.52] [1.27,1.62] [1.11,1.17] [1.91,2.78] [1.07,1.14] [3.47,4.41] [1.25,1.60] [3.40,4.14] [1.89,2.09]
(<0.0001) (<0.0001) (<0.0001) (<0.0001) (<0.0001) (<0.0001) (<0.0001) (<0.0001) (<0.0001) (<0.0001)
Moderate CO2
1.20 1.08 1.68 1.05 2.05 1.11 2.61 1.29 3.17 1.69
[1.13,1.27] [0.95,1.21] [1.51,1.85] [1.02,1.08] [1.63,2.48] [1.08,1.15] [2.15,3.07] [1.12,1.46] [2.81,3.53] [1.59,1.79]
(<0.0001) (0.23) (<0.0001) (0.0009) (<0.0001) (0.61) (<0.0001) (0.0013) (<0.0001) (<0.0001)
High CO2
0.91 0.88 0.85 1.00 1.33 1.08 1.01 0.98 0.83 0.99
[0.84,0.98] [0.75,1.01] [0.68,1.02] [0.97,1.03] [0.90,1.75] [1.05,1.12] [0.55,1.48] [0.81,1.15] [0.47,1.19] [0.89,1.09]
(0.015) (0.081) (0.087) (0.76) (0.14) (0.35) (<0.0001) (0.78) (0.36) (0.78)
Green
1.14 1.04 1.51 1.03 1.97 1.09 2.72 1.21 2.83 1.61
[1.06,1.21] [0.91,1.18] [1.34,1.68] [1.00,1.06] [1.54,2.40] [1.05,1.12] [2.26,3.19] [1.04,1.38] [2.46,3.19] [1.51,1.71]
(0.0003) (0.51) (<0.0001) (0.065) (<0.0001) (0.45) (<0.0001) (0.018) (<0.0001) (<0.0001)
Conventionala 1.00 1.00 1.00 1.00 1.00 1.00 1.00 1.00 1.00 1.00
Green+
1.37 1.33 1.52 1.15 2.27 1.11 4.04 1.50 3.98 2.03
[1.30,1.44] [1.20,1.46] [1.35,1.69] [1.12,1.19] [1.85,2.69] [1.08,1.15] [3.58,4.51] [1.33,1.67] [3.62,4.34] [1.93,2.13]
(<0.0001) (<0.0001) (<0.0001) (<0.0001) (<0.0001) (<0.0001) (<0.0001) (<0.0001) (<0.0001) (<0.0001)
R2 0.34 0.17 0.33 0.03 0.28 0.06 0.69 0.27 0.79 0.81 a Reference
Environ Health Perspect DOI: 10.1289/ehp.1510037 Advance Publication: Not Copyedited
30
FIGURE LEGENDS
Figure 1. Average cognitive function scores and standard error bars by domain for the
Conventional, Green and two Green+ conditions, normalized to the Green condition by dividing
all scores by the average score during the Green condition.
Figure 2. Cognitive function scores by domain and participant, and corresponding carbon
dioxide concentration in their cubicle. Each line represents the change in an individual’s CO2
exposure and cognitive scores from one condition to the next, normalized by the average CO2
exposure across all participants during the Green+ conditions.
Environ Health Perspect DOI: 10.1289/ehp.1510037 Advance Publication: Not Copyedited
31
Figure 1.
Basic Activity Level
Applied Activity Level
Focused Activity Level
Task Orientation
Crisis Response
Information Seeking
Information Usage
Breadth of Approach Strategy
●
●
●
●
●●
●●
●
●
●
●
●
●
●
●●
●
●
●
●
●
●
●
●
●
●
0.0
0.5
1.0
1.5
Cognitive Domain
Scor
e (N
orm
alize
d to
Gre
en)
● ● ●Conventional Green Green+
Environ Health Perspect DOI: 10.1289/ehp.1510037 Advance Publication: Not Copyedited
32
Figure 2.
Basic Activity Level Applied Activity Level Focused Activity Level
●●
●●
●●●●
●●
●●●●
●●
●●
●●
●●
●●
●●
●●
●●
●●
●●
●●●●●●
●●
●●
●●
●●●●●●
●●
●●
●●
●●
●●
●●
●●
●●
●●
●●
●●
●●
●●
●●
●●●●
●●
●●●●●●
●●
●●●●●●
●●
●●●●
●●
●●●●
●●
●●
●●●●●●
●●●●
●●
●●●●
●●
●●
●●
0.0
0.5
1.0
1.5
2.0
500 1000 1500 500 1000 1500 500 1000 1500
●● Green+ Medium CO2 High CO2
Task Orientation Crisis Response Information Seeking
●●●●
●●
●●●●
●●●●●●
●●
●●●●●●
●●
●●
●●
●●
●●
●●●●
●●●●●●●●
●●
●●
●●●●
●●
●●
●●
●●●●●●
●●●●●●●●●●●●●●
●●●●●●
●●●●
●●
●●●●●●
●●●●●●
●●●●●●●●
●●●●
●●
●●●●
●●●●
●●
●●
●●●●
●●●●
0.0
0.5
1.0
1.5
2.0
500 1000 1500 500 1000 1500 500 1000 1500Scor
e (N
orm
alize
d to
Gre
en+)
Information Usage Breadth of Approach Strategy
●●
●●
●●
●●
●●
●●
●●
●●
●●●●●●
●●
●●
●●
●●●●
●●●●●●●●
●●
●●
●●
●●●●●●
●●●●●●●●
●●●●●●
●●
●●●●
●●
●●●●●●
●●●●●●●●
●●
●●●●
●●
●●
●●●●●●●●
●●
●●●●
●●
●● ●●
●●●●●●
●●
●●
●●●●●●●●●●
0.0
0.5
1.0
1.5
2.0
500 1000 1500 500 1000 1500 500 1000 1500CO2 Concentration (ppm)