Embed Size (px)
Citation preview

EI Working Paper Series – Issue 2

© Educational Initiatives Pvt. Ltd.2
ASSET is a registered trademark of EI
WHY THIS STUDY HAS LARGER RELEVANCE India’s growth in the 21st century economy is increasingly dependent on the knowledge capital we are able to provide for our young citizens. This is true not only for India but applies to all developing and developed economies too. Research on education quality provides evidence that the cognitive skills of the population - quality rather than quantity of schooling – are powerfully related to the economic growth of a coun-try (Hanushek and Woesmann, 2007).
Given this scenario, the need for national level benchmarking achievement studies that provide detailed and granular information and in-sights into how well our children are learning assume greater importance. They can provide powerful ‘data-driven’ insights into the existing learning gaps - for students to learn better, teachers to teach better, and schools and policy makers to operate more effectively. This study assessed students in urban local body schools of 30 towns of India with respect to specific skills and competencies that they were expected to have acquired.
SALIENT FEATURES OF THE STUDY 1. Students from Local Body schools in 30 urban towns in 5 states - Gujarat, Andhra Pradesh, Rajasthan, Chhattisgarh, and Uttaran-
chal (currently Uttarakhand) were tested in February 2007. 2. Students of classes 2, 4 and 6 were tested in Language and
Maths. Environmental Science (EVS) was also included for classes 4 and 6. The tests were developed comparably in 3 lan-guages – Hindi, Gujarati and Telugu.
3. These were administered to 35000 students in about 300 local body schools. 3600 students in 30 low cost private schools in Hy-derabad, Ahmedabad and Roorkee were also tested.
4. Three forms of test administration were used – a written test, in which students had to read the question paper and write their answers; a group oral test – in which the questions were read out to the whole class by trained administrators and the answers were written individually by students; and an Individual Oral test – in which each child was tested orally on a one to one basis.
5. A two stage stratified cluster sampling design and a systematic probability-proportional-to-size (PPS) technique was used.
6. A scientifically designed testing cycle including detailed text-book analysis, pilot tests and expert feedback was followed.
7. Standardized test administration was carried out by specially trained invigilators.
8. Background information from student, teacher and school were collected to identify factors associated with learning.
9. The analysis included use of modern Item Response Theory (IRT) techniques. 10. Scale anchoring was carried out to identify what students know and are able to do at different ability levels. 11. Student misconceptions and common errors in Maths and EVS were analysed through distracter analysis. 12. The study also tried to find out if there are any learning differences between students from those government schools that did not charge
any fees and the students from private schools that charge very low fees. 13. Online availability of information in a granular form at item level and school level has been made available at
http://www.educationalinitiatives.com/msbonline/msb_main_screen.php. The full report is available at http://www.educationalinitiatives.com/msb
WHY ONLY MUNICIPAL SCHOOLS FROM THE STATES WERE INCLUDED The study focused on urban municipal schools and not all the schools of the state (even though this restricts the applicability of the findings a bit). This was because it was believed that the comparability was higher between municipal schools for the following reasons – a. education in these schools is directly offered by the Government. b. the socio-economic profile of students is likely to be similar; employment and other opportunities and lifestyles are less diverse than
they are when one looks at the state as a whole. c. Moreover, the employment and other local conditions are more likely to be the same for all the teachers of municipal schools of a town
than for the teachers of rural or private schools across a state. The norms and standards laid down by the municipal boards also re-main almost the same throughout. Hence, the validity of generalising from a sample of municipal schools to all municipal schools of the state will be higher.
© Educational Initiatives Pvt. Ltd.3
ASSET is a registered trademark of EI
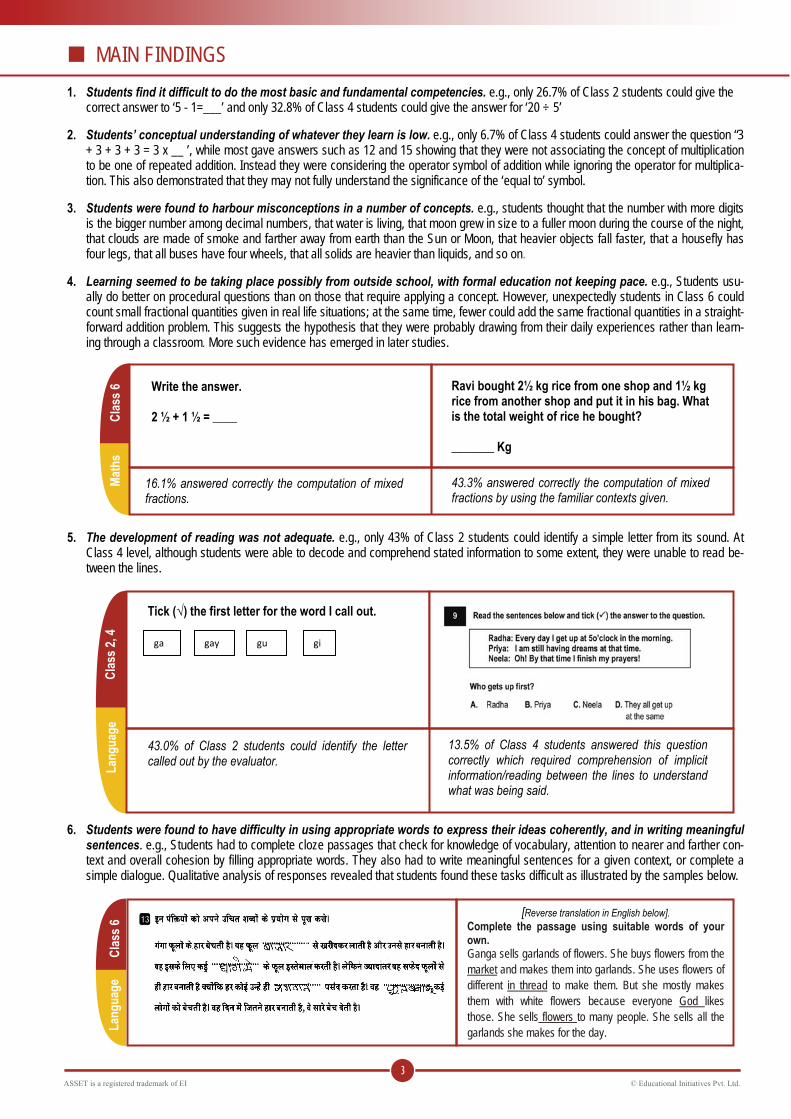
MAIN FINDINGS 1. Students find it difficult to do the most basic and fundamental competencies. e.g., only 26.7% of Class 2 students could give the
correct answer to ‘5 - 1=___’ and only 32.8% of Class 4 students could give the answer for ‘20 ÷ 5’
2. Students’ conceptual understanding of whatever they learn is low. e.g., only 6.7% of Class 4 students could answer the question “3 + 3 + 3 + 3 = 3 x __ ’, while most gave answers such as 12 and 15 showing that they were not associating the concept of multiplication to be one of repeated addition. Instead they were considering the operator symbol of addition while ignoring the operator for multiplica-tion. This also demonstrated that they may not fully understand the significance of the ‘equal to’ symbol.
3. Students were found to harbour misconceptions in a number of concepts. e.g., students thought that the number with more digits is the bigger number among decimal numbers, that water is living, that moon grew in size to a fuller moon during the course of the night, that clouds are made of smoke and farther away from earth than the Sun or Moon, that heavier objects fall faster, that a housefly has four legs, that all buses have four wheels, that all solids are heavier than liquids, and so on.
4. Learning seemed to be taking place possibly from outside school, with formal education not keeping pace. e.g., Students usu-
ally do better on procedural questions than on those that require applying a concept. However, unexpectedly students in Class 6 could count small fractional quantities given in real life situations; at the same time, fewer could add the same fractional quantities in a straight-forward addition problem. This suggests the hypothesis that they were probably drawing from their daily experiences rather than learn-ing through a classroom. More such evidence has emerged in later studies.
5. The development of reading was not adequate. e.g., only 43% of Class 2 students could identify a simple letter from its sound. At Class 4 level, although students were able to decode and comprehend stated information to some extent, they were unable to read be-tween the lines.
6. Students were found to have difficulty in using appropriate words to express their ideas coherently, and in writing meaningful
sentences. e.g., Students had to complete cloze passages that check for knowledge of vocabulary, attention to nearer and farther con-text and overall cohesion by filling appropriate words. They also had to write meaningful sentences for a given context, or complete a simple dialogue. Qualitative analysis of responses revealed that students found these tasks difficult as illustrated by the samples below.
[Reverse translation in English below]. Complete the passage using suitable words of your own. Ganga sells garlands of flowers. She buys flowers from the market and makes them into garlands. She uses flowers of different in thread to make them. But she mostly makes them with white flowers because everyone God likes those. She sells flowers to many people. She sells all the garlands she makes for the day.
Tick ( ) the first letter for the word I call out.
43.0% of Class 2 students could identify the letter called out by the evaluator.
13.5% of Class 4 students answered this question correctly which required comprehension of implicit information/reading between the lines to understand what was being said.
Ravi bought 2½ kg rice from one shop and 1½ kg rice from another shop and put it in his bag. What is the total weight of rice he bought? _______ Kg
Write the answer. 2 ½ + 1 ½ = ____
16.1% answered correctly the computation of mixed fractions.
43.3% answered correctly the computation of mixed fractions by using the familiar contexts given.
ga gay gu gi
Clas
s 2, 4
La
ngua
ge
Lang
uage
Cl
ass 6
Cl
ass 6
Ma
ths

© Educational Initiatives Pvt. Ltd.4
ASSET is a registered trademark of EI
MAIN FINDINGS (Continued...)
7. Significant differences between achievement of boys and girls were found. In Language, girls seemed to perform significantly better than boys in all classes, while in Maths and EVS boys seemed to perform significantly better than girls in both Class 4 and 6. The results are consistent with other research findings quoted in literature world wide where girls perform better than boys in Language but not in Maths and Science. This could also be attributed to the effect of conditioning in the society which expects girls to do well in arts and boys to excel in Maths and Science.
8. Similar gaps in understanding exist across all school systems in India in certain concepts. Comparison of common questions
used across different studies conducted by Educational Initiatives revealed the existence of similar conceptual gaps across school sys-tems. For example, the measurement question used in Maths papers in three different studies, namely the ‘Student Learning in Met-ros’, the ‘Andhra Pradesh Randomised Evaluation Study’ and this study (MSB) that looked at student learning in the best English me-dium private schools, AP rural govt schools, and urban municipal schools respectively, showed that a large proportion of students chose similar wrong answers in the tests in all the schools. This indicates that faulty understanding and methods percolate to all sys-tems.
Class 4 Maths Comparison of Identical/Similar Question in Different Studies Undertaken by EI
Answers given by Student (%)
Metro1 Study The length of this pencil is about________. A. 4cm B. 5cm C. 6cm D. 7cm
77.0% of students answered incorrectly as 6cm
APRESt2 What is the length of the line drawn next to the ruler?
Answer % 6 cm 6.24 7 cm 36.9
Any other Answer 29.8 Not attempted 26.9
36.9% of students answered incorrectly as 7cm
MSB Study How long is the pencil shown in the picture? (use the scale shown in the picture)
Ans: ____cm
Answer % 5 cm 7.5 6 cm 72.3
Any other Answer 11.7 Not attempted 4.5
73.0% of students answered incorrectly as 6cm
1 Metro Study was a study carried out by Educational Initiatives and covered the top schools of India in five of the largest metros – Delhi, Mumbai, Kolkata, Chennai and Ban-galore. These are schools that are English medium and mostly run and managed completely privately. These schools generally cater to the upper middle class of India. The full report is available in http//:www.ei-india.com 2 APRESt is a study that is conducted by Educational Initiatives in association with Harvard University, World Bank, Govt. of Andhra Pradesh and Azim Premji Foundation. In this study Educational Initiatives does the test design, development and analysis. The Study covers about 100,000 primary school students across rural Andhra Pradesh. More could be read about it in http://www.ei-india.com
Complete the following conversation between Leela and the Shopkeeper using your own words/ sen-tences. Leela: Do you have pencils available in your shop? Shopkeeper: Yes, is there. This is my shop. Leela: I want one pencil. Shopkeeper: want only one Leela: How much does this pencil cost? Shopkeeper: This pencil are for one rupees. Leela: Here, take 4 rupees. Shopkeeper: <Student response not clear>. Leela: No, I do not want anything else. Shopkeeper: Ok, come whenever you need to buy pencils.
Lang
uage
Cl
ass 6

© Educational Initiatives Pvt. Ltd.5
ASSET is a registered trademark of EI
COMPARATIVE PERFORMANCE OF STATES
Andhra Pradesh performed the best among all states in all classes tested in Language and Maths, (except Class 6 Maths in which they were better than interstate average). However, Andhra Pradesh showed the least performance among all states in EVS in Classes 4 and 6. Further investigations at question level showed that the AP gain was primarily in questions that were straightforward and procedural and the students of the state were underperforming in higher order competencies and conceptual questions.
Gujarat performed better than interstate average in Class 2 in both Language and Maths, while lesser than interstate average in all other classes and subjects.
Rajasthan performed the best compared to all states in Class 4 EVS and better than interstate average in Class 6 EVS. Chhattisgarh performed the best among all states in Class 6 Maths and EVS. Uttaranchal performed the least compared to all states in all classes tested in Language and Maths.
- higher than interstate average; * - Best performance among the states; x - Least performance among the states; L – Language; M –
Maths; E - EVS
MISCONCEPTIONS AND COMMON ERRORS IN STUDENTS ‘Misconceptions’ are concepts that students acquire which are not in line with or do not match the conventional expert view in that topic while ‘Common errors’ are often made by students who have not acquired the correct facts and mastery in the skills tested. Both miscon-ceptions and errors students commonly make are revealed by a detailed analysis of student responses to the different options used in the questions. A few of the misconceptions captured in the study are highlighted below:
Questions Option Percentage Which of these is a living thing?
A. water B. grass C. a car D. a magnet
Class 4 A % B % C % D % Rajasthan 41.6 17.7 13.1 15.3 Chhattisgarh 36.6 21.2 9.5 11.6 Andhra Pradesh 46.4 13.9 10.5 19.8 Gujarat 28.1 23.2 14.1 13.4 Uttaranchal 30.7 28.2 11.9 16.8 Inter State 36.0 19.3 11.8 15.0
Most students thought that water is a living thing.
If the shape of the moon at 7 in the night is like this,
what will it be at 11 on the same night?
Class 6 A % B % C % D % Rajasthan 25.4 33.2 15.1 20.2 Chhattisgarh 11.9 49.2 15.7 19.4 Andhra Pradesh 19.3 35.9 10.1 28.2 Gujarat 29.1 34.7 13.8 14.8 Uttaranchal 15.6 51.7 7.8 16.1 Inter State 20.9 39.3 13.5 20.2
Most students think that moon grows to full size during the night.
Who among these was a great ruler in India’s history?
A. Mahatma Gandhi B. Bhagat Singh C. Ashoka D. Dhirubhai Ambani
Class 6 A % B % C % D % Rajasthan 59.2 15.2 15.5 4.0 Chhattisgarh 59.7 19.9 14 3.6 Andhra Pradesh 54.3 7.4 30.6 1.5 Gujarat 73.4 12.1 4.5 4.0 Uttaranchal 61.1 11.1 13.3 3.9 Inter State 62.2 13.7 15.5 3.3
Most students think that Mahatma Gandhi was a great ruler.

© Educational Initiatives Pvt. Ltd.6
ASSET is a registered trademark of EI
SCALE ANCHORING – BENCHMARKS OF WHAT STUDENTS KNOW AND DO In an approach that moves away from focusing only on the overall achievement scores, the ‘scale anchoring’ methodology was followed to explain the performances in terms of what students know and are able to do at each of the MSB 2007 national benchmarks of achievement - top 10%, upper quarter, median, and lower quarter. Language, Maths and EVS Benchmarks for classes 2, 4, & 6 are available in full report. Classroom experience - as well as assessment results - clearly shows that students perform at different levels of achievement. Students can even be grouped based on their levels of performance. Neither of these, however, provides us concrete steps on what can be done to help students performing at lower levels. If we could know firstly, whether there are specific topics or concepts which students at lower levels of learning are systematically answering incorrectly, and if so, what they are, then remediation could focus on those topics. That is what Scale Anchoring provides, in an extremely scientific manner. The results clearly show which concepts or topics are understood only by students performing at higher levels and which topics are understood by other students also. Certain topics are said to ‘anchor’ at certain percentile levels of performance (25, 50, 75, 90 percentiles). Insights provided by the Scale Anchoring process can help us under-stand the way children learn and plan appropriate remediation. For example, the students in 90th percentile could write a dictated sentence with 5-6 words correctly without spelling error which students in 75th and lower percentiles could not do.
Low Benchmark (students reaching 25th percentile) 25th Percentile IRT Scaled Score: 447 Knows names for objects not seen in daily life, matches pictures with their names and their correct spellings. Uses appropriate words (adjec-tives, names of feelings/emotions) and completes a given sentence meaningfully. Reads very short stories independently and is able to answer simple factual questions. Follows complex oral instructions and is able to do as directed. Intermediate Benchmark (students reaching 50th percentile) 50th Percentile IRT Scaled Score: 507 Reads a given sentence and is able to use grammatically correct words with appropriate verb endings (gender) to complete sentences. For a given context, writes few meaningful and grammatically correct sentences independently. High Benchmark (students reaching 75th percentile) 75th Percentile IRT Scaled Score: 563 Uses appropriate words for denoting number and is able to complete sentences meaningfully. Reads very short stories independently and is able to answer questions which require analysis and inference. Reads and interprets stated information given in authentic material such as bottle labels. Listens to sounds in a word and is able to write words with conjoint letters correctly. Advanced Benchmark (students reaching 90th percentile) 90th Percentile IRT Scaled Score: 613 When dictated, writes sentences that have 5-6 words with correct spelling. .
Scale anchoring is a two-part process. First, the achievement data is analysed for each scale to identify items that students scoring at each anchor point answer correctly. Second, subject matter experts examine the knowledge shown by correct responses to the anchor items, summarise student’s understandings for each anchor point, and select example items to support the descriptions.

© Educational Initiatives Pvt. Ltd.7
ASSET is a registered trademark of EI
BACKGROUND FACTORS ASSOCIATED WITH LEARNING Background questionnaires were used to collect information related to the student, teacher and school and analysed to yield insights on relationships, if any, between these variables and student performance.
1. Infrastructure and Learning Resources - Student performance is not significantly impacted by school infrastructure and learning re-sources such as library and the presence of computers.
2. Type of School - There was no significant differences in performances due to it being a boys’ school, girls’ school or a co-ed school.
Head Teacher’s Background - Head teacher’s competence due to qualification, training and experience was seen to impact the stu-dent performance significantly while some of the variables like age, gender, in-service training, experience as head teacher and duration of stay at a particular school for the head teacher do not impact the student performance. a. Qualification (Significant) – Schools whose head teacher has a graduate or post-graduate degree had a better student performance
than schools that had head teachers with lower qualification. b. Pre-Service Training (Significant) – Students whose head teachers had M.Ed, B.Ed or Diploma showed better student performance
than students whose (head) teachers affirmed any other and no pre-service training. c. Teaching experience before becoming Head teacher (Significant) – The student scores in schools with head teacher, in an experi-
ence bracket of 1-5 years were significantly higher than the schools with head teachers with very long experience of up to 25 years or without any experience.
d. Position of starting one’s career (Significant) – Schools where the head teacher started her/his career as a head teacher or as a permanent teacher had significantly better performance than those where the head teacher was from the position of contract teach-ers, para teachers / helper teachers.
3. Teacher Beliefs – in comparison to female teachers, male teachers are more likely to say that strict discipline is necessary for proper
teaching, that there can be no discipline without fear, that a teacher loses respect if they joke around with students and that inattentive students should be physically punished. Female teachers also think that that all children are capable of learning.
4. Relationship between Teacher Gender and Learning Outcomes – Female teacher classrooms tend to perform better in language but
there are no such benefits for mathematics. Furthermore, these data do not show any evidence of specific beneficial effect for girl chil-dren in the presence of a female teacher. Equally importantly, the findings seem to indicate that the benefits of female-headed class-rooms over male-headed classrooms may be limited to specific sub-groups of teachers such as the early-career teachers with fewer years of experience.
ONLINE DATA AVAILABILITY
Assessment data for the study is available online. The data can be drilled down state-wise, town-wise, school-wise, student-wise, gender-wise, skill-wise subject-wise for Language, Maths and EVS and class-wise for classes 2, 4 and 6. The skill wise reports also have the question paper blue print which shows question-to-skill mapping for each question. The data can be seen question-wise, which enables identifying the difficult and easy questions and the answers student gave for them – this can be used for classroom remediation. The data is available in public domain and can be ac-cessed by following the link as given below http://www.educationalinitiatives.com/msbonline/msb_main_screen.php
REFERENCES 1. Adams, R.J., Wu, M.L., & Macaskill, G. (1997), “Scaling Methodology and Procedures for the Mathematics and Science Scales” in
M.O. Martin and D. L. Kelly (Eds.), TIMSS Technical Report Volume II: Implementation and Analysis. Chestnut Hill, MA: Boston College.
2. Chudgar, A., Sankar. V., (2008), “The relationship between teacher gender and student achievement: evidence from five Indian States”, Routledge, Vol. 38, No. 5, October 2008, 627 – 642.
3. Educational Initiatives (2006), “Student learning in Metros”. 4. Hanushek E. A., & Woesmann L. (2007), “The Role of Education Quality for Economic Growth”, Policy Research Working Paper Series
4122, The World Bank. 5. Reddy, S. (2004), “Status of learning achievements in India: A review of empirical research.” Bangalore: Azim Premji Foundation.

© Educational Initiatives Pvt. Ltd.8
ASSET is a registered trademark of EI
ABOUT EI Educational Initiatives carried out the Municipal School Benchmarking Study (MSB) with the support of ICICI Bank. This was a research study to understand how well students are learning in the local body schools of 30 large urban towns in 5 states – Andhra Pradesh, Gujarat, Rajasthan, Chhattisgarh and Uttarakhand. Over 35000 students in about 300 local body schools were administered the tests. 3600 students in 30 low cost private schools in Hyderabad, Ahmedabad and Roorkee were also tested. Students were tested in Language, Maths and EVS in classes 2, 4 and 6. The tests were conducted in February 2007. The full re-port is available at http://www.educationalinitiatives.com/msb. Data is available online at http://www.educationalinitiatives.com/msbonline/msb_main_screen.php We are an educational research organization that focuses on learning research through assessments. EI has been started by a group of IIM Ah-medabad alumni with first-hand experience of setting up and running educational institutions. It has been formed with a mission to work towards qualitative improvement in India’s educational system and our vision is “A world where children everywhere are ‘Learning with Understanding’”. PROJECTS OF EI: Andhra Pradesh Randomised Evaluation Study (2004 onwards): Conducted in partnership with Harvard University, Azim Premji Foundation, World Bank and the Government of Andhra Pradesh, this is a longitudinal study across 8-9 years and covers currently 100,000 elementary school kids and measures the impact of various inputs (e.g., block grants, additional teachers) with outcome-based teacher incentives. Assessment of Student Learning in Sarva Shiksha Abhiyan – RGSM, Chhattisgarh (2008 onwards): The test was developed in Hindi and administered to approximately 3 lakh students in about 1900 schools in 16 districts in Chhattisgarh state. The tests have already been conducted for students of class 3 to 8 for Language and Maths and the report submitted to RGSM. Municipal School Benchmarking Study (2004-2007): Supported by ICICI Bank, this study assessed learning in 35,000 municipal school students from class 2, 4 and 6 across the 6 biggest towns in each of the states - Gujarat, Andhra Pradesh, Rajasthan, Chhattisgarh and Uttarakhand. UNICEF Learning Assessment Study for Quality Education (2005-2006): Assessed mathematics and language acquisition among primary school children in the UNICEF quality package schools in 13 states of India. The tests were standardised across 9 languages and involved a very intricate development cycle involving language experts from all over India. Teacher Needs Assessment (2008 onwards): is a census study that has been initiated by the Royal Education Council, Government of Bhutan. In this project all teachers of Bhutan are assessed for their general ability, competence in subject knowledge and pedagogical practices. Student Learning Study (2008-2009): Supported by Google.org, this study is currently ongoing and assesses student learning in 21 states of India. Nearly 160000 students in classes 4, 6 and 8 are tested for learning in Language and Maths in rural and urban govt. schools. EI’S PRODUCTS AND LEARNING SOLUTIONS: ASSET: is an objective-type, multiple-choice test for students of Classes 3 to 10. It is a scientifically designed, skill based assessment developed in India for Indian schools. It assesses students’ level of proficiency in the skills and concepts underlying the school syllabus and provides them feed-back about their strengths and weaknesses. Know more about ASSET at www.ei-india.com Mindspark: is a computer based self-learning programme that helps the child improve her skills. It allows each student to follow a learning path that is based on her need. Mindspark is currently available for Maths for classes 1-10 in English version. Mindspark can be accessed at www.mindspark.in. Rural Mindspark: The Hindi version is currently available on demand for some Maths modules. Contact EI to know more about other language versions and modules.
Some Partners / Clients Google Inc. Government of Andhra Pradesh Michael and Susan Dell Foundation Rajiv Gandhi Shiksha Mission, Chhattisgarh Royal Government of Bhutan Suzlon Foundation WIPRO Applying Thought World Bank UNICEF, India CONTACT DETAILS: Educational Initiatives Pvt. Ltd
Head Office Ahmedabad
Bangalore Office
Delhi Office
Hyderabad Office
Mumbai Office
613-615 JB Towers, Opp. Doordarshan Tower, Drive-in Road, Ahmedabad 380054, INDIA Tel: 079 – 40269696, 40269625 Fax: 079-26841400
No.97, 2nd Floor, Robertson Road, Frazer Town, Bangalore-560005 INDIA Tel: 080 – 41657715, 64567049, 41237162
3rd Floor, Lakshey Deep Plaza, A-252A, Sant Nagar, East of Kailash, New Delhi-110065 INDIA Tel: 011-26462264, 40584952
Flat No 401/A, Shri S.K.Vihar, H.No:3-4-578/1, Beside Sri Chaitanya College, Narayanaguda, Hyderabad-500029, INDIA Tel: 040 – 32419534
Row House Number 1,Sea Coast 2, (Near Cidco Guest House), Kille Gaothan, Belapur, Navi Mumbai-400614 INDIA Tel: 022 - 32686329, 27561430
E-mail us at: [email protected] Website: www.ei-india.com March 2010


![[ET/EN/EJ/EX/ED/EI] Digital Communication rvidyalankar.org/upload/3_DC_Soln71114155950890.pdf · [ET/EN/EJ/EX/ED/EI] Digital Communication Time: 3 Hrs.] Prelim Question Paper](https://img.pdfslide.net/doc/110x75/5e1d0ae9ae3b7336db534123/etenejexedei-digital-communication-etenejexedei-digital-communication.jpg)