Embed Size (px)
Citation preview

Date: December 31, 2015
EIC Detector R&D Progress Report
Project ID: eRD_6_
Project Name: Proposal for tracking and PID detector R&D towards an EIC detector Period Reported: from July 2015 to December 2015
Project Leader:
Brookhaven National Lab: Craig Woody
Florida Tech: Marcus Hohlmann
Stony Brook University: Klaus Dehmelt, Thomas Hemmick
University of Virginia: Kondo Gnanvo, Nilanga Liyanage
Yale University: Richard Majka
Contact Person: Klaus Dehmelt
Project members
Brookhaven National Lab: B. Azmoun, M. L. Purschke, C. Woody
Brookhaven National Lab - Medium energy group: A. Kiselev
Florida Tech: M. Hohlmann, A. Zhang
Stony Brook University: K. Dehmelt, A. Deshpande, N. Feege, T. K. Hemmick
University of Virginia: K. Gnanvo, N. Liyanage
Yale University: R. Majka, N. Smirnov
Overview
The EIC facility and physics program will require developments in many areas at or
beyond the present state-of-the-art in detector technology. Key among these will be the
tracking systems and particle ID. Tracking technology spans a rather large phase space
of technology, each branch of which has various advantages (position resolution, small
radiation length, etc...). The physics program requirements will drive the community
both to the best existing technology choices as well as to the key areas wherein the state
of the art must be advanced. Often tracking technology serves intrinsic particle
identification functions or is most naturally paired with particular PID technologies. For
this reason tracking and PID technologies are often closely linked and should be
considered as a package rather than separately
The eRD6 Collaboration dates to the first round of EIC R&D funding and is among the
first of the so-called “Consortia” combining efforts and resources for tracking and PID
technologies across multiple institutions with similar interests and talents. The principle
goal of that program was to work toward a sector test of forward tracking prototypes
and PID during a single beam period. This sector test has already taken place in October
2013. Groups from Brookhaven National Lab, Yale University, University of Virginia,
Florida Institute of Technology, and Stony Brook University set up apparatus using four
of the six available stations at the Fermilab Test Beam Facility. This effort is the largest
to date at FTBF and was comprised of 19 detectors stations all of which worked
flawlessly and collected data over a three week period. BNL tested a minidrift detector
to demonstrate that this device can overcome the resolution degradation experienced by
most MPGD detectors for tracks impinging at large angles. Yale tested the so-called 3-
coordinate readout scheme which allows for reduced channel count from tracking
chambers by adding geometrical pattern recognition to the standard charge-matching
technique. UVA and Florida Tech tested multiple detectors including prototypes at
“full-size” EIC as well as channel-count reduction via the zig-zag charge division.
Stony Brook tested their compact RICH (1 meter radiator CF4 as compared to 3 meters
used by LHCb) to demonstrate clean hadron ID up to 32 GeV/c (highest available
secondary beam energy at FTBF).
The ongoing R&D is concentrating on improving the detector performances based on
experience obtained and introducing procedures for getting a better handling of the
detectors under consideration. New ideas are being investigated and play an important
role in the future development of detector R&D.

Past
What was planned for this period?
Brookhaven National Lab:
We planned to finish the analysis of all data from the minidrift detector, write up the
results and submit them for publication.
We planned to study the TPC portion of our prototype TPC/Cherenkov detector using
cosmic rays, radioactive sources and X-Ray sources. This was mainly to study the field
cage in various configurations, including determining HV breakdown thresholds, and
to study different gases in terms of their drift velocity and ability to operate with the
GEM detectors. We also hoped to start to study the Cherenkov part of the detector and
study its interplay with the TPC part of the detector. Also, while it was not initially
planned, we also started to investigate new readout patterns for the chevron readout
board for the TPC. These have so far been mainly calculations, but we hope to continue
these studies with actual detector tests.
Florida Tech:
Submit a paper to NIM on the results of the beam test of a large-area GEM with zigzag
readout strips, followed by a second paper on examining the geometric mean method
for resolution studies.
Set up the large zigzag GEM detector in our lab and measure its gain and uniformity
with an X-ray gun since the gain was actually not measured in the beam test.
Design frames, drift board, and readout board with improved zigzag strips for a
complete design of the next chamber prototype for the EIC forward tracker.
Study the performance of small GEM detectors with zigzag strip readout in a magnetic
field using our small table-top 1T magnet.
Stony Brook University:
We were planning to optimize the pad structures for charge dispersion.
Furthermore it was planned to work on refurbishing an in-house evaporator and
upgrading it to a high-vacuum device with appropriate instrumentation. This device is
foreseen to allow evaporating large mirror structures with protective and di-electric
coating. We are aiming on structures with sizes of about 1 m x 0.5 m area.
University of Virginia:
Submit the paper on the FTBF test beam results for publication in NIM A or TNS
peer-review journal
Continue the collaboration on the common GEM foil design with Florida Tech,
Temple University and Tech Etch Company.
Complete the design of the support frames and u/v readout board for EIC-FT-GEM
prototype II
Investigate the feasibility of large Cr-GEM foil with Tech-Etch and CERN.

Yale University:
3-Coordinate GEM
During the past period it was planned to complete the analysis and prepare a paper on
the results.
Hybrid Gain Structure for TPC readout – 2 GEM plus Micromegas (2-GEM+MMG)
During this period it was planned to make measurements on the 2-GEM+MMG gain
structure using resistive coatings or planes to reduce discharge probability and possibly
spread the signal spatially on the readout plane.
It was also planned to acquire wire planes and begin studies of the extended gated grid
structure proposed by Howard Weiman. i
A paper on the results on the 2-GEM+MMG studies with different gases was to be
prepared.
What was achieved?
Brookhaven National Lab:
The analysis of all the data from the minidrift detector is now complete. The results
have been written up and have been submitted for publication in the IEEE Transactions
on Nuclear Science. The paper was submitted in late August 2015 and is now under
review. We have received the first round of comments from the referees and will submit
our response by the end of this year. We therefore hope to have the paper published in
early 2016.
One additional analysis that was added just before submitting the paper for publication
was a study on the “ultimate” resolution one can achieve with the minidrift detector.
Our tests were hampered by limitations in the SRS readout system, which was not really
designed for any type of drift detector, but we nevertheless managed to extract excellent
position resolution from the data. We showed that by deconvoluting the pulse shape
from the time sliced data, it was possible to achieve a resolution well below 100 m
even at large angles. An example of these results taken from the paper is shown in
Figure 1.
Figure 1 Left: Correlation between the GEM residuals and the reference silicon telescope in the X and Y projections. Right: Projected resolution along the diagonal in Figure 1 left where the correlations between the X and Y coordinate measurements cancel out.

TPC/Cherenkov
The construction of the main part of the TPC-Cherenkov prototype detector has now
been completed and we have been studying the TPC part of the detector in the lab using
cosmic rays, radioactive sources and X-ray sources. We have studied the detector using
a variety of different gases, some of which would be useful only for operation as a TPC,
while others would be suitable for TPC/Cherenkov operation. The requirement for
TPC/Cherenkov operation is that the gas be transparent into the deep VUV in order to
achieve good photon detection efficiency, and that it also serve as the operating gas for
both the TPC and Cherenkov GEM detectors. This leads to mixtures involving CF4 and
Ar, both of which are transparent into the deep UV, as shown in Figure 2, and are also
gases that have been used to operate GEMs.
Figure 3 gives a compilation of a number of gases that could be used with the detector.
Mixtures of CF4 and Ar can provide a fast drift velocity at a relatively low electric field,
and would provide good transparency for TPC/Cherenkov operation. We have so far
studied Ar/CO2 (70/30), Ar/CO2/CF4 (80/10/10), Ar/CH4 (80/20), Ar/CF4 (95/5) and
pure CF4, and we plan to investigate several others gases in the coming months.
We also studied the operation of the TPC part of the detector in both the TPC only and
the TPC/Cherenkov configuration. Figure 4 shows the field cage which consists of a
double sided kapton foil with 4 mm copper strips. One part is a three sided foil that
remains a fixed part of the detector and the second part is a fourth side that is removable.
In the TPC only mode of operation, the fourth side is another kapton foil similar to the
Figure 2 Transparency of Ar and CF4 in the deep UV.
Figure 3 Compilation of drift velocities versus drift field for various gases that could be used for operating the TPC or combined TPC/Cherenkov detector.

other three sides. For operation as a TPC/Cherenkov, the fourth side is replaced by a
wire plane, shown on the right in Figure 4, which consists of 75 m wires spaced 1 mm
apart that are connected in groups of four and held at the same potential in order to
achieve the same field gradient as the copper strips on the kapton foil.
Figure 5 shows cosmic ray tracks found in the detector operating in Ar/CH4 (80/20)
using both the four sided kapton foil field cage and with one sided wire plane. Well
reconstructed cosmic ray tracks were found in both configurations. The length of the
reconstructed track was limited by the number of time samples that could be collected
with the SRS readout system, and by the relatively slow drift velocity of the gas that
was used. The distortions at the ends of the reconstructed tracks, which occur in both
configurations, we believe are caused by effects in the track reconstruction algorithm
and are not due to distortions of the field caused by the wire plane. Figure 6 shows the
correlation in the angle of the cosmic ray tracks measured with the TPC and the angle
Figure 4 Left: Kapton foil field cage showing three sided foil with fourth side removed. Right: Fourth side wire plane that is used for Cherenkov operation.
Figure 5 Cosmic ray tracks found in the TPC portion of the detector operating in Ar/CH4 (80/20). Left: Four sided kapton foil field cage, Right: Field cage consisting of three sided kapton foil and one side of wires.
Figure 6 Correlation between the angles of cosmic tracks measured in the TPC versus the angle of the track determined by the cosmic ray trigger counters.

measured by the cosmic ray trigger counters, which shows that the angle measured with
the detector is well correlated with the true angle.
We also measured cosmic ray tracks using pure CF4. This is an ideal gas for Cherenkov
operation and was used very successfully in the PHENIX HBD. Figure 7 shows the
distribution of cosmic ray tracks measured with the TPC operating in pure CF4 over a
range of angles selected by the trigger counters. Again, a good correlation of the tracks
measured in the detector was observed.
Florida Tech:
Publishing R&D results
We submitted an article on the 2013 beam test at the Fermilab Test Beam Facility
(FTBF) to NIM A. The paper was recently accepted for publication. As of the time of
writing this report, the article is in press.
We reported the overall status of R&D on forward tracking (FT) detectors for the EIC
at the 2015 IEEE NSS/MIC conference in San Diego and submitted a conference
record. This talk and paper covered the combined R&D of the eRD3/eRD6 FT groups
(Fl. Tech, Temple U., U. Virginia).
Gain and uniformity measurements for the 1-m long GEM detector
We measured the gas gain and response uniformity for the 1-m long GEM detector that
was tested at Fermilab in 2013 in our lab at Florida Tech. The X-ray gun (AMPTEK
Mini-X X-ray generator) was pointed at 30 “holes” (3 rows, 10 columns) on the back
of the drift board where the PCB had been machined down previously to reduce the
material (Figure 8).
Figure 7 Distribution of angles of cosmic ray tracks measured in the TPC operating with pure CF4 and the detector configured with the wire plane for TPC/Cherenkov operation.

Figure 9 shows the gain and counting rate measured for the 1-m long GEM detector
using signals picked up from the bottom of GEM3. The X-ray gun was set at 30 kV and
Figure 8 Setup for measuring gain and uniformity of the 1-m long GEM detector with X-rays.
Figure 9 Measured gas gain and counting rate at selected positions vs. current through the HV divider that supplies the GEM potentials for the 1-m long GEM detector.
Figure 10 Response uniformity (left) and relative energy resolution uniformity (right) for the 1-m long GEM detector based on the measured pulse height spectrum.

5 μA. We obtain fairly consistent gain curves and rate plateaus, and the gain reaches
3×10⁴ in Ar/CO2 70:30. Figure 10 shows the response uniformity and energy resolution
uniformity measured from the position and width of the 8 keV copper fluorescence peak
in the pulse height spectra. We observe the highest response at holes in column 10 at
the small end of the detector and near the gas inlet. This could be due to either a small
gas leak in the detector that causes some O2 contamination near the outlet region which
reduces the gain there, or due to a known slight deformation of the PCBs so that column
10 has smaller gas gaps. Overall, the response uniformity is measured to be 20% (rms)
(Figure 11).
Design of frames, drift, and readout for the next FT GEM prototype chamber
We described the common EIC GEM foil design in our last report. Kondo Gnanvo
(U.Va.) worked with the CERN workshop to add the actual GEM holes to our design.
That completes the common GEM foil design.
To assemble a GEM chamber from the common GEM foils, Florida Tech intends to use
the mechanical stretching technique that was pioneered by the CMS GEM collaboration
for the CMS muon endcap upgrade. The original mechanical stretching technique uses
a stack of 3 GEM foils and puts the drift electrode and readout structures on solid
printed circuit boards (PCBs). However, this results in significant amount of material
within the active detector area, which is not optimal for EIC tracking purposes. The
potential problems are multiple Coulomb scattering of charged particles and a non-
negligible probability for electron showering in the material, which causes systematic
effects in the measurement of scattered electron momenta that can be hard to track.
Consequently, we modify the original mechanical stretching technique by designing a
stack of 5 foils (3 GEM foils, 1 drift foil, and 1 readout foil) that is sandwiched between
two outer frames made of stiff material and stretched against posts that are also
sandwiched between the outer frames. Both frames will have thin windows, e.g. made
from 100 μm aluminized mylar foil, so that the material in the active detector area is
minimized. High-strength but low-mass material such as carbon fiber will be
investigated for the frames since PCB frames may not be strong enough to hold their
shapes under the stress required to stretch the foils. An outer frame surrounding all posts
will seal the gas volume.
Figure 11 Measured overall response uniformity for the 1-m long GEM detector using 30 irradiation spots (rms/mean = 69.1/339.4 = 20.4%).

We have produced a complete CAD drawing (Figure 12) for this modified stretching
technique. Designs of frames and posts have been completed in AutoDesk Inventor.
The drift foil design, which contains just a solid copper surface and an HV pad, and the
readout foil design, which is quite complex, have both been completed in Altium.
For the readout, we again use zigzag strips to minimize the number of required
electronic channels while preserving good spatial resolution. In our previous zigzag
design (Figure 13, left), the locations of the tips on a zigzag strip were constrained by
only two reference lines with limited interleaving of zigs and zags giving rise to a
central “spine” on each strip in the actual physical implementation on the PCB. This
resulted in a nonlinear response when constructing hit positions from the charge
centroid method. Inspired by Alexander Kiselev’s efforts to optimize the zigzag strip
structure (see below), the new design for the second FT GEM prototype will feature
zigzag strips with tips that will reach the center lines of their neighboring strips (Figure
Figure 13 Two types of zigzag strips running radially; the zigzag strip on the left shows that tips on one strip do not exceed two reference lines, while on the right the tips of a zigzag strip reach the centers of its neighboring strips.
Figure 12 CAD drawing showing the Triple-GEM detector design to be assembled with the modified mechanical stretching technique. Five foils (red) are sandwiched between small inner frame pieces (olive green) that get stretched against posts (brown). The posts themselves are to be sandwiched between large stiff outer frames (not shown) to provide mechanical stability.

13, right). This should optimize the charge sharing and give a more linear response
across the entire strip.
Figure 14 shows an overview of the full readout design for the EIC-FT-GEM-
Prototype-2. We divide the readout area into five radial regions. In sector 1 at smallest
radius, which extends 12 cm in radius, we use 128 straight strips in order to achieve
best spatial resolution and lowest occupancy since the sector width here is quite small
(~4 cm); here the angular pitch of the strips is 4.14 mrad. Sector 2 also has a radial
length of 12 cm, but is read out with 128 zigzag strips (also 4.14 mrad angular pitch).
Sectors 3-5 have a radial length of ~22 cm each and 384 zigzag strips, so the angular
pitch in the three sectors is 1.37 mrad. Nine APV hybrids (1152 channels) placed at the
wide end of the trapezoid suffice to read out the entire detector.
Another objective of this new design is to place all readout electronics at the wide end
of the detector. Routing of traces from the readout strips to Panasonic connectors that
the APV hybrids can plug in at the wide end proved to be quite complicated due to the
special strip arrangement. Based on a 2-layer PCB design sketch, vias (or via-like holes)
must be used. Figure 15 shows the finalized routing scheme. In this design, 50 μm
diameter vias are used. There are 128 vias each for Panasonic connectors 2-8, and 64
Figure 14 The readout design for the EIC-FT-GEM-Prototype-2 with five different sectors. Sector 1 has straight strips and the other sectors feature zigzag strips. All strips run radially. Design details are shown in zoomed-in views of three different sector transition regions on the right.

vias each for Panasonic connectors 1 and 9; so the total number of vias near the
Panasonic connectors is 128 × 7 + 64 × 2 = 1024. There are an additional 640 vias
in the region outside the frames, and 896 vias on the readout strips. The total number
of vias required is 1024+640+896=2560.
High-resolution scans of zigzag readout board responses
In order to better understand the performance of zigzag strips, we scanned zigzag strip
readout boards installed in a 10cm × 10cm Triple-GEM detector with an X-ray gun
mounted on a 2-D movable stage at BNL (Figure 16). The X-ray output energy is 5.9
keV and the beam is collimated by a slit of 0.05 mm by 8 mm giving a typical rate of a
few Hz. The X-ray gun is mounted on a 2-D motorized stage which can be moved with
a very small step size (~1 μm) in both X and Y directions.
Figure 15 Routing of traces from readout strips to Panasonic connectors at the wide end of the trapezoid foil, based on a 2-layer PCB design in Altium. The traces in red are on the top surface (same as the readout strips), while traces in blue are on the bottom surface. The top (bottom) plot shows views from the top (bottom) surface.

We scanned two zigzag boards; one board has 30 strips and the other one has 48 strips.
The zigzag strips on the two boards run radially and are equivalent to the geometry of
the zigzag readout of our first 1m-prototype detector at different R coordinates
corresponding to the narrow and wide ends of the trapezoid (R=1420-1520 mm for the
48-strip board, R=2240-2340 mm for the 30-strip board). The angular pitch of the
zigzag strips is 1.37 mrad for both boards. These boards were designed following the
idea shown in Figure 13 (left). Figure 17 (left) shows the zigzag strip design for the 48-
strip board. After the boards were produced by a PCB factory (American Circuit Inc.),
we noticed that the “spine” on the center of each strip were considerably thicker (Figure
17, right) because the tips and valleys are not as sharp in reality as in the design. The
same applies to the zigzag readout board of the first 1-m prototype detector.
In the summer, the two Florida Tech zigzag boards were mounted (one board at a time)
on a BNL 10 cm × 10 cm triple-GEM detector and were scanned with X-rays at BNL
by Bob Azmoun and Mike Phipps. The gas gaps of the detector were
5.63/1.34/1.54/1.53 mm and Ar/CO2 70:30 was used.
For each board, scans were performed along the azimuthal direction at three different
R coordinates. At each R, a 10 mm range was scanned with a 0.1 mm step; in each run
Figure 16 Setup for scanning a 10 cm × 10 cm GEM detector with an X-ray gun at BNL. The motorized stage can be moved in both X and Y directions with a minimal step size of about 1 micron.
Figure 17 Zigzag strips as originally designed (left) and as actually produced by a PCB factory (right) for the 48-strip board. On the right picture, the two indicated dimensions are: strip pitch (vertical tip to tip distance) 2.26 mm and zigzag period (horizontal tip to tip distance) 0.528 mm.

5k events were collected. The drift field in this configuration was 1 kV/cm, transfer and
induction fields were 3 kV/cm. The detector was read out with an APV25 chip and data
were taken with the Scalable Readout System (SRS). The detector was operated at
higher gas gain for most of the runs, which unfortunately caused APV saturation. Only
30 runs for the 30-strip board were taken at lower gain. Looking at the data, we observe
that the hit position reconstructed with the centroid method is not a linear function of
the X ray position (Figure 18). In certain regions near the “spine” of the strips,
corresponding to the flat parts on the curves in Figure 18, the readout is actually not
sensitive to the X-ray positions. It is unclear if that was entirely due to the intrinsic
behavior of the zigzag readout or if it is related partially to a saturation of the APV25
chips.
Figure 18 Measured hit centroid vs. X-ray position on the 30-strip board. Note that the X-ray position is not aligned so that the curves are not diagonal.
Figure 19 Setup for scanning zigzag readout boards with Struck ADCs at BNL.

In order to avoid saturation effects, Aiwu Zhang scanned the two zigzag boards at BNL
again in November using individual preamp/shaper circuits and three VME-based
ADCs (Struck SIS 3300/3301) with larger dynamic ranges. Each ADC has 8 channels
with two of the ADCs providing 12-bit resolution and the third ADC allowing 14-bit
resolution. Figure 19 shows the logic of using the Struck ADCs for reading out the
detector. Each channel was calibrated by injecting a test pulse into the preamplifier; all
channels showed very good linear response and large dynamic range, so that saturation
was not a problem anymore. Figure 20 shows a typical calibration curve for one of the
ADC channels, which allowed us to measure the actual full charge of a signal.
Table 1 Scan scenarios for the different readout boards at BNL.
Gas gap
configuration
Readout
strips
Applied voltages and
fields
Scanned scenarios
15.6/1.7/ 1.7/2.2 mm
COMPASS-style 2-D
straight strips
Ed=0.75 kV/cm
Et=Ei=3 kV/cm
VGEM=380V
Along X: 41 runs with 100 μm step; 35 runs with 50 μm step.
Along Y: 61 runs with 100 μm
step; 25 runs with 50 μm step.
3/1/2/1 mm 30 radial
zigzag strips
HV divider:
1/0.5/0.5/0.45/1/0.45
/0.5 MΩ
Along X: 38 runs with 100 μm
step.
Along Y: 21 runs with 100 μm
step; 10 runs with 100 μm step at another φ coordinate on the
board.
3/1/2/1 mm 48 radial zigzag strips
Ditto. Along X: 51 runs with 100 μm step.
Along Y: 21 runs with 100 μm
step.
Figure 20 Calibration curve for the first channel of the 14-bit Struck ADC.

In Table 1, we summarize the scans that were performed by Aiwu Zhang in November
with help from our BNL colleagues. We first took data with a standard 2D COMPASS
readout board where the gas gaps of the GEM detector had a non-standard
15.63/1.70/1.69/2.16 mm configuration. These data were mostly used for
commissioning the system and the GEM detector. Then we scanned the 30-strip and
48-strip zigzag boards using the GEM detector with standard 3/1/2/1 mm gas gaps.
These scans were done along the standard X and Y directions of the scanner. Scans
along X were across the zigzag strips in azimuthal direction; scans along Y were along
the zigzag strips in R direction. We took 10k events for each point to ensure sufficient
statistics for analysis.
We have taken a very first look at the November data with an online monitoring
program. Figure 21 shows two typical events from one run when the X-rays were aimed
at a position between two strips. These events mostly have a strip multiplicity of two as
expected. For the same run, we observe a charge spectrum with distinct photopeak and
escape peak on one strip (Figure 22, left), but we find only one peak on the other strip
(Figure 22, right). When the X-ray position is closer to the strip on the left, more charge
is induced on that strip and the deposited energy appears to be better resolved. We
observe that the situation is reversed when the X-ray gun is moved ~0.5 mm to the right.
Then the main peak and escape peak appear in the spectrum for the right strip, but only
one peak appears in the spectrum for the left strip.
Figure 21 Measured pulse charges in two typical events when aiming the X-rays between two strips on the 30-strip zigzag board.
Figure 22 The spectra measured by the two individual strips in a run for the 30-strip board.

Stony Brook University:
The results of the successful tests and its performance of the RICH prototype in two
test-beam campaigns have been published in an IEEE-TNS publication and the results
were presented at the 2015 IEEE Nuclear Science Symposium.
Working on refurbishing the evaporator has begun. In the initial stage it was estimated
how well the vacuum has to be in order to reliably perform evaporation of MgF2 on
mirror blanks. This will determine the type and power of vacuum pumping for the
evaporator. We are discussing and sketching with local workshop experts modifications
to the housing of the evaporator for inserting larger mirror blanks with minimum breach
of vacuum, e.g., by introducing an antechamber. In addition, investigations about
supporting and moving the larger mirror blanks within the evaporator to obtain a
homogenous deposit of the protective and dielectric layer are ongoing and the
acquisition of instrumentation to monitor the deposit process. The idea of smoothing
surface areas due to unevenness of layer deposition with the help of ion bombardment
has been introduced and is being looked after.
University of Virginia:
Published paper: Our paper on the performances in test beam of the EIC-FT-GEM
prototype I was submitted in September 2015 to NIMA and published in November
2015.
K. Gnanvo et al., “Performance in Test Beam of a Large-area and Light-weight
GEM detector with 2D Stereo-Angle (U-V) Strip Readout”, Nuclear Inst. and
Methods in Physics Research, A 808 (2016), pp. 83-92.
The paper report the results from the analysis of the FTBF test beam data in terms
of the response uniformity and efficiency higher than 95% over the large area
chamber, with a measurement of the angular resolution of 60 μrad in the azimuthal
direction and position resolution better than 550 μm in the radial direction, achieved
with the U–V strip readout.

The common GEM foil design: The collaboration with Florida Tech and Temple
University on the common GEM foil design for EIC-FT-GEM prototype II is still
ongoing and very active.
The common GEM foil design was submitted to the expert at CERN PCB workshop
for validation. Suggestions from CERN experts were implemented and finally, the
GEM holes scheme was added. The design is now completed and the common GEM
foil is ready for fabrication. Figure 23 shows the picture of the Gerber file of the
common GEM foil with an emphasis on the UVa implementation of the HV
electrodes and protective resistances.
2D U-V strips readout: The left picture of Figure 24 shows the basics parameters
of the new readout board. The board is a flexible double-layer printed circuit board
(PCB) with a U–V strip pattern, based on the same 50 μm thick copper-clad
Figure 23 Common EIC GEM foil with the UVa HV electrode scheme.
Figure 24 (Left): U-V strips readout board for EIC-FT-GEM prototype II. (Right): Design of the Zebra-to-Panasonic adapter board.

polyimide material used to produce the GEM foils. The strips of the top layer (U-
strips) run parallel to one of the two radial sides of the detector and the strips of the
bottom (V-strips) layer are parallel to the other side.
The readout design is an upgrade of the one used in the EIC-FT-GEM prototype I
but has narrower pitch (400 μm versus 550 μm), top strips width (80 μm vs 140 μm)
and bottom strip width (350 μm vs 490 μm). With the smaller pitch and strip widths,
we expect to achieve better angular resolution in the radial direction. In addition,
the stereo angle between U and V strips is larger (30.1° vs. 12°) than for the previous
readout; which would also lead to an improvement of the spatial resolution in the
azimuthal direction.
Zebra-to-Panasonic adapter board: Another specificity of the new board is the
electrical contacts to the front end electronics of all top and bottom strips is done on
the outer radius side of the detector. By avoiding FE electronics from inner radius
side and the radial sides of the chamber, we protect the electronics from intense
radiation near the beam pipe and also prevent multiple scattering from the FE card
material in the active area of the forward tracker. In addition, in the new readout
board, the electrical contact between the strips and the FE electronic channel is done
using zebra connectors. Zebra connectors are commonly used for electronic
devices such as liquid crystal displays (LCDs) to provide solder-less electrical
connection between the LCD and PC board or other type of board-to-board
connections. The principle of zebra connectors is illustrated right sketch of Figure
24. With this type of electrical contact, no connectors are mounted on the readout
board, making it easier for production and more operation. A zebra-to-Panasonic
adapter board is under designed for the connection of the detector readout to the
130-pins Panasonic connectors of SRS-APV25 FE cards. The preliminary drawing
of the zebra-to-Panasonic adapter board is shown on right picture of Figure 24. Each
board will host 2 APV25 FE cards to readout a total of 256 channels. In the current
design two adapter boards will be attached together face to face with the readout
board strip pads sandwiched between the zebra connectors. Screws are used to keep
the two adapters together and ensure good electrical contact of the zebra with the
readout strip contacts.

Chromium GEM foil (Cr-GEM): We have continued to study of GEM foil with
100 nm Chromium layer replacing the 5 μm Cu layer used as top and bottom
electrode of standard GEM foil. Cr-GEM foil is a good candidate for lightweight
and low mass triple GEM detector such as the one used for EIC forward trackers.
Description of Cr-GEM foil is shown on Figure 25.
The impact of Cr-GEM low mass on the material budget of a light weight triple
GEM detectors is shown Figure 26. A comparison with standard GEM shows up to
50 % reduction of the material in the active area of the triple-GEM. This is because
in lightweight triple-GEM detector such as the material budget is dominated by the
GEM foils and readout board all made of the same copper-clad Kapton foil.
Figure 25 Chromium GEM foil (Cr-GEM) for low mass triple GEM detectors.
Figure 26 Comparison of the radiation length of triple-GEM with Cr-GEM foil and standard GEM foil.

Tests of Cr-GEM foils: We recently built a small triple-GEM prototype with Cr-
GEM foils purchased from CERN workshop. A picture of the foil is shown on
Figure 25.
Results on Figure 27 show that the good response uniformity of the Cr-GEM
prototype with cosmics. The spectrum (in ADC units) of 55Fe sources with the
characteristic escape peak is shown for two different gain (HV). The Performances
of the Cr-GEM prototype are very similar to what we would expect from a detector
with standard GEM foils. We are currently testing the prototype in our x-ray box to
study the long term stability under very high rate and discharge probability with
heavily ionizing particle. Early signs of degradation in the performance of the
prototype with the apparition of dead area have been observed under intense
radiation. The degradation may have been caused by ageing or impact of spark
discharges. The high rate test with x-ray source is ongoing and we are investigating
the long term performance of such GEM foils.
Yale University:
3-Coordinate GEM
Analysis code was recovered from a major computer failure and analysis is near
completion.
Hybrid Gain Structure for TPC readout – 2 GEM plus Micromegas
A large range of measurements have been made on several 10 cm x 10 cm chambers
with different readout plane geometries and different gas mixtures. These results were
presented at Quark Matter 2015 and at IEEE/NSS/MIC 2015. A paper draft is in hand
and is in final editing. Two key figures from the paper showing energy resolution vs
Ion Backflow (IBF) are shown in Figure 28 and Figure 29. In these figures each curve
represents a different gas mix. The points along a given curve represent a scan of the
MMG in steps of 10 V starting at the voltage where the MMG gain is 200. For each
point the GEM voltages are adjusted to keep the total chamber gain at 2000.
We have acquired two MMG with a pad plane readout with resistive strips printed on
an insulating layer over the pads. The first measurements show that the MMG can
operate at higher voltage and gain than MMG with no resistive layer. Discharges have
much lower voltage drop on the MMG mesh and much smaller current flow to the
Figure 27 Characterization of triple-GEM detector with Cr-GEM foils.

anode. At high ionization loading however, the chamber appears to have corona-like
discharge. We are still investigating this phenomenon.
We have acquired all wire planes and built an extended gating grid structure over a 10
cm × 10 cm wire chamber. Initial baseline measurements to determine electron and
ion transparency as a function of voltage settings on the grid elements are underway.
Figure 28 Energy resolution ( of 55Fe peak) vs Ion Back Flow (IBF) for Argon gas mixes.
Figure 29 Energy resolution (of 55Fe peak) vs Ion Back Flow (IBF) for Neon gas mixes.

What was not achieved, why not, and what will be done to correct?
Brookhaven National Lab:
We did not finished testing all of the gases we would like to consider using for future
TPC and TPC/Cherenkov operation. We encountered some difficulties in testing some
of them, such as Ar/CF4 (95/5), in terms of stability of operation of the GEM detector.
We also had some breakdown problems when attempting to measure the drift velocity.
This may be due to impurities in the particular gas we are using, which we intend to
investigate. We will also test more CF4 rich mixtures which may provide more stable
GEM operation. We also plan to study gas mixture containing neon, which would
provide lower positive ion feedback for the TPC.
We have not yet tested the detector with Cherenkov GEM. The first of these tests will
be to install the GEM along with its mesh on its movable stage and study any possible
high voltage problems that may occur as the GEM is brought into close proximity to
the field cage of the TPC. After we have investigated the electrostatic interaction of the
Cherenkov GEM with the TPC, we will install the CsI photocathode on the Cherenkov
GEM and begin testing the Cherenkov portion of the detector. This will require making
CsI photocathodes, which we plan to do with the help of our colleagues at Stony Brook.
We plan to begin all of these tests starting in January of 2016.
Florida Tech:
We achieved most of what we had planned for this period, except measuring the
performance of a GEM detector with zigzag strips in a magnetic field and writing a
paper on examining the geometric mean method for resolution studies. These tasks were
delayed because we decided that it was more important to perform the X-ray scans at
BNL first in preparation for the construction of the next large FT GEM prototype.
Stony Brook University:
It turned out that the optimization of the pad structures for the RICH readout with the
help of charge dispersion is not feasible. The smallness of the charge signal due to
HBD-like photon readout in CF4 would require to decrease the pad size. Even with
charge dispersion the RICH would not benefit from 2 mm pixels as they are already
near the diffusion limit. A new approach for improving the position resolution to
measure precisely the Cherenkov-ring diameter is attempted which will be described in
the next section.
University of Virginia:
The design and drawings of the support frames for the GEM foils and for the
mechanical structure of the detector have been put on hold while we were working
on finalizing the GEM foil and readout board. With this task completed, we are
ready to start working on the frames design and planning for the actual assembly of
the prototype.
The discussion with Tech-Etch or CERN concerning the production of large size
Cr-GEM has not started yet since we are still performing the high radiation tests of

the small Cr-GEM foils and studying in detail study the ageing properties and
robustness against spark of this new type of GEM foil. It is essential that we fully
investigate the performances and characteristics of Cr-GEM with small size
prototype to better understand its properties before we move to larger size for an
EIC prototype.
Yale University:
3-Coordinate GEM
Final analysis was delayed by computer problems but is now again underway.
Hybrid Gain Structure for TPC readout – 2 GEM plus Micromegas
Publication of the results for the hybrid gain structure in different gases is a few months
behind schedule but final editing of the paper is in progress.

Future
What is planned for the next funding cycle and beyond? How, if at all, is this
planning different from the original plan?
Overview
Dr. Alexander Kiselev (BNL) performed the following studies for readout patterns that
might improve the charge sharing and consequently position resolution for the projects
described within this report.
The analysis of both FIT and BNL zigzag GEM tracking detector data, collected during
Fall’2013 test run at FNAL, revealed a number of issues with the present readout board
designs:
- strongly non-linear behavior of the measured residuals after weighted mean
centroid calculation as a function of charged particle track coordinates across the
strip direction
- the noticeable dependence of the required differential non-linearity (DNL)
correction on the electron cloud charge footprint size
- existence of several hundred micron wide regions around zigzag strip centers with
almost no sensitivity of the weighted-mean- centroid-based coordinate to the
actual charged particle track location
It was realized at some point, that all these problems may have the same origin, namely
be directly linked to the suboptimal effective charge sharing between neighboring strips
in both FIT and BNL designs. The idea emerged to set up a simplified simulation
environment to 1) confirm this explanation and 2) possibly come up with a better
readout board design, which could reduce or (ideally) eliminate the above mentioned
drawbacks.
This environment was realized as a standalone set of ROOT scripts on top of a
collection of custom C++ classes, which allowed one to model the idealized charge
collection process by GEM readout plane strips. A number of essential simplifications
were used at this stage: 1) it was assumed, that spatial distribution of the electron cloud
right below the „bottom“ GEM foil has a pure 2D gaussian shape, 2) ~100% of the
readout plane can be covered with electrodes, so that no electric field distortions need
to be taken into account. Pedestal noise was simulated on per-strip level as an additive
quantity with 0 mean and known gaussian sigma.
Despite the simplicity of this simulation environment it was perfectly sufficient to
describe, at least qualitatively, the features of weighted mean centroid calculations in
the real data, which were mentioned above, in particular the strong DNL effects and
sensitivity to the charge cloud footprint size. Figure 30 shows uncorrected residuals
after weighted mean centroid calculation as a function of track coordinate across the
strip direction for FIT-like zigzag design for electron cloud footprint sizes of 200 and
600 microns (gaussian sigma). It is clearly seen, that the residuals exhibit a strongly

non-linear dependence on the coordinate, which is different for different electron cloud
sizes.
It was also shown, that there exists a unique „linear“ charge collection scheme (and
respective idealized hardware zigzag strip geometry, see left panel in Figure 31) which
does not show any DNL for a straightforward 3-strip weighted mean centroid in a wide
range of charge cloud footprint sizes for a given value of strip pitch (see left panel of
Figure 32) As such, this scheme also 1) does not exhibit any „position insensitive“ areas
around strip centers and 2) gives very similar expected spatial resolution values at the
strip centers (minimal charge sharing) and in the inter-strip regions (charge sharing
~50/50 between neighboring strips). It should be mentioned, that a very similar layout
was realized in the LEGS TPC readout board.
m]m, [generated - XreconstructedX-500 -400 -300 -200 -100 0 100 200 300 400 500
Events
0
100
200
300
400
500
, [mm]generatedX4 4.5 5 5.5 6 6.5 7 7.5 8
m]
m,
[ge
ne
rate
d -
Xre
co
nstr
ucte
dX
-500
-400
-300
-200
-100
0
100
200
300
400
500
m]m, [generated - XreconstructedX-500 -400 -300 -200 -100 0 100 200 300 400 500
Events
0
20
40
60
80
100
120
140
160
180
200
, [mm]generatedX4 4.5 5 5.5 6 6.5 7 7.5 8
m]
m,
[ge
ne
rate
d -
Xre
co
nstr
ucte
dX
-500
-400
-300
-200
-100
0
100
200
300
400
500
Figure 30 A systematic DNL of uncorrected weighted mean residuals for FIT-like strip geometry as a function of simulated electron cloud coordinate in the direction across the strips. Horizontal axis covers 4mm range (two strips)
in both plots. Strip center locations are at 4mm, 6mm and 8mm. Left panel: charge cloud footprint size 200
microns (gaussian sigma). Right panel: the same, but charge cloud footprint 600 microns.
2Picture size: 10x10 mm mmX-pitch: 2.00 mm; Y-period: 500
X
Y
2Picture size: 10x10 mm mmX-pitch: 2.00 mm; Y-period: 500
X
Y
Electron cloud size: 400 x 400 micron(s) sigma
Figure 31 A schematic layout of a 10x10mm2 area of the GEM readout board equipped with zigzag strips. Pitch 2mm as indicated. Alternating green and yellow colored vertical zigzag bands show effective electron cloud
collection areas of neighboring strips. A 1 and 2circular areas corresponding to a gaussian electron cloud
footprint size of 400 microns are indicated in pink. Left panel: “ideal” geometry (zigzag “tips” reach exactly the centerlines of the neighboring strips). Right panel: FIT-equivalent geometry with “understretched” zigzag strips and wide areas around strip centers with poor charge sharing (and as a consequence almost no sensitivity to a charged track location).

The essential interplay between basic parameters like pitch across the strip direction,
noise level, periodicity of the geometry along the strip direction, charge cloud footprint
size was also investigated in detail. In particular, right panel of Figure 32 shows, that in
a simplified gaussian model the average expected spatial resolution linearly depends on
the pedestal noise level.
Possible application of the „linear charge sharing“ scheme to more sophisticated
readout board designs, in particular the 2D ones with both strip and pad „basic“
elements, was also investigated to a certain degree.
It is assumed, that the next round of simulations will be focused on a more realistic
modeling procedure of the readout board layouts (and the complete GEM foil stack if
needed) using available Open Source programs and libraries, including Elmer
electrostatic calculation code in conjunction with the Gmsh 2D and 3D meshing tool,
Garfield++ together with Magboltz and (should it becomes needed) gerbv library in
order to export essential parts of the models as gerber files suitable for PCB
manufacturing. To this moment a feasibility study of the outlined path was performed
and no obvious show-stoppers identified. Should this procedure succeed, this may in
principle open a way to establishing a de-facto „layout standard“ for the low-channel-
count and easy-in-analysis 1D and 2D GEM readout boards.
Brookhaven National Lab:
Our main activity during the next funding cycle will be to continue our tests of the TPC-
Cherenkov prototype detector. We will complete our study of various gases for the
detector, measuring drift velocities, studying their operation with the GEMs, studying
ion back flow, etc., and determine the best operating gas for TPC/Cherenkov operation.
We will also investigate the electrostatic interaction of the Cherenkov GEM and the
TPC and determine the optimal operating configuration for the two detectors. We will
then install the CsI photosensitive GEM in this position and begin testing the Cherenkov
portion of the detector. Assuming all of this procedure goes successfully, we hope to be
Pedestal noise variance [% to signal level]0 0.5 1 1.5 2 2.5 3 3.5 4 4.5 5
m]
mS
patial re
so
lutio
n [
0
20
40
60
80
100
120 / ndf 2c 54.76 / 43
Constant 8.1± 660.1
Mean 0.604± -1.173
Sigma 0.42± 60.12
m]m, [generated - XreconstructedX-500 -400 -300 -200 -100 0 100 200 300 400 500
Events
0
100
200
300
400
500
600
700 / ndf 2c 54.76 / 43
Constant 8.1± 660.1
Mean 0.604± -1.173
Sigma 0.42± 60.12
, [mm]generatedX4 4.5 5 5.5 6 6.5 7 7.5 8
m]
m,
[ge
ne
rate
d -
Xre
co
nstr
ucte
dX
-500
-400
-300
-200
-100
0
100
200
300
400
500
Figure 32 Left panel: same as Figure 30 (left), but for the “linear” charge sharing geometry model, corresponding to the strip layout shown in the left panel of Figure 31. Weighted mean centroid over 3 neighboring strips clearly gives unbiased estimate of the simulated cloud center location. Right panel: expected average spatial resolution of the “linear charge sharing zigzag” as a function of pedestal noise.

able to test the full combined TPC/Cherenkov detector in the test beam at Fermilab in
the spring of next year.
In addition to these tests, we also plan to investigate new and improved readout patterns
for the chevron strips. As discussed in a separate part of this report, we have already
begun to investigate these patterns with calculations and simulations. Using this
information, we plan to fabricate new readout boards with a number of different readout
patterns that we can measure and study in the lab. We hope that this will lead to better
position resolution and improved linearity with the chevron readout for the TPC.
We also plan to study hybrid configurations of GEMs and Micromegas which can
reduce ion feedback for the TPC and thereby reduce space charge distortions. We intend
to work with the Yale group on this project, which has had considerable experience in
this area as well as on other TPCs.
The study of the TPC/Cherenkov detector is part of the original R&D plan for the BNL
group. However, the investigation of the new chevron patterns and the study of the
combined GEM/Micromegas operation is a new activity for our group, although we
have already had several preliminary discussions about GEM/Micromegas operation
with the Yale group.
Florida Tech:
We will analyze the new BNL scan data obtained for the zigzag boards.
Before producing the new large zigzag readout board for the next FT GEM prototype,
we want to demonstrate that the re-designed zigzag strips have a more linear response.
To that end, we plan to produce new radial zigzag boards for a 10 cm × 10 cm GEM
detector with the re-designed zigzag pattern and will scan them at BNL in early 2016
in a similar fashion as described above.
We will start producing the large common GEM foils and send out the designs for drift
and readout foils and the various frames for quotes. We will also attempt to get them
produced if that is feasible on the time frame of the next 6 months. We will investigate
stiff carbon fiber frames for assembling the next EIC FT GEM prototype. We need to finish our second paper on the “Study of the Geometric-Mean Method for
Determining Spatial Resolution of Tracking Detectors in the Presence of Multiple
Scattering” and submit it to a peer-reviewed journal.
Stony Brook University:
Figure 33 Separation power for various readout point resolutions.

The charge cloud for a single photo-electron in the RICH is quite small due to the small
diffusion coefficient in the radiator gas CF4, of about 150 m. This means that the
charge cloud is too small for geometrical charge division for the pad size that has been
used and limits significantly the position resolution for the ring measurement and
therefore limits the power of particle separation (see Figure 33 and Figure 34). The
obvious solution is either to decrease the pad size which in turn means a higher channel
count; or to increase the signal width which cannot be achieved with the radiator that
will be used. A further solution is to introduce a charge sharing by means of interleaving
channel pattern and at the same time leaving the pad size the same.
Dr. Alexander Kiselev from the BNL group proposed a pattern structure as can be seen
in Figure 35 and performed an extensive study about the properties and response of zig-
zag like read-out structures applied to various applications. Among them are hexagonal
pads as have been used in the previous test-beam campaigns for the RICH prototype to
modify such that interleaving patterns occur across neighboring pads. The result would
be that the charge cloud due to a photo-electron would always hit an area which is
contained by a small hexagon with 1.25 mm apothem, half the size of a regular hexagon
as used in the test-beam. As estimated in Figure 36, this would gain a factor 2 in ring
radius resolution and at the same time leaving the overall pad size the same, i.e., having
the same channel count.
We are planning to design a pad readout board with snowflake pattern, locally at Stony
Brook with engineers and aiming for placing an order to our previous PCB vendor. The
next steps would be then to perform basic tests with this readout pattern and it is
photons per ring
0 5 10 15 20 25 30 35 40 45 50
eve
nt co
un
t
0
100
200
300
400
500
600
Photon count
photon X coordinate, [mm]
-40 -30 -20 -10 0 10 20 30 40p
hoto
n Y
coo
rdin
ate
, [m
m]
-40
-30
-20
-10
0
10
20
30
40
Photon 2D distribution
/ ndf 2c 51.92 / 46
Constant 5.4± 300.9
Mean 0.01± 33.02
Sigma 0.0044± 0.3934
ring radius, [mm]
31.5 32 32.5 33 33.5 34 34.5
eve
nt co
un
t
0
50
100
150
200
250
300
350 / ndf 2c 51.92 / 46
Constant 5.4± 300.9
Mean 0.01± 33.02
Sigma 0.0044± 0.3934
Ring radius resolution
Figure 34 Simulated parameters with input from measurements at test-beam campaigns (A. Kiselev).
Figure 35 Interleaving pattern for hexagonal readout pad with zoomed in area on the left (A. Kiselev).
foreseen to test it further in a future test-beam campaign, preferably at Fermilab.
Compared to the original plan of using charge dispersion as a way to improve the
position resolution for the Cherenkov ring measurements a new approach has been
started and will be pursued in the next funding cycle.
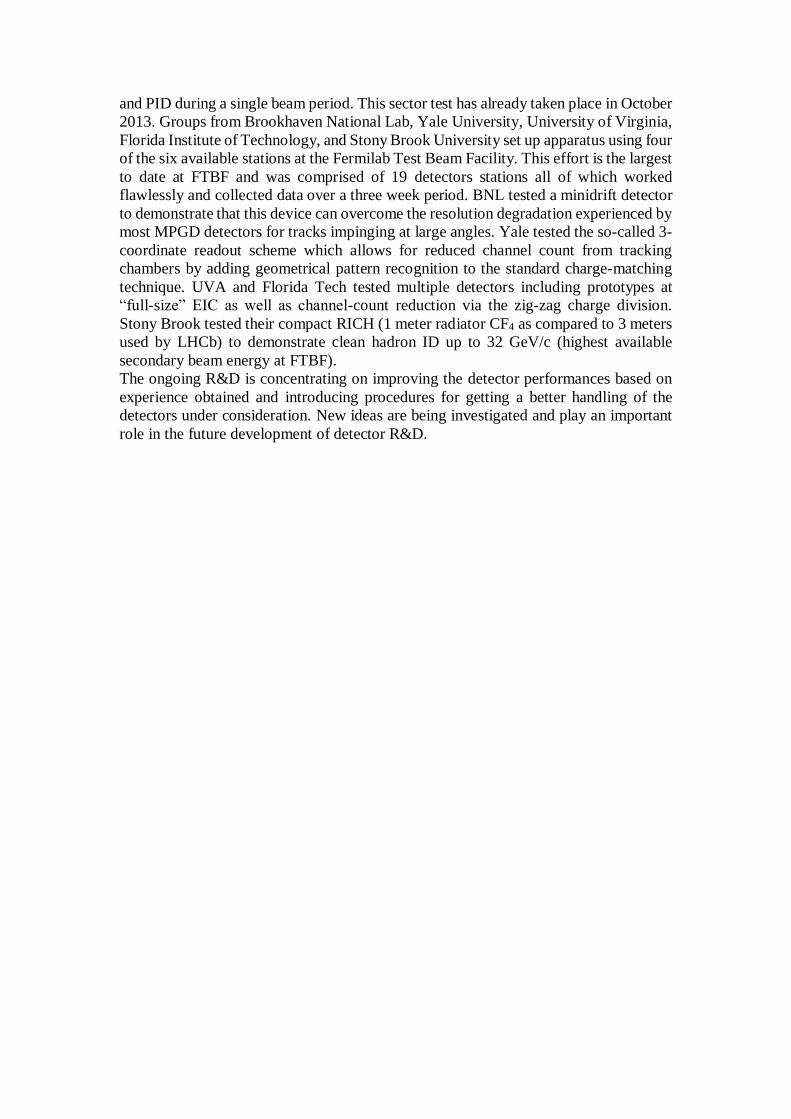
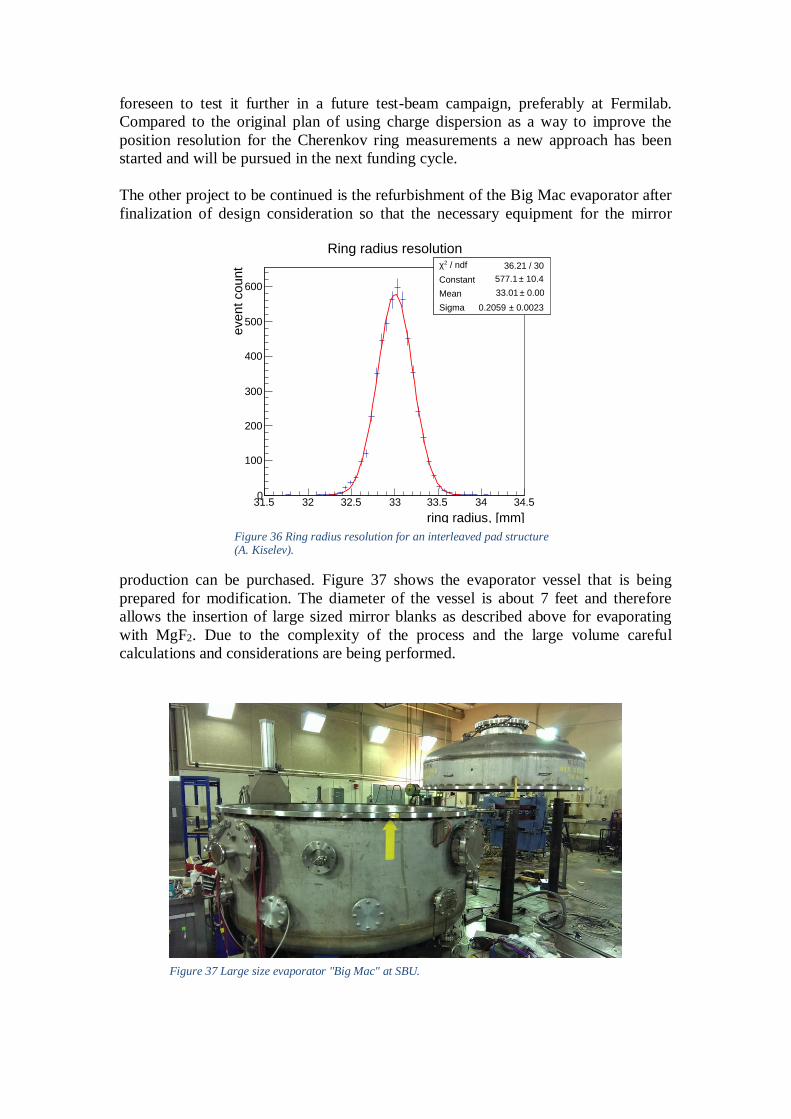
The other project to be continued is the refurbishment of the Big Mac evaporator after
finalization of design consideration so that the necessary equipment for the mirror
production can be purchased. Figure 37 shows the evaporator vessel that is being
prepared for modification. The diameter of the vessel is about 7 feet and therefore
allows the insertion of large sized mirror blanks as described above for evaporating
with MgF2. Due to the complexity of the process and the large volume careful
calculations and considerations are being performed.
/ ndf 2c 36.21 / 30
Constant 10.4± 577.1
Mean 0.00± 33.01
Sigma 0.0023± 0.2059
ring radius, [mm]
31.5 32 32.5 33 33.5 34 34.5
eve
nt co
unt
0
100
200
300
400
500
600
/ ndf 2c 36.21 / 30
Constant 10.4± 577.1
Mean 0.00± 33.01
Sigma 0.0023± 0.2059
Ring radius resolution
Figure 36 Ring radius resolution for an interleaved pad structure (A. Kiselev).
Figure 37 Large size evaporator "Big Mac" at SBU.

University of Virginia:
For the coming cycle from January 2016 to June 2016, we plan to:
Continue the tests of the Cr-GEM detector in x-ray box to study the performance
under severe background conditions
Complete the design of the Zebra-to-Panasonic adapter board and of the GEM
frames and mechanical structure of the triple-GEM chamber
The new 2D U-V strips readout design with narrow strips present several
advantages that are beneficial for EIC tracking detectors. However a few new ideas
such as etching the top and bottom strips contacts on the same Kapton support as
well as the zebra connectors for electrical contacts need to be tested before we
produce the EIC-size board for the second prototype. We plan to develop a small
(10 x 10 cm2) 2D U-V strips readout board with the new zebra-based connection
scheme and zebra-to-Panasonic adapter and perform validation tests.
Yale University:
3-Coordinate GEM
In the coming year we will complete the analysis and publish the results.
Hybrid Gain Structure for TPC readout
A draft paper is in hand on the present results and we expect to submit the paper this
year. We will continue investigation of the 2-GEM+MMG structure with resistive
planes and investigation of the extended gating grid concept.

What are critical issues?
Brookhaven National Lab:
The main critical issue is to demonstrate that the TPC and Cherenkov detectors can be
operated as a combined detector. We have successfully demonstrated that the TPC
operates well, but we must now demonstrate that it can be operated simultaneously with
the Cherenkov. The first step will be to show that the Cherenkov operates in a
standalone mode and then in combination with the TPC. We plan to do this by
performing various tests in the lab as described above, which would then be followed
by a beam test to demonstrate that the combined detector is fully operational.
Another critical issue that remains is that we need to obtain appropriate readout
electronics for the TPC. We will initially use the SRS readout system for the TPC, but
it has many limitations as a final readout system. We plan to investigate the T2K readout
electronics as a possible system that could at least be used to fully test our prototype,
but we are not sure that it would be suitable for a final readout system for an EIC
detector. Another possibility is the readout system based on the SAMPA chip that is
being developed for ALICE. This system is not currently available for us to use or test,
but we will also explore it as a possibility for the future.
Florida Tech:
We had transferred Gerber files for the common GEM foil design to the CERN
workshop for adding the actual GEM holes into the design. As of mid-October that step
was completed and from the technical point of view we were then ready for placing a
corresponding order of GEM foils with the CERN workshop. Unfortunately, we have
been forced to hold off on actually ordering the production of these foils at CERN
because as of the writing of this report (third week of December 2015) the funds that
were allocated for this production after the June 2015 review, have not yet arrived at
the universities (Fl. Tech and U. Va.) from BNL.
A critical issue specifically for Florida Tech is the continued availability of our post-
doc Aiwu Zhang throughout the production and testing phase for the next FT prototype.
The significant progress at Florida Tech described in the “What was achieved?” section
above, in particular getting two publications out and designing the next prototype, is to
a very large extent due to Aiwu’s hard work on the project. Without him, the EIC R&D
effort at Florida Tech would very likely collapse. His design work on the common GEM
foil is also directly benefitting two other groups in the eRD3/eRD6 consortia. Due to
the low overhead rates at Florida Tech, his employment is a very cost-effective
investment for the consortium. Consequently, we anticipate that we will request that
funding be provided to renew his position for another year in FY17.
Stony Brook University:
The calculations and modifications for the evaporator refurbishment design have to be
finalized. This is a non-trivial task since the evaporator has a significant volume which
has to be evacuated, making the design choices for the refurbishment a well-thought
through process.

University of Virginia:
The production and tests of the new readout design on a smaller scale is a critical
step before we can confidently go for the large size prototype. This is an area we
would like to investigate in the next six months.
Yale University:
Hybrid Gain Structure for TPC readout
Critical issues remain the same: develop methods for operating a TPC at high data rates
while maintaining low ion feedback, good energy resolution and robust operation (low
discharge rate).

Additional information:
Anticipated future budget request for new EIC R&D funds.
Brookhaven National Lab:
We anticipate the following funding request for the next round of EIC R&D funding in
FY17.
1. Support for beam test - $15k
2. Travel - $3k
3. Expendable materials and supplies - $12k
4. Design and materials for new chevron readout patterns - $10k
5. Parts and materials for investigation of GEM/Micromegas operation - $10k
6. New optics for VUV spectrometer - $10k
Total without overhead - $60k
Total with overhead - $90k
Florida Tech:
1. Salary for Aiwu (fully loaded) - $95k
2. Construction of next EIC FT prototype - $14k
3. Travel - $7k
4. Support for beam test - $7k
Total fully loaded - $123k
Stony Brook University:
1. Design and fabrication of snowflake readout patterns - $12k
2. Expendable materials and supplies - $5k
3. Support for beam test - $10k
4. Travel - $5k
Total without overhead - $32k
Total with overhead - $50k
University of Virginia:
1. Materials and Production of (U-V strips) readout board including the Zebra-
Panasonic adapter boards - $10k
2. Design and materials and production of GEM support frames - $4k
3. Expendable materials and supplies - $4k
4. Travel - $3k
5. Support for beam test - $10k
Total without overhead - $31k
Total with overhead - $49k

Manpower
Include a list of the existing manpower and what approximate fraction each has spent
on the project. If students and/or postdocs were funded through the R&D, please state
where they were located, what fraction of their time they spend on EIC R&D, and who
supervised their work.
Brookhaven National Lab:
This work is being carried out by members of the BNL Physics Department as listed
below. All personnel are paid by the BNL Physics Department.
Craig Woody, Senior Scientist (0.2 FTE)
Martin Purschke, Physicist (0.1 FTE)
Alexander Kiselev, Assistant Physicist (0.1 FTE)
Babak Azmoun, Physics Associate (1.0 FTE)
Bill Lenz, Technician (0.3 FTE).
Florida Tech:
Marcus Hohlmann, P.I., 0.25 FTE, not directly funded under this R&D program
Aiwu Zhang, post-doc, 1 FTE, fully funded under this R&D program, located at Florida
Tech and supervised by M. Hohlmann.
Several undergraduates; unfunded. Stony Brook University:
None of the labor at SBU is funded by EIC R&D. The workforce is listed below (in %
FTE):
K. Dehmelt Research Scientist 40%
T. K. Hemmick Professor 10%
E. Michael Undergraduate student 25%
N. Nguyen Undergraduate student 25%
University of Virginia:
None of the labor at UVa is funded by EIC R&D. The workforce is listed below (in %
FTE):
N. Liyanage Professor 25%
K. Gnanvo Research Scientist 40%
V. Nelyubin Senior Research Scientist 5%
H. Nguyen Post-doctoral 5%
X. Bai Graduate Student 5%
R. Wang Graduate Student 5%
Yale University:
None of the labor at Yale is funded by EIC R&D. The workforce is listed below.
R. Majka Senior Research Scientist and Scholar 10%
N. Smirnov Research Scientist and Scholar 50%
Graduate Student 25%
Undergraduate Student 25%

External Funding
Describe what external funding was obtained, if any. The report must clarify what has
been accomplished with the EIC R&D funds and what came as a contribution from
potential collaborators.
Brookhaven National Lab:
There is currently no other external funding for this R&D effort
Florida Tech:
Florida Tech has no external grants in nuclear physics. There is a base grant in HEP for CMS that has some synergy with R&D work on large-area GEMs.
All work described above was accomplished with the EIC R&D funds.
Stony Brook University:
There is no other external funding for this R&D effort.
University of Virginia: UVa has DOE basic research grant from Medium Energy Physics. The R&D work on Cr-
GEM is funded with the research grant.
The group also has DOE grants through JLab for the construction of the SBS GEM
trackers.
Yale University:
None.

Publications
Please provide a list of publications coming out of the R&D effort.
Brookhaven National Lab:
1. “A Prototype Combination TPC Cherenkov Detector with GEM Readout for Tracking and Particle Identification and its Potential Use at an Electron Ion Collider”, C. Woody et.al.,
Conference Proceedings of the 2015 Micropattern Gas Detector Conference, Trieste, Italy,
October 12-15, 2015 (submitted).
2. “A Study of a Mini-drift GEM Tracking Detector”, B. Azmoun et.al., submitted August,
2015 to the IEEE Transactions on Nuclear Science, currently under review.
3. “Study of a Short Drift GEM detector for future tracking applications at PHENIX”, M.
Purschke et.al., Conference Record Proceedings of the 2013 IEEE Nuclear Science Symposium
and Medical Imaging Conference, Seoul, Korea, October 2013.
Florida Tech:
1. A. Zhang et al., “Performance of a Large-area GEM Detector Read Out with Wide Radial Zigzag Strips,” Nucl. Instr. Meth. A811 (2016) 30-41, doi: 10.1016/j.nima.2015.11.157
2. A. Zhang et al., “R&D on GEM Detectors for Forward Tracking at a Future Electron-Ion
Collider,” 2015 IEEE Nuclear Science Symposium Conference Record, Nov 1-7, San Diego, CA.
Stony Brook University:
1. “Performance of a Quintuple-GEM Based RICH Detector Prototype”, IEEE
TRANSACTIONS ON NUCLEAR SCIENCE, VOL. 62, NO. 6, DECEMBER 2015.
2. ”Performance of a Quintuple-GEM Based RICH Detector Prototype”, Nuclear Science
Symposium Conference Record, 2015, IEEE
University of Virginia:
1. K. Gnanvo, et al. “Large Size GEM for Super Bigbite Spectrometer (SBS) Polarimeter for
Hall A 12 GeV program at JLab”, Nucl. Inst. and Meth. A782, 77-86 (2015). DOI: 10.1016/j.nima.2015.02.017
2. K. Gnanvo et al., “Performance in Test Beam of a Large-area and Light-weight GEM
detector with 2D Stereo-Angle (U-V) Strip Readout”, Nucl. Inst. and Meth. A808 (2016), pp. 83-92. DOI: 10.1016/j.nima.2015.11.071.
Yale University:
A publication is in preparation on the 2-GEM+MMG results described above and
presentations were made at Quark Matter 2015 and IEEE/NSS/MIC 2015.
i http://www-rnc.lbl.gov/~wieman/alice%20upgrade%20gating%20grid.pdf