Embed Size (px)
Citation preview
EigenSpokes: Surprising Patterns and Scalable
Community Chipping in Large Graphs
B. Aditya Prakash1, Ashwin Sridharan2, Mukund Seshadri2, SridharMachiraju3, and Christos Faloutsos1
1 Computer Science Department, Carnegie Mellon University{badityap, christos}@cs.cmu.edu
2 Sprint Applied Research Labs, California{ashwin.sridharan, mukund.seshadri}@sprint.com
3 Google Inc., [email protected]
Abstract. We report a surprising, persistent pattern in large sparse so-cial graphs, which we term EigenSpokes. We focus on large Mobile Callgraphs, spanning about 186K nodes and millions of calls, and find thatthe singular vectors of these graphs exhibit a striking EigenSpokes pat-tern wherein, when plotted against each other, they have clear, separatelines that often neatly align along specific axes (hence the term “spokes”).Furthermore, analysis of several other real-world datasets e.g., Patent Ci-tations, Internet, etc. reveals similar phenomena indicating this to be amore fundamental attribute of large sparse graphs that is related to theircommunity structure.This is the first contribution of this paper. Additional ones include (a)study of the conditions that lead to such EigenSpokes, and (b) a fastalgorithm for spotting and extracting tightly-knit communities, calledSpokEn, that exploits our findings about the EigenSpokes pattern.
1 Introduction
Given a large phone-call network, how can we find communities of users? Whilethe behavior of users in landline networks has been examined before [4], westudy here the phone call network of mobile users in cellular networks. Theanalysis of mobile phone graphs is interesting for multiple reasons as mobilephones are ubiquitous and are a key conduit for Internet access too. Severalrecent studies have used mobile call graph data to examine and characterizethe social interactions of cell phone users, with a focus on understanding thestructural properties of the graph [13, 11, 21], the evolution of social groups andthe spread of new products and services [14].
This material is based upon work supported by the National Science Foundation un-der Grants No. CNS-0721736 and CNS-0721889 and a Sprint gift. Research partlydone during a summer internship by the first author at Sprint Labs. Any opinions,findings, and conclusions or recommendations expressed in this material are thoseof the authors and do not necessarily reflect the views of the National Science Foun-dation, or other funding parties.

Our objective in this paper is to identify if and to what extent do well-definedsocial groups of callers exist in such networks. We emphasize that understandingthe entire graph structure is not our goal. Indeed, in large social networks, notevery node can be expected to belong to a community. Hence, extraction ofcommunity-like structures, which can be independently analyzed, is the focusof this paper rather than graph-partitioning. This approach based on chippingoff communities is also supported by recent studies [10] that have shown thepresence of small communities loosely connected with the remaining “core” of thegraph. Furthermore, when we applied well-known graph clustering techniques onour datasets, none of them provided much insight into chipping off interestingcommunity structures for further analysis, since these techniques are gearedtowards partitioning the entire graph. What was surprising, though, was ourdiscovery of the ‘spokes’ (or EigenSpokes) phenomenon (see Figure 1(b)): thesingular vectors of the Mobile Call graph, when plotted against each other,often have clear separate lines, typically aligned with axes. We term such plotsEigenEigen (or EE) plots.
We concentrate on three key questions in this paper:
1. Cause: What causes these spokes?2. Ubiquity: Do they occur across varied datasets to be worth studying?3. Community Extraction: How can we exploit them, to chip off meaningful
communities from large graphs?
We answer these three questions on graphs of Table 1. Our primary dataset inthis paper is an anonymized social graph based on mobile calls made from/tocallers located within a geographically contiguous urban area. In this socialgraph, callers are represented as nodes, and edges represent calls between nodes.This Mobile Call graph captures activity over the duration of a month (mil-lions of successfully completed calls) and consists of about 186, 000 nodes and464, 000 edges. We also investigate similar Mobile Phone graph datasets obtainedfrom other geographic areas, to support our findings. Since these graphs are dis-connected, we focus on the largest connected component. Our graphs exhibitcharacteristics such as degree distributions and generative processes similar tothose of other mobile call graphs [11, 21].
In addition to the above, we also investigate several other datasets (Table 1)in the public domain4 which allow us to determine the generality of our obser-vations and the underlying phenomenon. Also, they have meta-information thathelps us demonstrate that our algorithm chips-off meaningful communities.
Name Description Nodes Edges
Mobile Call graph Calls between callers/callees 186,000 464,000
Patent Citations Citations between patents 3,774,768 14,970,767
Internet routers Network links between routers 124,651 207,214
Dictionary words Words are connected if they 52,652 178,076differ by a single letter
Table 1. Graph datasets used in this paper
4 http://www.cise.ufl.edu/research/sparse/matrices/
The following sections discuss the related work, problems with traditionalmethods, explain the EigenSpokes pattern, develop the SpokEn algorithm andfinally present many surprising communities found in the datasets.
2 Related Work
Graph partitioning is a popular approach for studying community structure ingraphs. Popular methods include Spectral clustering (see [24] for a survey), a“cut-based” method for understanding graph structures, which has been suc-cessful in machine-learning and image segmentation. Similar approaches (e.g.[19, 16]) use the eigenvectors of the adjacency matrix. Lastly, spectral inspiredmethods have been used to learn model parameters for well-separated Gaussianmixtures [22]. Alternative cut-based multilevel approaches like Metis [8] and Gr-aclus [5, 20] coarsen the graph by coalescing nodes and then apply refinementsteps to recover partitions. We address both the Spectral and multi-level parti-tioning techniques in greater detail in § 3.
Cross-Association [2] partitions the graph so as to maximize informationcompression, but is limited to bi-partite structures. Co-clustering [6] trys tomaximize mutual information, but like k-means, requires a priori informationon the number of clusters. More generally in terms of clique extraction, [15]trys to extract quasi-cliques from graphs. Our focus however is on chipping outgeneral community structures.
Modularity based approaches compare a graph’s community structure againsta random graph. Studies have proposed using modularity based Laplacian-likematrices [12, 25] or greedy heuristics [3] for graph clustering. However all thesetechniques also partition the entire graph rather than extract relevant commu-nities, which is our objective.
In terms of social network analysis, [18] extracts communities from an In-stant Messenger Network by applying Co-clustering. [7] proposes flow-basedtechniques to identify Web-based communities. However, it identifies commu-nities for a set of known nodes, while our objective is to extract all nodes thatconstitute communities. Also, although the focus of [26] is on randomness mea-sures, they observed quasi-orthogonal spectral lines in context of small cavemen-like graphs. To the best of our knowledge the EigenSpokes pattern has not beenobserved in any real, large social networks.
3 Why not Traditional Methods?
We analyzed the mobile call graph using well-known spectral clustering [24]and multi-level graph partitioning [8, 5] techniques. Our goal here is to exploreif these methods can help us extract communities of nodes for further analysis.Although remarkably successful in other settings like image segmentation etc.,we find, as shown below, that these methods do not yield good communities inour graph.

V1
V2
V3
V4
V5
V6
V7
V8
V9
(a) Lrw: Note the long (b) EE-plot (c) Spy Plots of sub-chains graph of Top 20 Nodes
Fig. 1. (a) Typical Partition using Lrw (b),(c) EigenSpokes in Region 1 & Time 1.
Spectral Clustering: Lrw, Lsym, . . . Many “Laplacian” matrices can be de-fined on a graph G = (V, E) (see [24]). We applied the Lrw method [24] onour primary data set to obtain k-way partitions from k = 2 to k = 100. As inrecent studies ([9], [10]), we found that the application of the technique yields :a)skewed partitions consisting of very small clusters and a large ’core’ and b) theclusters lack internal coherence. The partitions we got from Lrw while loweringthe N-cut value had no or little internal coherence with long chains and mostnodes connected to 1 or 2 other nodes (see Figure 1(a)). We experimented withseveral other Laplacians including Lsym [24] and LQ (based on modularity) [25]but obtained similar results of limited utility.Graph Partitioning Methods Prevailing multilevel algorithms for graphpartitioning like Metis [8] and their improvements like Graclus [5] and MCR-MCL [20] are based on repeated coarsening and refinements of nodes with em-phasis on balanced cuts. To explore how well multilevel algorithms perform, weran Graclus on the Mobile Call graph to obtain k partitions. We invoked thealgorithm with various values for k from k = 2 to k = 10, 000. While Graclusyields more balanced clusters than Spectral partitioning, we observed that, asbefore, the clusters lack internal coherence. This can be attributed, again, to thefollowing two causes : a) these algorithms also utilize a cut-based metric and b)their objective is to partition the entire graph; as shown by our results as wellas [10], this is not feasible when applied to social graphs that comprise of a largeset of random nodes and small communities.
4 EigenSpokes
As demonstrated in the previous section (and prior work), Laplacians in certainlarge graphs yield communities that have a low cut but possess little internalcoherence. Hence, we investigate using the adjacency matrix itself. This leadsto several interesting observations, and motivates our approach for communityidentification.
4.1 A Surprise: Spokes
Recall that the Singular Value Decomposition (SVD) of an m × n matrix W
is a factorization defined as: W = UΣV T , where U and V are m × m and

n × n size matrices respectively, and Σ is an m × n diagonal matrix comprisedof the singular values. Taking the top K values of Σ yields the best rank-Kapproximation (w.r.t. the Frobenius norm) to the original matrix [23].
(a) Region 2, Time 2 (b) Region 3, Time 3
Fig. 2. EE-plots for Mobile Call graphs fordifferent geographic regions and time periods:note the persistence of EigenSpokes.
We define the EE-plot asthe scatter plot of vectorUi and Uj , for any i andj, i.e., they plot one point(Uin, Ujn) for each node n inthe graph. Surprisingly, we findthat the EE-plots for our Mo-bile Call graph show clear sep-arate straight lines that are of-ten aligned with axes5! We callthis the EigenSpokes pattern.This is demonstrated in Fig-ure 1(b), where we plot the first K = 18 singular vectors pairwise. Even morestriking is that, as shown in Figure 2, these spokes occur in many Mobile Callgraphs collected at various points of time (separated by several months) and atvarious geographic regions.
Some intuition: We delve further into the EigenSpokes pattern by identify-ing the nodes that lie on the extremities of the “spokes”; more precisely, for eachof the first 9 singular vectors, we identify the 20 nodes that had the highest mag-nitude projection along that vector. We then plot the induced sub-graph of thesenodes (see Figure 1(c)). Clearly, almost all of the induced sub-graphs containnear-cliques. These observations hint toward a strong connection between Eigen-
Spokes and communities, and raise the following questions : are these spokes
representative of fundamental community structures; do they occur elsewhere?
What is their origin and how exactly can they be used for chipping off commu-
nities?
We answer these questions next: in § 4.2, we provide a rigorous basis for thelink between EigenSpokes and communities; in § 4.3, we show that EigenSpokes
can be observed in several real-world graphs; and in § 4.4, we demonstrate thevarious conditions that lead to the presence (and absence) of the EigenSpokes
phenomenon.
(a) (b) Patents (c) Dictionary (d) Internet
Fig. 3. (a) EEE -plot for Mobile Call graph and EigenSpokes in other Real-World DataSets (b),(c),(d)
5 Axis-alignment is distinct from orthogonality of the vectors.

4.2 Justification and Proofs
Our focus in this paper is on undirected graphs, which implies that the adjacencymatrix A is a square, symmetric matrix. For such a matrix, it is well known thatthe singular values are absolute values of the non-zero eigenvalues: σi = |λi|and the singular vectors coincide with the non-null eigenvectors. Due to theequivalence between singular vectors and eigenvectors for the (symmetric) graphsconsidered in this paper, we abuse language and often refer to singular vectorsas being the spectra of A.
Given the presence of EigenSpokes, is it reasonable to expect the nodes lyingalong the extremes to have similar connectivity patterns?
EigenSpokes, Connectivity and Communities: The presence of spokesin EE-plots (axis-aligned or not) implies that nodes close to each other on aline have similar scores along two eigenvectors (‘score’ of node n along vectorUi is Uin). In fact, plots of the first 3 eigenvectors, or EEE-plots (see Figure 3)show lines too. This strongly suggests similar scores for the nodes in many vec-tors. Specifically, consider two nodes i and j whose connectivity information isrepresented by their rows Ai and Aj in A. If the kth eigenvector is denoted byUk, then AiUk and AjUk are the ith and jth components of Uk. These will beequal if Ai = Aj . Hence, the two nodes will have the same components alongthe eigenvectors. In general, we expect that nodes with similar connectivity will
have similar scores along the vectors of U .Is the converse also true? We can prove the following lemma to this end (note
that 〈x, y〉 = xT y denotes the dot-product of two column vectors x and y):
Lemma 1. For any real, symmetric adjacency matrix A, if for any i and j,
∀k, |〈(Ai − Aj)T , Uk〉| ≤ ǫ, then ∀k, |Aik − Ajk| ≤ (ǫ
√N) as well.
Proof. As A is real symmetric, by the Spectral Theorem, it is orthogonally diago-nalizable. Hence, it is non-defective and has a full basis of eigenvectors. Considerany vector C =
∑
k ckUk written using the basis consisting of the eigenvectors.Then,
〈(Ai − Aj)T , C〉 =
∑
k
ck〈(Ai − Aj)T , Uk〉
≤√
∑
k
c2
k
√
∑
k
〈(Ai − Aj)T , Uk〉2 ≤√
∑
k
c2
k
√N ǫ
where we use the Cauchy-Schwartz inequality in step 2 and given bound in step3. Use the above inequality for C = ek (indicator vector which is zero everywhereexcept at index k where it is 1), for every k. Also, note that orthogonal transfor-mations preserve the norm of a vector - hence,
√
∑
k c2
k =‖ C ‖, which would be
equal to 1 for our choice of C’s. Therefore, we get: ∀k, |Aik −Ajk| ≤ (ǫ√
N). ⊓⊔
Note that the above proof holds for any orthogonal basis set of vectors U ; butour basis set U is also a carefully chosen set: it is the set of singular vectors.Hence, we expect the bound to be tighter in practice.

In view of the above, we expect that nodes lying close to each other on a spokewill have similar neighbor sets. But what is the link between similar neighbor setsand communities in the graph? Consider the following two (sufficient) conditionsthat result in similar neighbor sets:
1. Cliques (or near-cliques) result in exactly the same 6 (or similar) adjacencyrows for nodes in the cliques.
2. Perfect (or near-perfect) Bipartite-cores also result in the same (or similar)adjacency rows for nodes in the two cores.
Consequently, we expect to see communities in the form of (near-)cliques or(near-)bi-partite cores among the nodes in the spokes.
Axis-alignment (or not): Recall another striking feature of the EE-plots:the presence of largely axis-aligned spokes. From the preceding discussion, giventhe presence of EigenSpokes, we should traverse the extreme points on each spoketo extract communities. This reduces to searching for ’high-scoring’ nodes in eachsingular vector separately, since axis-alignment implies that the extreme pointshave high values only in one of the vectors. In fact, prior work [1] has alreadyshown that nodes with scores at the extreme ends of the principal eigenvectorof Erdos-Renyi graphs do belong to the same clique. However, some spokes arenot axis-aligned (as in the last EE-plot of Figure 1(b)). This implies that somenodes have significant scores along multiple singular vectors. In the specific caseof EE-plots the linear nature of spokes means that the scores of the nodes arelinearly correlated. Hence, exploring dominant nodes along one singular vectorshould be sufficient to extract nodes of a community.
4.3 Ubiquity of Spokes
Apart from Mobile Call graphs, we have observed the EigenSpokes patternwith singular vectors of several other real world graphs. We show the EE-plots
for Patents, Dictionary and Internet router connectivity in Figure 3(b), 3(c)and 3(d) ([17] contains more detailed plots). In all three cases, we see thatmost pairwise combinations align in a spoke pattern, with some exceptions inthe Dictionary graph. We also observe that some of these spoke patterns arenot axis-aligned; as discussed earlier though, the linear correlation between thescores of the nodes is preserved. Thus the EigenSpokes pattern is persistentacross a wide array of diverse datasets.
4.4 Recreating Spokes
So far, we have provided some insight into why spokes arise. We now demon-strate exactly which features of graphs and community structure result in spokesusing both synthetic and real graphs. Synthetic graphs, in particular, allow us toexperiment with various parameters and characteristics, and observe their effecton their EE-plots. We show that the key factors responsible for these patternsare a large number of well-knit communities embedded in very sparse graphs.
6 not considering self-edges

(a) No Commu-nities
(b) 40 Commu-nities
(c) 400 Com-munities
Fig. 4. Genesis of EigenSpokes: synthetic heavy-tailedrandom graphs with community structure.
We started witha synthetic randomheavy-tailed graph withthe same number ofnodes and degree dis-tribution as our Mo-bile Call graph butwith no communitystructure. The EE-plotsdon’t exhibit any spokespattern (Figure 4(a))but, when we synthet-ically introduce 40 communities (near-cliques of sizes 31−50, with a probability0.8 of an intra-community edge) into the above random graph, in Figure 4(b),we observe the emergence of the spokes pattern. When we increase the numberof communities to 400, in Figure 4(c), the spoke pattern becomes more clear,and resembles Figure 2. Further, we verified that the nodes at the extremitiesdo indeed form the artificially embedded communities. We also found that thenature of the communities, including the level of internal connectivity, does notaffect the emergence of the spokes pattern as long as such connectivity is signif-icant. Thus we infer that one of the important causes for a spokes pattern isthe presence of a large number of tightly knit communities in the graph.
Due to lack of space we omit details about the effect of sparsity and degreedensity; they are demonstrated in greater detail in [17].
5 SpokEn: Exploiting EigenSpokes
Based on the insights from previous sections, we now develop our communityidentification approach SpokEn, that exploits EigenSpokes. While developingSpokEn, we also use experiments with synthetically generated graphs to helpus choose from the various algorithmic choices. Our approach differs from priorwork on graph partitioning as for certain classes of graphs, we observe a specificstructural property and exploit it. While this may not apply to all graphs, ourapproach is highly effective for the large sparse graphs we consider, as shown byour results later in the paper.
5.1 Designing SpokEn
Our proposed approach is based on the key property of EigenSpokes highlightedin § 4.2: the existence of EigenSpokes indicates the presence of well-knit com-munities whose nodes have a significant component in that singular vector. Thusan appropriate traversal of each singular vector in isolation can extract thesecommunities. A good traversal should select only the nodes which belong to acoherent community. We now discuss where to start the traversal, how to grow
the community and finally, when to stop.

Initialization: We choose the node with the score of maximum magnitude asthe seed for the community. We multiply the given singular vector Ui by −1 ifnecessary to ensure that the score with the largest magnitude is positive.Discovery: A simple algorithm for discovery is one that picks nodes in decreas-ing order of their scores. Such an algorithm can pick a node that is disconnectedfrom all the nodes chosen previously. Hence, we propose the following: let C
denote the set of all nodes that have been discovered so far; the next node thatwe select is the node with the largest score that is connected to some node in C.Formally, we augment C with a node n∗ that satisfies n∗ = arg maxn∈NC
Ui(n),where NC is the neighborhood of C7. This algorithm is intuitive and keeps C
always connected.Termination and Trimming: For termination, we need to use a metric thatquantifies the quality of the community extracted so far. We propose to use anovel hybrid approach based on conductance [24] for cut and modularity (actu-ally relative modularity) for coherence. The process discovers and adds nodes tothe set C as long as the relative modularity increases and terminates once it re-duces indicating reduction in community structure. We finally use a conductancebased method to trim out the remaining false positives.
5.2 Discussion
Relative Modularity: In large graphs such as ours, underlying communitiesare typically small (10 ≈ 100 in a million node-graph) [10]. The equation formodularity8 indicates that when extracting a single small community from alarge graph, the modularity metric computed on such a highly unbalanced par-tition would be dominated by the larger partition and not the discovered com-munity, thus rendering it useless. This was also empirically observed in extensiveevaluations over our datasets.
To resolve this problem, we once again utilize the concept of scores. Whentraversing a singular vector (say Ui), as a pre-processing step, we constructa new sub-graph Gǫ = (Vǫ, Eǫ) from G wherein we discard all nodes n withvalues Ui(n) below a certain threshold ǫ. The modularity computation is thenconducted w.r.t. Gǫ (hence relative modularity). This is justified since in the firstplace, we do not expect the discarded nodes to belong to the community underconsideration. The removal of such nodes induces a more balanced partitionand makes the modularity values more meaningful. We set ǫ = 10−4 in ourexperiments as several tests showed the results were insensitive around it.Trimming using Conductance: As shown later in § 5.3, conductance as atermination criterion results in premature termination of the discovery process,causing several false negatives while relative modularity as a termination metric
7 NC is the set of nodes not in C and are connected to at least one node in C8 The modularity of a graph partition C = {C1, C2, . . .} is Q(C) =
1
2m
∑
C∈C
∑
i,j∈C∩V
[
Aij −kikj
2m
]
, where ki is the degree of a node and Aij an element
of the adjacency matrix.

often results in overshooting and hence false positives. These two observationsindicate that modularity and conductance are complementary in the role of a ter-mination metric which is why we adopt a hybrid approach. Hence as mentionedbefore, after a community is extracted using relative modularity (to discover allrelevant nodes at the cost of false positives), a standard spectral technique (Lrw)is used to trim-out false positives by further bisection to determine a better cut.We give the pseudo-code of SpokEn in Algorithm 1.
Algorithm 1 SpokEn
Require: Symmetric binary adjacency matrix A
1: U = get first several eigenvectors of A
2: Stop if U has no EigenSpokes pattern3: for all eigenvectors v = Uk do4: Construct Gǫ = (Vǫ, Eǫ) such that Vǫ = {i : v(i) > ǫ}5: Initialize outputSet using seed //see Initialization
6: //see relative modularity in Termination
7: while modularity(outputSet, Gǫ) increases do8: Expand outputSet //see Discovery
9: end while10: Ck = trim outputSet using conductance //see Triming using Conductance
11: end for12: return {Ck}
5.3 Empirical Results
To evaluate the performance of our discovery process and termination crite-rion, we applied SpokEn on various synthetically generated graphs with knownground truths in each case (like the ones described in § 4.4 including an ERgraph embedded with bi-partite cores). While the detailed results are providedin [17], we found that conductance as a termination criterion undershot andhence detected fewer communities (about 60% with almost no false positives).On the other hand, modularity discovered about 80% communities but with 4%false positives. Their combination, SpokEn, was able to identify 76-90% of theembedded communities with almost no false positives.Speed : The computation time is mainly dominated by the eigenvector calcula-tion which is linear in edges. We ran SpokEn on graphs of various sizes on a DellServer with an Intel Xeon 3 GHz processor and 4 GB of RAM. In each case, wecomputed 100 singular vectors and mined communities from them. Figure 5(a)plots the computation time required by SpokEn to extract communities as afunction of the number of edges of the graph. As expected, it clearly shows theprocessing time is linear in the number of graph edges, which is a key indicationof scalability.
6 Successes with Real-World Graphs
We applied SpokEn to our real-world datasets and found that it extracts severalinteresting communities that reveal useful and relevant information about theconnectivity patterns.

We illustrate four typical communities extracted by SpokEn from our Mo-bile Call graph. Figure 5(b) presents the spy plots which clearly show that thecommunities are well-connected (the communities are red nodes on the top de-lineated by black boxes). To show the success of our terminating criterion, weplot additional nodes that would have been explored by the discovery processwithout termination. Notice that SpokEn does indeed typically stop at pointswhere a community appears to have ended. In the bottom left case, however,it overshoots and combines what appear to be two near-cliques into the samecommunity. We observe similar results for the other singular vectors as well:SpokEn extracts communities of nodes with good internal coherence though itsometimes clubs together two such communities into one.
The prevalence of such close-knit communities of more than 10 nodes in aMobile Call graph was quite unexpected to us. Temporal analysis of the usageof at least a few communities leads us to believe that these communities arisefrom users of the same organization.
0 0.5 1 1.5 2x 10
5
0
500
1000
1500
Number of Edges
Co
mp
uta
tion
Tim
e (
in s
eco
nd
s)
Observed TimeLinear Fit
(a) Scalability of SpokEn (b) Communities by SpokEn
Fig. 5. (a) SpokEn: Computation Time is linear in #(edges) (b) Four communities(delimited by black box and red dots) extracted by SpokEn from Mobile Call graph(spy plots). To illustrate the success of the termination criterion, we plot additionalnodes in the order of discovery. Notice the near-clique (= near block diagonal) behavior.
Next, we analyze a few typical communities from other data sets. Figure 6(a)plots the connectivity between nodes of a community extracted from the Patentcitation dataset. Notice the striking bipartite nature of the community. Uponfurther investigation, we find that the bipartite nature arises because of patentsfiled by the same organization on related topics reuse the bibliography entries.In the example shown here, one-half of the bi-partite graph comprises of about25 patents that were filed in a period of 1998 − 1999 by (the same) authorsfrom Kimberly-Clark in the area of photosensitive pigments for color printers.The bi-partite nature of the graph arises because all these 25 patents cited thesame set of past references. This also illustrates a crucial aspect of SpokEn: itextracts communities of nodes with similar connectivity. This may or may notimply mutual connectivity.
Figure 6(b) shows a typical community extracted from the Dictionary graph.Recall that this dataset connects two words if they differ by exactly one letter.The clique shown in Figure 6(b) arises from three-letter words that all endwith ‘on‘. We found many similar cases including words that end with ‘an‘, ‘ll‘,etc. Finally, Figure 6(c) shows a community extracted from the router graph.
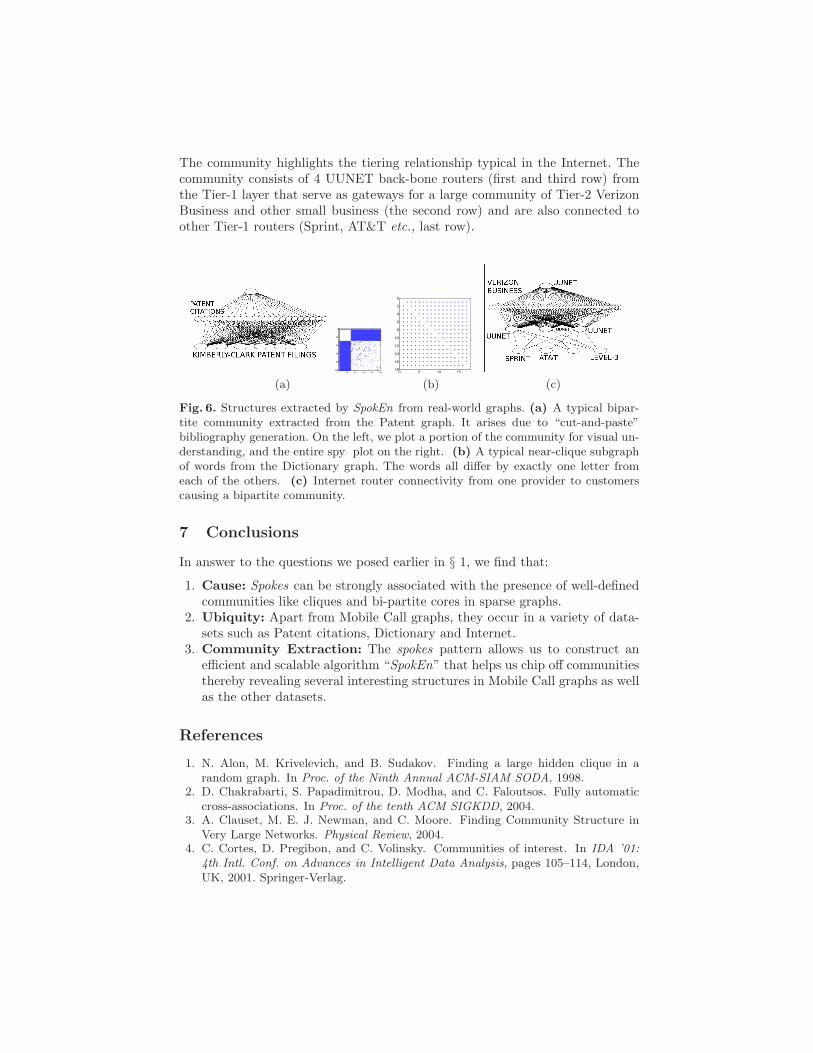
The community highlights the tiering relationship typical in the Internet. Thecommunity consists of 4 UUNET back-bone routers (first and third row) fromthe Tier-1 layer that serve as gateways for a large community of Tier-2 VerizonBusiness and other small business (the second row) and are also connected toother Tier-1 routers (Sprint, AT&T etc., last row).
0 20 40 60 80 100
0
20
40
60
80
100
(a)0 5 10 15
0
2
4
6
8
10
12
14
16
18
(b) (c)
Fig. 6. Structures extracted by SpokEn from real-world graphs. (a) A typical bipar-tite community extracted from the Patent graph. It arises due to “cut-and-paste”bibliography generation. On the left, we plot a portion of the community for visual un-derstanding, and the entire spy plot on the right. (b) A typical near-clique subgraphof words from the Dictionary graph. The words all differ by exactly one letter fromeach of the others. (c) Internet router connectivity from one provider to customerscausing a bipartite community.
7 Conclusions
In answer to the questions we posed earlier in § 1, we find that:
1. Cause: Spokes can be strongly associated with the presence of well-definedcommunities like cliques and bi-partite cores in sparse graphs.
2. Ubiquity: Apart from Mobile Call graphs, they occur in a variety of data-sets such as Patent citations, Dictionary and Internet.
3. Community Extraction: The spokes pattern allows us to construct anefficient and scalable algorithm “SpokEn” that helps us chip off communitiesthereby revealing several interesting structures in Mobile Call graphs as wellas the other datasets.
References
1. N. Alon, M. Krivelevich, and B. Sudakov. Finding a large hidden clique in arandom graph. In Proc. of the Ninth Annual ACM-SIAM SODA, 1998.
2. D. Chakrabarti, S. Papadimitrou, D. Modha, and C. Faloutsos. Fully automaticcross-associations. In Proc. of the tenth ACM SIGKDD, 2004.
3. A. Clauset, M. E. J. Newman, and C. Moore. Finding Community Structure inVery Large Networks. Physical Review, 2004.
4. C. Cortes, D. Pregibon, and C. Volinsky. Communities of interest. In IDA ’01:
4th Intl. Conf. on Advances in Intelligent Data Analysis, pages 105–114, London,UK, 2001. Springer-Verlag.

5. I. Dhillon, Y. Guan, and B. Kullis. Weighted Graph Cuts without EigenVectors:A Multilevel Approach. IEEE Transactions on Pattern Analysis and Machine
Intelligence, pages 1944–1957, November 2007.6. I. Dhillon, S. Mallela, and D. Modha. Information-theoretic co-clustering. In Proc.
of the ninth ACM SIGKDD, 2003.7. G. Flake, S. Lawrence, and L. Giles. Efficient identification of web communities.
In Proc. of Sixth ACM KDD, 2003.8. G. Karypis and V. Kumar. A fast and high quality multilevel scheme for parti-
tioning irregular graphs. SIAM Jnl. on Sci. Comp., 20(1):359–392, 1999.9. K. Lang. Fixing two weaknesses of the spectral method. In Proc. of NIPS, 2006.
10. J. Leskovec, K. J. Lang, A. Dasgupta, and M. W. Mahoney. Statistical propertiesof community structure in large social and information networks. In WWW, 2008.
11. A. A. Nanavati, S. Gurumurthy, G. Das, D. Chakraborty, K. Dasgupta, S. Mukher-jea, and A. Joshi. On the structural properties of massive telecom call graphs :findings and implications. Proc. of 15th ACM CIKM, pages 435–444, 2006.
12. M. E. J. Newman. Finding community structure in networks using the eigenvectorsof matrices. Phys. Rev. E, 74(036104), 2006.
13. J.-P. Onnela, J. Saramaaki, J. Hyvoven, G. Szabo, M. A. de Menezes, K. Kaski, andA.-L. Barabasi. Structure and Tie Strengths in Mobile Communication Networks.New Journal of Physics, 9, 2007.
14. G. Palla, A.-L. Barabasi, and T. Vicsek. Quantifying social group evolution. Na-
ture, 446(664), 2007.15. J. Pei, D. Jiang, and A. Zhang. On mining cross-graph quasi-cliques. In Proc. of
the eleventh ACM SIGKDD, 2005.16. P. Perona and W. T. Freeman. A factorization approach to grouping. In Proc. of
European Conference on Computer Vision, pages 655–670, 1998.17. B. A. Prakash, A. Sridharan, M. Seshadri, S. Machiraju, and C. Faloutsos. Patterns
and community extraction in large graphs. TR CMU-CS-09-176, 2009.18. J. Resig, S. Dawara, C. Homan, and A. Teredesai. Extracting social networks from
instant messaging populations. In Proc. of ACM SIGKDD, 2004.19. S. Sarkar and K. L. Boyer. Quantitative measures of changed based on feature
organization: Eigenvalues and eigenvectors. Computer Vision and Image Under-
standing, 71(1):110–136, July 1998.20. V. Satuluri and S. Parthasarathy. Scalable graph clustering using stochastic flows:
applications to community discovery. In Proc. of ACM SIGKDD, 2009.21. M. Seshadri, S. Machiraju, A. Sridharan, J. Bolot, C. Faloutsos, and J. Leskovec.
Mobile call graphs: Beyond power-law and lognormal distributions. In KDD, 2008.22. T. Shi, M. Belkin, and B. Yu. Data Spectroscopy: Learning Mixture Models using
Eigenspaces of Convolution Operators. In Proc. of ICML, 2008.23. G. Strang. Introduction to Linear Algebra. Wellesley-Cambridge Press, 2003.24. U. von Luxburg. A tutorial on spectral clustering. Statistics and Computing,
17(4):395–416, 2007.25. S. White and P. Smyth. A spectral clustering approach to finding communities in
graphs. In Proc. of SDM, 2005.26. X. Ying and X. Wu. On randomness measures for social networks. SDM, 2009.


![Real-Time Design Patterns: Robust Scalable Architecture for Real …index-of.co.uk/Software-Engineering/[0201699567]Real-Time... · 2019-03-07 · design patterns and their applications](https://img.pdfslide.net/doc/110x75/5ec979d3972d73389648dc3d/real-time-design-patterns-robust-scalable-architecture-for-real-index-ofcouksoftware-engineering0201699567real-time.jpg)


![Towards Lightweight and Scalable Simulation of Large-Scale ... · 2.1 Ember Motifs - Lightweight Communication Patterns for Scalable Simulation The Ember component within SST [6]](https://img.pdfslide.net/doc/110x75/5f4d122b59b8113a834e216e/towards-lightweight-and-scalable-simulation-of-large-scale-21-ember-motifs.jpg)