Embed Size (px)
Citation preview

European Integrated Hydrogen Project – Phase II (EIHP2) Sub-task 3.1: Optimum Storage Pressure
1 of 42
European Integrated Hydrogen Project - Phase 2
EIHP2
Contract N���� : ENK6-CT2000-00442
EUROPEAN INTEGRATED HYDROGEN PROJECT – Phase II(EIHP2)
Sub-task 3.1
IDENTIFICATION OF THEOPTIMUM ON-BOARD STORAGE PRESSURE
FORGASEOUS HYDROGEN CITY BUSES
March 2004
Report prepared by P Adams (Volvo Technology) in cooperation with the other Partners
Project co-funded by the European Community under the ‘Energy, Environment and Sustainable Development and Nuclear Energy Framework Programme V (1998-2002)

European Integrated Hydrogen Project – Phase II (EIHP2) Sub-task 3.1: Optimum Storage Pressure
2 of 42
EXECUTIVE SUMMARY The goal of this study is to identify an optimum on-board storage pressure(s) for compressed gaseous hydrogen (CGH2) non-articulated single deck city buses based on an assessment of safety, technical and economic issues, and refilling, vehicle and interface systems. The report also discusses the results in the context of passenger cars because of their different constraints on market acceptance, vehicle range and available storage volume. A major concern with CGH2 storage is where the upper limit lies in terms of safety issues. Without mitigating measures, an increase in the storage pressure increases the associated risk. However, it is widely believed that the risks can be reduced to acceptable levels by the measures proposed in the draft UN ECE legal requirements and draft ISO standards for vehicles, and in the EIHP2 guidelines and draft ISO standards being developed for refilling stations. No clear technical barriers to the use of CGH2 storage systems in the range of 35 - 70+MPa were identified. Nonetheless, a number of problems were identified that would need to be addressed before the introduction of such systems. In terms of storage system volume there are diminishing returns by increasing the vehicle storage pressure beyond 60-70MPa. In terms of automotive storage systems for city buses, where volume is not as critical a constraint as in cars, optimum pressures based on system weights were found at approximately 35MPa for Type 4 (non-metallic liner with full fibre overwrap) storage systems, and 50MPa for Type 3 (metallic liner with full fibre overwrap) storage systems. The optimum values were derived on the basis of a fixed quantity of 40kg of hydrogen that was assumed to provide a vehicle range of 400km. As the maximum on-board storage pressure varies, the costs will also vary. In an economic assessment of this type accurate financial data is essential, however, such data is often confidential by its very nature. To circumvent this problem the main part of the economic assessment is based on incremental costs rather than absolute costs, using an arbitrary baseline system pressure of 20MPa. In general only costs that varied with on-board storage pressure were considered including vehicle hydrogen storage, compressors, stationary storage, dispensers, and operating costs such as compressors and pre-cooling power and maintenance. The cost of hydrogen does not vary with pressure. Capital costs were found to dominate. In economic terms an optimum on-board pressure exists for Type 3 containers at approximately 35MPa, however, for the cheaper Type 4 containers the optimum on-board pressure would be slightly less than 20MPa. The optimum values were derived on the basis of a fixed quantity of 40kg of hydrogen that was assumed to provide a vehicle range of 400km. The maximum variation in incremental costs with increasing pressure is in the order of approximately 2-5 Euro Cents per km depending on the container type and refilling method. However, most of the variation occurs at pressures above 35MPa. The pressure variable costs discussed within this report amount to approximately 1% of the total costs per kilometre. Total costs are dominated by personnel and capital costs, and for Germany a typical total cost per kilometre for a diesel bus would be in the order of 5 Euro. In conclusion, taking into account all of the factors in the assessment framework (safety, technical and economic issues) and the probable direction of storage technology, it appears that for non-articulated single deck city buses an on-board storage pressure not exceeding 35MPa is the optimum. Further, it appears that overnight slow fill may be the most attractive refilling option though this may be influenced by garage land costs (not modelled in this study for slow fill options) if the land-take is substantially greater than fast fill and close vehicle parking. As capital costs account for all of the assumed vehicle costs and dominate the refilling costs, a stable low interest rate future will assist the development of the hydrogen economy. One issue that this study has not investigated is if there is an upper limit in terms of public acceptance based on perceptions of hydrogen and high-pressure system safety. For passenger cars there are clear demands for a vehicle range comparable with conventional vehicles. The shape of the cost/benefit curve is unclear, and restrictions on system cost, safety (i.e. public acceptance), or technical problems other than pressure may become the limiting factor. Given the sparse data on hydrogen systems at very high pressures, no definite recommendation on an optimum pressure for cars can be made, except to support continued research at 70MPa (and above).

European Integrated Hydrogen Project – Phase II (EIHP2) Sub-task 3.1: Optimum Storage Pressure
3 of 42
CONTENTS
Executive Summary 1 Introduction 2 Definitions 3 Scope of the study 4 Existing studies 5 Assessment framework 6 Safety assessment 7 Technical assessment 8 Economic assessment 9 Assessment framework results & conclusions 10 Passenger Cars References
INFORMAL SUB-TASK 3.1 REPORTS A DaimlerChrysler/LBST: High Pressure Storage of Hydrogen, December 2000. B Raufoss Alternative Fuel Systems informal report: Optimum CGH2 Storage Pressure
For Fuel Cell City Buses, Doc. No. RAFS-00023, 22.09.03. C Shell Global Solutions informal report: Temperature rises in pressure vessels supplied
with e-mail dated 17 July 2001. D Shell Global Solutions research note: OG.03.42*** 2nd draft for comment Optimising
Storage Pressure: Estimated Costs and Sensitivity Analysis For A Bus Fleet E Daimler Chrysler: Hydrogen Storage On The Roof Of A Fuel Cell Bus, supplied as an
e-mail dated 26 March 2003. F Norsk Hydro Internal Memo: Evaluation Of Optimum Storage Pressure For Hydrogen
Filling Stations, dated 24 June 2003 Rev.2. G Air Products: The Impact Of Land Costs For Fuelling Station Storage Upon The
Optimum Vehicle Fuelling Pressure, supplied as an e-mail dated 23 January 2004.

European Integrated Hydrogen Project – Phase II (EIHP2) Sub-task 3.1: Optimum Storage Pressure
4 of 42
1 INTRODUCTION
In the first phase of EIHP one of the issues identified as contributing to the safe and economic introduction of gaseous hydrogen vehicles was the adoption of a standard on-board storage pressure(s) (Adams, 2000). A standardised on-board storage pressure(s) would contribute to reducing:
i) The risk of refilling a vehicle to a pressure greater than that for which it was designed,
ii) Unnecessary system development costs for vehicles and the associated refilling infrastructure,
iii) The risk of damaging refilling interfaces due to incompatibility that could result from non-standardised on-board storage pressure.
Since EIHP1, industry has acknowledged the need for standardised on-board storage pressure for gaseous hydrogen vehicles. However, which pressure should be selected as the industry standard? Why not adopt the same pressure as existing natural gas vehicles, i.e. 20MPa? The values currently discussed for gaseous hydrogen service are 35MPa/5000psi and 70MPa/10000psi, i.e. approximately round numbers in both metric and imperial units. However, why adopt these values and not, for example, 50MPa and 100MPa? The goal of this study is to identify an optimum on-board storage pressure for compressed gaseous hydrogen (CGH2) non-articulated single deck city buses based on an assessment of safety, technical and economic issues. Note: Where pressures are referred to in this document they are settled pressures at 150C.
2 DEFINITIONS For the purpose of this report the following definitions have been used: Container: Any vessel used for the storage of compressed gaseous
hydrogen (UN ECE, 2004) CGH2: Compressed gaseous hydrogen Nominal Working Pressure: The pressure level at which a component typically
operates. For containers it is the settled pressure at a uniform temperature of 288K (150C) for a full container (UN ECE, 2004)
Type 3 Container: Fully Wrapped container with a seamless or welded metallic Liner (UN ECE, 2004)
Type 4 Container: Fully Wrapped container with a non-metallic Liner (UN ECE, 2004)
Existing CNG systems: 20-25MPa Nominal Working Pressure 1st generation hydrogen storage systems: 30-45MPa Nominal Working Pressure 2nd generation hydrogen storage systems: 50-70+MPa Nominal Working Pressure
3 SCOPE OF THE STUDY

European Integrated Hydrogen Project – Phase II (EIHP2) Sub-task 3.1: Optimum Storage Pressure
5 of 42
The scope of this study is restricted to non-articulated single deck city buses (standard public buses) due to the complexities of the study and the resources available. Section 10 of this report discusses the results in the context of passenger cars because of their different constraints on market acceptance, vehicle range and available storage volume.
4 EXISTING STUDIES Initially work was focused on identifying any related existing or planned studies, or storage pressures being proposed by other organisations/groups for CGH2 vehicles. Other projects/organisations using CGH2 storage that were identified are listed in Table 1.
Project Storage Pressure (MPa)
BC Hydro (CHIP) 70
Californian Fuel Cell Partnership 25 & 35
CUTE Project 35
Japan (Miti) Phase 1 Phase 2
25 & 35 50-70
US DoE Future Truck 35 - 70
(NASA X34 hypersonic aircraft) 41.4(6000psi) Note: 35MPa = approx. 5000psi, 70MPa = approx. 10000psi
Table 1
Existing & Planned CGH2 Projects & Storage Pressures
Additionally, at the time of the survey, the US Society for Automotive Engineers (SAE) was in the process of drafting a standard for gaseous hydrogen refilling connectors for vehicles. This work has now been published as SAE J2600 (SAE, 2002), and it refers to four different storage pressure levels: 25, 35, 50 & 70MPa. DaimlerChrysler supplied non-confidential parts of a report investigating the technical issues associated with very high-pressure CGH2 storage (Sub-task 3.1 Report A). The study concluded that pressures of up to 70MPa were technically feasible and that 70MPa may represent a practical upper limit to the storage pressure for CGH2 vehicles (see Section 7.2). Initial hydrogen systems were based on CNG technology with pressures in the 20-25MPa range, followed by first generation hydrogen systems based on 35MPa technology and with second generation hydrogen systems now being developed at 70MPa. No scientific studies were, or have since been, identified, which aimed to identify the optimum on-board storage pressure for CGH2 storage on-board vehicles. However, from the available information industry consensus is clearly moving towards 25, 35 & 70MPa.

European Integrated Hydrogen Project – Phase II (EIHP2) Sub-task 3.1: Optimum Storage Pressure
6 of 42
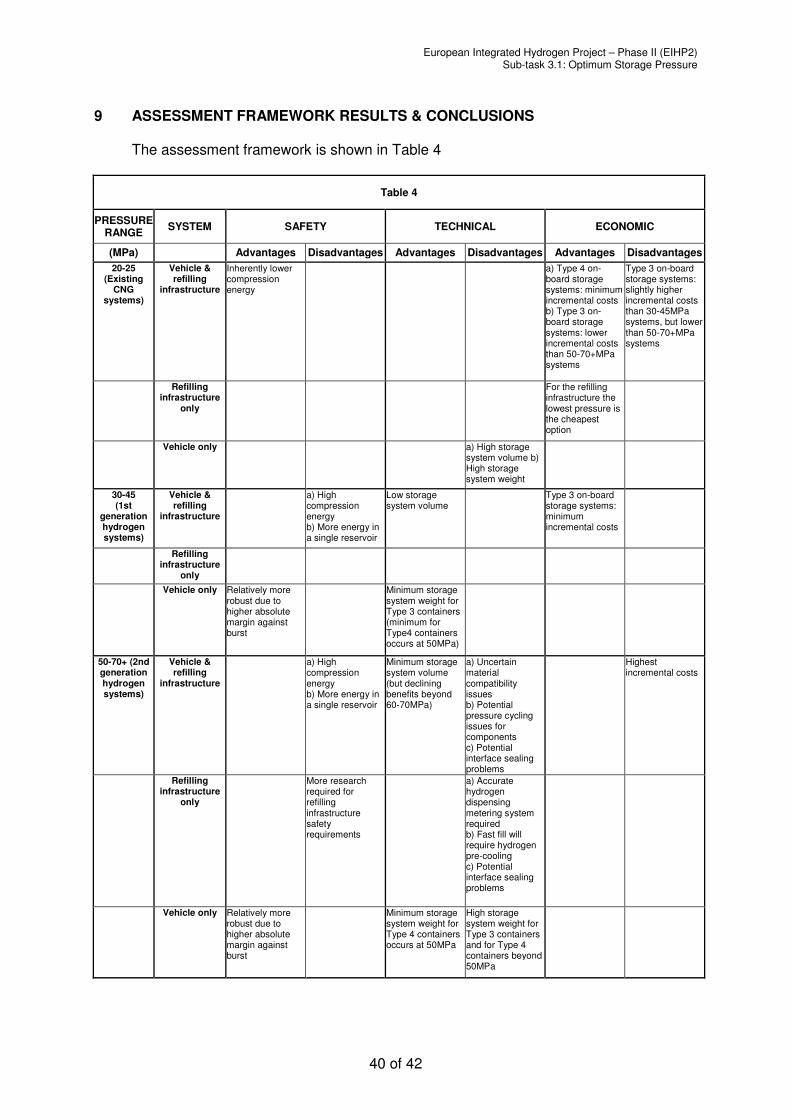
5 ASSESSMENT FRAMEWORK The assessment of the optimum on-board storage pressure for CGH2 city buses was based on the following issues:
i) Safety, ii) Technical, iii) Economic.
In addition the various systems that will affect the result were considered, including: i) Refilling station, ii) Interface, iii) Vehicle.
To allow an assessment of the optimum on-board storage pressure for CGH2 city buses, an appraisal framework has been used to collate the different types of data for the different issues and systems (see Figure1).
TECH
NIC
AL
ECON
OM
IC
SAFETY
FRAMEWORKASSESSMENT
VEHI
CLE
REFILLING STN
INTERFACE
Figure 1
Assessment Framework

European Integrated Hydrogen Project – Phase II (EIHP2) Sub-task 3.1: Optimum Storage Pressure
7 of 42
6 SAFETY ASSESSMENT
6.1 General The aim of the safety assessment is to investigate if there are any risks that become unacceptable with increasing storage pressure. The appraisal assumes that hydrogen is already accepted as a fuel, and only considers hazards related to gaseous storage that change with pressure. A detailed risk analysis is beyond the scope of this study.
6.2 Hazards & Mitigating Factors 6.2.1 Compression Energy
Hazard For a given mass of hydrogen, the compression energy within the gas in a container (pressure vessel) increases as the storage pressure increases. Sudden expansion of the gas, e.g. a rupture of the container, could have severe consequences that would increase with higher pressures. Mitigating Factors There are a number of factors that mitigate the risk of a release of the compression energy from a CGH2 storage system: i) As the storage pressure increases, the increase in compression
energy is not linear, i.e. a doubling of the storage pressure has a lesser effect on the compression energy. For adiabatic compression, an increase of storage pressure from 20 to 70MPa results in an increase of compression energy of approximately 60%.
ii) Assuming, that the only probable technology for automotive containers for the foreseeable future is based on liners fully wrapped in load carrying fibres, then higher pressures mean more fibre layers with increased wall thickness and greater inherent robustness to impact and fire damage than containers designed for lower pressures,
iii) According to draft legal requirements (based on the drafts developed within EIHP) and standards that have been developed to ensure that safety is not compromised at higher pressures (UN ECE, 2004 & ISO, 2002): a) Containers for gaseous fuel storage in automotive service are
required to have leak before break performance, i.e. a crack will develop allowing a relatively controlled release of the stored energy, rather than rupturing due to a brittle failure.
b) Containers for gaseous fuel storage in automotive service are required to have a minimum burst pressure of between 2.35 and 3.65 times the nominal working pressure depending upon the materials and type of construction.
c) As the storage pressure increases, containers will have a higher absolute margin against rupture. Assuming a metal liner fully wrapped with carbon fibre a minimum burst pressure of 2.35 times the nominal working pressure is required. This corresponds to an absolute margin of 27MPa at 20MPa nominal pressure, and 94.5MPa at 70MPa.

European Integrated Hydrogen Project – Phase II (EIHP2) Sub-task 3.1: Optimum Storage Pressure
8 of 42
d) Exposure to fire may reduce the strength of a container. However, a bonfire test is required to demonstrate that the container and its pressure relief device(s) (fire protection system) can withstand fire long enough for the gas to be vented in a controlled way via the pressure relief device(s) rather than by structural failure.
e) Containers are required to demonstrate sufficient structural integrity to withstand other types of damage without rupture, e.g. cuts in the fibre overwrap, impact damage, and a penetrating object demonstrated by a gunshot test.
iv) Typically for refilling facilities, hazards are mitigated by separation distances, protective structures and controlled releases to safe areas.
6.2.2 Hydrogen Release A) Hazard
For a given mass of hydrogen and the same release geometry, in general situations the maximum flammable mass or energy of hydrogen created during a release will increase with increasing pressure but that mass will disperse faster based on the results of EIHP2 Sub-task 5.3.
Mitigating Factors i) For unintentional releases associated with containers,
mitigating factors in Section 6.2.1 iii) apply. ii) For unintentional releases downstream of vehicle containers
the draft legal requirements (UN ECE, 2004) require an excess flow system to be installed to shut off the flow without manual intervention in the event of a line rupture or similar severe leakage.
iii) It seems likely that very high pressure vehicle storage systems will have in-tank pressure regulators or pressure regulators very close to the container to minimise the size of the very high pressure section.
iv) For intentional releases associated with pressure relief devices or pressure relief valves consideration could be given to optimising the pressure build up/hydrogen release rate for a particular system.
Note: For refilling facilities the high-pressure section will include the refilling line.
B) Hazard
A very high-pressure jet may cause sufficient turbulence to increase the likelihood of a detonation (Shell, 2001).
Mitigating Factors i) Points ii)-iv) in Section A) above would reduce the probability
of a very high pressure hydrogen jet release, ii) For intentional releases, e.g. from a pressure relief device, the
vent design could be optimised to minimise turbulence.

European Integrated Hydrogen Project – Phase II (EIHP2) Sub-task 3.1: Optimum Storage Pressure
9 of 42
C) Hazard
A hydrogen release in a tunnel is significantly more severe than in a less confined environment. For a comparable release, the available energy in the flammable cloud is greater and remains for a longer period in tunnels than in more open environments based on the results of EIHP2 Sub-task 5.3. Mitigating Factors i) Points i)-iv) in Section A) above would reduce the probability
of a hydrogen release,
Other Factors i) For smaller releases, e.g. venting of a single pressure vessel
of up to 200 litres size, the maximum flammable mass and overpressures if the cloud is ignited, are very similar regardless of the initial pressure based on the results of EIHP2 Sub-task 5.3. However, for larger releases, e.g. more or less simultaneous triggering of all PRDs, overpressures and fireball effects if the cloud is ignited increase with increasing vehicle storage pressure.
ii) Further research is required on the effects of hydrogen releases in tunnels and mitigating measures.
6.2.3 Self-ignition Of Hydrogen Releases
Hazard Self-ignition due to hydrogen releases from high velocity jets. Spontaneous ignition of hydrogen has been reported to occur when venting at pressures greater than 14MPa (ISO, 1999). Anecdotal evidence of such ignitions has also been reported in the process industry. Mitigating Factor Anecdotal reports by various research and testing organisations indicate that the spontaneous ignition of hydrogen venting from high-pressure systems designed for vehicles has not been observed, though it is not clear if the tests were set up to investigate such issues and the observations are not necessarily representative of real world scenarios.
6.2.4 Degradation Of Material Properties
Hazard Degradation of the mechanical properties of structural materials, e.g. hydrogen embrittlement. Mitigating Factor
The draft legal requirements (UN ECE, 2004) have been developed to expose any hydrogen embrittlement issues during type approval testing

European Integrated Hydrogen Project – Phase II (EIHP2) Sub-task 3.1: Optimum Storage Pressure
10 of 42
regardless of the nominal working pressure of the system. For refilling facilities, industry guidelines exist for hydrogen compatible materials.
6.2.5 Permeation
Hazard Hydrogen permeation through storage materials increases with increasing storage pressure. Mitigating Factors i) Permeation is not considered to be a problem for metallic materials
typically used in high-pressure automotive systems. ii) For non-metallic liner materials, the draft legal requirements (UN
ECE, 2004) require specific measures to mitigate the effect of permeation, i.e. a limitation on the permitted permeation rate and if mounted inside the vehicle, a gas tight housing vented to atmosphere.
iii) For materials in refilling facility components, e.g. refilling hoses, permeation will increase with pressure but the amounts are small and acceptable if not trapped. Hydrogen refilling facilities should always be outdoors.
6.3 Conclusions
A major concern with CGH2 storage is where the upper limit lies in terms of safety issues. Clearly, without mitigating measures, an increase in the storage pressure increases the associated risk. However, it is widely believed that the risks can be reduced to acceptable levels by the measures proposed in the draft UN ECE legal requirements and draft ISO standards for vehicles, and in the EIHP2 guidelines and draft ISO standards being developed for refilling stations.
7 TECHNICAL ASSESSMENT
7.1 General Issues were investigated that may be barriers to the successful introduction of 1st or 2nd generation CGH2 storage systems.
7.2 DaimlerChrysler/LBST Report DaimlerChrysler supplied non-confidential parts of a report by LBST investigating the technical issues associated with 1st and 2nd generation CGH2 storage systems from both the vehicle and infrastructure perspectives (Sub-task 3.1 Report A). The results of the study suggested that pressures of up to 70MPa are technically feasible, but that 70MPa may represent a practical upper limit to the storage pressure. From Figure 2 it can be seen that the slope of the volumetric storage density curve decreases noticeably at pressures beyond 60-70MPa. As a result there are diminishing returns in terms of reduced storage space by increasing the storage pressure much higher than 70MPa. This effect appears to diminish with increasing fibre quality. Figure 2 also shows the very large volume that is required to store hydrogen. From Figure 3 it can be seen that the gravimetric storage density peaks at approximately 45-50MPa for

European Integrated Hydrogen Project – Phase II (EIHP2) Sub-task 3.1: Optimum Storage Pressure
11 of 42
standard fibres and at 60MPa for higher fibre quality. Aerospace fibre is very expensive and is unlikely to be used for automotive applications.
Figure 2
Volumetric Storage Density vs. Vehicle Storage Pressure For Different Fibre Types
(Extract from Sub-task 3.1 Report A)
Figure 3
Gravimetric Storage Density vs. Vehicle Storage Pressure (Extract from Sub-task 3.1 Report A)

European Integrated Hydrogen Project – Phase II (EIHP2) Sub-task 3.1: Optimum Storage Pressure
12 of 42
7.3 Refilling Infrastructure Issues i) Safety standards for the infrastructure associated with 1st and 2nd generation
CGH2 storage systems in residential areas are underdeveloped, ii) An accurate metering system is required for sales and tax purposes. The
present requirements are +/-0.5% for petrol and +2% for CNG at 20MPa. As the dispensing pressure increases, it becomes harder to maintain the same accuracy over a wide pressure range.
iii) Very high pressures may cause problems with flexible components, e.g. refilling lines.
iv) Pressure cycling requirements for the refilling facilities: city buses typically refill once per day while cars may refill up to 3 times per day, e.g. taxis, but refilling station components may experience hundreds of pressure cycles per day.
v) Some materials/designs for 1st and 2nd generation CGH2 storage systems may suffer from fatigue problems including some aluminium alloys.
vi) Pressure cycling requirements for components may be more problematic with increasing pressure.
7.4 Vehicle Issues
7.4.1 CGH2 Storage System
The RAFS report (Sub-task 3.1 Report B) identifies the minimum number of containers required to give a city bus the maximum range that is likely to be required, i.e. a hydrogen capacity of 40kg (see Section 8.3.2 iv)), see Table 2.
Nominal Working Pressure
(MPa)
Hydrogen Density/1 (Kg/m3)
Storage Volume For 40 Kg Hydrogen
(Litres)
Minimum Number Of 125L
Containers
Minimum Number Of 200L
Containers
20 15.0044 2666 22 14
25 18.2061 2197 18 11
35 24.0281 1665 14 9
45 29.1651 1372 11 7
50 31.5087 1269 10 7
60 35.8034 1117 9 6
70 39.6407 1009 8 5
100 49.0276 816 7 4 Note: Container volume refers to internal volume.
Table 2
Containers Required To Store 40Kg Hydrogen At 20-100MPa (Extract from Sub-task 3.1 Report B)
Although the number of containers reduces significantly with increasing pressure this does not translate into a similar reduction in overall storage system weight and volume. At higher pressures the containers have to be stronger and therefore require more materials making them externally larger and heavier. This effect is amplified by the thick wall effect, in which the effect of increasing the over-wrap
1 Density data (± 1%) provided by Norsk Hydro

European Integrated Hydrogen Project – Phase II (EIHP2) Sub-task 3.1: Optimum Storage Pressure
13 of 42
wall thickness is lessened as the outer fibres become less efficient as the number of fibre layers increases due to the poor ability to transmit loads through the layers. The overall system weights needed to store 40kg of hydrogen are shown in Figure 4.
500
600
700
800
900
1000
1100
1200
1300
1400
20 40 60 80 100 Vehicle Storage Pressure (MPa)
Wei
ght (
kg) T3 125L
T3 200L T4 125L T4 200L
Figure 4 Estimated System Weights To Store 40Kg Hydrogen At 20-100MPa
(Extract from Sub-task 3.1 Report B) From Figure 4 there is a maximum variation of 400kg depending on the type of construction, container size and storage pressure. The maximum variation corresponds to approximately 50% of the lightest system weight. It can be seen that increasing storage pressure initially decreases the overall system weight, before increasing again with further increases in storage pressure despite fewer containers, i.e. there is an optimum value. The optimum value in terms of storage system weight occurs at approximately 35MPa for Type 4 storage systems, and 50MPa for Type 3 storage systems. Minimising the weight of the roof mounted system has numerous advantages for the overall design of the bus, including improved handling and a lighter structure. A reduction in overall system weight would permit more passengers to be carried. As a simple guideline a 35MPa CGH2 system (40kg hydrogen) occupies a similar volume to a typical 20MPa CNG system.
7.4.2 Other Issues
i) The temperature rise of the gas inside the container during fast filling is an area of concern and is exacerbated by hydrogen’s non-ideality. In particular the insulating effect of the overwrap material for Type 3 and 4 containers delays the dissipation of heat from the gas. An informal report was prepared by Shell (Sub-task 3.1 Report C). In Type 3 containers the metal liners have

European Integrated Hydrogen Project – Phase II (EIHP2) Sub-task 3.1: Optimum Storage Pressure
14 of 42
a larger thermal conductivity, which gives them a fast refilling advantage over Type 4 containers with non-metallic liners.
ii) 1st and 2nd generation CGH2 storage system pressures may cause problems with flexible components, e.g. flexible fuel lines.
iii) Some materials/designs for 1st and 2nd generation CGH2 storage systems may suffer from fatigue problems including some aluminium alloys.
iv) For 1st and 2nd generation hydrogen containers, sealing of non-metallic liners (Type 4 construction) with the boss may be problematic.
v) Pressure cycling requirements may be more problematic with increasing pressure.
7.5 Conclusions
No clear barriers to the use of 1st or 2nd generation CGH2 storage systems were identified. Nonetheless, a number of problems were identified that would need to be addressed before the introduction of such systems. In terms of storage system volume there diminishing returns by increasing the vehicle storage pressure beyond 60-70MPa. In terms of automotive storage systems for buses, where volume is not as critical a constraint as in cars, optimum pressures based on system weights were found at approximately 35MPa for Type 4 storage systems, and 50MPa for Type 3 storage systems.
8 ECONOMIC ASSESSMENT 8.1 Introduction
The goal of the economic assessment is to identify if an optimum on-board storage pressure(s) exists for CGH2 city buses based on economic issues associated with both the vehicle and the refilling infrastructure. A wide range of information relating to the vehicle systems, vehicle operation, and the refilling infrastructure has been collated and analysed in the economic assessment. From the basic data the primary elements of the cost changes with varying storage pressure can be derived including: • Vehicle costs, e.g. equipment, fuel consumption and maintenance • Refilling costs, e.g. equipment, maintenance, service levels and fuel supply Factors that may influence the economic assessment of the optimum on-board storage pressure are illustrated in Figure 5. In this report the economic assessment will investigate the optimum solution over the expected life of a city bus, with the results presented in terms of a cost per vehicle kilometre.

European Integrated Hydrogen Project – Phase II (EIHP2) Sub-task 3.1: Optimum Storage Pressure
15 of 42
OptimumStoragePressure(x Euro/km)
VehicleDesign &
Performance
RefuellingFacilities
Container& Equipment
Costs
Effect On FuelConsumption
Refuelling &Compression
Costs
Varioussources
VehicleManufacturer
VehicleManufacturer
H2 Producer/Retailer
Container/EquipmentSpecialist
Container/EquipmentSpecialist
InformationInputs
CostInputs
Safety
Container& Equipment
Design
H2 Producer/Retailer
Figure 5
Factors That May Influence The Economic Assessment Of The Optimum On-board Storage Pressure For CGH2
8.2 Incremental Costs
As the maximum on-board storage pressure varies, the costs will also vary. In an economic assessment of this type accurate financial data is essential, however, such data is often confidential by its very nature. To circumvent this problem the assessment has been structured to use incremental costs rather than absolute costs. The incremental costs have been calculated for the various pressures around an arbitrary baseline system pressure of 20MPa. The use of incremental costs has been beneficial with respect to obtaining otherwise confidential information required for the assessment, particularly for on-board storage.
8.3 Vehicle 8.3.1 General
This section discusses the costs that influence the optimum storage pressure from the vehicle perspective.
8.3.2 Assumptions
Vehicle types vary considerably in terms of operating characteristics and costs, hence a number of assumptions have been made and are described in this section. Although most of the assumptions are related to the operational requirements and affect the vehicle systems they may also influence the refilling infrastructure.

European Integrated Hydrogen Project – Phase II (EIHP2) Sub-task 3.1: Optimum Storage Pressure
16 of 42
i) Vehicle Type A non-articulated single deck city bus for European markets was assumed for this study, typical dimensions being: Length = 12.0m Width = 2.5m Height = 3.0m
ii) Vehicle Life The vehicle life is based on the lifetime mileage that a bus operator would assume for a new bus in European markets, i.e. the mileage before it would be replaced. DaimlerChrysler and Volvo agreed a lifetime vehicle mileage of 1,000,000km.
iii) Fleet Size Fleet sizes to be investigated:
20, 100 & 150 buses The fleets are assumed to be all hydrogen fuelled.
iv) Hydrogen Storage Pressure Range The pressure range to be considered was agreed to be 20 to 70MPa. The lower limit of 20MPa was chosen to give a direct comparison with existing natural gas vehicles. The upper limit was chosen on the basis of Section 7.2 of this report. Available Hydrogen Storage Volume It was assumed that the hydrogen would be stored on the roof of the bus in common with the majority of European natural gas buses because: • Collision damage to city buses occurs most frequently at typical vehicle
heights, i.e. up to 1m above the ground, while city buses infrequently experience damage on the roof,
• Hydrogen leakage from the storage system into the bus compartment is avoided,
• Maintainability is improved by easy access to the components on the bus roof.
The storage space available on the roof of a bus is restricted due to: • Cooling & other equipment located on the roof, • Escape hatches, • Overall height. DaimlerChrysler (Sub-task 3.1 Report E) and Volvo investigated the typical maximum roof area that is available on a city bus for fuel storage and the maximum height available on top of the roof. If it is assumed that a bus has to carry the same mass of hydrogen regardless of the storage pressure, then clearly the roof space becomes more critical the lower the storage pressure. For this study we can assume that air conditioning and cooling
European Integrated Hydrogen Project – Phase II (EIHP2) Sub-task 3.1: Optimum Storage Pressure
17 of 42
units can be located elsewhere on the bus if necessary, permitting a maximum available hydrogen storage space of 8.0m (length) x 2.3m (width) x 0.9m (depth). Hydrogen Required DaimlerChrysler and Volvo investigated the quantity of hydrogen that it would be necessary to store on a city bus, which is dependant on a range of factors including: • Vehicle range • Hydrogen consumption
- Performance (power) requirements - Drive train type & characteristics, e.g. ICE or fuel cell, system
design, hybridisation, etc. - Vehicle weight - Air resistance - Rolling resistance
• Storage volume available The study assumes a fuel cell drivetrain, however, it would also apply to an internal combustion engine drivetrain. The only difference being that the vehicle range would reduce due to the less efficient drivetrain. Based upon detailed vehicle and power train simulations by Volvo for another EC project, a requirement of 40-45kg of hydrogen was identified depending upon the size of energy recovery device for a driving range up to 475km. The results were based on simulated operating cycles in Gothenburg (Sweden) and Braunschweig (Germany). DaimlerChrysler estimates were for a driving range of up to 400km and were derived from typical diesel fuel consumption rates, but without an energy recovery device, giving a hydrogen requirement of 40-48kg. From the calculations described above, DaimlerChrysler and Volvo agreed for this study that the maximum mass of hydrogen to be stored on-board should be 40kg and assuming a vehicle range of 400km.
v) Containers Container Configurations Container costs were based on typical container sizes used in existing CNG systems of 125 and 200litre water volume. It was noted that a single container would give the optimum results in pure economic terms. Container Details The following assumptions were made for the containers: i) Cylindrical with hemispherical ends, ii) Inner diameter fixed at 350mm, iii) Only Type 3 and Type 4 designs have been considered as they are
the most likely to be used with existing materials, iv) Over-wrap to be carbon fibre. For Type 3 containers the liner is
assumed to be aluminium.

European Integrated Hydrogen Project – Phase II (EIHP2) Sub-task 3.1: Optimum Storage Pressure
18 of 42
v) Container designs shall be in accordance with the draft ECE regulations (UN ECE, 2004),
vi) Maximum material temperature shall be 850C during both service and refilling (UN ECE, 2004),
vii) Maximum average gas temperature inside the container shall be 850C including during both service and refilling (UN ECE, 2004),
viii) Expected service life of 20 years (UN ECE, 2004).
The base cases were assumed to be: • Type 3 (Fully wrapped) container; aluminium liner/carbon fibre over-
wrap; maximum system storage capacity 40kg, with individual container water capacities of 125 litres and 200 litres.
• Type 4 (Fully wrapped) container; plastic liner/carbon fibre overwrap; maximum system storage capacity 40kg, with individual container water capacities of 125 litres and 200 litres.
For the sensitivity analysis the following issues were considered: • Changes in carbon fibre types, • Container burst pressure levels, • Large-scale production.
vi) High-pressure Systems Other Than Containers System designs are assumed to be in accordance with the draft ECE regulations (UN ECE, 2004). The focus for related vehicle costs was placed on the containers, as systems exceeding 20-25MPa are considered likely to use internal pressure regulators due to, for example, sealing problems at interfaces. Hence there is likely to be a marginal effect on ancillary equipment costs, e.g. valves, etc. The costs of internal pressure regulators are not expected to vary significantly as they are exposed to uniform pressure. For this study the container, pressure regulator, automatic cylinder valve and pressure relief device were considered. The expected service life is 20 years (UN ECE, 2004).
8.3.3 Container And Other High-Pressure Equipment Costs
The data for this section is based on the results of the RAFS study (Sub-task 3.1 Report B). The RAFS results are based on four typical automotive container designs, i.e. Type 3 and 4 designs with 125 and 200 litre internal volume, see Figure 6. The results take into account a reduction in the number of containers and ancillary components that would be possible with increasing pressure. The base case is assumed to be Type 3, 200 litre containers at 20MPa. The results are based on the following additional assumptions to those stated in Section 8.3.2: • The report has adopted a cost ratio between containers and the other
accessories, which is based on an assessment of cost relationships for similar 20MPa CNG-systems today. Identical ratios are used for all the evaluated pressure levels.
• Both weight and cost related to the overwrap increases proportionally to pressure, except for the deviation caused by the thick-wall effect.

European Integrated Hydrogen Project – Phase II (EIHP2) Sub-task 3.1: Optimum Storage Pressure
19 of 42
• The liner thickness and inner diameter is fixed for all containers. Increasing the composite wall thickness, which is necessary to add sufficient strength to the containers at higher pressures, will only affect the outer diameter.
• Permeability issues related to plastic liners are disregarded in the analysis, as are fatigue issues related to metallic liners at high pressures.
• Although the cost evaluation for Type 3 containers is based on aluminium liners, it is presumed that the results will be fairly similar for other metallic liners, e.g. steel. If, for example, stainless steel is used, it must be competitive with aluminium.
• Issues related to tightness and structural integrity of liner/boss interfaces or boss/valve connections for Type 4 containers are not dealt with in the analysis.
The incremental storage system costs are spread over the vehicle life to obtain a cost per vehicle-km. The assumption of a lifetime vehicle mileage of 1,000,000km is taken from Section 8.3.2 ii).
-10000 -8000 -6000 -4000 -2000
0 2000 4000 6000 8000
10000
20 40 60 80 100 Vehicle Storage Pressure (MPa)
Incr
emen
tal V
ehic
le S
tora
ge S
yste
m C
ost
(Eur
o)
T3 125L T3 200L T4 125L T4 200L
Note: Base Case, Type 3 200L
Figure 6 Incremental Vehicle Storage System Costs
To Store 40Kg Hydrogen (Extract from Sub-task 3.1 Report B)
8.3.4 Vehicle Construction, Assembly & Testing Costs
Any cost changes related to changes in the maximum storage pressure due to different requirements for vehicle construction, assembly and testing are assumed to be negligible when series production is considered and the cost changes are considered in terms of vehicle-kilometres. Such costs could include: • Effects on the vehicle structure due to the varying weight of the storage
system, • Leak testing of the high pressure system,

European Integrated Hydrogen Project – Phase II (EIHP2) Sub-task 3.1: Optimum Storage Pressure
20 of 42
• Very high-pressure systems may be more complex with longer assembly times.
8.3.5 Fuel Costs
A change in vehicle weight will influence the fuel consumption. A typical city bus weighs approximately 18 tonnes with the weight restricted by axle load limitations. From Sub-task 3.1 Report B the hydrogen storage system weight varies between –285kg and +160kg around the base case, which is equivalent to approximately –1.6% to +0.9% of the total vehicle weight. Within the limitations of this study in terms of the hydrogen consumption, e.g. would an energy recovery device be fitted, such a variation in vehicle weight would have negligible effect on the fuel costs.
8.3.6 Maintenance Costs Many direct and indirect maintenance costs related to high-pressure system testing could be expected to increase with increasing storage pressure, e.g. test gas and some maintenance equipment such as pressure measuring equipment. Labour costs would be similar regardless of the pressure and would form a significant element of the maintenance costs. Increasing storage pressure would lead to an increase in the individual cost associated with periodic replacement of components, and possibly increased replacement frequency. However, there is a significant advantage associated with increasing the storage pressure. As can be seen from Table 2, increasing storage pressure substantially reduces the number of containers and therefore the associated number of ancillary components requiring maintenance, e.g. valves and pressure relief devices and if used in-tank pressure regulators, unless an assembly concept is used. The reduction is almost a factor of 3 between 20MPa and 70MPa. The maintenance costs are assumed to be negligible when the cost changes are considered in terms of vehicle-kilometres.
8.3.7 Bus Operator Revenue A change in vehicle weight will influence the number of passengers that could be carried, i.e. standing passengers. A typical city bus weighs approximately 18 tonnes with the weight restricted by axle load limitations. From the Sub-task 3.1 Report B, the hydrogen storage system weight varies between –285kg and +160kg around the base case. Such a variation in vehicle weight would equate to approximately +4 and -2 passengers assuming that the rest of the drivetrain is similar for all of the cases. In terms of bus operator revenue it is not possible to give an effect on the costs because: i) A bus typically only operates at maximum passenger capacity for short
periods, e.g. rush hours or special events, ii) Fares vary significantly from one area to another and may be influenced
by public subsidies. 8.3.8 Cost Of Capital
European Integrated Hydrogen Project – Phase II (EIHP2) Sub-task 3.1: Optimum Storage Pressure
21 of 42
The vehicle analysis assumes that all capital expenditure is recovered over 10 years at an interest rate of 15%. A high interest rate was selected because of the high proportion of capital costs within the pressure variable costs and to recognise the longer term risk of upward movement in interest rates.
8.4 Refilling Infrastructure 8.4.1 General
This section summarises the work undertaken on the refilling infrastructure issues by Air Products (land costs), NorskHydro (compression and pre-cooling power requirements) and Shell (combined refilling costs) (Sub-task 3.1 Reports G, F and D respectively), and it discusses the main costs that influence the optimum storage pressure from the refilling infrastructure perspective.
8.4.2 Hydrogen Production
Hydrogen production and transportation is a key element in the unit cost of hydrogen delivered by the refilling station, however, this cost is considered to be independent of the final supply pressure to the vehicle and is not considered in the main section of this study.
8.4.3 Assumptions i) Quantity To Be Refuelled
City buses would typically require 27kg of hydrogen per day. It was assumed that buses would be refuelled from a minimum level of 13kg to the maximum of 40kg every day.
ii) Refilling Operations DaimlerChrysler and Volvo investigated refilling operations by city bus operators. Buses are refilled on a daily basis after operation regardless of the quantity of fuel remaining. At some garages the driver may refuel, while at others operatives will be employed to refuel, wash and park the buses. Given that the first buses will start arriving back at the garage in the early evening, up to 12 hours will be available between peak vehicle usage. For fast filling of CNG buses, typically two fuel dispensers are used up to a fleet size of approximately 150 vehicles, with the majority of vehicles returning after the evening rush hour during a two hour period. At the EIHP2 Mid-term Workshop in 2002, participants Faber and Staubli suggested investigating slow-fill of all buses in parallel, as this is standard practice for CNG bus fleets in both France and Sweden. It is not considered to be expensive, as when using a central reservoir and compressor only a hose and nozzle are required for each bus.
European Integrated Hydrogen Project – Phase II (EIHP2) Sub-task 3.1: Optimum Storage Pressure
22 of 42
Three main refilling scenarios are considered: a) Fast fill (base case). Hydrogen is produced and compressed into
stationary storage tanks until needed. Hydrogen flows into the vehicle by differential pressure, so some over-pressure is needed in the stationary tanks. The refilling is of short duration so significant heating occurs in the vehicle containers. The base case investigated was fast filling over a period of 5 hours with stationary storage in Type 4 containers. An alternative case with stationary storage in Type 3 containers was also investigated.
b) Slow overnight fill of all buses in parallel. Hydrogen is produced and compressed directly into the vehicle containers, so neither stationary tanks nor over-pressure are needed. The refuelling is of long duration, so no build-up of heat occurs in the vehicle.
c) Boost fill. This is a variant of fast fill in which the pressure in the stationary storage tanks is lower than the vehicle pressure. A boost compressor in the fuel dispenser delivers hydrogen at higher pressure directly into the vehicle containers. The refuelling is of short duration so some heating occurs in the vehicle containers. The boost fill scenario takes place over a period of 5 hours with stationary storage in Type 4 containers (plastic liners).
iii) Number Of Refilling Dispensers
For Scenarios a) and c) above the number of refilling dispensers will be related to the throughput of buses returning to the depot after the evening peak hour traffic. It was assumed that 2/3 of the fleet is refilled in 3 hours and that the remaining 1/3 is refilled in a further 2 hours. A 5-minute refilling time is assumed, which will approximately equate to a total refilling station occupancy time of 15 minutes per bus including time for manoeuvring the bus, connecting/disconnecting the dispenser nozzle, cleaning, completing records, etc. For Scenario b) above, one connection per bus is required.
iv) Refilling Station/Vehicle Communication Communication between the vehicle and the refilling station has not been considered for this study.
v) Vehicle Refilling Rate It was assumed that the refilling rate is governed by a maximum refilling temperature of 850C. NorskHydro and Shell believe that pre-cooling of the hydrogen would be required for fast fill to pressures higher than 35MPa. Pre-cooling costs are considered as part of the refilling costs. The requirement for pre-cooling is dependant on ambient temperature, filling time, initial and final pressure and the container type. A maximum material temperature and average gas temperature of 850C was assumed in accordance with the draft ECE regulations (UN ECE, 2004).

European Integrated Hydrogen Project – Phase II (EIHP2) Sub-task 3.1: Optimum Storage Pressure
23 of 42
vi) Hydrogen Production Hydrogen was assumed to be delivered to the compressor at 20°C and 1.5MPa and is available at any (constant) rate and operating period required by the compressor.
8.4.4 Land Costs
APCI investigated land costs and found an average to be in the order of 195Euro/m2 (Sub-task 3.1 Report G). Figure 7 shows a comparison of overall land costs for different storage pressures and unit land costs. For every kilogram of hydrogen that is dispensed, the water volume of storage required at a filling station decreases as the vehicle fill pressure is increased. Hence the footprint of the storage area decreases for stations that are designed to fill to higher pressures and so land costs fall correspondingly. However, on the assumption that locating other equipment in the safety zone can optimise land use, the review ignores the potential impact should larger safety (separation) distances be required at higher pressures.
0
10,000
20,000
30,000
40,000
50,000
60,000
70,000
35 115 195 270 350
Cost Of Land (Euro/m2)
Ove
rall
Cos
t Of L
and
For
Sto
rage
Sys
tem
(E
uro)
700 bar fill 500 bar fill 350 bar fill 250 bar fill
Figure 7 Overall Land Costs For Differing Unit Costs & Vehicle Storage Pressures
(100 Bus Depot) (Extract from Sub-task 3.1 Report G)
When increasing the vehicle storage pressure and comparing the increase in cost of other pressure dependant refilling infrastructure capital costs against the corresponding reduction in expenditure on land, the increase in other capital costs far outweigh the reduction in expenditure on land. A quick estimate would put the reduction in land costs at less than 5% of the other refilling infrastructure capital costs, even for the most expensive land. Hence the expenditure on land is considered to be insignificant in comparison to the other capital costs and should not affect the economic optimisation of the vehicle storage pressure. Even where

European Integrated Hydrogen Project – Phase II (EIHP2) Sub-task 3.1: Optimum Storage Pressure
24 of 42
land is scarce, the requirements for parking a fleet of buses is likely to far outweigh the area used for the stationary hydrogen storage.
8.4.5 Stationary Storage At higher pressures the cost of steel tanks rapidly overtakes the cost of composite tanks for stationary storage. Shell assumed a base line cost of 400 Euro/kg hydrogen (based on public information from various sources) to the relative costs quoted by RAFS, giving a break point between steel and composite construction of 33.6MPa. On this basis in the future, steel is likely to be used only for low-pressure tanks, and composites for high-pressure tanks. In the Shell analysis, all the stationary storage is assumed to be in composite tanks.
8.4.6 Dispensing Equipment CNG dispensers are available for pressures up to 25MPa, and have been adapted for hydrogen at higher pressures. However, the market is not well developed and costs for mass production are uncertain. The figures used in the Shell analysis were estimated assuming that costs will increase as working pressure rises. However, the cost of dispensers were found to be a relatively small part of the total costs, so the quality of the cost estimate does not have a major influence on the conclusions. For the slow fill cases the cost of dispensing equipment has been omitted from the calculations since it is essentially only a supply line and valve.
8.4.7 Compression & Pre-Cooling For Fast Filling Compressor requirements are detailed in the NorskHydro and Shell reports (Sub-task 3.1 Reports F and D). At pressures above 35MPa it has been assumed that pre-cooling of the hydrogen is required to counteract the compression heating of the gas in the on-board containers for fast fill. NorskHydro estimated these costs for a variety of ambient temperatures. In the Shell analysis a worst case was assumed of an ambient temperature of 30°C. The costs are based on energy consumption but not capital cost. The cost of the refrigeration compressor will rise as the amount of cooling increases, but probably slightly less than linearly because larger compressors are cheaper per unit throughput. The hydrogen pressure will influence the strength of the heat exchanger, and costs are likely to increase linearly, as for steel containers. To some extent, these trends are already modelled in the cost of the hydrogen compressor and the stationary storage, allowing identification of the optimum pressure even if the costs are underestimated. Electrical energy was assumed for compression and pre-cooling. Sub-task 3.1 Report D used average figures for OECD Europe and the USA. The energy usage, for both compression and refrigeration is directly proportional to the number of operational days. If a 50% service is assumed on Sundays and public holidays, then a reasonable operating period would be 333 days per year. The economic analysis has generally assumed 365 days. The effect of the change would be a slight increase in the operating costs per vehicle kilometre,

European Integrated Hydrogen Project – Phase II (EIHP2) Sub-task 3.1: Optimum Storage Pressure
25 of 42
because a compressor of the same size as before is now being written off over a slightly smaller throughput.
8.4.8 Maintenance Many direct and indirect maintenance costs related to high-pressure system testing could be expected to increase with increasing storage pressure, e.g. test gas and some maintenance equipment such as pressure measuring equipment. Labour costs would be similar regardless of the pressure and would form a significant element of the maintenance costs. Increasing storage pressure would lead to an increase in the individual cost associated with periodic replacement of components, and possibly increased replacement frequency. However, as with vehicle storage, there is a significant advantage associated with increasing the storage pressure since it substantially reduces the number of containers and therefore the associated number of ancillary components, e.g. shut-off valves, to be maintained. The refilling maintenance costs are assumed to be 5% of the stationary storage and compressor capital costs.
8.4.9 Cost Of Capital
Sub-task 3.1 Report D assumed that all capital expenditure is recovered over 10 years at an interest rate of 15%. Compressors and stationary storage tanks may physically last longer than 10 years. However, technology is changing rapidly in this area and the relatively short payback time reflects the technological risk, e.g. owning a half paid-for compressor in a world that may have switched to liquid hydrogen.
8.4.10 Overall Refilling Costs
Sub-task 3.1 Report D provides absolute costs per kg of hydrogen delivered. Based on the report the absolute refilling costs were calculated in terms of vehicle kilometres, and from this data the incremental refilling costs per vehicle km around the base case of 20MPa were calculated, see Figure 8.

European Integrated Hydrogen Project – Phase II (EIHP2) Sub-task 3.1: Optimum Storage Pressure
26 of 42
-4
-2
0
2
4
6
8
10
12
20 25 35 45 50 60 70
Vehicle Storage Pressure (MPa)
Incr
emen
tal R
efill
ing
Cos
t Per
Veh
icle
Km
(Eur
o C
ents
/veh
.km
)
Base Case Fast Fill T4 SS
Fast Fill T3 SS ,
Slow Fill 100 Buses
Slow Fill 20 Buses
Boost Fill T4 SS
Note: SS = Stationary storage Figure 8
Incremental Refilling Costs (Euro Cents/Veh.km) (Hydrogen production costs are NOT included)
8.4.11 Sensitivity Sub-task 3.1 Report D considered the different refilling scenarios (see Section 8.4.3 ii)) as part of the sensitivity analysis plus variations on the following data: i) Fleet size, ii) Compressor running hours, iii) Cascade utilisation efficiency, iv) Capital recovery factors, v) Electricity costs.
8.5 Overall Incremental Costs & Results
The aim of this economic study is to investigate if there is an optimum on-board storage pressure over the service life of a city bus. The assessment has been made in terms of incremental cost per vehicle kilometre based on the assumptions stated earlier by combining the vehicle related costs with the refilling related costs. Base Case For vehicles the base case was taken as Type 3 containers (aluminium liners fully wrapped with carbon-fibre) with a water capacity of 200 litres. For the refilling infrastructure, the base case was taken as a fast fill scenario over a period of 5 hours using Type 4 containers for stationary storage.

European Integrated Hydrogen Project – Phase II (EIHP2) Sub-task 3.1: Optimum Storage Pressure
27 of 42
Other Cases Other cases considered were based on a matrix of vehicle and refilling cases as indicated in Table 3.
Refilling Case Vehicle Case Fast Fill, Type 4
Stationary Storage
Fast Fill, Type 3
Stationary Storage
Slow Fill, 100 Buses
Slow Fill, 20 Buses
Boost Fill, Type 4
Stationary Storage
Type 3 125L X X X X X*
Type 3 200L BASE CASE X X X X*
Type 4 125L X X X X X*
Type 4 200L X X X X X*
Note *: Cases only considered above 35MPa
Table 3 Cases Investigated
The incremental costs were calculated for the various pressures around an arbitrary baseline system pressure of 20MPa. The combined results are presented in Figure 9a. Figure 9b shows the extracted incremental cost variations for the cheapest vehicle storage system (Type 4, 200L containers) for the different refilling options. Figure 9c shows the incremental cost variations for the refilling base case (fast fill with Type 4 stationary storage) for the different vehicle storage options. Figure 9d shows the incremental cost variations for the cheapest refilling option (slow fill for 100 buses) for the different vehicle storage options.

European Integrated Hydrogen Project – Phase II (EIHP2) Sub-task 3.1: Optimum Storage Pressure
28 of 42
-6
-4
-2
0
2
4
6
8
10
12
14
20 25 35 45 50 60 70
Vehicle Storage Pressure (MPa)
Incr
emen
tal C
ost p
er V
ehic
le k
m(E
uro
Cen
ts/v
eh.k
m)
T3 125L & Fast FillT4 SST3 125L & Fast FillT3 SST3 125L & Slow Fill100 BusesT3 125L & Slow Fill20 BusesT3 125L & Boost FillT4 SST3 200L & Fast FillT4 SST3 200L & Fast FillT3 SST3 200L & Slow Fill100 BusesT3 200L & Slow Fill20 BusesT3 200L & Boost FillT4 SST4 125L & Fast FillT4 SST4 125L & Fast FillT3 SST4 125L & Slow Fill100 BusesT4 125L & Slow Fill20 BusesT4 125L & Boost FillT4 SST4 200L & Fast FillT4 SST4 200L & Fast FillT3 SST4 200L & Slow Fill100 BusesT4 200L & Slow Fill20 BusesT4 200L & Boost FillT4 SS
Note: SS = Stationary storage Figure 9a
Combined Vehicle & Refilling Incremental Costs Per Vehicle Kilometre (Euro Cents/Veh.km)

European Integrated Hydrogen Project – Phase II (EIHP2) Sub-task 3.1: Optimum Storage Pressure
29 of 42
-6
-4
-2
0
2
4
6
8
10
12
14
20 25 35 45 50 60 70
Vehicle Storage Pressure (MPa)
Incr
emen
tal C
ost p
er V
ehic
le k
m(E
uro
Cen
ts/v
eh.k
m) Fast Fill T4 SS
Fast Fill T3 SS
Slow Fill 100 Buses
Slow Fill 20 Buses
Boost Fill T4 SS
Note: SS = Stationary storage Figure 9b
Variations Of Incremental Costs With Different Refilling Options For Type 4 200L Vehicle Storage
(Euro Cents/Veh.km)
-6
-4
-2
0
2
4
6
8
10
12
14
20 25 35 45 50 60 70
Vehicle Storage Pressure (MPa)
Incr
emen
tal C
ost p
er V
ehic
le k
m(E
uro
Cen
ts/v
eh.k
m)
T3 125L
T3 200L
T4 125L
T4 200L
Figure 9c
Variations Of Incremental Costs With Different Vehicle Storage Options For The Base Case Refilling Option (Fast Fill With Type 4 Stationary Storage)
(Euro Cents/Veh.km)

European Integrated Hydrogen Project – Phase II (EIHP2) Sub-task 3.1: Optimum Storage Pressure
30 of 42
-6
-4
-2
0
2
4
6
8
10
12
14
20 25 35 45 50 60 70
Vehicle Storage Pressure (MPa)
Incr
emen
tal C
ost p
er V
ehic
le k
m(E
uro
Cen
ts/v
eh.k
m)
T3 125L
T3 200L
T4 125L
T4 200L
Figure 9d
Variations Of Incremental Costs With Different On-board Storage Options For The Cheapest Refilling Option (Slow Fill, 100 Bus Fleet)
(Euro Cents/Veh.km) From Figure 9a it can be seen that there is a variation in the combined vehicle and refilling incremental costs per vehicle kilometre within a maximum range of approximately 15 Euro Cents. The main influence on the incremental costs appears to be the refilling method (see Figure 9b or compare the different colours in Figure 9a). Slow overnight refilling (green & blue lines on Figures 9a & 9b) gives lower combined costs than the fast fill cases, with a difference of approximately 2 Euro Cents at 20MPa increasing to 5 Euro Cents at 70MPa when compared with the refilling base case (black lines on Figures 9a & b). The fleet size has a nominal effect on the slow fill costs. For fast fill the type of construction of the stationary storage has minimal effect. The boost fill (orange lines on Figures 9a & b) has the highest incremental costs, with a difference of approximately 4 Euro Cents at 35MPa increasing to 7 Euro Cents at 70MPa when compared with the refilling base case (black on Figures 9a & b). Given the higher costs it can be assumed that the boost fill can be ruled out of further consideration for the city bus study. From Figures 9a, c & d, vehicle storage systems with Type 4 containers have lower incremental costs than equivalent size Type 3 containers for the same refilling option. Similarly the larger 200 litre containers have lower incremental costs than the 125 litre containers. Of most interest to this study is the variation of the incremental costs for each case with increasing pressure. A minimum value indicates an optimum pressure in economic terms. From Figure 9a:
Vehicle Storage Economic Optimum Vehicle Storage Pressure (MPa)
European Integrated Hydrogen Project – Phase II (EIHP2) Sub-task 3.1: Optimum Storage Pressure
31 of 42
Type 3 125L 35 Type 3 200L 35 Type 4 125L <20 Type 4 200L <20
Sub-task 3.1 Report B indicates that Type 4 containers will be cheaper than today’s more common Type 3 designs. If this is the case, the Type 4 containers will be increasingly used. Based on the results of this analysis the economic optimum storage pressure would be in the range of 20-35MPa for city buses, however, this has also to be considered in relation to safety and technical issues. The maximum variation in incremental costs with increasing pressure is in the order of approximately 2-5 Euro Cents per km depending on the container type and refilling method (neglecting the boost fill case where costs rise steeply with pressure). Assuming a 1,000,000km vehicle life and a 100 bus fleet this represents a variation of 2-5M Euro over the life the fleet. However, most of the variation occurs at pressures above 35MPa.
8.6 Overall Absolute Costs Although the main study is based on incremental costs to assess if there is an economic optimum, it is of interest to see how the absolute costs vary with on-board storage pressure. In order to maintain the agreed confidentiality of the RAFS base data, Shell obtained data from other studies (Sub-task 3.1 Report D) which results in adding a base cost of 400Euro/kg to the relative costs quoted by RAFS. Figure 10 shows only the absolute costs that vary with on-board storage pressure for the base case refilling option, i.e. fast fill, and assuming Type 4 200 litre containers are used for both stationary and vehicle storage. It can be seen from Figure 10 that: i) Between 20 & 35MPa, capital costs account for approximately 75% of the total
absolute costs, however with further increases in storage pressure the proportion of capital costs decreases to approximately 70%.
ii) Operating costs increase to a small degree with increasing pressure, with most of the increase being due to the requirement for hydrogen pre-cooling beyond 35MPa, the remainder of the increase being associated with compressor operating costs.
Figure 11 shows the total absolute costs including hydrogen costs for the base case refilling option, i.e. fast fill, and assuming Type 4 200 litre containers are used for both stationary and vehicle storage. A hydrogen unit cost of 1.5 Euro/kg was assumed based on inputs from APCI, NorskHydro and Shell, suggesting a reasonable range in the order of 1-2 Euro/kg of hydrogen. However, it should be emphasised that the upper end of the range is subject to many differing potential supply methods (size, production method and location, local costs of utilities, etc.). Nonetheless, the exercise demonstrates that the cost of hydrogen dominates the costs that vary with on-board storage pressure. Figure 12 shows the principal cost elements within the cost per vehicle kilometre for a CGH2 city bus based on data supplied by DaimlerChrysler for a typical diesel city bus. The pressure variable costs discussed within this report amount to approximately 1% of the total costs per kilometre. Total costs are dominated by personnel and capital costs. For Germany a typical total cost per kilometre would be in the order of 5 Euro.

European Integrated Hydrogen Project – Phase II (EIHP2) Sub-task 3.1: Optimum Storage Pressure
32 of 42
0
2
4
6
8
10
12
14
20 25 30 35 40 45 50 55 60 65 70
Vehicle Storage Pressure (MPa)
Cap
tial C
osts
(blu
e) +
Ope
ratin
g C
osts
(gre
en)
(Eur
o C
ents
/Veh
.km
) Maintenance
Refrigeration energy
Compression energy
Vehicle Storage
Stationary Storage
Compressor
Dispensers
Note: Absolute vehicle storage costs from Shell (Sub-task 3.1 Report D)
Figure 10 Variations Of Absolute Costs (Excluding Hydrogen)
With Varying Vehicle Storage Pressure For The Base Case Refilling Option (Fast Fill
& Type 4 Stationary/Vehicle Storage) (Euro Cents/Veh.km)
(Based on Sub-task 3.1 Report D)

European Integrated Hydrogen Project – Phase II (EIHP2) Sub-task 3.1: Optimum Storage Pressure
33 of 42
0
5
10
15
20
25
30
20 25 30 35 40 45 50 55 60 65 70
Vehicle Storage Pressure (MPa)
Cap
ital C
osts
(blu
e) +
Ope
ratin
g C
osts
(gre
en) +
H2
Cos
ts (o
rang
e)(E
uro
Cen
ts/V
eh.k
m) Maintenance
Refrigeration energy
Compression energy
Vehicle Storage
Stationary Storage
Compressor
Dispensers
Hydrogen
Note: Absolute vehicle storage costs from Shell (Sub-task 3.1 Report D)
Figure 11
Variations Of Total Costs (Including Hydrogen) With Varying Vehicle Storage Pressure
For The Base Case Refilling Option (Fast Fill & Type 4 Stationary/Vehicle Storage)
(Euro Cents/Veh.km) (Based on Sub-task 3.1 Report D)

European Integrated Hydrogen Project – Phase II (EIHP2) Sub-task 3.1: Optimum Storage Pressure
34 of 42
74%
2%
20%
3% 1%
Personnel CostsMaintenanceCapital CostsHydrogenPressure variable costs
Figure 12 Principal Cost Elements Within The Cost Per Vehicle Kilometre
For A City Bus
8.7 Sensitivity Analysis 8.7.1 General
From Figure 12 the pressure variable costs amount to approximately 1% of the total costs per vehicle kilometre for a city bus. Even substantial sensitivity within the pressure variable costs will be negligible when compared to the total costs. The RAFS and Shell reports (Sub-task 3.1 reports B & D) have considered various issues as part of their sensitivity analysis:
RAFS: • Fibre type • Container burst pressure level • Large-scale production
Shell: • Use of Type 3 storage • Fleet size • Compressor running hours • Cascade utilisation efficiency • Capital recovery factors • Electricity cost
Although the issues identified above affect the costs, none appear to affect the assessment of an optimum vehicle storage pressure.

European Integrated Hydrogen Project – Phase II (EIHP2) Sub-task 3.1: Optimum Storage Pressure
35 of 42
A further sensitivity analysis has been undertaken on the combined results, based on the lowest cost vehicle storage option (Type 4 200L containers) and the refilling base case (Fast fill, Type 4 stationary storage). The analysis investigated the effects of varying the following factors:
• Lifetime vehicle mileage • Annual vehicle usage • Fleet size • Power costs • Repayment period • Capital recovery • Hydrogen consumption
The results are shown in Figure 13 and as can be seen there is no effect on the optimum pressure. Figures 14 & 15 show the cost variations around an arbitrary base cost for each of the factors considered at vehicle storage pressures of 25 & 35MPa respectively.
-1.00
1.00
3.00
5.00
7.00
9.00
20 25 35 45 50 60 70
Vehicle Storage Pressure (MPa)
Incr
emen
tal C
ost p
er V
ehic
le K
m (E
uro
Cen
ts/v
eh.k
m)
Type 4, 200L
LVM 750000
LVM 1000000
LVM 1250000
LVM 1500000
AVM 80000
AVM 90000
AVM 100000
AVM 110000
Fleet size 20
Fleet size 100
Fleet size 150
Power cost 4
Power cost 5
Power cost 6
5yr Repayment
10yr Repayment
15yr Repayment
Interest rate 10%
Interest rate 15%
Interest rate 20%
9km/kg H2 Cons
10km/kg H2 Cons
11km/kg H2 Cons
See Fig. 14 See Fig.15
Notes: 1. Base Case: Lowest cost vehicle storage option (Type 4 200L containers) and the refilling base case (Fast fill, Type 4
stationary storage) 2. LVM = Lifetime vehicle mileage 3. AVM = Annual vehicle mileage 4. Repay = Repayment period 5. The solid black line indicates the base case
Figure 13
Effect Of Varying Various Input Parameters On The Incremental Vehicle & Refilling Costs Per Vehicle Kilometre (Euro Cents/km)

European Integrated Hydrogen Project – Phase II (EIHP2) Sub-task 3.1: Optimum Storage Pressure
36 of 42
For comparison of the scale of the variations, Figure 10 indicates the pressure variable costs per vehicle kilometre (i.e. excluding hydrogen production/delivery costs) to be approximately 7-7.5 Euro Cents at 25-35MPa increasing to almost 12 Euro Cents at 70MPa.
0.00 0.25 0.50 0.75 1.00 1.25 1.50 1.75 2.00 2.25 2.50 2.75 3.00
Repayment Period(yrs)
Interest Rate (%)
Fleet size
HydrogenConsumption (km/kg)
Power Cost(Eurocents/kWhr)
Annual VehicleUsage ('000 km)
Effect Of Varying Assumptions About The Base Case (Euro Cents/Veh. Km)
lower boundBase caseupper bound
100 9080
10 911
54 6
1510 20
100150 20
515 10
25MPa
Note: The variations due to changes in the lifetime vehicle mileage are too small to show.
Figure 14 Effect Of Varying Various Input Parameters For 25MPa Vehicle Storage: Cost Variation Around An Assumed Base Cost Of 1 Euro Cent/Veh. Km

European Integrated Hydrogen Project – Phase II (EIHP2) Sub-task 3.1: Optimum Storage Pressure
37 of 42
0.00 0.25 0.50 0.75 1.00 1.25 1.50 1.75 2.00 2.25 2.50 2.75 3.00
Repayment Period(yrs)
Interest Rate (%)
Fleet size
HydrogenConsumption (km/kg)
Power Cost(Eurocents/kWhr)
Annual Vehicle Usage('000 km)
Effect Of Varying Assumptions About The Base Case (Euro Cents/Veh. Km)
lower boundBase caseupper bound
10090 80
10 911
54 6
1510 20
100150 20
515 10
35MPa
Note: The variations due to changes in the lifetime vehicle mileage are too small to show.
Figure 15 Effect Of Varying Various Input Parameters For 35MPa Vehicle Storage: Cost Variation Around An Assumed Base Cost Of 1 Euro Cent/Veh. Km
The effects of varying the different parameters are considered below.
8.7.2 Lifetime Vehicle Mileage The effect of varying the lifetime mileage of the bus around the agreed base of 1,000,000km was investigated. Alternative figures of 0.75M km, 1.25M km and 1.5M km were considered. There was no effect on the optimum pressure. The refilling costs are not affected, however, there is a very small increase of vehicle costs (less than 0.05 Euro Cents per kilometre) with a reduced lifetime mileage, and a similarly small reduction with an increased lifetime mileage.
8.7.3 Annual Vehicle Usage Volvo identified that for intense urban city bus operations a typical annual mileage would be up to 80/90,000km, while for suburban operations it would be 100/110,000km. 90,000km was chosen as the base case, and a sensitivity test undertaken for 80/100/110,000km.
European Integrated Hydrogen Project – Phase II (EIHP2) Sub-task 3.1: Optimum Storage Pressure
38 of 42
The annual mileage affects both the refilling and vehicle costs. Assuming that the bus is in operation for 333 days per year (less frequent holiday and Sunday services), i.e. 6.4 days per week for an annual mileage of 90,000km. This is equivalent to approximately 270km per day or 27kg of hydrogen per day (10kg of hydrogen is approximately equivalent to 100km for a city bus). As a result the different annual mileages affect the daily refilling rate and hence the refilling costs. The annual mileage also affects the vehicle capital recovery costs. There was no effect on the optimum pressure, and affects on the costs are less than 0.25 Euro Cents per kilometre.
8.7.4 Power Costs
A variation of 1 Euro Cent around the average value of 5 Euro Cents per kWh was considered. There was minimal effect on the optimum pressure. The electricity cost was assumed not to affect the vehicle costs and it has an effect of less than 0.4 Euro Cents per kilometre on the refilling costs.
8.7.5 Hydrogen Consumption
Although hydrogen costs are not taken into account in the main study, the hydrogen consumption rate affects the conversion of the refilling costs from cost per kilogram to cost per vehicle kilometre. The base case assumes 40kg of hydrogen gives a range of 400km, i.e. 10km per kilogram of hydrogen. Alternatives of 9 and 11km per kilogram of hydrogen were considered. There was no effect on the optimum pressure. The variation of hydrogen consumption has an effect of less than 1 Euro Cents per kilometre on the total costs.
8.7.6 Fleet Size
To represent small town garages and large city garages, three fleet sizes were considered: 20, 100 and 150 buses. There was no effect on the optimum pressure. For the purposes of this analysis the fleet size does not affect the vehicle costs, however, in practice some reduction could be expected, for example, if a large order was placed. Effects on the refilling costs are less than 1.5 Euro Cent per kilometre, with increases associated with smaller fleet sizes. The finding of Sub-task 3.1 Report D in relation to fleet size should be noted. Large compressors and large fleets would be preferable to small compressors and small fleets because compressors are cheaper per unit throughput as their size increases, and the capital costs of compressors are a significant element of the pressure dependant refilling costs. Because the refilling costs are dominated by capital rather than operating costs, it is important to use the full capacity of the refilling system. Below 80% utilisation the share of the capital cost per vehicle increases sharply.
8.7.7 Cost Of Capital As capital costs account for all of the assumed vehicle costs and dominate the refilling costs, the cost of capital has one of the most significant effects on the incremental costs of any of the parameters considered. The base case interest rate was taken as 15% with alternatives of 10 and 20%. There was no effect on the optimum pressure. The variation of interest rates has an effect of less than 1.3 Euro Cents per kilometre on the total costs.

European Integrated Hydrogen Project – Phase II (EIHP2) Sub-task 3.1: Optimum Storage Pressure
39 of 42
The sensitivity analysis considered a large variation in the interest rate of -5%, and as can be seen from Figures 13, 14 and 15 this is equivalent to a cost reduction of approximately 0.7-1.2 Euro Cents/veh.km, i.e. approximately 10% of the total pressure variable costs or 0.2% of the total operating costs. More significantly for this study the change does not affect the economic optimum pressure.
8.7.8 Repayment Period
As would be expected where capital costs dominate, the repayment period has a significant effect on the incremental costs. Capital costs account for all of the assumed vehicle costs and dominate the refilling costs. The base case repayment period was taken as 10 years for the vehicle and refilling infrastructure with alternatives of 5 and 15 years. There was no effect on the optimum pressure. The variation of repayment period has an effect of less than 3.5 Euro Cents per kilometre on the total costs.
European Integrated Hydrogen Project – Phase II (EIHP2) Sub-task 3.1: Optimum Storage Pressure
40 of 42
9 ASSESSMENT FRAMEWORK RESULTS & CONCLUSIONS The assessment framework is shown in Table 4
Table 4
PRESSURE RANGE SYSTEM SAFETY TECHNICAL ECONOMIC
(MPa) Advantages Disadvantages Advantages Disadvantages Advantages Disadvantages 20-25
(Existing CNG
systems)
Vehicle & refilling
infrastructure
Inherently lower compression energy
a) Type 4 on-board storage systems: minimum incremental costs b) Type 3 on-board storage systems: lower incremental costs than 50-70+MPa systems
Type 3 on-board storage systems: slightly higher incremental costs than 30-45MPa systems, but lower than 50-70+MPa systems
Refilling infrastructure
only
For the refilling infrastructure the lowest pressure is the cheapest option
Vehicle only a) High storage system volume b) High storage system weight
30-45 (1st
generation hydrogen systems)
Vehicle & refilling
infrastructure
a) High compression energy b) More energy in a single reservoir
Low storage system volume
Type 3 on-board storage systems: minimum incremental costs
Refilling infrastructure
only
Vehicle only Relatively more robust due to higher absolute margin against burst
Minimum storage system weight for Type 3 containers (minimum for Type4 containers occurs at 50MPa)
50-70+ (2nd generation hydrogen systems)
Vehicle & refilling
infrastructure
a) High compression energy b) More energy in a single reservoir
Minimum storage system volume (but declining benefits beyond 60-70MPa)
a) Uncertain material compatibility issues b) Potential pressure cycling issues for components c) Potential interface sealing problems
Highest incremental costs
Refilling infrastructure
only
More research required for refilling infrastructure safety requirements
a) Accurate hydrogen dispensing metering system required b) Fast fill will require hydrogen pre-cooling c) Potential interface sealing problems
Vehicle only Relatively more robust due to higher absolute margin against burst
Minimum storage system weight for Type 4 containers occurs at 50MPa
High storage system weight for Type 3 containers and for Type 4 containers beyond 50MPa

European Integrated Hydrogen Project – Phase II (EIHP2) Sub-task 3.1: Optimum Storage Pressure
41 of 42
If it is assumed that technological issues associated with Type 4 containers can be solved, then as they appear to be the cheapest storage solution, it is reasonable to assume that they will become the predominant automotive CGH2 storage technology. For Type 4 vehicle containers there is an optimum value at 35MPa in terms of storage system weight. In terms of incremental costs the lowest pressure is the cheapest option for Type 4 vehicle containers, as it appears that the incremental costs are reaching a minimum just below 20MPa, as other factors start to influence the container design. For Type 3 vehicle containers an optimum value would be 35MPa in terms of storage system weight and incremental costs. The maximum variation in incremental costs with increasing pressure is in the order of approximately 2-5 Euro Cents per km depending on the container type and refilling method. However, most of the variation occurs at pressures above 35MPa. The pressure variable costs discussed within this report amount to approximately 1% of the total costs per kilometre. Total costs are dominated by personnel and capital costs, and for Germany a typical total cost per kilometre for a diesel bus would be in the order of 5Euro. Stationary storage system containers are unlikely to constrain the choice of optimum pressure because they are not limited by space or weight considerations. In conclusion, taking into account all of the factors in the assessment framework (safety, technical and economic issues) and the probable direction of storage technology, it appears that for non-articulated single deck city buses an on-board storage pressure between 20 and 35MPa is the optimum. Further, it appears that overnight slow fill may be the most attractive refilling option though this may be influenced by garage land costs (not modelled in this study) if the land-take is greater than fast fill and close vehicle parking. As capital costs account for all of the assumed vehicle costs and dominate the refilling costs, a stable low interest rate future will assist the development of the hydrogen economy. One issue that this study has not investigated is if there is an upper limit in terms of public acceptance based on perceptions of hydrogen and high-pressure system safety.
10 PASSENGER CARS For passenger cars, vehicle range remains critical. Informal discussions with various car companies suggest the minimum hydrogen capacity necessary to provide an acceptable range is 4kg. However, will 4kg of hydrogen be sufficient? This is an amount of energy equivalent to only 15 litres of gasoline. The ACEA fleet average emissions target (for 2010) is 120g CO2/km as measured in the standard European test procedure. This is equivalent to about 4.4 litres/100km, so 15 litres of gasoline would be equivalent to approximately 350km (or less, depending on how close to empty the car is driven). However, a reasonable assumption would be to use hydrogen in a fuel cell drivetrain at up to twice the efficiency of today's Otto engines. It has also been suggested that future cars may ultimately achieve 3.6 l/100km. 4kg of hydrogen may well be sufficient, so long as these efficiency savings can be made. The car companies also suggest that approximately 150 litres and 100kg are the maximum tank dimensions that can be accommodated. At ambient temperature, 4kg of hydrogen at 35MPa occupies approximately 172 litres and the external volume of such a tank with its fittings would be even larger, so pressures above 35MPa are needed. At 70MPa, 4kg of hydrogen occupies only 100 litres. A container at this pressure would probably fit in the space available.

European Integrated Hydrogen Project – Phase II (EIHP2) Sub-task 3.1: Optimum Storage Pressure
42 of 42
Unlike in buses where hydrogen storage space is not so critical, there are clear benefits to be gained for cars by moving to higher pressures in the form of increased range and customer acceptability. In theory such demands could lead to pressures even higher than 70MPa. However, due to thick-wall effects and the growing incompressibility of hydrogen, increasing the storage pressure brings diminishing returns. The shape of the cost/benefit curve for passenger cars is unclear, and restrictions on system cost, safety, i.e. public acceptance, or technical problems other than pressure may become the limiting factor. Given the sparse data on hydrogen systems at very high pressures, no definite recommendation on an optimum pressure for cars can be made, except to support continued research at 70MPa (and above).
REFERENCES Adams, 2000 Adams, P., Final Report 01.02.98 to 30.04.00 for the European
Integrated Hydrogen Project (EC Contract No. JOE3-CT97-0088), Volvo Technological Development Corporation, Doc. No. 06120-00-853-1, June 2000.
ISO, 1999 ISO/TC 197/SC/WG7, Basic Considerations For The Safety Of
Hydrogen Systems, ISO/WD 15916, 1999. ISO, 2002 ISO/TC 197/SC/WG 5 (N172-6 R1), Gaseous Hydrogen and
hydrogen blends – Land Vehicle Fuel Tanks – Parts 1-5, ISO/CD 15869-1-5, 2002.
SAE, 2002 SAE J2600, Compressed Hydrogen Surface Vehicle Refuelling
Connection Devices, October 2002 Shell, 2001 “Compilation Of Existing Safety Data On Hydrogen And
Comparative Fuels”, EIHP2 Sub-task 5.1 Deliverable Report, Shell Global Solutions, 2001.
UN ECE, 2004 “Proposal for a new draft Regulation: uniform provisions
concerning the approval of: 1. Specific components of motor vehicles using compressed gaseous hydrogen; 2. Vehicles with regard to the installation of specific components for the use of compressed gaseous hydrogen;” UN ECE WP.29 GRPE Working Doc. 2004/3, http://www.unece.org/trans/doc/2004/wp29grpe/TRANS-WP29-GRPE-2004-03e.doc.