Embed Size (px)
Citation preview

Ekahau
Site Survey 2.2
User Guide

BEFORE YOU BEGIN .......................................................................... 1 INTRODUCTION.................................................................................. 1
CHAPTER 1: GETTING STARTED ........................................................ 3 SYSTEM REQUIREMENTS ....................................................................... 3 INSTALLING ESS™............................................................................. 4 PURCHASING AND UPGRADING ESS™ ....................................................... 5 SUPPORTED WI-FI ADAPTERS ................................................................. 6 TIPS FOR SELECTING AND USING WI-FI ADAPTERS......................................... 6 UPDATING YOUR WI-FI ADAPTER DRIVER ................................................... 7 TECHNICAL SUPPORT ........................................................................... 8
CHAPTER 2: NETWORK ADAPTER .................................................... 10 DETECTION OF MULTIPLE WLAN DEVICES...................................................10 WORKING WITH CONFIGURATION PROFILES.................................................10 EKAHAU WIRELESS UTILITY ..................................................................11 CHANGING WI-FI ADAPTER SETTINGS ......................................................13 USING EKAHAU CLIENT .......................................................................13
CHAPTER 3: DEPLOYING A WIRELESS LAN USING ESS ................... 15 CHAPTER 4: STARTING A SURVEY WITH ESS .................................. 18
PREPARING TO WORK WITH ESS .............................................................18 USER INTERFACE...............................................................................19 OPENING AND CONFIGURING A MAP .........................................................21 USING THE BROWSER VIEW ..................................................................22 RECORDING A SITE SURVEY ..................................................................24 SIGNALS TAB ..................................................................................26 RECORD TAB ...................................................................................27 FREEZING ACCESS POINTS FOR NETWORK PLANNING ......................................27
CHAPTER 5: AFTER THE SURVEY ..................................................... 29 SITE SURVEY PROJECT ........................................................................29 OBSERVED AND SIMULATED ACCESS POINTS AND PROPERTIES ...........................29 FILLING UNSURVEYED AREAS TO MINIMIZE SURVEY TIME .................................32 MARKING EXACT ACCESS POINT LOCATIONS ...............................................33 SEGREGATING MY ACCESS POINTS AND OTHER ACCESS POINTS .........................35 SURVEY PROPERTIES, CHART, AND EVENTS.................................................35 EDITING ACCESS POINT PROPERTIES ........................................................36

BINDING ACCESS POINTS WITH MULTIPLE RADIOS OR VIRTUAL LANS...................37 CHAPTER 6: VISUALIZATION, ANALYSIS AND EXPORTING............. 38
GENERAL VISUALIZATION SETTINGS.........................................................38 SIGNAL STRENGTH ............................................................................42 ADAPTER SIGNAL STRENGTH .................................................................45 SIGNAL TO NOISE RATIO (SNR) ............................................................45 INTERFERENCE .................................................................................47 STRONGEST ACCESS POINT...................................................................49 ACCESS POINT COUNT ........................................................................50 SIGNALS AT CHANNEL .........................................................................51 ACCESS POINT PLACEMENT TIP...............................................................52 ACCESS POINT LOCATION ESTIMATE.........................................................54 DATA RATE.....................................................................................56 EXPORTING AND PRINTING MAP IMAGES ....................................................57 EXPORTING DATA AS TEXT....................................................................57 EXPORTING DATA AS XML....................................................................58 EXPORTING TO REMOTE HOST................................................................59
CHAPTER 7: ABBREVIATIONS AND DEFINITIONS........................... 60 CHAPTER 8: TROUBLESHOOTING .................................................... 64 APPENDIX A: PLANNING................................................................. 67
CREATING A NETWORK PLAN .................................................................68 APPENDIX B: REPORTING............................................................... 71
ESS REPORTING FEATURE....................................................................71 GENERATING REPORTS ........................................................................71 EDITING REPORT TEMPLATES .................................................................72
APPENDIX C: GPS ........................................................................... 82 RECORDING A SITE SURVEY WITH GPS .....................................................82

BEFORE YOU BEGIN
Introduction
Ekahau Site Survey™ (ESS) is a portable software tool for recording, visualizing, planning, simulating, optimizing, and reporting the different characteristics of Wi-Fi (802.11 a/b/g) radio networks:
• Visualize the recorded or predicted coverage areas, data rates, and other Wi-Fi attributes using standard JPG or PNG map images.
• Pinpoint friendly and rogue AP locations.
• Find optimal locations for new and existing APs.
• Quickly create fully customizable and shareable site survey reports and network plans including all the statistics and map visualizations.
• Plan and design networks off-site without existing Wi-Fi infrastructure.
• Select the right channels for minimum interference.
• Visualize and minimize the amount of RF leakage outside your building.
• Export the survey data and visualizations to other applications.
ESS can be used with or without a map image (JPG or PNG). If a map image is not available, you can perform quick site surveys without a map and use the Signals Tab and Survey Properties to view, name, and save the signal properties at different locations.
1

NOTE Do not operate ESS and drive or carelessly walk at the same time. Stop using ESS and switch off the Wi-Fi adapter when it is forbidden to use radio equipment or when it may cause interference or danger.
2

CHAPTER 1: Getting Started
System Requirements
1 Light-weight laptop PC with at least Windows® XP or 2000, Pentium III, 512 MB RAM, and 500 MB of disk space.
2 Supported Wi-Fi adapter (see Device Support in the Client folder in Start Menu).
3 (Optional) external antenna for increased measuring accuracy. Recommended for site surveys only if the end users are expected to use similar antennas.
4 ESS software, license key, and license file.
3

5 If used with the optional GPS license, a GPS receiver with NMEA (0183) and WGS84 support, to be used for outdoor wide-area site surveys.
6 At least one operational Wi-Fi access point (802.11a/b/g).
7 (Optional) map image of the facility or area (JPG or PNG).
NOTE Only the ESS software is supplied by the vendor. All other system components are standard off-the-self items that can be sourced from any computer related resellers.
Installing ESS™
1 Uninstall any previous ESS version before installing a newer version. This will not remove your site survey project files (.ess).
2 Insert your Wi-Fi adapter into the PC slot (unless integrated), and refer to its documentation to properly install all default software.
3 Double-click the .exe file to begin the installation. In case of CD installation, place the CD in the drive. If the installation does not start automatically, open the Windows Explorer on the CD drive and double-click the .exe file located in the root folder of the CD drive.
4 Follow the on-screen instructions and select the components you wish to install. It is highly recommended to include the Wi-Fi adapter drivers in the installation.
4

5 Before the installation is finished, you are prompted to install the correct driver for your network card. Carefully read the list of supported network cards and install the correct driver using the instructions provided. You may have to download the driver prior to installing it, depending on which network adapter you are using.
6 The installer will then copy the selected drivers under the Drivers folder in the program installation folder to let you manually install them.
Purchasing and Upgrading ESS™
ESS can be evaluated for 14 days without a license. After this period a license must be purchased by contacting your sales representative or [email protected] .
Upgrade your ESS after receiving a new license:
1 Start ESS and select Help > About > Upgrade License.
2 Choose the license file (in zip format, the file you downloaded from the web)
3 Click OK and restart the application to see the new license information on the startup logo and Help > About dialog.
5

Supported Wi-Fi Adapters
ESS has been successfully tested on Windows® XP and 2000 with more than 25 leading Wi-Fi adapters from Agere, Avaya, Buffalo, Cisco, D-Link, Enterasys, IBM, Nortel Networks, Proxim, and other manufacturers. Please refer to the Device Support page in Start Programs Ekahau Site Survey Client for the detailed list of supported Wi-Fi adapters and drivers. It is not recommended to use unsupported adapters. Ekahau provides no support when using an unsupported adapter as unsupported adapters may provide inaccurate survey results.
Tips for Selecting and Using Wi-Fi Adapters
• Ekahau highly recommends using one of the recommended adapters and drivers.
• Determine which bands (802.11a/b/g) you need to survey. With a combo adapter, you can scan multiple bands in one survey.
• If you need to detect hidden networks (APs that are not broadcasting their SSID), refer to the Device Support documentation and choose an adapter that enables it.
• If you prefer quick surveys, choose an adapter that provides a fast scan rate. With faster scan rate, the adapter will be able to collect more network signals in the same period of time.
6

• Scanning is usually a little slower for hidden
networks or scanning multiple bands.
• Scanning can perform better when the adapter is not associated with an access point. When using 802.11abg adapters based on the Atheros chipset (such as Cisco CB-21, D-Link DWL-AG650, Nortel 2201/2202, NetGear WAG511), do not let your adapter associate when recording site survey data. The easiest way to do this is to use a WLAN profile that has an SSID that does not exist.
Updating Your Wi-Fi Adapter Driver
Always update your Wi-Fi adapter driver before using ESS for the first time, or after changing your Wi-Fi adapter. An old device driver is the most common reason for not receiving network data. Follow these instructions if you did not install the included drivers during ESS installation, or want to change to another Wi-Fi adapter model without re-installing the software.
1 Make sure your Wi-Fi adapter works normally and you have completely installed ESS including the optional drivers.
2 Click Start > Settings > Network Connections.
3 Right-click an appropriate Wireless Connection in the list, select Properties, and click the Configure… button.
7

4 Click the Driver tab sheet. If the driver version number is lower than the one listed in the Device Support Document, you must update the driver.
5 Click the Update Driver button.
• Click Install from a list or specific location, then Next.
• Browse to C:\Program Files\Ekahau\Drivers (or the directory where ESS was installed) and select the appropriate driver for your Wi-Fi adapter. In some cases, you may have to download the driver from a web page.
• Click Next to install the new driver, then Finish to exit the Hardware Update Wizard.
6 See steps 2–4 above to confirm that the new driver version was installed properly. If you have trouble updating the driver, please refer to the Wi-Fi adapter and driver documentation before contacting support.
Technical Support
If you have purchased Support Package with your ESS, Ekahau technical support and ESS version updates are included in the product license. Ekahau Support Package includes: All non-major ESS product updates (e.g. bug fixes, patches and “dot-releases”. E-mail assistance from Ekahau technical experts for problem resolution and technical guidance.
8

Technical support expires after the release of the next major Ekahau product version. Without the purchase of Ekahau Support Package, Ekahau will provide critical bug fixes and assist you if you encounter a program error while installing or using the tool. If you encounter problems while using Ekahau software, or if you have improvement ideas, contact [email protected]. Ekahau technical support will respond within 24 hours on business days (Monday through Friday). Please include the following information in your e-mail:
• Detailed description and steps to reproduce the problem.
• Operating system in use. • Wi-Fi adapter’s model number and driver
version. • Access point models.
9

CHAPTER 2: Network Adapter
Detection of multiple WLAN devices
If multiple WLAN devices are connected and enabled (for example, integrated and external adapters), ESS will discover all of those devices. However, Ekahau very highly recommends de-activating all but one adapter using the Devices tab. You will see a warning in the user interface if multiple (or none) WLAN devices are connected. Using multiple adapters may provide more scan results over time, but please note that the measurement accuracy may vary between different network adapters.
Working with Configuration Profiles
Your Wi-Fi adapter’s configuration profile may affect site survey results. For example, enabling only 802.11a band in the Wi-Fi adapter’s Client Utility may make 802.11a the only available band in ESS as well. The drivers that are used with Ekahau Site Survey also serve as “regular” drivers for establishing a network connection to your wireless network without re-installing the drivers. Open the standard Wi-Fi adapter utility, such as Agere Wireless Client Manager, Ekahau Wireless Utility (when using adapters based on the Atheros-chipset except Cisco), or Cisco Aironet Client Monitor, and create a suitable network profile for site surveys. For example,
10

Ekahau Wireless Utility allows selecting specific bands such as 802.11a or 802.11b, or both. Depending on your Wi-Fi adapter you may also need to provide valid security credentials to access the network you are about to survey.
Windows® XP sometimes causes configuration profile conflicts with its automatic Zero Configuration. To turn it off, right-click My Computer on the desktop and select Manage > Services and Applications > Services. Then open the Wireless Zero Configuration properties and Disable the service.
NOTE Refer to the Device Support page (in Start Programs Ekahau Client) to see which Wi-Fi adapters can
detect hidden, possibly unauthorized, networks.
Ekahau Wireless Utility
When using network cards based on the Atheros-chipset (such as D-Link DWL-AG650 and NetGear WAG511, Nortel 2201/2202 and Linksys WPC55AG), Ekahau highly recommends using Ekahau Wireless Utility (EWU) for configuring network profiles. You can choose to install EWU when installing the Ekahau drivers for your adapter. Choose “install driver and supplicant” for all Atheros adapter models, except Cisco CB-21. You can start EWU via the start menu, or right-clicking the icon (four bars) in your taskbar and selecting Open. Ekahau Wireless Utility comes with 4 pre-installed wireless profiles. These profiles are meant to be used
11

while performing site surveys. Using these profiles, you can select which technology or technologies you want to optimize your wireless network scanning for. If you are encountering problems with scanning all bands (a/b/g) at the same time, or if scanning all the bands is too slow, you may want to try to limit the scanning to one particular band. You can also use Ekahau Wireless Utility for managing your wireless network connectivity when not performing site surveys. Do remember to re-activate the Ekahau Site Survey profiles while performing surveys again to optimize the performance of the adapter. Please see the Help menu in the Ekahau Wireless Utility for further instructions on the use of EWU.
NOTE – ATHEROS – BASED NETWORK CARDS: The waiting time per channel when surveying the network depends on the association to the network. If you are not associated, the waiting time per channel will be reduced to maintain network connectivity. If you are associated, the waiting time will be longer (over 100ms). Also make sure that you have selected the technologies (a/b/g) you want to survey from the wireless client utility (if using the utility).
NOTE – CISCO CB21 USERS Do not install Ekahau Wireless Utility when using Cisco CB-21ABG Network Cards. Use Cisco Wireless Utility (which is very similar) instead. Create a profile that does not associate with the network while performing surveys while using Cisco CB21.
12

Changing Wi-Fi Adapter Settings
Open ESS and click the Devices Tab to view the attached Wi-Fi devices. Click a device to see its properties. Different Wi-Fi adapters may display different options.
• Wi-Fi adapter’s MAC and IP address are always displayed.
• Scan Interval is always displayed. Note that with the fastest (0s) setting the device will return new network scan results as quickly as possible. With some devices this can be less than a second per 802.11a/b/g band, while others require several seconds per band.
• Scan Mode selection is displayed only when using certain Proxim/Orinoco Wi-Fi adapters, such as Orinoco “Classic” 802.11b. Scan All scans all APs, but cannot detect networks that are not broadcasting SSID. Scan Current Profile scans only the network (SSID) that is specified in the Wi-Fi adapter’s configuration profile. This network can be hidden but its name and possible security credentials must be set in the configuration profile to enable scanning.
Using Ekahau Client
Ekahau Client is a small program (Windows service) that allows ESS to retrieve network data from the Wi-Fi adapter. Ekahau Client must be running whenever ESS is used. Starting ESS also starts the Ekahau Client if it is not running.
13

Ekahau Client provides a separate Properties dialog, the Ekahau Client Controller that can be used for starting and stopping the Ekahau Client service and for enabling the writing of an Ekahau Client log file. To open the Ekahau Client Controller, click the icon in the Windows system tray. If the icon is not displayed, start the Client Controller from the start menu.
EKAHAU CLIENT CONTROLLER DIALOG ON WINDOWS® XP. If you need to manually view, start, or stop the Windows service, right-click My Computer on the desktop, and select Manage > Services and Applications > Services.
NOTE A red dot on the Ekahau Client symbol on the system tray means that the Client service is not running. A yellow flag means an error. Open the Client Properties dialog to view error status.
14

CHAPTER 3: Deploying a Wireless LAN using ESS This Chapter provides a practical example on how to design and deploy a high-quality wireless network using Ekahau Site Survey.
1 Define the requirements
Find out the applications to be used, number of users, serving areas, network security policies, end user devices, funding and scheduling. From these, define the network coverage, performance, compatibility, and security requirements. Conduct a visual site inspection. Requirements specification is a manual procedure.
2 Create the network plan
Use the network planning features of ESS to figure out the optimal locations and configuration for your access points. You can also visualize your predicted coverage and network performance prior to surveying.
3 (Optionally) Create work orders and proposals
Use the reporting feature of ESS to create work orders and customer proposals based on the network plan.
15

4 Perform pre-deployment site survey
Power up one or a few access points while on-site in the locations defined in step 2. Perform a site survey in the coverage area(s). Use the Freeze Access Point feature, and move the access point(s) to the next location(s). Conduct another site survey. Repeat.
5 Improve the network design
Compare the coverage areas of the simulated access points and the real-world access points. Adjust the settings and/or locations of the access points if necessary.
6 Deploy the infrastructure
Based on the network plan, the preliminary site surveys, and the improvements made to the network, deploy the wireless network infrastructure: install and configure access points and antennas, configure the WLAN switch, install the cabling.
7 Conduct a verification survey
Verify the network coverage and performance by conducting a site survey throughout the entire site.
8 Analyze and fine-tune to finalize the network design
If the verification survey reveals that the network still does not meet the requirements, fine tune and re-survey until it does.
16
9 Create documentation
Use the reporting feature of ESS to create complete documentation of the network installation, coverage, and performance.
10 Monitoring, maintenance, expansion
Use Ekahau Site Survey in combination with your wireless LAN monitoring and maintenance system to keep your wireless network up and running. Conduct periodic site surveys with ESS to ensure flawless operation. Problems do occur that cannot be “seen” from the constant RF monitoring system, but have to be investigated on the client side. Design for additional coverage or performance using the network planning features of ESS by simply opening the surveyed project file, and adding simulated access points on the surveyed data.
17

CHAPTER 4: Starting a Survey with ESS
Preparing to work with ESS
1 Open ESS by clicking its icon in the Windows Start Menu. This also starts the Ekahau Client service that reads the wireless network information from your Wi-Fi adapter.
2 Make sure that Ekahau Client runs properly by clicking its icon in the task bar. If you cannot see the icon, start the Client Controller from the Start Menu
3 After the ESS has started, click the Signals tab in the Bottom View. If you cannot see changing signal values:
• Make sure that Ekahau Client is running, and your Wi-Fi adapter and driver version are supported (see Device Support in the Client folder in Start Menu)
• Close all the other utilities that may be interfacing with the wireless network adapters
• If you are using an external PCMCIA adapter, disable the internal network adapter from Control Panel – Network Connections
• Disable Wireless Zero Configuration from (right-click) My computer – Manage – Services and Applications – Services
• Make sure the network adapter is not associated with an access point
18

You don’t need to see the signals if you do not wish to record any survey data
4 If possible, enable broadcast SSID in the access points to be surveyed. This allows for the network card to retrieve signal information from the AP’s more frequently.
User Interface
USER INTERFACE ON WINDOWS® XP.
(1) Menu and Toolbar provides the basic functions for working with files, maps, and recording field data.
(2) Browser View is a flexible selection tool for maps, surveys, networks, and APs. You can select multiple items by holding down CTRL or SHIFT, and "lock" your selection to keep from de-selecting it. Locking keeps the
19

item selected until you un-lock the item. Only the selected or locked items are displayed in the Map View and used by the visualizations and other functions. The Browser View also displays the properties of a selected item.
(3) Map View displays the selected map image and map tool buttons. All the visualizations (heat maps for coverage, SNR, data rate etc.) are displayed on the map. If you have multiple maps in the project, click the preferred map name in the Browser View to display it in the Map View.
• Turn the mouse wheel to zoom the map in or out. • Hold down the middle (mouse wheel) button to pan
the map. • Right-click on a map to open a context menu with
zoom and other map features.
(4) Bottom View has five Tab Sheets.
• Signals tab allows you to view real-time information about all the currently audible access points.
NOTE Not all network cards are able to output Noise or SNR,
but this only affects the Signals-tab. Even though real-time Noise and SNR are not shown in the Signals-tab, all the map visualizations (including SNR and Interference) will be displayed correctly if a supported adapter and driver version are used.
• Visualization tab is used for analyzing the network coverage and performance.
• Devices tab allows viewing and changing the Wi-Fi and GPS device properties.
20
• Simulated Properties allows changing the properties
of selected or locked APs. • Record tab shows the recorded signal strengths
readings over time for the selected or locked APs.
Opening and Configuring a Map
ESS does not require a map image, but using a map is very highly recommended as it enables most of the features. The supported map formats are JPG and PNG. You can get digital or paper maps from the facility management, national land survey, or other such authorities. If you cannot get a map, you can draw a rough map yourself with any drawing tool supporting the above file formats, such as Microsoft Paint. CAD-files (e.g. AutoCAD DWG, DXF) can be easily converted to PNG or JPG using freeware tools widely available in the internet.
1 To open a JPG or PNG map image, select File > New > Map.... You can alternatively right-click the Maps folder in the Browser View, and select New Map from the context menu.
2 Click Select… and Open to select a map image.
NOTE To maintain smooth map operation, keep each map image smaller than 2000x2000 pixels. If you have larger maps, split them with any drawing tool. A white backround is highly preferred.
21

3 You need to specify the map scale (pixels per meter or foot) for each map image. If you already know the map scale, you can enter it in the properties dialog. If you don’t know the map scale, leave the scale field empty and click OK. The map will shortly appear on screen.
4 Use the Scale Tool to define the map scale, i.e. how many map pixels equal one meter or foot in the real world. Click a point on the map, for example the corner of a wall or another measurable object. Then click another point on the map, at least 3 meters (10 feet) from the starting point. Then walk to the marked location and measure the real world distance between the two points with a measuring tape. Type the real-world distance in the Meters or Feet text field, and click Set Scale.
5 You can change the map distance unit between meters and feet by selecting File Preferences.
6 Use the mouse wheel for zooming, or hold it down to pan.
Using the Browser View
The Browser View is used for selecting maps, surveys, APs, or networks, and displaying their properties. You can select multiple items by holding down the CTRL or SHIFT key. Only selected or locked items are displayed on the map, visualizations, and exports.
22

Display a map by double-clicking a preferred map in the Browser View. (First be sure to add one from File > New > Map…). Only one map can be displayed at a time. Select multiple items by holding down the CTRL or SHIFT key.
Lock your selection by clicking the lock button, or right-clicking on the item and selecting “Lock Selection”, to keep from losing your selection when selecting or browsing additional items. Locking/unlocking a folder locks/unlocks all the items in the folder. Unlock your selection by selecting the items to be unlocked and clicking the unlock button. Alternatively, right-click on the item and select Unlock selection.
NOTE Only the selected or locked items will be displayed on
the map and used for the data visualizations. If you cannot see your survey on the map, make sure that you have selected or locked it. Changing the network, AP, or survey selection also immediately affects the visualizations.
Change the active survey by right-clicking the preferred survey in the Browser View, then clicking Select as Active Survey in the context menu. The active survey is displayed on the toolbar next to the Record button. This survey is used whenever recording data. The active survey is also displayed in the Record-tab.
Hide items that are not related to the selected or locked items by clicking the Show Related button. To hide all items that are not selected or locked, click the Show Selected button. To view all items, click Show All.
23

The numbers after the folders represent the number of currently displayed items / all items in the folder.
Group APs by Network Name, Band, Channel, or Privacy, by clicking the Group by button or right-clicking on an Access Point folder and selecting Group by from the context menu. The access points should be segregated between My Access Points (your network, the access points your wireless users can associate with) and Other Access Points (neighboring networks, rogue access points, etc). Other access points will be considered as sources of co-channel interference in SNR, Interference, and Data Rate view.
NOTE ESS visualization algorithms perform correctly only if all APs other than your own are dragged to the Other Access Points folder before performing survey data analysis.
Recording a Site Survey
1 Add a new map image (PNG or JPG) to the project by selecting File > New > Map.
2 Use the Scale Tool to define the map scale, i.e. how many map pixels equal one meter or foot in the real world. See the chapter Opening and Configuring a Map for details.
3 Add a new site survey to the project by selecting File > New… > Survey. After taking a break in surveying, it is recommended to create a new survey. You can lock all the desired surveys to easily merge the results from all the surveys.
24

4 Click the Record button to start recording network data to the survey, or press CTRL+R. If you want to have a short break and continue surveying from the same location, simply turn off the data collection by clicking the Record button, and re-enable recording by hitting the record-button again after the break.
5 Take your laptop with you and start walking or driving around the facility or area. Click on the map accurately where you are (without stopping when clicking).
6 Always click the map again when:
• You change your speed, stop or start moving.
• You change your walking direction.
NOTE The survey recording is ON and continuous between
map clicks. ESS assumes that between the map clicks, the surveyor is either standing still or walking on a straight line at a constant speed. This allows for quick surveys while recording a lot of data. It also frees the user from clicking on the map continuously when surveying long hallways, for example, as ESS interpolates the measurements that occurred between two clicks.
7 When you have recorded enough data, click the Record
button again to stop recording.
8 Save the project file by selecting File > Save.
25

IN ADDITION TO THE VISUALIZATIONS, YOU CAN USE THE SIGNALS TAB AND SURVEY PROPERTIES TO VIEW THE AP SIGNALS AT DIFFERENT LOCATIONS.
Signals Tab
The Signals Tab displays all observed Wi-Fi signals in real-time. You can click the header columns to sort the list by Name, MAC, SSID (Network Name), Band, Channel, Privacy, RSSI (raw value from the adapter), Normalized Signal Strength (dBm), Noise Level, SNR, and Last Update Time (last time the entry was refreshed). A signal will be removed from the list if it has not been observed for 20 seconds. Sorting the Signals Tab allows quickly finding APs with, for example, the strongest signal, weakest noise level, or highest SNR. Sorting by Name, MAC, or SSID helps find unauthorized APs without a map.
26

NOTE Due to the variations in different Wi-Fi Adapters’ signal
strength scales, the Normalized Signal Strength values are normalized to Cisco Systems 350 Series RSSI scale. The normalized values are also used in the map visualizations for more reliable results.
Record Tab
The Record Tab shows the real-time AP signal strength (RSSI) as a RSSI-TIME diagram. Each curve describes an AP’s signal strength, while its color describes the channel used.
Freezing Access Points for Network Planning
Many site surveyors use just one or a few APs to verify the coverage prior to deploying the complete network. Use this powerful method with ESS as follows:
1 Place an AP at a promising location (use Simulated Access Points [Preferred] or the AP Placement Tip if you are unsure of the placement). Do not install the AP or antenna permanently.
2 Record a site survey that covers the AP’s coverage area. Right-click the AP in the Browser View and select Freeze Access Point from its context menu. This will display a text Frozen [date and time] after the AP. After freezing, no more data will be recorded for the Frozen AP. The next time this physical AP is powered up, it will be listed as a new AP.
27

3 Jump to step 1: Move the same AP to the next obvious location, record a new survey (or continue the first survey), and Freeze the AP after recording its coverage area. Continue the process until you have covered the whole site.
Select the survey(s) and frozen APs from the Browser View, and try the different visualizations and AP properties to analyze how the network would function with as many real APs.
28
CHAPTER 5: After the Survey After a site survey has been conducted, you can organize the results and write additional notes to the project file for later analysis and reporting. To proceed, you need to understand the main elements of ESS: Site Survey Project and Observed and Simulated Access Point Properties.
Site Survey Project
Each ESS project file (.ess) can contain any number of site surveys, map images, access points, and wall elements. ESS always starts with an empty project.
Observed and Simulated Access Points and Properties
Ekahau Site Survey contains two types of information for access points: observed and simulated. You can visualize measured or observed data alone, or combine measured and observed results in various ways. Observed access points are access points that exist in physical form. In ESS, one 802.11 radio transmitter is by default considered as one access point. When performing a site survey, observed access points are automatically detected and added to the Browser View by ESS.
29

Observed access points contain observed properties. These properties, such as channel and MAC address of the AP, are detected when the site survey is conducted. Signal strength readings can also be considered as observed properties of the AP. Observed properties cannot be changed.
PURE OBSERVED (SURVEYED) COVERAGE VISUALIZED. Observed access points also contain simulated properties. Simulated properties are changeable at any time. Generally, you would change the simulated properties, such as antenna type and transmission power, to represent the real properties of the access point – to ensure they are later reported correctly. Transmission power and antenna type, for example, cannot be detected automatically and thus must be entered manually.
30

The band and channel of the observed access points are displayed in both observed properties and simulated properties. This allows the user to create “what-if” scenarios using the site survey data. By changing the simulated channel of the observed access point, you can simulate how changing the channel would affect interference, SNR and data rate. This allows for easy channel optimization. By changing the simulated technology of the observed access point, you can simulate how the data rate would change, for example, if you used an 802.11g access point instead of the 802.11b AP that you used in the survey. Simulated Access Points only exist in an Ekahau Site Survey project - they are not physical access points. See the chapter ESS Planning Features for more details on simulated access points. In ESS, you can visualize the coverage and performance of both observed and simulated access points simply by selecting or locking a combination of both in the browser view.
31

PURE SIMULATED COVERAGE VISUALIZED
Filling Unsurveyed Areas to Minimize Survey time
It may be impossible to visit all the areas of the facility during the site survey. Thus, you may not have survey data for all of the locations of the site. Ekahau Site Survey can predict the coverage and performance in the unsurveyed areas. This is done with the Fill Grid With Simulated Values feature that is found in the Signals tab. You must have drawn the walls, inserted observed access point locations on the map, and indicated the proper configuration (Transmission Power, Antenna type) for the access points to use Fill Grid with Simulated Values feature. When Fill Grid With Simulated Values is used, ESS displays measured data where you have performed surveys, and predicts the data to the unsurveyed areas using prediction algorithms.
32

FILL GRID WITH SIMULATED VALUES ALLOWS YOU TO DISPLAY A COMBINATION OF SURVEYED AND PREDICTED DATA.
Marking Exact Access Point Locations
ESS produces a location estimate for each AP that has been recorded at some point during a survey. To display the estimated locations, select or lock the preferred survey(s) and network(s) or single AP(s) in the Browser View, click the Visualization Tab, select Access Point Location Estimate View, and fine Grid size. You can also manually mark the exact location of each AP for analysis, reporting, or documentation purposes. These AP locations do not affect any visualization or calculation, unless you have checked the Fill Grid With Simulated Values checkbox. To mark a known (exact) AP location on the map:
33

1 Select an AP from the Browser View.
2 Select the Edit tool ( ).
3 Right-click on the map at the exact location of the AP and select Place Selected Access Point from the context menu.
You can also find an AP in the Browser View by left-clicking the desired AP on the map. You can select multiple APs by holding down CTRL.
USE THE ACCESS POINT LOCATION ESTIMATE TO FIND AN AP (AFTER A FIELD SURVEY), AND PLACE THE MAP SYMBOL AT THE EXACT LOCATION.
34

Segregating My Access Points and Other Access Points
By default, ESS adds all discovered access points in the My Access Points folder, and considers them “friendly,” or as ones that the users can associate with. When you see foreign networks or APs appearing under the My Access Points folder, it is highly recommended to mark them as Other Access Points by moving them to the Other Access Points folder. To move items between folders, hold down the left mouse button and drag the selected item(s) to the new location.
Survey Properties, Chart, and Events
Select a survey and click the Properties Tab in the Browser View or right-click a survey and select Properties from the context menu. The Properties Tab can be used for storing any useful information, such as surveyor name, survey notes, and any special comments. The Chart Tab is used for displaying the recorded signal strength readings of the selected APs, and the Events tab can be used for checking when the survey was started, stopped, etc.
35

Editing Access Point Properties
Select an AP and click the Properties Tab in the Browser View or right-click an AP and select Properties from the context menu. Here you can add Access Point Notes, which can be reported automatically later. The notes may include information about AP mounting, cabling, housing, and so on.
The observed properties were detected during the site survey and cannot be changed. You can modify the simulated properties for example to store the access point configuration information, such as transmission power and antenna type. When the access point is discovered, default values are added for transmission power, height, and antenna type. The simulated properties of a measured access point – except for the band/channel - should always be changed to correspond to the configurations that were active when the survey was conducted. Changing these values for the measured, “real-world” access points will not change the visualizations, except when the access point has been placed on the map and Fill Grid With Simulated Values is enabled. The measured channel of the AP is the channel that the AP was on at the time the survey was conducted. Changing the channel of the AP has an effect on co-channel interference, thus affecting visualizations that use the co-channel interference information, such as SNR and Data Rate. See chapter Observed and Simulated Access Points and Properties for more information.
36
The AP color only affects the “Strongest Access Point” visualization. Each AP should have a unique color.
Binding Access Points with Multiple Radios or Virtual LANs
Some AP models use multiple MAC addresses in a single AP. By default, these “multi-MAC” APs appear as multiple APs in the ESS Browser View. To display the multi-MAC APs as one, select or lock all the APs that belong to the same physical AP (hold down CTRL or SHIFT), right-click, and select Bind Access Points from the context menu. To remove AP binding, right-click a bound AP in the Browser View and select Remove Binding.
37

CHAPTER 6: Visualization, Analysis and Exporting
General Visualization Settings
The visualization features in ESS allow you to analyze the recorded (or simulated) network performance, and improve your Wi-Fi network.
1 To visualize data, you must first select or lock the preferred survey(s) and network(s) or single AP(s) in the Browser View that you want to visualize – you can either use the Lock feature [preferred] or select multiple items by holding down CTRL or SHIFT.
2 Open the Visualization Tab in the bottom view, and select a suitable visualization View to display its results on the map. See the following chapters for details of each visualization view.
3 Adjust the grid to set the correct amount of extrapolation for the surveyed data. Click View > Grid to turn on the visual grid. This helps selecting a suitable accuracy for the visualization. It is recommended to always use a finer grid size, provided that you have collected enough data around the site.
38

Grid Setting
Example Description
Coarser
If you have surveyed a large area in a limited time, there are likely some spots that have not been visited. To display a continuous visualization over the whole survey area, use a coarser setting (=more extrapolation).
Finer
If you have surveyed a smaller indoor (or outdoor) area with lots of survey routes, select a finer setting. The results are accurate, but you have to survey more.
Fine using Fill Grid With Simulated Values
If you have indicated wall materials and observed AP locations and settings, use Fill Grid with Simulated Values to show surveyed data as well as predicted data outside the surveyed routes.
39

4 You can change the adapter type from the Adapter list box (for applicable visualization types) at any time to simulate how different adapters would function. If the adapter of the end users varies or is not known, use “Generic 802.11a/b/g”
5 Adjust the Network Load slider (for applicable visualization types) to simulate adding wireless network traffic to the network. Increasing network load increases co-channel interference, which may decrease SNR and data rate. 0% network load means no traffic at all, while 100% means a theoretic situation where all the access points would be transmitting data 100% of the time – which does not happen in the real world. Set the network load between 10% and 20% in a typical Wireless LAN installation. For networks with constant and excessive data throughput, use 20% to 50%. Values higher than 50% are extreme, and should be used mostly for locating possible network troublespots more easily.
NOTE (FOR ADVANCED USERS) If required, you may edit the different adapters’ values in the nics.conf file located in the conf folder under your Ekahau Site Survey installation directory. Refer to your Wi-Fi adapter’s documentation to find out the minimum receiver sensitivities to operate at specific data rates (1, 2, 5.5, 11, 18, 36, 54 Mbps).
40

Click the Legend Properties button to set the color range, value range, and number of colors for the selected visualization. Use the Legend Properties to set minimum requirements to your network, i.e. typing –75dBm to “Min”-field when displaying Signal Strength will only display colors in the areas where signal strength exceeds –75dBm.
6 Click the Legend Details button to display a detailed color and value range for the selected visualization.
7 Check the Fill Grid with simulated values checkbox to fill the empty grid squares with predicted signal values. This feature requires first indicating the AP transmit power and antenna type, and placing the recorded APs on the map – see
41

Editing Access Point Properties and Marking Exact Access Point Locations. It can significantly improve your site survey speed and visualizations by predicting the signal characteristics for the areas that you did not visit.
USE THE VISUALIZATION TAB FOR ANALYZING THE NETWORK DATA.
Signal Strength
The signal strength view displays the normalized signal strength of the selected APs. By default, the value of the strongest AP’s signal is shown per location. If you wish to visualize the coverage of your network, select the “My Access Points” –folder. The signal strength view displays the coverage of the wireless network, and helps find the specific areas with weak network coverage or backup coverage.
1 Select Signal Strengths from the View list box.
2 Select Viewed Signal.
Viewed Signal
Description
Strongest Displays the strongest signal at each map location.
2nd Strongest
Displays the 2nd strongest signal at each map location. Answers the question: “What
42

if my strongest access point broke down at any location, would I still have coverage?”
3rd Strongest
Displays the 3rd strongest signal at each map location.
3 Choose Access Point Category: My, Other or All. Regardless of which AP’s you have locked or selected from the browser view, the AP Group will limit this selection to only show the signal strength of
4 Select the appropriate Grid setting to set the accuracy for the visualization. Select a Coarser setting if your survey lines are far away from each other or a more Fine setting if survey lines exist very near to each other. The more survey lines you have, the finer you can set the grid, and the more accurate your survey visualization will be. The visual grid can be turned on or off from the View menu.
NOTE It is recommended to always use a finer grid size, provided that you visit most of the grid squares when recording the field data.
5 Optionally set the dBm value range (for example, min. requirements) and number of visualization colors by clicking the Legend Properties button. The default setting is between -100 (weak) and -10 (strong).
6 Click the Legend Details button to display the accurate dBm ranges for different colors.
43
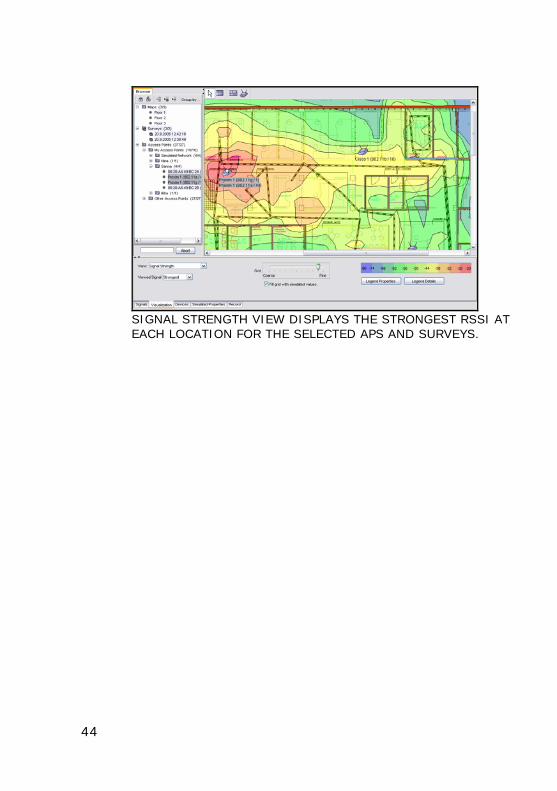
SIGNAL STRENGTH VIEW DISPLAYS THE STRONGEST RSSI AT EACH LOCATION FOR THE SELECTED APS AND SURVEYS.
44

Adapter Signal Strength
The adapter signal strength displays the signal strength for the selected Wi-Fi adapter model.
1 Set the other visualization options as described in the
Signal Strength chapter.
2 Select a network adapter, typically the closest one to the expected adapter to be used by the network users, from the Adapter list box. This allows ESS to fine-tune its visualizations to the specified adapter.
3 You can change the adapter type at any time to simulate how different adapters would function in the same environment.
Signal to Noise Ratio (SNR)
The SNR view displays the relationship between Wi-Fi signal strength (RSSI) and interference, as described in the next chapter. With high interference, the SNR can drop down to zero, making data transfer very slow or impossible. SNR is calculated as follows:
Signal to Noise Ratio (SNR) = RSSI – Noise Level
Select the expected Adapter, Data Rate, and Network Load from the list boxes. The network load simulates how often the selected AP(s) are transmitting data, 100% meaning all the time (worst-case scenario), 0% never (best case scenario, no traffic in the wireless network). Using the Network Load slider, you can easily
45

simulate how adding traffic would affect the performance of your wireless network. The more traffic, the more potential co-channel interference will occur. Please note that the SNR visualization is based on a computational estimate from the recorded data – not concrete SNR observations from the Wi-Fi adapter. Momentary SNR values are not used because they may be affected by momentary variation such as a varying number of clients transmitting data, or random radio interference, such as emissions from a microwave oven. During a preliminary site survey the network is not generally in production use, which means that the survey results may not represent the performance of the production network.
IF THE SNR IS LOW OR BELOW ZERO, THERE’S EITHER WEAK SIGNAL STRENGTH, OR RADIO INTERFERENCE AFFECTING YOUR NETWORK PERFORMANCE.
46

Interference
The Interference visualization displays what happens when all selected or locked APs send data at the specified interval. The Interference view calculation assumes that the strongest signal of the My Access Points is the associated one, and all other signals were interfering with it by sending data.
1 Select the expected Network Load from the list box. The network load simulates how often the selected AP(s) are transmitting data, 100% meaning all the time (theoretical worst-case scenario), 0% never (best case scenario).
2 Select the closest matching Adapter from the Adapter list box. This allows ESS to fine-tune its visualizations to the specified adapter. You can change the adapter type at any time to simulate how different adapters would function.
Please note that the Interference visualization is based on a computational estimate from the recorded data – not concrete observations from the Wi-Fi adapter. Momentary Interference values are not used because they may be affected by momentary variation such as varying number of clients transmitting data, or random radio interference, such as emissions from a microwave oven.
47

BY INVESTIGATING THE INTERFERENCE SURFACE YOU CAN FIND THE OPTIMAL CHANNELS WITH MINIMUM INTERFERENCE.
48

Strongest Access Point
The strongest AP view displays the strongest AP at each map location. Typically the Wi-Fi adapters try to associate with the AP that has the fastest data rate (combo-adapters) or strongest signal (single-band adapters). Thus, Strongest AP visualization can be used for predicting roaming behavior and when planning for load-balancing. The color for each AP can be chosen from the Access Point Properties. Select the closest matching Adapter from the Adapter list box. This allows ESS to fine-tune its visualizations to the specified adapter. You can change the adapter type at any time to simulate how different adapters would function.
VISUALIZING THE STRONGEST APS PER LOCATION. SPECIFIC COLOR CAN BE DEFINED FOR EACH AP.
49

Access Point Count
The Access Point Count displays the number of APs at each location with respect to the selected Minimum Signal Strength. The feature is useful for visualizing overlapping coverage areas, for example to ensure “backup” coverage in case of an AP breakdown, or to find areas of excessive overlap that may cause interference.
THE ACCESS POINT COUNT SURFACE DISPLAYS THE NUMBER OF OVERLAPPING APS PER LOCATION.
50

Signals at Channel
The Signals at Channel displays the strongest signal strength (RSSI) at each location for each individual channel. Use the Band/Channel list box to change the band (802.11a/b/g) and channel. Signals at channel can be used to display how “crowded” with signals different locations and channels are. Select a band/channel (for example 802.11b / 5) that is not used by any of your APs, to display the signal leakage from surrounding channels (802.11b / 4 and 802.11b / 6).
THE STRONGEST SIGNAL PER LOCATION AT CHANNEL 2 (802.11B).
51

Access Point Placement Tip
The AP Placement Tip helps to find the optimum location for a new or existing AP.
1 Select the AP(s) from the Browser View that you wish to be treated as your “existing network”. If you have, for example, 10 APs, you can select all or them, or just 9 of them, to see where the “last one” should be installed instead of its current location.
2 Select the band (802.11a/b/g) and channel that you’d like to use with the AP. Try different channels to see how the suitability changes. Channels and locations with lower interference and signal strength are given better suitability. Higher suitability (near 100) is marked with red color (by default).
AP Placement Tip suggests the location for your next access point, provided that you know the channel to use. Use the network prediction features for more in-depth network planning.
52
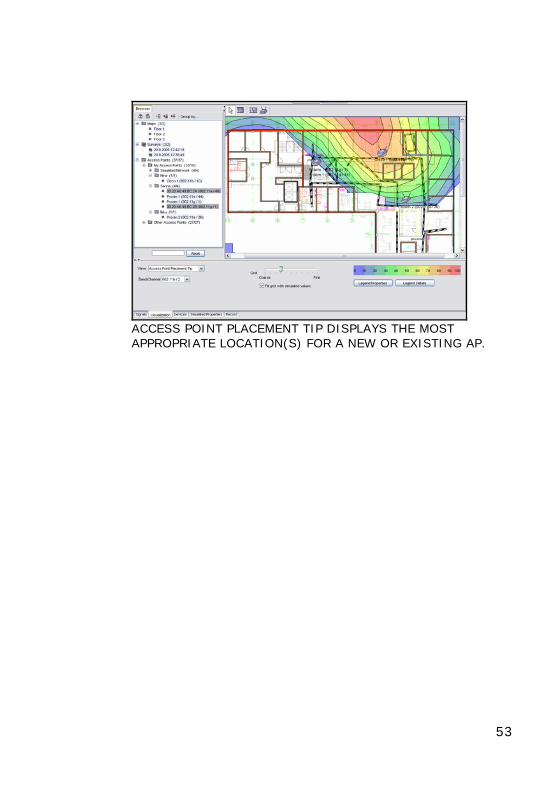
ACCESS POINT PLACEMENT TIP DISPLAYS THE MOST APPROPRIATE LOCATION(S) FOR A NEW OR EXISTING AP.
53

Access Point Location Estimate
The AP Location Estimate helps to find the location of your existing APs or unknown or unauthorized “rogue” APs.
1 Unlock all the access points
2 Select the AP(s) that you wish to locate from the Browser View. Selecting only one or two access points makes finding the access point(s) easier.
3 Select finer Grid size to calculate more accurate AP location.
4 Find the APs from the suggested locations.
5 After finding an AP you may optionally mark its exact location on the map for automatic reporting or documentation purposes. See Marking Exact Access Point Locations Chapter for details. Note that marking the exact AP locations will not affect any map visualization, unless you have checked the Fill grid with simulated values checkbox.
54

ACCESS POINT LOCATION ESTIMATE VISUALIZATION
55

Data Rate
The data rate estimation is based on the specified network load setting, selected adapter, and the calculated SNR for each location. The actual data rates may vary from the estimate.
1 Select the expected Network Load and Adapter from the list boxes. The network load simulates how often the selected AP(s) are transmitting data, 100% meaning all the time (worst-case scenario), 0% never (best case scenario).
2 ESS will visualize the predicted data rate per location using the strongest AP signal at each location.
DATA RATE QUICKLY GIVES AN ESTIMATE OF THE ACHIEVABLE THROUGHPUT PER LOCATION.
56

Exporting and Printing Map Images
• Open an existing project with surveys, or record a new survey.
• Make selections in the Browser View and Visualization Tab to display the appropriate visualization on the map.
• Print map by selecting File > Print and click OK to print the Map View to the default printer.
• Export the Map View to a file by selecting File > Export Image… Type a name for the image file, select the format, and click OK.
NOTE Printing or exporting the image will not include a legend,
use the report feature for full visualization details. Printing may take several minutes depending on your printer and the map image. The quality and color accuracy of the printed images and reports may vary
Exporting Data as Text
1 Open an existing project with surveys, or record new.
2 Select the surveys you wish to export in the Browser View.
3 Export the surveys by selecting File > Export Data…
4 Type a name for the data file and click OK.
The export data format consists of header information and survey data. The header describes which map(s), site survey(s), and AP(s) were selected or locked in the ESS during the export.
57

The survey data (after <BeginData>) describes the AP ID, survey ID, RSSI, noise level, map ID, and map coordinates for each map point that was clicked during the survey. The upper left corner of each map image is the origin (0,0) of the map coordinate system. The X coordinate grows from left to right and Y coordinate from top to bottom. The time format is UNIX time as milliseconds since the standard epoch of 1/1/1970.
Exporting Data as XML
1 Open an existing project with surveys, or record new.
2 Export all data by selecting File > Export as XML
3 Type a name for the data file and click OK.
The XML format contains all data in the project, including all map images, in Base64 format. For complete specification of the XML format, please see the XML schema file surveydata.xsd located under the installation folder in \doc\xmlexport. The XSD file describes the data types and their relationships for the export function. You can also find an example of the exported XML file example.xml in the same directory. These files are provided for user documentation only and they do not affect the XML export feature.
58

Exporting to Remote Host
This feature will generate the XML export file and then send it to a remote host, referred to with IP address and port number.
1 Open an existing project with surveys, or record new.
2 Export the survey data to a remote host by selecting File > Export to Remote Host
3 Choose the remote host IP address and Port Number
59

CHAPTER 7: Abbreviations and Definitions AP Wireless LAN Access Point dBm Decibels relative to one milliwatt, where one milliwatt (1 mW) equals 1/1000 of a watt. This unit is commonly used in test laboratories to define signal strength. The dBm increment is based on the decibel, a logarithmic measure of relative power. Suppose a signal has a power level of P mW. Then the signal strength in dBm, symbolized SdBm, is: SdBm = 10 log10 P A 1-mW signal has a level of 0 dBm. Signals weaker than 1 mW have negative dBm values; signals stronger than 1 mW have positive dBm values. ESS reports all signal strengths as dBm values. IEEE The Institute of Electrical and Electronics Engineers, Inc. A non-profit, technical professional association of more than 380,000 individual members in 150 countries. Produces 30 percent of the world's published literature in electrical engineering, computers and control technology, and has nearly 900 active standards with 700 under development.
60

IEEE 802.11b The most common Wireless LAN standard that provides up to 11 Mbps by using the 2.4GHz band with 11 channels (US) or 13 (EU). There are only 3 channels (1, 6, and 11) which do not overlap. IEEE 802.11a Delivers up to 54 Mbps by using twelve separate non-overlapping channels in the 5GHz frequency band. As a result, up to twelve APs can be set to different channels in the same area without them interfering with each other. This makes AP channel assignment easier and increases the throughput. RF interference is also less likely because of the less-crowded 5GHz band. Due to higher frequency, however, range (around 80 feet) is somewhat less than with lower frequency systems (i.e., 802.11b and 802.11g). The problem with 802.11a is that it is not directly compatible with 802.11b or 802.11g networks. IEEE 802.11g Extension to 802.11b, the basis of the majority of wireless LANs in existence today. Uses OFDM (orthogonal frequency division multiplexing) technology for data rates up to 54 Mbps within the 2.4 GHz band. Because of backward compatibility, an 802.11b radio card will interface directly with an 802.11g AP (and vice versa) at 11 Mbps or lower data rate depending on range. Similar to 802.11b, 802.11g operates in the 2.4GHz band, and the transmitted signal uses approximately 30MHz, which is one third of the band. This limits the number of non-overlapping 802.11g channels to three,
61

which is the same as 802.11b. This means that there is the same difficulty with 802.11g channel assignment as with 802.11b when covering a large area with high user density. The solution is to lower the power of each AP, which allows placement of APs closer to each other. Infrastructure Mode An 802.11 networking framework in which devices can communicate with each other or with a wired network through an Access Point (AP). When an AP is connected to a wired network and a set of wireless stations it is referred to as a Basic Service Set (BSS). An Extended Service Set (ESS) is a set of two or more BSSs that form a single subnetwork. Most wireless LANs operate in infrastructure mode because they require access to the wired network. NL Noise Level RF Radio Frequency Rogue AP Unauthorized or hostile access point RSSI Received Signal Strength Indication SNR Signal-to-Noise Ratio (SNR = RSSI – NL)
62

SSID Service Set Identifier, a 32-character unique identifier attached to the header of packets sent over a WLAN that acts as a password when a device tries to connect to the AP. Because an SSID can be sniffed in plain text from a packet it does not supply any security to the network (even when hidden). An SSID is also referred to as a network name because it identifies a wireless network. Wi-Fi Wi-Fi (Wireless Fidelity) is the certification given by the Wi-Fi Alliance for wireless networking equipment that passes the Wi-Fi Alliance tests. Wi-Fi labeled equipment will work with any Wi-Fi certified device.
63

CHAPTER 8: Troubleshooting
I can’t see any signals in the ESS
• Click the Ekahau Client Controller Icon on the system tray to see if Ekahau Client has encountered errors.
• Refer to the Device Support document in the Client folder in Start Menu to see which Wi-Fi adapters and drivers are supported, and how to configure network settings.
• Turn on broadcast SSID on your network access points
• Make sure all but one Wi-Fi adapters are disabled (for example, if using an external NIC but the laptop also is equipped with an internal NIC)
• Turn off any programs that may be interfacing with your Network Adapter
I can only see 802.11b (or 802.11a) APs even though I’m using 802.11a/b combo card.
• The available bands also depend on any limitations in the active configuration profile. Use your Wi-Fi adapter’s wireless configuration utility to create a configuration profile that allows reading preferred 802.11 band(s).
64

How do I review the survey results?
1 Perform the survey or load an existing survey file.
2 Lock the surveys and APs (AP) you want to visualize. Locking “merges” the surveys and APs.
3 Select a visualization view from the Visualization tab.
4 Adjust the Grid slider to an appropriate accuracy level.
5 Adjust Additional settings (legend and other visualization-specific settings), if necessary. Switch the visualization of Survey trails, Grid, Access points, and Reference points on or off from the View menu.
What is the best way to perform a survey?
• Use a lightweight laptop or Tablet PC. A touch screen can also be useful.
• Use a high quality black and white map. This enables you to click your location accurately and read visualizations easily. For maximum performance, avoid using too large files (more than 2000 x 2000 pixels).
• Walk or drive at a steady speed around the area you want to survey.
• If you are surveying a large facility, perform several short surveys instead a single large survey.
• The more data you gather and the more precisely you pinpoint your location, the more accurate the results are.
65

• Adjust the Grid slider to the desired setting and select "Signal strength" from the Surface tab. Lock the Access points while surveying to update the results in real time and to cover all the obvious holes in the coverage.
• Note that the data is gathered continuously and not only when you click the map.
66

APPENDIX A: Planning NOTE The Planning Features are only available when Ekahau
Planner optional module has been purchased and activated. The ESS planning features present an innovative approach that streamlines Wi-Fi network design and deployment. It can be used to intelligently simulate the AP placement, settings, and walls, and thus predict the expected network performance prior to installing any Wi-Fi infrastructure. Network plans can be verified later and improved by recording real site survey data from the installed network. The ESS planning features also improve field site surveys by optionally filling the unvisited areas with predicted signal values (after manually placing the surveyed APs on the map). You can also plan for added capacity or coverage, and perform various simulations on your network using ESS’s planning features.
NOTE All network design tools, such as the Ekahau Site Survey Tool, can only predict the expected Wi-Fi performance. It is always recommended to perform a field site survey after the initial AP placement to validate the predicted network plan before permanent network installation.
67

Creating a Network Plan
1 Open a floor map by selecting File > New… > Map.
2 Define the map scale by using the Scale tool. The map scale is important for correctly predicting the network coverage and displaying the wall thicknesses.
3 Click the Wall tool and select a suitable wall material type. Click the map sequentially to draw right-angled wall. Right-click to end the wall or hold down CTRL to draw free-angled walls.
NOTE If required, you can edit, add and remove the wall materials in the wall-types.conf file located in the conf folder under your Ekahau Site Survey installation directory.
4 Click the Edit tool ( ) to select, edit, move, or delete walls and APs. Drag APs and walls to move their locations. Select multiple items by holding down CTRL or SHIFT, or by holding down the left mouse button and dragging a rectangle. You can also change the AP antenna directions by holding down the ALT key while left-clicking an AP, holding down the left mouse button, and choosing the antenna direction.
5 Avoid unnecessary drawing of walls: If you are planning a multi-floor facility that has several floors that have similar or almost similar structure, right-click on the map name and select duplicate. This will create a copy of the current map, including the scale and wall materials.
68

6 Select the Simulated Access Point tool and click the map to create and place a new Simulated Access Point. To define the antenna direction, hold down the left mouse button and choose the antenna direction with the mouse before releasing the left button. Drag the marker with the left mouse button to move the AP. The Simulated Access Points will appear under the Simulated Access Points folder in the Browser View under My Access Points.
7 Click the Simulated Properties Tab in the Bottom View to display and edit the properties of the selected AP(s). You can edit the values by clicking the fields.
8 Click the Visualizations Tab to make sure that your network plan fulfills the requirements in coverage, data rate, backup APs, and other Wi-Fi characteristics.
9 Adjust the number of APs, their locations, and configuration, until the network meets your requirements.
10 Deploy the network using the information (access point locations and configuration) acquired from the network plan. You can record “real-world” site survey measurements to the same project where you have the network plan. It is easy to compare the results of the visualizations between the simulated and measured access points by selecting or locking only the desired group.
11 Save the project and optionally print it, export its images, or generate a customizable HTML report of the network plan.
69

NOTE If required, you can edit the displayed antenna names and gains in the antenna.conf file located in the conf folder under your Ekahau Site Survey installation directory. Mark the gains for different antenna types between every 10º. See the diagram for an example of visualized Azimuth Pattern for the Yagi Antenna (8dBi).
70
APPENDIX B: Reporting NOTE The Reporting Feature is only available when Ekahau
Reporter optional module has been purchased and activated.
ESS Reporting Feature
The ESS reporting feature allows you to quickly generate informative reports of the available APs, coverage areas, and other characteristics of 802.11a/b/g networks. The reports are based on editable HTML templates. The blank generated report can be viewed using a web browser. The standard HTML language and additional HTML-like Report Tags allow you to fully customize the styles and locations of the texts, images, general report information, site survey list, AP list, survey notes, AP notes, and different visualizations.
Generating Reports
You can generate a report by following the instructions below:
1 Open an existing site survey file (.ess) or create a new one.
2 Select or lock the map, survey(s), and AP(s) in the Browser View that you wish to include in the report. Note that the AP map symbols, survey notes, and AP notes are included by default unless you modify the
71

default HTML template. The additional settings, such as legend properties, grid setting and visualization-specific settings (for example receiver sensitivity and selected NIC card for data rate), will be used.
3 Select the HTML template from the list box, or add your own template by clicking the Add Templates… button.
4 Type a name for the report and select its output directory. The Name field indicates the folder name that will be created under the directory in the Location field. You may also select between the PNG and SVG image formats for the generated images.
5 Click the Create button to create and save the report in the specified directory. If you ticked the View Generated Report in Browser checkbox, the report will be opened in your default web browser.
6 If you want to share your report, compress (ZIP) the report folder and send it as an e-mail attachment.
Editing Report Templates
You can easily edit the existing report template or create your own report template by using any text or HTML editor. Note that some popular HTML editors, such as Microsoft® FrontPage, are not recommended because they insert additional tags in documents. Some very basic knowledge of HTML is required to edit the templates.
72

All the report tags begin with <report:, for example <report:Today/>. A report tag either creates a single element (such as the name of the map), or HTML-entities, such as an AP information table. You can use Cascading Style Sheets (CSS) to adjust your report layout and appearance. With CSS you can also define page breaks to your report. The default template utilizes CSS. For more information on CSS, see: http://www.w3.org/Style/CSS/. Editing the default report template:
1 Open the default_template.html file with a suitable text (recommended) or HTML editor. The file is located in the templates folder under the ess installation folder.
2 Select File > Save As… to save the file with another filename. Make sure the file extension is .HTML, not .TXT.
3 Edit the Report Tags, their locations, and the HTML texts as instructed below. Use standard HTML-language and appropriate tags only. The report is parsed prior to generation and ess will inform you if inappropriate HTML or report tags are found.
4 Save the document as .HTML.
5 Open ess and generate a new report based on the edited template.
6 Observe the changes in the report and repeat steps 1-5 if necessary.
73

NOTE You can create localized reports for example in Japanese:
Change default encoding from UTF-8 to Shift_JIS in \conf\sitesurvey.conf, and
Change encoding from UTF-8 to Shift_JIS in \templates\default_template.html
There is also a sample Japanese report template under \templates\default_template_japanese.html. General Tags The General tags do not require a separate end tag. They will simply replace themselves with the related information.
Displaying the current date:
<report:Today/>
Attribute Argument(s) Description
Today - Inserts the report creation date and time, for example Feb 4, 2004 9:21 AM
MapName - Inserts the name of the currently open map.
74

Count Tag The Count tag displays the number value of any attribute-argument pair marked between its beginning and ending tags.
Displaying the number of selected surveys:
<report:Count> <report:Surveys group="selected"/> </report:Count>
Attribute Argument(s) Description
AccessPoints group
all/selected Displays the number of all or selected APs.
Surveys group all/selected Displays the number of all or selected surveys.
Graphics Tag The Graphics tag generates an image based on the given attributes and arguments. Several tags can be placed in a single Graphics tag section. Creating a map image with the locations of recorded signal strength samples, manually placed APs, and signal strength surface:
75

<report:Graphics> <report:MapImage/>
<report:SamplePoints/> <report:AccessPointLocations/>
<report:Surface type="Signal Strength" contours="yes"/> </report:Graphics>
Attribute Argument(s) Description
MapImage - Uses the open map image as a base for the output image.
Sample Points
- Displays the recorded sample point locations.
AccessPointLocations
- Displays the manually placed AP symbols.
Surface type
Signal Strength Signal-to-Noise Ratio Interference Signals at Channel Strongest Access Point Access Point Count Access Point Location Data Rate
Generates the selected visualization for the map.
contours yes/no Displays black contour lines between the color areas.
76

Surveys Tag The Surveys tag displays information about the site surveys. It does not require a separate end tag. By selecting the fields to be used you can limit the amount of information to be used in one surveys-table. When using survey notes it is recommended to divide the survey notes to another Surveys-table to prevent the HTML-tables from getting too wide.
Creating a survey table sorted by survey names:
<report:Surveys group="all" structure="table" sortBy="name" fields="name,created,modified,record time"/>
Attribute Argument(s) Description
group selected/all Lists all or only the selected surveys.
structure table/tree Sets the table or tree view for the information.
sortBy name/created/ modified/record time/notes
Sorts the table based on a given field argument.
fields name,created, modified,record time,notes
Displays all listed fields.
77

AccessPoints Tag The AccessPoints tag displays information about the APs. It does not require a separate end tag.
Creating an AP table sorted by network name (ESSID):
<report:AccessPoints group="selected" structure="table" sortBy="ESSID" fields="essid,name,band/channel "/>
78

Creating an AP tree view:
<report:AccessPoints group="selected" structure="tree" format="MAC={mac},ESSID={essid},Band/Channel={band/ch}"/>
Attribute Argument(s) Description
group selected/all Lists all or only the selected APs.
structure table/tree Sets the table or tree view for the information.
sortBy essid/name/ band/channel Sorts the table based on a given field argument.
fields essid,name, band/channel, power,antenna, height,direction, privacy
Displays all listed fields.
format MAC={mac},ESSID={essid}, CH={channel}, BAND={band}
Sets the field names for the tree structure.
79

Legend Tag The Legend tag creates a color range legend for the image.
Creating a signal strength (RSSI) legend table with 10 items in one row:
<report:Legend type="Signal Strength" layout="horizontal" limit="10" colorBoxWidth="40"/>
Attribute Argument(s) Description
type Signal Strength Signal-to-Noise Ratio Interference Signals at Channel Strongest Access Point Access Point Count Access Point Location Data Rate
Selects the type of legend.
layout horizontal/vertical Selects the legend layout.
limit Any integer value, for example “10”
Limits the maximum number of legend items per row or column.
colorBoxWidth Any integer value, for example “40”
Selects the pixel width of the legend color boxes.
80

Statistics Tag The Statistics tag creates a statistical signal strength (RSSI) or signal-to-noise ratio (SNR) data table for each selected survey or AP.
Displaying signal strength (RSSI) statistics for each selected survey:
<report:SurveyStatistics data="RSSI" groupBy="survey"/>
Attribute Argument(s) Description
data RSSI/SNR Creates statistical RSSI or SNR data tables for each selected survey or AP.
groupBy AccessPoint / Survey
Groups the data table(s) by survey(s) or AP(s). (See below for a single survey)
81

Appendix C: GPS NOTE The GPS Feature is only available when Ekahau GPS
optional module has been purchased and activated. The GPS Feature allows you to quickly perform extensive outdoor site surveys by driving or walking. With a standard GPS receiver and the Ekahau GPS module there is no need to manually click the map.
Recording a Site Survey with GPS
1 Make sure that the GPS is connected, you have installed the Ekahau GPS license (available separately), and the communication settings are correct: Click the Ekahau Site Survey Icon on the Windows system tray to open Ekahau Client, and select Device Settings.
2 Open the Devices Tab in ESS to view the GPS device properties. Make sure the device is enabled and coordinates are available.
3 Make sure that the Signals Tab shows changing signals.
4 Add New Map by selecting File > New > Map.
5 Use the Scale Tool to define the map scale
6 To see the GPS location marker on the map you must define at least three reference points. Reference points can be added by right-clicking over the map: Coordinates for the clicked location should be received from the GPS automatically (when outdoors).
82

7 Reference points can be also added manually by right-clicking the map in the Browser View and selecting Projection. Enter the pixel coordinates and their real world counterparts manually.
8 Add a new site survey to the project by selecting File > New > Survey.
9 Click the Record button to start recording network data to the survey. If you want to have a break, turn off the data collection by clicking the Record button again.
10 Take your laptop with you and start driving or walking around the network area. Your GPS position coordinates are automatically attached to the network data – there is no need to manually click the map.
11 Save project by selecting File > Save.
NOTE When moving through a tunnel, or whenever the GPS
positioning is not available (N/A), some survey inaccuracy may occur. However, the (buffered) survey data is interpolated on the survey route when the first GPS position becomes available, keeping the error at minimum. You may also try “helping” the GPS by manually clicking the map at your correct location.
83