Embed Size (px)
Citation preview

ekoNET solutions for addressing air-pollution in Smart Cities
Introduction
Measurement of the air quality represents an important aspect of quality of life in the cities, as well as for
running responsible operations in different industries. DunavNET developed an ekoNET solution which is
integrated within the IoT Lab platform in order to obtain people perspective and subjective feeling of air
quality, as well as to use the crowdsourcing to tackle the problem, and propose solutions for reduction of
air pollution.
ekoNET portable testbeds [1] , composed of low cost sensor based monitoring devices (EB800/RPi800)
enable a real time monitoring of the air quality (gas and particle sensors, sensors for air pressure,
humidity, temperature and noise measurements) in urban and rural areas and they can be deployed either
indoor or outdoor. Advantages include high mobility and portability, easy installation, cheaper sensor
technologies and a better utilisation of data. Each device includes a GPS module for location and GPRS
mobile network interface for data transfer.
Figure 1: EkoNET Platform
Figure 2 The ekoNET device

The ekoNET solution with portable testbeds is integrated within the IoT Lab platform providing a
description of all resources to IoT Lab database and enabling the access to measurements from EkoNET
sensors via web service. The ekoNET devices are deployed at several locations in Serbia including Novi Sad
city buses (MobiWallet Serbian Pilot [2]), several schools in Belgrade (CitiSense project [3] ), and an open
pit mine in Serbia as well as at test sites in Australia and Canada.
The IoT Lab platform with an integrated ekoNET solution represents a valuable tool for setting up and
deploying the use cases to address the air pollution in smart cities enabling collection of the people’s
perspectives and subjective feeling about the air quality as well as allowing the crowdsourcing of opinions
to tackle the problem and propose solutions for reducing the air pollution.
Use Case scenario
The use case, set outdoor, in the city of Novi Sad, combines geo-localised environmental data collected
by the bus mounted ekoNET devices with geo-localised inputs from the crowd on perception of the air
quality and their happiness level collected through a simple survey all via IoT Lab platform. It also explores
a correlation between the crowd happiness level and environmental conditions taking into account the
crowd socio-economic profile.
Results that are being collected through this use case will benefit the local administration to reduce the
air pollution in the city. As part of incentive scheme each completed survey will contribute towards a small
donation to local charity thus making a step forward towards the happier city.
Similar use case is planned for schools to explore relation between air quality in schools and satisfaction,
performance and behavior of pupils.
Experimental setup
Research required setting up the following interactions and experiments:
1. Crowd interactions – requiring crowdsourcing inputs from end users through surveys
2. Crowdsensing – requiring crowdsensing geo-location inputs from end users’ smart devices
(optional, up to the user)
3. IoT interactions – requiring data from IoT resources, specifically from the portable testbeds
Stage 1 refers to the crowd interaction section of TBaaS: researchers composed survey questions for the
crowd participants including also within the questions an option for the participant to voluntarily report
their GPS location at the time of the survey submission. The survey was implemented within the
LimeSurvey.
Stage 2 refers to IoT interaction section of TBaaS: researchers composed an experiment involving ekoNET
sensors for environmental monitoring that were mounted on city busses. The experiment was setup to
collect real time data on atmospheric and pollution parameters in the city to the platform database. Data
was collected in pre-set time sampling intervals.
Crowd interactions
Crowdsourcing information
A simple questionnaire (2 questions) has been sent via IoT Lab web portal (TBaaS) to a selected group of
participants (with the IoT Lab mobile app installed), Figure 3. Participants have been selected among the
citizens of Novi Sad using the Research Code option available through the platform that easily filters all
the participants interested in this specific use case. Citizens have been informed about the use case

through various communication channels and provided with the instructions how to join it including the
information about the Research Code for this use case.
We have created the survey in both Serbian and English language named “Hepimeter: kako kvalitet
vazduha utice na nase raspolozenje.
Figure 3 Two phones that received a survey defined with a research code – both phones had the research code ‘Hepi021’ included
in the app settings
Questions (translated from Serbian):
1. Please, express your level of happiness today by selecting one of the offered options: exuberant
(6), joyful (5) , satisfied (4) , unhappy (3) , sad (2) , helpless (1)
2. Do you think the quality of the air is: excellent (5), very good (4), good (3), poor (2) or bad (1)?
3. Share your GPS data before submitting the answers
Crowdsensing information
In order to collect the geo-localisation of users at the time of the survey submission, users are asked to
enable geo-location on their smart devices and submit it via survey through a simple button pressing
action.
GPS localisation sensors on participants’ mobile phones would be used and location submitted through
survey.
IoT interactions
Physical testbeds
An experiment is set up with reserved air pollution sensors belonging to ekoNET portable testbeds and
data is collected for the desired time period and with the set sampling frequency.
Merging resulting data
The final part involves relating the survey responses to socio-economic profile of participants and then
merging this with the environmental data collected in the city in order to perform the final analysis of
data and study the correlation.

Research Results (initial run)
Data results from IoT experiment
The data collected from sensors on portable testbeds were saved in a database and downloaded into
excel file. The results showed that we were able to successfully collect data from all sensors on portable
testbed. Number of collected values per hour was also possible to change with the sampling frequency.
Data results from survey
The results provided by participants are collected in LimeSurvey and downloaded in excel format.
Downloaded survey response data from LimeSurvey does not include any socio-economic profile data
since data collected in LimeSurvey DB is only related to questions included in a survey. IoT Lab TBaaS
enables researcher to merge the survey data and socio-economic profile of respondents as illustrated
Figure 4.
Figure 4 Merging (a) socio economic profile of crowd participants with (b) their responses: (a) is stored in IoT Lab DB whilst survey
responses are stored in LimeSurvey DB. They both have the common column – limeResponseID/responseID. which enabled
merging two datasets.
Steps for merging survey data with socio economic profile of corresponding participants are:
1) Download limesurvey data
2) Download socio-economic profile data from IoT Lab TBaaS – IoT interactions by pressing
the button “respondents’ profile”
3) Merge them using the common field (note: LimeResponseID=responseID)
Data visualisation
Visualisation of spatial distribution of data points from both the experiment (collecting environment data)
and survey (collecting users’ responses) from the use case run in real conditions with external users is
presented in Figure 5.

Figure 5 Distribution of responses from surveys as well as data points from sensors on ekoNET device
Initial Results
In the initial 2 weeks long use case run conducted in August/September 2016, 57 inputs were collected.
Environment variables observed were Temperature (T), Relative Humidity (RH) and Carbon Monoxide
(CO) whilst subjective parameters collected through surveys include Level of Happiness (LoH) and Air-
pollution Perception index (APPI). Also collected is the socio-economic profile of participants. Here is
initially shown change of T, RH and CO over time as well as the time distribution of the users’ responses
on their level of happiness over the time period of initial run.
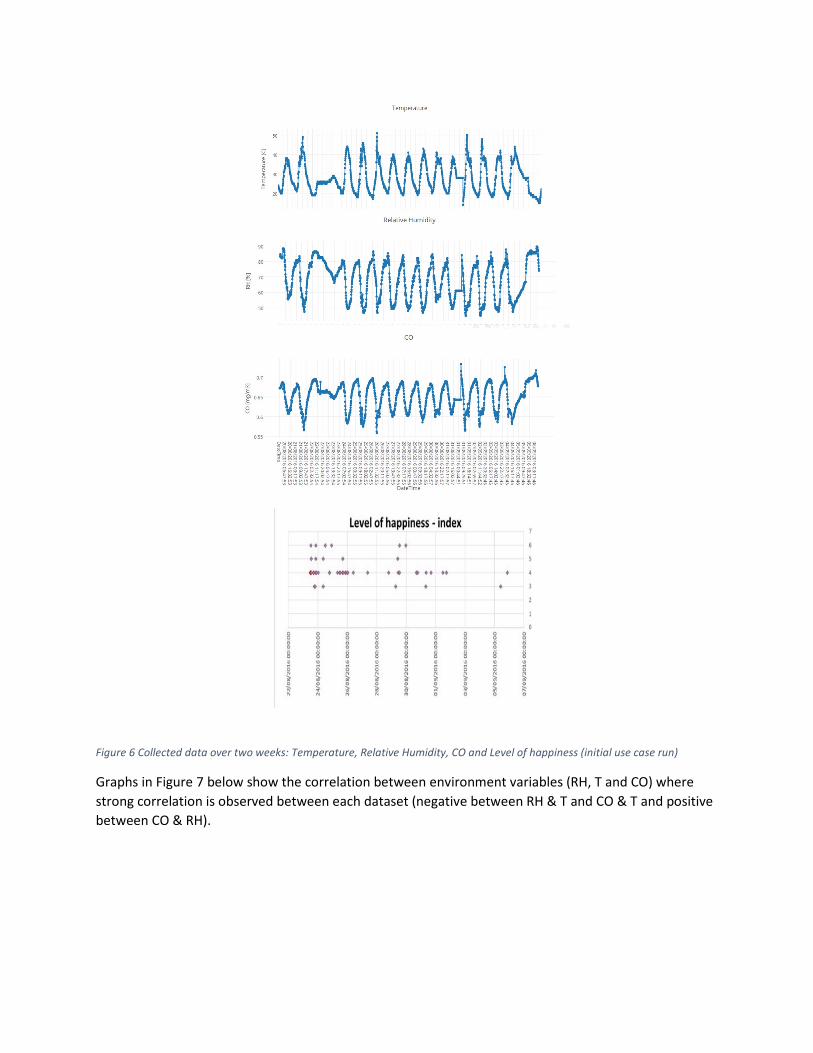
Figure 6 Collected data over two weeks: Temperature, Relative Humidity, CO and Level of happiness (initial use case run)
Graphs in Figure 7 below show the correlation between environment variables (RH, T and CO) where
strong correlation is observed between each dataset (negative between RH & T and CO & T and positive
between CO & RH).

Figure 7 Correlation between environmental variables (RH, T and CO)
Graphs in Figure 8 show there is no correlation between: Level of Happiness (LoH) and T, LoH and Relative
Humidity (RH) and LoH and CO for the collected dataset.
Figure 8 Correlation between environmental variables (LoH and T, LoH and RH and LoH and CO)
Correlation level between Level of Happiness and Air-pollution perception is illustrated in Figure 9.

Figure 9 Correlation between Level of Happiness and Air-pollution perception
Distribution of responses for the Level of Happiness and Perception of Air Quality is shown in Figure 10.
Figure 10 Distribution of respondents’ responses
Outreach and end user engagement
These are the channels used for advertising the use case and attracting the participants:
● Social networks (twitter and facebook) in both Serbian and English.
● Websites of DunavNET and IoT Lab
● Emails to Serbian partners on other projects
● Through MobiWallet project channels/MobiWallet partners and users
● Emails to friends
● Emails to colleagues within the company
● Personal facebook accounts (voluntary)
Future steps
It is planned to repeat the research over a longer period (for at least three months) involving more
people and collecting more observations/responses in order to be able see the real correlation between
people’s mood and the environmental parameters. This will be led by a good promotion of the research
project (with the City of Novi Sad) and will include incentives framework available within the platform.
In addition to involving the City of Novi Sad, plan is to also engage other companies such as Novi Sad
Public Communal Company that has ekoNET testbeds with air pollution sensors placed at various
nurseries/schools around the city and are interested in monitoring the data and finding the air pollution
effects on satisfaction/behaviour of staff/kids.
Impact
This research can benefit:
• Local administration – to learn about localities within the city mostly affected by pollution and to learn
about the people’s perception of pollution and thus take actions to reduce pollution in the city
• Local people/crowd who can benefit through actions of local administrations to reduce pollution in
the city
In the next experiment run, as part of incentive scheme each completed survey will contribute towards a
small donation to local charity thus making a step forward towards the happier city.

References
[1] http://ekonet.solutions
[2] http://www.mobiwallet-
project.eu/index.php?option=com_content&view=article&id=23&catid=8&Itemid=124
[3] http://www.citi-sense.eu/