Embed Size (px)
Citation preview
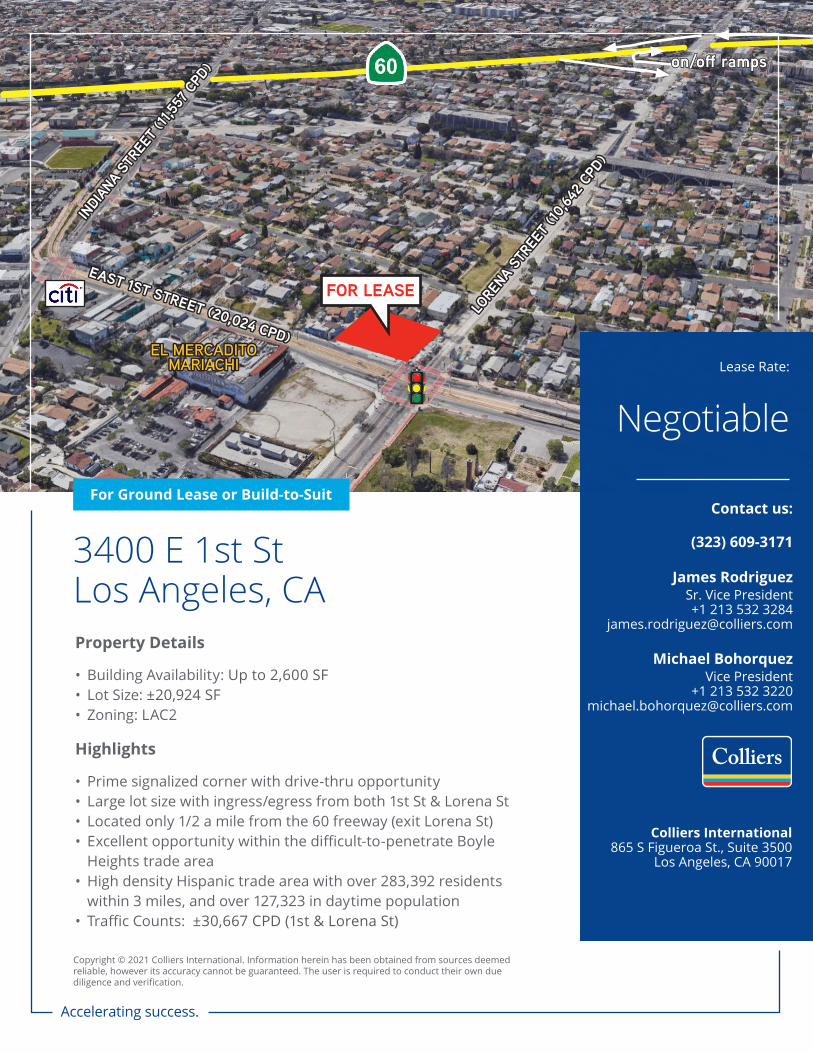
EAST 1ST STREET (20,024 CPD)
EAST 1ST STREET (20,024 CPD)
LORE
NA ST
REET
(10,6
42 C
PD)
LORE
NA ST
REET
(10,6
42 C
PD)
FOR LEASE
INDI
ANA
STRE
ET (1
1,557
CPD
)
INDI
ANA
STRE
ET (1
1,557
CPD
)
EL MERCADITOEL MERCADITOMARIACHIMARIACHI
on/off rampson/off ramps
Accelerating success.
Colliers International865 S Figueroa St., Suite 3500
Los Angeles, CA 90017
For Ground Lease or Build-to-Suit
Negotiable
Lease Rate:
Contact us:
(323) 609-3171
James RodriguezSr. Vice President+1 213 532 3284
Michael BohorquezVice President
+1 213 532 [email protected]
3400 E 1st St Los Angeles, CAProperty Details
• Building Availability: Up to 2,600 SF • Lot Size: ±20,924 SF• Zoning: LAC2
Copyright © 2021 Colliers International. Information herein has been obtained from sources deemed reliable, however its accuracy cannot be guaranteed. The user is required to conduct their own due diligence and verification.
Highlights
• Prime signalized corner with drive-thru opportunity• Large lot size with ingress/egress from both 1st St & Lorena St• Located only 1/2 a mile from the 60 freeway (exit Lorena St)• Excellent opportunity within the difficult-to-penetrate Boyle
Heights trade area• High density Hispanic trade area with over 283,392 residents
within 3 miles, and over 127,323 in daytime population• Traffic Counts: ±30,667 CPD (1st & Lorena St)
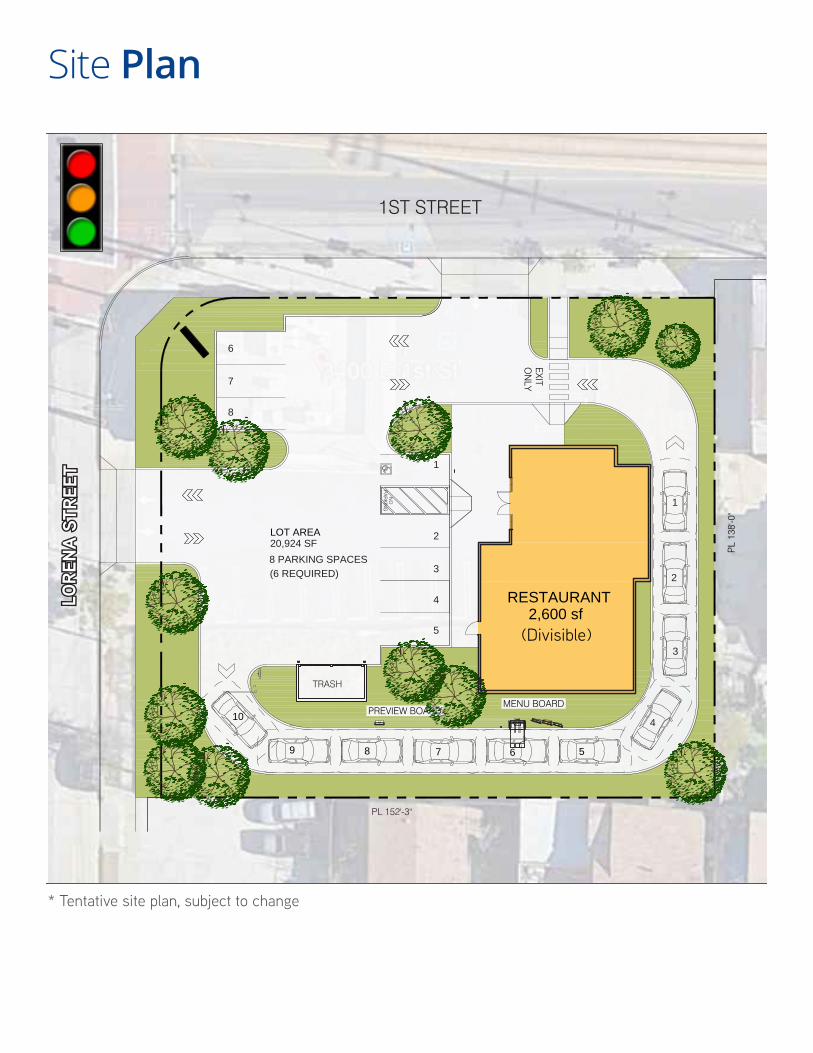
Site Plan
PL
138'
-0"
PL 152'-3"
PA
RK
ING
NO
LOT AREA20,924 SF
1
2
3
4
5
6
7
8
1
2
4
3
TRASH
8 PARKING SPACES(6 REQUIRED)
1ST STREET
LOR
EN
A S
T.
3400 E. 1ST STLOS ANGELES CA
09.21.21
MENU BOARDPREVIEW BOARD
EXIT
ON
LY
56789
10
2,600 sfRESTAURANT
2600 SF DRIVE THROUGH
LORE
NA S
TREE
TLO
RENA
STR
EET
(Divisible)
* Tentative site plan, subject to change
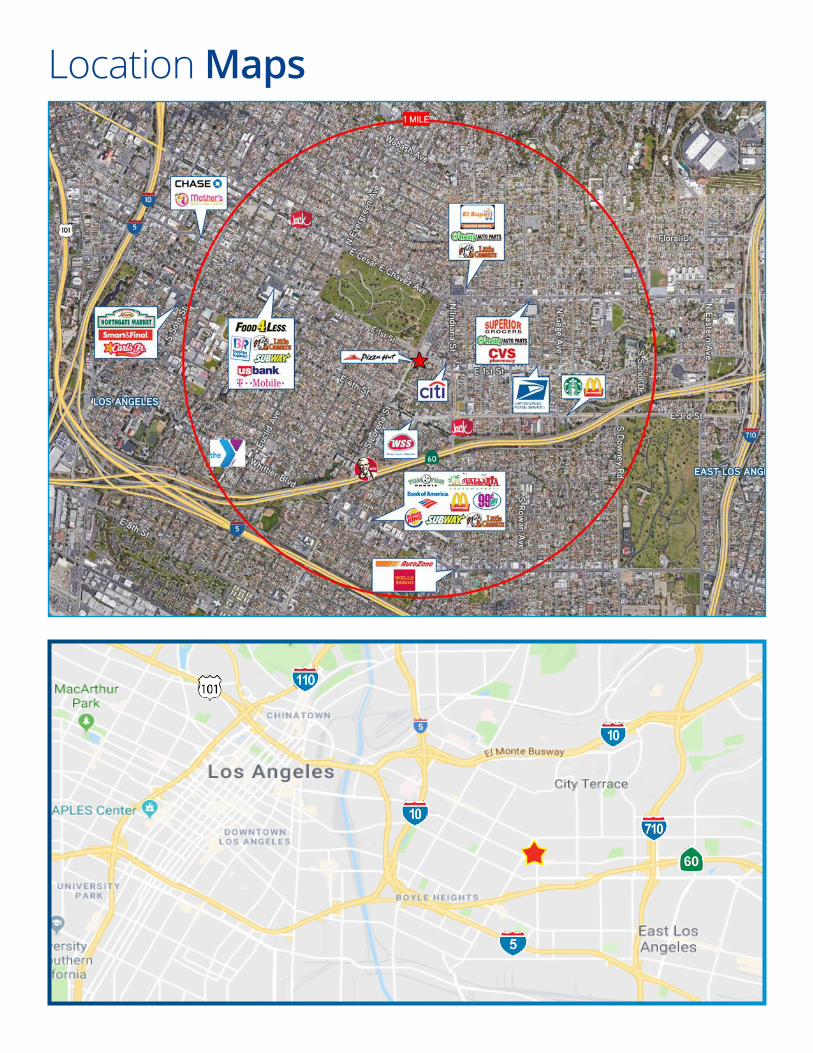
9200 Whittier Blvd | For LeaseLocation Maps
Baldwin ParkBaldwin Park

Demographic Summary Report3400 E 1st St, Los Angeles, California, 90063 Prepared by Colliers1,3,5 mile radius rings Latitude: 34.037018
Longitude: -118.1948390
1 mile radius 3 mile radius 5 mile radiusPopulation Summary
2000 Total Population 65,152 279,008 889,0382010 Total Population 64,295 278,403 894,0892021 Total Population 65,100 283,392 933,561
2021 Group Quarters 207 17,393 26,1132026 Total Population 65,095 286,817 956,704
2021-2026 Annual Rate (CAGR) 0.00% 0.24% 0.49%
2000 to 2010 Population Change -1.3% -0.2% 0.6%2000 to 2021 Population Change -0.1% 1.6% 5.0%2010 to 2026 Population Change 1.2% 3.0% 7.0%2021 to 2026 Population Change 0.0% 1.2% 2.5%
2021 Total Daytime Population 50,850 297,497 970,351Workers 10,176 127,323 426,513Residents 40,674 170,174 543,8382021 Workers % of Daytime Population 20.0% 42.8% 44.0%2021 Residents % of Daytime Population 80.0% 57.2% 56.1%
Household Summary2000 Households 15,449 67,370 237,8562010 Households 15,479 71,310 254,3862021 Households 15,651 73,583 273,051
2021 Average Household Size 4.15 3.61 3.322026 Households 15,604 75,434 283,990
2021-2026 Annual Rate -0.06% 0.50% 0.79%
2000 to 2010 Household Change 0.2% 5.8% 6.9%2000 to 2021 Household Change 1.3% 9.2% 14.8%2010 to 2026 Household Change 0.8% 5.8% 11.6%2021 to 2026 Household Change -0.3% 2.5% 4.0%
2010 Families 12,896 54,100 181,6172021 Families 13,057 54,966 188,4252026 Families 13,046 55,477 192,547
2021-2026 Annual Rate -0.02% 0.19% 0.43%Housing Unit Summary
2021 Housing Units 16,574 78,628 295,193Owner Occupied Housing Units 30.0% 29.8% 27.9%Renter Occupied Housing Units 70.0% 70.2% 72.1%Vacant Housing Units 5.6% 6.4% 7.5%
Owner Occupied Median Home Value2021 Median Home Value $548,221 $565,224 $615,5302026 Median Home Value $680,672 $677,170 $727,658
Income2021 Per Capita Income $14,553 $17,218 $21,0162021 Median Household Income $47,233 $47,106 $50,4922021 Average Household Income $60,294 $64,696 $71,391
Household Income Base 15,651 73,583 273,051<$15,000 13.3% 16.4% 15.5%$15,000 - $24,999 11.4% 11.5% 11.4%$25,000 - $34,999 11.5% 10.5% 9.9%$35,000 - $49,999 16.0% 13.8% 12.7%$50,000 - $74,999 20.5% 17.3% 16.6%$75,000 - $99,999 11.6% 11.4% 11.3%$100,000 - $149,999 10.5% 11.7% 12.7%$150,000 - $199,999 2.9% 4.2% 5.0%$200,000+ 2.2% 3.4% 4.9%
Source: Esri, U.S. Census
09/28/2021
Page 1 of 2
Demographics

DemographicsDemographic Summary Report3400 E 1st St, Los Angeles, California, 90063 Prepared by Colliers1,3,5 mile radius rings Latitude: 34.037018
Longitude: -118.1948390
1 mile radius 3 mile radius 5 mile radiusMedian Age
2010 28.9 31.1 31.52021 29.6 32.0 32.82026 31.8 33.9 34.6
2021 Population by AgeTotal 65,099 283,391 933,563
0 - 4 8.6% 7.3% 7.0%5 - 9 8.4% 7.3% 7.0%10 - 14 8.0% 7.0% 6.7%15 - 19 7.9% 7.4% 6.9%20 - 24 8.6% 8.3% 8.1%25 - 29 9.3% 9.3% 9.4%30 - 34 8.1% 8.3% 8.5%35 - 39 7.2% 7.3% 7.5%40 - 44 6.1% 6.5% 6.5%45 - 49 5.7% 6.1% 6.1%50 - 54 4.9% 5.5% 5.6%55 - 59 4.2% 4.8% 4.9%60 - 64 3.8% 4.2% 4.4%65 - 69 3.2% 3.3% 3.6%70 - 74 2.4% 2.7% 2.9%75 - 79 1.6% 1.9% 2.0%80 - 84 1.1% 1.3% 1.4%85+ 1.1% 1.4% 1.4%
18+ 70.4% 74.1% 75.3%21+ 65.5% 69.3% 70.8%
2021 Population by Race/EthnicityTotal 65,100 283,392 933,560
White Alone 47.8% 44.9% 41.1%Black Alone 0.7% 3.7% 3.7%American Indian Alone 1.0% 1.0% 1.0%Asian Alone 1.1% 8.2% 14.2%Pacific Islander Alone 0.1% 0.1% 0.1%Some Other Race Alone 46.1% 38.6% 35.8%Two or More Races 3.3% 3.5% 4.1%
Hispanic Origin 97.3% 84.5% 76.2%Diversity Index 78.3 84.5 87.9
2021 Population 25+ by Educational AttainmentTotal 38,173 177,486 600,199
Less than 9th Grade 30.6% 25.1% 23.4%9th - 12th Grade, No Diploma 17.3% 15.7% 13.8%High School Graduate 22.9% 21.7% 20.3%GED/Alternative Credential 1.8% 2.3% 1.9%Some College, No Degree 13.9% 15.4% 14.6%Associate Degree 3.7% 4.7% 5.0%Bachelor's Degree 8.0% 11.2% 14.7%Graduate/Professional Degree 1.9% 3.9% 6.2%
Source: Esri, U.S. Census
09/28/2021
Page 2 of 2
Michael BohorquezVice President+1 213 532 [email protected]
James RodriguezSr. Vice President+1 213 532 [email protected]
Contact
This document has been prepared by Colliers International for advertising and general information only. Colliers International makes no guarantees, representations or warranties of any kind, expressed or implied, regarding the information including, but not limited to, warranties of content, accuracy and reliability. Any interested party should undertake their own inquiries as to the accuracy of the information. Colliers International excludes unequivocally all inferred or implied terms, conditions and warranties arising out of this document and excludes all liability for loss and damages arising there from. This publication is the copyrighted property of Colliers International and/or its licensor(s). ©2021. All rights reserved.