Embed Size (px)
Citation preview

1
Global WarmingEl Niño and the Southern Oscillation
Earth Science: Ch 20, p. 573-581STM: Ch 25, p. 545-568
Glaciers
Earth ScienceChapter 6
p. 154-159, 168-173
Southern Hemisphere Northern Hemisphere
Ice Age Sea Level on North America Valley and Piedmont Glaciers
• Malaspina Glacier, Alaska

2
Crevasse Glacier movement, tracked by stakes
Glacial Snow BudgetStriations and
polish
Cycle of valley glacier erosion U-Shaped Valley with tarns

3
Hanging Valley Arete
Cirque, Horn Fiord
Lateral moraine Lateral and Medial Moraine

4
Moraine deposit Loess
Continental Glacial deposits Pleistocene Ice Maximum
Upper Midwest End Moraines Coastal moraines of New England

5
Upper Midwest drainage before glaciation
Upper Midwest Drainage—after glaciation
• Deranged drainage after ice melts
Pluvial Lakes of Southwest
Ice Age Sea Level on North America
Iceberg Photo Iceberg diagram
6
Bering land bridge
http://www.atmos.washington.edu/~dennis/Our_Changing_Climate.html
Location of 300 MY Continental Glaciation
Location of 300 MY Continental Glaciationwith continents located 300 mya Elliptical orbit
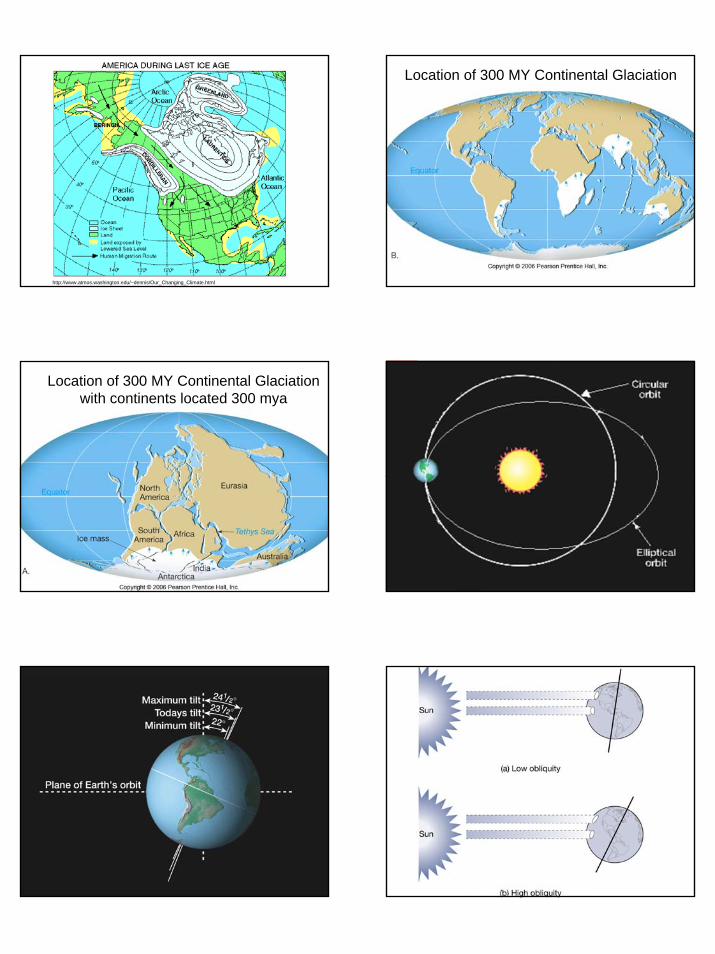
Axial Tilt variation obliquity

7
Precession of axial tilt Milankovitch cycles
Northern hemisphere insolation differences due to Milankovitch
cycles
Oxygen isotope fractionation
Temperature record from O-18 Threshold diagram

8
Positive Climate Feedback Loops
• Ice albedo decreases temperature, increases ice. Reduced ice increases temperature
Ice-albedo feedback loop
Positive Climate Feedback Loops
• Ice albedo decreases temperature, increases ice. Reduced ice increases temperature
• Glacial periods result in larger arid areas, increasing delivery of iron nutrients to sea, lowering CO2 levels, and temperature
• Lowering sea level will expose reefs to weathering. Reaction consumes CO2 , lowering temperature. Rising sea level has opposite effect
Negative Climate Feedback Loop
• Forest die out during glacial ages, reducing mechanism to remove CO2 from atmosphere, increasing temperature
Forest cover—negative feedback Temperature compared to sulfur aerosol concentration

9
Nutrient cycle Nutrients related to sea level change
Ozone Hole Atmospheric feedback mechanisms
Carbon cycle Temperature trend 30 years
http://en.wikipedia.org/wiki/Global_average_temperature Red and green are trends predicted from satellite measurements

10
Temperature trend 150 years Temperature Trend 2000 years
http://en.wikipedia.org/wiki/Global_average_temperature
Temperature Trend 12,000 Years
http://en.wikipedia.org/wiki/Global_average_temperature
Temperature trend 450,000 years
• Curves of reconstructed temperature at two locations in Antarctica and a global record of variations in glacial ice volume. Today's date is on the left side of the graph
http://en.wikipedia.org/wiki/Global_average_temperature
Temperature trend 5,000,000 years
http://en.wikipedia.org/wiki/Global_average_temperature
Temperature Trend 65,000,000 years
http://en.wikipedia.org/wiki/Geologic_temperature_record

11
Temperature trend 500,000,000 years
http://en.wikipedia.org/wiki/Geologic_temperature_record
Temperature Change
Northern Hemisphere surface temperature variation Hydrocarbon CO2 emission trend
Atmospheric Carbon dioxide trend US energy use

12
Rice paddy field Sea Ice Breakup at Antarctica
Ocean carbonate buffer Shoreline shift with sea level rise
Implication of sea level rise
• Building for passive Sun heating• Photovoltaic and Water heating also
incorporated• Note operable skylight for cooling
• http://www.earthship.com/staticpages/index.php?page=sale&osCsid=e2e983564ec7a5b9921a71236bed60c8

13
WindPower
• http://www.bergey.com/
Geothermal
http://geothermal.marin.org/GEOpresentation/sld012.htm
Geothermal
http://geothermal.marin.org/GEOpresentation/sld045.htm
Geothermal
Brady Hot Springs, northern Nevada, dries onions for Burger Kinghttp://geothermal.marin.org/GEOpresentation/sld087.htm
Geothermal
Reykjavik in the 1930shttp://geothermal.marin.org/GEOpresentation/sld094.htm
Geothermal
Reykjavik today http://geothermal.marin.org/GEOpresentation/sld095.htm

14
Tidal Lagoon
• http://www.forbes.com/global/2003/0721/042chart.html
http://www.forbes.com/global/2003/0721/042chart.html
Grand Coulee Dam
• Hydroelectric power• North America’s
largest concrete structure
• Located on the Columbia River in Central Washington
Biomass
• Direct burning of plant material• Oil harvested from seeds• Plant material converted to
– Alcohol: methanol and ethanol– Converted to methane
El Nino animation Normal equatorial flow

15
Vertical normal flow ENSO disruption of flow
Vertical ENSO flow Normal vs. enso pressures


![Hewitt/Suchocki/Hewitt Conceptual Physical ...brownk/ES106/ES106.2010... · Title: Microsoft PowerPoint - 07_LectureOutline.ppt [Compatibility Mode] Author: brownk Created Date: 4/8/2010](https://img.pdfslide.net/doc/110x75/5f0223827e708231d402c359/hewittsuchockihewitt-conceptual-physical-brownkes106es1062010-title.jpg)